Exclusive Signaling States Howard Hughes Medical Institute ...1Howard Hughes Medical Institute,...
16
Cis Interactions between Notch and Delta Generate Mutually Exclusive Signaling States David Sprinzak 1 , Amit Lakhanpal 1 , Lauren LeBon 1 , Leah A. Santat 1 , Michelle E. Fontes 1 , Graham A. Anderson 3 , Jordi Garcia-Ojalvo 2 , and Michael B. Elowitz 1 1 Howard Hughes Medical Institute, Division of Biology and Department of Applied Physics, California Institute of Technology 2 Department de Física i Enginyeria Nuclear, Universitat Politècnica de Catalunya, Colom 11, E-08222 Terrassa, Spain 3 Department of Chemical and Systems Biology, Stanford University School of Medicine Abstract The Notch-Delta signaling pathway enables communication between neighboring cells during development 1 . It plays a critical role in the formation of ‘fine-grained’ patterns, generating distinct cell fates among groups of initially equivalent neighboring cells, and in sharply delineating neighboring regions in developing tissues 2 , 3 , 4 , 5 . The Delta ligand has been shown to have two activities: it trans-activates Notch in neighboring cells, and cis-inhibits Notch in its own cell. However, it remains unclear how Notch integrates these two activities and how the resulting system facilitates pattern formation. To address these questions, we developed a quantitative time- lapse microscopy platform for analyzing Notch-Delta signaling dynamics in individual mammalian cells. By controlling both cis- and trans-Delta levels, and monitoring the dynamics of a Notch reporter, we measured the combined cis-trans input-output relationship for the Notch- Delta system. The data revealed a striking difference between the response of Notch to trans- and cis-Delta: While the response to trans-Delta is graded, the response to cis-Delta exhibits a sharp, switch-like response at a fixed threshold, independent of trans-Delta. We developed a simple mathematical model that shows how these behaviors emerge from the mutual inactivation of Notch and Delta proteins. This interaction generates an ultrasensitive switch between mutually exclusive sending (high Delta / low Notch) and receiving (high Notch / low Delta) signaling states. At the multicellular level, this switch can amplify small differences between neighboring cells even without transcription-mediated feedback. This Notch-Delta signaling switch facilitates the formation of sharp boundaries and lateral inhibition patterns in models of development, and provides insight into previously unexplained mutant behaviors. Notch and Delta are single-pass transmembrane protein families found in metazoan species. Delta in one cell can bind to, and transactivate, Notch in a neighboring cell. This interaction Users may view, print, copy, and download text and data-mine the content in such documents, for the purposes of academic research, subject always to the full Conditions of use:http://www.nature.com/authors/editorial_policies/license.html#terms Author Contributions DS and MBE designed the research. DS, LAS, MEF, and GAA built cell lines and performed experiments. DS, AL, LL, JGO, and MBE performed data analysis and mathematical modeling. DS and MBE wrote the manuscript with substantial input from the other authors. Published as: Nature. 2010 May 6; 465(7294): 86–90. HHMI Author Manuscript HHMI Author Manuscript HHMI Author Manuscript
Transcript of Exclusive Signaling States Howard Hughes Medical Institute ...1Howard Hughes Medical Institute,...
Cis Interactions between Notch and Delta Generate Mutually Exclusive Signaling States
David Sprinzak1, Amit Lakhanpal1, Lauren LeBon1, Leah A. Santat1, Michelle E. Fontes1, Graham A. Anderson3, Jordi Garcia-Ojalvo2, and Michael B. Elowitz1
1Howard Hughes Medical Institute, Division of Biology and Department of Applied Physics, California Institute of Technology
2Department de Física i Enginyeria Nuclear, Universitat Politècnica de Catalunya, Colom 11, E-08222 Terrassa, Spain
3Department of Chemical and Systems Biology, Stanford University School of Medicine
Abstract
The Notch-Delta signaling pathway enables communication between neighboring cells during
development1. It plays a critical role in the formation of ‘fine-grained’ patterns, generating distinct
cell fates among groups of initially equivalent neighboring cells, and in sharply delineating
neighboring regions in developing tissues 2,3,4,5. The Delta ligand has been shown to have two
activities: it trans-activates Notch in neighboring cells, and cis-inhibits Notch in its own cell.
However, it remains unclear how Notch integrates these two activities and how the resulting
system facilitates pattern formation. To address these questions, we developed a quantitative time-
lapse microscopy platform for analyzing Notch-Delta signaling dynamics in individual
mammalian cells. By controlling both cis- and trans-Delta levels, and monitoring the dynamics of
a Notch reporter, we measured the combined cis-trans input-output relationship for the Notch-
Delta system. The data revealed a striking difference between the response of Notch to trans- and
cis-Delta: While the response to trans-Delta is graded, the response to cis-Delta exhibits a sharp,
switch-like response at a fixed threshold, independent of trans-Delta. We developed a simple
mathematical model that shows how these behaviors emerge from the mutual inactivation of
Notch and Delta proteins. This interaction generates an ultrasensitive switch between mutually
exclusive sending (high Delta / low Notch) and receiving (high Notch / low Delta) signaling
states. At the multicellular level, this switch can amplify small differences between neighboring
cells even without transcription-mediated feedback. This Notch-Delta signaling switch facilitates
the formation of sharp boundaries and lateral inhibition patterns in models of development, and
provides insight into previously unexplained mutant behaviors.
Notch and Delta are single-pass transmembrane protein families found in metazoan species.
Delta in one cell can bind to, and transactivate, Notch in a neighboring cell. This interaction
Users may view, print, copy, and download text and data-mine the content in such documents, for the purposes of academic research, subject always to the full Conditions of use:http://www.nature.com/authors/editorial_policies/license.html#terms
Author Contributions DS and MBE designed the research. DS, LAS, MEF, and GAA built cell lines and performed experiments. DS, AL, LL, JGO, and MBE performed data analysis and mathematical modeling. DS and MBE wrote the manuscript with substantial input from the other authors.
Published as: Nature. 2010 May 6; 465(7294): 86–90.
HH
MI A
uthor Manuscript
HH
MI A
uthor Manuscript
HH
MI A
uthor Manuscript

results in proteolytic release of the Notch intracellular domain (ICD), which translocates to
the nucleus and activates target genes6 (Fig. 1A). Delta also plays a second role, inhibiting
Notch activity in its own cell (cis-inhibition) 7,8,9,10. Cis-inhibition has been shown to
involve direct interaction of the two proteins11, but current understanding is incomplete12.
In order to understand how levels of cis- and trans-Delta are integrated by the Notch
pathway (Fig. 1B), we constructed cell lines that allowed us to independently modulate the
levels of cis- and trans-Delta, and quantitatively monitor the transcriptional response of a
Notch reporter (Figs. 1C, S1, supplementary). These cell lines stably expressed Notch
receptors and corresponding Citrine fluorescent protein (YFP) reporters of Notch activity
(Figs. S1, S2). These cell lines also contained a doxycycline-inducible chimeric
Delta(rDll1)-mCherry fusion gene (Fig. S3). In our main cell line, hN1G4esn, the
intracellular domain of hNotch1 was replaced with a minimal variant of the transcriptional
activator Gal4, denoted Gal4esn (ref. 13), to avoid activation of endogenous Notch
targets14,15,16. A second cell line, hN1, containing the full length hNotch1 was analyzed as a
control (Figure S1). Notch mRNA expression levels in these cells were comparable to those
observed in early T-cell progenitors where Notch is active17 (supplementary).
We first asked how Notch activity depends on the level of trans-Delta. We adsorbed IgG-
Deltaext fusion proteins to the surface of plates at different concentrations, denoted Dplate
(Fig. 2A, S4)18,19, and recorded time-lapse movies of Notch activation. Prior to the start of
each movie (t<0), we inhibited Notch activation using the γ-secretase inhibitor N-[N-(3,5-
Difluorophenacetyl)-L-alanyl]-S-phenylglycine t-butyl ester (DAPT). At t=0, DAPT was
washed out, allowing the fluorescent reporter to accumulate at a rate determined by Notch
activity (Fig. 2B,C, Movie S1). The YFP production rate showed a graded response to Dplate
well fit by Hill functions with modest Hill coefficients (Fig. 2D). A similar response was
observed in the hN1 cell line (Figure S1). This graded response was not due to the use of
plate-bound ligands: When cells expressing only Delta were co-cultured with cells
expressing only Notch, we observed a similarly graded dependence of Notch activity on
Delta expression level, but with greater variability (Fig. S5).
We next set out to quantify the response of Notch to varying levels of cis-Delta in the
hN1G4esn cell line. We used a scheme in which Delta-mCherry was expressed in a pulse
prior to the start of the movie and subsequently allowed to dilute, effectively titrating its
concentration (Fig. 3A)20. These experiments were performed at low cell density, where
relatively weak intercellular activation of Notch is observed (Fig. S6), and trans-activation
was induced predominantly by Dplate. At the beginning of the movie Notch reporter
expression was fully inhibited by high Delta-mCherry levels (Fig. 3B, Movie S2).
Subsequently, Delta-mCherry levels gradually declined with a timescale of τD=32±2.5
hours, consistent with dilution by cell growth and division (Fig. 3C). At ton≈40 hours, we
observed a sharp onset of reporter expression in the median response of the population (Fig
3C). Even sharper responses were evident in individual cell lineages (Fig. 3D,E,F, S13).
Similar behavior was observed in the hN1 cell line (Fig. S7).
To quantify the sharpness of cis-inhibition, we computed the rise time, denoted τrise,
required for Notch activity to increase by a factor of e in individual cells (Figs. 3E, and 3A,
Sprinzak et al. Page 2
Nature. Author manuscript; available in PMC 2010 November 06.
HH
MI A
uthor Manuscript
HH
MI A
uthor Manuscript
HH
MI A
uthor Manuscript

inset). The distribution of τrise showed a median of 2.6 hours, considerably shorter than τD
(Fig. 3F). For comparison, an equivalently sharp Hill function of cis-Delta would require a
Hill coefficient .
We repeated the experiment at varying levels of Dplate, allowing us to directly measure the
integrated response of Notch across the two-dimensional input space of cis- and trans-Delta
levels (Fig. 3G, S14). Activation occurred at a similar ton, and therefore cis-Delta level,
regardless of Dplate, as indicated by the fixed position of the transition from black to green
points in Fig. 3G. In addition, the activation remained sharp at all Dplate values where it
could be clearly measured.
Thus, an explanation for the observed cis and trans signal integration must simultaneously
account for the three key features of the experimental data: (1) A graded response to trans-
Delta (Fig. 2D), (2) A sharp response to cis-Delta (Fig. 3C-F), and (3) a fixed threshold for
cis-inhibition across varying levels of trans-Delta (Fig. 3G). We show here that a simple
model can explain these observations in a unified way (Box 1, Fig. 3H). The model’s key
assumption is that Notch and Delta in the same cell mutually inactivate each other. As
shown in Box 1, strong enough mutual inactivation can produce an ultrasensitive switch
between two mutually exclusive signaling states: Cells can be in a predominantly “sending”
state, with high Delta and low Notch, or a “receiving” state, with high Notch / low Delta
(“receiving”), but cannot be in both states at the same time. Alternative models that do not
include mutual inactivation fail to account for the observed data (Fig. S8).
The three features described above emerge naturally in this model. First, in the absence of
cis-Delta, Notch activation is proportional to trans-Delta concentration, generating a graded
response. Second, a sharp response to cis-Delta results from mutual inactivation, which
causes an excess of either protein to strongly diminish the activity of the other. Finally, the
switching point occurs when Notch and cis-Delta levels are comparable, and is therefore
only weakly dependent on trans-Delta.
The mutual inactivation model predicts cis-inhibition, not just of Notch by Delta, but also of
Delta by Notch. This interaction is supported by results in other systems12,21,22. We tested
this prediction in our system using a transactivation assay based on co-culture of Delta-
expressing “sending” cells with Notch reporter cells. Expression of Notch in the Delta-
expressing cells reduced their ability to transactivate, as predicted (Fig. S9). While the exact
biochemical mechanism of mutual inactivation remains unclear, we observed no sharp drop
in total cellular Delta-mCherry fluorescence during switching, suggesting that the inactive
complex may be stable in these conditions (Fig. 3C,D).
What implications does the signaling switch have for multicellular patterning? Consider two
neighboring cells which produce Notch and Delta at constant rates (Fig. 4A). A slight excess
of Notch production in one cell and a slight excess of Delta production in its neighbor can
generate a strong signaling bias in one direction: the first cell becomes a receiver and the
second becomes a sender. In this way, a small difference in production rates between cells is
amplified into a much larger difference in Notch activity (Fig. 4B). This amplification does
not require transcriptional regulation or feedback.
Sprinzak et al. Page 3
Nature. Author manuscript; available in PMC 2010 November 06.
HH
MI A
uthor Manuscript
HH
MI A
uthor Manuscript
HH
MI A
uthor Manuscript

The send-receive signaling switch can facilitate formation of sharp boundaries. For example,
in Drosophila, Notch and Delta sharply delineate wing vein boundaries 4,5. In this system,
Delta production is initially expressed in a graded profile transverse to the vein. Eventually,
Notch signaling is restricted to two sharp side bands on either side of the vein axis.
As a simplified model, we simulated the development of a field of cells with a graded rate of
Delta production and a uniform rate of Notch production (Fig. 4C). The mutual inactivation
model generated sharply defined side-bands of Notch signaling at positions where the two
production rates intersect, i.e. where ‘sender’ and ‘receiver’ cells are next to each other (Fig.
4C). Moreover, this model explains a striking mutant behavior occurring in the Drosophila
wing vein system. While Notch and Delta are individually haploinsufficient (causing thicker
veins), the Notch+/- Delta+/- double mutant restores the wild-type phenotype23. This
suppression of the single mutant phenotypes in the double mutant emerges automatically in
the model because proportional rescaling of the Notch and Delta production rates does not
move their intersection points (Fig. 4D). This suppression is maintained across a broad range
of parameter values and persists even with additional feedbacks (Fig. S10f), but is difficult
to explain in other models (Fig. S10, supplementary).
The send-receive signaling switch can also facilitate lateral inhibition patterning. When
Notch transcriptionally downregulates Delta expression, the resulting intercellular positive
feedback loop can generate ‘checkerboard’ patterns of Notch activity (Fig. 4E)24,25. Without
mutual inactivation, pattern formation requires a minimum Hill coefficient of n > 2, or
higher, in the regulatory feedback loop (Fig. 4F, left, supplementary). Although we cannot
rule out such cooperativity, or additional feedback loops, no evidence for strongly
cooperative trans-activation was observed here or previously (Figs. 2D, S1). In contrast,
mutual inactivation enables patterning even without cooperativity, by introducing a sharp
response to changes in Delta expression, (Fig. 4F, right panel). In addition, for strong
enough cis-inhibition, mutual inactivation allows cells with high Delta levels to co-exist next
to one another at steady-state, leading to a broader range of possible patterns (Fig. S17).
Finally, we note that low levels of free Notch (Delta) exist in sender (receiver) cells at finite
mutual inactivation strength (Fig. S11). The resulting signaling between like cells (senders
or receivers) can play a role in lateral inhibition patterning dynamics.
Different signal transduction pathways are optimized to encode and transmit information in
different ways, depending on the tasks they perform in the organism. Our results show that
mutual inactivation between Notch and Delta in the same cell forces cells into
predominantly sending or receiving states (Box 1 Figure). In a multicellular context, this
mechanism amplifies small initial differences between neighboring cells, and facilitates
pattern formation (Fig. 4). This signaling switch thus appears to optimize the Notch-Delta
pathway for directional signaling, and may explain why it is employed in specific
developmental processes. Moreover, this mechanism could also provide other advantages
such as faster dynamics 26,27. We note that interactions between Notch and Delta are
typically embedded in more complex dynamic regulatory networks that involve additional
feedbacks. It will be important to explore how this signaling switch functions in the context
of larger regulatory circuits.
Sprinzak et al. Page 4
Nature. Author manuscript; available in PMC 2010 November 06.
HH
MI A
uthor Manuscript
HH
MI A
uthor Manuscript
HH
MI A
uthor Manuscript

Box 1: Model of mutual inactivation of Notch and Delta
Here we describe a simple model of Notch-Delta interactions that explains the
experimental data and provides insight into developmental patterning processes. The
model involves several reactions: First, during intercellular signaling Notch in one cell
binds to extracellular Delta, Dtrans, leading to release of the Notch intracellular domain
and degradation of its extracellular domain6. Similarly, Notch in a neighboring cell,
Ntrans, can bind to Delta. Second, Notch binds irreversibly to Delta in the same cell to
form a stable, inactive, complex, which is effectively removed from the system12.
Finally, Notch and Delta are produced at constant rates, and degraded and/or diluted at a
constant rate, in addition to their removal through the interactions described above.
These reactions can be expressed as a set of ordinary differential equations for free
Notch, N, and free Delta, D, in an individual cell. An additional equation represents the
intracellular domain of Notch, denoted S, which activates expression of the fluorescent
reporter gene:
Here, Dtrans represents Dplate in Figs 2-3, but could also represent Delta levels in one or
more neighboring cells (supplementary). Similarly, D in these equations corresponds to
Dcis in the experiments. βN and βD denote the production rates of Notch and Delta,
respectively. The combined degradation and dilution rate, γ, is assumed for simplicity to
be the same for Notch and Delta. γS is the rate of decay for S. kc and kt determine the
strengths of cis-inhibition and trans-activation, respectively. See supplementary for a
more detailed description.
At steady-state, mutual inactivation leads to a switch between two qualitatively distinct
behaviors, depending on the relative production rates of Delta and Notch. When βD > βN,
excess Delta effectively inactivates most Notch, allowing cells to send, but not to
efficiently receive, signals. Conversely, when βD < βN, excess Notch effectively
inactivates Delta, allowing cells to receive, but not efficiently send. Thus, the system
approaches two mutually exclusive signaling states: high Delta / low Notch (“sending,”
pink shading in Box Fig.), and high Notch / low Delta (“receiving,” blue shading). Note
that this switch is not bistable.
At steady-state the transition between the two regimes is ultrasensitive: Near the
threshold, a small relative change in βD (or βN) can lead to a much larger change in
signaling (Fig. S11). Related biochemical kinetics occur in bacterial sRNA, and protein
sequestration27,28,29. In Fig. 3, ultrasensitivity occurs dynamically in response to the
decay of the total Delta concentration (supplementary).
Sprinzak et al. Page 5
Nature. Author manuscript; available in PMC 2010 November 06.
HH
MI A
uthor Manuscript
HH
MI A
uthor Manuscript
HH
MI A
uthor Manuscript

Methods Summary
Genetic constructs and cell lines were assembled by standard methods (Table S1). All cell
lines used in the main text (Table S2) were derived from T-REx-CHO-K1 (Invitrogen). Cell
lines were constructed by sequential rounds of Lipofectamine 2000 (Invitrogen) transfection
and selection. Stably transfected clones were isolated by limiting dilution or fluorescence-
activated cell sorting (FACS). Time-lapse microscopy was performed with cells plated on
24-well glass-bottom plates (Mattek). For plate-bound Delta experiments, IgG-Deltaext was
adsorbed to the plate together with 5 μg/ml hamster fibronectin (Innovative Research) prior
to cell plating. Before imaging, cells were switched to a low-fluorescence medium,
consisting of 5% FBS in αMEM lacking riboflavin, folic acid, phenol red, and vitamin B12.
Movies were acquired using an Olympus IX-81 ZDC microscope, equipped with a 37°C
environmental chamber supplying 5% CO2, a 20X 0.7 NA objective, and automated
acquisition software (MetaMorph). Western blots for Gal4 were obtained using standard
protocols. Blots were probed with rabbit anti-Gal4 DBD primary antibody (sc-577, Santa
Cruz Biotechnology, 1:200) followed by incubation with horseradish peroxidase-labeled
anti-rabbit IgG secondary antibody (Amersham, 1:2000). Bands were quantified using a
VersaDoc gel imaging system. qRT-PCR was performed using standard protocols based on
the RNeasy kit (Qiagen) and iScript cDNA synthesis kit (Bio-Rad). Co-culture experiments
were analyzed for YFP fluorescence using a FACScalibur flow cytometer (Becton
Dickinson) and standard protocols. Movies were analyzed in several stages. First, individual
cell nuclei were identified on CFP images using a custom Matlab-based algorithm based on
edge detection and thresholding of constitutively expressed H2B-Cerulean fluorescence.
Then, for analysis of single-cell expression trajectories, individual nuclei were tracked
across frames using custom software (Matlab, C) based on the SoftAssign algorithm
(supplementary). All single-cell trajectories were validated manually. For further details see
supplementary.
Methods
Genetic constructs
We used standard molecular biology techniques to assemble all constructs used in this paper
(Table S1). The construct used to generate the hN1 cell line, pcDNA3-hN1-mCherry was
Sprinzak et al. Page 6
Nature. Author manuscript; available in PMC 2010 November 06.
HH
MI A
uthor Manuscript
HH
MI A
uthor Manuscript
HH
MI A
uthor Manuscript
constructed by fusing the coding sequence of mCherry to hN1, provided by Jon Aster7. The
construct used to generate the hN1G4esn cell line, pcDNA3-hNECD-Gal4esn was
constructed by replacing amino acids 1742 to 2556 of hNotch1 with the amino acids 1-147
and 768-881 of Gal4. The Delta-mCherry fusion consists of the entire coding sequence of
rDll1 concatenated directly to the coding sequence of mCherry. The reporter for hNotch1
activation was constructed from the 12XCSL construct provided by Urban Lendahl6. The
reporter for hNECD-Gal4esn activation was constructed from the UAS construct provided by
Scott Fraser5. Both reporters used a protein fusion of H2B-Citrine in order to localize
fluorescence to cell nuclei where it could be more accurately quantified. Doxycycline-
inducible constructs were based on the T-REx system (Invitrogen).
Generation of stable cell lines
All cell lines used in the main text (Table S2) were based on the cell line T-REx-CHO-K1
(Invitrogen). Cells were grown in Alpha MEM Earle’s Salts (Irvine Scientific)
supplemented with 10% Tet System Approved FBS (Clontech), 100 U/ml penicillin -100
ug/ml streptomycin − 0.292 mg/ml L-glutamine (Gibco), and 10 μg/ml Blasticidin
(InvivoGen) at 37°C in the presence of 5% CO2 under a humidified atmosphere. Cell lines
incorporating multiple transgenes were constructed by sequential rounds of Lipofectamine
2000 (Invitrogen) transfection and selection. Stably transfected clones were generated by
limiting dilution or fluorescence-activated cell sorting (FACS) of single cells. hN1 and
hN1G4esn cell lines were first created by stably integrating the 12xCSL-H2B-Citrine or
UAS-H2B-Citrine reporters, respectively, into T-REx-CHO-K1 cells. After selection with
media containing 400 μg/ml Zeocin (Invitrogen) and 10 μg/ml Blasticidin (InvivoGen),
individual clones were obtained. Clones with the best dynamic range of reporter induction
were identified and used in subsequent stages. pcDNA3-hN1-mCherry or pcDNA3-hNECD-
Gal4esn was transfected into the 12xCSL-H2B-Citrine or UAS-H2B-Citrine reporter cell
lines, respectively. Cells were selected with media containing 400 μg/ml Zeocin, 10 μg/ml
Blasticidin, and 600 μg/ml Geneticin (Invitrogen). Individual clones were obtained and
tested for Notch activity by plating on 2.5 ug/ml IgG-Deltaext. Clones with minimal
background levels and high reporter activation when exposed to Delta were selected and
transfected with a plasmid expressing Delta-mCherry under a doxycycline inducible
promoter (pcDNA5-TO-Dl-mCherry). These cells were selected in media containing 400
μg/ml Zeocin, 10 μg/ml Blasticidin, 600 μg/ml Geneticin, and 500 μg/ml Hygromycin
(InvivoGen). Clonal cell populations were obtained, and the clone with the lowest mCherry
background expression in the absence of doxycycline, as well as good inducibility of
mCherry expression when exposed to 1 μg/ml doxycycline, was selected for experiments.
hN1 and hN1G4esn cell lines also contain an integrated H2B-Cerulean under constitutive
CMV promoter. A separate cell line containing only inducible Delta-mCherry was created
by transfecting T-REx-CHO-K1 cells with pcDNA5-TO-Dl-mCherry. Clones were
generated as above, but selection media contained only Blasticidin and Hygromycin. This
cell line was then used to generate the TO-DMC+hN1G4esn cell line by stably transfecting
with pcDNA3-hNECD-Gal4esn construct (600 μg/ml Geneticin).
Sprinzak et al. Page 7
Nature. Author manuscript; available in PMC 2010 November 06.
HH
MI A
uthor Manuscript
HH
MI A
uthor Manuscript
HH
MI A
uthor Manuscript

Experimental techniques and imaging protocols
Surface preparation: All time-lapse microscopy experiments were performed with cells
plated on 24-well glass bottom plates (Mattek). IgG-Deltaext constructs were generously
provided by Irwin Bernstein. For plate-bound Delta experiments, IgG-Deltaext was adsorbed
together with 5 μg/ml hamster fibronectin (Innovative Research) to the glass plate surface by
incubation for 1 hour at 4°C prior to cell plating. Cells were diluted to 2×10⁴ cells/ml (1×10⁵
cells/ml for coculture experiments). A calibration was performed for determining the
dependence of active IgG-Deltaext concentration on the concentration added during
incubation (see supplementary). Preparation of cells for imaging: Before imaging, cells were
switched to a low-fluorescence medium, consisting of 5% FBS in αMEM lacking riboflavin,
folic acid, phenol red, and vitamin B12. Time-lapse microscopy: Movies were acquired
using an Olympus IX-81 ZDC microscope, equipped with a 37°C environmental chamber
supplying 5% CO2, a 20X 0.7 NA objective, and automated acquisition software
(MetaMorph). For each movie, fluorescence images were acquired in CFP, YFP, and RFP
channels, as well as Differential interference contrast (DIC).
Western blot
Western blots were performed using standard protocols. For detection of Gal4, TO-Gal4esn
cells were either uninduced or induced for 24 hr with 100 ng/ml of doxycycline. 4 ×10⁶ cells
were lysed with 200ul 1.5x complete SDS loading buffer at 0 hr, 1 hr, 2 hr, 4 hr and 6 hr
post-doxycycline removal. 10ul of cell lysate was run in triplicate on a NuPAGE Novex
4-12% Bis-Tris Midi Gel (Invitrogen) and transferred to a 0.2 μm nitrocellulose membrane
using the iBlot from Invitrogen. The blot was probed with rabbit anti-Gal4 DBD primary
antibody (sc-577, Santa Cruz Biotechnology, 1:200) followed by incubation with
horseradish peroxidase-labeled anti-rabbit IgG secondary antibody (Amersham, 1:2000).
Bands were quantified using a VersaDoc gel imaging system.
Real-time qRT-PCR
qRT-PCR was performed using standard protocols based on the RNeasy kit (Qiagen) and
iScript cDNA synthesis kit (Bio-Rad). RNA was isolated from hN1 and hN1G4esn cells.
cDNA was subsequently synthesized from 1ug of RNA. From a 20ul reaction, 2ul of cDNA
was used to assess Notch and β-Actin mRNA levels.
Flow cytometry analysis of co-cultures
TO-DMC or TO-DMC+ hN1G4esn cells were co-cultured with hN1G4esn-No-Delta cells.
1×10⁵ cells were plated at a ratio of 20% Delta cells and 80% Notch reporter cells. For each
set of co-cultures, a 12 hr pulse of 1.6 ng/ml and 100 ng/ml doxycycline was performed (a
well with no doxycycline served as a control). 24hr after doxycycline removal, co-cultured
cells were trypsinized and then analyzed for YFP fluorescence using a FACScalibur flow
cytometer (Becton Dickinson) and standard protocols.
Image and data analysis
Movies were analyzed in several stages: (1) Segmentation. Individual cell nuclei were
identified on CFP images using a custom Matlab-based algorithm based on edge detection
Sprinzak et al. Page 8
Nature. Author manuscript; available in PMC 2010 November 06.
HH
MI A
uthor Manuscript
HH
MI A
uthor Manuscript
HH
MI A
uthor Manuscript

and thresholding of constitutively expressed H2B-Cerulean fluorescence. (2) Tracking. For
analysis of single-cell expression trajectories, individual nuclei were tracked across frames
using custom software (Matlab, C) based on the SoftAssign algorithm– see supplementary
materials for details. (3) Verification. All single-cell trajectories were validated using a
semi-automated custom software system (Matlab). (4) More detailed analysis of the
resulting data is described in supplementary material.
Supplementary Material
Refer to Web version on PubMed Central for supplementary material.
Acknowledgments
We would like to thank Irwin Bernstein for the Delta ligands, Urban Lendahl for the 12XCSL reporter construct, J. Aster for hNotch1 and other constructs, and Gerry Weinmaster for the rat Dll1 construct and advice. We also thank Roger Tsien and Kurt Thorn for mCherry, Sean Megason and Scott Fraser for H2B-Citrine and other constructs, Urban Lendahl for the 12xCSL constructs, Rochelle Diamond and Diana Perez for assistance with FACS, and Fred Tan and John Yong for help with cloning some of the constructs. We thank Avigdor Eldar, James Locke, Georg Seelig, Roy Kishony, Boris Shraiman, Andrew C. Oates, and members of the Elowitz lab for fruitful discussions and advice. This work was supported by NIH Fellowship F32GM77014 to D.S., the Caltech Center for Biological Circuit Design, and the Packard Foundation.
References
1. Artavanis-Tsakonas S, Rand MD, Lake RJ. Notch signaling: cell fate control and signal integration in development. Science. 1999; 284:770–776. [PubMed: 10221902]
2. Goodyear R, Richardson G. Pattern formation in the basilar papilla: evidence for cell rearrangement. J Neurosci. 1997; 17:6289–6301. [PubMed: 9236239]
3. Heitzler P, Simpson P. The choice of cell fate in the epidermis of Drosophila. Cell. 1991; 64:1083–1092. doi:0092-8674(91)90263-X [pii]. [PubMed: 2004417]
4. Huppert SS, Jacobsen TL, Muskavitch MA. Feedback regulation is central to Delta-Notch signalling required for Drosophila wing vein morphogenesis. Development. 1997; 124:3283–3291. [PubMed: 9310323]
5. de Celis JF, Bray S, Garcia-Bellido A. Notch signalling regulates veinlet expression and establishes boundaries between veins and interveins in the Drosophila wing. Development. 1997; 124:1919–1928. [PubMed: 9169839]
6. Bray SJ. Notch signalling: a simple pathway becomes complex. Nat Rev Mol Cell Biol. 2006; 7:678–689. doi:nrm2009 [pii] 10.1038/nrm2009. [PubMed: 16921404]
7. de Celis JF, Bray S. Feed-back mechanisms affecting Notch activation at the dorsoventral boundary in the Drosophila wing. Development. 1997; 124:3241–3251. [PubMed: 9310319]
8. Micchelli CA, Rulifson EJ, Blair SS. The function and regulation of cut expression on the wing margin of Drosophila: Notch, Wingless and a dominant negative role for Delta and Serrate. Development. 1997; 124:1485–1495. [PubMed: 9108365]
9. Klein T, Brennan K, Arias AM. An intrinsic dominant negative activity of serrate that is modulated during wing development in Drosophila. Dev Biol. 1997; 189:123–134. doi:S0012-1606(97)98564-X [pii] 10.1006/dbio.1997.8564. [PubMed: 9281342]
10. Miller AC, Lyons EL, Herman TG. cis-Inhibition of notch by endogenous delta biases the outcome of lateral inhibition. Curr Biol. 2009; 19:1378–1383. doi:S0960-9822(09)01319-0 [pii] 10.1016/j.cub.2009.06.042. [PubMed: 19631544]
11. Cordle J, et al. A conserved face of the Jagged/Serrate DSL domain is involved in Notch trans-activation and cis-inhibition. Nat Struct Mol Biol. 2008; 15:849–857. doi:nsmb.1457 [pii] 10.1038/nsmb.1457. [PubMed: 18660822]
Sprinzak et al. Page 9
Nature. Author manuscript; available in PMC 2010 November 06.
HH
MI A
uthor Manuscript
HH
MI A
uthor Manuscript
HH
MI A
uthor Manuscript

12. Matsuda M, Chitnis AB. Interaction with Notch determines endocytosis of specific Delta ligands in zebrafish neural tissue. Development. 2009; 136:197–206. doi:dev.027938 [pii] 10.1242/dev.027938. [PubMed: 19056830]
13. Kakidani H, Ptashne M. GAL4 activates gene expression in mammalian cells. Cell. 1988; 52:161–167. doi:0092-8674(88)90504-1 [pii]. [PubMed: 2830021]
14. Struhl G, Adachi A. Nuclear access and action of notch in vivo. Cell. 1998; 93:649–660. doi:S0092-8674(00)81193-9 [pii]. [PubMed: 9604939]
15. Aster JC, et al. Essential roles for ankyrin repeat and transactivation domains in induction of T-cell leukemia by notch1. Mol Cell Biol. 2000; 20:7505–7515. [PubMed: 11003647]
16. Yang LT, et al. Fringe glycosyltransferases differentially modulate Notch proteolysis induced by Delta and Jagged1. Mol Biol Cell. 2005; 16:927–942. doi:E04-07-0614 [pii] 10.1091/mbc.E04-07-0614. [PubMed: 15574878]
17. Rothenberg EV, Moore JE, Yui MA. Launching the T-cell-lineage developmental programme. Nat Rev Immunol. 2008; 8:9–21. doi:nri2232 [pii] 10.1038/nri2232. [PubMed: 18097446]
18. Varnum-Finney B, et al. Immobilization of Notch ligand, Delta-1, is required for induction of notch signaling. J Cell Sci. 2000; 113(Pt 23):4313–4318. [PubMed: 11069775]
19. Wang S, et al. Notch receptor activation inhibits oligodendrocyte differentiation. Neuron. 1998; 21:63–75. doi:S0896-6273(00)80515-2 [pii]. [PubMed: 9697852]
20. Rosenfeld N, Young JW, Alon U, Swain PS, Elowitz MB. Gene regulation at the single-cell level. Science. 2005; 307:1962–1965. doi:307/5717/1962 [pii] 10.1126/science.1106914. [PubMed: 15790856]
21. Jacobsen TL, Brennan K, Arias AM, Muskavitch MA. Cis-interactions between Delta and Notch modulate neurogenic signalling in Drosophila. Development. 1998; 125:4531–4540. [PubMed: 9778511]
22. Shaye DD, Greenwald I. LIN-12/Notch trafficking and regulation of DSL ligand activity during vulval induction in Caenorhabditis elegans. Development. 2005; 132:5081–5092. doi:dev.02076 [pii] 10.1242/dev.02076. [PubMed: 16236769]
23. de Celis JF, Bray SJ. The Abruptex domain of Notch regulates negative interactions between Notch, its ligands and Fringe. Development. 2000; 127:1291–1302. [PubMed: 10683181]
24. Collier JR, Monk NA, Maini PK, Lewis JH. Pattern formation by lateral inhibition with feedback: a mathematical model of delta-notch intercellular signalling. J Theor Biol. 1996; 183:429–446. doi:S0022-5193(96)90233-7 [pii] 10.1006/jtbi.1996.0233. [PubMed: 9015458]
25. Plahte E. Pattern formation in discrete cell lattices. J Math Biol. 2001; 43:411–445. [PubMed: 11767205]
26. Melen GJ, Levy S, Barkai N, Shilo BZ. Threshold responses to morphogen gradients by zero-order ultrasensitivity. Mol Syst Biol. 2005; 1:0028. doi:msb4100036 [pii] 10.1038/msb4100036. [PubMed: 16729063]
27. Levine E, Zhang Z, Kuhlman T, Hwa T. Quantitative characteristics of gene regulation by small RNA. PLoS Biol. 2007; 5:e229. doi:06-PLBI-RA-1518 [pii] 10.1371/journal.pbio.0050229. [PubMed: 17713988]
28. Buchler NE, Louis M. Molecular titration and ultrasensitivity in regulatory networks. J Mol Biol. 2008; 384:1106–1119. doi:S0022-2836(08)01248-5 [pii] 10.1016/j.jmb.2008.09.079. [PubMed: 18938177]
29. Lenz DH, et al. The small RNA chaperone Hfq and multiple small RNAs control quorum sensing in Vibrio harveyi and Vibrio cholerae. Cell. 2004; 118:69–82. doi:10.1016/j.cell.2004.06.009 S0092867404005732 [pii]. [PubMed: 15242645]
30. Hansson EM, et al. Recording Notch signaling in real time. Dev Neurosci. 2006; 28:118–127. doi:DNE20060281_2118 [pii] 10.1159/000090758. [PubMed: 16508309]
Sprinzak et al. Page 10
Nature. Author manuscript; available in PMC 2010 November 06.
HH
MI A
uthor Manuscript
HH
MI A
uthor Manuscript
HH
MI A
uthor Manuscript

Figure 1. System for analyzing signal integration in the Notch-Delta pathway(A) Notch (blue) and Delta (red) interactions are indicated schematically. (B) Notch activity
integrates cis- and trans-Delta. (C) CHO-K1 cell line for analyzing Notch activity. (C) The
hN1G4esn cell line stably incorporates a variant of hNotch1 in which the activator Gal4esn
replaces Notch ICD. This cell line also contains genes for Histone 2B (H2B)-Citrine (YFP)
reporter controlled by a UAS promoter, a Tet-inducible Delta-mCherry fusion protein, and a
constitutively expressed H2B-Cerulean (CFP) for image segmentation (not shown). A
similar cell line expressing full length hNotch1 (hN1 cell line) was also analyzed (Figs. S1,
S2). These cells exhibit no detectable endogenous Notch or Delta activities. Notch-Delta
interactions are indicated schematically and do not represent molecular interaction
mechanisms11.
Sprinzak et al. Page 11
Nature. Author manuscript; available in PMC 2010 November 06.
HH
MI A
uthor Manuscript
HH
MI A
uthor Manuscript
HH
MI A
uthor Manuscript
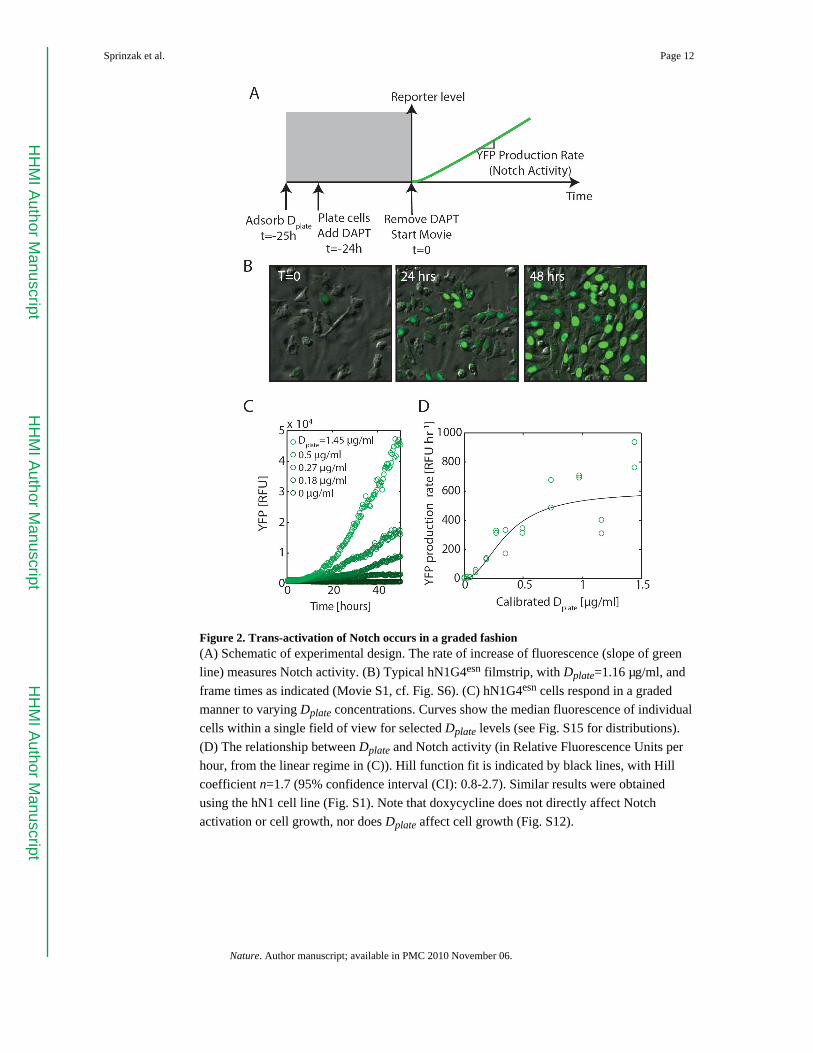
Figure 2. Trans-activation of Notch occurs in a graded fashion(A) Schematic of experimental design. The rate of increase of fluorescence (slope of green
line) measures Notch activity. (B) Typical hN1G4esn filmstrip, with Dplate=1.16 μg/ml, and
frame times as indicated (Movie S1, cf. Fig. S6). (C) hN1G4esn cells respond in a graded
manner to varying Dplate concentrations. Curves show the median fluorescence of individual
cells within a single field of view for selected Dplate levels (see Fig. S15 for distributions).
(D) The relationship between Dplate and Notch activity (in Relative Fluorescence Units per
hour, from the linear regime in (C)). Hill function fit is indicated by black lines, with Hill
coefficient n=1.7 (95% confidence interval (CI): 0.8-2.7). Similar results were obtained
using the hN1 cell line (Fig. S1). Note that doxycycline does not directly affect Notch
activation or cell growth, nor does Dplate affect cell growth (Fig. S12).
Sprinzak et al. Page 12
Nature. Author manuscript; available in PMC 2010 November 06.
HH
MI A
uthor Manuscript
HH
MI A
uthor Manuscript
HH
MI A
uthor Manuscript

Figure 3. Cis/trans signal integration by Notch(A) Schematic of the experimental protocol. Inset: Rise time, τrise, is the time required for
Notch activity (black line, or slope of green line) to change by a factor of e . (B) Filmstrip of
hN1G4esn cells, with Dplate=1.45 μg/ml (Movie S2), showing Delta-mCherry fluorescence
(red) and concomitant activation of Notch reporter (green); times as indicated (cf. Fig. S6).
(C) Population average (median) response for the same movie shows a slow decay of Delta-
mCherry fluorescence (red points), but a sharp response of reporter expression (green
points). Constitutively expressed pCMV-H2B-Cerulean (blue) remains constant (control).
Compare single-cell tracks in Fig. S13, and response to modulation of dox in Fig. S14. (D)
Single-cell response for two individual cells (solid and dashed lines, colors as in C). Black
arrows mark cell divisions. (E) Single cell traces in (D) replotted, but shifted up after each
cell division event to ‘add back’ sister cell fluorescence, in order to show the continuity of
Notch activity (see also Fig. S13). (F) Histogram of τrise from 26 non-overlapping cell
lineages (Fig. S13). (G) Notch response to both cis and trans Delta. Data shown are from 2
duplicate movies acquired at each of 12 Dplate values for hN1G4esn cells. Green coloring
indicates points that exceed a detection threshold. Note that turn-on (black to green
transition) occurs at approximately the same time in all movies. (H) Simulations based on
Sprinzak et al. Page 13
Nature. Author manuscript; available in PMC 2010 November 06.
HH
MI A
uthor Manuscript
HH
MI A
uthor Manuscript
HH
MI A
uthor Manuscript
the model in Box 1 are qualitatively similar to data in (G) (see supplementary and Fig. S16
for model details).
Sprinzak et al. Page 14
Nature. Author manuscript; available in PMC 2010 November 06.
HH
MI A
uthor Manuscript
HH
MI A
uthor Manuscript
HH
MI A
uthor Manuscript

Figure 4. The mutual inactivation model in multicellular patterning(A) Signal amplification (schematic). Two interacting cells with the same amount of Notch
(here, 2 molecules), but different amounts of Delta (1 or 3 molecules). Due to the cis-
interaction between Notch and Delta, signaling is strongly biased to cell1. (B) Notch
amplifies differences between cells. Signal amplification, defined as shown, for two
interacting cells, with different Delta production rates, βD(2) = 1.35 βD
(1) (see model in
supplementary). The x-axis specifies the average Delta production rate,
. Maximum amplification occurs when Delta production rates flank
βN (vertical line). Stronger mutual inactivation (smaller kc/kt) increases signal amplification.
(C-D) Sharp boundary formation in response to a gradient of Delta production. (C)
Simulation of a field of interacting cells in which Delta production rates decay exponentially
from the center, according to βD (x) = βD0exp (−x/x0) with x0 =7 cells (dashed red line).
Notch production rate, βN, is constant (dashed blue line). Resulting free Notch and Delta
protein levels are indicated (solid lines). Notch activation occurs in two sharply defined
columns of cells (green line in plot and green cells in cellular diagram). (D) This model
explains suppression of mutant phenotypes. Gray lines indicate positions where βN = βD (x),
leading to Notch activity peaks. Simultaneous reduction of both Notch and Delta production
rates by half maintains boundary positions (dotted lines) (Fig. S10). (F-G) Mutual
inactivation facilitates lateral inhibition patterning, shown schematically in (F). (G) In the
absence of cooperativity in regulatory feedback, a standard lateral inhibition model 24
Sprinzak et al. Page 15
Nature. Author manuscript; available in PMC 2010 November 06.
HH
MI A
uthor Manuscript
HH
MI A
uthor Manuscript
HH
MI A
uthor Manuscript

cannot pattern (first panel) while a model of lateral inhibition with mutual inactivation can
(second panel).
Sprinzak et al. Page 16
Nature. Author manuscript; available in PMC 2010 November 06.
HH
MI A
uthor Manuscript
HH
MI A
uthor Manuscript
HH
MI A
uthor Manuscript