EXAMEN ORDINARIO OPTIMIZACIÓN
34
ANOR ASUR EUR ASIA ÁFR AMÉRICA N 81 92 101 130 115 10 6000 Y1 AMÉRICA S 117 77 108 98 100 10 4500 Y2 EUROPA 102 105 95 119 111 10 6500 Y3 ASIA 115 125 90 59 74 10 4100 Y4 ÁFRICA 142 100 103 105 71 10 4000 Y5 AMÉRICA N 81 92 101 130 115 20 9000 Y6 AMÉRICA S 117 77 108 98 100 20 6750 Y7 EUROPA 102 105 95 119 111 20 9750 Y8 ASIA 115 125 90 59 74 20 6150 Y9 ÁFRICA 142 100 103 105 71 20 6000 Y10 Demanda 12 8 14 16 7 X11 X12 X13 X14 X15 X21 X22 X23 X24 VARIABLES 0 0 0 0 0 12 8 0 0 COSTOS 81 92 101 130 115 117 77 108 98 f(x) 1 1 g(x) 1 1 h(x) 1 1 i(x) 1 1 j(x) 1 CAPACIDAD 1 1 1 1 1 1 1 1 1 REGIÓN DE DEMANDA(costo de producción y transporte por cada 1,000,000 de unidades) REGION DE OFERTA CAPACI DAD Costo Fijo($ )
-
Upload
alejandro-contreras-reyes -
Category
Documents
-
view
22 -
download
0
description
investigacion de operaciones
Transcript of EXAMEN ORDINARIO OPTIMIZACIÓN
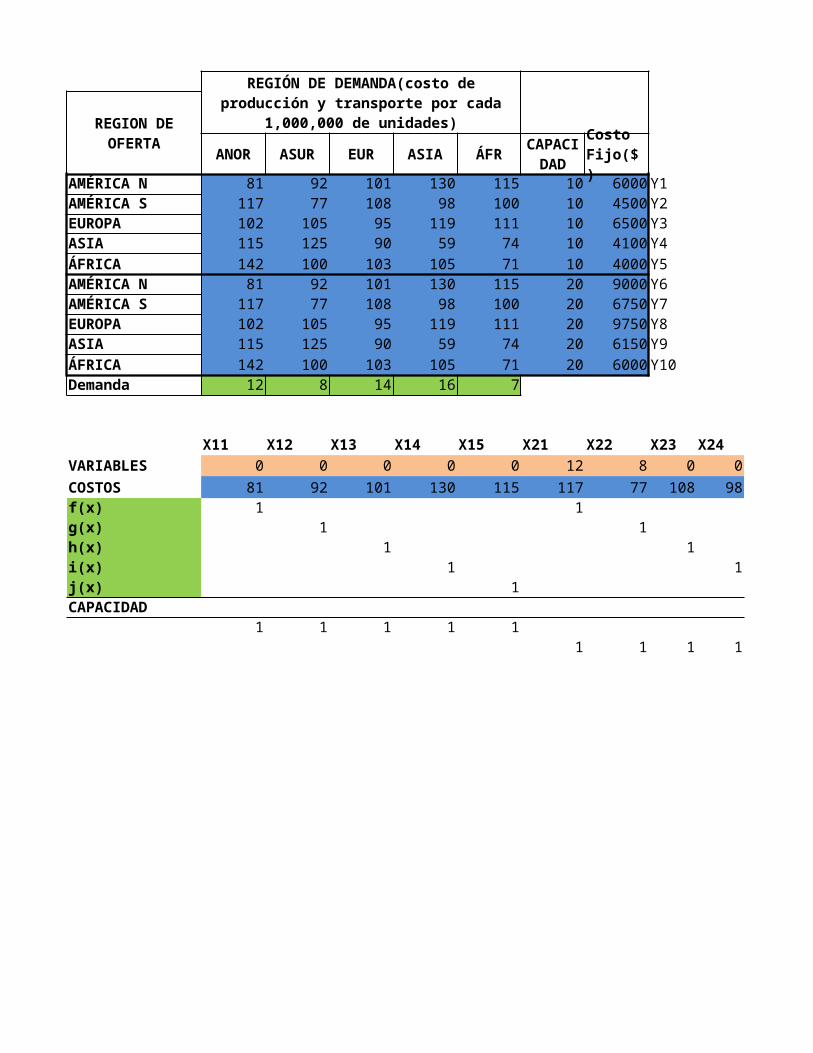
ANOR ASUR EUR ASIA ÁFR
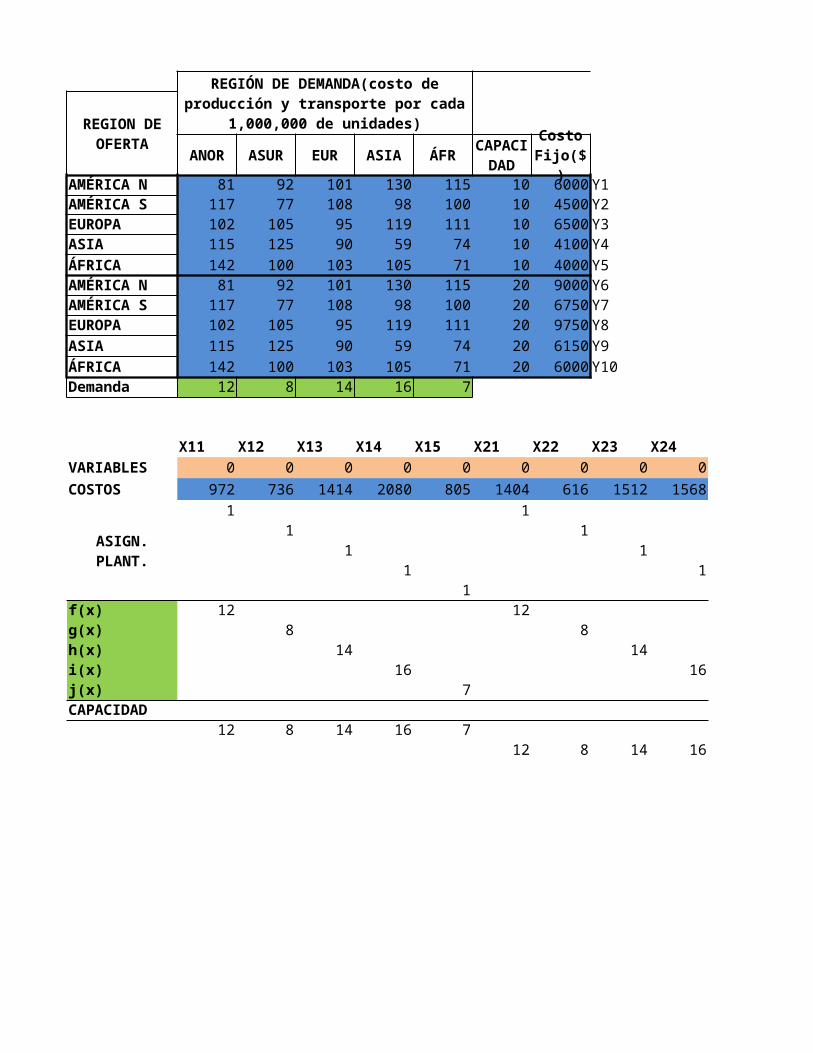
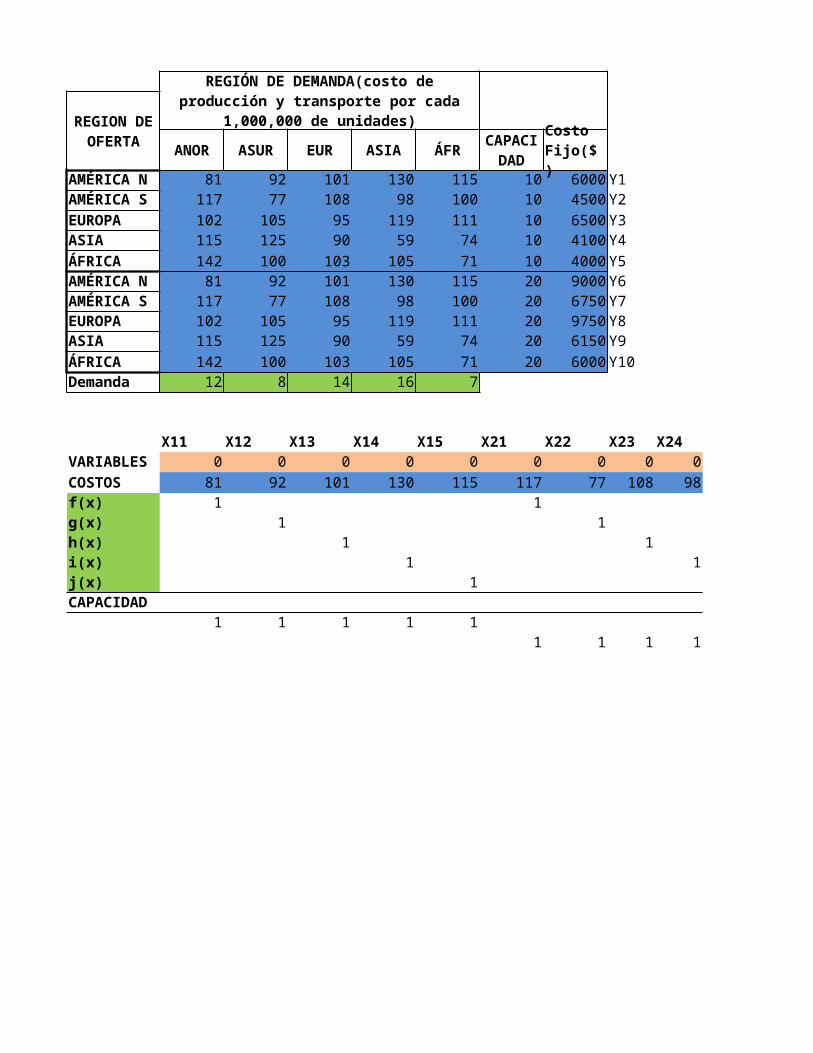
AMÉRICA N 81 92 101 130 115 10 6000 Y1AMÉRICA S 117 77 108 98 100 10 4500 Y2EUROPA 102 105 95 119 111 10 6500 Y3ASIA 115 125 90 59 74 10 4100 Y4ÁFRICA 142 100 103 105 71 10 4000 Y5AMÉRICA N 81 92 101 130 115 20 9000 Y6AMÉRICA S 117 77 108 98 100 20 6750 Y7EUROPA 102 105 95 119 111 20 9750 Y8ASIA 115 125 90 59 74 20 6150 Y9ÁFRICA 142 100 103 105 71 20 6000 Y10Demanda 12 8 14 16 7
X11 X12 X13 X14 X15 X21 X22 X23 X24 X25 X31VARIABLES 0 0 0 0 0 12 8 0 0 0 0COSTOS 81 92 101 130 115 117 77 108 98 100 102f(x) 1 1 1g(x) 1 1h(x) 1 1i(x) 1 1j(x) 1 1CAPACIDAD
1 1 1 1 11 1 1 1 1
1
REGIÓN DE DEMANDA(costo de producción y transporte por cada 1,000,000 de
unidades)REGION DE OFERTA CAPACI
DADCosto Fijo($)

X32 X33 X34 X35 X41 X42 X43 X44 X45 X51 X52 X53 X54 X55 Y1 Y20 0 0 0 0 0 4 16 0 0 0 10 0 7 0 0
105 95 119 111 115 125 90 59 74 142 100 103 105 71 6000 45001 1
1 1 11 1 1
1 1 11 1 1
10 10
1 1 1 11 1 1 1 1
1 1 1 1 1
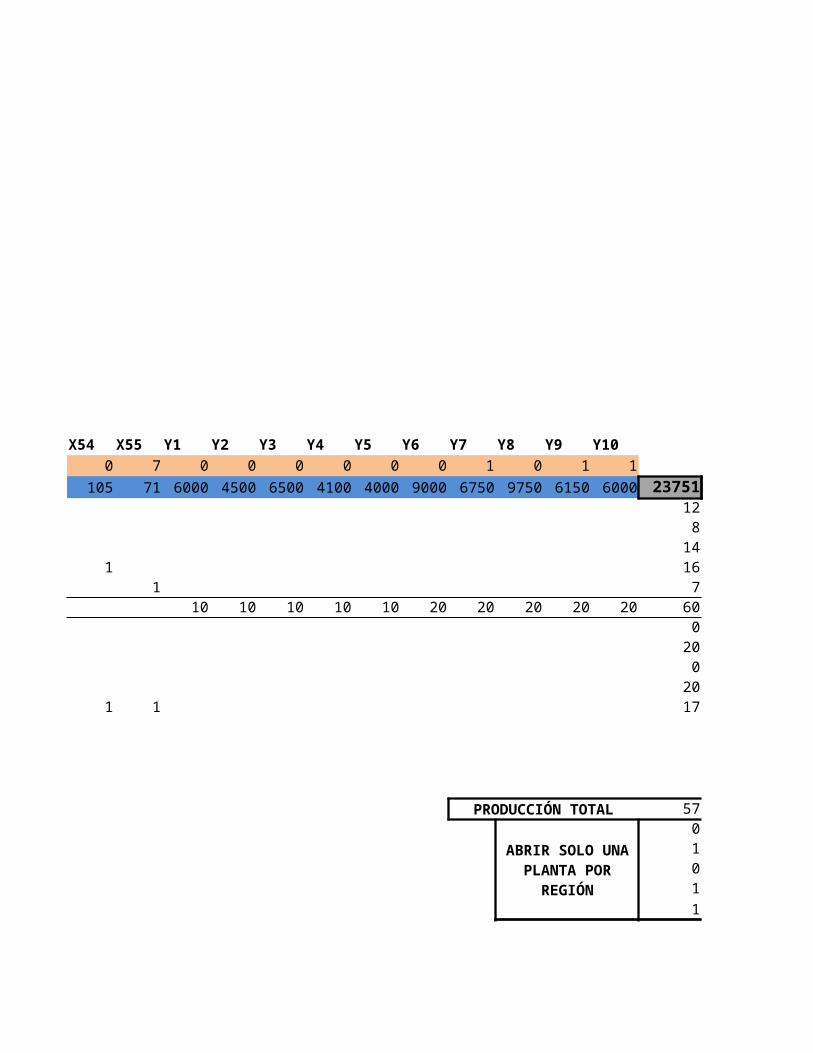
Y3 Y4 Y5 Y6 Y7 Y8 Y9 Y100 0 0 0 1 0 1 1
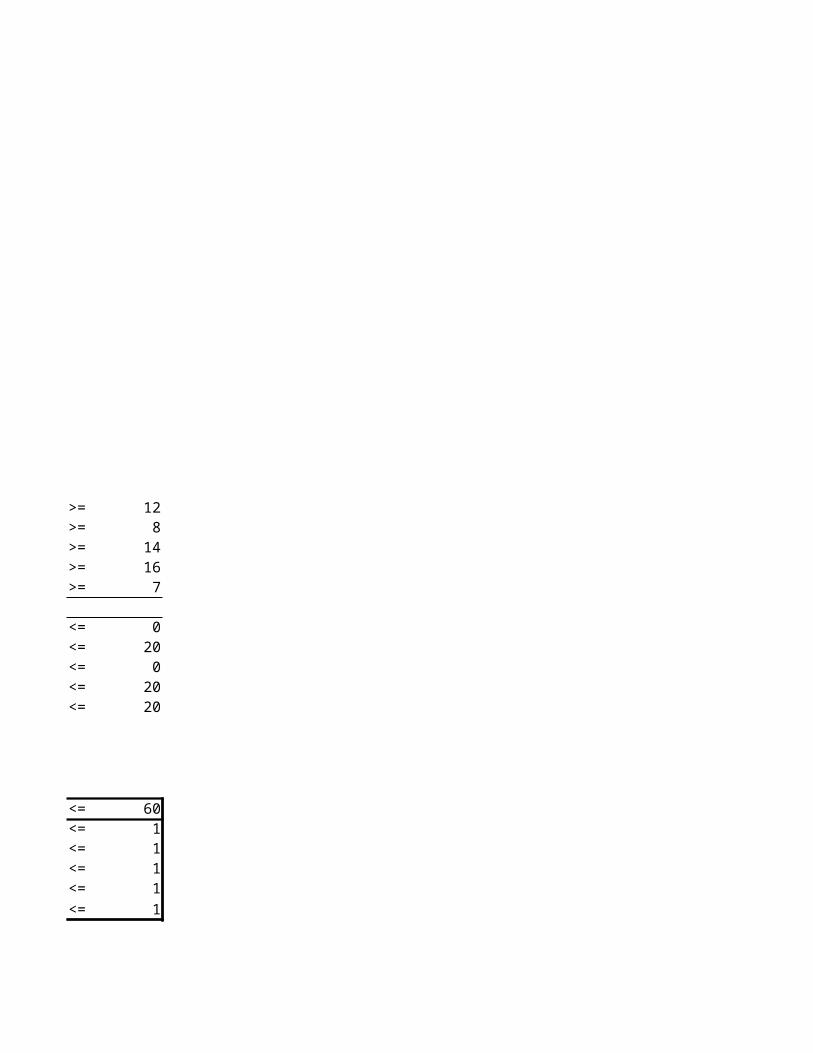
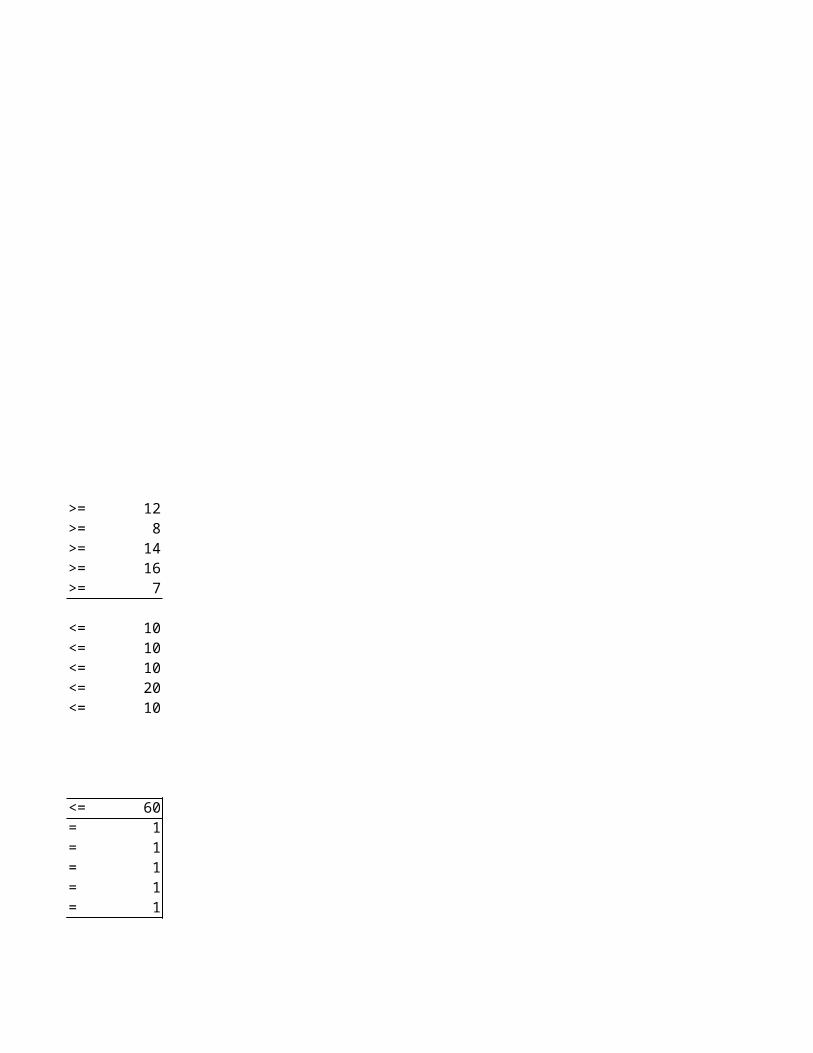
6500 4100 4000 9000 6750 9750 6150 6000 2375112 >= 12
8 >= 814 >= 1416 >= 16
7 >= 710 10 10 20 20 20 20 20 60
0 <= 020 <= 20
0 <= 020 <= 2017 <= 20
PRODUCCIÓN TOTAL 57 <= 600 <= 11 <= 10 <= 11 <= 11 <= 1
ABRIR SOLO UNA PLANTA POR
REGIÓN
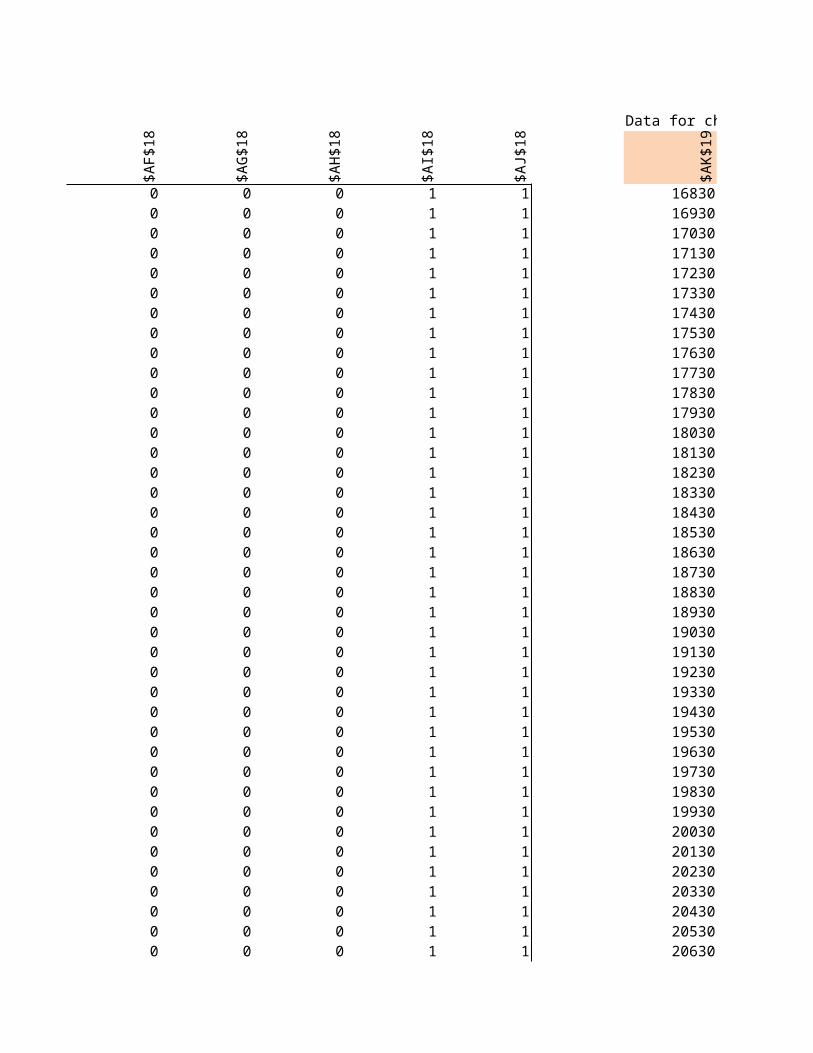
Oneway analysis for Solver model in Variacion 1 worksheet
Input (cell $AA$19) values along side, output cell(s) along top
$AK$
19
$AA$
18
$AB$
18
$AC$
18
$AD
$18
$AE$
18
$AF$
18
0 16830 1 0 0 0 1 0100 16930 1 0 0 0 1 0200 17030 1 0 0 0 1 0300 17130 1 0 0 0 1 0400 17230 1 0 0 0 1 0500 17330 1 0 0 0 1 0600 17430 1 0 0 0 1 0700 17530 1 0 0 0 1 0800 17630 1 0 0 0 1 0900 17730 1 0 0 0 1 0
1000 17830 1 0 0 0 1 01100 17930 1 0 0 0 1 01200 18030 1 0 0 0 1 01300 18130 1 0 0 0 1 01400 18230 1 0 0 0 1 01500 18330 1 0 0 0 1 01600 18430 1 0 0 0 1 01700 18530 1 0 0 0 1 01800 18630 1 0 0 0 1 01900 18730 1 0 0 0 1 02000 18830 1 0 0 0 1 02100 18930 1 0 0 0 1 02200 19030 1 0 0 0 1 02300 19130 1 0 0 0 1 02400 19230 1 0 0 0 1 02500 19330 1 0 0 0 1 02600 19430 1 0 0 0 1 02700 19530 1 0 0 0 1 02800 19630 1 0 0 0 1 02900 19730 1 0 0 0 1 03000 19830 1 0 0 0 1 03100 19930 1 0 0 0 1 03200 20030 1 0 0 0 1 03300 20130 1 0 0 0 1 03400 20230 1 0 0 0 1 03500 20330 1 0 0 0 1 03600 20430 1 0 0 0 1 03700 20530 1 0 0 0 1 03800 20630 1 0 0 0 1 03900 20730 1 0 0 0 1 04000 20830 1 0 0 0 1 04100 20930 0 0 0 1 1 04200 20930 0 0 0 1 1 0
B5
Solver found a solution. All constraints and optimality conditions are satisfied.
B6
Solver found a solution. All constraints and optimality conditions are satisfied.
B7
Solver found a solution. All constraints and optimality conditions are satisfied.
B8
Solver found a solution. All constraints and optimality conditions are satisfied.
B9
Solver found a solution. All constraints and optimality conditions are satisfied.
B10
Solver found a solution. All constraints and optimality conditions are satisfied.
B11
Solver found a solution. All constraints and optimality conditions are satisfied.
B12
Solver found a solution. All constraints and optimality conditions are satisfied.
B13
Solver found a solution. All constraints and optimality conditions are satisfied.
B14
Solver found a solution. All constraints and optimality conditions are satisfied.
B15
Solver found a solution. All constraints and optimality conditions are satisfied.
B16
Solver found a solution. All constraints and optimality conditions are satisfied.
B17
Solver found a solution. All constraints and optimality conditions are satisfied.
B18
Solver found a solution. All constraints and optimality conditions are satisfied.
B19
Solver found a solution. All constraints and optimality conditions are satisfied.
B20
Solver found a solution. All constraints and optimality conditions are satisfied.
B21
Solver found a solution. All constraints and optimality conditions are satisfied.
B22
Solver found a solution. All constraints and optimality conditions are satisfied.
B23
Solver found a solution. All constraints and optimality conditions are satisfied.
B24
Solver found a solution. All constraints and optimality conditions are satisfied.
B25
Solver found a solution. All constraints and optimality conditions are satisfied.
B26
Solver found an integer solution within tolerance. All constraints are satisfied.
B27
Solver found an integer solution within tolerance. All constraints are satisfied.
B28
Solver found an integer solution within tolerance. All constraints are satisfied.
B29
Solver found an integer solution within tolerance. All constraints are satisfied.
B30
Solver found a solution. All constraints and optimality conditions are satisfied.
B31
Solver found an integer solution within tolerance. All constraints are satisfied.
B32
Solver found an integer solution within tolerance. All constraints are satisfied.
B33
Solver found an integer solution within tolerance. All constraints are satisfied.
B34
Solver found an integer solution within tolerance. All constraints are satisfied.
B35
Solver found a solution. All constraints and optimality conditions are satisfied.
B36
Solver found a solution. All constraints and optimality conditions are satisfied.
B37
Solver found an integer solution within tolerance. All constraints are satisfied.
B38
Solver found an integer solution within tolerance. All constraints are satisfied.
B39
Solver found an integer solution within tolerance. All constraints are satisfied.
B40
Solver found an integer solution within tolerance. All constraints are satisfied.
B41
Solver found an integer solution within tolerance. All constraints are satisfied.
B42
Solver found an integer solution within tolerance. All constraints are satisfied.
B43
Solver found an integer solution within tolerance. All constraints are satisfied.
B44
Solver found an integer solution within tolerance. All constraints are satisfied.
B45
Solver found an integer solution within tolerance. All constraints are satisfied.
B46
Solver found an integer solution within tolerance. All constraints are satisfied.
B47
Solver found an integer solution within tolerance. All constraints are satisfied.

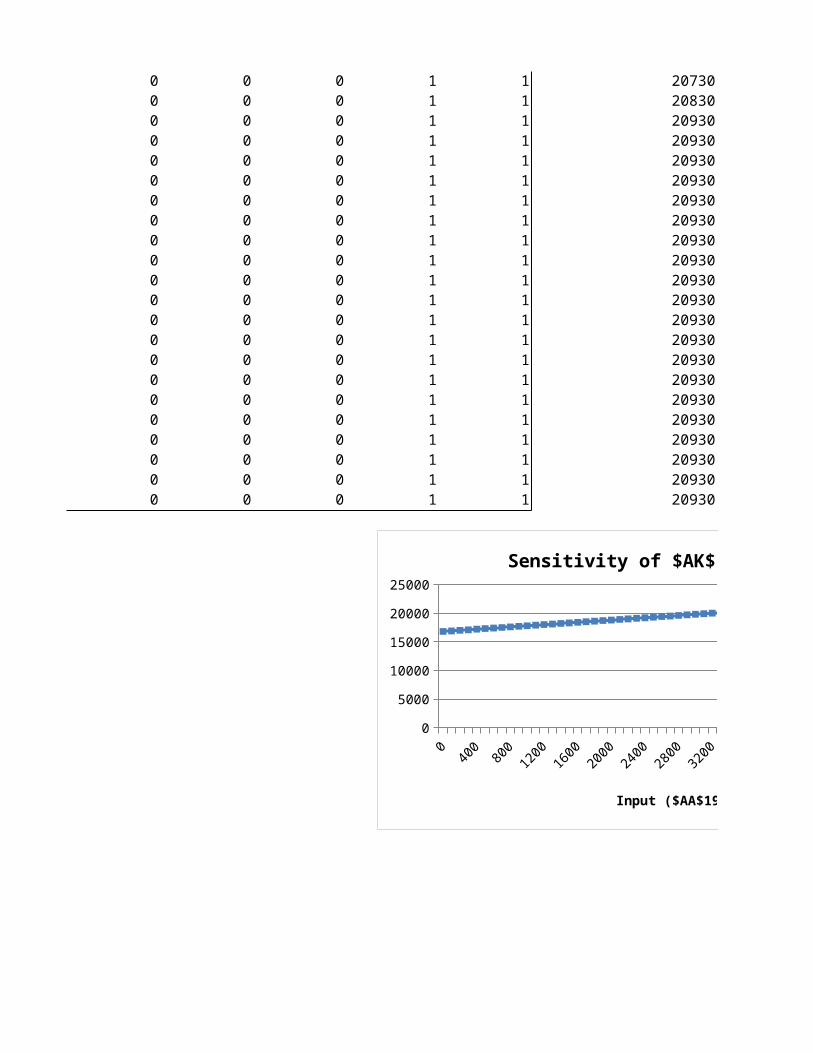
4300 20930 0 0 0 1 1 04400 20930 0 0 0 1 1 04500 20930 0 0 0 1 1 04600 20930 0 0 0 1 1 04700 20930 0 0 0 1 1 04800 20930 0 0 0 1 1 04900 20930 0 0 0 1 1 05000 20930 0 0 0 1 1 05100 20930 0 0 0 1 1 05200 20930 0 0 0 1 1 05300 20930 0 0 0 1 1 05400 20930 0 0 0 1 1 05500 20930 0 0 0 1 1 05600 20930 0 0 0 1 1 05700 20930 0 0 0 1 1 05800 20930 0 0 0 1 1 05900 20930 0 0 0 1 1 06000 20930 0 0 0 1 1 0
B48
Solver found an integer solution within tolerance. All constraints are satisfied.
B49
Solver found an integer solution within tolerance. All constraints are satisfied.
B50
Solver found an integer solution within tolerance. All constraints are satisfied.
B51
Solver found an integer solution within tolerance. All constraints are satisfied.
B52
Solver found an integer solution within tolerance. All constraints are satisfied.
B53
Solver found an integer solution within tolerance. All constraints are satisfied.
B54
Solver found an integer solution within tolerance. All constraints are satisfied.
B55
Solver found an integer solution within tolerance. All constraints are satisfied.
B56
Solver found an integer solution within tolerance. All constraints are satisfied.
B57
Solver found an integer solution within tolerance. All constraints are satisfied.
B58
Solver found an integer solution within tolerance. All constraints are satisfied.
B59
Solver found an integer solution within tolerance. All constraints are satisfied.
B60
Solver found an integer solution within tolerance. All constraints are satisfied.
B61
Solver found an integer solution within tolerance. All constraints are satisfied.
B62
Solver found an integer solution within tolerance. All constraints are satisfied.
B63
Solver found an integer solution within tolerance. All constraints are satisfied.
B64
Solver found an integer solution within tolerance. All constraints are satisfied.
B65
Solver found an integer solution within tolerance. All constraints are satisfied.

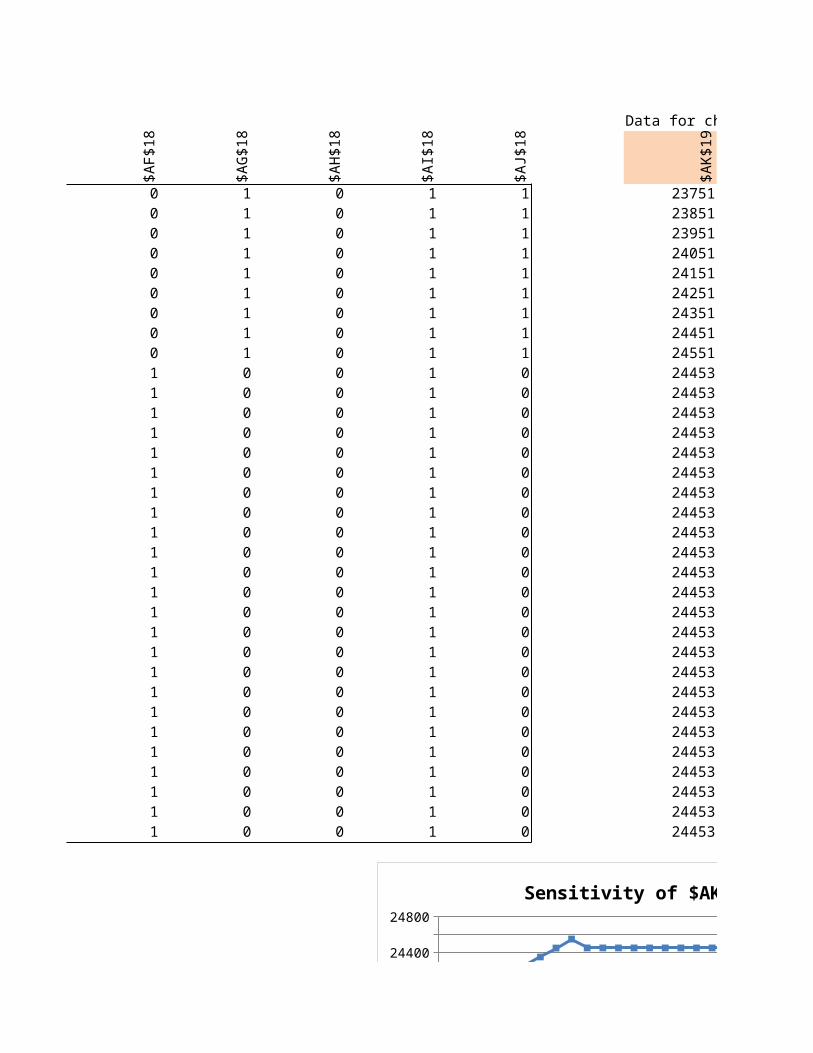
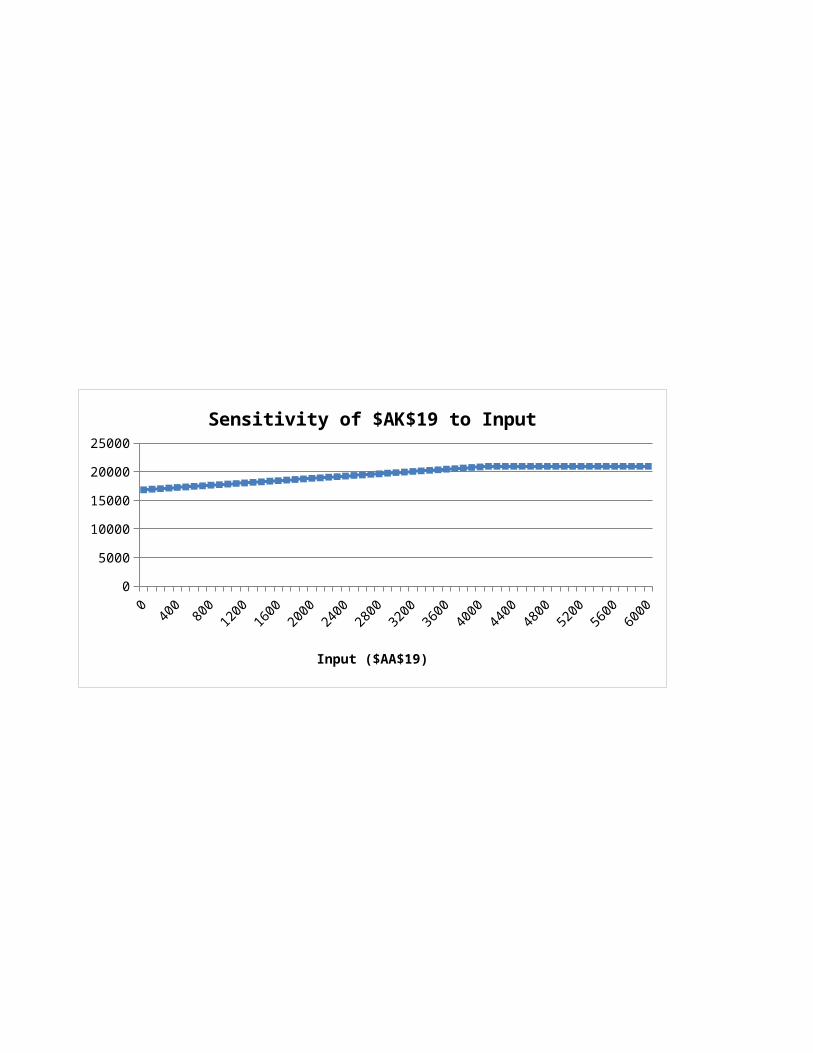
Sensitivity of $AK$19 to Input
Data for chart$A
G$1
8
$AH
$18
$AI$
18
$AJ$
18
1 $AK$
19
0 0 1 1 168300 0 1 1 169300 0 1 1 170300 0 1 1 171300 0 1 1 172300 0 1 1 173300 0 1 1 174300 0 1 1 175300 0 1 1 176300 0 1 1 177300 0 1 1 178300 0 1 1 179300 0 1 1 180300 0 1 1 181300 0 1 1 182300 0 1 1 183300 0 1 1 184300 0 1 1 185300 0 1 1 186300 0 1 1 187300 0 1 1 188300 0 1 1 189300 0 1 1 190300 0 1 1 191300 0 1 1 192300 0 1 1 193300 0 1 1 194300 0 1 1 195300 0 1 1 196300 0 1 1 197300 0 1 1 198300 0 1 1 199300 0 1 1 200300 0 1 1 201300 0 1 1 202300 0 1 1 203300 0 1 1 204300 0 1 1 205300 0 1 1 206300 0 1 1 207300 0 1 1 208300 0 1 1 209300 0 1 1 20930
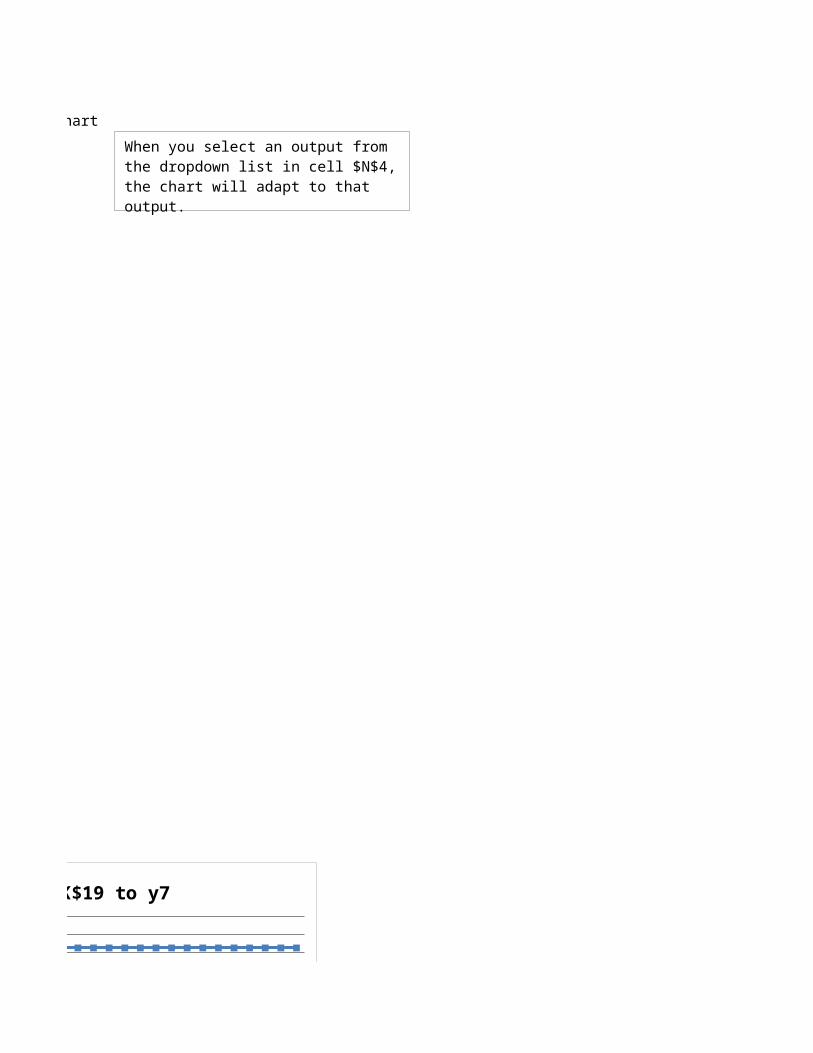
When you select an output from the dropdown list in cell $N$4, the chart will adapt to that output.
0 0 1 1 209300 0 1 1 209300 0 1 1 209300 0 1 1 209300 0 1 1 209300 0 1 1 209300 0 1 1 209300 0 1 1 209300 0 1 1 209300 0 1 1 209300 0 1 1 209300 0 1 1 209300 0 1 1 209300 0 1 1 209300 0 1 1 209300 0 1 1 209300 0 1 1 209300 0 1 1 20930
0300
600900
12001500
18002100
24002700
30003300
36003900
42004500
48005100
54005700
60000
5000
10000
15000
20000
25000
Sensitivity of $AK$19 to Input
Input ($AA$19)
When you select an output from the dropdown list in cell $N$4, the chart will adapt to that output.

0300
600900
12001500
18002100
24002700
30003300
36003900
42004500
48005100
54005700
60000
5000
10000
15000
20000
25000
Sensitivity of $AK$19 to Input
Input ($AA$19)

Oneway analysis for Solver model in Original worksheet
y7 (cell $AG$19) values along side, output cell(s) along top
$AK$
19
$AA$
18
$AB$
18
$AC$
18
$AD
$18
$AE$
18
$AF$
18
6750 23751 0 0 0 0 0 06850 23851 0 0 0 0 0 06950 23951 0 0 0 0 0 07050 24051 0 0 0 0 0 07150 24151 0 0 0 0 0 07250 24251 0 0 0 0 0 07350 24351 0 0 0 0 0 07450 24451 0 0 0 0 0 07550 24551 0 0 0 0 0 07650 24453 0 1 0 0 1 17750 24453 0 1 0 0 1 17850 24453 0 1 0 0 1 17950 24453 0 1 0 0 1 18050 24453 0 1 0 0 1 18150 24453 0 1 0 0 1 18250 24453 0 1 0 0 1 18350 24453 0 1 0 0 1 18450 24453 0 1 0 0 1 18550 24453 0 1 0 0 1 18650 24453 0 1 0 0 1 18750 24453 0 1 0 0 1 18850 24453 0 1 0 0 1 18950 24453 0 1 0 0 1 19050 24453 0 1 0 0 1 19150 24453 0 1 0 0 1 19250 24453 0 1 0 0 1 19350 24453 0 1 0 0 1 19450 24453 0 1 0 0 1 19550 24453 0 1 0 0 1 19650 24453 0 1 0 0 1 19750 24453 0 1 0 0 1 19850 24453 0 1 0 0 1 19950 24453 0 1 0 0 1 1
B5
Solver found an integer solution within tolerance. All constraints are satisfied.
B6
Solver found a solution. All constraints and optimality conditions are satisfied.
B7
Solver found a solution. All constraints and optimality conditions are satisfied.
B8
Solver found an integer solution within tolerance. All constraints are satisfied.
B9
Solver found an integer solution within tolerance. All constraints are satisfied.
B10
Solver found an integer solution within tolerance. All constraints are satisfied.
B11
Solver found an integer solution within tolerance. All constraints are satisfied.
B12
Solver found an integer solution within tolerance. All constraints are satisfied.
B13
Solver found an integer solution within tolerance. All constraints are satisfied.
B14
Solver found a solution. All constraints and optimality conditions are satisfied.
B15
Solver found a solution. All constraints and optimality conditions are satisfied.
B16
Solver found a solution. All constraints and optimality conditions are satisfied.
B17
Solver found a solution. All constraints and optimality conditions are satisfied.
B18
Solver found an integer solution within tolerance. All constraints are satisfied.
B19
Solver found an integer solution within tolerance. All constraints are satisfied.
B20
Solver found an integer solution within tolerance. All constraints are satisfied.
B21
Solver found an integer solution within tolerance. All constraints are satisfied.
B22
Solver found a solution. All constraints and optimality conditions are satisfied.
B23
Solver found an integer solution within tolerance. All constraints are satisfied.
B24
Solver found an integer solution within tolerance. All constraints are satisfied.
B25
Solver found a solution. All constraints and optimality conditions are satisfied.
B26
Solver found a solution. All constraints and optimality conditions are satisfied.
B27
Solver found a solution. All constraints and optimality conditions are satisfied.
B28
Solver found an integer solution within tolerance. All constraints are satisfied.
B29
Solver found a solution. All constraints and optimality conditions are satisfied.
B30
Solver found a solution. All constraints and optimality conditions are satisfied.
B31
Solver found an integer solution within tolerance. All constraints are satisfied.
B32
Solver found an integer solution within tolerance. All constraints are satisfied.
B33
Solver found an integer solution within tolerance. All constraints are satisfied.
B34
Solver found an integer solution within tolerance. All constraints are satisfied.
B35
Solver found an integer solution within tolerance. All constraints are satisfied.
B36
Solver found an integer solution within tolerance. All constraints are satisfied.
B37
Solver found an integer solution within tolerance. All constraints are satisfied.

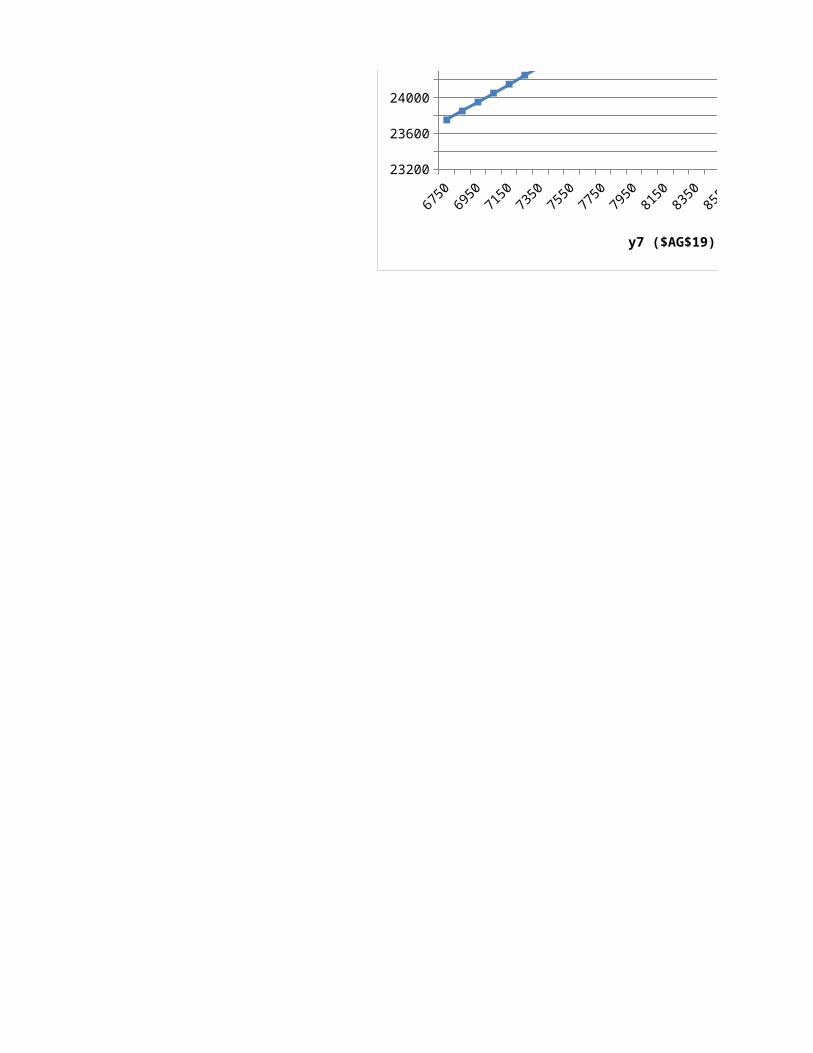
Sensitivity of $AK$19 to y7
Data for chart$A
G$1
8
$AH
$18
$AI$
18
$AJ$
18
1 $AK$
19
1 0 1 1 237511 0 1 1 238511 0 1 1 239511 0 1 1 240511 0 1 1 241511 0 1 1 242511 0 1 1 243511 0 1 1 244511 0 1 1 245510 0 1 0 244530 0 1 0 244530 0 1 0 244530 0 1 0 244530 0 1 0 244530 0 1 0 244530 0 1 0 244530 0 1 0 244530 0 1 0 244530 0 1 0 244530 0 1 0 244530 0 1 0 244530 0 1 0 244530 0 1 0 244530 0 1 0 244530 0 1 0 244530 0 1 0 244530 0 1 0 244530 0 1 0 244530 0 1 0 244530 0 1 0 244530 0 1 0 244530 0 1 0 244530 0 1 0 24453
67506950
71507350
75507750
79508150
83508550
87508950
91509350
95509750
995023200
23400
23600
23800
24000
24200
24400
24600
24800
Sensitivity of $AK$19 to y7
y7 ($AG$19)
When you select an output from the dropdown list in cell $N$4, the chart will adapt to that output.
67506950
71507350
75507750
79508150
83508550
87508950
91509350
95509750
995023200
23400
23600
23800
24000
24200
24400
24600
24800
Sensitivity of $AK$19 to y7
y7 ($AG$19)
67506950
71507350
75507750
79508150
83508550
87508950
91509350
95509750
995023200
23400
23600
23800
24000
24200
24400
24600
24800
Sensitivity of $AK$19 to y7
y7 ($AG$19)
When you select an output from the dropdown list in cell $N$4, the chart will adapt to that output.
67506950
71507350
75507750
79508150
83508550
87508950
91509350
95509750
995023200
23400
23600
23800
24000
24200
24400
24600
24800
Sensitivity of $AK$19 to y7
y7 ($AG$19)

67506950
71507350
75507750
79508150
83508550
87508950
91509350
95509750
995023200
23400
23600
23800
24000
24200
24400
24600
24800
Sensitivity of $AK$19 to y7
y7 ($AG$19)
0300
600900
12001500
18002100
24002700
30003300
36003900
42004500
48005100
54005700
60000
5000
10000
15000
20000
25000
Sensitivity of $AK$19 to Input
Input ($AA$19)

0300
600900
12001500
18002100
24002700
30003300
36003900
42004500
48005100
54005700
60000
5000
10000
15000
20000
25000
Sensitivity of $AK$19 to Input
Input ($AA$19)
ANOR ASUR EUR ASIA ÁFR
AMÉRICA N 81 92 101 130 115 10 6000 Y1AMÉRICA S 117 77 108 98 100 10 4500 Y2EUROPA 102 105 95 119 111 10 6500 Y3ASIA 115 125 90 59 74 10 4100 Y4ÁFRICA 142 100 103 105 71 10 4000 Y5AMÉRICA N 81 92 101 130 115 20 9000 Y6AMÉRICA S 117 77 108 98 100 20 6750 Y7EUROPA 102 105 95 119 111 20 9750 Y8ASIA 115 125 90 59 74 20 6150 Y9ÁFRICA 142 100 103 105 71 20 6000 Y10Demanda 12 8 14 16 7
X11 X12 X13 X14 X15 X21 X22 X23 X24 X25 X31VARIABLES 0 0 0 0 0 0 0 0 0 0 0COSTOS 972 736 1414 2080 805 1404 616 1512 1568 700 1224
ASIGN. PLANT.
1 1 11 1
1 11 1
1 1f(x) 12 12 12g(x) 8 8h(x) 14 14i(x) 16 16j(x) 7 7CAPACIDAD
12 8 14 16 712 8 14 16 7
12
REGIÓN DE DEMANDA(costo de producción y transporte por cada
1,000,000 de unidades)REGION DE OFERTA CAPACI
DADCosto Fijo($)
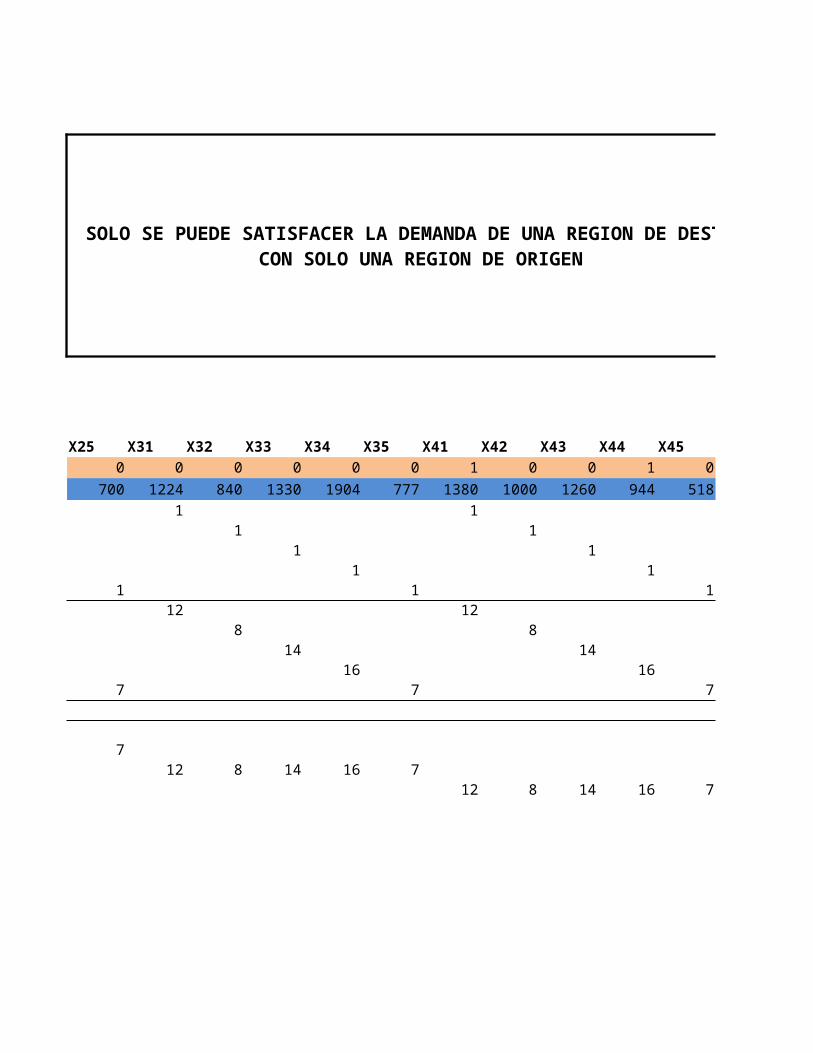
SOLO SE PUEDE SATISFACER LA DEMANDA DE UNA REGION DE DESTINO CON SOLO UNA REGION DE ORIGEN
X32 X33 X34 X35 X41 X42 X43 X44 X45 X51 X52 X53 X540 0 0 0 1 0 0 1 0 0 1 1 0
840 1330 1904 777 1380 1000 1260 944 518 1704 800 1442 16801 1
1 1 11 1 1
1 1 11 1
12 128 8 8
14 14 1416 16 16
7 7
8 14 16 712 8 14 16 7
12 8 14 16
SOLO SE PUEDE SATISFACER LA DEMANDA DE UNA REGION DE DESTINO CON SOLO UNA REGION DE ORIGEN
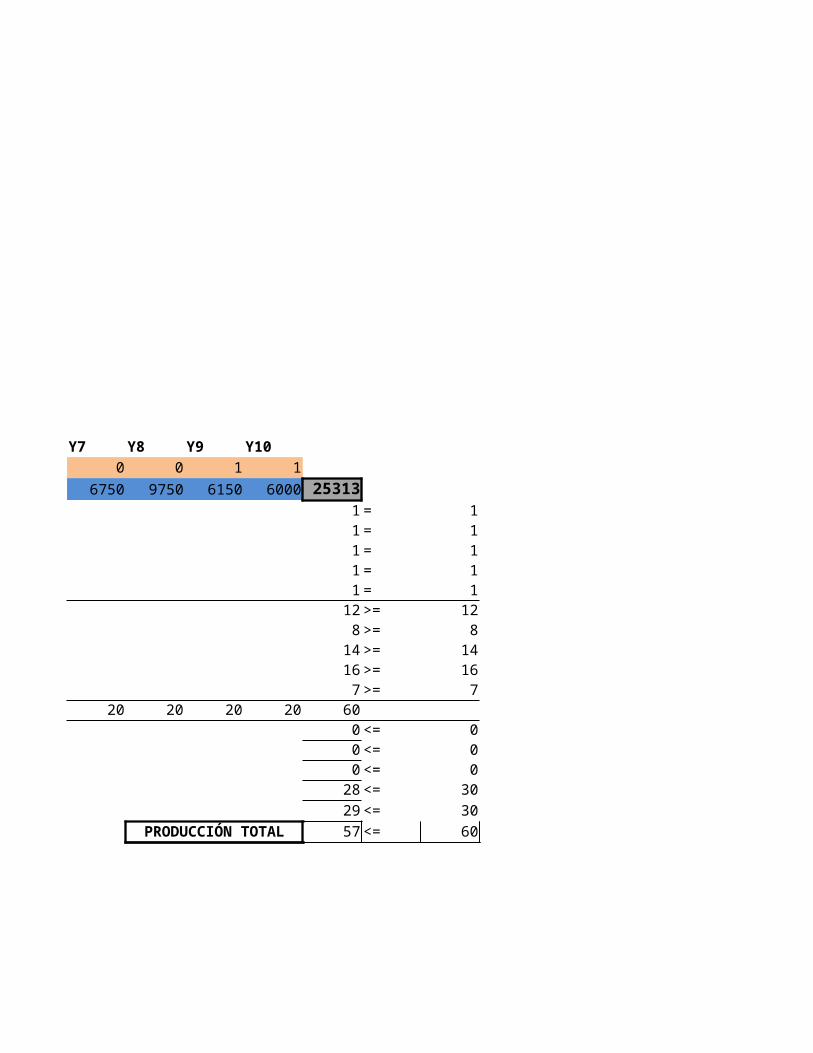
X55 Y1 Y2 Y3 Y4 Y5 Y6 Y7 Y8 Y9 Y101 0 0 0 1 1 0 0 0 1 1
497 6000 4500 6500 4100 4000 9000 6750 9750 6150 6000 253131 =1 =1 =1 =
1 1 =12 >=
8 >=14 >=16 >=
7 7 >=10 10 10 10 10 20 20 20 20 20 60
0 <=0 <=0 <=
28 <=7 29 <=
PRODUCCIÓN TOTAL 57 <=
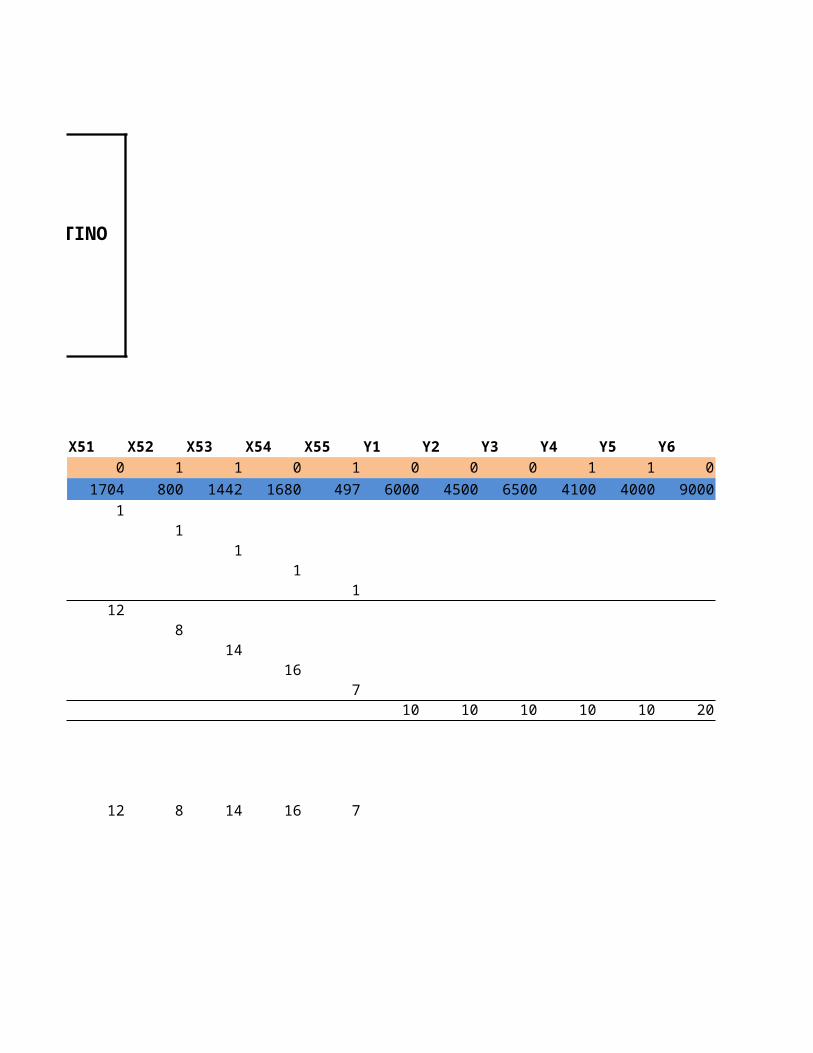
11111
128
1416
7
000
303060
ANOR ASUR EUR ASIA ÁFR
AMÉRICA N 81 92 101 130 115 10 6000 Y1AMÉRICA S 117 77 108 98 100 10 4500 Y2EUROPA 102 105 95 119 111 10 6500 Y3ASIA 115 125 90 59 74 10 4100 Y4ÁFRICA 142 100 103 105 71 10 4000 Y5AMÉRICA N 81 92 101 130 115 20 9000 Y6AMÉRICA S 117 77 108 98 100 20 6750 Y7EUROPA 102 105 95 119 111 20 9750 Y8ASIA 115 125 90 59 74 20 6150 Y9ÁFRICA 142 100 103 105 71 20 6000 Y10Demanda 12 8 14 16 7
X11 X12 X13 X14 X15 X21 X22 X23 X24 X25 X31VARIABLES 10 0 0 0 0 0 8 0 0 0 2COSTOS 81 92 101 130 115 117 77 108 98 100 102f(x) 1 1 1g(x) 1 1h(x) 1 1i(x) 1 1j(x) 1 1CAPACIDAD
1 1 1 1 11 1 1 1 1
1
REGIÓN DE DEMANDA(costo de producción y transporte por cada 1,000,000 de
unidades)REGION DE OFERTA CAPACI
DADCosto Fijo($)

X32 X33 X34 X35 X41 X42 X43 X44 X45 X51 X52 X53 X54 X55 Y1 Y20 8 0 0 0 0 4 16 0 0 0 2 0 7 1 1
105 95 119 111 115 125 90 59 74 142 100 103 105 71 6000 45001 1
1 1 11 1 1
1 1 11 1 1
10 10
1 1 1 11 1 1 1 1
1 1 1 1 1
ABRIR UNA PLANTA EN CADA REGION

Y3 Y4 Y5 Y6 Y7 Y8 Y9 Y101 0 1 0 0 0 1 0
6500 4100 4000 9000 6750 9750 6150 6000 3154712 >= 12
8 >= 814 >= 1416 >= 16
7 >= 710 10 10 20 20 20 20 20 60
10 <= 108 <= 10
10 <= 1020 <= 20
9 <= 10
PRODUCCIÓN TOTAL 57 <= 601 = 11 = 11 = 11 = 11 = 1
ABRIR UNA PLANTA EN CADA
REGION

ANOR ASUR EUR ASIA ÁFR
AMÉRICA N 81 92 101 130 115 10 6000 Y1AMÉRICA S 117 77 108 98 100 10 4500 Y2EUROPA 102 105 95 119 111 10 6500 Y3ASIA 115 125 90 59 74 10 4100 Y4ÁFRICA 142 100 103 105 71 10 4000 Y5AMÉRICA N 81 92 101 130 115 20 9000 Y6AMÉRICA S 117 77 108 98 100 20 6750 Y7EUROPA 102 105 95 119 111 20 9750 Y8ASIA 115 125 90 59 74 20 6150 Y9ÁFRICA 142 100 103 105 71 20 6000 Y10Demanda 12 8 14 16 7
X11 X12 X13 X14 X15 X21 X22 X23 X24 X25 X31 X32VARIABLES 0 0 0 0 0 0 0 0 0 0 0 0COSTOS 81 92 101 130 115 117 77 108 98 100 102 105f(x) 1 1 1g(x) 1 1 1h(x) 1 1i(x) 1 1j(x) 1 1CAPACIDAD
1 1 1 1 11 1 1 1 1
1 1
REGIÓN DE DEMANDA(costo de producción y transporte por cada 1,000,000 de
unidades)REGION DE OFERTA CAPACI
DADCosto Fijo($)
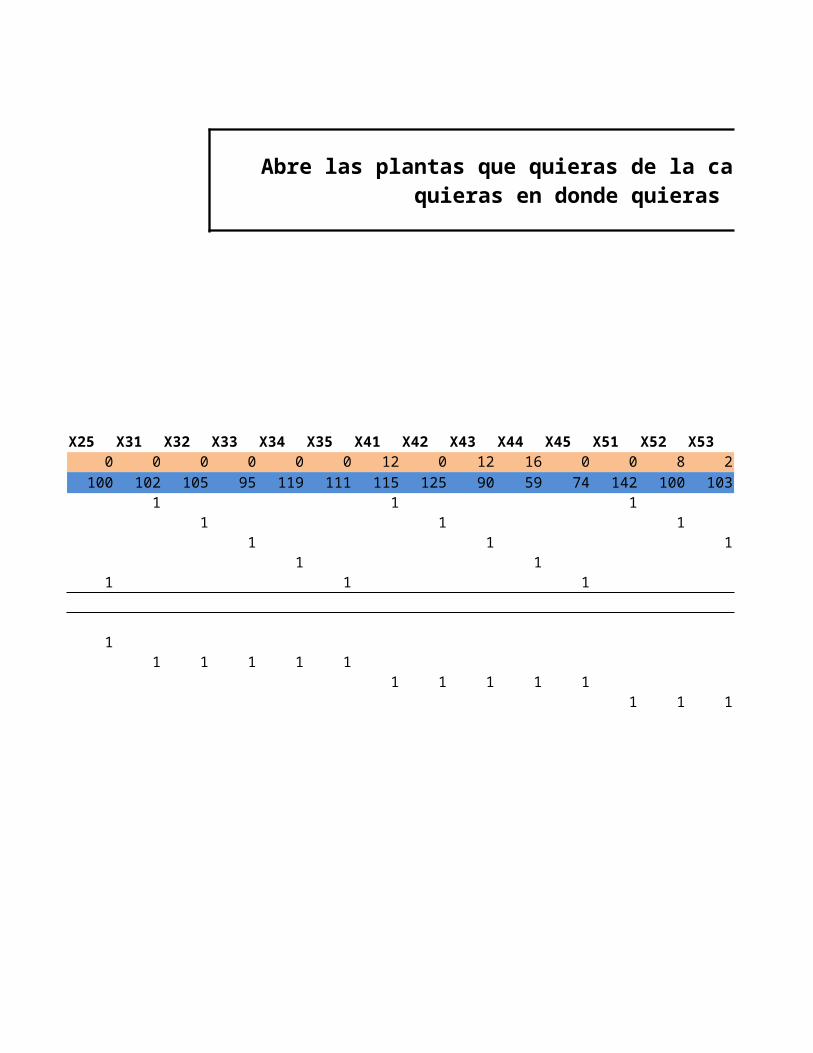
X33 X34 X35 X41 X42 X43 X44 X45 X51 X52 X53 X54 X55 Y1 Y2 Y30 0 0 12 0 12 16 0 0 8 2 0 7 0 0 0
95 119 111 115 125 90 59 74 142 100 103 105 71 6000 4500 65001 1
1 11 1 1
1 1 11 1 1
10 10 10
1 1 11 1 1 1 1
1 1 1 1 1
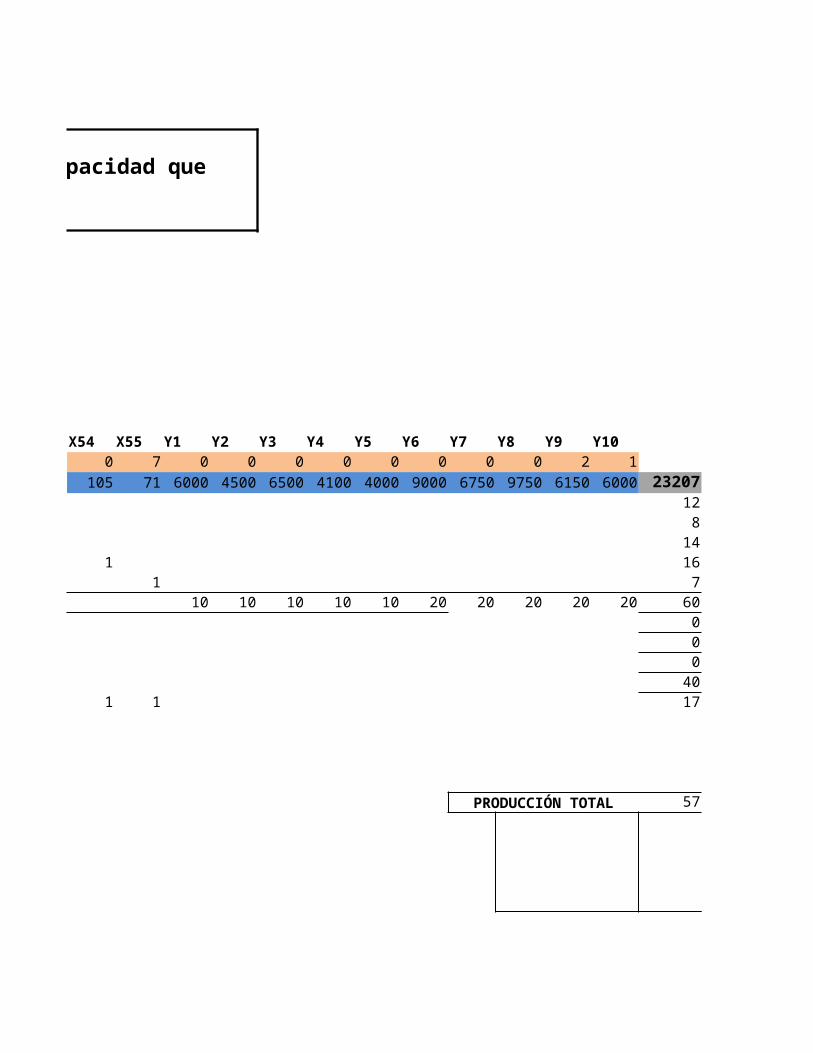
Abre las plantas que quieras de la capacidad que quieras en donde quieras
Y4 Y5 Y6 Y7 Y8 Y9 Y100 0 0 0 0 2 1
4100 4000 9000 6750 9750 6150 6000 2320712 >= 12
8 >= 814 >= 1416 >= 16
7 >= 710 10 20 20 20 20 20 60
0 <= 00 <= 00 <= 0
40 <= 4017 <= 20
PRODUCCIÓN TOTAL 57 <= 60
Costo Fijo($)
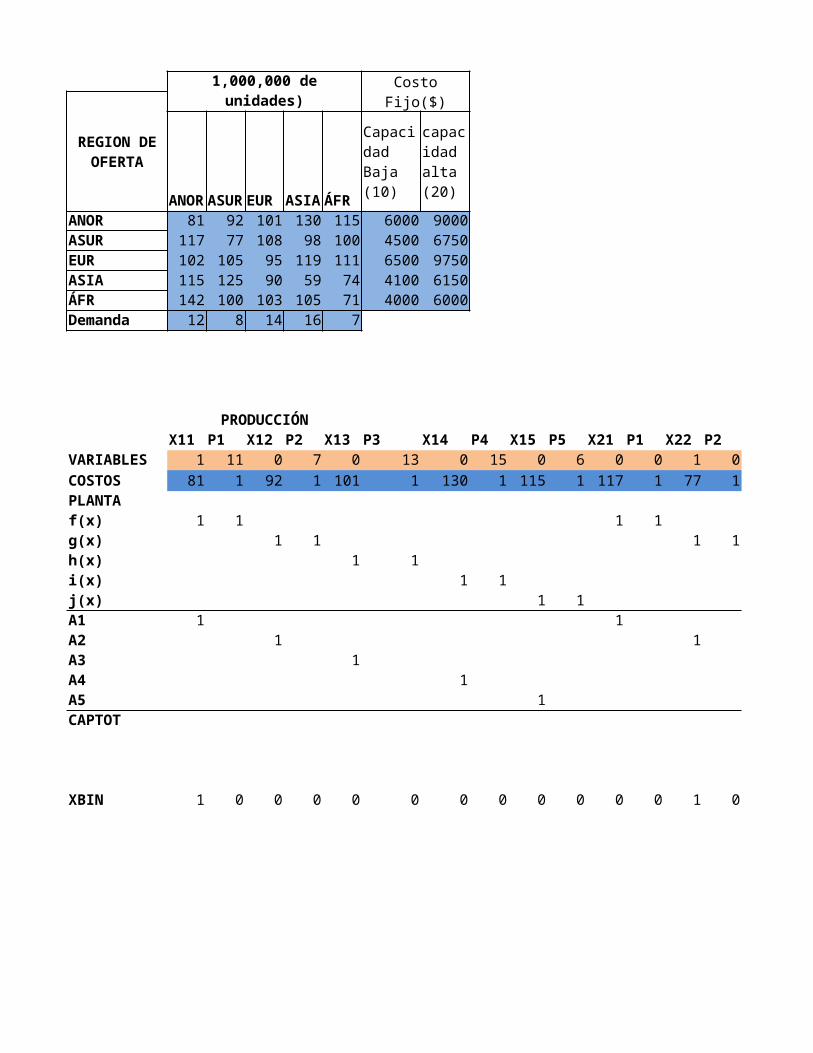
ANORASUREUR ASIA ÁFRANOR 81 92 101 130 115 6000 9000ASUR 117 77 108 98 100 4500 6750EUR 102 105 95 119 111 6500 9750ASIA 115 125 90 59 74 4100 6150ÁFR 142 100 103 105 71 4000 6000Demanda 12 8 14 16 7
PRODUCCIÓNX11 P1 X12 P2 X13 P3 X14 P4 X15 P5 X21 P1 X22 P2 X23 P3
VARIABLES 1 11 0 7 0 13 0 15 0 6 0 0 1 0 0 0COSTOS 81 1 92 1 101 1 130 1 115 1 117 1 77 1 108 1PLANTAf(x) 1 1 1 1g(x) 1 1 1 1h(x) 1 1 1 1i(x) 1 1j(x) 1 1A1 1 1A2 1 1A3 1 1A4 1A5 1CAPTOT
XBIN 1 0 0 0 0 0 0 0 0 0 0 0 1 0 0 0
REGIÓN DE DEMANDA(costo de
producción y transporte por cada 1,000,000 de
unidades)
REGION DE OFERTA
Capacidad Baja (10)
capacidad alta (20)
X24 P4 X25 P5 X31 P1 X32 P2 X33 P3 X34 P4 X35 P5 X41 P1 X42 P2 X43 P30 0 0 0 0 0 0 0 0 0 0 0 0 0 0 0 0 0 1 0
98 1 100 1 102 1 105 1 95 1 119 1 111 1 115 1 125 1 90 1
1 1 1 11 1 1 1
1 1 1 11 1 1 1
1 1 1 11 1
1 11 1
1 11 1
0 0 0 0 0 0 0 0 0 0 0 0 0 0 0 0 0 0 1 0

X44 P4 X45 P5 X51 P1 X52 P2 X53 P3 X54 P4 X55 P5 Y11 Y12 Y21 Y221 0 0 0 0 0 0 0 0 0 0 0 1 0 0 0 0 1
59 1 74 1 142 1 100 1 103 1 105 1 71 1 6000 9000 4500 67501 1 1 1
1 11 1
1 11 1 1 1
1 1 1 11
11
1 11 1
10 20 10 20
1 0 0 0 0 0 0 0 0 0 0 0 1 0
Y31 Y32 Y41 Y42 Y51 Y520 0 0 1 0 1
6500 9750 4100 6150 4000 6000 193301 1 1 1 1 1 3 <= 5
12 >= 128 >= 8
14 >= 1416 >= 16
7 >= 71 >= 11 >= 11 >= 11 >= 11 >= 1
10 20 10 20 10 20 60
57 <= 60
0 <= 11 <= 10 <= 11 <= 11 <= 1
TOTAL DEMANDA
UNA PLANTA POR REGION


![[AS9028 Examen]-AS9028 Examen](https://static.fdocuments.in/doc/165x107/577cdc2c1a28ab9e78aa1150/as9028-examen-as9028-examen.jpg)