
EWO 2011-03 Martijn.ppt - Carnegie Mellon Universityegon.cheme.cmu.edu/ewo/docs/UnileverEWO 2011-03...
15
FMCG scheduling Martijn van Elzakker EWO meeting, March 2011 S P S Process Systems Engineering
Transcript of EWO 2011-03 Martijn.ppt - Carnegie Mellon Universityegon.cheme.cmu.edu/ewo/docs/UnileverEWO 2011-03...

FMCG scheduling g
Martijn van Elzakker
EWO meeting, March 2011
S P SProcess Systems Engineering
Outline
Problem Overview
Modeling Approach
Results Results
Future Work
S P S Process Systems Engineering 112-3-2011
Problem overview
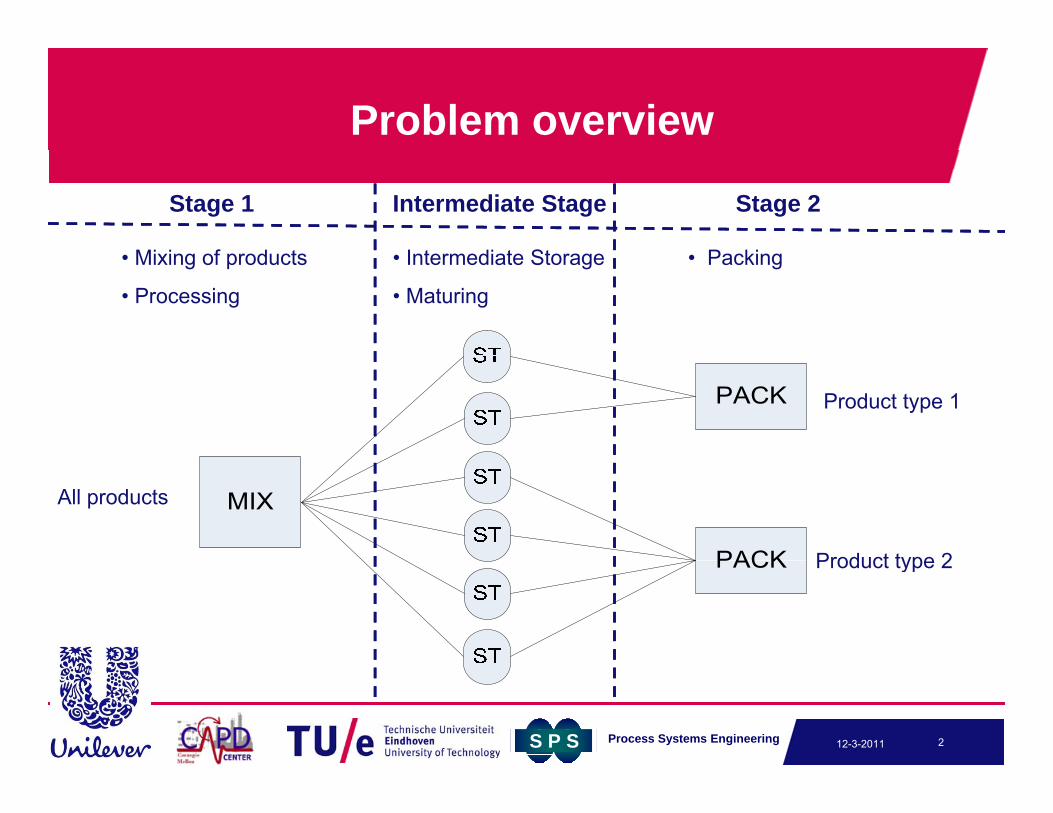
Stage 1 Intermediate Stage Stage 2
Mi i f d t I t di t St P ki• Mixing of products
• Processing
• Intermediate Storage
• Maturing
• Packing
Product type 1
All products
Product type 2Product type 2
S P S Process Systems Engineering 212-3-2011
Main Challenge
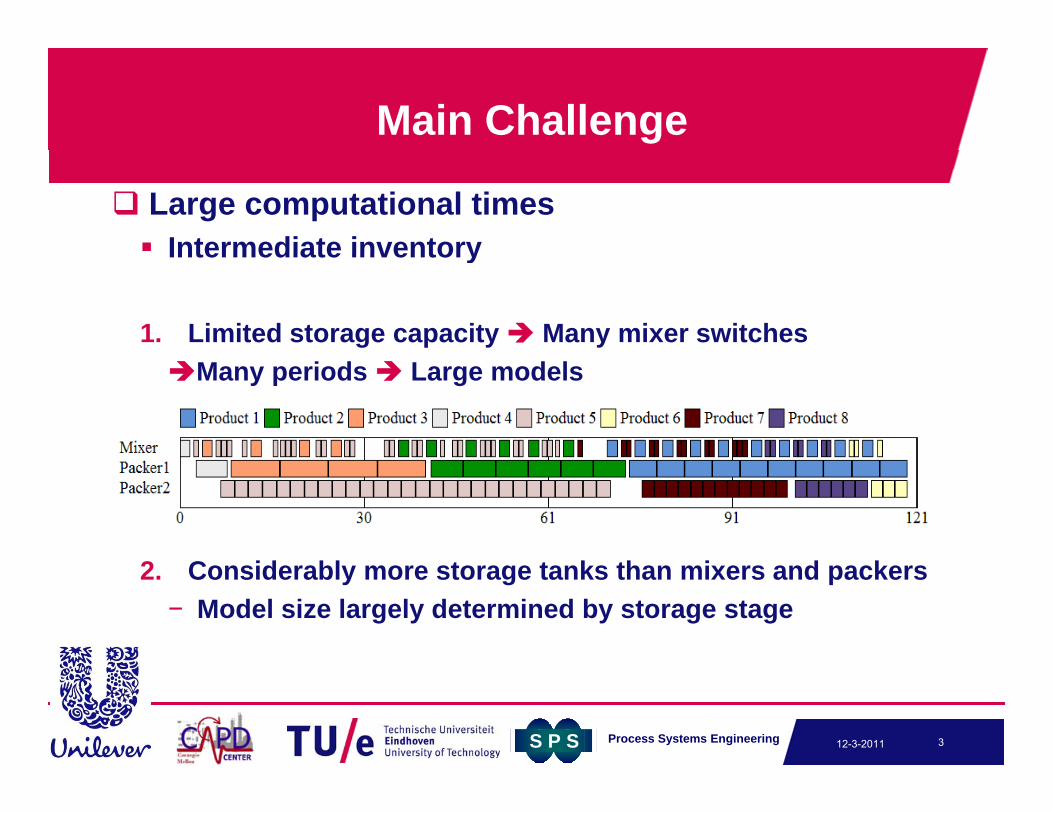
Large computational times Intermediate inventoryIntermediate inventory
1. Limited storage capacity Many mixer switchesMany periods Large models
2 C2. Considerably more storage tanks than mixers and packers− Model size largely determined by storage stage
S P S Process Systems Engineering 312-3-2011
Dedicated time slots
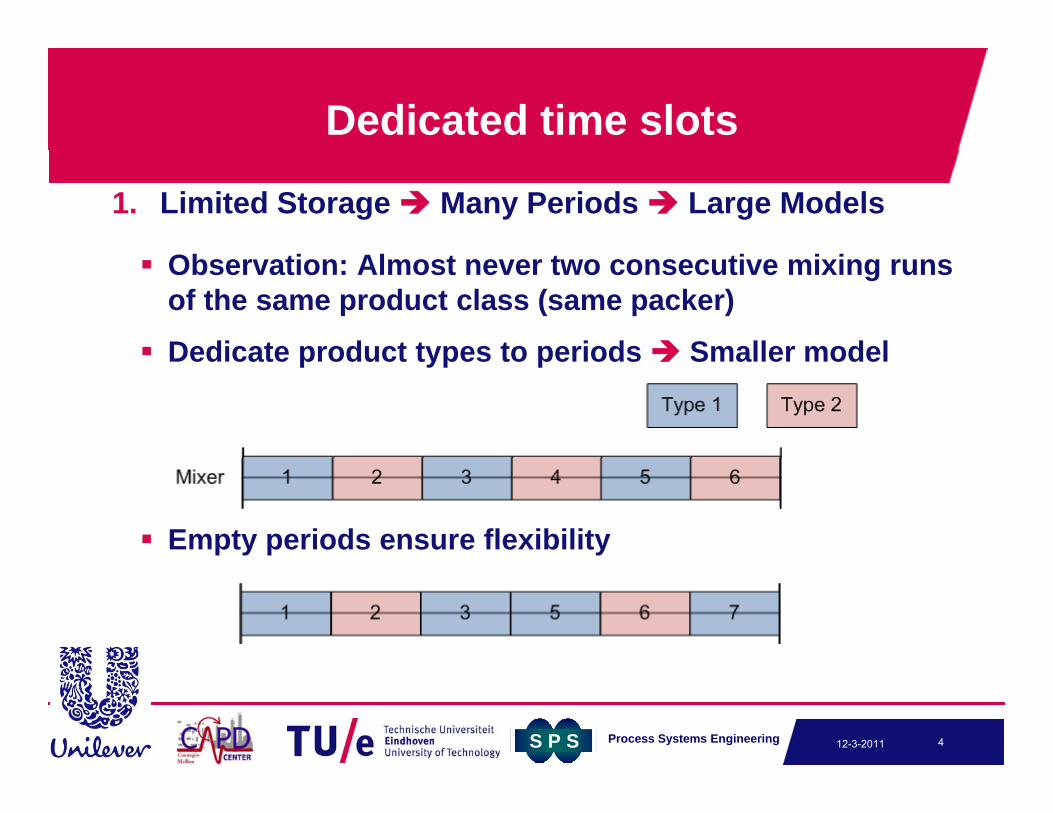
1. Limited Storage Many Periods Large Models
Observation: Almost never two consecutive mixing runs of the same product class (same packer)
Dedicate product types to periods Smaller modelDedicate product types to periods Smaller model
Empty periods ensure flexibility
S P S Process Systems Engineering 412-3-2011
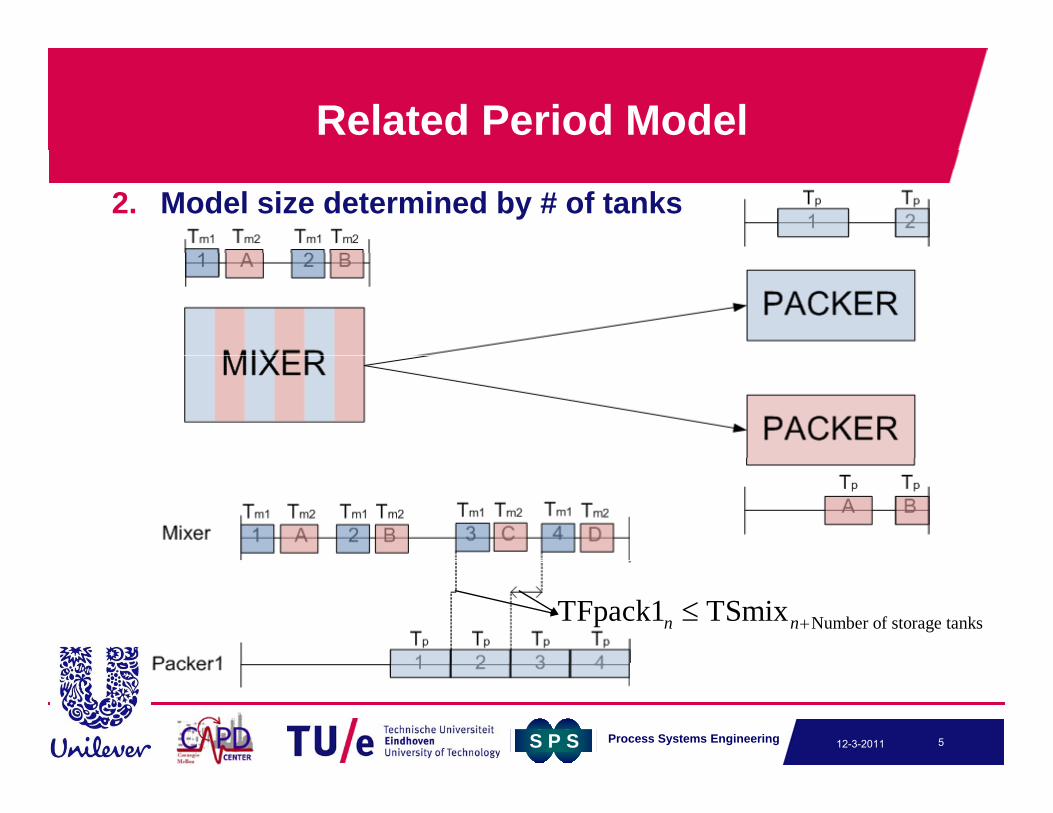
Related Period Model
2. Model size determined by # of tanks
Number of storage tanksTFpack1 TSmixn n
S P S Process Systems Engineering 512-3-2011
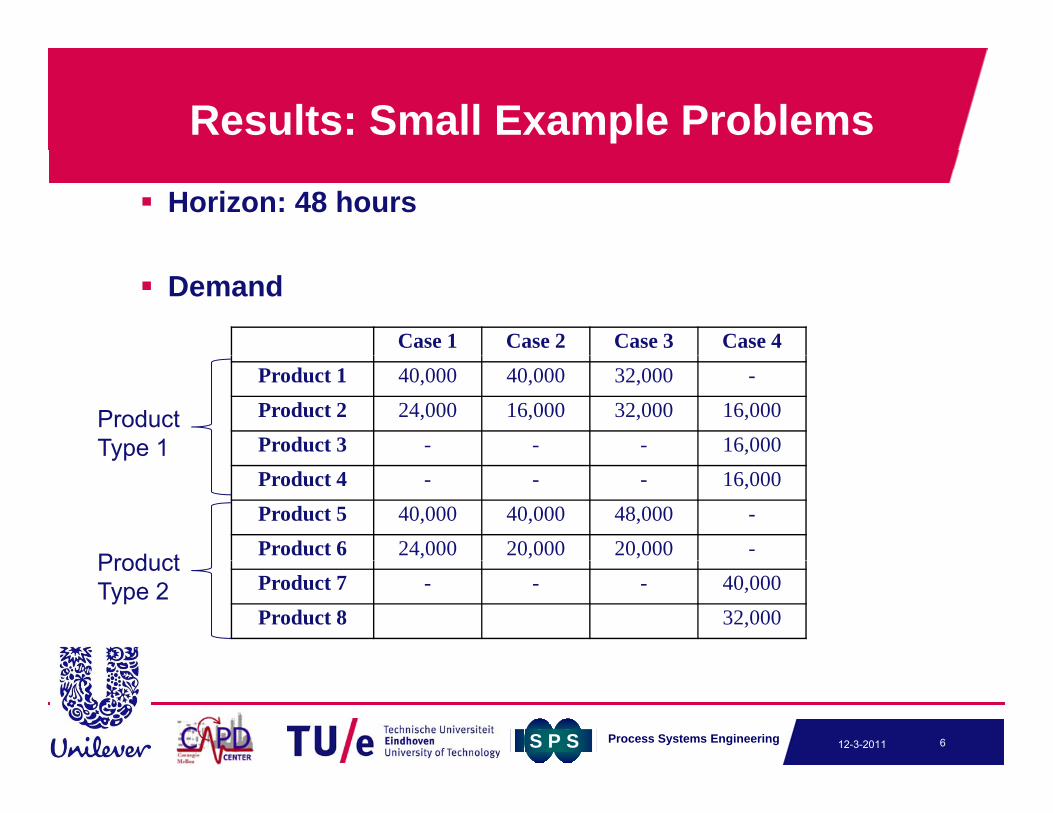
Results: Small Example Problems
Horizon: 48 hours
Demand
Case 1 Case 2 Case 3 Case 4Product 1 40,000 40,000 32,000 -Product 2 24,000 16,000 32,000 16,000Product 3 - - - 16,000
Product Type 1
Product 4 - - - 16,000Product 5 40,000 40,000 48,000 -Product 6 24,000 20,000 20,000 -
yp
ProductProduct 7 - - - 40,000Product 8 32,000
Product Type 2
S P S Process Systems Engineering 612-3-2011
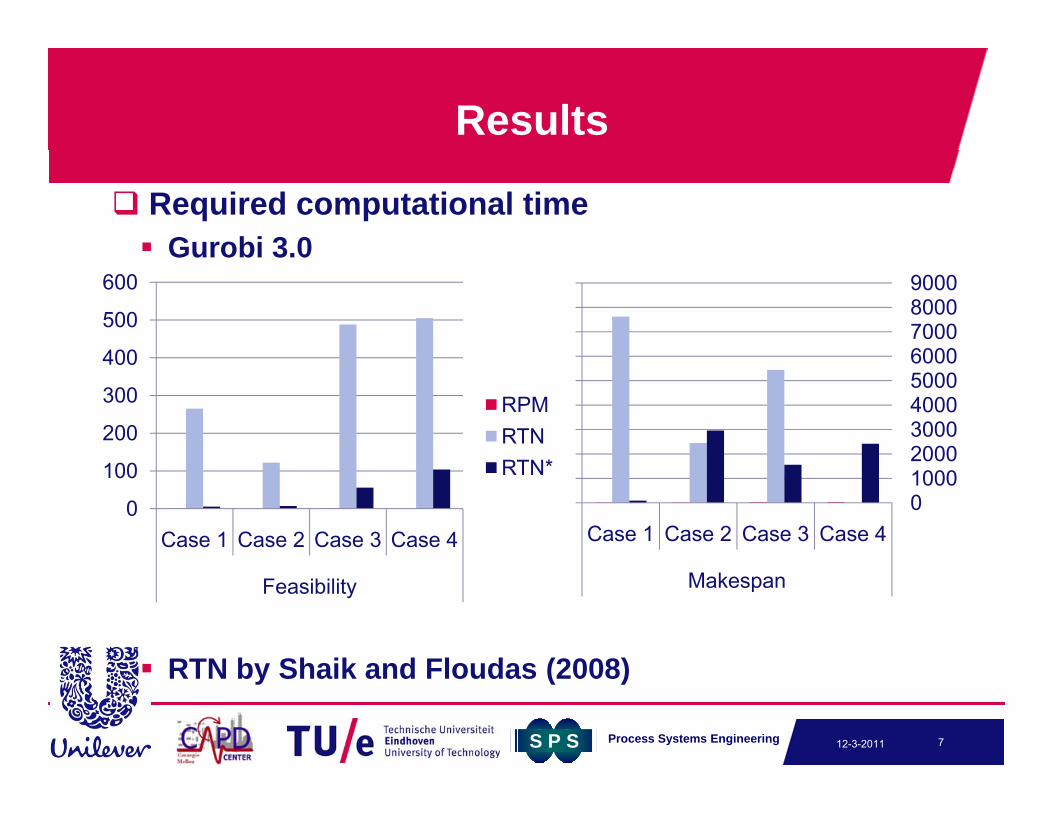
Results
Required computational time Gurobi 3 0Gurobi 3.0
400
500
600
6000700080009000
200
300
400
RPMRTN
20003000400050006000
0
100
Case 1 Case 2 Case 3 Case 4
RTN*010002000
Case 1 Case 2 Case 3 Case 4
RTN b Sh ik d Fl d (2008)
Feasibility Makespan
S P S Process Systems Engineering
RTN by Shaik and Floudas (2008)
712-3-2011
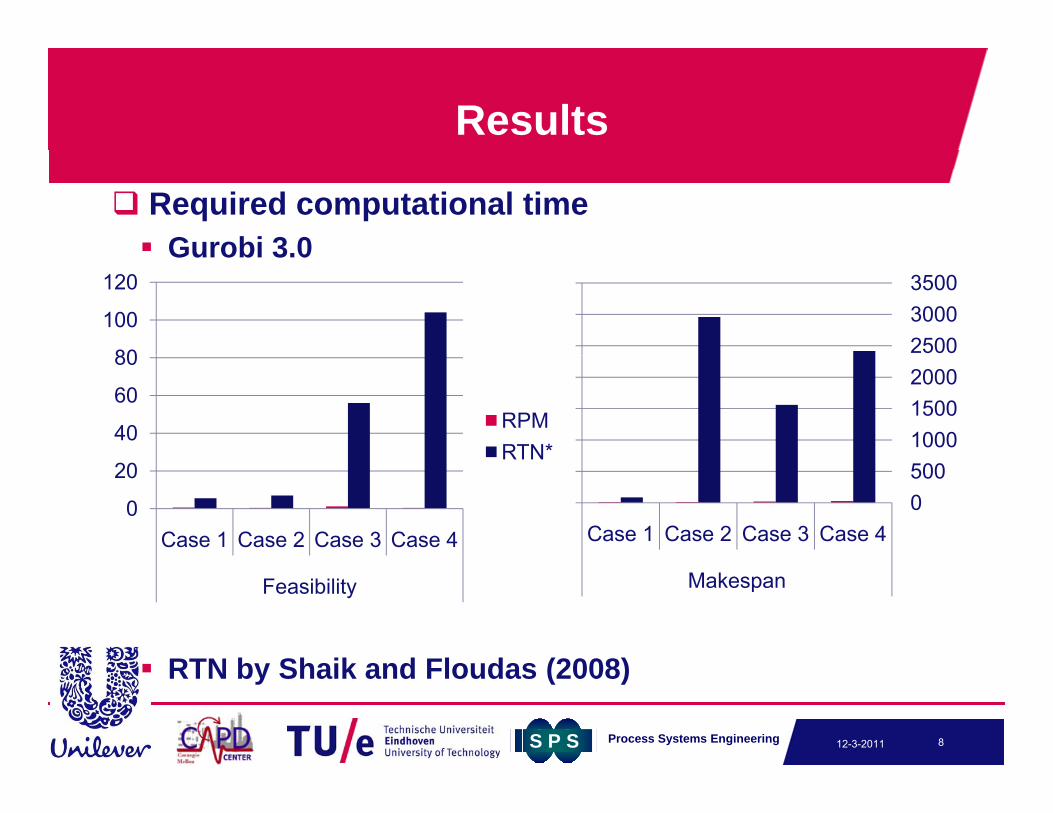
Results
Required computational time Gurobi 3 0Gurobi 3.0
80
100
120
250030003500
40
60
80
RPMRTN* 1000
15002000
0
20
Case 1 Case 2 Case 3 Case 4
RTN
0500
Case 1 Case 2 Case 3 Case 4
RTN b Sh ik d Fl d (2008)
Feasibility Makespan
S P S Process Systems Engineering
RTN by Shaik and Floudas (2008)
812-3-2011
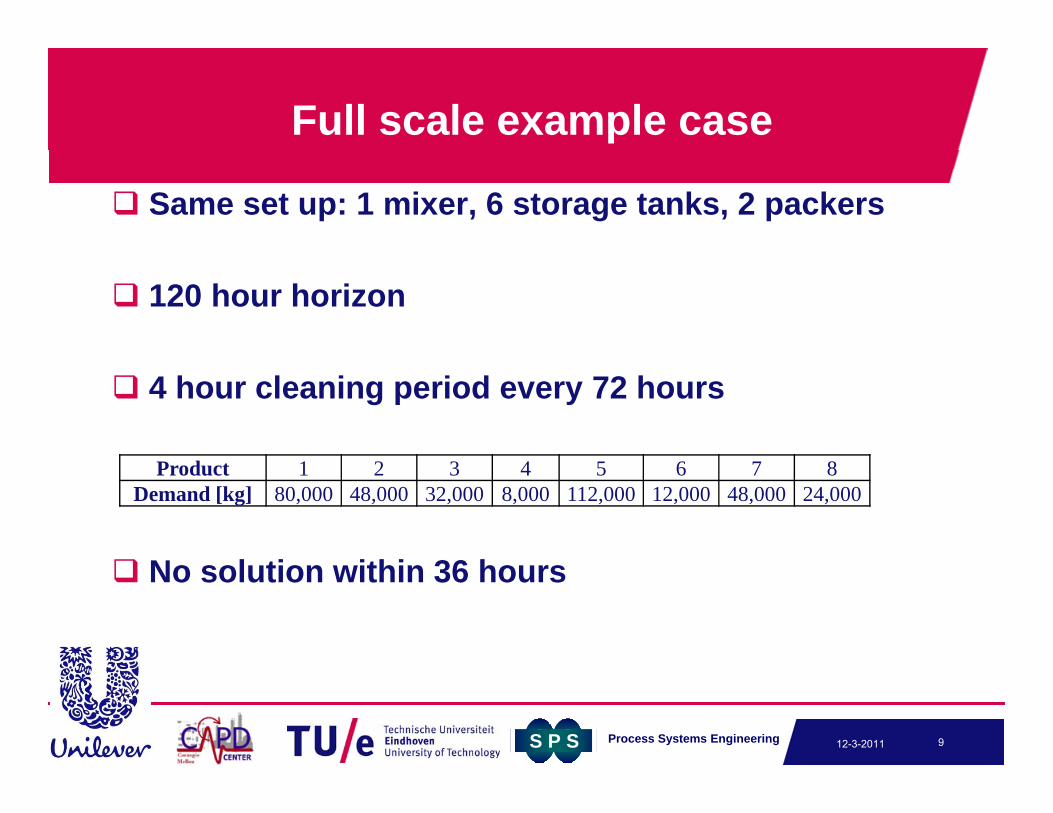
Full scale example case
Same set up: 1 mixer, 6 storage tanks, 2 packers
120 hour horizon
4 hour cleaning period every 72 hours
N l ti ithi 36 h
Product 1 2 3 4 5 6 7 8Demand [kg] 80,000 48,000 32,000 8,000 112,000 12,000 48,000 24,000
No solution within 36 hours
S P S Process Systems Engineering 912-3-2011
Heuristics
Bottleneck Minimum makespan 1st packer: 118 33 hrMinimum makespan 1 packer: 118.33 hr Minimum makespan 2nd packer: 109.44 hr
Products on the 1st packer in optimal order 4-3-2-1
Feasibility optimization: 28 hours
S P S Process Systems Engineering 1012-3-2011
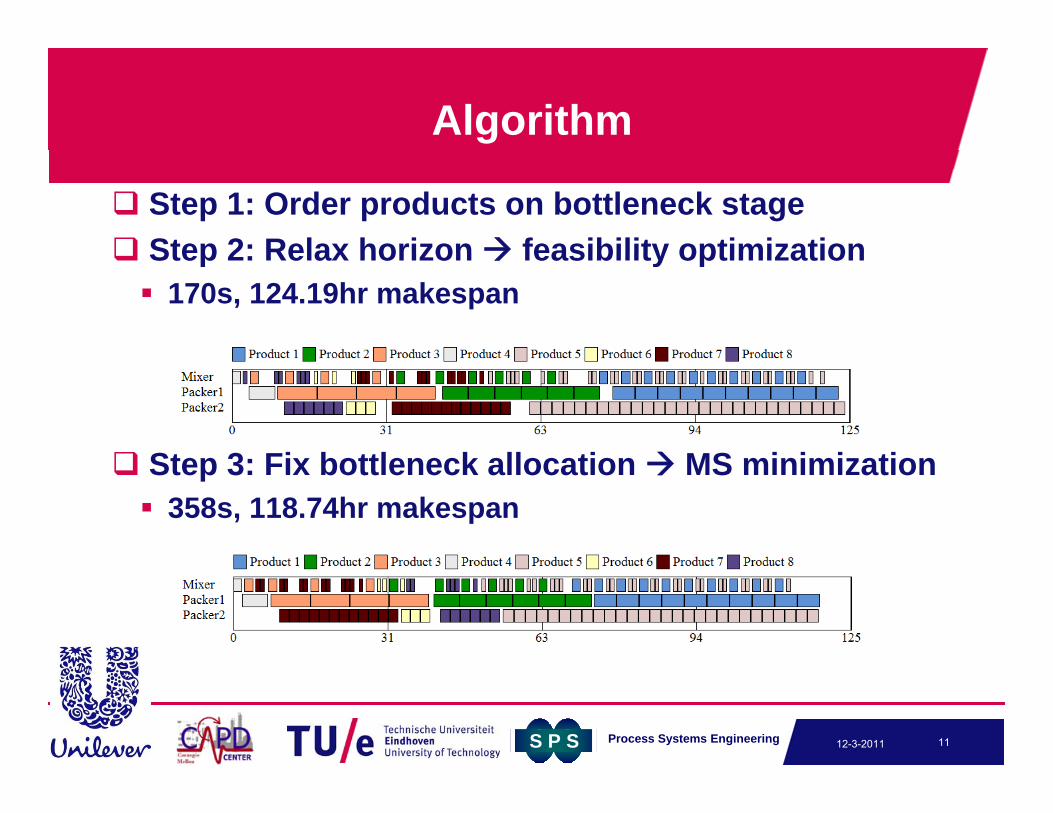
Algorithm
Step 1: Order products on bottleneck stage Step 2: Relax horizon feasibility optimization Step 2: Relax horizon feasibility optimization 170s, 124.19hr makespan
St 3 Fi b ttl k ll ti MS i i i ti Step 3: Fix bottleneck allocation MS minimization 358s, 118.74hr makespan
S P S Process Systems Engineering 1112-3-2011
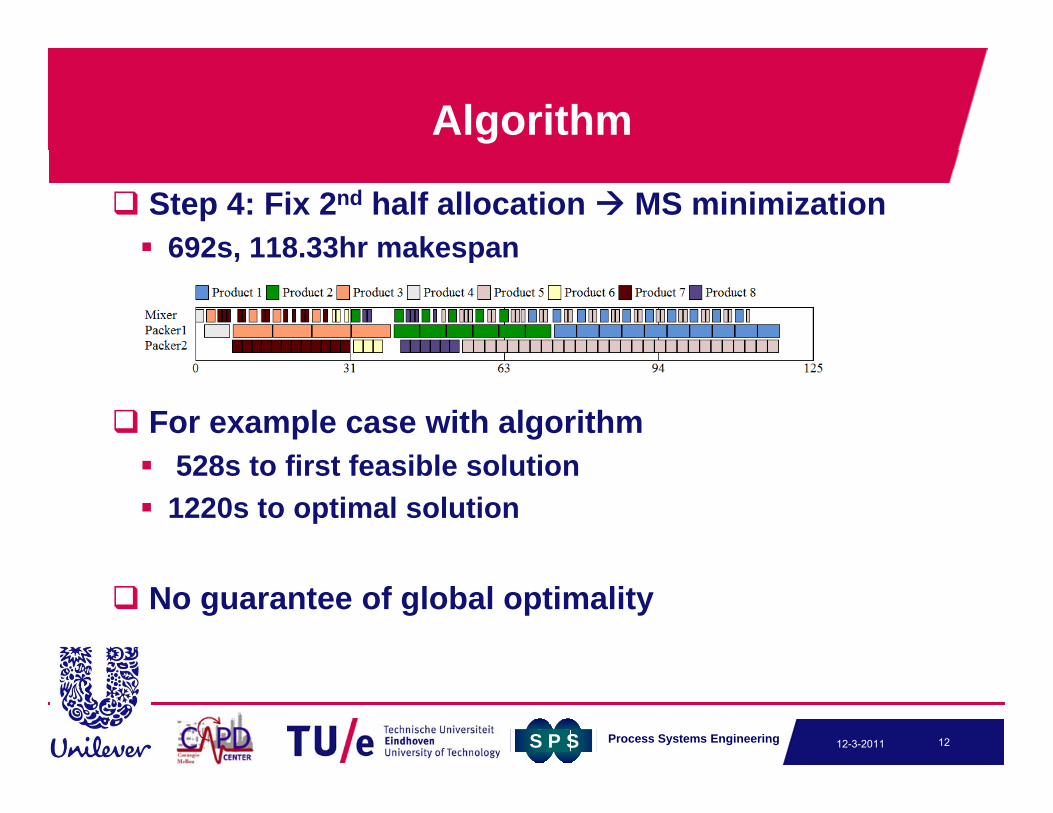
Algorithm
Step 4: Fix 2nd half allocation MS minimization 692s 118 33hr makespan692s, 118.33hr makespan
For example case with algorithm528 t fi t f ibl l ti 528s to first feasible solution
1220s to optimal solution
No guarantee of global optimality
S P S Process Systems Engineering 1212-3-2011
Conclusions
RPM model more efficient than RTN models Dedicated time periods improve efficiencyDedicated time periods improve efficiency Indirectly modeling inventory improves efficiency
Algorithm Required for larger cases
C t t l b l ti lit Cannot guarantee global optimality Gives good results within reasonable time
S P S Process Systems Engineering 1312-3-2011

Future work
Tactical Planning model 1-1 5 year horizon1 1.5 year horizon Fast moving consumer goods− Large number of products− Seasonality Weekly time periods− Large uncertainty in demand and supply
Capacity Estimation Capacity Estimation− How to determine maximum capacity utilization?
S P S Process Systems Engineering 1412-3-2011