Mergers and Business Model Assimilation: Evidence from Low ...
Market power versus efficiency defense in the
European Commission’s merger policy:
Evidence on European airline mergers
by
Adél Németh
a Thesis submitted in partial fulfillment
of the requirements for the degree of
Doctor of Philosophy
in Economics
Approved Dissertation Committee
Prof. Dr. Gert Brunekreeft
Name and title of Chair
Prof. Dr. Hans-Martin Niemeier
Name and title of Committee Member
Prof. Dr. Julia Bendul
Name and title of Committee Member
__________________________________
Date of Defense:
May 2nd, 2016

Humanities and Social Sciences
Statutory Declaration
(on Authorship of a Dissertation)
I, Adél Németh hereby declare that I have written this PhD thesis independently,
unless where clearly stated otherwise. I have used only the sources, the data and the
support that I have clearly mentioned. This PhD thesis has not been submitted for
conferral of degree elsewhere.
I confirm that no rights of third parties will be infringed by the publication of this
thesis.
Bremen, May 31, 2016
Signature ___________________________________________________________


IN MEMORY OF MY FATHER

vii
ACKNOWLEDGMENT
I am particularly grateful to my supervisors, Prof. Gert Brunekreeft and Prof. Hans-Martin Niemeier,
for their support and encouragement during all the years of working around and on the dissertation,
within the framework of numerous research projects and beyond. I would also like to thank my co-
supervisor, Prof. Julia Bendul, for her constructive feedback.
I am indebted to my colleagues and friends at the University of Applied Sciences Bremen and the Jacobs
University Bremen, who never got tired of assisting me in gathering data, finding contacts and
discussing the results, and who always had an open ear for further questions. I am especially grateful to
Dr. Vanessa Liebert for her unlimited endorsement inside and outside the (home) office and for Dr. Eric
Njoya for his endless interest in debating economics with me. I would like to express my gratitude to
Annika Paul, who carefully read and commented on the draft version of the thesis. My PhD fellows,
Karsten Fröhlich, Dr. Tolga Ülkü, Dr. Nele Friedrichsen and Dr. Roland Meyer, were always helpful
in guiding me in academic life and research practice.
The thesis profited from the research projects German Airport Performance (GAP) and German
Aviation Benchmarking (GAB) with the financial support of the Federal Ministry of Education and
Research. Furthermore, I would like to thank the Erich-Becker-Foundation and the Jacobs University
Bremen for providing me with a research grant and enabling an exceptional research stay in Australia,
a summer school in Greece and participation in numerous international conferences and high-level PhD
courses.
I would like to thank the German Aviation Research Society (G.A.R.S.), particularly Wolfgang
Grimme, Prof. Frank Fichert, Prof. Jürgen Müller, Prof. Hansjochen Ehmer and Prof. Peter Forsyth, for
assisting me with data collection and networking, and for helpful reviews of the research papers that
built the base of the PhD thesis. I wish to acknowledge my papers’ co-authors, Prof. Volodymyr
Bilotkach (Newcastle University), Prof. Yusaf Akbar (Central European University) and Dr. Ádám
Remetei-Filep (European Commission), for their support and guidance.
Finally, I will forever be grateful to my parents, who let me go my road; my family, Andreas and my
daughter Ida, who attended me on the way; and my friends, especially Vera Hervai, for being there for
me.

ix
STATEMENT ON CONTRIBUTION TO ALL ARTICLES
Article Contribution
Total own
contribution to
manuscript
Németh, A., 2014. Does efficiency matter? Working Paper.
Available at: http://www.garsonline.de/
Chapter 1 has been
introduced here. 100 %
Németh, A. & Remetei-Filep, Á., 2010. The economic analysis of
EU airline consolidation: does the Commission get the economics
right? Working Paper. Available at: http://www.garsonline.de/
1.1.2 and 1.2.6 contain
slightly improved parts;
3.4.1 and 3.4.2 are based
on; while 6.2.1 may
contain parts of our
paper. (Ca. 11 pages)
50 %
economic literature
review on models
related to merger
analysis
Fröhlich, K., Hellmers, J., Holtz, M, Grimme; W., Németh, A.
& Niemeier, H-M., 2013. An assessment of the synergies and the
success of cross-border airline mergers and acquisitions in Europe,
In: Forsyth, P., Gillen, D., Hüschelrath, K., Niemeier, H-M.
&Wolf, H. (editors). 2013. Liberalisation in Aviation. Surrey:
Ashgate, pp. 197-220.
2.2.1; 2.2.3 and 7.3.1 are
based on our book
chapter.
(Ca. 7 pages)
20% to each
literature review on
network effects,
mergers and alliances;
such as data analysis
on airline mergers and
synergy effects
Fröhlich, K., Müller, J., Németh, A., Niemeier, H-M., Njoya, E.
T., and Pashkin, R., 2011. Vertical Structure of Air Transport:
Problems for Competition and Regulation. Working paper.
Melbourne, GARS. Available at: http://www.garsonline.de/
2.2.3 is based on our
working paper. (Ca. 0.5
pages)
Németh, A., 2011a. (Market) Power of European Airlines.
Working paper. Sydney: ATRS Air Transport Research Society.
Available at: http://www.atrsworld.org
Table 22 on p. 67 comes
from here. 100%
Bilotkach, V., Müller, J. & Németh, A., 2014. Estimating the
consumer welfare effects of de-hubbing: The case of Malév
Hungarian Airline. Transportation Research Part E: Logistics and
Transportation Review 66, pp. 51-65.
3.4.4 is based on; while
5.4 is mainly identical to
our research paper.
(Ca. 9 pages)
35 %
gathering and
preparing data,
historical review on
Malév
Németh, A. & Niemeier, H.-M., 2012. Airline mergers in Europe -
An overview on the market definition of the EU commission.
Journal of Air Transport Management 22, pp. 45-52.
Chapter 4 is based on;
while 6.2.1 may contain
parts of our research
paper.
(Ca. 23 pages)
50 %
literature review;
investigation on case
decisions; describing
merger regulation
Akbar, Y., Németh, A. & Niemeier, H.-M., 2014. Here we go
again. Permanently failing Organisations. Journal of Air Transport
Management 35, pp. 1-11.
The paper above is based on my own working paper:
Németh, A., 2011b. Strategies for Eastern European Airlines: The
case of Malév Hungarian Airline. Available at:
http://www.crninet.com/2011/c12c.pdf, Brussels: CRNI
Competition and Regulation in Network Industries.
5.3 is mainly identical to
our research paper.
(Ca. 7 pages)
35%
literature review;
describing the history
and the performance
of Malév, CSA and
LOT
Németh, A., 2015. A dynamic competitive assessment of the recent
Lufthansa mergers, Working Paper. Available at:
http://www.garsonline.de/
Chapter 6 has been
introduced here. 100 %

xi
ABSTRACT
According to microeconomics, mergers result in a more concentrated industry. This fact is hardly
questionable, but the discussion about whether concentration is good or bad for society leads us to a
lively debate, called the efficiency defense: do mergers increase market power or efficiency? How does
merger policy take market power and efficiency into consideration?
My work investigates the circumstances and consequences of merger appraisal in passenger airline
markets in Europe between 1995 and 2015. The analysis tries to identify the role of consolidation driven
by market power, efficiency and bankruptcy. The thesis introduces economic principles, models and
policy choices behind the efficiency defense, and explains why the European Commission did not
consider efficiency as a core criterion for their decision to allow or prevent takeovers.
In summary, efficiencies could be considered in the merger process under the total welfare approach,
which also contains efficiency gains from producer surplus increase. The author believes that efficiency
is the ordinary aim of companies, but the reason behind mergers is to increase market presence, market
share or with other words: market power. Competition policy should therefore improve a transparent
and smart framework to regulate market power.

xiii
CONTENTS
STATEMENT ON CONTRIBUTION TO ALL ARTICLES IX
ABSTRACT XI
INTRODUCTION 1
1 EFFICIENCY DEFENSE AND BEYOND 5
1.1 INTRODUCTION 5
1.1.1 THE WILLIAMSON TRADE-OFF 6
1.1.2 THE MORE ECONOMIC APPROACH 7
1.1.3 THE EFFICIENCY DEFENSE AND ITS PARADOX 8
1.2 ECONOMIC SCHOOLS OF ANTITRUST 10
1.2.1 NEOCLASSICAL THEORY, THE CRADLE OF ANTITRUST 10
1.2.2 THE HARVARD SCHOOL, LIMITING MONOPOLY AND MARKET POWER 11
1.2.3 THE CHICAGO SCHOOL AND THE HARDCORE ECONOMISTS, ENHANCING EFFICIENCY 12
1.2.4 THE HARVARD VS. CHICAGO BATTLE 13
1.2.5 NEW INDUSTRIAL ORGANIZATION: A MARRIAGE BETWEEN THE HARVARD AND CHICAGO SCHOOLS 15
1.2.6 THE EUROPEAN SCHOOL: A MORE ECONOMIC APPROACH 16
1.3 SYNTHESES ON COMPETITION POLICY 19
1.3.1 IS CONCENTRATION THE EVIDENCE OF MARKET POWER OR OF EFFICIENCY? 19
1.3.2 WHAT DOES EFFICIENCY MEAN? 21
1.3.3 DO ENTRY BARRIERS EXIST OR ARE THE MARKETS CONTESTABLE? 24
1.3.4 DO WE NEED GOVERNMENT INTERVENTION? 25
1.4 WELFARE STANDARDS AND APPLICATIONS 31
1.4.1 TOTAL WELFARE STANDARD, FIRST ATTEMPTS IN CANADA AND IN AUSTRALIA 31
1.4.2 CONSUMER SURPLUS STANDARD: EVIDENCE FROM THE UK 33
1.4.3 ALTERNATIVE WELFARE STANDARDS AND GERMANY 35
1.5 MORE, BUT WHICH ECONOMIC APPROACH? WILLIAMSON’S EFFECT ON EC MERGER POLICY 38
1.6 CONCLUSIONS 41
2 EFFICIENCY TRADE-OFF IN PRACTICE: THE EUROPEAN COMMISSION 42
2.1 INTRODUCTION 42
2.1.1 THE SCP MODEL – EXTENDED BY EFFICIENCIES 43
2.1.2 THE TYPOLOGY OF EFFICIENCIES IN THE EC’S MERGER REGULATION 44
2.2 EFFICIENCY GAINS IN AVIATION 46
2.2.1 COMPETITIVE ADVANTAGES: MERGERS VERSUS ALLIANCES 47
2.2.2 COST, REVENUE AND RISK SYNERGIES – FOCUS ON ECONOMIC THEORIES 51
2.2.3 NETWORK EFFECTS: DO THEY INCREASE EFFICIENCY OR MARKET POWER? 53
2.3 WHY DID THE EC NOT CONSIDER EFFICIENCY GAINS? 56
2.4 CONCLUSIONS 58
xiv
3 ECONOMIC MODELS OF PRICE EFFECTS VERSUS EFFICIENCY 59
3.1 INTRODUCTION 59
3.2 REGRESSION ANALYSIS 61
3.2.1 CROSS-SECTION AND FIXED-EFFECTS ANALYSES 61
3.2.2 UPWARD PRICING PRESSURE TEST 62
3.3 MERGER SIMULATIONS 64
3.3.1 MINIMUM REQUIRED EFFICIENCY 65
3.3.2 THE PASS-THROUGH RATE 66
3.4 PRICE AND WELFARE EFFECTS IN THE AIRLINE PRACTICE 67
3.4.1 PRICE EFFECTS OF MERGERS 67
3.4.2 PASSENGERS’ UTILITY AND TOTAL WELFARE 70
3.4.3 AN EXAMPLE: OUR PRICE-FREQUENCY TRADE-OFF MODEL 72
3.5 CONCLUSIONS 74
4 THE EUROPEAN COMMISSION’S MERGER FRAMEWORK IN AVIATION 75
4.1 INTRODUCTION 75
4.2 THE THEORETICAL FRAMEWORK FOR AIRLINE MERGERS 77
4.2.1 THE RELEVANT MARKET 77
4.2.2 (ANTI)COMPETITIVE ASSESSMENT: CONCENTRATION AND DOMINANCE 80
4.3 REMEDIES: SLOTS RELEASES TO PROMOTE COMPETITION 82
4.4 THE PRACTICE: DEVELOPMENT OF THE EC-RELEVANT MARKET DEFINITION 84
4.4.1 O&D APPROACH IN THE EARLIER AIRLINE MERGER DECISIONS: 1995-1997 87
4.4.2 DEFINING ‘BUSINESS’ AND ‘LEISURE’ PASSENGERS: 1997 KLM/AIR UK 87
4.4.3 DEFINING ‘DIRECT’ AND ‘INDIRECT’ FLIGHTS: 2002 SAS/SPANAIR 88
4.4.4 DEFINING TIME-SENSITIVE AND TIME-INSENSITIVE PASSENGERS: 2004 AIR FRANCE/KLM 89
4.5 COMPETITIVE ASSESSMENT 90
4.5.1 GROWING HIGH-SPEED RAILWAY COMPETITION 90
4.5.2 AIRPORT SUBSTITUTION: DO SCHIPHOL AND HEATHROW HAVE MARKET POWER? 91
4.6 ASSESSING THE REMEDIES 93
4.6.1 AIR FRANCE 93
4.6.2 BRITISH AIRWAYS 94
4.7 CONCLUSIONS 95
5 AIRLINE PERFORMANCE: INEFFICIENCY, BANKRUPTCY AND WELFARE 96
5.1 INTRODUCTION 96
5.2 BENCHMARKING: AIRLINE EFFICIENCY IN PRACTICE 98
5.3 CASE STUDY: INEFFICIENT AIRLINES 101
5.3.1 EXPLAINING POOR PERFORMANCE 101
5.3.2 PERMANENTLY FAILING ORGANIZATIONS 103
5.3.3 THE ROLE OF COMPETITION AND NETWORK EFFECTS 104
xv
5.3.4 BENCHMARKING CEE CARRIERS’ PERFORMANCE 105
5.4 CASE STUDY: ESTIMATING THE WELFARE EFFECTS OF DE-HUBBING 108
5.4.1 THE BANKRUPTCY OF MALÉV AND ITS IMPACTS 108
5.4.2 ROUTE CLASSIFICATIONS – PRE- AND POST-BANKRUPTCY 109
5.4.3 REGRESSION ANALYSIS AND CONSUMER WELFARE ESTIMATION 111
5.5 CONCLUSIONS 115
6 CONCENTRATION AND PRICE EFFECTS OF LUFTHANSA MERGERS: A DYNAMIC
COMPETITIVE ASSESSMENT 116
6.1 INTRODUCTION 116
6.2 LUFTHANSA’S COMPETITIVE ENVIRONMENT: FROM RIVALS AND PARTNERS TO MEMBERS OF THE
LUFTHANSA GROUP 119
6.2.1 LUFTHANSA TAKEOVERS WITH REMEDIES 120
6.2.2 MARKET STRUCTURE ON THE RELEVANT ROUTES 123
6.3 THE EFFECT OF REMEDIES ON MARKET STRUCTURE 128
6.3.1 DID THE SLOT REMEDIES WORK? ENTRY AND MARKET SHARE INVESTIGATION 129
6.3.2 DID THE FREQUENCY AND PRICE FREEZE REMEDIES WORK? 134
6.3.3 SUMMARY OF THE RESULTS ON REMEDIES 138
6.4 ENTRY AND EXIT: HIT-AND-RUN OR PREDATION? 140
6.4.1 INTRODUCING AIR BERLIN AS A COMPETITOR TO LUFTHANSA 142
6.4.2 PREDATION ON THE HUB-TO-HUB ROUTE ZRH-FRA? CAPACITY AND PRICE INCREASE 144
6.4.3 PREDATION ON THE HUB-TO-SPOKE ROUTE VIE-CGN? 146
6.4.4 PRICE COMPETITION WITH CONSEQUENCES ON THE HUB-TO-HUB ROUTE VIE-FRA 148
6.4.5 CONTESTABILITY ON THE HUB-TO-SPOKE ROUTE VIE-STR? 150
6.4.6 SUMMARY OF THE RESULTS ON ENTRY AND EXIT 151
6.5 MONOPOLY PRICING AND CAPACITY CUT: (AB)USING MARKET POWER 152
6.5.1 MONOPOLY AFTER AIR BERLIN’S EXIT FROM ZRH-HAM AND ZRH-HAJ 153
6.5.2 FREQUENCY AND CAPACITY CUTS ON THE BRU MONOPOLY ROUTES 154
6.5.3 FLAG CARRIERS: COOPERATION (ZRH-CPH, ZRH-WAW) OR EXIT (ZRH-OTP) 155
6.5.4 LUFTHANSA’S YIELD DEVELOPMENT: MORE EXPENSIVE DOMINANT ROUTES 157
6.5.5 SUMMARY OF THE RESULTS ON MARKET POWER ANALYSIS 162
6.6 CONCLUSIONS 163
7 EFFICIENCY GAINS FROM LUFTHANSA MERGERS 165
7.1 INTRODUCTION 165
7.2 PARTIAL PRODUCTIVITY ANALYSIS 166
7.2.1 LABOR PRODUCTIVITY AND STAFF COSTS 167
7.2.2 AIRCRAFT PRODUCTIVITY, FUEL COSTS AND AIRPORT CHARGES 168
7.3 MERGER-SPECIFIC EFFICIENCY GAINS AT SWISS 171
7.3.1 AN OVERVIEW OF POTENTIALLY MERGER-SPECIFIC EFFICIENCY GAINS 171
7.3.2 COST EFFICIENCIES – REDUCED SALES COMMISSIONS, INSURANCE, FEES AND CHARGES, AND MRO 173
7.3.3 COST EFFICIENCIES – LOWER WAGES IN THREE LUFTHANSA DEPARTMENTS 176
xvi
7.4 CONCLUSIONS 178
SUMMARY 179
FUTURE RESEARCH, IMPLICATIONS AND LIMITATIONS 185
8 ANNEX 187
8.1 MERGER REGULATIONS IN THE US, AUSTRALIA, CANADA, UK, AND GERMANY 187
8.2 QUANTITATIVE ECONOMETRIC MODELS FOR COMPETITION POLICY USE (EU) 188
8.3 CONSUMER WELFARE: THE PRICE – FREQUENCY TRADE-OFF 189
TERMS AND DEFINITIONS 190
LEGISLATIONS AND NOTIFICATIONS 192
EUROPEAN COMMISSION’S DECISIONS 193
REFERENCES 194

xvii
TABLE CONTENTS
WILLIAMSON’S “WELFARE TRADE-OFF” MODEL .......................................................................................................................... 7 DIFFERENT VIEWS ON FIRM AGREEMENTS: HARVARD AND CHICAGO .................................................................................. 13 EC COMPETITION POLICY REGULATIONS RELATED TO MERGERS ........................................................................................... 18 COMPARING HARVARD, CHICAGO AND MODERN IO ................................................................................................................ 19 THE CHICAGO EFFICIENCY DOCTRINE AND THE HARVARD CONCENTRATION DOCTRINE................................................... 20 THE GROWING CIRCLE OF WEALTH, WELFARE AND EFFICIENCIES ......................................................................................... 24 DIFFERENT VIEWS ON ENTRY BARRIERS .................................................................................................................................... 25 THE GOALS OF COMPETITION POLICY .......................................................................................................................................... 26 DO WE NEED REGULATION? MARKET AND GOVERNMENT FAILURES .................................................................................... 29
WELFARE STANDARDS AND TESTS APPLIED IN DIFFERENT COUNTRIES ............................................................................... 31 COMPARING TOTAL WELFARE AND CONSUMER SURPLUS STANDARDS .................................................................................. 35 EFFICIENCY PYRAMID: THE ROLE OF EFFICIENCIES IN DIFFERENT WELFARE STANDARDS ................................................ 36 THE EXTENDED SCP FRAMEWORK OF THE EUROPEAN COMMISSION ................................................................................... 43 EFFICIENCY CONSIDERATIONS IN THE NEW ECMG 2004 ...................................................................................................... 44 BALANCING ‘CONSUMER’ WELFARE ............................................................................................................................................ 46 COMPETITIVE ADVANTAGES: AIRLINE MERGERS VERSUS ALLIANCES .................................................................................... 48 COST, REVENUE AND RISK SYNERGIES – AIRLINE CLAIMS AND EC ACCEPTANCE ................................................................. 52 HOW SHOULD MERGER-SPECIFIC EFFICIENCIES BE MEASURED? ............................................................................................ 59 ILLUSTRATING THE UPP TEST ..................................................................................................................................................... 63 CALCULATING MRE: POST-MERGER PRICE INCREASE OR MINIMUM REQUIRED EFFICIENCY (IN PERCENT) .................. 65 PRICE CHANGES AFTER US AIRLINE MERGERS AND ALLIANCES: EVIDENCE OF MARKET POWER? .................................... 69 FITTED MARGINAL EFFECT: LOWER-PRICE-LOWER FREQUENCY TRADE-OFF ...................................................................... 73 COMPETITION ANALYSIS: FRAMEWORK FOR AIRLINE MERGERS ............................................................................................ 76 IMPLEMENTATION OF THE SSNIP TEST ..................................................................................................................................... 78 AIRLINE MERGER REMEDIES FROM 1995 TO 2009 ................................................................................................................ 83 THE DEVELOPMENT OF THE RELEVANT MARKET DEFINITION AND THE ECONOMICS USED ............................................... 85 RELEVANT MARKET DEFINITION, 1997-2002 ........................................................................................................................ 86 EARLIER AIRLINE MERGER DECISIONS ........................................................................................................................................ 88 AIRLINE MERGER CASES AFTER THE ECMR 2004 .................................................................................................................. 89 THE INCREASING ROLE OF RAILWAY COMPETITION ................................................................................................................. 91 REMEDIES IN THE 2004 AIR FRANCE/KLM MERGER ............................................................................................................ 93 PARTIAL PRODUCTIVITY MEASURES USED BY THE AIRLINES .................................................................................................. 98 AIRLINE PRODUCTIVITY PERFORMANCE METRICS (RELATED TO PASSENGER TRAFFIC) .................................................... 99 BENCHMARKING AIRLINES: A LITERATURE REVIEW ...............................................................................................................100 DRIVING FORCES OF WORSENING PERFORMANCE...................................................................................................................104 DEA AIRLINE EFFICIENCY SCORES IN EUROPE ........................................................................................................................106 NUMBER OF PASSENGERS (IN MILLION) FROM 2000 TO 2010: MALÉV. LOT AND CSA ...............................................106 PROFITS AND LOSSES PER PASSENGER (IN €) FROM 2000 TO 2010: MALÉV, LOT AND CSA .....................................107 LOAD FACTOR OF EUROPEAN AIRLINES (IN PERCENT) ..........................................................................................................107 ESTIMATED PRICE DECLINES REQUIRED TO COMPENSATE FOR LOWER FREQUENCY ........................................................113 THE STORYBOARD OF THE AIRLINE MERGERS .........................................................................................................................116 RELEVANT MARKETS: CITY PAIRS IN THE RECENT LUFTHANSA TAKEOVERS .....................................................................117 DATASET: AIRLINE SCHEDULE AND PRICE DATA .....................................................................................................................118 FACTS ABOUT THE LUFTHANSA TAKEOVERS ...........................................................................................................................119 LUFTHANSA’S MERGER REMEDIES FROM 2006 TO 2013 ....................................................................................................122 GROUPINGS OF THE LUFTHANSA CASES BY TYPE OF COMPETITION .....................................................................................123 ORIGIN AND DESTINATION ROUTES IN THE DATA SAMPLE ...................................................................................................124 REVENUE PASSENGERS ON THE RELEVANT ROUTES BY GROUPINGS, 2004, ANNUAL .......................................................125 TAKEOVERS, PARTNERSHIPS AND INSOLVENCIES IN THE RELEVANT MARKETS FROM 2000 TO 2014 ........................126 THE STRUCTURE OF THE DYNAMIC COMPETITIVE ANALYSIS ON MERGER REMEDIES........................................................128
xviii
THE RESULT OF THE SLOT REMEDIES ON THE LH MONOPOLY ROUTES – NEW ENTRIES ..................................................129 MARKET SHARE DEVELOPMENT ON THE ZRH-FRA AND THE ZRH-MUC ROUTES .........................................................130 THE RESULT OF THE SLOT REMEDIES ON THE LH LCC MONOPOLY ROUTES – NEW ENTRIES .........................................130 THE RESULT OF THE SLOT REMEDIES ON THE AB COMPETITION ROUTES – NEW ENTRIES .............................................131 AB’S MARKET SHARE DEVELOPMENT ON THE ZRH ROUTES WITH LH COMPETITION .....................................................132 THE RESULT OF THE SLOT REMEDIES ON THE FLAG COMPETITION ROUTES – NEW ENTRIES ..........................................133 DEVIATING FROM THE PRICE FREEZE REMEDY? AVERAGE SEGMENT PRICES FROM 2004 TO 2005 ............................135 ZRH-MUC: FREQUENCY DISTRIBUTION AT THE LUFTHANSA GROUP, 2004 TO 2006 ..................................................136 REVENUE INCREASE AT ZRH-MUC (IN $M) ...........................................................................................................................137 POST-MERGER RESULTS ON THE LHG’S MARKET SHARE, CAPACITY, FREQUENCY AND AIRFARES .................................139 THE STRUCTURE OF THE ENTRY-EXIT ANALYSIS .....................................................................................................................140 THE (END OF) LOW-COST, REGIONAL, FLAG AND AIR BERLIN COMPETITION WITH LUFTHANSA ..................................142 AIR BERLIN’S AVERAGE YIELD PER MILE (IN $), 2004 TO 2012 ........................................................................................143 AIR BERLIN’S EFFECT ON THE LUFTHANSA GROUP’S PRICES ...............................................................................................144 NUMBER OF PASSENGERS ON THE ZRH-FRA HUB-TO-HUB CONNECTION, 2004 TO 2010 ..........................................144 SEAT CAPACITY CHANGES ON ZRH-FRA DURING COMPETITION WITH AB .......................................................................145 ZRH-FRA: AVERAGE SEGMENT TICKET PRICES DURING THE COMPETITION WITH AB (IN $) .......................................145 VIE-CGN: LH’S AND LX’S PRICES DURING AND AFTER AB COMPETITION (IN PERCENT) ..............................................146 FORCING OUT AB FROM VIE-CGN? POST-MERGER SEAT CAPACITY DEVELOPMENT ......................................................148 AIRLINE EXIT AFTER LH INCREASED DAILY FREQUENCIES ON THE VIE-FRA ROUTE......................................................149 YIELDS PER MILE ON VIE-FRA (IN $): FIERCE PRICE COMPETITION ..................................................................................149 SEAT CAPACITY INCREASES ON VIE-STR, 2005 TO 2010 ..................................................................................................150 COMPARING THE LHG AND AB ON THE RELEVANT ROUTES, 2004 TO 2014 ..................................................................151 STRUCTURE OF THE MARKET POWER ANALYSIS .....................................................................................................................152 THE DIFFERENCE BETWEEN AB’S AND THE LHG’S AVERAGE FARES, 2004 TO 2014, IN PERCENT .............................153 PASSENGER DEVELOPMENT PRE- AND POST-MERGER ON THE BRUSSELS ROUTES ...........................................................154 YIELDS PER MILE ON ZRH-CPH (IN $): PRICE CORRELATION AFTER RIVALS LEFT .........................................................155 YIELDS PER MILE ON ZRH-WAW (IN $): COMPETITION OR COOPERATION? ...................................................................156 YIELD DEVELOPMENT ON ZRH-OTP (IN $) ...........................................................................................................................157 LUFTHANSA’S DECREASING AVERAGE YIELD PER MILE (IN $) ..............................................................................................158 REGULATED VERSUS NON-REGULATED ROUTES – LH’S AVERAGE YIELD PER MILE (IN $) ..............................................159 SWISS’S AVERAGE YIELD PER MILE (IN $) ..............................................................................................................................159 REGULATED VERSUS NON-REGULATED ROUTES – LX’S AVERAGE YIELD PER MILE (IN $) ...............................................160 BRUSSELS AIRLINE’S AVERAGE YIELD PER MILE (IN $) .........................................................................................................160 AUSTRIAN AIRLINE’S AVERAGE YIELD PER MILE (IN $) .........................................................................................................161 THE SUMMARY OF THE FREQUENCY, CAPACITY AND PRICE ANALYSIS .................................................................................164 COST DEVELOPMENT AT THE LUFTHANSA GROUP (IN €M), 2004-2013 ........................................................................166 THE LUFTHANSA GROUP’S EMPLOYEES AND AVERAGE UNIT STAFF COSTS (IN €), 2004 TO 2013 .............................167 ASK AND RPK PER EMPLOYEE (IN MILLIONS), 2004 TO 2013 .........................................................................................167 TOTAL COSTS PER RPK AND PER ASK AT THE LUFTHANSA GROUP (IN €), 2004 TO 2013 ........................................168 NUMBER OF PASSENGER AIRCRAFT, 2004 TO 2013 .............................................................................................................169 AVERAGE KILOMETERS FLOWN PER BLOCK HOUR, 2004 TO 2013 ....................................................................................169 CRUDE OIL AND JET FUEL KEROSENE PRICE DEVELOPMENT (IN $), 2004 TO 2013 .......................................................170 UNIT COSTS PER MILE AT THE LUFTHANSA GROUP (IN € AND $), 2004 TO 2013 .........................................................170 LUFTHANSA’S SYNERGY CLAIM CONCERNING THE BRUSSELS AIRLINES TAKEOVER IN 2009 .........................................172 SYNERGIES GENERATED BY THE LH/SWISS MERGER (IN €M) ..........................................................................................173 COSTS PER RPK AT THE LUFTHANSA GROUP (IN €), 2004 TO 2013 ...............................................................................173 EFFICIENCY GAINS FROM UNIT COST SAVINGS AT LH PASSENGER TRANSPORTATION IN 2007 ....................................175 UNIT STAFF COSTS DEVELOPMENT AT THE LUFTHANSA GROUP (IN €), 2005 TO 2007 ...............................................176
xix
ABBREVIATIONS
AC Average Costs
ACCC Australian Competition & Consumer Commission
ACT Australian Competition Tribunal
ASK Available Seat Kilometer
ATRS Air Transport Research Society
CAT Competition Appeal Tribunal (UK)
CC Competition Commission (UK)
CEE Central Eastern Europe
CLA Critical Loss Analysis
CRESSE European Summer School and Conference in Competition and Regulation
CS Consumer Surplus
DEA Data Envelopment Analysis
DLR German Aerospace Center (Deutsches Zentrum für Luft- und Raumfahrt)
DoJ Department of Justice (US)
DoT Department of Transport (US)
EBIT Earnings before interest and taxes
EBITDA Earnings before taxes, interest, depreciation and amortization
EC European Commission
ECMG European Council Merger Guideline
ECMR European Council Merger Regulation
EU European Union
FC Fixed Costs
FFP Frequent Flyer Program
FTC Federal Trade Commission (US)
HHI Herfindahl-Hirschman Index
IATA International Air Transport Association
ICN International Competition Network
ICAO International Civil Aviation Organization
IO Industrial Organization
LCC Low-Cost Carrier
LF, PLF Passenger Load Factor
M&A Mergers and Acquisitions
MC Marginal Costs
MRE Minimum Required Efficiency
O&D Origin and Destination
OFT Office of Fair Trade (UK)
OLS Ordinary Least Squares
PFO Permanently Failing Organizations
R&D Research and Development
RPK Revenue Passenger Kilometer
SCP Structure- Conduct- Performance
SIEC Significant Impediment to Effective Competition (test)
SLC Substantive Lessening of Competition (test)
SSNIP Small but Significant Non-transitory Increase in Price (test)
TFEU Treaty on the Functioning of the European Union
TFP Total Factor Productivity
TW Total Welfare
UPP Upward Pricing Pressure
VC Variable Costs
xx
LIST OF AIRPORTS AND AIRLINES WITH IATA CODES
Airports
AOC Leipzig
ARN Stockholm
BUD Budapest
BRU Brussels
BSL Basel
CDG Paris Charles de Gaulle
CGN Cologne/ Bonn
CPH Kopenhagen
DRS Dresden
DUS Düsseldorf
FRA Frankfurt
GVA Geneva
HAJ Hanover
HAM Hamburg
LCY London City
LGW London Gatwick
LHR London Heathrow
MUC Munich
NUE Nuremberg
ORY Paris Orly
OTP Bucharest
STN London Stansted
STR Stuttgart
SXF Berlin Schönefeld
TXL Berlin Tegel
VIE Vienna
WAW Warsaw
ZRH Zurich
Airlines
0D Darwin Airline
2L Helvetic Airways
4U Germanwings
5P Sky Europe Airlines
A3 Aegean Airlines
AA American Airlines
AB Air Berlin
AF Air France
AY Finnair
AZ Alitalia
BA British Airways
BD BMI
BE Flybe
C3 Contact Air Germany
C9 Cirrus Airlines
CL Lufthansa CityLine
CO Continental Airlines
DE Condor Flugdienst
DL Delta Airlines
DM Maersk
EI Aer Lingus
EW Eurowings
FR Ryanair
HF Hapagfly
HG Niki
IB Iberia Airlines
JK Spanair
KF Blue1
KL KLM
LG Luxair
LH Lufthansa
LO LOT Polish Airlines
LT LTU International
LX Swiss International Air Lines
MA Malév Hungarian Airlines
MT Thomas Cook Airlines
NB Sterling Airlines
NC North Central Airlines
NE SkyEurope
NG Lauda Air
NW Northwest Airlines
OK Czech Airlines
OL OLT Express Germany
OS Austrian Airlines
OZ Ozark Airlines
PS Ukraine International Airlines
PT Piedmont Airlines
QA Cimber
QI Cimber Sterling
RC Republic Airlines
RO Tarom
SK Scandinavian Airlines
SN Brussels International Airlines
SO Southern Airways
SQ Singapore Airlines
SU Aeroflot Russian Airlines
TE FlyLal
TV Virgin Express
TW Trans World Airlines
UA United Airlines
U2 easyJet
VO Tyrolean Airways
VY Vueling
W6 Wizz Air
WA KLM Cityhopper
WN Southwest Airlines
WU Wizz Air Ukraine
WW Bmibaby
XG Clickair
Efficiency Defense and Beyond
1
INTRODUCTION
“We do not know whether the work of economists should be oriented toward the formulation of public
policy or toward the analysis of market situations. The trend, however, is definitely towards the latter.
The further economics goes in this direction, the greater becomes the difference between legal and
economic conceptions” (Mason, 1937, p. 1).
Mason had already highlighted the parallel world of economics, namely the description and analysis
and/or evaluation and prescription, in 1937. This gap in economics, especially in competition policy,
became bigger every day after Professor Mason retired from Harvard University in 1969. My work
attempts to bridge the gap by evaluating the (aviation) market situation and describing the public
(competition) policy behind it. The PhD thesis contributes to the literature with an academic analysis
of the circumstances and consequences of airline mergers on the passenger airline market.
Competition policy, a branch of microeconomics, was developed to ensure that competition works in
favor of our welfare. The traditional approach has long been that concentration increases market power,
the ability to set higher prices, and is thus bad for society. Therefore the policy, as the name ‘antitrust’
implies, has usually decided against takeovers. The revolution of merger policy started in the 1970s at
the University of Chicago in the US. The new direction used efficiency reasons to explain concentration
and asserted that big, concentrated companies are profitable because they are more efficient. Efficiency
brings innovations, enables research and development, and continuously improves product quality, so
it is good for everyone. The industry appreciated the new approach, which soon settled in the (first US)
politics and completely changed previous antitrust thinking. By the 1980s, the efficiency defense (thus
efficiency arguments of companies) had overcome the fear of concentration and high prices, and
resulted in a deregulation and takeover wave.
The wave reached the European Union (EU) toward the turn of the millennium and challenged the
European Commission’s (EC’s) merger policy. In today’s globalized world, there is an increasing need
for a convergence of EU-US competition policy, and companies also prefer to use the efficiency
defense. However, in contrast to the relatively liberal antitrust policy in the US, EC competition policy
has a multiple-goal system, based on a social rather than a liberal market economy. Due to its special
characteristics, a social market economy also emphasizes macro- and microeconomic goals.
Simple adding the efficiency goal made the already complex system nontransparent and sometimes
paradoxical. The outcome is confusion on both the company and policy sides. The motivation of the
thesis is to fight confusion and clarify the role of efficiency versus market power in merger procedures.
Efficiency Defense and Beyond
2
The main topics of the PhD work are market power and efficiency. While there are new paragraphs
(§76 to §88) on efficiency in the EC Merger Guidelines (ECMG, 2004), it is still unclear what efficiency
means. The EC differentiates between costs- and revenue efficiencies, but only accepts efficiencies
from variable cost savings. Further, merging companies need to present documentary proof that they
could not achieve these efficiencies without the takeover (efficiencies are merger-specific) and that they
will pass through all cost savings to consumers. The claim of companies, the efficiency defense, in a
merger procedure fails to work at this point, at the latest.
Therefore, there is no such thing as an efficiency defense in EU-practice. The dissertation explains why
the EC does not, and in the currently form cannot, apply the efficiency defense. Further, the analysis
highlights the limitations of current EC merger policy, the failure to regulate market power and its
consequences on welfare. The efficiency potential within the current EC merger framework is limited
by the consumer surplus approach and excludes improvements in producer surplus. The European
Commission follows the Harvard-view on concentration, but leaves a gray area for efficiency claims.
Complex, sometimes controversial policy goals; nontransparent efficiency and consumer welfare
definitions; and the fear of failing firms all promoted the European Commission’s trend of allowing
mergers, even if they were found to be anticompetitive. The EC needs to justify the merger approvals,
including implementing efficiency defense, more consistently and more systematically.
The aim of the research is to explain the discrepancy in the EC merger policy and provide a framework
in which an efficiency defense may be applicable, if desired by the policy. Therefore, the main research
question are:
I. How does merger policy take market power and efficiency into consideration?
II. Do mergers increase market power or efficiency?
The first part of the thesis (Chapter 1 to 3) describes the theoretical background and criticizes the
European competition policy for mixing different welfare standards with diverse (even controversial)
policy aims. The EC only considers efficiencies if they are pre-merger verifiable and benefit consumers
(i.e. stem from variable cost savings). Moreover, the merger framework in Europe is based on the
Structure-Conduct-Performance model which contradicts efficiencies. Thus, in accordance with the
Harvard School’s concentration doctrine, the EC still emphasizes market power despite efficiencies.
The second part of the dissertation (Chapter 4 to 7) is an application of merger theory in European
aviation. In order to decide whether the application of the efficiency defense might be useful, a
descriptive case study on Lufthansa/ SWISS merger is used to investigate the potential of efficiency
gains in airline merger cases. The study generally finds improved efficiency after the takeover, but
merger-specific efficiencies are difficult to separate from general achievements to increase productivity.
Efficiency Defense and Beyond
3
The research methodology is based on applied microeconomics, relied on industrial organization. The
main methodology of the work is quantitative (descriptive) case study analysis supported by qualitative
partial productivity analysis. Case study analysis is the most appropriate method to investigate
individual airline merger cases over time. The advantages of the methodology are that it enables to
compare different cases by different approaches and does not require a big dataset. The dissertation also
processed wide ranges of data, where it was available, on post-merger changes in quantity and price.
The structure of the work is the following. The doctoral thesis starts with a normative analysis and
provides a framework for analysis by introducing different economic principles and policy choices on
a meta-level. The first chapter discusses the theoretical background behind the efficiency defense, i.e.
the general debate about market power versus efficiency trade-off. The rest of the PhD work is a positive
analysis of the performance of the European aviation market.
The second chapter assesses potential merger-specific efficiency gains from airline consolidation and
explains why the European Commission (EC) did not consider efficiency as a core criterion for their
decision to allow or prevent mergers. The third chapter surveys economic models used to measure the
price and efficiency effects of mergers and finds that most models predict a price increase and limited
efficiency, especially in the sense of benefiting consumers. The fourth chapter describes the current
merger framework within the European Commission and asserts that the EC did not comprehensibly
apply its welfare standard; otherwise, it would have prohibited many of the airline mergers that I
examine here. Chapter 5 then reviews the alternative scenario without merger permission: bankruptcy
and its consequences. Two case studies about the failure of Malév Hungarian Airlines provide insight
into the background of underperformance as well as into the short-term effects of airline exit on
passengers’ welfare, airport planning and LCC and network carrier competition.
Finally, at the operational level, the PhD thesis analyzes four Lufthansa takeovers in 2005 and 2009,
and describes the consequences of failing to regulate market power. Chapter 6 controls for the EC’s
merger remedies, which proved only partially successful (e.g., they achieved only 15.3 new frequencies
instead of the maximum possible 350 slot surrenders in all four cases), and it descriptively assesses
capacity, frequency, yield and price changes on 21 overlapping routes. Although Lufthansa did not
deviate from the EC rulings on frequency freeze, the airline increased capacity instead. Further, price
freeze remedies in the current form are a ‘gray area’ and should be more precisely defined and
controlled by the EC. The study also provides evidence that Lufthansa predated and foreclosed its rival
Air Berlin on ZRH-FRA and VIE-CGN when it entered the market on these routes. Further, the
investigation on the Lufthansa Group’s price and capacity strategies on dominant routes finds
significant price differences (about 15 to 32 percent) due to high concentration.
Efficiency Defense and Beyond
4
Chapter 7 identifies merger-specific cost efficiencies in the Lufthansa/SWISS case: economies of scale
in marketing (reduced sales commission, insurance and security fees) and access to cheaper labor
(outsourcing MRO and catering, and new contracts with cabin staff at SWISS). Assessed cost synergies
were probably merger-specific, but also driven by a general cost-savings plan. Lufthansa itself did not
realized any efficiency gains from takeovers other than SWISS.
In summary, I believe that efficiency, with other words productivity or profitability, is probable the
main goal of all companies in order to survive. However, in case of a takeover, efficiency expectations
has been usually too optimistic and merger-specific efficiency claims overestimated.
Most airline merger cases I investigate during the PhD thesis have been applied to rarely insolvent
merger candidates. Taking over an almost bankrupt airline and hope for efficiency-gains in the short-
run, where also passengers benefit from could not convince the European competition policy, which is
understandable. The idea behind the EC’s policy is to protect consumers from potentially price increase.
However, the EC also seems to protect (less efficient) competitors from failure and thus, allows
(previously prohibited) airline mergers (see Aegean/Olympic II, 2013). The limit of this approach,
which is called Consumer Surplus (CS) standard, is however how to motivate competition?
The Chicago School provides one answer of that question, namely the so called Total Welfare (TW)
standard. The aim of competition policy in this framework is exactly to enhance competition. The
outcome of the merger procedure in the TW approach is similar to the CS approach, since at the end of
the day, merger approval remains the dominant strategy. Though, while the EC allows mergers in order
to protect less powerful market participants, the alternative merger standard would protect or rather
support the most powerful, the most efficient members.
The discussion on who deserves more protection and / or more support by the government is endless in
the history. In my view, the introduction of the more liberal TW approach into the European merger
policy is challenging by numerous reasons I am going to describe in the following chapters. In sum,
competition policy is not in the position (does not want/ does not believe/ does not capable) to assess
merger-specific efficiencies.
My conclusion is therefore that merging companies need to be aware of the fact that the main goal of
the EC merger policy is to protect consumers from price increase. As long as the industry keeps the
rules, merging firms may enjoy the support of the government. The following work should provide a
merger guidance for industry, for policy, and for interested audience of any kind of ‘consumers’
Efficiency Defense and Beyond
5
1 EFFICIENCY DEFENSE AND BEYOND
“Efficiency defense is a legal provision allowing merging parties to present a justification to the
adverse effects on competition found by the enforcement authority at the end of the competition
analysis” (ICN, 2006, p. 63).
1.1 INTRODUCTION
Efficiency has become a buzzword in merger processes, but how effective is merger control in reality?
Does efficiency still matter if the merger would otherwise increase market power? No, it does not, at
least not in Europe. Competition law has traditionally had multiple goals in Europe, such as market
integration, protection of freedom, efficiency and consumer welfare. Social and environmental issues
are also included. The main purposes of competition policy in the new century seem to be efficiency
and consumer welfare, but these are in conflict. Chapter 1 investigates these questions.
When merger control was influenced by the Harvard School approach during the 1950s, 1960s and
early 1970s, efficiencies were not considered. However, with the rise of the Chicago School in the US
at the end of the 1970s, efficiencies suddenly became an important part of the analysis. Competition
policy in the European Union is a step behind: the EU started to adopt the efficiency criterion in the
early 2000s, when industrial economics was already questioning the use of efficiencies. Section 1.2
provides insight into the theories behind the purpose of antitrust, while Section 1.3 derives the main
competition-related syntheses from the different economic schools. These ideas are mainly based on
the Chicago and Harvard Schools.
In his textbook on competition policy, the current Chief Economist of the European Commission (EC),
Massimo Motta, defined competition policy as “the set of policies and laws which ensure that
competition in the marketplace is not restricted in such a way to reduce economic welfare” (2004, p.
30). However, it is not always clear what economic welfare means. Is it consumer surplus, producer
surplus, or both together? If the latter, whose interests are weighted more heavily? The goal of antitrust
or competition policy depends on the welfare standard that is applied. The consumer surplus (CS)
standard used in EC merger control differs from the total welfare (TW) focus in Canada or the hybrid
approach in the US. Section 1.4 describes this issue. The EC aims to maximize consumer welfare based
on consumer surplus and therefore applies the consumer surplus standard, which requires that
consumers benefit from the merger. Section 1.5 focuses on the move since 1997 toward increasing the
role of efficiencies (also called a more economic approach), in particular efficiency pass-over to
consumers, and the relevance of the efficiency defense.
Efficiency Defense and Beyond
6
In the following sections, I will introduce the key issues of the thesis: the Williamson trade-off, the
more economic approach and the efficiency defense.
1.1.1 THE WILLIAMSON TRADE-OFF
Williamson (1968) showed that the net effects of a merger are probably generally positive, so a
relatively small cost reduction (from efficiencies) can offset a higher price increase1. If the net allocative
effects of the merger are positive, the merger should be cleared. Williamson defined the net allocative
effect as the difference between deadweight loss and average cost savings (ΔAC).
Competition authorities should consider merger-specific efficiency gain (realized in ΔA), which might
overcome deadweight loss (also called allocative inefficiency) and price increase (the transfer from
consumer surplus to producer surplus; calculated as (P2- P1)*Q2). As long as the cost savings are greater
than the deadweight loss, the merger will increase total welfare, even if consumers pay a higher price.2
In Williamson’s approach, a price increase is only a welfare transfer from consumers to producers, so
it leads to no relative change in total welfare and is unimportant.
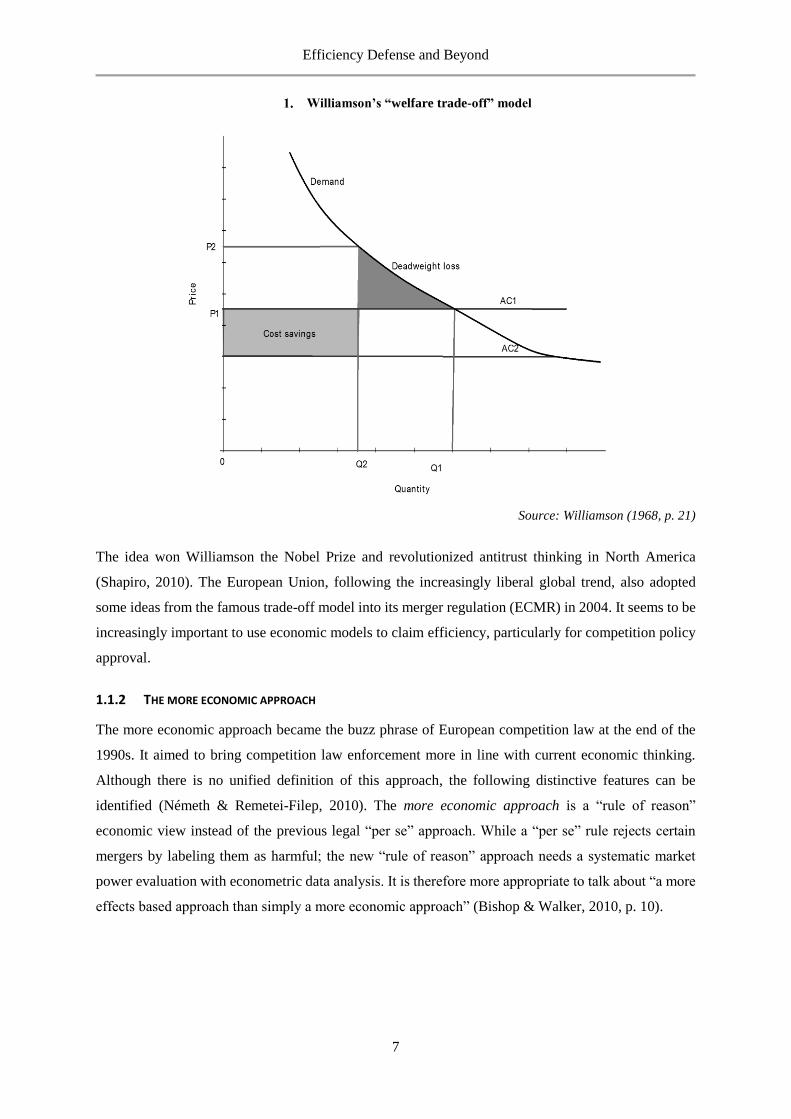
In summary, if the cost savings are greater than the deadweight loss (see in Figure 1), the merger has
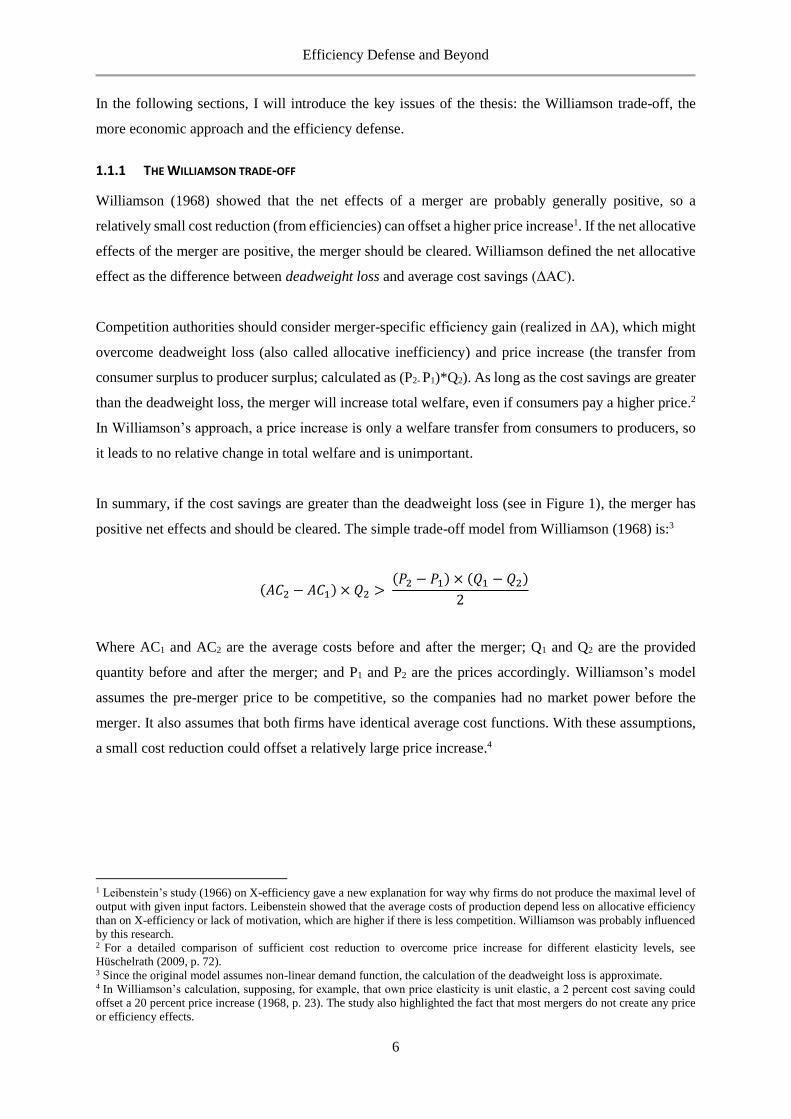
positive net effects and should be cleared. The simple trade-off model from Williamson (1968) is:3
(𝐴𝐶2 − 𝐴𝐶1) × 𝑄2 > (𝑃2 − 𝑃1) × (𝑄1 − 𝑄2)
2
Where AC1 and AC2 are the average costs before and after the merger; Q1 and Q2 are the provided
quantity before and after the merger; and P1 and P2 are the prices accordingly. Williamson’s model
assumes the pre-merger price to be competitive, so the companies had no market power before the
merger. It also assumes that both firms have identical average cost functions. With these assumptions,
a small cost reduction could offset a relatively large price increase.4
1 Leibenstein’s study (1966) on X-efficiency gave a new explanation for way why firms do not produce the maximal level of
output with given input factors. Leibenstein showed that the average costs of production depend less on allocative efficiency
than on X-efficiency or lack of motivation, which are higher if there is less competition. Williamson was probably influenced
by this research. 2 For a detailed comparison of sufficient cost reduction to overcome price increase for different elasticity levels, see
Hüschelrath (2009, p. 72). 3 Since the original model assumes non-linear demand function, the calculation of the deadweight loss is approximate. 4 In Williamson’s calculation, supposing, for example, that own price elasticity is unit elastic, a 2 percent cost saving could
offset a 20 percent price increase (1968, p. 23). The study also highlighted the fact that most mergers do not create any price
or efficiency effects.
Efficiency Defense and Beyond
7
Williamson’s “welfare trade-off” model
Source: Williamson (1968, p. 21)
The idea won Williamson the Nobel Prize and revolutionized antitrust thinking in North America
(Shapiro, 2010). The European Union, following the increasingly liberal global trend, also adopted
some ideas from the famous trade-off model into its merger regulation (ECMR) in 2004. It seems to be
increasingly important to use economic models to claim efficiency, particularly for competition policy
approval.
1.1.2 THE MORE ECONOMIC APPROACH
The more economic approach became the buzz phrase of European competition law at the end of the
1990s. It aimed to bring competition law enforcement more in line with current economic thinking.
Although there is no unified definition of this approach, the following distinctive features can be
identified (Németh & Remetei-Filep, 2010). The more economic approach is a “rule of reason”
economic view instead of the previous legal “per se” approach. While a “per se” rule rejects certain
mergers by labeling them as harmful; the new “rule of reason” approach needs a systematic market
power evaluation with econometric data analysis. It is therefore more appropriate to talk about “a more
effects based approach than simply a more economic approach” (Bishop & Walker, 2010, p. 10).
Efficiency Defense and Beyond
8
The first document 5 that should be mentioned as a result of the more economic approach is the
“Commission notice on the definition of the relevant market,” published by the European Commission
(EC, 1997). It describes methodologies to use when identifying the competitive constraints on market
players, and introduces the SSNIP test6 and various quantitative methods (Németh & Remetei-Filep,
2010). Since then, the causes and consequences of mergers have received growing attention in Europe.
Econometric approaches are increasingly used in competition policy enforcement: for example, a
market analysis has to show that a merger will not lead to undue market power and abuse of market
dominance.7
1.1.3 THE EFFICIENCY DEFENSE AND ITS PARADOX
Article 2(1)(b) of the first merger regulation (EC, 1989) was a contradiction on efficiency defense.
Efficiencies (such as development of technical and economic progress) shall be taken into account if
they benefit consumers and do not create an obstacle to competition. Since the efficiency defense is
needed to counterbalance the potential harm, it is normally used if there is a conflict between
competition and efficiency. The 1989 legislation, however, suggested that a defense could only be used
if there is no conflict. Anyhow, in this case, efficiency does not need to be defended. Therefore, “the
efficiency defense under the merger regulation (if any) is intended to be limited” (Röller et al., 2000, p.
68).
Three court defeats related to merger cases led to significant changes in 2002. The European
Commission prohibited the mergers of Airtours/First Choice (M. 1524, 1999), GE/Honeywell (M. 2220,
2001), Schneider/Legrand (M. 2283, 2001) and Tetra Laval/Sidel (M. 2416, 2001). However, the Court
of First Instance reversed the EC’s prohibition decisions and delivered a hard critique of the lack of
economics applied by the EC and how it treated those mergers (Németh & Remetei-Filep, 2010). It was
time to conform and professionalize the economics used in merger decisions, so in 2003, the
Commission created the position of Chief Economist. That person would be tasked with providing
expert opinions and adopting a new regulation.
5 The reform of vertical agreements in 1999 was the next step toward a more economic approach (EC, 1999). The approach is
more effect-based, emphasizing that the importance of market power in agreements cannot be exempted. The EC continued
the reform with horizontal agreements. The most difficult task of introducing the new approach was in the legislation on the
abuse of dominant position (Article 102, previous Article 82). Its reform began in 2005 (Németh & Remetei-Filep, 2010). 6 Developed by the US DoJ in 1982, SSNIP stands for the “small but significant non-transitory increase in price” test. The
test, also called the hypothetical monopolist test, is based on own-price elasticity data. Section 4.2.1 describes SSNIP in detail. 7 Christiansen (2009) provides a good overview of the exact methodology of the more economic approach and many case
examples about how far it has been implemented in EC merger policy in recent years (in German).
Efficiency Defense and Beyond
9
The new EC Merger Regulation (ECMR) 139/2004 came into force on May 1, 2004. According to its
guidelines, concentration should be welcomed if it does not damage the competition, but increases the
competitiveness of the entire European industry and raises living standards. Concentration has to
maintain and develop effective competition. The resulting expansion of technical and economic
progress should benefit consumers. The ECMR states in §29: “It is possible that the efficiencies brought
about by the concentration counteract the effects on competition, and in particular the potential harm to
consumers.”
The ECMR 2004 replaced the dominance test (used from 1989-2004) with the SIEC test: “a
concentration which would significantly impede effective competition (…) shall be declared
incompatible with the common market” (Art. 2(3)). The new test also aimed to address the non-
collusive oligopoly problems. The adopted merger guidelines dealt with the appraisal of mergers and
with the assessment of non-coordinated (unilateral, non-cooperative game-theory-based oligopoly
models) and coordinated (collusive) effects, and efficiency claims (Németh & Remetei-Filep, 2010).
The new European-level guidelines moved away from protecting competitors and toward protecting
competition and consumer welfare or consumer interest. In other words network, efficiencies and
synergies should play an important role in the future (Németh & Niemeier, 2012). Thus, a convergence8
with US antitrust had begun. Economics is already central to antitrust in the US and competition policy
in Europe, but which economic concepts provide the most appropriate tools and the best suitable
analytical framework for assessing market power and efficiency within merger control? The first
chapter aims to answer this question.
8 The aim is to bring US antitrust and European competition policy closer. According to my interview with the EC DG Comp
(Pavlova, 2011), the main challenge is the different institutional frameworks. The US antitrust authority consists of the DoT
(Department of Transport) and the DoJ (Department of Justice). The DoJ deals with antitrust and merger cases, while the DoT
handles immunity cases. The role of the DoT is to meet the public interest, so it is important to note who benefits from the
merger. If there is great public interest, the DoT allows the merger. It provides an explanation for the liberal forms of transport
agreements.
Efficiency Defense and Beyond
10
1.2 ECONOMIC SCHOOLS OF ANTITRUST
“In general, if any branch of trade, or any division of labour, be advantageous to the public, the freer
and more general the competition, it will always be more so” (Smith, 1776, p. 421).
The history of antitrust and competition policy has been extensively studied.9 The aim of the next
section is to provide a brief overview of the main achievements of previous antitrust thinking in order
to better understand the European competition policy framework. This section introduces the
neoclassical approach, as well as the Harvard School, the Chicago School and the Modern Industrial
Organization theories.
1.2.1 NEOCLASSICAL THEORY, THE CRADLE OF ANTITRUST
There have been many improvements10 since Smith described the concept of free competition with self-
interested behavior of market participants and laissez-faire. The Classical School was born with the
publication of Smith’s The Wealth of Nations in 1776 and was developed through the mid-nineteenth
century by Ricardo, Malthus, Say and Mill. The Classical School was an attack on protectionism and
feudalism at the time of England’s industrialization. Its main topics were economic growth, the theory
of value (Ricardo), the law of supply and demand (Say) and the problems of a growing population
(Malthus). As the last great writer among nineteenth-century classical economists, Mill integrated the
different classical views in his main work Principles of Political Economy in 1848. His more social
approach to income distribution and government intervention was widely discussed.
Deeply impressed by Ricardo’s ideas, Marshall wrote Principles of Economics in 1890, which ushered
in a new century of economic analysis.11 In his Memorials (pp.416), Marshall remembered: “My main
position as to the theory of value and distribution was practically completed in the years 1867 to 1870,
when I translated Mill’s version of Ricardo’s or Smith’s doctrines into mathematics” (Shove, 1942, p.
302). With the help of mathematical tools developed by Cournot, Marshall developed the Price Theory.
It forms the mainstream of microeconomic thinking and is the basis of the Neoclassical School and,
later, the Chicago School.
Price theory is based on perfect competition in which there are many firms with homogeneous products,
well-behaved production technology, no barriers to entry and perfect information. In this static model,
market equilibrium is achieved and economic efficiency is reached when supply equals demand. Thus
the equilibrium price of a given product equals the marginal cost of producing it.
9 See, for example, Drexl et al. (2011); Hildebrand (2009); Whish (2009); Pitofsky (2008); Posner (2007); Mercuro & Medema
(2006); Shavell (2004); Gellhorn & Kovacic (1994); and Areeda (1981). 10 For an overview on economic thoughts before Smith, look at Robbins (2000). 11 Nevertheless, Marshall’s concept of competition was still dynamic, like the Classical approach. He defined moving
equilibriums as part of the evolution. In contrast, Neoclassical economists have a static view on competition and equilibrium.
For more about the differences between Classical and Neoclassical concepts of competition, price and value, see Stigler (1957).
Efficiency Defense and Beyond
11
Antitrust legislation was born in the same year as Marshall’s book was published. In 1890, the Sherman
Anti-Trust Act (Act of July 2, 1890) was enacted. It was the first legislation to address merger control,
in the form of contracting against unlawful restraints of trade (Sec.1) and monopolizing (Sec.2). It was
the first and probably the most debated regulation in the history of antitrust, and different parties have
interpreted it very differently.12
The next milestone, the Clayton Antitrust Act of 1914, revisited previous regulations and prohibited
acquisitions that could substantially reduce competition or create a monopoly.
1.2.2 THE HARVARD SCHOOL, LIMITING MONOPOLY AND MARKET POWER
Harvard economists in the early twentieth century found it naive to believe that the conditions of perfect
competition could be met. The first criticism of the price theory model came from Chamberlin in the
1920s (at that time he was a PhD fellow at Harvard University, and he later became a professor there).
He introduced the ideas of oligopoly, monopolistic competition and product differentiation. In this
context, he was the first to draw attention to the cooperative and non-cooperative behaviors of
oligopolies.
A decade later, the first female contributor the theory of competition, Robinson, further developed
Marshall’s partial equilibrium techniques (focusing on marginal revenue “MR” and marginal cost
“MC” analysis). However, she dropped the assumption of perfect competition and added price
discrimination instead. Chamberlin’s book, The Theory of Monopolistic Competition, and Robinson’s
book, The Economics of Imperfect Competition, were both published in 1933 (Deane, 1993).
Robinson’s work became the early guide for today’s relevant antitrust market analysis.
Mason (1939), a Harvard professor, was the first to mention the need for a more complex tool than pure
price analysis. He drew attention to the chain of problems: different market structures, price response
and their consequences for the economy. His new model became well-known as the Structure-Conduct-
Performance (SCP) framework and, extended with entry barriers by Bain, is still the starting point for
the research field of Industrial Organization (IO). This field was the beginning of a new economic
thought cluster that turned away from price theory, called the Harvard School.
12 On one side, the Sherman Act is claimed to be the “best-known response to a combination of economic, social and political
circumstances, which was influenced by resentment against increasing domination of big business, political fears of
concentrated power and the perceived threat to the traditional right of individuals to determine their own destinies”
(Hildebrand, 2009, p. 79). On the other side, Holmes stated in the early 1900s that it was “a humbug based on economic
ignorance and incompetence” (Gellhorn & Kovacic, 1994, p. 19). The courts have also made varying interpretations of the
Sherman Act; it is unclear whether monopolies are per se prohibited, or only the attempt to monopolize.
Efficiency Defense and Beyond
12
Scherer (1970) defines IO as a field of study which describes how production is balanced with demand
through organizing mechanisms (e.g., free market) and “how variations and imperfections in the
organizing mechanism affect the degree of success achieved by producers in satisfying society’s wants”
(p. 1). In Scherer’s view, while Price Theory (microeconomics) keeps models simple and rigorous, IO
is rich in independent variables, predictions and explanations for real-world issues.
Scherer (1970) also introduced the SCP model, which has become the central model for IO analysis. It
assumes that the fundamental aim of production is good performance, which can be achieved by four
factors: 1) efficiency, 2) innovative production, 3) full employment and 4) equal income distribution.
All four factors should be satisfied. Performance depends on conduct (i.e., the behavior of sellers and
buyers: pricing, marketing, R&D, etc.), while conduct depends on the structure of the relevant market
(e.g., concentration, entry barriers, product homogeneity). One can derive market structure from basic
conditions of supply and demand, but structure can also change basic conditions on the market. Conduct
(e.g., successful research) might also influence basic conditions (e.g., technology) and/ or structure
(e.g., production costs). These adverse effects are called the feedback effects.
Starting in the 1950s and reaching the height of its influence in the 1960s, the Harvard School of
antitrust and industrial organization became the mainstream economic theories in the US. During the
1960s, the goal of US antitrust policy was the limitation of monopoly and market power.
1.2.3 THE CHICAGO SCHOOL AND THE HARDCORE ECONOMISTS, ENHANCING EFFICIENCY
The rise of the Chicago School in the early 1970s was complex. Due to strict antitrust politics expressed
in regulation against concentration, US firms were losing market share nationally and internationally.
The general dissatisfaction led to the election of Republican Richard Nixon to the presidency in 1969,
the first time in almost13 36 years that a Democrat did not hold that office. The new president appointed
numerous Chicago School scholars14 to the US Court of Appeals, beginning the change in antitrust law
(Kovacic & Shapiro, 2000).
The Chicago School’s approach was based on four statements. First, neoclassical price theory
(microeconomics) is the most qualified science to analyze antitrust.15 Second, the only goal of antitrust
policy is consumer welfare with efficiency, not wealth distribution or other macroeconomic aims. Third,
judges therefore need to make decisions consistent with the aim of antitrust policy (i.e., efficiency).
Fourth, “simplicity and clarity” offer a secure and predictable legal framework, and promote capital
investments within it (Hildebrand, 2009).
13 Since Roosevelt was first elected president in 1933, only Eisenhower’s presidency (from 1953 to 1961) had interrupted the
Democrats’ hold on the presidency. These nearly four decades are also called the ‘New Deal Coalition.’ 14 E.g., Bork, Easterbrook, and Posner. 15 Milton Friedman argued that not the model of perfect competition itself, but its explanatory power is important (1953).
Efficiency Defense and Beyond
13
There are a number of other differences between the Harvard School and the Chicago School.
Proponents of the Chicago School believe in a dynamic competitive market in which market
imperfections and conspiracies are transitory; in the survival of the fittest in the market (which Stigler
(1971) called Economic Darwinism); in the importance of economies of scale; and in the insignificance
of entry barriers (other than governmental), which therefore require no remedies. Chicago School
proponents also assume that all firms have perfect information on costs and profits; view market power
with skepticism; and have an entrepreneur-friendly liberal-conservative attitude (Mercuro & Medema,
2006; and Hildebrand, 2009). The contrasting views on predatory pricing provide a helpful example.
Whereas the Harvard School treated predatory pricing as an attempt to monopolize, Chicago School
judge Frank Easterbrook said that predatory pricing is an “irrational activity and those claiming it should
be summarily dismissed” (Hovenkamp, 2010b, p. 2).
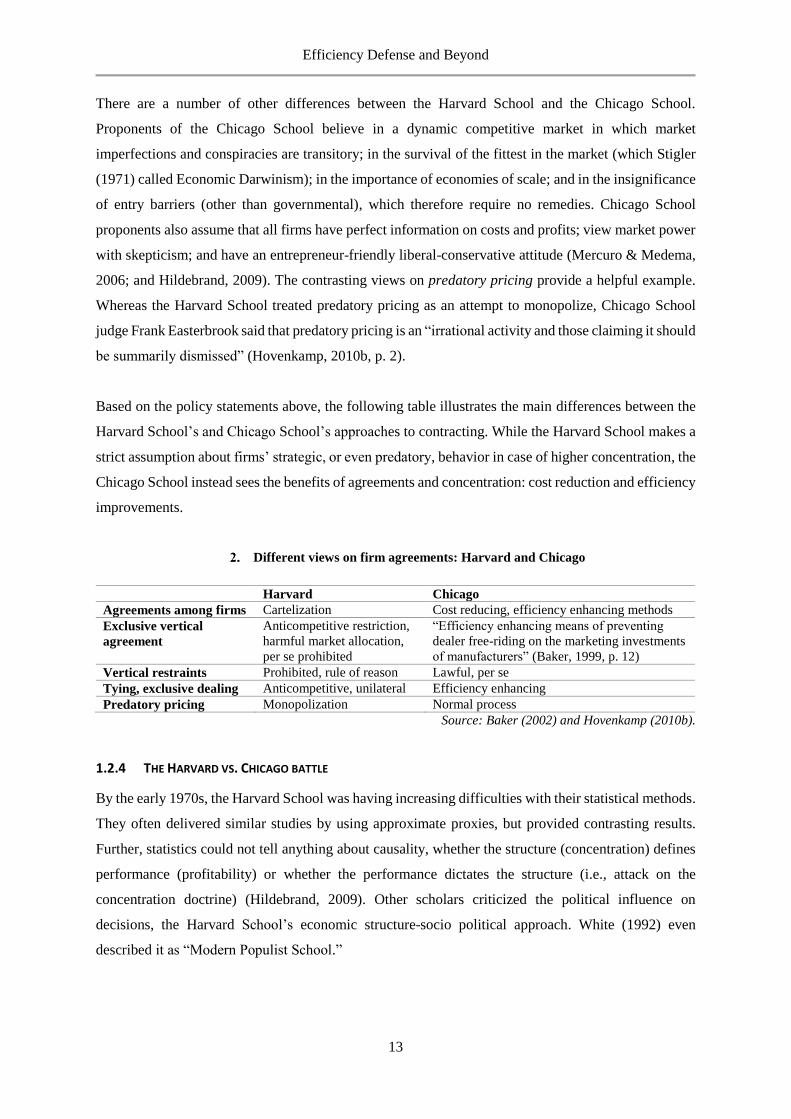
Based on the policy statements above, the following table illustrates the main differences between the
Harvard School’s and Chicago School’s approaches to contracting. While the Harvard School makes a
strict assumption about firms’ strategic, or even predatory, behavior in case of higher concentration, the
Chicago School instead sees the benefits of agreements and concentration: cost reduction and efficiency
improvements.
Different views on firm agreements: Harvard and Chicago
Harvard Chicago
Agreements among firms Cartelization Cost reducing, efficiency enhancing methods
Exclusive vertical
agreement
Anticompetitive restriction,
harmful market allocation,
per se prohibited
“Efficiency enhancing means of preventing
dealer free-riding on the marketing investments
of manufacturers” (Baker, 1999, p. 12)
Vertical restraints Prohibited, rule of reason Lawful, per se
Tying, exclusive dealing Anticompetitive, unilateral Efficiency enhancing
Predatory pricing Monopolization Normal process
Source: Baker (2002) and Hovenkamp (2010b).
1.2.4 THE HARVARD VS. CHICAGO BATTLE
By the early 1970s, the Harvard School was having increasing difficulties with their statistical methods.
They often delivered similar studies by using approximate proxies, but provided contrasting results.
Further, statistics could not tell anything about causality, whether the structure (concentration) defines
performance (profitability) or whether the performance dictates the structure (i.e., attack on the
concentration doctrine) (Hildebrand, 2009). Other scholars criticized the political influence on
decisions, the Harvard School’s economic structure-socio political approach. White (1992) even
described it as “Modern Populist School.”
Efficiency Defense and Beyond
14
The hardest critics came from the Chicago School, especially from Bork,16 Posner, Stigler, Demsetz,
Easterbrook and Gellhorn. They argued that there were efficiency reasons behind performance and
refused any part of price or entry regulations. By the end of the 1970s, even Harvard economists and
lawyers like Areeda and Turner17 had moved away from the SCP approach. They oriented themselves
toward anticompetitive conduct and refused aggressive legal intervention (Hovenkamp, 2010b).
The sunset of Harvard’s SCP paradigm had already begun when Bork and Bowman (1965) published
their article on the crisis in antitrust. They affirmed antitrust as protectionist, since “antitrust law
protects competitors in name of protecting competition” (p. 375). They asserted that antitrust had
labeled economies of scale and efficiency as anticompetitive, because it could create competitive
advantage, injure competitors and impede new entry.
Bork and Bowman (1965) made an example of the Brown Shoe Co. v. United States case18 and presented
the contrast in the court’s argument: “Although mergers are not rendered unlawful by the mere fact that
small independent stores may be adversely affected, we must recognize that mergers are unlawful when
small independent stores may be adversely affected” (p. 373). They excoriated the court’s decision,
which declared the merger illegal since it generally held vertical integration to be illegal as a type of
exclusionary practice (such as price discrimination or exclusive dealing contracts). The article also
reviewed the social purpose of antitrust (calling it an “ugly demand for class privilege”) and questioned
the credibility of courts: “How could one know in a particular case whether the court would apply a
rigorously pro-competitive rule or the social policy of preserving small business units from aggressive
behavior?” (p. 370).
Stigler, a former PhD student of Knight (who was known as the ‘father of the Chicago School’), heavily
criticized earlier antitrust economics: “I am unwilling to believe that economists in general, or Clark in
particular, had any appreciable influence on antitrust legislation. (…) no economist had any professional
knowledge on which to base recommendations” (1982a, p. 6). He went even further: “The wonder, of
course, is that any large number of economists ever survive in a law enforcement agency (…) but unless
one believes in a labor theory of value, the magnitude of economists’ influence remains uncertain” (p.
16 Bork (1993, first edition 1978) was very skeptical of oligopoly theory. He wrote: “it is little more than a guess” (p. 92) and
ironically went further: “there appear to be about as many oligopoly theories as there are economists who have written on the
subject” (p. 102). Finally, he even called it “speculation about how firms may or may not be able to behave” (p. 104). 17 Turner described the 1956 DuPont case in the Harvard Law Review. That case later became known as the ‘cellophane
fallacy’ and was a milestone in the history of relevant market definition. 18 The Celler-Kefauver Act in 1950 strengthened antitrust by adding vertical mergers and asset acquisitions to the list of
prohibitions (if they lessen competition). In the case Brown Shoe Co. v. United States in 1962 the court overruled a merger by
means of a five percent market share. “This measure enabled the government to press aggressive attacks against categories of
horizontal and vertical transactions” (Kovacic & Shapiro, 2000, p. 51).
Efficiency Defense and Beyond
15
7). In that same year, Stigler won the Nobel Prize for his work on markets and public regulation (Stigler,
1982b). It was time to change general thinking about economics and antitrust.19
1.2.5 NEW INDUSTRIAL ORGANIZATION: A MARRIAGE BETWEEN THE HARVARD AND CHICAGO SCHOOLS
By the time the courts had adopted Chicago School theories, economists had already improved new
theories by combining ideas from both the Chicago and Harvard Schools. They did this while keeping
in mind Keynes’ idea: “The common sense of one generation is often the economic theory of a previous
generation” (Baker, 2002, p. 18). Mathematics and empirical econometrics challenged the Chicago
School. The main tool of new IO research20 is the study of human behavior, (mainly non-cooperative)
Game Theory21.
The first critics of the Chicago School appeared at the end of the 1980s. They asserted that it is only
driven by ideology and is not fact-oriented. They also asserted that its static models are too simple: they
should include market imperfections (e.g., asymmetric information or externalities) and strategic
behavior with market power that can harm competition (e.g., raising rivals’ costs22).
The new thinkers not only considered allocative and productive efficiency, but also introduced dynamic
efficiency, (e.g., future gains from innovation) (Hildebrand, 2009). The new research focused on
conduct instead of structure, on dynamic strategic behavior (e.g., predatory behavior) and especially on
predatory pricing. IO theory at the end of the 1980s had moved far away from the contestable market
theory and had begun to consider sunk costs, entry barriers and government regulation. Modern IO in
the 1990s combined the “theory of business strategy and the tools of industrial analysis” (Shapiro, 1989,
p. 134).
19 The final attempt to rescue the ruins of antitrust based on the SCP approach was the Neal Report in 1968. Its contributors
were, among others, Neal (the Dean of Chicago Law School), Baxter (Stanford Law School) and Bork (Yale Law). President
Johnson commissioned the report just before Nixon won the 1968 presidential election. Nixon then appointed Stigler to write
a new report in that same year. Bork published his minority report in 1968 (in Antitrust Law and Economics 53). Baxter, fully
rejecting his previous recommendations in the Neal Report, became the first Assistant Attorney General in the Antitrust
Division after Reagan won the presidential election in 1980 (Hovenkamp, 2009; and Mercuro & Medema, 2006). 20 The research field is also called Modern Industrial Organization, post-Chicago and Industrial Economics. 21 In its early years, game theory focused on rationality (Neumann, Morgenstern), introduced the first mover advantage
(Stackelberg), added signaling doctrine to asymmetric information theory (Spence) and described strategic interactions among
humans. Famous representatives of game theory include Nash, Selten and Harsanyi, the latter of whom won the Nobel Prize
in Economic Sciences in 1994. 22 Incumbent firms can act strategically to raise the costs of a potential entrant: put them at a competitive disadvantage and
reduce the profitability of entry (Church & Ware, 2000, p. 123). Raising rivals’ cost is a conduct, a strategy, which excludes
competitors by increasing their costs, e.g., by exclusive arrangements to force suppliers to discriminate against rivals; by rent
seeking in politics in order to battle out product standards, minimum wage contracts (if the rival is labor-intensive), or other
government regulations; by advertising or R&D. These strategies have advantages over predatory pricing: it is more credible,
less expensive and “it is better to compete against high-cost firms than low-cost ones” (Salop & Scheffman, 1983, p. 267). A
good overview of case history provides (Scheffman & Higgins, 2003).
Efficiency Defense and Beyond
16
Schmalensee (1988) wrote a comprehensive study on the topics of what he called industrial economics,
which is still relevant. While describing the improvements in different fields of research (e.g.,
credibility23, principal-agent theory, entry deterrence), he also drew attention to the problems, which
mainly arise from having too many different theories. As Schmalensee pointed out: “Recent research
has cast doubt on many positive and normative relations that were once widely believed to be generally
valid” (p. 677).
The relationship between concentration and competition is still questionable. Welfare analysis (due to
very different oligopoly models, sophisticated game theory and imperfect data24) is based on distorted
equilibrium with second-best solutions.
Modern IO advanced from both the Chicago and Harvard Schools and focuses on the behavior of firms
and individuals (i.e., the theory of the firm by institutional or transaction cost economics; game theory
with strategic interactions). By developing IO, the Harvard School played a dominant role in forming
mainstream ideas about antitrust worldwide.
US antitrust was also influenced by the Chicago School in the 1980s, while competition policy within
Europe was instead inspired by the Freiburg School (for more details about the Freiburg School, see
Section 1.4.3). These diverse impacts make a convergence of US antitrust and EU competition policy
more difficult.
1.2.6 THE EUROPEAN SCHOOL: A MORE ECONOMIC APPROACH
Competition law has traditionally had multiple goals in Europe. These include market integration,
protection of freedom, efficiency and consumer welfare, but also social and environmental issues. The
main goals in the new century, however, seem to be efficiency and consumer welfare (van den Bergh,
2007). In order to understand the roots of this multiplicity, we need to take a short look at the history
of EC competition law.
During the 1940s, economists went back and forth about the appropriate model: perfect competition or
oligopoly? This discussion is the background of Harvard economist John Maurice Clark’s theory of the
second best25.
23 The credibility of threats is a key issue in dynamic games. Only threats that are credible will influence the behavior of
rational agents (Church & Ware, 2000, p. 299). 24 “Since data collection is usually neither intellectually exciting nor highly valued by the economics profession” (p. 677), it
will always depend on financial support. This raises another interesting question related to corporate financing: could the data
provided be partial or biased by corporate interests? 25 Lipsey and Lancaster define the theory of the second best as the following: “the maximization of total surplus in one market
may not be efficient if surplus in other markets is not also maximized” (Church & Ware, 2000, p. 29).
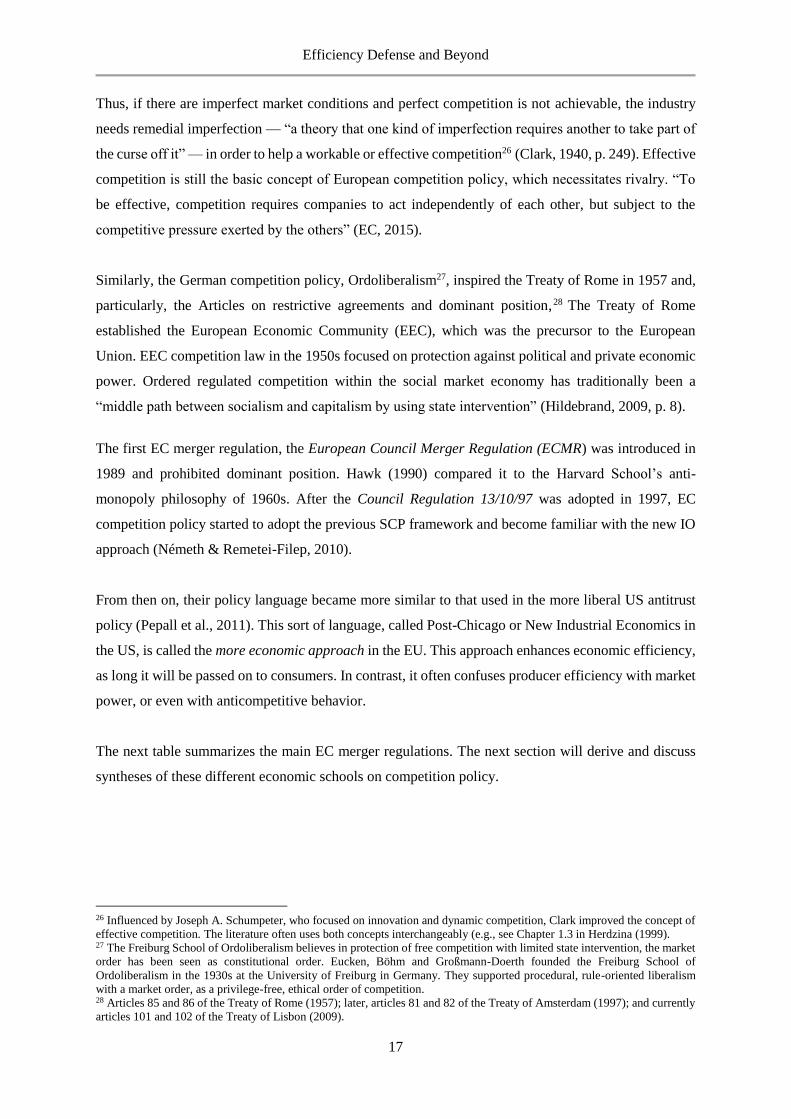
Efficiency Defense and Beyond
17
Thus, if there are imperfect market conditions and perfect competition is not achievable, the industry
needs remedial imperfection — “a theory that one kind of imperfection requires another to take part of
the curse off it” — in order to help a workable or effective competition26 (Clark, 1940, p. 249). Effective
competition is still the basic concept of European competition policy, which necessitates rivalry. “To
be effective, competition requires companies to act independently of each other, but subject to the
competitive pressure exerted by the others” (EC, 2015).
Similarly, the German competition policy, Ordoliberalism27, inspired the Treaty of Rome in 1957 and,
particularly, the Articles on restrictive agreements and dominant position,28 The Treaty of Rome
established the European Economic Community (EEC), which was the precursor to the European
Union. EEC competition law in the 1950s focused on protection against political and private economic
power. Ordered regulated competition within the social market economy has traditionally been a
“middle path between socialism and capitalism by using state intervention” (Hildebrand, 2009, p. 8).
The first EC merger regulation, the European Council Merger Regulation (ECMR) was introduced in
1989 and prohibited dominant position. Hawk (1990) compared it to the Harvard School’s anti-
monopoly philosophy of 1960s. After the Council Regulation 13/10/97 was adopted in 1997, EC
competition policy started to adopt the previous SCP framework and become familiar with the new IO
approach (Németh & Remetei-Filep, 2010).
From then on, their policy language became more similar to that used in the more liberal US antitrust
policy (Pepall et al., 2011). This sort of language, called Post-Chicago or New Industrial Economics in
the US, is called the more economic approach in the EU. This approach enhances economic efficiency,
as long it will be passed on to consumers. In contrast, it often confuses producer efficiency with market
power, or even with anticompetitive behavior.
The next table summarizes the main EC merger regulations. The next section will derive and discuss
syntheses of these different economic schools on competition policy.
26 Influenced by Joseph A. Schumpeter, who focused on innovation and dynamic competition, Clark improved the concept of
effective competition. The literature often uses both concepts interchangeably (e.g., see Chapter 1.3 in Herdzina (1999). 27 The Freiburg School of Ordoliberalism believes in protection of free competition with limited state intervention, the market
order has been seen as constitutional order. Eucken, Böhm and Großmann-Doerth founded the Freiburg School of
Ordoliberalism in the 1930s at the University of Freiburg in Germany. They supported procedural, rule-oriented liberalism
with a market order, as a privilege-free, ethical order of competition. 28 Articles 85 and 86 of the Treaty of Rome (1957); later, articles 81 and 82 of the Treaty of Amsterdam (1997); and currently
articles 101 and 102 of the Treaty of Lisbon (2009).
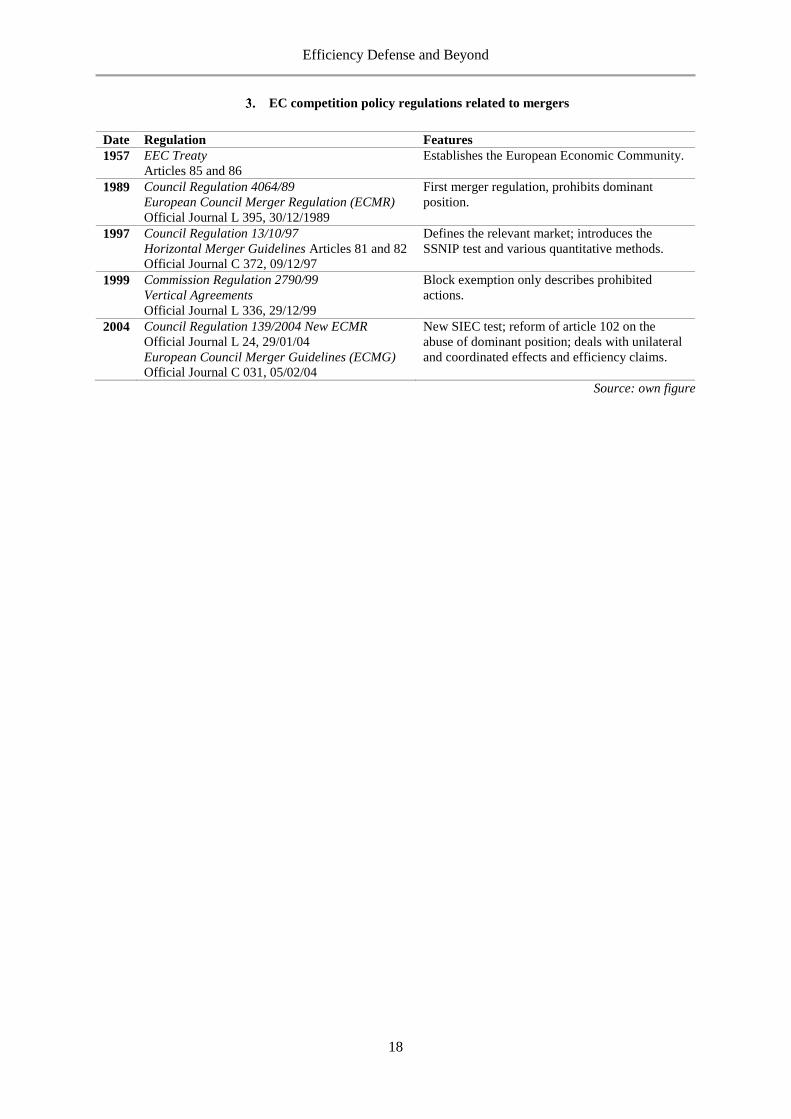
Efficiency Defense and Beyond
18
EC competition policy regulations related to mergers
Date Regulation Features
1957 EEC Treaty
Articles 85 and 86
Establishes the European Economic Community.
1989 Council Regulation 4064/89
European Council Merger Regulation (ECMR)
Official Journal L 395, 30/12/1989
First merger regulation, prohibits dominant
position.
1997 Council Regulation 13/10/97
Horizontal Merger Guidelines Articles 81 and 82
Official Journal C 372, 09/12/97
Defines the relevant market; introduces the
SSNIP test and various quantitative methods.
1999 Commission Regulation 2790/99
Vertical Agreements
Official Journal L 336, 29/12/99
Block exemption only describes prohibited
actions.
2004 Council Regulation 139/2004 New ECMR
Official Journal L 24, 29/01/04
European Council Merger Guidelines (ECMG)
Official Journal C 031, 05/02/04
New SIEC test; reform of article 102 on the
abuse of dominant position; deals with unilateral
and coordinated effects and efficiency claims.
Source: own figure
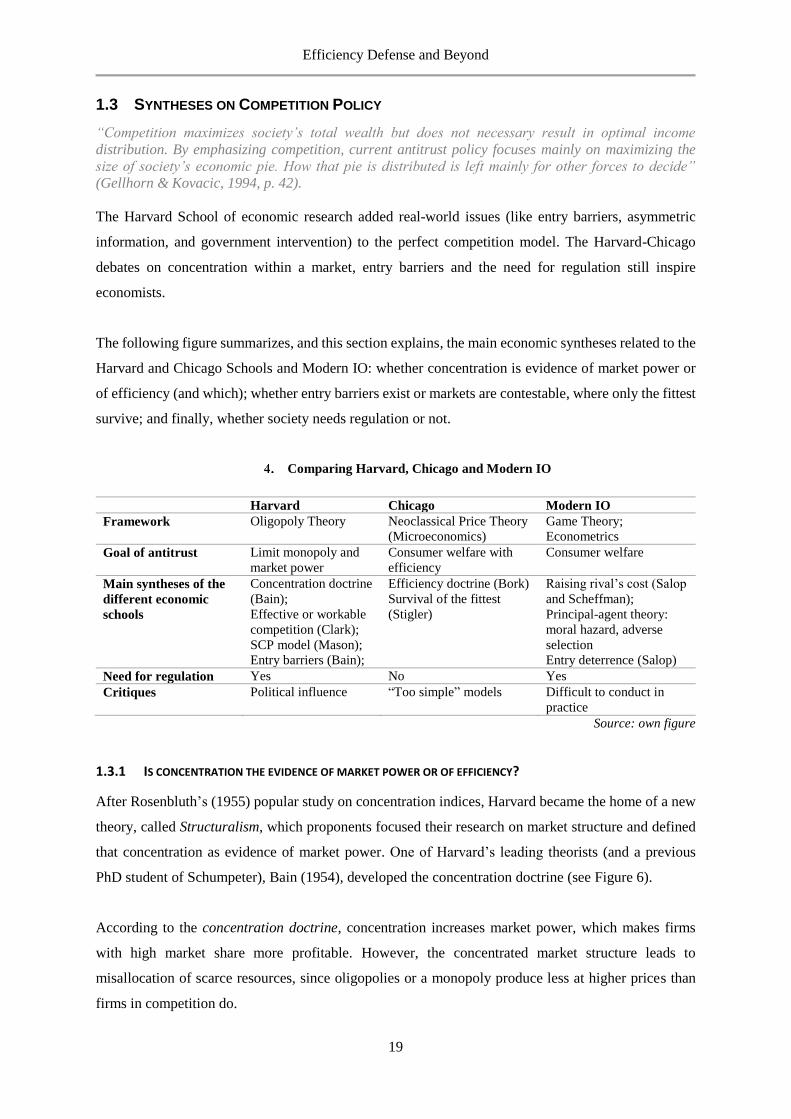
Efficiency Defense and Beyond
19
1.3 SYNTHESES ON COMPETITION POLICY
“Competition maximizes society’s total wealth but does not necessary result in optimal income
distribution. By emphasizing competition, current antitrust policy focuses mainly on maximizing the
size of society’s economic pie. How that pie is distributed is left mainly for other forces to decide”
(Gellhorn & Kovacic, 1994, p. 42).
The Harvard School of economic research added real-world issues (like entry barriers, asymmetric
information, and government intervention) to the perfect competition model. The Harvard-Chicago
debates on concentration within a market, entry barriers and the need for regulation still inspire
economists.
The following figure summarizes, and this section explains, the main economic syntheses related to the
Harvard and Chicago Schools and Modern IO: whether concentration is evidence of market power or
of efficiency (and which); whether entry barriers exist or markets are contestable, where only the fittest
survive; and finally, whether society needs regulation or not.
Comparing Harvard, Chicago and Modern IO
Harvard Chicago Modern IO
Framework Oligopoly Theory Neoclassical Price Theory
(Microeconomics)
Game Theory;
Econometrics
Goal of antitrust Limit monopoly and
market power
Consumer welfare with
efficiency
Consumer welfare
Main syntheses of the
different economic
schools
Concentration doctrine
(Bain);
Effective or workable
competition (Clark);
SCP model (Mason);
Entry barriers (Bain);
Efficiency doctrine (Bork)
Survival of the fittest
(Stigler)
Raising rival’s cost (Salop
and Scheffman);
Principal-agent theory:
moral hazard, adverse
selection
Entry deterrence (Salop)
Need for regulation Yes No Yes
Critiques Political influence “Too simple” models Difficult to conduct in
practice
Source: own figure
1.3.1 IS CONCENTRATION THE EVIDENCE OF MARKET POWER OR OF EFFICIENCY?
After Rosenbluth’s (1955) popular study on concentration indices, Harvard became the home of a new
theory, called Structuralism, which proponents focused their research on market structure and defined
that concentration as evidence of market power. One of Harvard’s leading theorists (and a previous
PhD student of Schumpeter), Bain (1954), developed the concentration doctrine (see Figure 6).
According to the concentration doctrine, concentration increases market power, which makes firms
with high market share more profitable. However, the concentrated market structure leads to
misallocation of scarce resources, since oligopolies or a monopoly produce less at higher prices than
firms in competition do.
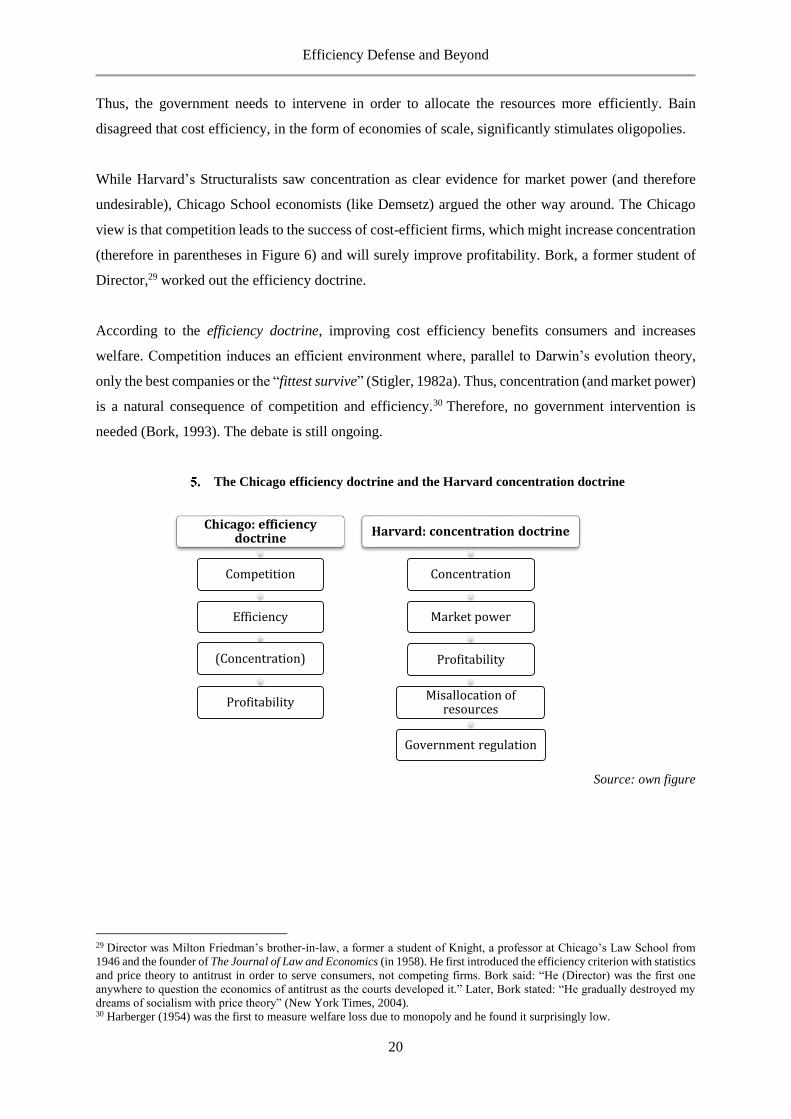
Efficiency Defense and Beyond
20
Thus, the government needs to intervene in order to allocate the resources more efficiently. Bain
disagreed that cost efficiency, in the form of economies of scale, significantly stimulates oligopolies.
While Harvard’s Structuralists saw concentration as clear evidence for market power (and therefore
undesirable), Chicago School economists (like Demsetz) argued the other way around. The Chicago
view is that competition leads to the success of cost-efficient firms, which might increase concentration
(therefore in parentheses in Figure 6) and will surely improve profitability. Bork, a former student of
Director,29 worked out the efficiency doctrine.
According to the efficiency doctrine, improving cost efficiency benefits consumers and increases
welfare. Competition induces an efficient environment where, parallel to Darwin’s evolution theory,
only the best companies or the “fittest survive” (Stigler, 1982a). Thus, concentration (and market power)
is a natural consequence of competition and efficiency.30 Therefore, no government intervention is
needed (Bork, 1993). The debate is still ongoing.
The Chicago efficiency doctrine and the Harvard concentration doctrine
Source: own figure
29 Director was Milton Friedman’s brother-in-law, a former a student of Knight, a professor at Chicago’s Law School from
1946 and the founder of The Journal of Law and Economics (in 1958). He first introduced the efficiency criterion with statistics
and price theory to antitrust in order to serve consumers, not competing firms. Bork said: “He (Director) was the first one
anywhere to question the economics of antitrust as the courts developed it.” Later, Bork stated: “He gradually destroyed my
dreams of socialism with price theory” (New York Times, 2004). 30 Harberger (1954) was the first to measure welfare loss due to monopoly and he found it surprisingly low.
Chicago: efficiency doctrine
Competition
Efficiency
(Concentration)
Profitability
Harvard: concentration doctrine
Concentration
Market power
Profitability
Misallocation of resources
Government regulation
Efficiency Defense and Beyond
21
1.3.2 WHAT DOES EFFICIENCY MEAN?
Efficiency has become a buzzword in both academics and business since the Chicago School’s
efficiency doctrine. However, ‘efficiency’ takes various forms. This section explains the different
approaches to efficiency. To give a résumé of several efficiency approaches, this section describes
allocative, productive, dynamic and transactional efficiencies.
1.3.2.1 Productive efficiency
Productive efficiency, a term mostly used in business life, means producing with minimum average
total costs (ATC). In Scherer’s definition (ibid), in the long-run equilibrium, each firm sets prices, where
P=ATCmin. Scherer declared that competition leads to productive efficiency, which hinders firms from
earning a supra-profit and guarantees an equal income distribution between consumers and producers.
In their Neoclassical economics textbook, Samuelson and Nordhaus described productive efficiency:
when the economy is on its production-possibility frontier, it “cannot produce more of one good without
producing less of another” (1989, p. 28).
Independent from market structure, and if both allocative and productive efficiency criteria are satisfied,
Chicago School economists talk about wealth maximization. In Bork’s definition, the nation’s wealth
is “consumer” (meaning total) welfare.
The Chicago School approach to productive efficiency is not transparent. Bork defined overall
efficiency as allocative and productive efficiency. Though he wrote the following about the use of
resources inside a firm — “Efficiency alone is used, productive efficiency is meant“ (1993, p. 91) — it
is more than simply a technical or plant-level efficiency. Economies of scale, management skills,
minimum efficient size or specialization are only causes of efficiency. “It is any activity by a business
firm that creates wealth (…) that consumers are willing to pay for” (p. 104ff).
1.3.2.2 Allocative efficiency
Most academics talk about Pareto efficiency (or Neoclassical Pareto efficiency31) and define efficiency
as if nobody could be made better off without making someone else worse off. Perfect competition,
through its price system, efficiently allocates the resources. The process is also called allocative
efficiency (Nicholson & Snyder, 2010).
31 See Paul A. Samuelson’s or Hal Varian’s work. A modern application is in Nicholson and Snyder (2010). Neoclassical
economists suggest maximizing the sum of consumer and producer surplus, maximizing satisfaction or utility, given efficient
resource allocation, which can be the case only under perfect competition.
Efficiency Defense and Beyond
22
Posner (2007), a leading Chicago scholar, completed Pareto efficiency with the compensation
principle32 and argued that Kaldor and Hicks made the most popular interpretation of efficiency. Hicks
argued: “If a community were organized on the principle of making all alterations which were
improvements [in the efficiency sense], then, (…) almost all of them would be better off after the lapse
of a sufficient length of time” (Hicks, 1941, p. 111). Kaldor suggested that efficiency improvements
should be preferred in general, even if some people lose and are not compensated by the winners
(Scitovsky, 1951).
In Bork’s definition, allocative efficiency asks whether the resources in an economy are placed (i.e.,
allocated) in the way in which consumers most appreciate their output. The best solution employs all
input factors where the value of their marginal product is the highest. The problem of monopoly (and
merger or cartel) is not the higher price or the output restriction, but the misallocation of resources
(Bork, 1993).
Harvard professor Scherer (1970) also considered the costs and derived allocative efficiency from the
long-run equilibrium, where “the cost of producing the last unit of output — the marginal cost — is
equal to the price paid by consumers for that unit” (p. 13). Most microeconomic textbooks apply this
P=MC assumption.
1.3.2.3 Dynamic efficiency
Since the previously described approaches to efficiency have limitations in time, analysts may add
dynamic efficiency. As Motta characterized it, dynamic efficiency is “the extent to which a firm
introduces new products or processes of production …(…) …move the efficient frontier faster or further
forward” (2004, p. 55). Motta measured dynamic efficiency by measuring the incentives of innovation
and found that a firm in a competitive environment will innovate if the future profit is higher than the
fixed costs of innovation. Kolasky and Dick (2003, p. 247) classified dynamic efficiency as learning by
doing, research and development (R&D) and entrepreneurial creativity. However, there is a further
question: do large firms and monopolies encourage R&D and innovation or better competition?33
32 Chipman defines dynamic efficiency as follows: “when comparing two alternatives, one of the states constitutes an
improvement over the other (in the weak sense including equivalence) if it is possible for the gainers to compensate the losers
for their losses and still be at least as well off as in the original state “ (Eatwell et al., 1987, p. 524). 33 Arrow’s defense (1972) of the role of competition won him a Nobel Prize for his contribution to general equilibrium theory
in 1972 (when he was a Harvard professor). The idea of ‘creative destruction’ comes from the Austrian economist Joseph
Schumpeter. Heertje describes creative destruction like: “an essential process in capitalism, which refers to the incessant
mutation of the economic structure: destroying the old and creating a new. Schumpeter invented the phrase in 1942” (Eatwell
et al., 1987, p. 714). Schumpeter theorized that in order to protect firms from ‘too much’ competition, the protection of
ownership rights and provision of patents, copyrights, and licenses should be based on the view that innovation has to be
defended. Demsetz (1982, p. 32) noted the paradox of this policy: “Whereas the existence of (appropriate) trademark protection
is a barrier to greater production of known products, the absence (…) is a barrier to invention of new products.” Twenty-first
century economists still disagree about the role of market structure in enhancing innovation. Baker (2007a, p. 589) argued that
Efficiency Defense and Beyond
23
1.3.2.4 Transactional efficiency
New Industrial or Behavioral economists also consider a fourth kind of efficiency. Denying the
Neoclassical model of pure price mechanism in his early work, Coase (1937, p. 390) asserted that the
main matter of creating a firm is “the cost of using the price mechanism,” such as the costs of
information, marketing, negotiating and contracting. If the costs of these transactions are too high
(especially because of uncertainty in the market), it seems to be better to integrate them via long-run
contracts or even through vertical or horizontal integration. This concept is called transactional
efficiency.
Williamson (1981) drew attention to human imperfections, like bounded rationality and opportunism,
which make a transaction more risky and complicated. Thus, given uncertainty and the growing risk of
opportunism, firms have a high incentive to internalize. Contracting is important when there are semi-
special assets, while more specialization usually needs internalization. Common ownership should
diminish the costs when contracting becomes too risky.
Hovenkamp (2010a) writes that transaction cost analysis brought the Harvard and the Chicago Schools
closer together. By concerning itself with vertical restraints, tying, double marginalization, exclusive
dealing, resale price maintenance, exclusionary practices, predatory pricing, raising rivals cost,
foreclosure, price discrimination, joint ventures and mergers, transaction cost economics does not
assume that those arrangements are suspicious (like the Harvard School does). In contrast, it shows the
conditions under which they might be beneficial. On the other side, transaction cost economics also
rejects the Neoclassical and Chicago School arguments about free entry, flexible resource allocation or
human rationality. Hovenkamp summarized that: “The use of transaction cost economics in antitrust is
an exercise in examining conduct by reference to Coasean markets, while power is assessed by reference
to neoclassical markets” (ibid, p. 10).
Transactional efficiency is rarely applied in competition policy practice. One reason is that the line
between efficient and harmful contracting and bargaining is not clear; it can differ in every situation.
There is no general rule, like high concentration indices in the Harvard School or more or less the power
of free competition in the Classical, Neoclassical or Chicago Schools. As Hovenkamp wrote (ibid, p.
35): “As a result, the transaction costs of operating the legal system are necessarily higher.”
“antitrust is not a general-purpose competition intensifier”. Instead, it should merely focus on enforcing behavior and conduct,
which improve innovation. On the other side, Motta (2004, p. 57) highlighted the importance of structure and concluded that
“a monopoly (or a cartel) is worse than competitive market structures, because it fails to stimulate dynamic efficiency.”
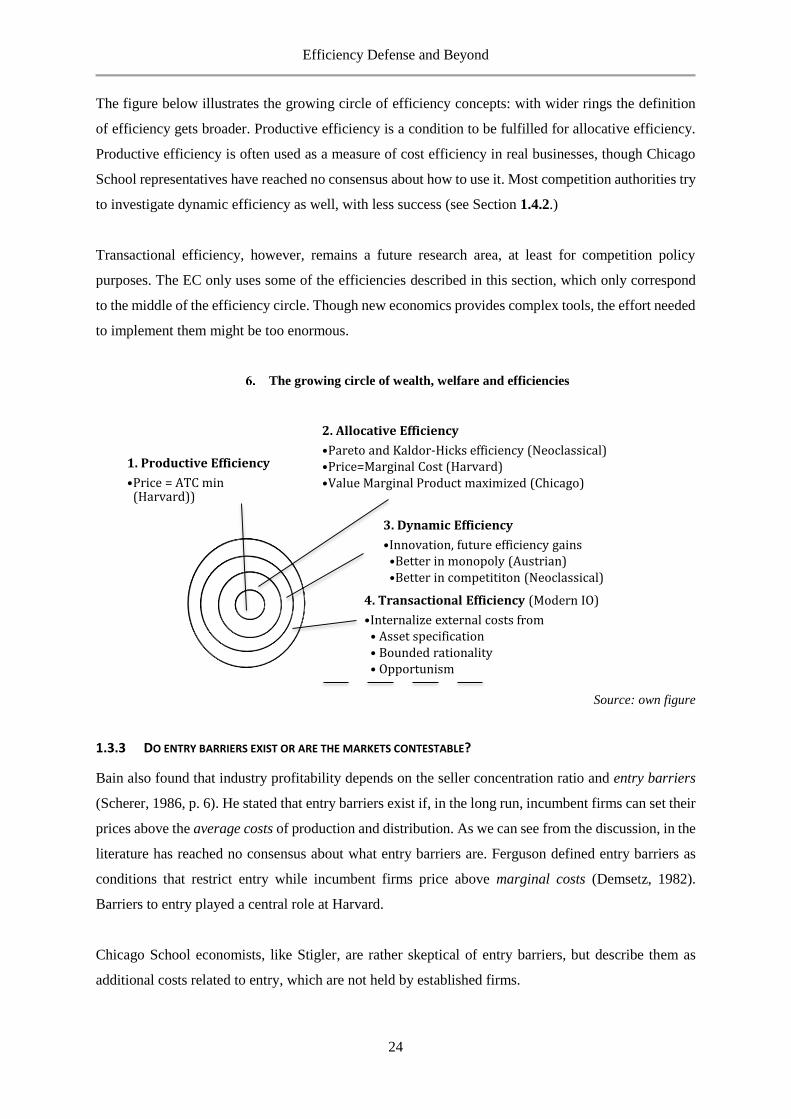
Efficiency Defense and Beyond
24
The figure below illustrates the growing circle of efficiency concepts: with wider rings the definition
of efficiency gets broader. Productive efficiency is a condition to be fulfilled for allocative efficiency.
Productive efficiency is often used as a measure of cost efficiency in real businesses, though Chicago
School representatives have reached no consensus about how to use it. Most competition authorities try
to investigate dynamic efficiency as well, with less success (see Section 1.4.2.)
Transactional efficiency, however, remains a future research area, at least for competition policy
purposes. The EC only uses some of the efficiencies described in this section, which only correspond
to the middle of the efficiency circle. Though new economics provides complex tools, the effort needed
to implement them might be too enormous.
The growing circle of wealth, welfare and efficiencies
Source: own figure
1.3.3 DO ENTRY BARRIERS EXIST OR ARE THE MARKETS CONTESTABLE?
Bain also found that industry profitability depends on the seller concentration ratio and entry barriers
(Scherer, 1986, p. 6). He stated that entry barriers exist if, in the long run, incumbent firms can set their
prices above the average costs of production and distribution. As we can see from the discussion, in the
literature has reached no consensus about what entry barriers are. Ferguson defined entry barriers as
conditions that restrict entry while incumbent firms price above marginal costs (Demsetz, 1982).
Barriers to entry played a central role at Harvard.
Chicago School economists, like Stigler, are rather skeptical of entry barriers, but describe them as
additional costs related to entry, which are not held by established firms.
2. Allocative Efficiency
•Pareto and Kaldor-Hicks efficiency (Neoclassical)•Price=Marginal Cost (Harvard)•Value Marginal Product maximized (Chicago)
1. Productive Efficiency
•Price = ATC min (Harvard))
3. Dynamic Efficiency
•Innovation, future efficiency gains•Better in monopoly (Austrian)•Better in competititon (Neoclassical)
4. Transactional Efficiency (Modern IO)
•Internalize external costs from• Asset specification• Bounded rationality• Opportunism
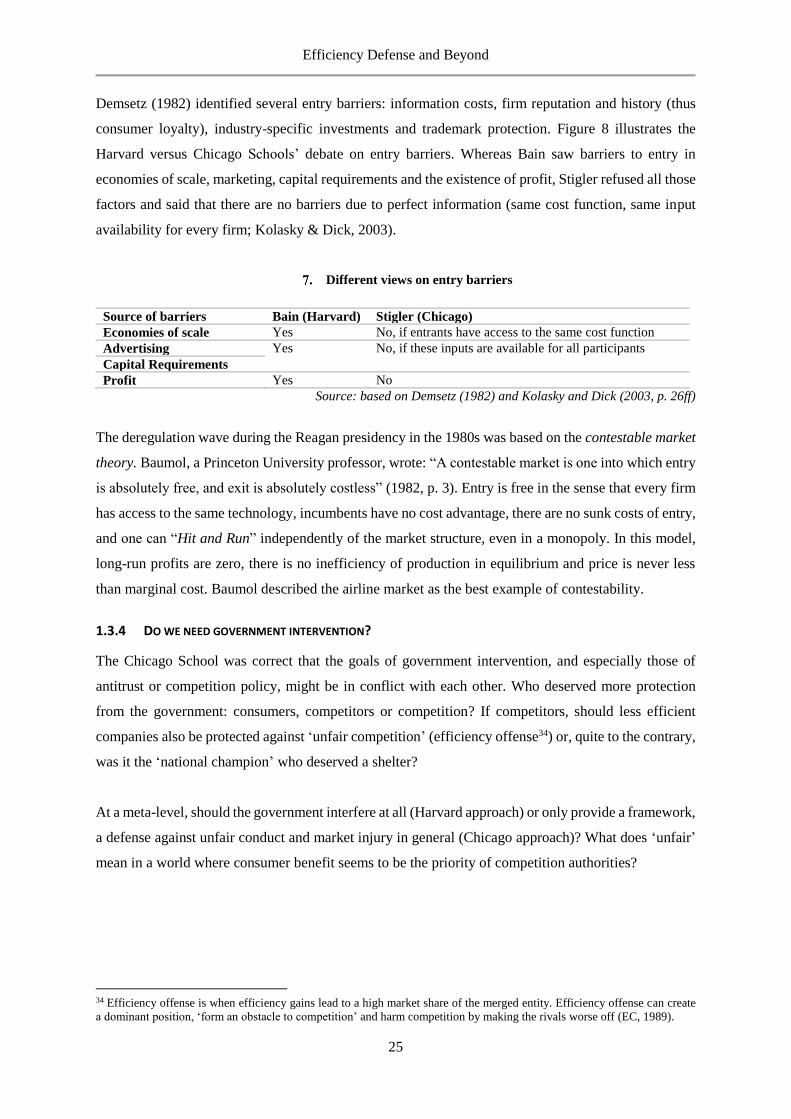
Efficiency Defense and Beyond
25
Demsetz (1982) identified several entry barriers: information costs, firm reputation and history (thus
consumer loyalty), industry-specific investments and trademark protection. Figure 8 illustrates the
Harvard versus Chicago Schools’ debate on entry barriers. Whereas Bain saw barriers to entry in
economies of scale, marketing, capital requirements and the existence of profit, Stigler refused all those
factors and said that there are no barriers due to perfect information (same cost function, same input
availability for every firm; Kolasky & Dick, 2003).
Different views on entry barriers
Source of barriers Bain (Harvard) Stigler (Chicago)
Economies of scale Yes No, if entrants have access to the same cost function
Advertising Yes No, if these inputs are available for all participants
Capital Requirements
Profit Yes No
Source: based on Demsetz (1982) and Kolasky and Dick (2003, p. 26ff)
The deregulation wave during the Reagan presidency in the 1980s was based on the contestable market
theory. Baumol, a Princeton University professor, wrote: “A contestable market is one into which entry
is absolutely free, and exit is absolutely costless” (1982, p. 3). Entry is free in the sense that every firm
has access to the same technology, incumbents have no cost advantage, there are no sunk costs of entry,
and one can “Hit and Run” independently of the market structure, even in a monopoly. In this model,
long-run profits are zero, there is no inefficiency of production in equilibrium and price is never less
than marginal cost. Baumol described the airline market as the best example of contestability.
1.3.4 DO WE NEED GOVERNMENT INTERVENTION?
The Chicago School was correct that the goals of government intervention, and especially those of
antitrust or competition policy, might be in conflict with each other. Who deserved more protection
from the government: consumers, competitors or competition? If competitors, should less efficient
companies also be protected against ‘unfair competition’ (efficiency offense34) or, quite to the contrary,
was it the ‘national champion’ who deserved a shelter?
At a meta-level, should the government interfere at all (Harvard approach) or only provide a framework,
a defense against unfair conduct and market injury in general (Chicago approach)? What does ‘unfair’
mean in a world where consumer benefit seems to be the priority of competition authorities?
34 Efficiency offense is when efficiency gains lead to a high market share of the merged entity. Efficiency offense can create
a dominant position, ‘form an obstacle to competition’ and harm competition by making the rivals worse off (EC, 1989).
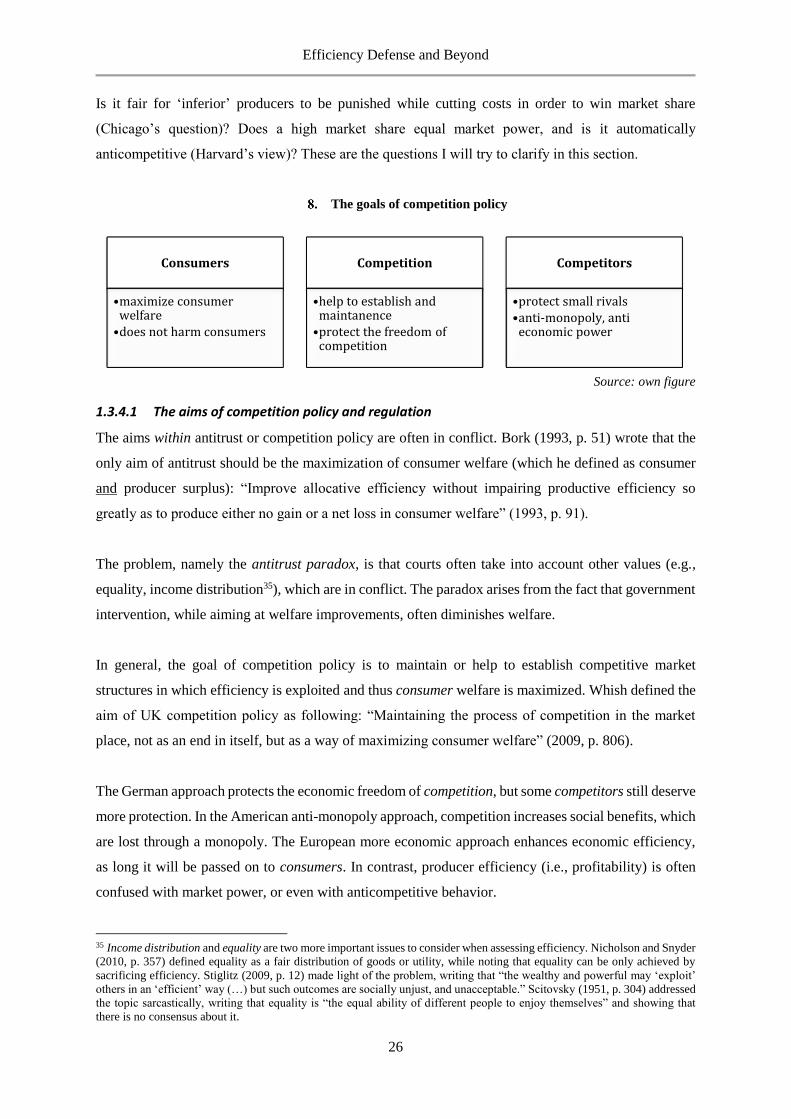
Efficiency Defense and Beyond
26
Is it fair for ‘inferior’ producers to be punished while cutting costs in order to win market share
(Chicago’s question)? Does a high market share equal market power, and is it automatically
anticompetitive (Harvard’s view)? These are the questions I will try to clarify in this section.
The goals of competition policy
Source: own figure
1.3.4.1 The aims of competition policy and regulation
The aims within antitrust or competition policy are often in conflict. Bork (1993, p. 51) wrote that the
only aim of antitrust should be the maximization of consumer welfare (which he defined as consumer
and producer surplus): “Improve allocative efficiency without impairing productive efficiency so
greatly as to produce either no gain or a net loss in consumer welfare” (1993, p. 91).
The problem, namely the antitrust paradox, is that courts often take into account other values (e.g.,
equality, income distribution35), which are in conflict. The paradox arises from the fact that government
intervention, while aiming at welfare improvements, often diminishes welfare.
In general, the goal of competition policy is to maintain or help to establish competitive market
structures in which efficiency is exploited and thus consumer welfare is maximized. Whish defined the
aim of UK competition policy as following: “Maintaining the process of competition in the market
place, not as an end in itself, but as a way of maximizing consumer welfare” (2009, p. 806).
The German approach protects the economic freedom of competition, but some competitors still deserve
more protection. In the American anti-monopoly approach, competition increases social benefits, which
are lost through a monopoly. The European more economic approach enhances economic efficiency,
as long it will be passed on to consumers. In contrast, producer efficiency (i.e., profitability) is often
confused with market power, or even with anticompetitive behavior.
35 Income distribution and equality are two more important issues to consider when assessing efficiency. Nicholson and Snyder
(2010, p. 357) defined equality as a fair distribution of goods or utility, while noting that equality can be only achieved by
sacrificing efficiency. Stiglitz (2009, p. 12) made light of the problem, writing that “the wealthy and powerful may ‘exploit’
others in an ‘efficient’ way (…) but such outcomes are socially unjust, and unacceptable.” Scitovsky (1951, p. 304) addressed
the topic sarcastically, writing that equality is “the equal ability of different people to enjoy themselves” and showing that
there is no consensus about it.
Consumers
•maximize consumer welfare
•does not harm consumers
Competition
•help to establish and maintanence
•protect the freedom of competition
Competitors
•protect small rivals•anti-monopoly, anti
economic power
Efficiency Defense and Beyond
27
This section takes a look behind the theory, searching for why the competition authorities are skeptical
of efficiencies. The Classical School of free competition and the Neoclassical price theory focus on
consumer satisfaction and efficiency, but are “silent about institutional arrangements, about adequate
policy rules. If competition is not feasible, regulation has to develop those institutional arrangements”
(Kahn, 1995, p. 17). If competition itself does not work, the government needs to make it work (i.e.,
with the help of market regulation).36
The differences between competition policy and regulation are as follows. First, regulation defines the
rules and imposes or controls prices, product choices and investments based on Principal-Agent models.
In contrast, competition policy assesses conduct and checks the lawfulness within an oligopoly
framework.
Second, regulation provides a continuous working framework (ex ante). Competition policy only comes
into force if serious problems appear (ex post) (Geroski, 2004, in Hüschelrath, 2009, p. 4).
Third, the strength of regulation is its reliance on superior expertise, based on quantitative evidence.
The advantage of competition policy is that it is more general, universal and independent, and
qualitative evidence plays an important role (but benchmarking is limited).
Fourth, therefore, the weakness of regulation is its limited commitment power, incentive problems and
the fact that regulation is sometimes captured by interest groups (Rey, 2003 and Motta, 2004). However,
merger control in Europe is a “quasi-regulatory process” since the EC must be notified before large-
mergers (Rey, 2003, p. 123).
1.3.4.2 Market failure and government failure
We talk about market failure when markets cannot allocate resources efficiently. In view of the lack of
perfect allocation, diverse economic schools (notably the Harvard School and the new IO) suppose
government intervention provides a better outcome.
With his pioneering work on the topic, Bator (1958) distinguished market failure from indivisibility,
public goods37 and nonappropriability.38 Current research first emphasizes the presence of asymmetric
information. Snyder and Nicholson (2008) differentiated between two classes of informational
problems: adverse selection and moral hazard.
36 Viscusi et al. (2005) and Baldwin and Cave (2008) both provide good introductions to regulatory issues. 37 Public goods are defined by their two attributes: nonexclusivity (exclusion of individuals from benefiting is very costly or
impossible) and nonrivalry (additional units have zero social marginal costs) (Snyder & Nicholson, 2008, p. 679). 38 “The inability of a producer of a good or a service physically to exclude users, or to control the rationing of his produce
among them” (Bator, 1958, p. 361).
Efficiency Defense and Beyond
28
While in the first case one party has limited information before signing the contract, in the second case
informational inequality appears during the contract. According to Arrow (1974), uncertainty is the
main problem behind modeling adverse selection and moral hazard.
Market failure becomes more complex if there are only a few companies in the market. Fritsch et al.
(2005) defined four market failures which violate the theory of perfect competition: imperfect
information, externalities, indivisibility and unstable market equilibrium. Indivisibility mainly refers to
resource capacity in network industries with decreasing average costs and thus economies of scope.
Indivisibility can lead to public goods, oligopoly or, in extreme cases, a (natural) monopoly39. Unstable
market equilibrium (or a lack of equilibrium) exists if the market has an over-demand or oversupply40
in the case of market inflexibility.41Williamson (1975) argued that market inefficiencies are based on
human behavior, especially bounded rationality and opportunism. Bounded rationality damages the
ability of people to analyze and handle difficult situations.
Bork questioned the need for regulation.42 “It is always possible to posit ‘market imperfections’ that
may result in markets working contrary to the predictions of economics. Those ‘imperfections’ are
typically ...both ingenious and imaginary. The result of reintroducing them into the law is lengthy trials
on baseless claims and with unpredictable outcomes. Many antitrust issues must be tried to a jury, but
economic impossibilities ought not be” (Bork, 1993, p. 438).
The Chicago School and Austrian School make many arguments against regulation.43 I will briefly
summarize the main reasons, based on government failures. First (1), regulation restricts competition.
As Kahn (1995), the ‘father of airline deregulation’ wrote: “The decision to regulate it, typically, a
decision also to restrict competition, not just to supplement it (…) but to supplant it” (p. 1). Second (2),
regulation is selective and protectionist, creating a lot of room for lobbyists. In other words, regulation
“chooses to serve the one by serving the other” (p. 13). Third (3), regulation rarely has incentives.
39 “Natural monopoly is a firm that has diminishing average cost over a broad range of output levels and can therefore supply
a good or service at a lower cost than could two or more firms” (Mankiw and Taylor, 2011, p. 311). 40 In both cases, there is no intersection of the demand and supply curves (e.g., a simultaneously perfectly inelastic (agricultural
market) or perfectly elastic demand and supply (Keynesian labor market)). See Fritsch et al. (2005, p. 327ff). 41 Such as overcapacity, strong price and quantity fluctuations or structural crises. 42 A middle path (limited state intervention) for the European airline industry provides an example. Fichert (2008) claims that
public goods and natural monopolies are both “fundamental” limits to competition (p.131). If barriers to entry exist, a natural
monopoly leads to inefficient allocation of resources, higher prices and reduced output. The paper criticized the current
regulatory forms for natural monopolies and stated that there had been “rather disappointing experiences with traditional
regulation schemes” (p.133). In addition, Fichert distinguished between “correctable” limits to competition and the described
fundamental failures (i.e., externalities). The problem with externalities is that when the market price does not involve the
costs or benefits provided to third parties, the allocation of resources is again inefficient. 43 See Starkie (2008) for a comprehensive approach to regulation and deregulation of the aviation industry.
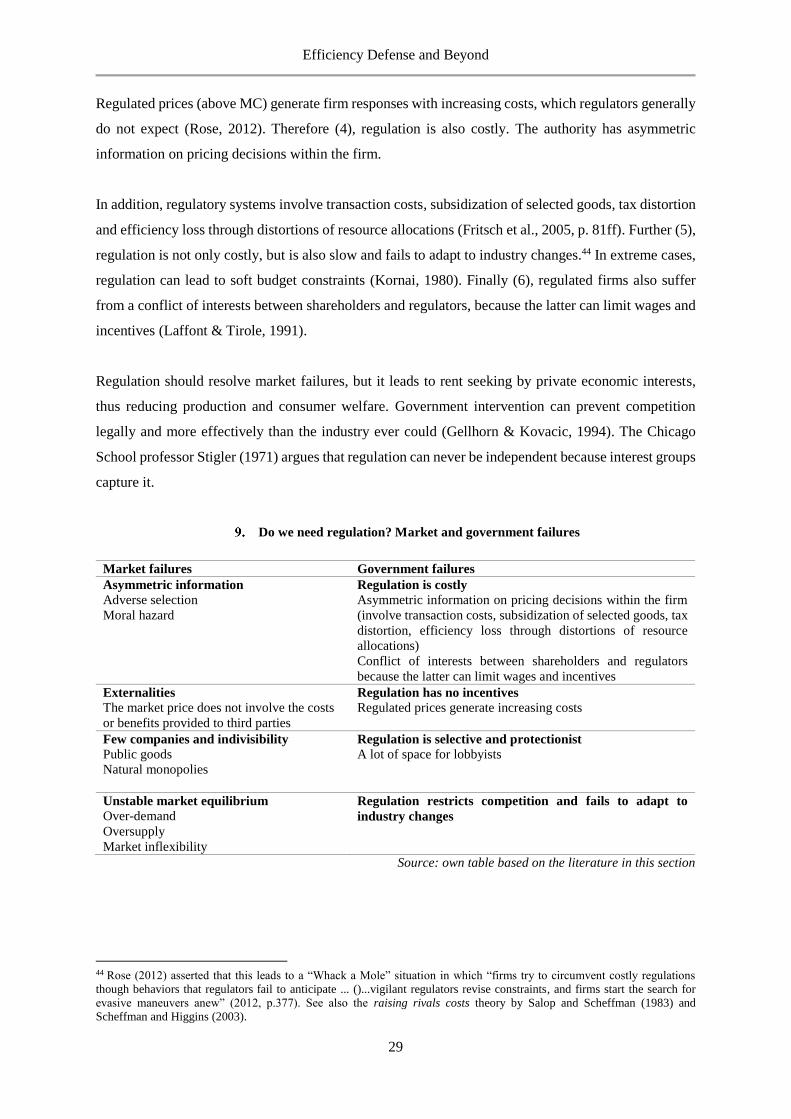
Efficiency Defense and Beyond
29
Regulated prices (above MC) generate firm responses with increasing costs, which regulators generally
do not expect (Rose, 2012). Therefore (4), regulation is also costly. The authority has asymmetric
information on pricing decisions within the firm.
In addition, regulatory systems involve transaction costs, subsidization of selected goods, tax distortion
and efficiency loss through distortions of resource allocations (Fritsch et al., 2005, p. 81ff). Further (5),
regulation is not only costly, but is also slow and fails to adapt to industry changes.44 In extreme cases,
regulation can lead to soft budget constraints (Kornai, 1980). Finally (6), regulated firms also suffer
from a conflict of interests between shareholders and regulators, because the latter can limit wages and
incentives (Laffont & Tirole, 1991).
Regulation should resolve market failures, but it leads to rent seeking by private economic interests,
thus reducing production and consumer welfare. Government intervention can prevent competition
legally and more effectively than the industry ever could (Gellhorn & Kovacic, 1994). The Chicago
School professor Stigler (1971) argues that regulation can never be independent because interest groups
capture it.
Do we need regulation? Market and government failures
Market failures Government failures
Asymmetric information
Adverse selection
Moral hazard
Regulation is costly
Asymmetric information on pricing decisions within the firm
(involve transaction costs, subsidization of selected goods, tax
distortion, efficiency loss through distortions of resource
allocations)
Conflict of interests between shareholders and regulators
because the latter can limit wages and incentives
Externalities
The market price does not involve the costs
or benefits provided to third parties
Regulation has no incentives
Regulated prices generate increasing costs
Few companies and indivisibility
Public goods
Natural monopolies
Regulation is selective and protectionist
A lot of space for lobbyists
Unstable market equilibrium
Over-demand
Oversupply
Market inflexibility
Regulation restricts competition and fails to adapt to
industry changes
Source: own table based on the literature in this section
44 Rose (2012) asserted that this leads to a “Whack a Mole” situation in which “firms try to circumvent costly regulations
though behaviors that regulators fail to anticipate ... ()...vigilant regulators revise constraints, and firms start the search for
evasive maneuvers anew” (2012, p.377). See also the raising rivals costs theory by Salop and Scheffman (1983) and
Scheffman and Higgins (2003).
Efficiency Defense and Beyond
30
Figure 10 above compares pros and cons of regulation: market failures versus government failures.
While followers of the Harvard School emphasize the role of market failures, Chicago School
economists generally highlight the importance of government failures and support deregulation.
The 1968, 1982 and 1984 US Merger Guidelines were introduced alongside the background discussions
on concentration versus (which) efficiency; entry barriers or contestable markets; and government
intervention or free market.45 The legislation used many Chicago School ideas, but still laid them on
oligopoly models. Blumenthal (2010) described the 1982 US Merger Guideline as “the seed from which
virtually all merger control around the globe has sprouted (…) moving steadily away from simplicity
and administrability and towards greater flexibility” (p. 2). Annex 8.1 provides an overview of the most
relevant merger regulations before 2000.
Since the US Merger Guidelines were introduced, efficiency-seeking mergers have become more
conventional across the world and a wave of mergers has begun. The liberal Chicago School philosophy
had arrived in Europe by the 1990s and challenged the institutions of competition policy, which had
traditionally been driven by Harvard School ideas. The next section will describe the differences
between the traditional and the Chicago School welfare standards and will explain why the EC cannot
apply the efficiency defense.
45 More recently, Fox (2012, p. 2159) highlighted the complexity of the different assumptions of competition policy and
refused the goal of maximizing consumer welfare, saying that: “antitrust law is not designed to make consumers as well off as
possible.” The operational aim is to “let business be free of antitrust unless its acts will decrease aggregate consumer surplus.”
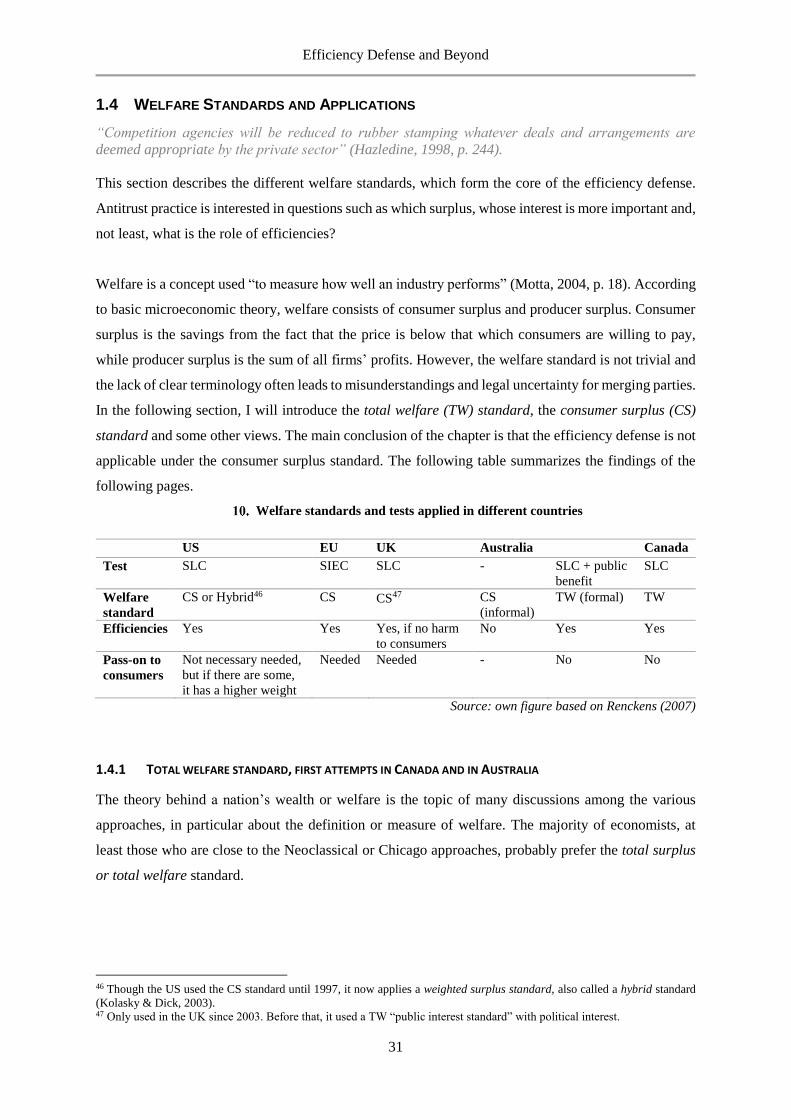
Efficiency Defense and Beyond
31
1.4 WELFARE STANDARDS AND APPLICATIONS
“Competition agencies will be reduced to rubber stamping whatever deals and arrangements are
deemed appropriate by the private sector” (Hazledine, 1998, p. 244).
This section describes the different welfare standards, which form the core of the efficiency defense.
Antitrust practice is interested in questions such as which surplus, whose interest is more important and,
not least, what is the role of efficiencies?
Welfare is a concept used “to measure how well an industry performs” (Motta, 2004, p. 18). According
to basic microeconomic theory, welfare consists of consumer surplus and producer surplus. Consumer
surplus is the savings from the fact that the price is below that which consumers are willing to pay,
while producer surplus is the sum of all firms’ profits. However, the welfare standard is not trivial and
the lack of clear terminology often leads to misunderstandings and legal uncertainty for merging parties.
In the following section, I will introduce the total welfare (TW) standard, the consumer surplus (CS)
standard and some other views. The main conclusion of the chapter is that the efficiency defense is not
applicable under the consumer surplus standard. The following table summarizes the findings of the
following pages.
Welfare standards and tests applied in different countries
US EU UK Australia Canada
Test SLC SIEC SLC - SLC + public
benefit
SLC
Welfare
standard
CS or Hybrid46 CS CS47 CS
(informal)
TW (formal) TW
Efficiencies Yes Yes Yes, if no harm
to consumers
No Yes Yes
Pass-on to
consumers
Not necessary needed,
but if there are some,
it has a higher weight
Needed Needed - No No
Source: own figure based on Renckens (2007)
1.4.1 TOTAL WELFARE STANDARD, FIRST ATTEMPTS IN CANADA AND IN AUSTRALIA
The theory behind a nation’s wealth or welfare is the topic of many discussions among the various
approaches, in particular about the definition or measure of welfare. The majority of economists, at
least those who are close to the Neoclassical or Chicago approaches, probably prefer the total surplus
or total welfare standard.
46 Though the US used the CS standard until 1997, it now applies a weighted surplus standard, also called a hybrid standard
(Kolasky & Dick, 2003). 47 Only used in the UK since 2003. Before that, it used a TW “public interest standard” with political interest.
Efficiency Defense and Beyond
32
Williamson (1968) described the TW standard, which has revolutionized antitrust thinking. His
intention was to balance the price effect with efficiencies from mergers or, in other words, to find the
trade-off between deadweight loss and cost saving. Under this standard, “a merger should be allowed
if it creates more wealth to producers than it destroys for consumers. Hence, distribution does not
matter” (Röller et al., 2000, p. 81).
The TW standard is used in Australia and in Canada. The competition authorities in those countries
consider consumer surplus (i.e., efficiencies from the merger versus producer surplus (profit increase
of merging firms and of other firms)) with the anticompetitive effects of a merger. However Lyons
(2003) doubts whether Australia, Canada or any major competitive authority can consistently apply the
TW standard. Reasons for this are outlined in the following section by looking at its country-specific
applications.
In Australia it is not mandatory to notify the competition authority about mergers, but a review is
highly recommended since mergers are prohibited if they substantially lessen (or are likely to lessen)
competition. The Australian Competition & Consumer Commission (ACCC) 48 carries out the
Substantive Lessening of Competition (SLC) test, but the Australian Competition Tribunal (ACT) can
still grant a clearance despite a positive SLC if the merger benefits the public.
There is an interesting difference concerning formal and informal merger reviews in Australia. The
most common informal review applies CS and requires that consumers benefit from the merger. The
formal review, in contrast, applies TW and considers efficiencies (Renckens, 2007).
This paradox of welfare standards arises because if merging firms apply for authorization, it is their
interest to provide evidence that the merger benefits the public. Thus they appeal to take TW into
account. Since the formal process is public and companies dislike publishing internal data, the TW
standard is rarely applied (Lyons, 2004).
Canada adopted the TW standard in its Competition Act in 1985, which is still valid. It aims to
“maintain and encourage competition in Canada in order to promote the efficiency (…) ensure that
small and medium-sized enterprises have an equitable opportunity (…) provide consumers with
competitive prices and product choices” (MoJ, 1985, p. 1).
48 The ACCC defines their role as “to protect, strengthen and supplement the way competition works in Australian markets
and industries to improve the efficiency of the economy and to increase the welfare of Australians” (ACCC, 2010). I would
like to thank Clare McGiness, Darrell Channing and Isabelle Arnaud for the interview at ACCC Melbourne on July 12, 2011.
Efficiency Defense and Beyond
33
The Competition Act states that after the Substantive Lessening of Competition (SLC) test, which is
based solely on concentration or market share (Sec. 92.(2)), is found to be positive, the tribunal shall
make an efficiency exception (Sec. 96.(1)) if the efficiency gains offset harms. Efficiency gains are
measured in real value of export or domestic substitution in imported goods (Sec. 93(3)).
1.4.2 CONSUMER SURPLUS STANDARD: EVIDENCE FROM THE UK
The consumer surplus approach is equal to the total welfare approach with zero weight to firms’ profits.
Thus, the TW approach considers:
𝑇𝑊 = 𝛼1𝐶𝑆 + 𝛼2𝑃𝑆
Where 𝛼1 + 𝛼2 = 1
𝐶𝑆 𝑠𝑡𝑎𝑛𝑑𝑎𝑟𝑑 = 𝑇𝑊 𝑠𝑡𝑎𝑛𝑑𝑎𝑟𝑑 𝑤𝑖𝑡ℎ 𝛼2 = 0
In the CS approach, in contrast to the TW standard, only efficiencies passed on to consumers matter.
Here, the distribution from the firm to the consumers plays a relevant role.
Although Motta (2004) prefers the TW approach, he summarized the arguments for the CS standard.
First, it can counterbalance the stronger lobby power of companies, or the regulatory capture, in advance
of consumers; second, it can reduce the authority’s asymmetric information on efficiency gains under
uncertainty. Lyons (2004, p. 252) made a third argument: the selection advantage of firms. This means
that firms “are likely to choose mergers that create negligible total welfare benefit – these would just
pass the total welfare standard and maximize profits.”
One could extend the reasoning of the CS approach with simple price theory and argue that because of
the diminishing marginal utility of money or the diminishing marginal rate of substitution, the more we
get from a good, the less we value an additional unit. Therefore, small ‘poor’ consumers value money
more than ‘rich’ shareholders. This idea leads us to the question of equity and income (re)distribution,
which are part of the SCP model.
Lyons (2003) further claimed that political interests also prefer the CS approach. Since there are more
people (i.e., more ‘voters’) who imagine themselves to be consumers than there are profit-receiving
stakeholders and politicians who want to maximize their votes, political interests behave to the
advantage of the majority. Lyons denied that CS would only be “looking for lost keys under a lamppost
because that is the only place where there is a light” (p. 4), but others have argued that the CS standard
simplifies decisions to the point of merely assessing the price effects (Werden’s point in Renckens,
2007).
Efficiency Defense and Beyond
34
The United Kingdom is a good example of the consumer surplus welfare standard. It has a long
tradition of registering restrictive trade practices without punishing them. Since the introduction of the
Competition Act in 1998, UK merger control has had more similarities with the ECMR. However, one
difference is that there is no obligation to announce a merger in the UK. Nevertheless, most firms
voluntarily notify the Office of Fair Trade (OFT)49 and hold pre-merger discussions. If there are serious
doubts concerning the merger, the OFT refers the case to the Competition Commission (CC) to apply
the SLC test (similar to a Phase II investigation in the EU). The CC “may also take into account any
relevant consumer benefits” (Whish, 2009, p. 889). The Competition Appeal Tribunal (CAT) then has
to review the decisions of both the OFT and the CC. Part 3 of the Enterprise Act 2002 defines the
current legal framework for mergers. The UK uses the SLC test with a clause stating that “mergers are
acceptable if they bring relevant consumer benefits” (Lyons, 2004, p. 261). Most countries (EU, UK
and the informal review in Australia) apply the CS standard, which requires that consumers benefit
from a merger.50
Table 12 summarizes the main features of TW and CS standards. The first difference is the goal of
competition policy. In the TW approach, competition policy should enhance economic efficiency, while
the CS standard aims to maintain competition. Maximizing welfare seems to be a secondary aim in both
approaches, and the term ‘welfare’ is treated differently. Misinterpreted and misleading terms and goals
are a source of problems. In my opinion, the goal of maximizing consumer welfare is absurd, since
there is no consensus about what consumer welfare is.51
The second difference is the attitude toward mergers. According to the TW standard, a merger should
be allowed if it creates more wealth for producers than it destroys for consumers, thus resulting in a
positive net benefit. To the contrary, in the CS approach, only mergers that increase consumer surplus
(or at least do not decrease it) should be cleared. Therefore, income distribution only plays a role under
the CS standard.
While market structure is still the basis of any antitrust analysis under the CS standard (see the SCP
paradigm), economists who prefer the TW analysis do not attach value to structure, and particularly
deny relevant market analysis (see Chapter 3).
49 The OFT has a high publicity obligation: the cases are published and need to describe consumer benefits. The Mergers
Group (with around 35-40 officers) is responsible for merger cases (Whish, 2009). 50 For airline-specific examples, see Morrison and Winston (1989), Brueckner and Pels (2005) and Barla and Constantatos
(2006). 51 Consumer welfare is mostly interpreted as consumer surplus. Writing consumer welfare, Bork however means aggregate or
total welfare, thus consumer surplus plus producer surplus. Werden (2011) compares the different meanings of the term
“consumer welfare” in US, EU and UK competition policy.
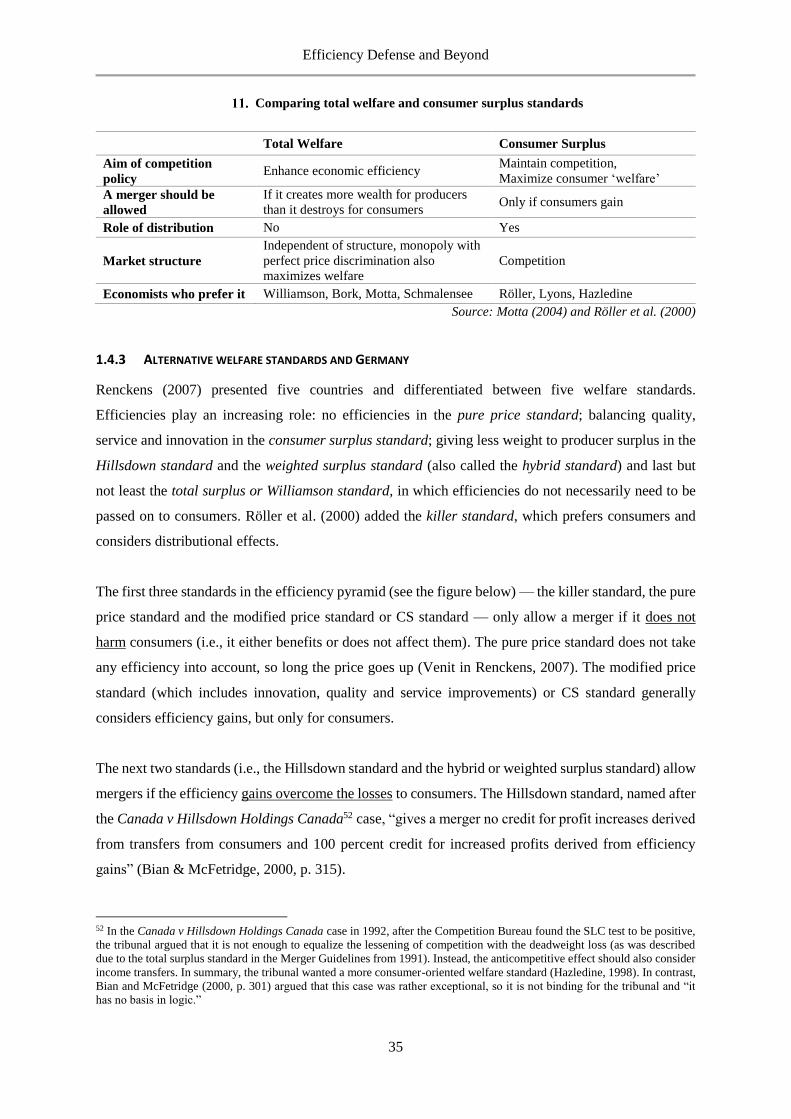
Efficiency Defense and Beyond
35
Comparing total welfare and consumer surplus standards
Total Welfare Consumer Surplus
Aim of competition
policy Enhance economic efficiency
Maintain competition,
Maximize consumer ‘welfare’
A merger should be
allowed
If it creates more wealth for producers
than it destroys for consumers Only if consumers gain
Role of distribution No Yes
Market structure
Independent of structure, monopoly with
perfect price discrimination also
maximizes welfare
Competition
Economists who prefer it Williamson, Bork, Motta, Schmalensee Röller, Lyons, Hazledine
Source: Motta (2004) and Röller et al. (2000)
1.4.3 ALTERNATIVE WELFARE STANDARDS AND GERMANY
Renckens (2007) presented five countries and differentiated between five welfare standards.
Efficiencies play an increasing role: no efficiencies in the pure price standard; balancing quality,
service and innovation in the consumer surplus standard; giving less weight to producer surplus in the
Hillsdown standard and the weighted surplus standard (also called the hybrid standard) and last but
not least the total surplus or Williamson standard, in which efficiencies do not necessarily need to be
passed on to consumers. Röller et al. (2000) added the killer standard, which prefers consumers and
considers distributional effects.
The first three standards in the efficiency pyramid (see the figure below) — the killer standard, the pure
price standard and the modified price standard or CS standard — only allow a merger if it does not
harm consumers (i.e., it either benefits or does not affect them). The pure price standard does not take
any efficiency into account, so long the price goes up (Venit in Renckens, 2007). The modified price
standard (which includes innovation, quality and service improvements) or CS standard generally
considers efficiency gains, but only for consumers.
The next two standards (i.e., the Hillsdown standard and the hybrid or weighted surplus standard) allow
mergers if the efficiency gains overcome the losses to consumers. The Hillsdown standard, named after
the Canada v Hillsdown Holdings Canada52 case, “gives a merger no credit for profit increases derived
from transfers from consumers and 100 percent credit for increased profits derived from efficiency
gains” (Bian & McFetridge, 2000, p. 315).
52 In the Canada v Hillsdown Holdings Canada case in 1992, after the Competition Bureau found the SLC test to be positive,
the tribunal argued that it is not enough to equalize the lessening of competition with the deadweight loss (as was described
due to the total surplus standard in the Merger Guidelines from 1991). Instead, the anticompetitive effect should also consider
income transfers. In summary, the tribunal wanted a more consumer-oriented welfare standard (Hazledine, 1998). In contrast,
Bian and McFetridge (2000, p. 301) argued that this case was rather exceptional, so it is not binding for the tribunal and “it
has no basis in logic.”
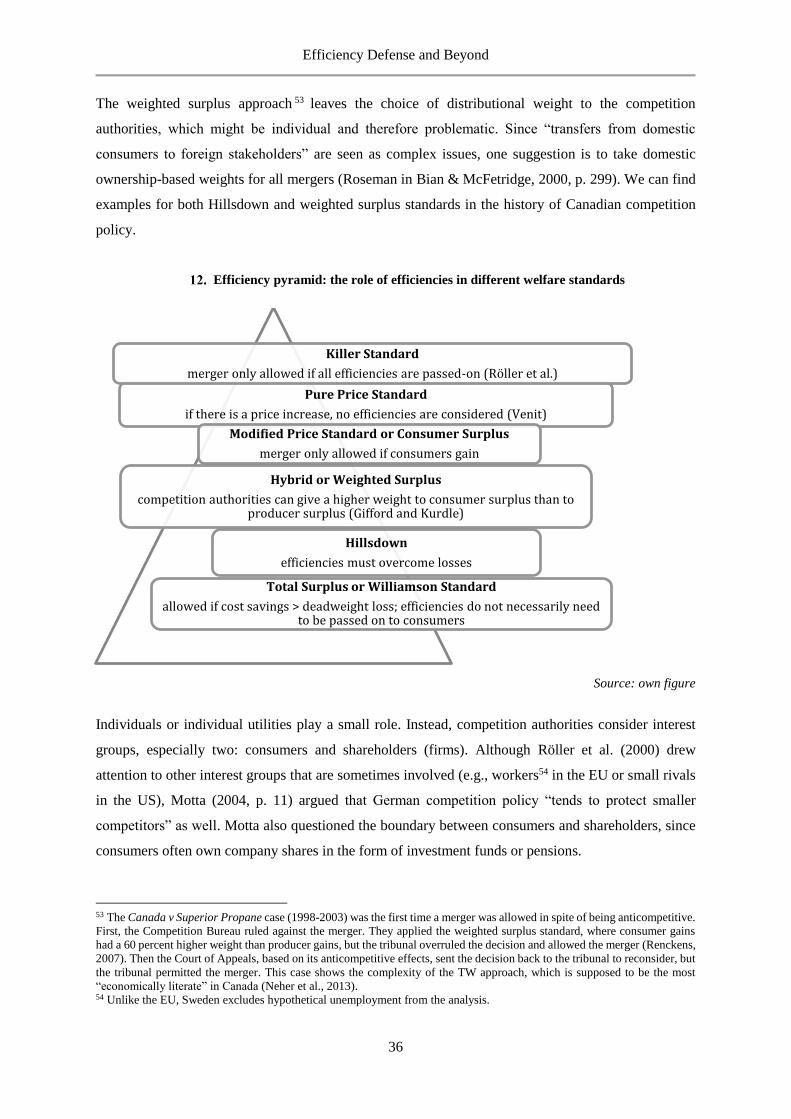
Efficiency Defense and Beyond
36
The weighted surplus approach 53 leaves the choice of distributional weight to the competition
authorities, which might be individual and therefore problematic. Since “transfers from domestic
consumers to foreign stakeholders” are seen as complex issues, one suggestion is to take domestic
ownership-based weights for all mergers (Roseman in Bian & McFetridge, 2000, p. 299). We can find
examples for both Hillsdown and weighted surplus standards in the history of Canadian competition
policy.
Efficiency pyramid: the role of efficiencies in different welfare standards
Source: own figure
Individuals or individual utilities play a small role. Instead, competition authorities consider interest
groups, especially two: consumers and shareholders (firms). Although Röller et al. (2000) drew
attention to other interest groups that are sometimes involved (e.g., workers54 in the EU or small rivals
in the US), Motta (2004, p. 11) argued that German competition policy “tends to protect smaller
competitors” as well. Motta also questioned the boundary between consumers and shareholders, since
consumers often own company shares in the form of investment funds or pensions.
53 The Canada v Superior Propane case (1998-2003) was the first time a merger was allowed in spite of being anticompetitive.
First, the Competition Bureau ruled against the merger. They applied the weighted surplus standard, where consumer gains
had a 60 percent higher weight than producer gains, but the tribunal overruled the decision and allowed the merger (Renckens,
2007). Then the Court of Appeals, based on its anticompetitive effects, sent the decision back to the tribunal to reconsider, but
the tribunal permitted the merger. This case shows the complexity of the TW approach, which is supposed to be the most
“economically literate” in Canada (Neher et al., 2013). 54 Unlike the EU, Sweden excludes hypothetical unemployment from the analysis.
Pure Price Standard
if there is a price increase, no efficiencies are considered (Venit)
Killer Standard
merger only allowed if all efficiencies are passed-on (Röller et al.)
Modified Price Standard or Consumer Surplus
merger only allowed if consumers gain
Hillsdown
efficiencies must overcome losses
Hybrid or Weighted Surplus
competition authorities can give a higher weight to consumer surplus than to producer surplus (Gifford and Kurdle)
Total Surplus or Williamson Standard
allowed if cost savings > deadweight loss; efficiencies do not necessarily need to be passed on to consumers
Efficiency Defense and Beyond
37
Germany has an alternative welfare standard other than the European Commission’s consumer surplus
standard. “German competition law is known to focus on protecting the competitive process, and not
primarily consumer interests” said Bernhard Heitzer, the former president of the German
Bundeskartellamt (2008, p. 3). Competition policy has its roots in the Freiburg School of Ordoliberalism
in Germany.55 A fellow of the school, Alfred Müller-Armack developed the concept of social market
economy, which was the basis for rebuilding the German economy after the Second World War
(Vanberg, 2011).
The social market economy is based on protecting competition economic freedom. Freedom also means
freedom of contracting (e.g., price agreements and cartels). Although the US did not allow these sorts
of contracts, they were permitted in Germany until the first competition law came into force in 1958
(Motta, 2004). Kühn (1997) and Motta (2004, p.10) noted that by 1923 there were around 1,500 cartels
in Germany, which served as ‘national champions’. During the Second World War, it was usual to
create compulsory cartels in order to control industry and outperform foreign companies.
The German competition law (Gesetz gegen Wettbewerbsbeschränkungen, GWB of 1957) was finally
modified to conform to the EC law in 2005. While the EC increasingly focuses on low prices and
consumer surplus, Germany assumes consumer benefits are an “unpredictable process of competition”
(Heitzer, 2008, p. 4) and also addresses longer-term factors related to product choice, quality and
invention.
Above a certain revenue rate,56 firms that wish to merge need to apply at the Bundeskartellamt (the
German competition authority) for authorization. However, § 42 of the GWB allows the possibility of
direct ministerial admission, if the “social economic gains” overcome the competitive harms or if the
merger serves the “public interest.” This exceptional regulation highlights the lack of transparency in
policy and the complexity of different macroeconomic aims at different levels of governmental
interventions. It also raises the critique that “the Bundeskartellamt fails to continuously consider
consumer and consumer welfare as the relevant standard” (Budzinski & Wacker, 2007, p. 303). Knieps
(2008) and Kühn (1997) provide good overviews of German competition policy.
55 In 1962, Hayek also joined the University of Freiburg, after spending 12 years at the University of Chicago. Thus, Hayek
was a representative of the Austrian School, the Chicago School and the Freiburg School as well, although his work was
largely neglected until he received the Nobel Prize in 1974. Kay wrote that Hayek was isolated and “in Hayek’s mind his
opponents are usually not just wrong, but mentally and morally defective” (Kay, 2004, p. 185). 56 €500m international together, €25m in Germany.
Efficiency Defense and Beyond
38
1.5 MORE, BUT WHICH ECONOMIC APPROACH? WILLIAMSON’S EFFECT ON EC MERGER
POLICY
“The information needed by the optimizer is not provided by an existing market. It will be provided by
a market which will exist in the future, but that is a bit too late to help in decisions made today” (Arrow,
1974, p. 6).
European competition policy is supposed to consider efficiencies, but the EC cannot yet apply the
efficiency defense. This section describes the limitation of Williamson’s model (see Figure 1) generally
and in Europe specifically. The main barrier to implementing an efficiency defense is the consumer
surplus standard. Under the CS standard, a merger will reduce ‘consumer welfare’ since higher prices
will lessen the consumer surplus. Proponents of the CS standard would reject a merger even if the TW
effect is positive, but the profit (producer surplus) gain is higher than the consumers’ lost surplus. Thus,
as long as the EC applies the CS standard, we cannot talk about an efficiency defense in Williamson’s
sense.
Williamson (1968) suggested using a TW standard, but also took other factors (i.e., income distribution)
into account. In Bork’s ‘consumer welfare’ model, everybody is a consumer in a certain manner; thus
this TW model does not consider income distribution, since it is only a shift among two consumer
classes. Bork expressed the opinion that income distribution “should be completely excluded” from
antitrust (1993, p. 111). Compensation or income distribution should not be considered (that is the task
of the tax system). Shavell (2004) argued that antitrust could consider morality, but its weighting is
challenging.
Williamson’s model (1968) has some basic limitations. First, the model presumes there are constant
average cost (AC) functions, but economies of scale are only available at a diminishing AC. Second,
while only illustrating AC, the paper differentiated between fixed and variable cost savings. Thus,
according to the paper, it is not enough to have immediate cost reductions, which could have been
realized anyway. Since immediate cost savings probably come from fixed cost savings (i.e.,
suspension), it would be more appropriate to use marginal costs (MC) instead of AC. Indeed, Farrell
and Shapiro (1990) extended Williamson’s model57 and found that larger firms generally have more
incentives and should be allowed to merge.
57 The study by Farrell and Shapiro (1990) used a Cournot oligopoly with homogeneous goods. The paper developed the net
externality effect on rival firms and consumers. If the non-participant firms are large, they could exploit their markup and
expand capacity, thus increasing total output. In this case, a merger might raise welfare by output shifting. Therefore, an
increase in concentration might result in better performance and is not necessarily bad, but the more concentrated an industry
is, the more likely is a collusion with negative external effects. The authors argued that both anticompetitive effects and
efficiency should always be proved, but “small firms should generally be allowed to merge” (Farrell & Shapiro, 1990, p. 124).
Efficiency Defense and Beyond
39
There are several more problems with the Chicagoan efficiency approach.58 The new direction of
antitrust economics research is difficult to conduct in practice for several reasons. First, Williamson
already drew attention to the fact that “courts do not possess the expertise” (1968, p.34), so judges do
not feel comfortable with the complexity of qualifications used. It is impossible to quickly understand,
follow and apply Williamson’s model in a courtroom. Second, there is a lack of reliable data and/or
time to collect it (Gellhorn & Kovacic, 1994, p. 89). Therefore, simple methods are needed. This
explains the popularity of using concentration data. In the words of Scherer, who criticized the courts:
“…they adopt the ‘do nothing’ approach to their jobs” (2008, p. 37). However, Scherer agreed that the
data and the empirical methodologies are often unsatisfactory.
The more complex IO research becomes, the more difficult it is to adjust the law and focus on the
extended, sometimes paradoxical, welfare goal of antitrust policy. Thus, the higher the gap between
law and economics, the more complicated the understanding and cooperation need to be between
lawyers and economists. It seems to be a vicious cycle that the more economists work on antitrust
models, the more complex they become and the more probable it becomes that they will be refused by
the court.
As a consequence, a third source of dissatisfaction is accepting deals (Budzinski & Kuchinke, 2012).
Legal uncertainty from misunderstood terminologies is a further problem. While the aim of competition
policy seems to be maximizing consumer welfare, the different terminologies on welfare, the various
policy perspectives and assumptions on competition and markets result in at least three different welfare
standards.
Chicago economists and academics close to the Austrian School and Schumpeter’s view on R&D and
innovation generally argue for an efficiency defense. However, there have been very few cases59 where
the efficiency defense has been implemented worldwide. In looking for an efficiency defense, Klumpp
(2005, p. 256) compared merger policies in the US, Germany and the EC. He found no evidence of an
efficiency defense in the German or European policies, and concluded that also in the US, the call for
an efficiency defense was a reaction to the strict merger-refusing policy of the 1960s.
58 Kay (2004, p. 185) claimed that Chicago, as the center of conservative economic thought, was responsible for “various neo-
liberal experiments in South-America and New Zealand.” He argued that Chicagoans were focused on the insistence on
rationality and did not want to believe in market failures. Chicago economists ‘economized’ everything; in the Chicagoan
Journal of Political Economy (which is the number two economic scientific journal, just after the American Economic Review)
one can find articles about the economics of crime, language, family, suicide and even brushing your teeth (Kay, 2004). 59 In Canada, the Competition Tribunal successfully applied the efficiency defense in the Superior Propane case, which was
allowed despite its resulting in local monopolies and price increases. The Federal Court of Appeal claimed the wealth transfer
from consumers to producers had no results (ICN, 2006).
Efficiency Defense and Beyond
40
The EC’s more economic approach is supposed to fill the gap between US antitrust and EC competition
policy and to strengthen the EC’s position against the European courts. Without legal certainty on the
basic welfare standard and accepted type of efficiencies, however, the new approach cannot help the
EC Commission to “be the winner of the law-making game” (van den Bergh, 2007, p. 28). In summary,
antitrust today represents more a “somewhat chastised Harvard School than of any traditional version
of the Chicago School” (Hovenkamp, 2010b, p. 8). For European competition policy, Chicago beliefs
on efficiency are even further away. The pluralist tradition of European competition policy makes the
convergence even more difficult.
Because of the legal uncertainty around welfare and efficiencies, the EC’s approach toward measuring
efficiencies is very similar to the US debate from the 1960s. At that time, Bork said: “Economic analysis
does away with the need to measure efficiencies directly. It is enough to know in what sorts of
transactions efficiencies are likely to be present and in what sorts anticompetitive effects are likely to
be present” (in Williamson, 1968, p. 5).
Efficiency Defense and Beyond
41
1.6 CONCLUSIONS
Chapter 1 investigated the question of which economic theories provide the most appropriate tools and
the most suitable analytical framework for assessing market power and efficiency within merger
control. Section 1.2 introduced the main economic schools behind antitrust policy and found that while
the Chicago School challenged US antitrust policies in the 1970s, the influence of the Harvard School
has remained dominant until today. The Harvard approach, while protecting consumers, emphasizes
concentration as a sign of market power. The Chicago view sees concentration as evidence of efficiency
and would therefore promote it.
Section 1.3 derived the main syntheses on competition policy from the Harvard vs. Chicago battle. It
contrasted concentration with the efficiency doctrine and entry barriers with contestable markets, and
discussed the need for governmental intervention. The main finding here is that because of the
complexity of competition policy aims, consumers interest is often preferred to efficiency. Section 1.4
compared different welfare standards and efficiency concepts and found that the main obstacle to
introducing an efficiency defense is the unclear definition of welfare with a weight on the consumer
side. Williamson’s efficiency trade-off model is only applicable under the TW standard, where welfare
transfer from consumers to producers is allowed. Canada was the first nation to implement the
efficiency defense.
Section 1.5 focused on the application of an efficiency defense in Europe. The EC has rejected the TW
standard and instead focuses on protecting ‘consumer welfare’ in the frame of the CS standard. As long
as the EC applies the CS standard, there is no application of efficiency defense in Williamson’s sense.
The ECMR (2004) only allows efficiency considerations if they are not in conflict with harming
consumers by a potential price increase. The merger guidance prescribes that efficiencies must be
merger-specific, verifiable and beneficial to consumers.
The next chapters will show the efficiency trade-off in practice (Chapter 2) as well as which economic
models the EC merger policy could (Chapter 3) and do apply (Chapter 4, introducing the current
framework). The rest of the work focuses on airline mergers in Europe. Chapter 5 assesses the
performance of aviation in general and answers the question of whether there is room for efficiency
improvement, in particularly by takeovers. Chapters 6 and 7 analyze Lufthansa mergers from 2005 and
2009 and focus on entry to relevant markets, price- and output development and efficiency (synergy)
effects.
Efficiency Trade-off in Practice: The European Commission
42
2 EFFICIENCY TRADE-OFF IN PRACTICE: THE EUROPEAN COMMISSION
“Unfortunately, these ‘positive’ economic advantages of hub and spoke networks never get passed
through to consumers. They have been immediately leveraged with anticompetitive actions to increase
and exploit market power by incumbents dominating hubs” (Cooper, 2011, p. 2).
2.1 INTRODUCTION
The EC took the first steps toward a more economic approach, thus a more flexible rule of reason
approach, which tries to take efficiency into account. The question is whether the move toward a more
relaxed, laissez-faire Chicago approach has resulted in a softer merger control regime. This chapter
discusses the rationale for the European competition authorities’ new approach toward efficiency,
particularly in airline merger decisions.
In Europe, following the US and the global trend, liberalization and the sudden appearance of low-cost
carriers have inevitably led to airline takeovers and mergers. The global economic crisis is expected to
create further consolidation. While some industry observers and managers welcome this development,
competition authorities, and in particular the EC, are concerned that a change toward a more
concentrated market structure might reduce competition and consumer welfare. At the same time,
efficiency claims, particularly for competition policy approval, seem to achieve a growing importance.
As introduced in Chapter 1, the EC’s merger policy is similar to the Harvard approach. Decisions about
a merger are usually based on its potential anticompetitive effects, but they are used to refuse potential
efficiency gains. The EC has been rather skeptical toward efficiency gains from mergers, because real
efficiency gains are often too complex to measure (see Chapter 3), while there is a broad literature on
the real anticompetitive effects of mergers.
This chapter shows that efficiencies from mergers probably exist, but these efficiencies, in the presence
of market power, are not going to be passed through to consumers. Efficiencies do not result in cheaper
ticket prices, but might improve quality and variety.
Section 2.2 will revisit the literature on efficiency gains in different stages of airline cooperation, while
Section 2.3 will explain their limitations (i.e., why the EC did not consider efficiencies). Section 2.4
will describe my conclusions.
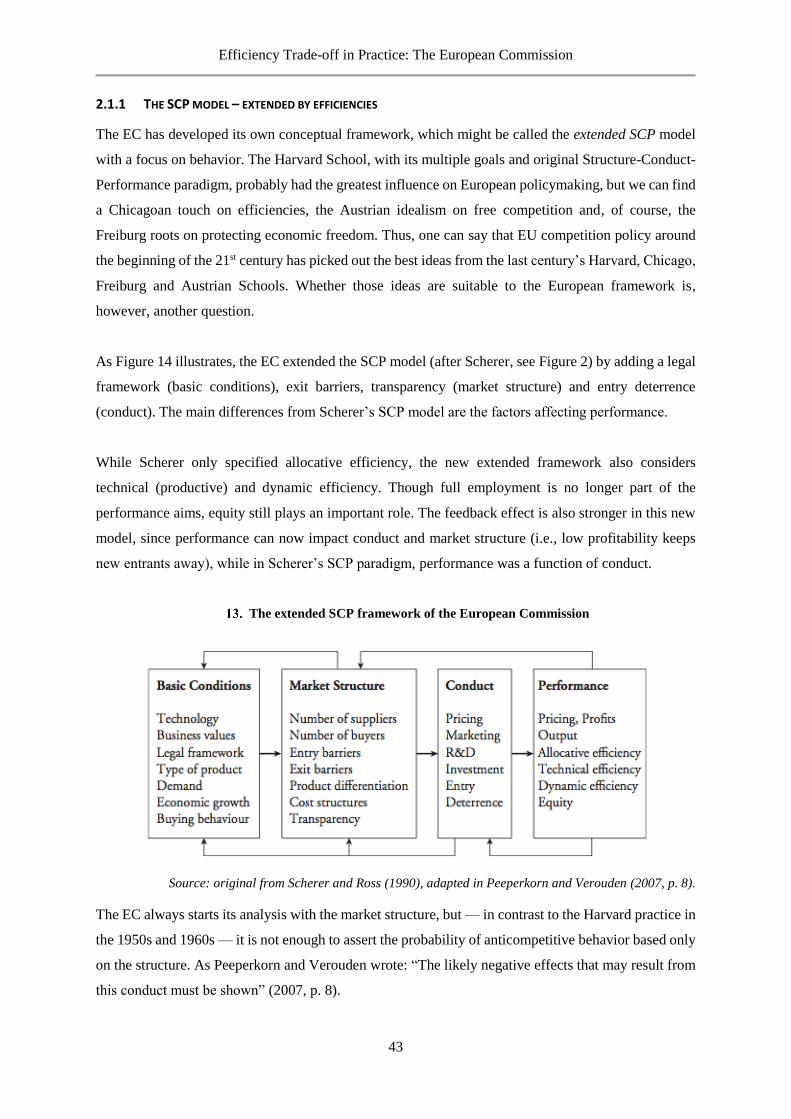
Efficiency Trade-off in Practice: The European Commission
43
2.1.1 THE SCP MODEL – EXTENDED BY EFFICIENCIES
The EC has developed its own conceptual framework, which might be called the extended SCP model
with a focus on behavior. The Harvard School, with its multiple goals and original Structure-Conduct-
Performance paradigm, probably had the greatest influence on European policymaking, but we can find
a Chicagoan touch on efficiencies, the Austrian idealism on free competition and, of course, the
Freiburg roots on protecting economic freedom. Thus, one can say that EU competition policy around
the beginning of the 21st century has picked out the best ideas from the last century’s Harvard, Chicago,
Freiburg and Austrian Schools. Whether those ideas are suitable to the European framework is,
however, another question.
As Figure 14 illustrates, the EC extended the SCP model (after Scherer, see Figure 2) by adding a legal
framework (basic conditions), exit barriers, transparency (market structure) and entry deterrence
(conduct). The main differences from Scherer’s SCP model are the factors affecting performance.
While Scherer only specified allocative efficiency, the new extended framework also considers
technical (productive) and dynamic efficiency. Though full employment is no longer part of the
performance aims, equity still plays an important role. The feedback effect is also stronger in this new
model, since performance can now impact conduct and market structure (i.e., low profitability keeps
new entrants away), while in Scherer’s SCP paradigm, performance was a function of conduct.
The extended SCP framework of the European Commission
Source: original from Scherer and Ross (1990), adapted in Peeperkorn and Verouden (2007, p. 8).
The EC always starts its analysis with the market structure, but — in contrast to the Harvard practice in
the 1950s and 1960s — it is not enough to assert the probability of anticompetitive behavior based only
on the structure. As Peeperkorn and Verouden wrote: “The likely negative effects that may result from
this conduct must be shown” (2007, p. 8).
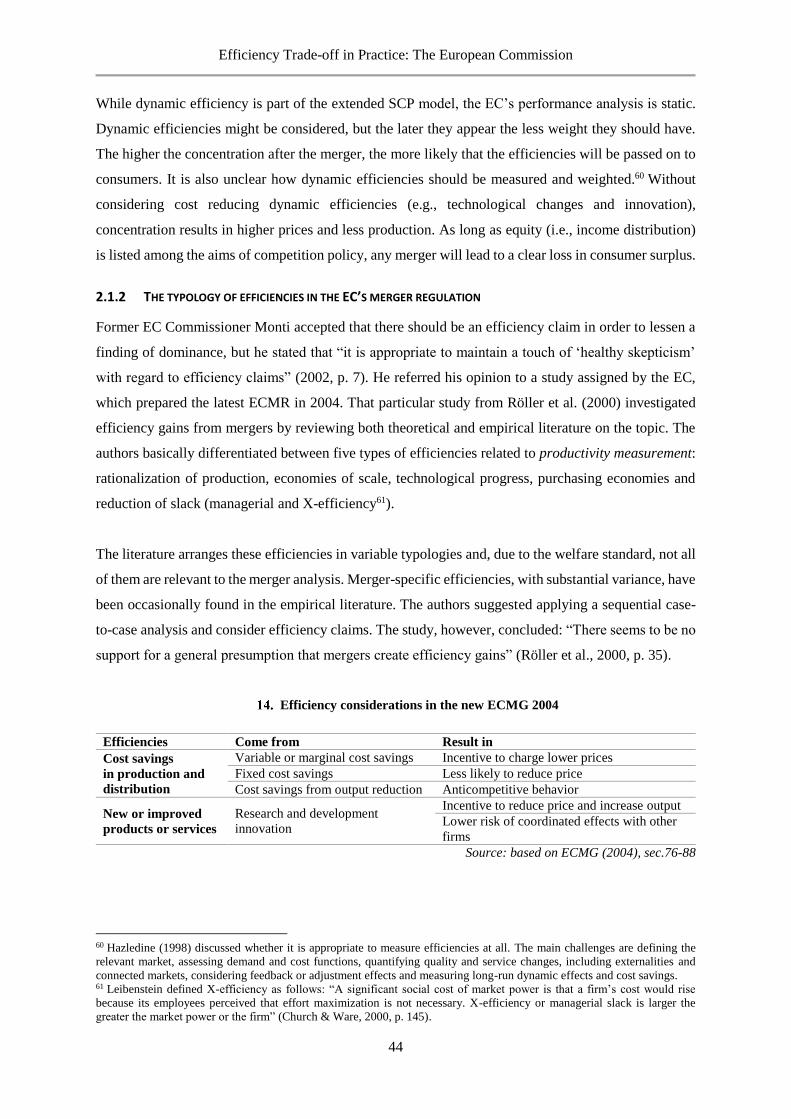
Efficiency Trade-off in Practice: The European Commission
44
While dynamic efficiency is part of the extended SCP model, the EC’s performance analysis is static.
Dynamic efficiencies might be considered, but the later they appear the less weight they should have.
The higher the concentration after the merger, the more likely that the efficiencies will be passed on to
consumers. It is also unclear how dynamic efficiencies should be measured and weighted.60 Without
considering cost reducing dynamic efficiencies (e.g., technological changes and innovation),
concentration results in higher prices and less production. As long as equity (i.e., income distribution)
is listed among the aims of competition policy, any merger will lead to a clear loss in consumer surplus.
2.1.2 THE TYPOLOGY OF EFFICIENCIES IN THE EC’S MERGER REGULATION
Former EC Commissioner Monti accepted that there should be an efficiency claim in order to lessen a
finding of dominance, but he stated that “it is appropriate to maintain a touch of ‘healthy skepticism’
with regard to efficiency claims” (2002, p. 7). He referred his opinion to a study assigned by the EC,
which prepared the latest ECMR in 2004. That particular study from Röller et al. (2000) investigated
efficiency gains from mergers by reviewing both theoretical and empirical literature on the topic. The
authors basically differentiated between five types of efficiencies related to productivity measurement:
rationalization of production, economies of scale, technological progress, purchasing economies and
reduction of slack (managerial and X-efficiency61).
The literature arranges these efficiencies in variable typologies and, due to the welfare standard, not all
of them are relevant to the merger analysis. Merger-specific efficiencies, with substantial variance, have
been occasionally found in the empirical literature. The authors suggested applying a sequential case-
to-case analysis and consider efficiency claims. The study, however, concluded: “There seems to be no
support for a general presumption that mergers create efficiency gains” (Röller et al., 2000, p. 35).
Efficiency considerations in the new ECMG 2004
Efficiencies Come from Result in
Cost savings
in production and
distribution
Variable or marginal cost savings Incentive to charge lower prices
Fixed cost savings Less likely to reduce price
Cost savings from output reduction Anticompetitive behavior
New or improved
products or services
Research and development
innovation
Incentive to reduce price and increase output
Lower risk of coordinated effects with other
firms
Source: based on ECMG (2004), sec.76-88
60 Hazledine (1998) discussed whether it is appropriate to measure efficiencies at all. The main challenges are defining the
relevant market, assessing demand and cost functions, quantifying quality and service changes, including externalities and
connected markets, considering feedback or adjustment effects and measuring long-run dynamic effects and cost savings. 61 Leibenstein defined X-efficiency as follows: “A significant social cost of market power is that a firm’s cost would rise
because its employees perceived that effort maximization is not necessary. X-efficiency or managerial slack is larger the
greater the market power or the firm” (Church & Ware, 2000, p. 145).
Efficiency Trade-off in Practice: The European Commission
45
The table above shows that only cost savings from variable or marginal cost savings are accepted, since
only these costs may motivate firms to lower prices. Mergers could improve competitiveness, increase
growth and raise the living standard. The most important criterion is that consumers on the relevant
market must not be worse off after the merger.
The European Council Merger Guidance (ECMG, 2004, p. 13) further describes the conditions of
efficiency implementation: “efficiencies have to benefit consumers, be merger-specific and be
verifiable.” Merger-specific means that other, less anticompetitive forms of cooperation cannot achieve
these efficiencies. The notifying parties need to inform the EC about the (possible quantified) efficiency
gains and the clear impact on consumers. The EC may verify that the claims are based upon internal
documents and external studies.
The ICN (2006, p. 61) also affirmed that authorities are generally skeptical of efficiency claims, which
are the “most speculative single element of merger review.” The study specified efficiencies from
variable or marginal cost savings, better capacity utilization, economies of scale and scope, network
effects, product quality and R&D complementarity. Producer efficiencies are usually not taken into
account, since most countries apply the CS standard and “protect consumers against a loss of consumer
welfare” (p. 63). Self-assessment is difficult, because firms have asymmetric information (which is
sometimes too optimistic) on the possible efficiencies.
As a result of the discussion about efficiencies, the new European Council Merger Regulation (ECMR,
2004) takes efficiencies into account on a voluntary basis.62 “It is possible that the efficiencies brought
about by concentration counteract the effects on competition, and in particular the potential harm to
consumers, that it might otherwise have” (sec 29). It seems that even if a merger could harm consumers,
it can be cleared based on large enough efficiency gains. Therefore, it seems that there is an efficiency
defense in European merger control.
The ECMR (2004) is, however, limited on the efficiency defense. It only allows efficiency
considerations if they are not in conflict with harm to consumers caused by a potential price increase.
However, if there is no fear of harming consumers or competition, no policy intervention is needed. In
contrast, the idea from Williamson and later the Chicago School was a counterbalance between price
increases and cost savings from an efficiency increase. This is definitely not the case in Europe or the
US.
62 “Failure to provide information on efficiencies will not be taken to imply that the proposed concentration does not create
efficiencies or that the rationale for the concentration is to increase market power. Not providing the requested information on
efficiencies at the notification stage does not preclude providing the information at a later stage. However, the earlier the
information is provided, the better the Commission can verify the efficiency claim” (EC, 2009, p. 65).
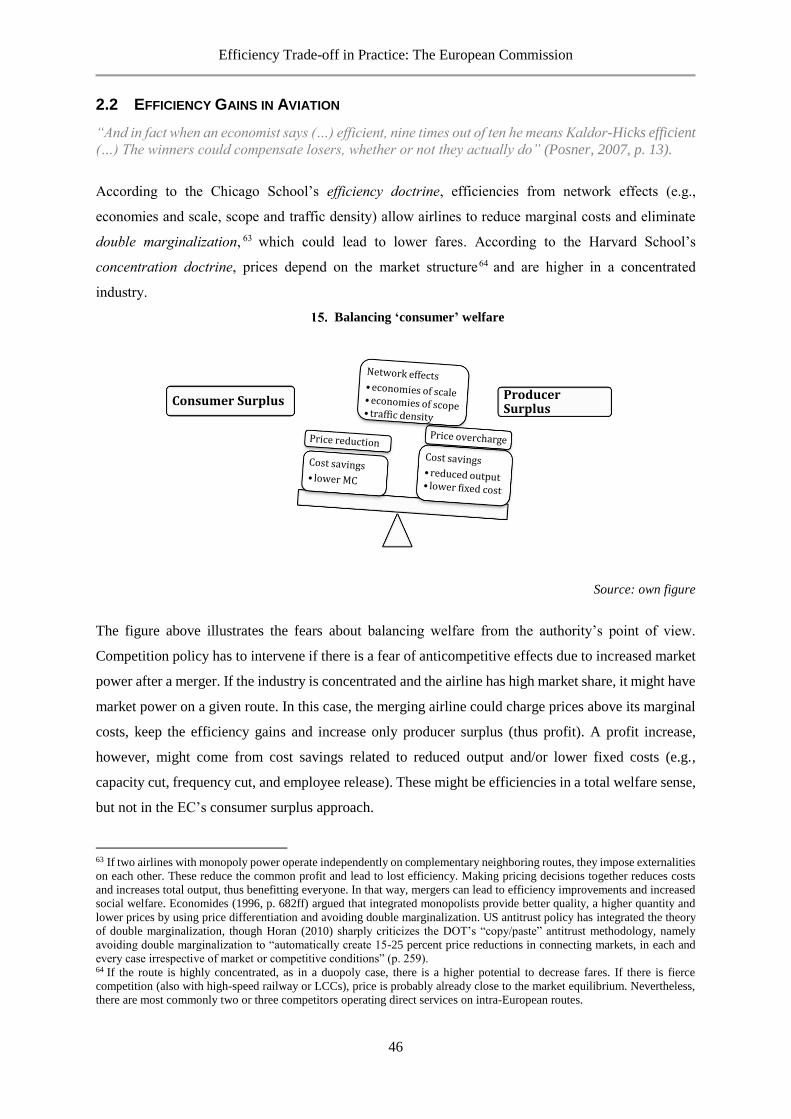
Efficiency Trade-off in Practice: The European Commission
46
2.2 EFFICIENCY GAINS IN AVIATION
“And in fact when an economist says (…) efficient, nine times out of ten he means Kaldor-Hicks efficient
(…) The winners could compensate losers, whether or not they actually do” (Posner, 2007, p. 13).
According to the Chicago School’s efficiency doctrine, efficiencies from network effects (e.g.,
economies and scale, scope and traffic density) allow airlines to reduce marginal costs and eliminate
double marginalization, 63 which could lead to lower fares. According to the Harvard School’s
concentration doctrine, prices depend on the market structure64 and are higher in a concentrated
industry.
Balancing ‘consumer’ welfare
Source: own figure
The figure above illustrates the fears about balancing welfare from the authority’s point of view.
Competition policy has to intervene if there is a fear of anticompetitive effects due to increased market
power after a merger. If the industry is concentrated and the airline has high market share, it might have
market power on a given route. In this case, the merging airline could charge prices above its marginal
costs, keep the efficiency gains and increase only producer surplus (thus profit). A profit increase,
however, might come from cost savings related to reduced output and/or lower fixed costs (e.g.,
capacity cut, frequency cut, and employee release). These might be efficiencies in a total welfare sense,
but not in the EC’s consumer surplus approach.
63 If two airlines with monopoly power operate independently on complementary neighboring routes, they impose externalities
on each other. These reduce the common profit and lead to lost efficiency. Making pricing decisions together reduces costs
and increases total output, thus benefitting everyone. In that way, mergers can lead to efficiency improvements and increased
social welfare. Economides (1996, p. 682ff) argued that integrated monopolists provide better quality, a higher quantity and
lower prices by using price differentiation and avoiding double marginalization. US antitrust policy has integrated the theory
of double marginalization, though Horan (2010) sharply criticizes the DOT’s “copy/paste” antitrust methodology, namely
avoiding double marginalization to “automatically create 15-25 percent price reductions in connecting markets, in each and
every case irrespective of market or competitive conditions” (p. 259). 64 If the route is highly concentrated, as in a duopoly case, there is a higher potential to decrease fares. If there is fierce
competition (also with high-speed railway or LCCs), price is probably already close to the market equilibrium. Nevertheless,
there are most commonly two or three competitors operating direct services on intra-European routes.
Consumer Surplus Producer Surplus
Efficiency Trade-off in Practice: The European Commission
47
2.2.1 COMPETITIVE ADVANTAGES: MERGERS VERSUS ALLIANCES65
There is a broad literature about airline alliances and their ramifications, but it is rare to find a discussion
that compares the advantages and disadvantages of mergers to strategic alliances, as a business strategy
for internationalization. This issue is of particular interest as alliances are sometimes seen as second-
best solutions to circumvent restrictive bilateral agreements, which generally do not allow cross-border
mergers or acquisitions.
Airline agreements differ in the level of cooperation as follows. First is the commercial alliance:
interlining, ground handling, frequent flyer programs (FFPs), code-sharing, blocking space, common
sales, schedule and capacity coordination, joint engineering, joint flights and franchising. Second is the
strategic alliance: common branding, joint cargo and passenger services. Third is the full merger
(Doganis, 2006). Article 3 of the ECMR (2004) defines mergers as a “change in control as a lasting
basis (…) which confer the possibility of exercising decisive influence on an undertaking” (p.7).
Economic and managerial theories explain the internationalization of firms to answer the following
question: Why are mergers the preferred management strategy? It has been discussed broadly in the
literature with respect to multinational corporations (e.g., Aharoni, 1966; Dunning, 1981; Forsgren,
2008; Glaum, 1996; and Morck & Yeung, 1992). Existing literature explains the competitive
advantages that can be achieved within an alliance or a merger/acquisition (e.g., Hanlon, 2003; Iatrou
& Oretti, 2007; Iatrou & Alamdari, 2005; Fritz, 2005; Gudmundson & Lechner, 2006; and Merkert &
Morrell, 2012).
Based on the literature review in this section, the following table summarizes the advantages of mergers
compared to alliances. The main advantages of airline mergers are the potential to: decrease and
internalize costs (economies of scale in marketing, cheaper labor costs and avoiding transaction costs);
increase revenue by exploiting market power, especially by price fixing; extend the network with new
slots; and finally to pursue their own personal managerial aims (higher salary and empire building).
Dempsey (2002) also added another motivation for alliances: predatory behavior in order to reduce
competition and the “desire to skirt around the nationality rules (which prohibit multinational
ownership) and cabotage (which prohibits foreign carriers from flying domestic traffic)” (Dempsey,
2010, p. 6). Both can be stronger in case of a merger.
65 Based on our joint research paper Fröhlich et al. (2013), so this section is mostly identical to the original text.
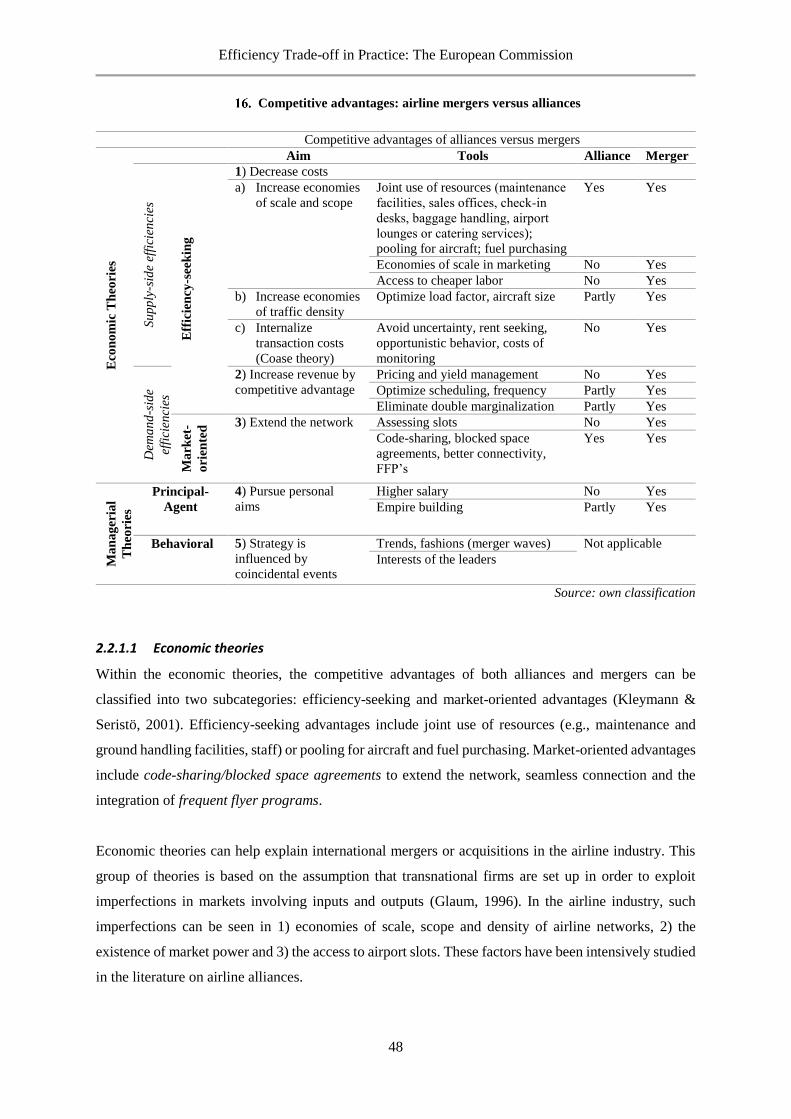
Efficiency Trade-off in Practice: The European Commission
48
Competitive advantages: airline mergers versus alliances
Competitive advantages of alliances versus mergers
Eco
no
mic
Th
eori
es
Aim Tools Alliance Merger S
up
ply
-sid
e ef
fici
enci
es
Eff
icie
ncy
-see
kin
g
1) Decrease costs
a) Increase economies
of scale and scope
Joint use of resources (maintenance
facilities, sales offices, check-in
desks, baggage handling, airport
lounges or catering services);
pooling for aircraft; fuel purchasing
Yes Yes
Economies of scale in marketing No Yes
Access to cheaper labor No Yes
b) Increase economies
of traffic density
Optimize load factor, aircraft size Partly Yes
c) Internalize
transaction costs
(Coase theory)
Avoid uncertainty, rent seeking,
opportunistic behavior, costs of
monitoring
No Yes
Dem
an
d-s
ide
effi
cien
cies
2) Increase revenue by
competitive advantage
Pricing and yield management No Yes
Optimize scheduling, frequency Partly Yes
Eliminate double marginalization Partly Yes
Ma
rket
-
ori
ente
d 3) Extend the network Assessing slots No Yes
Code-sharing, blocked space
agreements, better connectivity,
FFP’s
Yes Yes
Ma
na
ger
ial
Th
eori
es
Principal-
Agent
4) Pursue personal
aims
Higher salary No Yes
Empire building Partly Yes
Behavioral 5) Strategy is
influenced by
coincidental events
Trends, fashions (merger waves) Not applicable
Interests of the leaders
Source: own classification
2.2.1.1 Economic theories
Within the economic theories, the competitive advantages of both alliances and mergers can be
classified into two subcategories: efficiency-seeking and market-oriented advantages (Kleymann &
Seristö, 2001). Efficiency-seeking advantages include joint use of resources (e.g., maintenance and
ground handling facilities, staff) or pooling for aircraft and fuel purchasing. Market-oriented advantages
include code-sharing/blocked space agreements to extend the network, seamless connection and the
integration of frequent flyer programs.
Economic theories can help explain international mergers or acquisitions in the airline industry. This
group of theories is based on the assumption that transnational firms are set up in order to exploit
imperfections in markets involving inputs and outputs (Glaum, 1996). In the airline industry, such
imperfections can be seen in 1) economies of scale, scope and density of airline networks, 2) the
existence of market power and 3) the access to airport slots. These factors have been intensively studied
in the literature on airline alliances.
Efficiency Trade-off in Practice: The European Commission
49
1) One important result is that economies of scale vanish at a rather early stage, and therefore cannot
be used to explain mergers in the air transport industry (Caves et al., 1984; and Laaser, 2001). More
important are economies of scope and density. The DoT has emphasized that “carriers enter into
transnational alliances to take advantage of economies of scope and density by increasing the size and
reach of their networks” (Gellmann Research Associates, 1994, p. 7). Numerous researchers have
shared this point (Oum et al., 2000). There is no doubt that these types of network effects have been
one of the major driving forces behind alliances and mergers (for more about network effects, see
Section 2.2.3).
The realization of economies of scale in marketing is limited within an alliance, as the alliance partners
are likely to be focused on promoting their own brands instead of the alliance brand (Hanlon, 2003).
However, it is still questionable whether the creation of a single global airline brand is desirable, as
airline passengers seem to have a preference for their national carrier(s), which express their respective
national identities.66
Another tool for decreasing costs is the access to cheaper labor that comes with an international
acquisition. With a foreign acquisition, it may be possible to offshore some of the acquiring airline’s
functions, such as data processing, weight & balance calculations or maintenance.
A famous branch of efficiency-oriented theories is the internalization theory. This approach follows
Coase (1937), who extensively described the determinants of the boundaries of firms, using the
transaction costs occurring for market transactions and internalization or hybrid forms of interaction.
Following this theory, a merger may lead to a greater reduction in transaction costs than an alliance. It
is also reasonable to assume that a certain level of rent seeking over the alliance partners occurs within
an alliance and that alliance partners have to bear transaction costs (in the form of costs for monitoring
and control) to avoid the possible opportunistic behavior of their alliance partners.67
66 For instance, when British Airways introduced a multicultural branding strategy at the end of the 1990s, it provoked a
strongly negative public opinion that finally resulted in the restoration of the ‘British’ image (Thurlow & Aiello, 2007). The
national identity of a carrier therefore can be interpreted as part of a unique selling position, which is a valuable asset in the
market. The creation of the pan-European brands Thomas Cook and — more recently — TUIfly have shown that it seems to
be very difficult to exploit economies of scale in marketing due to the cultural diversity in Europe. In the former case, the
experiment of renaming the traditional German brand Condor to Thomas Cook was reversed after less than two years. Although
Thomas Cook is a brand with a tradition of more than 160 years in the UK, it was virtually unknown in Germany. A more
positive example is the presence of the Virgin brand in different markets all over the globe, although the independent operation
of Virgin-branded companies in totally different geographical markets (UK, Australia and USA) and with different business
models (short-haul low cost services in Australia and the USA, long-haul low-cost operations from Australia and a full service
long-haul operation based in the UK) seems to reduce the possibility of achieving economies of scale (Altman, 2009). 67 Anecdotal evidence from recent events may illustrate such intra-alliance rivalries. While both Singapore Airlines (SQ) and
Lufthansa (LH) are members of Star Alliance, SQ’ early-morning departure from Frankfurt to New York does not bear the LH
code and is therefore not sold by Lufthansa. Moreover, starting with the 2007 winter schedule, LH scheduled their own all-
business-class service to New York, five minutes ahead of SQ’ departure. LH’s service was discontinued in 2008, but
Efficiency Trade-off in Practice: The European Commission
50
These examples show that even within alliances, opportunistic behavior cannot be avoided and that the
behavior of alliance partners is in many instances beyond the control of the other partners. In the
presented instances, neither “deterrence-based trust” nor “familiarity” within the alliance seems to be
working (Kleymann & Seristö, 2001). The study further sums up the problems and disadvantages
associated with alliances: among them uncertainty, ambiguity and market dynamics that need to be
adapted to and may destabilize alliances in the long run. In the case where alliance partners were to be
integrated into one firm under a single management, it can be expected that transaction costs could be
reduced as, for instance, when frequency or destination decisions can be made unilaterally and not
through bi- or multilateral negotiations.
2) Part of every successful strategy is gaining competitive advantage, and alliances might be a very
effective instrument. Youssef and Hansen (1994, p. 416) pointed out that “alliances may create virtual
monopolies in markets between the hubs of alliance partners.” Competition authorities treat alliances
and mergers similarly, but in some cases do not allow price fixing among alliance partners. The
advantage of a merger approved by the competition authorities is that it allows for practices that
otherwise would not have been allowed by these authorities.
3) While network economies can be exploited within existing alliances, direct access to an alliance
partners’ resources (such as slots) would only be possible with a takeover. This argument is
strengthened by the fact that even under a regime that allows slot trading, slot pairs are rarely traded
between competing carriers or alliances due to strategic considerations. The possession of slots is seen
as a key business asset and new entrants have had difficulties obtaining slots from incumbents, even at
airports that are not used as hubs (e.g., New York-La Guardia) (Ball et al., 2007). Therefore, the
acquisition of complete airlines (or major parts of their assets) for the sake of gaining control over slots
has been observed in the past.68 Slots might be the main reason behind mergers.
Lufthansa still does not cooperate with Singapore Airlines on this particular flight. Another example of intra-alliance
competition was provided by Christian Hylander, the Germany-based Country Manager for Scandinavian Airlines (SK), who
characterized the relationship with alliance partner Lufthansa as “friendly competition” (FVW, 2007). Elements of this include
the unilateral introduction of one-way fares (which has the potential to erode yields for Lufthansa), the reintroduction of
Scandinavian group sales and travel agent support in Germany, and the termination of both the joint call center use and the
joint corporate volume discount program (ibid). 68 One example is the divestiture of Pan Am after its bankruptcy in December 1991. Delta Airlines bought a major part of Pan
Am’s transatlantic and domestic network in the northeast for $416 m and assumed its liabilities (New York Times, 1992)
United acquired Pan Am’s Latin American network for $160 m (New York Times, 1991). The transactions included the
transfer of route authorities, slots, staff and other assets.

Efficiency Trade-off in Practice: The European Commission
51
2.2.1.2 Managerial theories
Based on the managerial theory of the firm, the principal-agent theory (number 4 in the table above)
states that the primary objective of managers is not to increase shareholder value, but to pursue their
own personal objectives, such as increasing their personal power or salary. An extensive analysis on
this subject can be found in Glaum (1996). As mergers and acquisitions seem to be more promising
than alliances as a way of achieving the managers’ personal objectives, managers may underestimate
the risks associated with integrating the acquired firms and may overestimate the chances of success
(Roll, 1986).69
The behavioral theory of internationalization (number 5 in the table above) describes the firm as a
network of interacting stakeholder groups in which each influences the firm’s decision-making
processes with their own objectives (Aharoni, 1966). Coincidental events, trends and fashions (‘M&A
waves’) or the interests and opinions of the leaders within the firm (typically higher management, board
members or consultants) influence internationalization.
In the following section, the analysis focuses on efficiency-seeking and market-oriented explanations
and classifies the efficiency gains from merger synergies claimed by economic theories and
implemented by airline managers. Extensions from principal-agent and behavioral theories supplement
the core economic model and will be handled as risk.
2.2.2 COST, REVENUE AND RISK SYNERGIES – FOCUS ON ECONOMIC THEORIES
Assuming that the aim of all managers is supposed to be creating additional value (in the form of
efficiencies or synergies; see, e.g., Seth, 1990) by maximizing profit, I simply state that profit is a
function of revenues minus costs. Therefore, the two ways to increase profitability are to increase
revenue or decrease costs. Götsch and Albers (2005) added a third source of better performance:
potential synergies from risk reduction. Since the revenue function depends on the demand and the cost
function depends on supply, the literature also uses the terms ‘demand and supply synergies.’ I prefer
‘differentiating cost, revenue and risk synergies.’
Cost synergies play an important role from the policy point of view, since a (marginal) cost reduction
may shift the supply curve to the right and might reduce equilibrium prices, thus benefiting consumers
and increasing consumer surplus. Revenue synergies, however, come from increased prices that are
partially due to quality improvements and based on a higher demand, thus an upward shift of the demand
curve.
69 The failure of some transnational mergers in other industries (e.g., Daimler-Benz and Chrysler) may provide some anecdotal
evidence for this theory, but the airline industry also provides some examples in which cross-border equity investments (not
completed mergers) have failed (e.g., Swissair’s investments in Sabena, Air Outre Mer, Air Europe and South African
Airways).
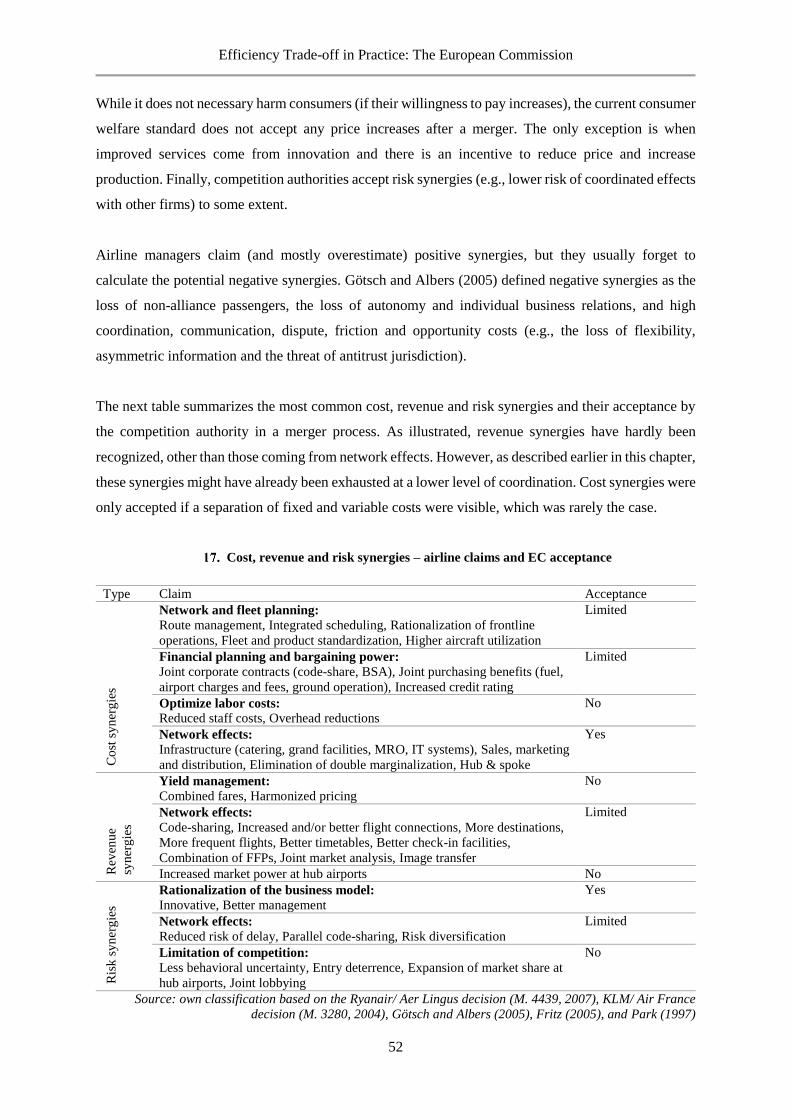
Efficiency Trade-off in Practice: The European Commission
52
While it does not necessary harm consumers (if their willingness to pay increases), the current consumer
welfare standard does not accept any price increases after a merger. The only exception is when
improved services come from innovation and there is an incentive to reduce price and increase
production. Finally, competition authorities accept risk synergies (e.g., lower risk of coordinated effects
with other firms) to some extent.
Airline managers claim (and mostly overestimate) positive synergies, but they usually forget to
calculate the potential negative synergies. Götsch and Albers (2005) defined negative synergies as the
loss of non-alliance passengers, the loss of autonomy and individual business relations, and high
coordination, communication, dispute, friction and opportunity costs (e.g., the loss of flexibility,
asymmetric information and the threat of antitrust jurisdiction).
The next table summarizes the most common cost, revenue and risk synergies and their acceptance by
the competition authority in a merger process. As illustrated, revenue synergies have hardly been
recognized, other than those coming from network effects. However, as described earlier in this chapter,
these synergies might have already been exhausted at a lower level of coordination. Cost synergies were
only accepted if a separation of fixed and variable costs were visible, which was rarely the case.
Cost, revenue and risk synergies – airline claims and EC acceptance
Type Claim Acceptance
Co
st s
yn
erg
ies
Network and fleet planning:
Route management, Integrated scheduling, Rationalization of frontline
operations, Fleet and product standardization, Higher aircraft utilization
Limited
Financial planning and bargaining power:
Joint corporate contracts (code-share, BSA), Joint purchasing benefits (fuel,
airport charges and fees, ground operation), Increased credit rating
Limited
Optimize labor costs:
Reduced staff costs, Overhead reductions
No
Network effects:
Infrastructure (catering, grand facilities, MRO, IT systems), Sales, marketing
and distribution, Elimination of double marginalization, Hub & spoke
Yes
Rev
enu
e
syn
erg
ies
Yield management:
Combined fares, Harmonized pricing
No
Network effects:
Code-sharing, Increased and/or better flight connections, More destinations,
More frequent flights, Better timetables, Better check-in facilities,
Combination of FFPs, Joint market analysis, Image transfer
Limited
Increased market power at hub airports No
Ris
k s
yn
erg
ies
Rationalization of the business model:
Innovative, Better management
Yes
Network effects:
Reduced risk of delay, Parallel code-sharing, Risk diversification
Limited
Limitation of competition:
Less behavioral uncertainty, Entry deterrence, Expansion of market share at
hub airports, Joint lobbying
No
Source: own classification based on the Ryanair/ Aer Lingus decision (M. 4439, 2007), KLM/ Air France
decision (M. 3280, 2004), Götsch and Albers (2005), Fritz (2005), and Park (1997)
Efficiency Trade-off in Practice: The European Commission
53
2.2.3 NETWORK EFFECTS: DO THEY INCREASE EFFICIENCY OR MARKET POWER?
The next section70 will describe why economists and competition authorities are skeptical of synergies
from network effects. Network effects are special market externalities, whereby the number of
consumers and/or producers using the same product or technology directly affects profitability (Shy,
2010).
The most known network effects in aviation are economies of scale, scope and traffic density. Network
effects combine cost and revenue synergies since, for example, traffic density improvement attracts
more passengers, which can result in a better load factor and in economies of scale.
First, if average costs decrease as output goes up, then we talk about economies of scale. Brueckner and
Spiller (1991) drew the attention of competition policy to the network effects in air transport. Merged
airlines operate with lower marginal costs due to economies of scale. The study pointed out that network
effects are problematic for competition authorities, which focus on individual routes (i.e., relevant
markets; see Chapter 4) and fail to capture the wider effects of a merger. Therefore, it would be better
to also take efficiency gains in ‘outsider’ markets into account, since benefits from the merger can spill
over to other routes. However, there is a difference between parallel and complementary integration.71
A merger might reduce welfare on overlapping routes, but passengers (particularly connecting
passengers) on related routes might benefit from cost complementarities. According to Brueckner’s
theory, if network effects are present, perfect competition would result in higher MC.
Generally in the airline industry, scale economies emerge by increasing network size (Caves et al.,
1984). Smaller airlines can decline their average cost by increasing the number of served cities. This
allows airlines to lower the ‘unit cost’ (i.e., the average cost of a passenger). Carlton, Landes, and Posner
(1980) stated that in every case, passengers benefit from large networks.
On the other side, a merger might cause diseconomies of scale when an airport is already overloaded.
In this case, not only the airport’s operating costs increase, but so do the consumers’ costs due to delays.
The negative effects spill over within the whole network with the consequence that the airline’s network
(not only the route) becomes less attractive to consumers.72
70 This section is mainly based on our working paper Fröhlich et al. (2011), and a book chapter Fröhlich et al. (2013). 71 Parallel integration occurs if the partners’ networks strongly overlap while complementary integration increases the size of
the network (Brueckner & Spiller, 1991). 72 Spillover effects appear on neighboring routes and connecting airports, also in the case of price or capacity regulation on a
given route. The regulated route loses attractiveness, prices increase, demand diminishes and passengers (mostly leisure
passengers) will switch to alternative flights. Neighboring routes and connecting airports (mainly in foreign countries) benefit
from restrictive air service agreements, but the introducing home country loses (Wolf, 2001).
Efficiency Trade-off in Practice: The European Commission
54
Second, there are economies of scope in which the total cost of producing given quantities of two goods
in the same airline is less than producing them in two single-product airlines. Bigger airlines aim to
improve their network and tie in more consumers with bonus schemes like FFPs.
The third important network effect in the airline industry is the traffic density within a given network
size.73 When the level of traffic increases, the cost per passenger falls (Tretheway & Oum, 1992).
Further, if the aircraft’s load factor increases, the airline can achieve cost efficiencies. The airports also
benefit from economies of traffic density, since the additional traffic lowers the average cost of
operating the infrastructural facilities (Wolf, 2001).
On the other side, network effects may also increase market power. The question of market power at
the hub airport (i.e., hub dominance or hub premium) and its influence on the market situation remains
unclear. Hub premium occurs when one dominating airline charges a higher fare for flights from the
hub airport.
Dodgson (1994) compared the first European mergers and described why mergers with hub dominance
can be anticompetitive. Network effects might be responsible for higher ticket prices. The literature has
often analyzed this problem with different outcomes. Borenstein (1989) estimated a 12 percent higher
price if the airline had more than 50 percent market share at the hub airport compared to another airline
with only 10 percent market share. Tretheway and Kincaid (2005) summarized previous research
findings on hub premium and highlighted the results of the General Accounting Office (1990), which
announced 27 percent more yields at hub airports, while the DoT (1990) only reported 18.7 percent at
airports dominated by one airline. Abunassar and Koford (1994) stated that 10 percent higher fares due
to hub dominance eliminated the hub premium effect because of higher demand for the hub cities. Lee
and Luengo-Prado (2005) estimated 12.2 percent, while Morrison and Winston (1995) only expected a
5.2 percent premium, which completely stems from the higher quality service. Lijesen et al. (2001)
calculated an around 15 percent hub premium concerning Lufthansa, KLM and Swissair’s long-haul
flights, and suggested taxing FFPs to reduce the principal-agent problem. Ledermann (2008) argued
that FFPs are one of the main reasons behind hub premium, since FFP alone increases ticket prices by
3.5 to 5 percent. Bilotkach and Pai (2014) found that the higher prices paid by business passengers are
only due to their higher willingness to pay, while dominant airlines abuse their market power on average
passengers instead.
73 For more on traffic density, see Caves, Christensen, and Tretheway (1984), who further explained the benefits of higher
frequency and/or large aircraft. Other important contributors to the literature are Baumol and Willig (1981), Brueckner, Dyer
and Spiller (1992), Zhang et al. (2004), and Lederman (2007).

Efficiency Trade-off in Practice: The European Commission
55
Oum et al. (2000) found positive effects on productivity and profit for major alliances 74 (e.g.,
KLM/NWA) and insignificant effects for minor alliances. Major alliances increase total factor
productivity by 4.9 percent, lower revenues (due to lower fares) per output by 1.5 percent and increase
profitability by 1.5 percent. As airline competition became stronger, and low-cost carriers (LCCs)
appeared at the beginning of the new century, discussions about hub premium lost their importance75.
74 The term ‘major alliances’ does not refer to size, but to the scope of cooperation (Oum et al., 2000). 75 Now, a different way of looking at hub premium is to emphasize de-hubbing and analyze the consequences of a hub carrier
disappearing due to bankruptcy or merger. See our case study on de-hubbing in Section 5.4.
Efficiency Trade-off in Practice: The European Commission
56
2.3 WHY DID THE EC NOT CONSIDER EFFICIENCY GAINS?
“Firms provide biased evidence; agency balances with focus on consumer welfare” (Lyons, 2012).
Independent of the airlines’ relationship, the EC has not considered network effects. Even if efficiencies
could be proven, measuring the rate to be passed through to consumers might be a further challenge.
On one side, the EC has welcomed efficiency studies, but it has also pointed out the lack of the ratio
between consumer welfare and social welfare which “would be necessary to examine to what extent
such efficiencies would be passed on to consumers (…) however, they are very difficult to be quantified
and the study’s attempt to do so relies on rather strong assumptions” (M. 5141, 2008, p. 97). On the
other side, the Commission has had serious concerns with respect to these takeovers, and has tried to
benchmark the post-merger price evolution76 of leisure fares (Németh & Niemeier, 2012).
Potential positive synergies were already welcomed during the Swissair/Sabena merger in 1995: these
included “fleet planning, strategic network development, financial planning, and route management,
yield management, sales and marketing” (M. 616, 1995, p. 3). However, the optimism at the beginning
and the forecasted positive synergies seemed to have been overestimated. Six years after the takeover,
both airlines went bankrupt77 (Knorr & Arndt, 2004).
First attempts to use efficiency considerations in the decisions date from 2006, but the question of their
usefulness was generally left open. In the Ryanair/Aer Lingus case (M. 4439, 2007), the EC rejected
the efficiency gains78 of €200-250m proposed by consultants on behalf of Ryanair because they were
unlikely to outweigh the competitive harm.
The EC not only rejected the efficiencies, but also the Ryanair/Aer Lingus merger. The merger should
have been prohibited with or without efficiency considerations. According to § 84 of the ECMG: “It is
highly unlikely that a merger leading to a market position approaching that of a monopoly, or leading
to a similar level of market power, can be declared compatible with the common market on the ground
that efficiency gains would be sufficient to counteract its potential anti-competitive effects.” Thus, if
there is a fear of abusing market power, efficiencies do not matter.
76 In the Ryanair/Aer Lingus case (2007), the commission also used a price-correlation analysis. 77 In the following year, Sabena was successfully reestablished as SN Brussels Airlines. Swissair was restructured as Swiss in
2001 and was taken over by Lufthansa in 2005. Lufthansa merged with SN Brussels in 2009. 78 Mainly from variable cost savings, like economies of scale and rationalization of the business model (more innovative, better
management). According to Ryanair, those savings would have affected staff costs, aircraft ownership costs, maintenance
costs, airport charges, ground operational costs, ancillary sales and distribution efficiencies (p. 311). However, the EC found
most of these would affect rather short-run fixed costs instead (p. 313). Further, Aer Lingus claimed that efficiencies are
overestimated, not merger-specific, not verifiable and probably not passed through to passengers (pp. 313-316).
Efficiency Trade-off in Practice: The European Commission
57
In 2008, KLM submitted a study in which they claimed supply-79 and demand-side efficiencies80 of
€16.4m when allowing the takeover of Martinair81 (M. 5141). The study also differentiated between
fixed and variable costs savings (only the latter is relevant for benefiting passengers). Since demand-
side efficiencies are concerned with quality improvements, they are hard to quantify and measure.
However, since the merger, with or without efficiencies, “would not significantly impede effective
competition,” the case was cleared by the EC (ibid, pp. 96-98). Therefore, if there is no fear of abusing
market power, efficiencies do not matter. So the EC was skeptical of efficiency claims provided by
airlines (specifically by their economic consultancies), with or without market power.
In the 2010 British Airways (BA)/Iberia merger case, BA claimed significant synergies of €400m,
enhanced consumer benefits and developed their network (157 new destinations). Passengers should
benefit from cost savings and higher quality service. The EC focused on price effects and conducted an
econometric analysis with the data provided by BA, AA, Iberia and Virgin Atlantic. The assessment
found a possible “increase of prices by 2.2 percent for business fully flexible tickets and 5.4 percent of
economy restricted tickets” (M. 5747, p. 10) and rejected the claimants’ argument that the merger would
be beneficial for consumer welfare (Németh & Niemeier, 2012). Nevertheless, the merger was
approved.
Efficiency is one of the main aims of the EU, but the more economic approach, at least in terms of
accepting efficiency claims, has not yet been applied to airline merger decisions. However, mergers
will probably still be cleared if there are other justifiable reasons (e.g., quality and variety82) to believe
that they will not significantly impede effective competition. Airline managers claim positive network
effects, arising from significant cost and revenue synergies. The potential is higher if the merging
airlines operate on complementary routes and if they do not previously belong to the same alliance.
Nevertheless, convincing forecasts are difficult.
79 Supply-side efficiencies were the joint purchasing benefits, overhead reductions, rationalization of frontline operations,
systems integration and network efficiencies (M. 5141, p. 97). 80 Demand-side efficiencies were the elimination of double-marginalization, increase in flight connections, reduced risk of
delay, frequent flyer programs and better check-in facilities (M. 5141, p. 97). 81 KLM and Martinair already had a long history at the European Commission. After a contested process in December 1999,
the EC imposed fines on KLM for supplying incorrect and misleading information about the destinations of its subsidiary,
Transavia. KLM refused to answer in English and wanted to use Dutch as the official language of the proceedings. KLM held
back the overlapping route information from the EC, hoping for an acceptance of the merger. In spite of this, the merger was
rejected and a €40,000 fine was levied. 82 E.g., increasing network quality and higher flexibility, lounge access and ground processes, more frequencies, more
destinations, realigned timetables, better connections.
Efficiency Trade-off in Practice: The European Commission
58
2.4 CONCLUSIONS
Previous literature differs about the magnitude of synergy effects, so the EC is skeptical of merger-
specific synergy gains, which could be passed on to consumers. The only certain network effect remains
quality improvement, which is challenging to quantify. Cost savings could be measured, but it is difficult
to relate them to exact network effects because they can spill over other routes as well. The role of
competition authorities under the TW standard should be to prove whether the positive synergy effects
overcome the anticompetitive effects from increased market power. Efficiency gains do not fit the CS
standard applied in the EU unless they are passed on to passengers.
Chapter 2 tried to provide an answer to the contradiction of the merger policy: the EC does not directly
measure efficiency, but takes it into account to some extent. The chapter addressed why the EC refused
efficiency gains related to airline takeovers but still allowed the mergers.
First, the EC is generally skeptical of efficiency claims, which are of a speculative nature. Existing
literature supports this view. Second, European competition policy applies the Harvard-developed SCP
model. This model is based on oligopoly theory, where a concentration usually results in higher prices
and less output. Hence, the model assumes that new oligopoly price is above the old price. As long as
a merger leads to a marginal price increase, the price development causes a loss in consumer surplus,
thus harming consumers. Therefore, any price increase would exclude efficiency considerations. In
other words, even if the current merger regulation would allow efficiency defense, the applied oligopoly
framework would exclude any trade-off when a potential price increase harms consumers. It is a
contradiction of legislation. As a consequence and third, the EC had to switch to the TW standard to
introduce the efficiency defense. Until then, one could conclude that airlines do not need to spend too
much time assessing efficiency claims, since they will be rejected anyway.
Finally, there is a solution to the contradiction. According to the ECMG, efficiencies can be taken into
account as long as they will be passed on to consumers (in our case, passengers). If there is a sign that
efficiencies improve consumer welfare, mergers might be cleared. Although neither the ECMR nor the
ECMG define consumer welfare, it could be defined as the well-being of consumers depending not only
on price, but also on quality and variety. Efficiency gains might be passed on to consumers in these
forms. This extended definition of consumer welfare meets the companies’ needs. By implementing
efficiency gains that lead to quality improvement for passengers, the welfare balance shifts back to the
consumer’s side and the goal of competition policy is successfully achieved. The conflict of the current
merger policy is that there might be a better cost/price margin due to efficiencies, but does it also result
in cheaper ticket prices (that benefit consumers)? The answer is probably not. Chapter 3 introduces
different economic models to quantify the price and efficiency effects of mergers.
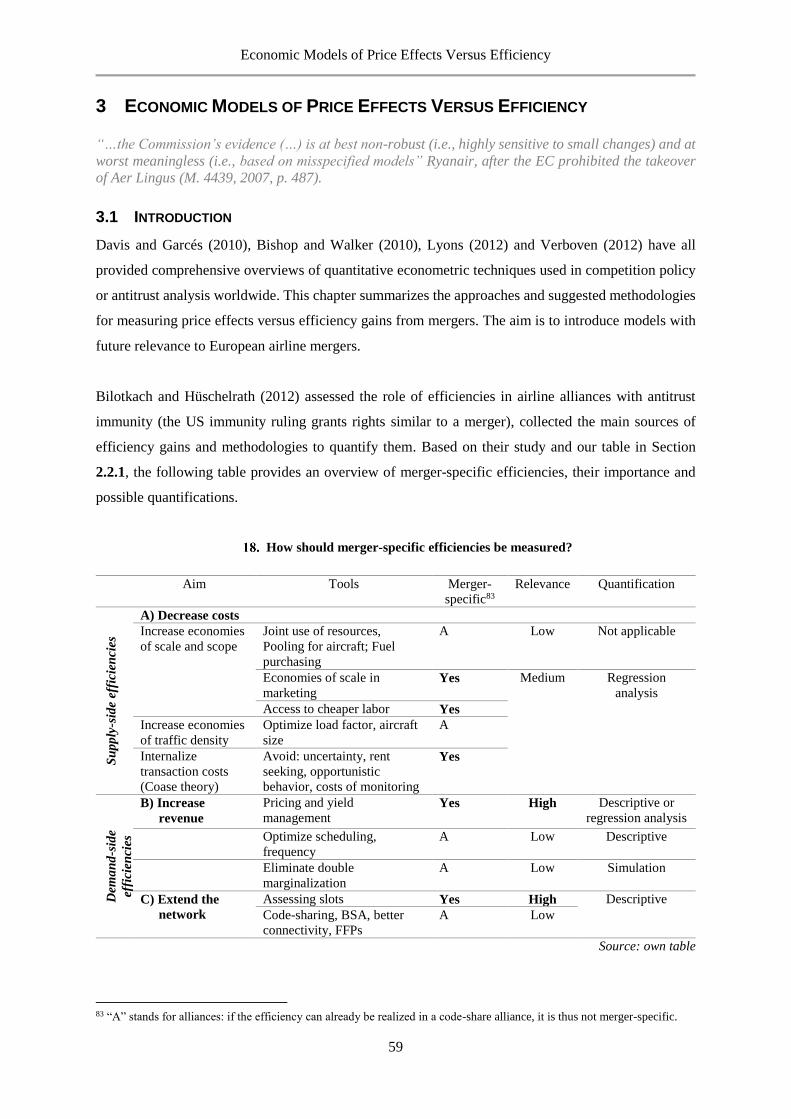
Economic Models of Price Effects Versus Efficiency
59
3 ECONOMIC MODELS OF PRICE EFFECTS VERSUS EFFICIENCY
“…the Commission’s evidence (…) is at best non-robust (i.e., highly sensitive to small changes) and at
worst meaningless (i.e., based on misspecified models” Ryanair, after the EC prohibited the takeover
of Aer Lingus (M. 4439, 2007, p. 487).
3.1 INTRODUCTION
Davis and Garcés (2010), Bishop and Walker (2010), Lyons (2012) and Verboven (2012) have all
provided comprehensive overviews of quantitative econometric techniques used in competition policy
or antitrust analysis worldwide. This chapter summarizes the approaches and suggested methodologies
for measuring price effects versus efficiency gains from mergers. The aim is to introduce models with
future relevance to European airline mergers.
Bilotkach and Hüschelrath (2012) assessed the role of efficiencies in airline alliances with antitrust
immunity (the US immunity ruling grants rights similar to a merger), collected the main sources of
efficiency gains and methodologies to quantify them. Based on their study and our table in Section
2.2.1, the following table provides an overview of merger-specific efficiencies, their importance and
possible quantifications.
How should merger-specific efficiencies be measured?
Aim Tools Merger-
specific83
Relevance Quantification
Su
pp
ly-s
ide
effi
cien
cies
A) Decrease costs
Increase economies
of scale and scope
Joint use of resources,
Pooling for aircraft; Fuel
purchasing
A Low Not applicable
Economies of scale in
marketing Yes Medium Regression
analysis
Access to cheaper labor Yes
Increase economies
of traffic density
Optimize load factor, aircraft
size
A
Internalize
transaction costs
(Coase theory)
Avoid: uncertainty, rent
seeking, opportunistic
behavior, costs of monitoring
Yes
Dem
an
d-s
ide
effi
cien
cies
B) Increase
revenue
Pricing and yield
management Yes High Descriptive or
regression analysis
Optimize scheduling,
frequency
A Low Descriptive
Eliminate double
marginalization
A Low Simulation
C) Extend the
network
Assessing slots Yes High Descriptive
Code-sharing, BSA, better
connectivity, FFPs
A Low
Source: own table
83 “A” stands for alliances: if the efficiency can already be realized in a code-share alliance, it is thus not merger-specific.
Economic Models of Price Effects Versus Efficiency
60
Supply-side efficiencies might be realized by decreasing costs. The appropriate methodology is
regression analysis based on internal cost data. Mergers might also increase revenue through common
pricing and yield management. This analysis also requires cost data and detailed data about price
discrimination. The third source of merger-specific efficiencies is the slot assessment, which could be
investigated by a descriptive analysis.
To review the main literature, economic competition models (lacking cost data) mostly try to estimate
the price effects of a merger84. The first group (1) of models are based on the relevant market definition
with the help of demand elasticity (SSNIP or CLA). They then calculate the potential increase in market
power due to structural changes, thus changes in market share (Lerner index or HHI).85 As I will
illustrate in Chapter 4, the EC applies this two-level framework to its merger analyses.
The models in the first group rely on the Harvard-based SCP paradigm and expect a direct correlation
between prices and concentration, which can be measured by a regression analysis (2). The second
group (2a) of econometric models focus on cross-section or fixed-effects analysis. In line with the more
economic approach, the EC also investigates price-concentration analysis (e.g., in the Ryanair/Aer
Lingus case). The remaining regression models (2b) assume a Cournot, Stackelberg or Bertrand
oligopoly market without directly defining the relevant market. This group of models contains the
upward pricing pressure (UPP) test to quantify potential efficiency gains from mergers. Section 3.2
describes these models.
The last group (3) of models tries to estimate parameters for demand, costs and equilibrium, and tries
to set up an oligopoly model to simulate price and welfare effects of mergers by using different
assumptions. Minimum required efficiency (MRE) tests are the most commonly used to measure
efficiency gains. Section 3.3 introduces merger simulations.
Section 3.4 assesses the literature on the price and welfare effects of mergers and alliances in the airline
industry and develops a model to measure the price-frequency trade-off. The EC does not yet use merger
simulations for airline mergers.
84 Annex 8.2 summarizes the main groups of economic models, including the latest research papers, applied in competition
economics research and policy practice. 85 For more about “small but significant increases in price” (SSNIP), critical loss analysis (CLA) and the Lerner and
Herfindahl-Hirsch index (HHI), see Chapter 4.2.1.
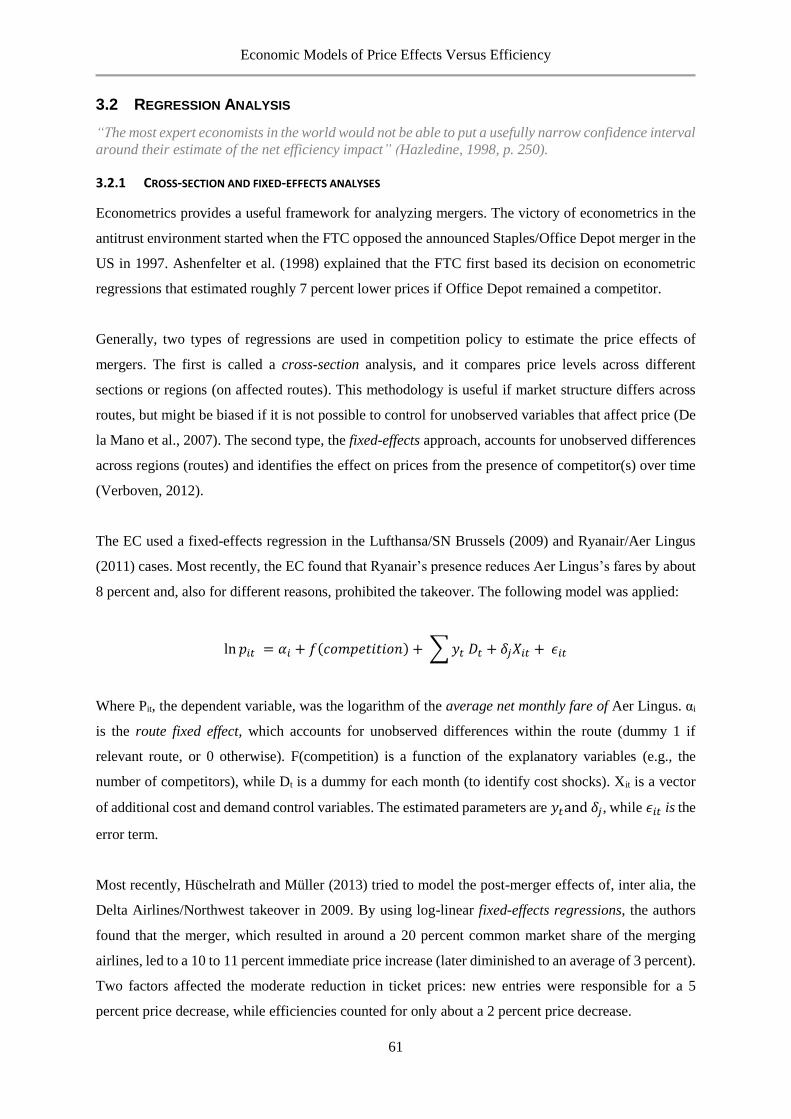
Economic Models of Price Effects Versus Efficiency
61
3.2 REGRESSION ANALYSIS
“The most expert economists in the world would not be able to put a usefully narrow confidence interval
around their estimate of the net efficiency impact” (Hazledine, 1998, p. 250).
3.2.1 CROSS-SECTION AND FIXED-EFFECTS ANALYSES
Econometrics provides a useful framework for analyzing mergers. The victory of econometrics in the
antitrust environment started when the FTC opposed the announced Staples/Office Depot merger in the
US in 1997. Ashenfelter et al. (1998) explained that the FTC first based its decision on econometric
regressions that estimated roughly 7 percent lower prices if Office Depot remained a competitor.
Generally, two types of regressions are used in competition policy to estimate the price effects of
mergers. The first is called a cross-section analysis, and it compares price levels across different
sections or regions (on affected routes). This methodology is useful if market structure differs across
routes, but might be biased if it is not possible to control for unobserved variables that affect price (De
la Mano et al., 2007). The second type, the fixed-effects approach, accounts for unobserved differences
across regions (routes) and identifies the effect on prices from the presence of competitor(s) over time
(Verboven, 2012).
The EC used a fixed-effects regression in the Lufthansa/SN Brussels (2009) and Ryanair/Aer Lingus
(2011) cases. Most recently, the EC found that Ryanair’s presence reduces Aer Lingus’s fares by about
8 percent and, also for different reasons, prohibited the takeover. The following model was applied:
ln 𝑝𝑖𝑡 = 𝛼𝑖 + 𝑓(𝑐𝑜𝑚𝑝𝑒𝑡𝑖𝑡𝑖𝑜𝑛) + ∑ 𝑦𝑡 𝐷𝑡 + 𝛿𝑗𝑋𝑖𝑡 + 𝜖𝑖𝑡
Where Pit, the dependent variable, was the logarithm of the average net monthly fare of Aer Lingus. αi
is the route fixed effect, which accounts for unobserved differences within the route (dummy 1 if
relevant route, or 0 otherwise). F(competition) is a function of the explanatory variables (e.g., the
number of competitors), while Dt is a dummy for each month (to identify cost shocks). Xit is a vector
of additional cost and demand control variables. The estimated parameters are 𝑦𝑡and 𝛿𝑗, while 𝜖𝑖𝑡 is the
error term.
Most recently, Hüschelrath and Müller (2013) tried to model the post-merger effects of, inter alia, the
Delta Airlines/Northwest takeover in 2009. By using log-linear fixed-effects regressions, the authors
found that the merger, which resulted in around a 20 percent common market share of the merging
airlines, led to a 10 to 11 percent immediate price increase (later diminished to an average of 3 percent).
Two factors affected the moderate reduction in ticket prices: new entries were responsible for a 5
percent price decrease, while efficiencies counted for only about a 2 percent price decrease.

Economic Models of Price Effects Versus Efficiency
62
3.2.2 UPWARD PRICING PRESSURE TEST
As described in Chapter 1, the concentration doctrine was challenged by the Chicago School’s
efficiency doctrine, which says that high market share might be based on efficiency or innovation.
Following this line of thinking, the next model included efficiency arguments in the merger analysis,
independently of market share. The upward pricing pressure (UPP) model86 is a modern implication
of the Williamson trade-off, since it balances the UPP from lost direct competition and the downward
price pressure from marginal cost savings.
Farrell and Shapiro (2010b) suggested using the price-cost-margin-based UPP test instead of the
traditional (concentration-based) relevant market definition.87 The model assumes a Bertrand oligopoly
with product differentiation instead of the traditional approach, which is based on a Cournot framework
with homogeneous products. Therefore, coordinated effects (e.g., collusion) play a more important role
here, while the traditional competition policy framework deals with unilateral effects instead.88 With
merging firms A and B, the UPP is the following:
𝑈𝑃𝑃𝐴 = 𝐷𝐴𝐵 × (𝑃𝐵 − 𝐶𝐵) − 𝐸𝐴 × 𝐶𝐴
Where DAB is the diversion ratio from A to B, thus the proportion of consumers who switch from A to
B if PA increases. Thereby we need to carry out consumer surveys to estimate demand function and
cross-elasticity. PB-CB is the price-cost margin that B receives in each of these switches (retrieved from
accounting data). EACA is the post-merger efficiency gain from the merger, thus the marginal cost
changes at firm A due to efficiency. If there is a positive UPP, the merger very probably has an upward
pricing pressure.
Lyons (2012) provided a good example to illustrate the UPP test (while assuming, e.g., PB-CB=20% and
EACA=5%). The following table shows the correlation between firms A, B, C and D after firm A
increased prices by 5 percent. Since A and B are close substitutes (ΔQ shows that after A’s price
increase, 15 of the 20 lost consumers switched to B), while assuming a 5 percent efficiency gain, the
merger of A and B would result in a 10 percent UPP. On the contrary, a merger between A and C or A
and D might result in a negative, thus downward, pricing pressure.
86 Originally, Werden (1996) developed the UPP model. 87 Since the authors were that time working for FTC and DoJ, their model probably influenced the new US merger guidelines
in 2010 (Lyons, 2012). 88 For a more detailed discussion on coordinated and unilateral effects see Section 4.2.2.
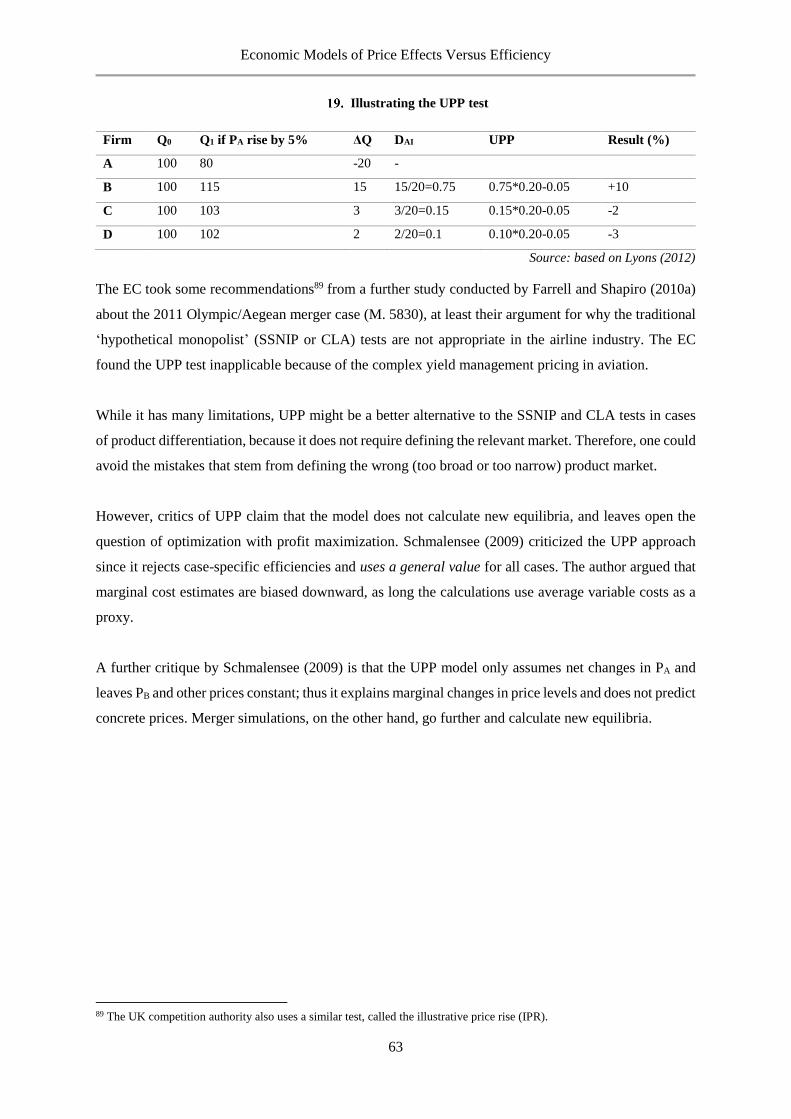
Economic Models of Price Effects Versus Efficiency
63
Illustrating the UPP test
Firm Q0 Q1 if PA rise by 5% ΔQ DAI UPP Result (%)
A 100 80 -20 -
B 100 115 15 15/20=0.75 0.75*0.20-0.05 +10
C 100 103 3 3/20=0.15 0.15*0.20-0.05 -2
D 100 102 2 2/20=0.1 0.10*0.20-0.05 -3
Source: based on Lyons (2012)
The EC took some recommendations89 from a further study conducted by Farrell and Shapiro (2010a)
about the 2011 Olympic/Aegean merger case (M. 5830), at least their argument for why the traditional
‘hypothetical monopolist’ (SSNIP or CLA) tests are not appropriate in the airline industry. The EC
found the UPP test inapplicable because of the complex yield management pricing in aviation.
While it has many limitations, UPP might be a better alternative to the SSNIP and CLA tests in cases
of product differentiation, because it does not require defining the relevant market. Therefore, one could
avoid the mistakes that stem from defining the wrong (too broad or too narrow) product market.
However, critics of UPP claim that the model does not calculate new equilibria, and leaves open the
question of optimization with profit maximization. Schmalensee (2009) criticized the UPP approach
since it rejects case-specific efficiencies and uses a general value for all cases. The author argued that
marginal cost estimates are biased downward, as long the calculations use average variable costs as a
proxy.
A further critique by Schmalensee (2009) is that the UPP model only assumes net changes in PA and
leaves PB and other prices constant; thus it explains marginal changes in price levels and does not predict
concrete prices. Merger simulations, on the other hand, go further and calculate new equilibria.
89 The UK competition authority also uses a similar test, called the illustrative price rise (IPR).
Economic Models of Price Effects Versus Efficiency
64
3.3 MERGER SIMULATIONS
“The neoclassical theory is highly manipulable and flexible (…) our models are too simple; we ignore
other arguments in the utility function, power, status, social approval, or whatnot that also motivate
individuals, and we ignore some constraints, capacity for calculations and social controls” (Arrow,
1974, p. 3).
The research field, what Bork called “speculation,” is the basis of merger simulation models. These
demand-based models estimate the price and welfare effects of mergers due to increased market share
in an oligopoly framework. Homogeneous product markets generally apply the Cournot framework
(quantity competition), while heterogeneous markets (e.g., airline services) apply the Bertrand
oligopoly (price competition) model. The Bertrand model does not necessarily require marginal cost
data for describing the profit-maximizing conditions.
Budzinski and Ruhmer (2009) provided an overview of merger simulations, with their strengths and
limitations, applied to antitrust. The authors summed up the process of building a merger simulation:90
1. Choose a demand model up to the consumer behavior91
2. Estimate or deduce own- and cross-price elasticity from the data
3. Build a demand system including pre-merger prices, elasticity and market shares
4. Model the supply side with a Cournot or Bertrand oligopoly model
5. Calculate post-merger equilibrium with new market shares.
The simple static simulation model then might be extended by product differentiation (each product
needs an own demand and cost function), efficiency gains (efficiencies are included in the cost
function), entry or exit, and welfare considerations.
Ivaldi et al (2003) summarized the static merger simulations and explained demand models with
elasticity, market power and welfare.92 To their knowledge, dynamic models have not been applied in
antitrust. The European Commission first looked at a merger simulation model in 1999 in the
Volvo/Scania case, which was presented by Ivaldi and Verboven (2005).
90 For a detailed description of how to perform a simulation model (e.g., with Mathematica software), see Werden and Froeb
(1994). Davis and Garcés (2010) also provide a good overview of building a merger simulation. 91 The authors described linear, log-linear, discrete choice (logit, nested logit and random coefficients), almost ideal (AIDS),
proportionally calibrated (PC AIDS) and multi-level demand models. They concluded that log-linear models predict the
highest price increase, while linear models predict the lowest price increase. Indeed, these two types of demand models are
hardly used, since they would assume constant own- and cross-price elasticity, which is definitely not the case in airline tickets.
Discrete choice models estimate consumer utility for differentiated products and give an option for ‘outside good’ if the
consumer does not switch but refrains from purchasing the product after a price increase. AIDS and PCAIDS models use no
demand function, but use real scanner data (which is rare and costly) and allow for a complex representation of elasticity.
Multi-level estimations distinguish between top demand in the market (with a log-linear demand function) and brand bottom
competition with the help of an AIDS model. 92 The study also introduced supply models used mainly in collusion cases.
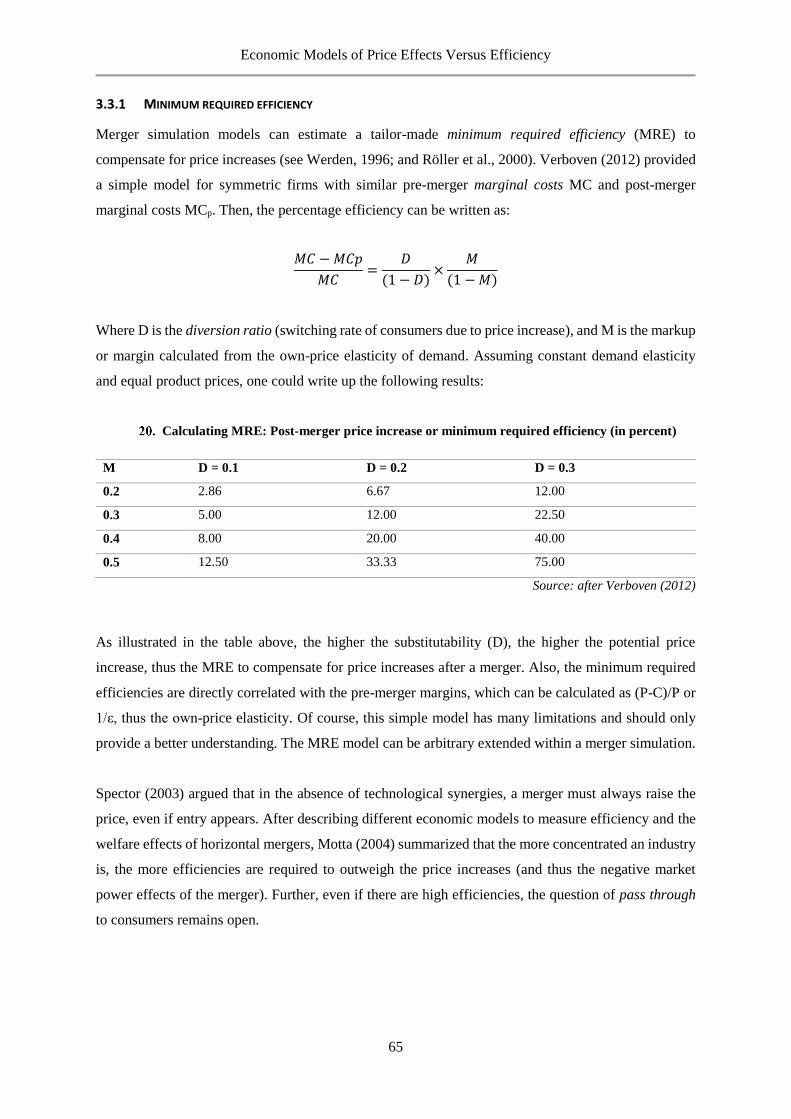
Economic Models of Price Effects Versus Efficiency
65
3.3.1 MINIMUM REQUIRED EFFICIENCY
Merger simulation models can estimate a tailor-made minimum required efficiency (MRE) to
compensate for price increases (see Werden, 1996; and Röller et al., 2000). Verboven (2012) provided
a simple model for symmetric firms with similar pre-merger marginal costs MC and post-merger
marginal costs MCp. Then, the percentage efficiency can be written as:
𝑀𝐶 − 𝑀𝐶𝑝
𝑀𝐶=
𝐷
(1 − 𝐷)×
𝑀
(1 − 𝑀)
Where D is the diversion ratio (switching rate of consumers due to price increase), and M is the markup
or margin calculated from the own-price elasticity of demand. Assuming constant demand elasticity
and equal product prices, one could write up the following results:
Calculating MRE: Post-merger price increase or minimum required efficiency (in percent)
M D = 0.1 D = 0.2 D = 0.3
0.2 2.86 6.67 12.00
0.3 5.00 12.00 22.50
0.4 8.00 20.00 40.00
0.5 12.50 33.33 75.00
Source: after Verboven (2012)
As illustrated in the table above, the higher the substitutability (D), the higher the potential price
increase, thus the MRE to compensate for price increases after a merger. Also, the minimum required
efficiencies are directly correlated with the pre-merger margins, which can be calculated as (P-C)/P or
1/ε, thus the own-price elasticity. Of course, this simple model has many limitations and should only
provide a better understanding. The MRE model can be arbitrary extended within a merger simulation.
Spector (2003) argued that in the absence of technological synergies, a merger must always raise the
price, even if entry appears. After describing different economic models to measure efficiency and the
welfare effects of horizontal mergers, Motta (2004) summarized that the more concentrated an industry
is, the more efficiencies are required to outweigh the price increases (and thus the negative market
power effects of the merger). Further, even if there are high efficiencies, the question of pass through
to consumers remains open.
Economic Models of Price Effects Versus Efficiency
66
3.3.2 THE PASS-THROUGH RATE
Ashenfelter et al. (1998) and Froeb, Tschantz and Werden (2005) tried to assess the extent to which
synergies, concerning marginal costs, will be passed on to consumers. More recently, Farrell and
Shapiro (2010b) calculated an artificial pass-through rate (PTR) for cost changes in price, which can be
also used to improve the SSNIP test. For the oligopoly environment, the formula is as follows:
𝑃𝑇𝑅 =휀
{(휀 − 1 + ⌊𝑃휀 ⌋) × (
𝑑휀𝑑𝑃
)}
Their contribution is that this ratio depends not only on the own-price elasticity ε, but also on the
demand function’s curvature dε/dP, thus on how the slope of the demand curve varies along different
price levels. The authors argued that PTR is not directly related to market power (thus saying that the
argument that firms with market power have low PTR is false), but is instead related to the shape of the
demand function. The authors argued that even if there were efficiencies, they would not be passed
through. Thus, the efficiency defense, in their view, has only a limited meaning.
Röller et al (2000) concluded that only efficiencies from variable cost savings can affect pricing
decisions, while fixed cost savings have no impact on prices. In case of variable cost, the authority
needs to know the magnitude, thus the share of these cost savings compared to all variable costs, such
as the expected time when the firm expects to realize variable cost savings (e.g., from economies of
scale). The study suggested considering synergies from quality improvements.
Weyl and Fabinger (2013) derived the pass-through ratio for different market structures and made a
complex statement about the conditions under which it might be used. Baye and Hunter (2010) were
more pessimistic and claimed that, unfortunately, it is merely conventional wisdom that efficiencies, in
the form of marginal cost savings, will be passed through to consumers. The rate depends on the degree
of competition and basically on the nature of the demand, but the authors conclude that such an analysis
“goes beyond textbook models” (p. 7).
In summary, while the research field is improving, merger simulations have many limitations in my
view. First, gathering data costs time and money, and the data is often still imperfect. Second, the more
sophisticated a model becomes, the more expertise, time and data it requires; thus the costs of merger
simulation might overcome the benefits. Still, even complex models might have less significance, due
to the increasing number of conditions and assumptions, or excluded factors: for instance, non-price
dimensions of competition (e.g., entry and exit barriers, buyer power, quality, and innovation).
Economic Models of Price Effects Versus Efficiency
67
3.4 PRICE AND WELFARE EFFECTS IN THE AIRLINE PRACTICE
“Anything is possible” (Schmalensee on industrial economics research, 1988, p. 676).
3.4.1 PRICE EFFECTS OF MERGERS
The following section93 chronologically summarizes the main literature about price estimations due to
airline mergers. Most of the studies forecasted price changes after a merger, but some authors also tried
to assess efficiencies related to the takeover.
Borenstein (1989) and Werden, Joskow and Johnson (1991) compared the first US merger cases and
found evidence of increased fares from 1985 to 1987. In the Northwest/Republic (NW-RC) case, fares
increased by 5.6 percent in the overlapping market, but decreased by 0.8 percent in the former hub
(Detroit). In the Trans World Airlines/Ozark (TW-OZ) case, fares in short-haul94 overlapping markets
increased by around 4.5 percent, while fares outside the overlapping markets decreased by 5.5 percent.
Kim and Singal (1993) analyzed 14 US airline merger cases in the period between 1985 and 1988. They
found that merged airlines increased fares by 9.44 percent more on overlapping routes than on other
routes. This price increase could even be 40 to 45 percent, if the merger involved a bankrupt airline
takeover. On routes where airlines operated from the same hub, there was some evidence of efficiency
gains. The authors pointed out that positive synergies do not arise until the end of the merger process,
while the negative effects due to increased market power emerge at an early stage. The paper concluded
that the negative effects are always greater than the positive synergies.
Evans and Kessides (1994) reviewed collusive multimarket contracts between 33 US airlines between
1984 and 1988. They noted the importance of external contracts on airfares: “fares are higher in city-
pair markets served by carriers with extensive inter route contracts” (p. 341). That proves the ‘golden
rule’: airlines do not use aggressive pricing because if the competitor behaves in the same way, a price
war will begin. The study further found that if the market structure moves from monopoly to duopoly,
prices fall by 11 percent, but a move from a four-airline to a five-airline oligopoly only changes prices
by minus 1.1 percent.
Singal (1996) considered the market shares and the relative size of the contracting/merging airlines and
calculated a price increase of 10 to 14 percent on long-haul routes after the merger. He suggested that
antitrust policy should examine not only the mergers, but also the collusive contracts. He concluded
that consumers are always worse off.
93 This chapter is mainly based on Németh and Remetei-Filep (2010) and, in particular, is identical to the text of our working
paper. 94 Short-haul means less than 1000 miles; while the effect on long-haul markets was not significant.
Economic Models of Price Effects Versus Efficiency
68
Carlsson (2002) examined the changes in market structure and their effects on prices. This was the first
study to compare airline data from eight European countries. By differentiating between business and
economy passengers, Carlsson argued that structure has no significant influence on economy ticket
prices. Since leisure passengers are price sensitive, the intermodal or airline competition is stronger.
Peters (2003) from the DoJ compared six US merger cases from the 1980s and showed the post-merger
price development. The study used two simulation models based on non-cooperative Bertrand duopoly
and cross-price elasticity by measuring product substitutability. In every case, the actual prices were
higher than those predicted by the models. The study also found increased marginal costs95 after the
merger, which questions the efficiency gains.
Kwoka and Shumilkina (2010) analyzed the USAir (now US Airways)/Piedmont Airlines (PT) case
from 1987. They showed that air fares increased by 10 to 12 percent on overlapping routes. They
assessed the anticompetitive incumbent pricing, which allows deterring entry and raising prices by 5 to
6 percent.
The following table summarizes the current state of the literature about the price effects of mergers.
While ten research papers found evidence of higher prices, two studies found no price increasing
impact. The opposing studies are representatives of the Chicago School’s view of efficiency claims and
positive network effects: Carlton et al. (1980) and Brueckner et al. (1992). Studies that found increased
prices after a merger estimated these price effects as between 5 and 14 percent.96
95 Due to high financial investments in the bankrupt airlines and increased labor costs. 96 A further extended approach is that firms might be generally worse-off after merger. Salant et al. (1983) described a special
type of Cournot oligopoly in which firms that previously colluded are worse-off after the merger due to decreased joint profits
related to less production. Perry and Porter (1985) argued that though a merger always increases prices, not every firm has an
incentive to merge. However, if the merged entity is large enough, it can compensate for the lost production with the price
increase in such a manner that a merger became profitable again. With the help of game theory, Kamien and Zang (1990)
presented the limits of monopolization in a homogeneous product industry with linear cost function. Flores-Fillol and Moner-
Colonques (2007) derived a model in which airline alliances are not profitable if there is other significant competition on the
route and traffic density is low. Socorro (2007) went further and claimed that mergers with demand uncertainty and constant
marginal costs are privately unprofitable but socially advantageous and should be publicly subsidized or granted a “limited
liability debt financing” by the state. The paper presents examples from Asian countries, the USA and Spain. The model
developed by Brander and Lewis (1986) provided the idea behind Socorro’s proposition, which states that firms with high
debt compete more aggressively and, thus, benefit consumers.
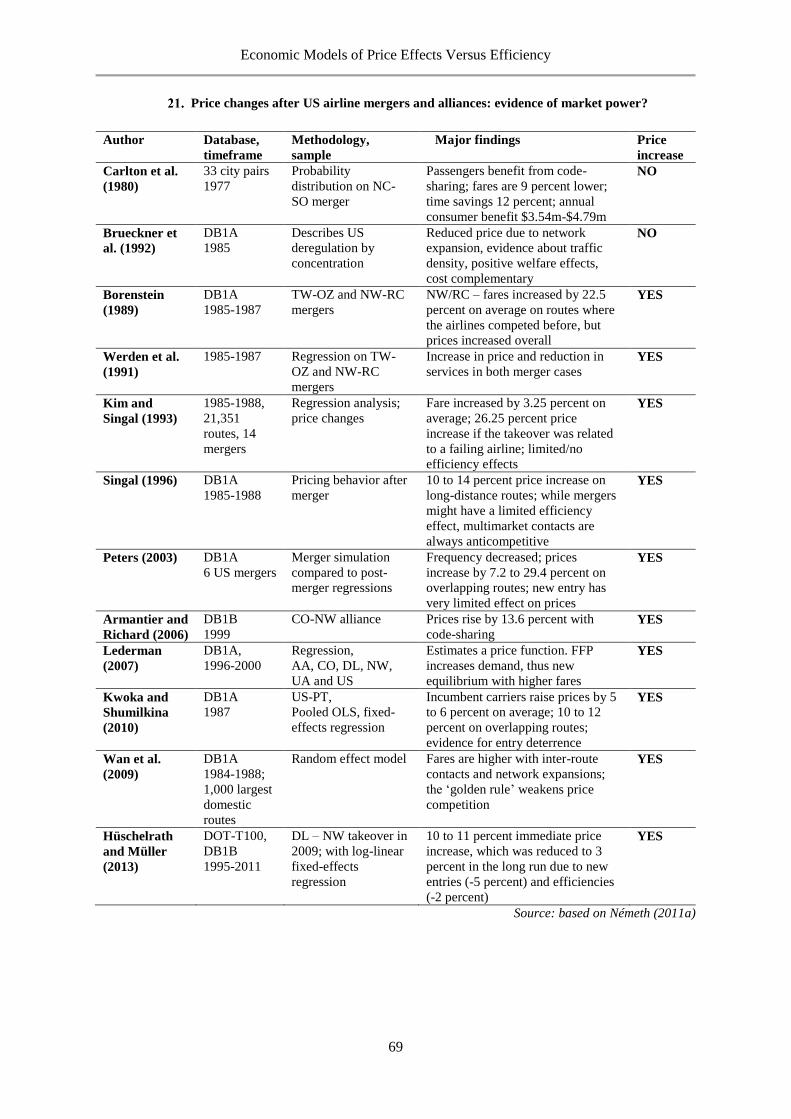
Economic Models of Price Effects Versus Efficiency
69
Price changes after US airline mergers and alliances: evidence of market power?
Author Database,
timeframe
Methodology,
sample
Major findings Price
increase
Carlton et al.
(1980)
33 city pairs
1977
Probability
distribution on NC-
SO merger
Passengers benefit from code-
sharing; fares are 9 percent lower;
time savings 12 percent; annual
consumer benefit $3.54m-$4.79m
NO
Brueckner et
al. (1992)
DB1A
1985
Describes US
deregulation by
concentration
Reduced price due to network
expansion, evidence about traffic
density, positive welfare effects,
cost complementary
NO
Borenstein
(1989)
DB1A
1985-1987
TW-OZ and NW-RC
mergers
NW/RC – fares increased by 22.5
percent on average on routes where
the airlines competed before, but
prices increased overall
YES
Werden et al.
(1991)
1985-1987 Regression on TW-
OZ and NW-RC
mergers
Increase in price and reduction in
services in both merger cases YES
Kim and
Singal (1993)
1985-1988,
21,351
routes, 14
mergers
Regression analysis;
price changes
Fare increased by 3.25 percent on
average; 26.25 percent price
increase if the takeover was related
to a failing airline; limited/no
efficiency effects
YES
Singal (1996) DB1A
1985-1988
Pricing behavior after
merger
10 to 14 percent price increase on
long-distance routes; while mergers
might have a limited efficiency
effect, multimarket contacts are
always anticompetitive
YES
Peters (2003) DB1A
6 US mergers
Merger simulation
compared to post-
merger regressions
Frequency decreased; prices
increase by 7.2 to 29.4 percent on
overlapping routes; new entry has
very limited effect on prices
YES
Armantier and
Richard (2006)
DB1B
1999
CO-NW alliance Prices rise by 13.6 percent with
code-sharing YES
Lederman
(2007)
DB1A,
1996-2000
Regression,
AA, CO, DL, NW,
UA and US
Estimates a price function. FFP
increases demand, thus new
equilibrium with higher fares
YES
Kwoka and
Shumilkina
(2010)
DB1A
1987
US-PT,
Pooled OLS, fixed-
effects regression
Incumbent carriers raise prices by 5
to 6 percent on average; 10 to 12
percent on overlapping routes;
evidence for entry deterrence
YES
Wan et al.
(2009)
DB1A
1984-1988;
1,000 largest
domestic
routes
Random effect model Fares are higher with inter-route
contacts and network expansions;
the ‘golden rule’ weakens price
competition
YES
Hüschelrath
and Müller
(2013)
DOT-T100,
DB1B
1995-2011
DL – NW takeover in
2009; with log-linear
fixed-effects
regression
10 to 11 percent immediate price
increase, which was reduced to 3
percent in the long run due to new
entries (-5 percent) and efficiencies
(-2 percent)
YES
Source: based on Németh (2011a)
Economic Models of Price Effects Versus Efficiency
70
3.4.2 PASSENGERS’ UTILITY AND TOTAL WELFARE
In order to compute welfare, Neoclassical welfare economics97 basically maximizes consumers’ utility
(e.g., with merger simulations). The main determinants of travelers’ utility are (1) the monetary cost of
the flight, (2) the preferred departure time and (3) the opportunity cost of time. The difference between
(2) and (3) is also called ‘scheduled delay’ and is inversely proportional to the flight frequency.
Applying a simple log-linear function, Peters (2003) developed the passengers’ utility model. It includes
ticket price, flight frequency, airport presence, distance and whether the flight is non-stop. His model
also measures the fixed effects of mergers in different time periods.
In the extended model, passengers’ utility is not only dependent on ticket prices, but also on schedule
delay or ‘generalized price.’ Mergers may imply better connections and lower switching costs, thus less
travel time. Therefore, even with a higher ticket price, the generalized price might be lower and
consumers might be better off after a merger.98 However, little evidence in the empirical research
supports this result.
While airlines usually benefit from a merger (increased producer surplus), consumers might be worse
off. Airline alliances and mergers cause complex welfare effects. The purpose of European competition
policy is to maintain competition and avoid harm to consumers. Applying a CS standard and focusing
only on price effects means that European competition policy should always rule against mergers.
However, case studies in Section. 3.2 illustrate the opposite behavior.99 Not even economic research
applying a TW approach with the Williamson trade-off could prove that airline mergers enhance
welfare.100 The latest European research into airlines with a TW approach concluded that the Air
France/KLM merger was anticompetitive (Brueckner & Pels, 2005).
97 Welfare economics is “the framework to measure market performance and the effects of firm behavior” (Church & Ware,
2000, p. 20). 98 I would like to thank Pilar Socorro for her useful comments and advice on extending the welfare approach and including
the advantages of airline mergers. 99 A recent incident from Australia shows the inconsistency around welfare. South African Airways had a joint venture with
Qantas on the Johannesburg to Pert and Johannesburg to Sydney routes until 2010, based on “the maintenance or promotion
of exports, and in respect of a change in productive capacity to stop decline in an industry” (ACCC, 2010, sec. 10(3)(b)(i) and
(iii)). The code sharing was first challenged (because it resulted in high airfares and entry barriers), but was then extended for
two more years. 100 E.g., Werden and Froeb (1994) simulated seven hypothetical mergers of long-distance carriers with and without cost
efficiencies. Two mergers had significant price effects and all negatively affected the consumer surplus, even within the cost
savings scenario. Total welfare decreased in every case without cost savings, but hardly increased with possible cost
efficiencies.
Economic Models of Price Effects Versus Efficiency
71
Morrison and Winston (1989) found that airline mergers might harm competition and consumers. They
analyzed six US merger cases involving 115 routes and found that passengers choose the airline that
offers the highest utility: by fare, service time, safety record, reputation and promotional offerings. They
also found that fare and service time are the most significant factors. They estimated the passengers’
value of hourly travel time at $35 and valued the transfer time even higher, allowing that if mergers
reduce transfer time, some passengers may benefit despite higher fares. They estimated that welfare
effects ranged from -$75m to +$71m annually. However, without an extended FFP, they stated that all
six mergers would harm passengers, by around an annual $335m.101 The price increasing effect spilled
over to overlapping routes.
By using merger simulation, Brueckner and Pels (2005) used the example of the KLM/Air France
merger to show that all the merger’s effects were harmful due to the loss of competition between the
two carriers inside the big alliance. In that case, the efficiencies were already exhausted because the
airlines were members of the same alliance. The authors found that the decrease in consumer surplus
was higher than the increase in profit. This result is surprising, since Brueckner and Spiller (1991)
earlier drew attention around competition policy to the (positive) network effects on air transport.
Brueckner and Pels (2005) explained that TW depends on the nature of integration (parallel versus
complementary cooperation), the strength of network effects and the gains from avoiding double
marginalization. The authors state that among the costs, two other factors influence airline fares: the
level of competition (positive) and the economies of traffic density (negative).
In contrast, Daughety (1990) described the conditions under a Cournot model, in which mergers, even
without cost efficiencies, always enhance welfare. In Daughety’s model, a merger changes the
symmetric equilibrium on the market and the behavior of the firms, which now become Stackelberg
leaders. The paper claims that symmetry (thus equal firm size) is rather welfare decreasing. Along this
line, Levin (1990) stated that mergers with less than 50 percent market share are welfare improving,
even if they reduce common output. Welfare in these models is defined as consumer and producer
surplus and corresponds to the TW standard.
101 This research leads back to an often-discussed question: do FFPs have positive or negative network effects? While merging
airlines usually claim that taking part in each other’s frequent flyer programs will have a positive network effect, some authors
argue that FFP is anticompetitive (Tretheway, 1989). I would also suggest being more skeptical about FFPs and not
automatically accepting them as a positive synergy.
Economic Models of Price Effects Versus Efficiency
72
3.4.3 AN EXAMPLE: OUR PRICE-FREQUENCY TRADE-OFF MODEL
In the following section, I will summarize the lower-price-lower-frequency trade-off model presented
in our research paper (Bilotkach et al., 2014).102 Lower frequency of service increases schedule delay,
but the entry of LCCs might result in lower airfares. Therefore, the net effect on the full price of travel
(i.e., the sum of airfare and the schedule delay) can be expressed as
𝑝 +𝛾
𝑓. The passengers’ utility is then:
𝑈 = 𝑦 − 𝑝 −𝛾
𝑓
Where y is passengers’ disposable income; f is frequency; and 𝛾 is a parameter representing the degree
to which an extra flight increases customers’ utility. Then, as in (Bilotkach et al., 2010), we can assume
that passengers’ income y is uniformly distributed on [0,1] interval and only those passengers for whom
utility is positive will travel ( 𝑦 ≥ 𝑝 +𝛾
𝑓). Then, demand for travel is given by:
𝑄 = ∫ 𝑑𝑦1
𝑝+𝛾𝑓
= 1 − 𝑝 −𝛾
𝑓
Denoting 𝛼∗ = 𝑝 +𝛾
𝑓 we define consumer surplus as:
𝐶𝑆 = ∫ 𝑦𝑑𝑦𝛼∗
0
+ ∫ (𝑦 − 𝑝 −𝛾
𝑓) 𝑑𝑦
1
𝛼∗
The first component of the above expression is the utility obtained by the customers taking the outside
option (not flying), while the second is the total utility obtained by the traveling public. After solving
the equation (see in Annex 8.3), we found that:
𝑑𝑝 <𝛾
𝑓2𝑑𝑓
The left-hand side of the above inequality is the change in price; the right-hand side is the marginal
effect of change in frequency on consumers’ utility. For instance, if 𝑑𝑓 = 0, then any decrease in price
increases consumer welfare, whereas any increase in price lowers it.
102 This section is based on our joint paper and is therefore mainly identical to the original text.
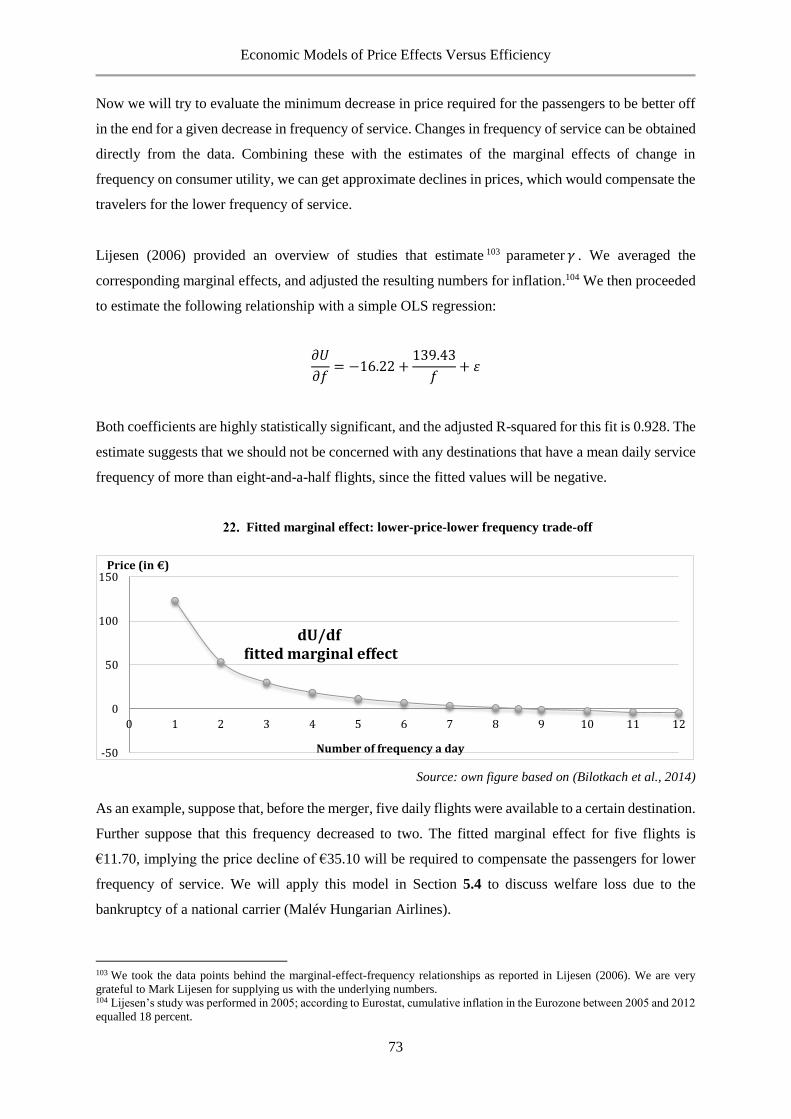
Economic Models of Price Effects Versus Efficiency
73
Now we will try to evaluate the minimum decrease in price required for the passengers to be better off
in the end for a given decrease in frequency of service. Changes in frequency of service can be obtained
directly from the data. Combining these with the estimates of the marginal effects of change in
frequency on consumer utility, we can get approximate declines in prices, which would compensate the
travelers for the lower frequency of service.
Lijesen (2006) provided an overview of studies that estimate 103 parameter 𝛾 . We averaged the
corresponding marginal effects, and adjusted the resulting numbers for inflation.104 We then proceeded
to estimate the following relationship with a simple OLS regression:
𝜕𝑈
𝜕𝑓= −16.22 +
139.43
𝑓+ 휀
Both coefficients are highly statistically significant, and the adjusted R-squared for this fit is 0.928. The
estimate suggests that we should not be concerned with any destinations that have a mean daily service
frequency of more than eight-and-a-half flights, since the fitted values will be negative.
Fitted marginal effect: lower-price-lower frequency trade-off
Source: own figure based on (Bilotkach et al., 2014)
As an example, suppose that, before the merger, five daily flights were available to a certain destination.
Further suppose that this frequency decreased to two. The fitted marginal effect for five flights is
€11.70, implying the price decline of €35.10 will be required to compensate the passengers for lower
frequency of service. We will apply this model in Section 5.4 to discuss welfare loss due to the
bankruptcy of a national carrier (Malév Hungarian Airlines).
103 We took the data points behind the marginal-effect-frequency relationships as reported in Lijesen (2006). We are very
grateful to Mark Lijesen for supplying us with the underlying numbers. 104 Lijesen’s study was performed in 2005; according to Eurostat, cumulative inflation in the Eurozone between 2005 and 2012
equalled 18 percent.
-50
0
50
100
150
0 1 2 3 4 5 6 7 8 9 10 11 12
Price (in €)
Number of frequency a day
dU/dffitted marginal effect
Economic Models of Price Effects Versus Efficiency
74
3.5 CONCLUSIONS
Chapter 3 collected economic models to measure the price and efficiency effects of airline takeovers.
Merger-specific efficiencies can be measured in a descriptive way, by regression analysis or by merger
simulation models. If there is a lack of internal (marginal) cost data, supply-side efficiencies (changes
in costs, particularly due to network effects) are difficult to calculate.
Regression analysis therefore mostly focuses on the demand side, especially on airline pricing. Some
regression models also include demand-side efficiencies. Section 3.2.1 introduced different price effect
estimation methodologies with the help of regression analysis; Section 3.2.2 extended the investigations
to include cost efficiencies.
Section 3.3 described (limited) merger simulation models, which first estimate consumers’ utility,
calculate price elasticity (i.e., set up a demand model) and then choose an oligopoly framework (the
supply model) to calculate new equilibria after the takeover. Some models also calculate the minimum
required efficiency to compensate price increases; or even the pass-through rate, in which extend
efficiencies would be passed through to consumers. Most studies conclude that efficiencies would not
be passed through at all.
As Section 3.4 summarized, most models predict a significant price increase but no direct efficiency
gain. Prices on overlapping routes tend to increase after a takeover. I used a model we developed in
Section 3.4.3 to try to estimate the frequency improvements required to compensate for higher prices.
The CS standard dictates that consumers must not be worse off after a merger. Microeconomics
measures the change in consumer surplus in money, thus in price. As long as the price increases, given
the same demand function, consumers lose money. Yet, the EC’s trend is to clear105 airline mergers.
The next chapter will investigate the EC’s merger framework in aviation to try to find the reason behind
their soft merger policy. Chapter 4 will evaluate the EC’s current merger framework with a focus on
relevant markets.
105The only exception was the Ryanair/Aer Lingus case.
The European Commission’s Merger Framework in Aviation
75
4 THE EUROPEAN COMMISSION’S MERGER FRAMEWORK IN AVIATION
“A lawyer who has not studied economics and sociology is very apt to become a public enemy” (Louis
D. Brandeis, Supreme Court, 1934, in Gellhorn and Kovacic, 1994, p. 44).
4.1 INTRODUCTION
Németh and Niemeier (2012) assessed the development of the definition of the relevant market after
liberalizing the European airline industry and found that the EC had broadened the market definition
by airport, mode of transport and flight substitution concerning leisure passengers 106 . In sum,
concentration is lower in a broader market, so mergers might be less harmful. This more laissez-faire
approach might explain the central question of merger approvals in the 2000s, even without efficiency
claims. We can observe the first signs of applying the more relaxed economic approach since 2008.
Section 4.2 will describe the theoretical framework used to analyze airline mergers and its economic
background. Section 4.3 will focus on structure and investigate the development of the relevant market
definition in practice since 1995. It will also show the advantages and disadvantages of improving the
origin and destination (O&D) route approach. Section 4.4 will assess the competitive environment of
the mergers. It concludes that more competition from rail carriers or LCCs has benefited the leisure
passenger market, but business passengers have rather limited choices on a consolidated market.
Finally, Section 4.5 will introduce the topic of EC remedies, which will be analyzed in detail in Chapter
6.
As introduced in Chapter 1, in most parts of the world (including Europe), only efficiencies passed on
to consumers matter. Competition authorities can block mergers that would raise ticket prices on
overlapping routes and harm consumers. In order to avoid the loss of competition and protect
consumers, the EC analyzes overlapping routes and, if necessary, applies remedies (e.g., slot releases).
Decisions over the past 20 years show that the majority of airline mergers have been subjected to one
or more remedies.
When European airlines (with an EU-wide turnover of over €250m) decide to merge, they need to notify
the EC. The current merger control process has two phases. In Phase I, the EC has 25 working days to
take a quick look at the merger. In Phase II, the EC has 90 working days to investigate and carry out a
multi-step analysis.
In the EC merger framework, the following four factors have to be taken into account on a case-to-case
basis: substitutes (number of firms offering similar products); degree of competition between these
106 The chapter is based on Németh and Niemeier (2012) and is, in part, identical to the text of the research paper.
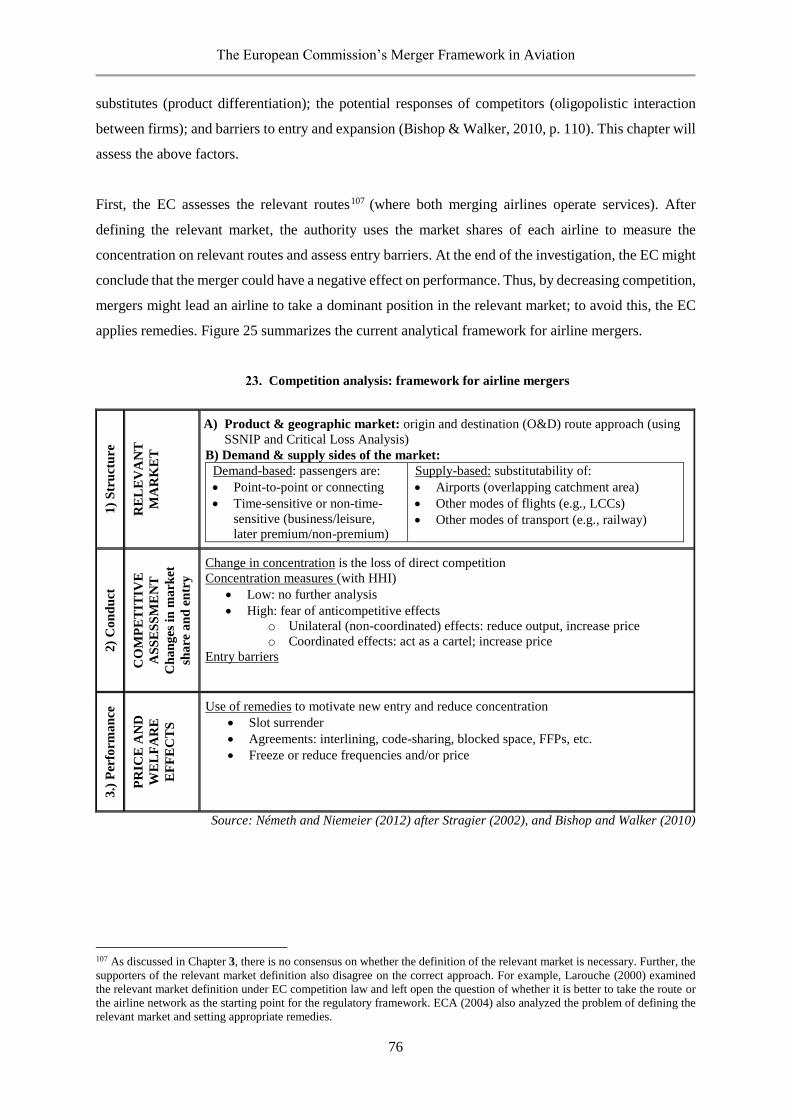
The European Commission’s Merger Framework in Aviation
76
substitutes (product differentiation); the potential responses of competitors (oligopolistic interaction
between firms); and barriers to entry and expansion (Bishop & Walker, 2010, p. 110). This chapter will
assess the above factors.
First, the EC assesses the relevant routes107 (where both merging airlines operate services). After
defining the relevant market, the authority uses the market shares of each airline to measure the
concentration on relevant routes and assess entry barriers. At the end of the investigation, the EC might
conclude that the merger could have a negative effect on performance. Thus, by decreasing competition,
mergers might lead an airline to take a dominant position in the relevant market; to avoid this, the EC
applies remedies. Figure 25 summarizes the current analytical framework for airline mergers.
Competition analysis: framework for airline mergers
1)
Str
uct
ure
RE
LE
VA
NT
MA
RK
ET
A) Product & geographic market: origin and destination (O&D) route approach (using
SSNIP and Critical Loss Analysis)
B) Demand & supply sides of the market:
Demand-based: passengers are:
Point-to-point or connecting
Time-sensitive or non-time-
sensitive (business/leisure,
later premium/non-premium)
Supply-based: substitutability of:
Airports (overlapping catchment area)
Other modes of flights (e.g., LCCs)
Other modes of transport (e.g., railway)
2)
Co
nd
uct
CO
MP
ET
ITIV
E
AS
SE
SS
ME
NT
Ch
an
ges
in
ma
rket
sha
re a
nd
en
try
Change in concentration is the loss of direct competition
Concentration measures (with HHI)
Low: no further analysis
High: fear of anticompetitive effects
o Unilateral (non-coordinated) effects: reduce output, increase price
o Coordinated effects: act as a cartel; increase price
Entry barriers
3.)
Per
form
an
ce
PR
ICE
AN
D
WE
LF
AR
E
EF
FE
CT
S
Use of remedies to motivate new entry and reduce concentration
Slot surrender
Agreements: interlining, code-sharing, blocked space, FFPs, etc.
Freeze or reduce frequencies and/or price
Source: Németh and Niemeier (2012) after Stragier (2002), and Bishop and Walker (2010)
107 As discussed in Chapter 3, there is no consensus on whether the definition of the relevant market is necessary. Further, the
supporters of the relevant market definition also disagree on the correct approach. For example, Larouche (2000) examined
the relevant market definition under EC competition law and left open the question of whether it is better to take the route or
the airline network as the starting point for the regulatory framework. ECA (2004) also analyzed the problem of defining the
relevant market and setting appropriate remedies.
The European Commission’s Merger Framework in Aviation
77
4.2 THE THEORETICAL FRAMEWORK FOR AIRLINE MERGERS
“European school is a self-contained school of thought which should not be confused with the schools
in the US, e.g., the Harvard school, the Chicago school” (Hildebrand, 2009, p. 5).
4.2.1 THE RELEVANT MARKET
In every case, the EC first defines the relevant market. According to Relevant Market Notice (EC, 1997)
the market has to be defined using the O&D route approach. “Every combination of a point of origin
and a point of destination should be considered to be a separate market” (M. 3280, 2004, p. 3). The
relevant market is not Europe or a specific city, but the city pair impacted by the proposed merger. If
the merger leads to unduly high market shares (i.e., market power on the given route (relevant market)),
the EC needs to assess any potential harm on competition.
4.2.1.1 The SSNIP test
Since 1997, EC merger policy has used the SSNIP test (EC, 1997). This small but significant non-
transitory increase in price test, also called the hypothetical monopolist test, analyzes the extent to which
sales decrease after a hypothetical108 price increase of 5 to 10 percent. If the price increase is profitable,
it means that there are no close substitutes, so it is supposed to be a separate market. Thus, we have
found the relevant market. If the price increase is not profitable, there are many close substitutes and
the market definition needs to be narrowed by taking away some products.
The question is whether passengers of merging airlines would switch from one product (flight) to
another (flight or rail) if the price of the original flight were to increase by 5 to 10 percent for one year.
If passengers are likely to switch, the two modes of transport belong to the same market.
The SSNIP test is usually based on passenger surveys and private company data. It requires data about
prices and sales to calculate demand substitution (i.e., own-price elasticity (Ε)) and data about cost
savings due to reduced sales and less production (Verboven, 2012, and Bishop and Walker, 2010). As
usual, a firm’s gross revenue is calculated as price (P) times the sold quantity (Q). Net revenue or profit
equals revenue minus costs. Own-price elasticity (Ε) is defined at the margin and measures the
percentage changes in demand due to the percentage price increase (ΔQ/ΔP). It depends on whether the
flight is long- or short-haul, international or domestic, and dominated by business or leisure
passengers.109 For example, a short-haul business passenger has an average price elasticity of Ε =-0.7
(Conrady et al., 2009, p. 353).
108 The next step is to see whether the firms have so much market power that they could actually raise prices profitably. 109 E.g., Peters (2003) compared elasticity estimations in aviation derived from different econometric models.
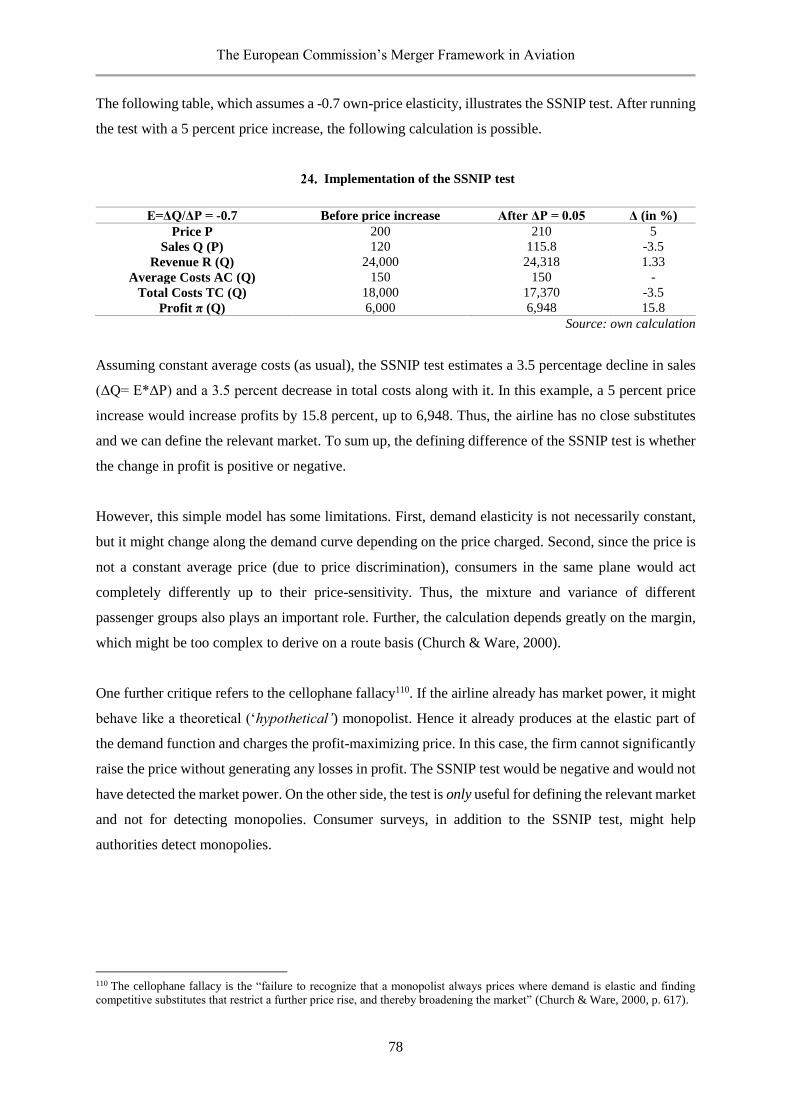
The European Commission’s Merger Framework in Aviation
78
The following table, which assumes a -0.7 own-price elasticity, illustrates the SSNIP test. After running
the test with a 5 percent price increase, the following calculation is possible.
Implementation of the SSNIP test
Ε=ΔQ/ΔP = -0.7 Before price increase After ΔP = 0.05 Δ (in %)
Price P 200 210 5
Sales Q (P) 120 115.8 -3.5
Revenue R (Q) 24,000 24,318 1.33
Average Costs AC (Q) 150 150 -
Total Costs TC (Q) 18,000 17,370 -3.5
Profit π (Q) 6,000 6,948 15.8
Source: own calculation
Assuming constant average costs (as usual), the SSNIP test estimates a 3.5 percentage decline in sales
(ΔQ= Ε*ΔP) and a 3.5 percent decrease in total costs along with it. In this example, a 5 percent price
increase would increase profits by 15.8 percent, up to 6,948. Thus, the airline has no close substitutes
and we can define the relevant market. To sum up, the defining difference of the SSNIP test is whether
the change in profit is positive or negative.
However, this simple model has some limitations. First, demand elasticity is not necessarily constant,
but it might change along the demand curve depending on the price charged. Second, since the price is
not a constant average price (due to price discrimination), consumers in the same plane would act
completely differently up to their price-sensitivity. Thus, the mixture and variance of different
passenger groups also plays an important role. Further, the calculation depends greatly on the margin,
which might be too complex to derive on a route basis (Church & Ware, 2000).
One further critique refers to the cellophane fallacy110. If the airline already has market power, it might
behave like a theoretical (‘hypothetical’) monopolist. Hence it already produces at the elastic part of
the demand function and charges the profit-maximizing price. In this case, the firm cannot significantly
raise the price without generating any losses in profit. The SSNIP test would be negative and would not
have detected the market power. On the other side, the test is only useful for defining the relevant market
and not for detecting monopolies. Consumer surveys, in addition to the SSNIP test, might help
authorities detect monopolies.
110 The cellophane fallacy is the “failure to recognize that a monopolist always prices where demand is elastic and finding
competitive substitutes that restrict a further price rise, and thereby broadening the market” (Church & Ware, 2000, p. 617).
The European Commission’s Merger Framework in Aviation
79
4.2.1.2 Critical loss analysis
The critical loss analysis111 (CLA) is very similar. It asks “how many sales a hypothetical monopolist
could afford to lose because of a price increase before the price rise becomes unprofitable” (Bishop &
Walker, 2010, p. 552). Again, the margin determines whether the price rise is profitable. The CLA
shows the break-even (i.e., how many passengers (sales) are required after the price increase to achieve
the same profit).
The first comprehensive evaluation with CLA was carried out in 2008 in the KLM/Martinair case. The
LEGC consultancy’s study (on behalf of the merging airlines) focused exclusively on the Amsterdam-
Havana route. However, the results were not taken into account in the final decision. The EC rejected
the study with the following arguments: (1) there was a contradiction between the results’ high gross
margin and high demand elasticity (high margins signal inelasticity); (2) it was assessed on a flight
focusing only on short-term effects; and (3) it contains inconsistencies in the cost calculations (e.g., too
low marginal costs).
One year later, in 2009, the EC controlled a CLA to assess the substitutability of Brussels Airport and
Antwerp in the Lufthansa/SN Brussels case (M. 5335).112 However, the question about how to use it
was left open: “The Commission does not consider the use of critical loss analysis to be appropriate in
an industry in which price discrimination is a major feature and where the calculation of avoidable costs
can be very complex” (ibid, p. 31).
Since the CLA test assumes a single price and calculates with a 5 to 10 percent change of this average
price, it provides biased results in every case. Price-sensitive passengers would immediately switch and
already-high-yield passengers would not. This result highlights the importance of the two different
markets: business and leisure.113
In summary, based on the shortcomings described in the introduction to this chapter, the EC declared
that the use of a CLA is inappropriate in aviation due to the lack of transparency in costs and price
structure. However, the EC still applies the SSNIP test, which has similar features.
111 For more about the CLA, see Werden (1996), Baker (2007b) and Farrell and Shapiro (2010a). 112 The EC concluded, “it is not likely that the merger would benefit consumers on the affected routes to such an extent that
they could counter-balance the competitive harm” (ibid, p. 112). Despite this potential harm, the EC allowed the merger. 113 Leisure passengers who hold economy-class tickets are price-sensitive but not time-sensitive.
The European Commission’s Merger Framework in Aviation
80
4.2.2 (ANTI)COMPETITIVE ASSESSMENT: CONCENTRATION AND DOMINANCE
The change in concentration caused by a merger indicates the loss of direct competition.114 If the
modification is high, there is a potential competitive harm. The data used for the analysis is based on
reliable sources:115 the ‘future competitive significance indicators.’ If the relevant market is highly
concentrated, there might be a fear of anticompetitive behavior. This section briefly summarizes the
most important types of anticompetitive behavior.
Chicago School economists like Demsetz or Posner would argue for efficiency behind the concentration
and probably clear the mergers. Farrell and Shapiro (1990), following this approach, showed that a high
concentration leads to larger, more efficient firms with lower unit costs. In the Cournot model, the firms
with the lowest marginal cost produce the most product. The Austrian School, especially Schumpeter,
would prefer large firms (monopolies in particular) to encourage innovation and dynamic efficiency.
However, these economic schools have had little influence on European merger policy. Europe has
followed the Harvard School’s view that high market share equals market power. Most commonly, EC
policy uses the Herfindahl-Hirschman Index (HHI) to measure industry concentration.
HHI is the sum of squaring the market shares (w) of each firm within an industry. The number ranges
from 0 to 10,000; the higher the number, the higher the concentration. While the US Horizontal Merger
Guidelines contain stricter thresholds based on HHI, the EC might intervene if the HHI value after
merger increases 2,500 or if the change in the index due to takeover exceeds 150 to 250 (Bishop &
Walker, 2010). The index is calculated as follows:
𝐻𝐻𝐼 = 10,000 ∑ 𝑤𝑖2
Carlsson (2002) defined market share as the airline’s share of the aggregate number of seats, while
Peters (2003) based it on airline revenues instead of passenger shares. After measuring market shares
and the competitive environment, 116 authorities can suggest whether a merger is likely to have
anticompetitive consequences or not.
There are two types of anticompetitive behavior: unilateral and coordinated effects. They depend on
market share, product similarities, price elasticities, capacity constraints, switching costs and entry
barriers (Buccirossi et al., 2008).
114 E.g., Campos and Romero (2008) presented a complex approach for weighting the market power of airlines. 115 E.g., trade associations, market sources, market research studies, companies’ estimates or consultancy agents, comparative
statistics, sales, production and capacity data. 116 Supply-side substitutes, which could receive more weight in the future, are the competition by feeder carrier and LCCs;
airport substitution; and alternative transport modes.
The European Commission’s Merger Framework in Aviation
81
Coordinated effects occur “if the airlines coordinate their behavior in an anticompetitive manner”
(Bishop & Walker, 2010, p. 355). This means the firms act as if they were a cartel. This behavior is also
known as ‘tacit collusion’ or collective dominance. Collusion is more probable if there are only a few
firms on the market with transparent prices, similar cost structures and homogeneous goods. After a
merger, the market structure is more conducive to collusion and therefore the price will go up.117 Ivaldi
et al. (2003) concluded that in the absence of entry barriers, collusion is unlikely.118
We talk about unilateral (US) or non-coordinated (EU) effects when firms price independently and the
nature of competition does not change after the merger. In this case, the merged entity probably also
increases the price. Lyons (2012) argued that there must be an efficiency reason behind the merger since
without efficiencies, companies would have to merge up to an 80 percent market share to be profitable.
Peters (2003) highlighted another form of anticompetitive behavior: post-merger entry deterrence. He
stated that entry has very small effects on prices and concluded that the policy “should not be expected
to yield large gains” from expected new entries (p. 45). Entry deterrence, like foreclosure, might be a
strategic option for maintaining market position. Airlines with market power can use limit pricing
possessing valuable slots to behave anticompetitive and deter entry. Economies of scale can also create
entry barriers and help airlines keep smaller competitors out of the market. On the other side, Shy (2010,
p. 18) argued that cooperation by allowing access to the own standard (like common FFP) is a better
long-run strategic behavior than deterrence.
The EC considers potential market entry to be a constraint of anticompetitive behavior. In their view,
the threats of market entry after the merger or of rivals seeming to expand capacity to maintain their
market positions lessen the feasibility of harm (Németh, 2011b). This approach arises from the
contestability theory discussed in Section 1.3.3. Liberalization in European aviation started in 1993 and
was based on contestability. However, recent research has questioned the contestability of the aviation
market (e.g., Arndt, 2004), especially because of high sunk costs and the slot system in Europe.119
117 The EC did not look at coordinated effects until the Nestlé/Perrier case (merging from 3 to 2) in 1991. The second
remarkable case involved Airtours in 1998 (merging from 4 to 3); the merger was prohibited based on coordinated effects, but
Airtours appeared before the EU Court, questioned the quality of the analysis and won against the EC. In the US, we can find
many examples involving airlines (mostly merging from 6 to 5), but in every case there was a ‘maverick’: the weakest LCC
airline with a small market share had a strong incentive to deviate and detect collusion (Lyons, 2012). 118 In cases of collusion, the result is worse than in a monopoly (Brueckner & Pels, 2005, p. 37). If airlines collude, they split
passengers, thus limiting economies of density. This leads to higher costs, lower traffic and more expensive ticket prices. From
a consumer surplus approach, this might be the worst outcome. Adler and Hanany (2010) argued that capacity agreements are
also worse than mergers. When airlines set capacity jointly but do not have any pooling agreements (meaning they do not
provide access to each other’s capacity), this leads to lower capacity, higher prices and a reduction in consumer surplus. 119 Werden et al. (1991), Reiss and Spiller (1989), Berry (1992), Joskow et al. (1994), Sinclair (1995), Dunn (2008), Lin et al.
(2002), Oliveira (2008), and Goolsbee and Syverson (2008) have assessed entry in the airline industry. Most of these studies
deal with the US market, and some pay specific attention to LCCs. Ciliberto and Williams (2010) analyzed the access to airport
facilities as a determinant of market power in the airline industry (Bilotkach et al., 2014). Balfour (2004) introduced the EC
practice according to the remedies in airline alliance cases.
The European Commission’s Merger Framework in Aviation
82
4.3 REMEDIES: SLOTS RELEASES TO PROMOTE COMPETITION
“Slot allocation will not go away even with airport expansion; there will always be a need to have some
basis of allocation. Issues of equity, efficiency and competition are all intertwined in such methods of
allocation” (Gillen, 2008, p. 52).
The current slot system might impede contestability. The landing or takeoff right to use airport
infrastructure (thus scarce airport capacities) during a given period of time (EC, 2004) can be a serious
barrier to entry for new entrants at slot-coordinated airports. The grandfather rights120 of incumbent
carriers, the IATA slot allocation system and the high capacity utilization at some airports can make it
almost impossible to get new slots.
Knieps (2004) warned that slots could be stockpiled for anticompetitive purposes and suggested that
airport operators conduct ex ante auctions, which could finance airport (capacity) developments from
scarcity rents. Knieps and Neuscheler (2009) made a detailed proposal about slot auction and its
potential pricing scheme.
Czerny et al. (2008) provided a comprehensive overview of several issues related to slot allocation and
its possible reform, pricing and regulation at slot-coordinated airports and their efficiencies based on
international evidence. Starkie (2008) defended the high slot concentrations at hub airports, which
generally increases efficiency due to network effects, but also benefits secondary airports with LCCs.
Since the current slot allocation system does not facilitate new entries and the secondary trading of slots
is not allowed in Europe (but happens in the UK, according to Gillen, 2008, p. 45), an airline can obtain
access to new markets by taking over a small regional airline with valuable slots at a hub airport.121
This can also motivate airline mergers.
However, if a takeover leads the merged entity to take a dominant position on a given route (usually
above 50 percent common market share), the European Commission can introduce remedies122 (i.e.,
undertakings) that define the conditions under which a merger would be approved. In most cases, the
release or surrender of slots is one of those conditions, to allow for new entry to mitigate the dominant
position. Merging airlines have to announce that they are making some of their slots available for new
entrants for free. This is important at slot-coordinated airports,123 where scarce slots would deter entry
and impede competition.
120 Airlines that previously received a slot (i.e., grandfathers) can keep it, but they are obligated to use it at least 80 percent of
the time. If they do not, they can lose it in the next period following the ‘use-it-or-lose-it’ rule. 121 Which was the case, for example, in the Lufthansa/bmi merger. 122 Or even prohibit the merger. The only prohibition in the last 20 years was in the Ryanair/Aer Lingus case (M. 4439, 2007). 123 For example, the slot-coordinated airports in Germany are Munich, Stuttgart, Frankfurt, Dusseldorf and Berlin. According
to current data (IATA, 2010), there are 155 slot-coordinated airports worldwide, 98 of which are in Europe. Greece has the
highest share (23) of slot-coordinated airports, but the busiest cities in Europe are coordinated as well.
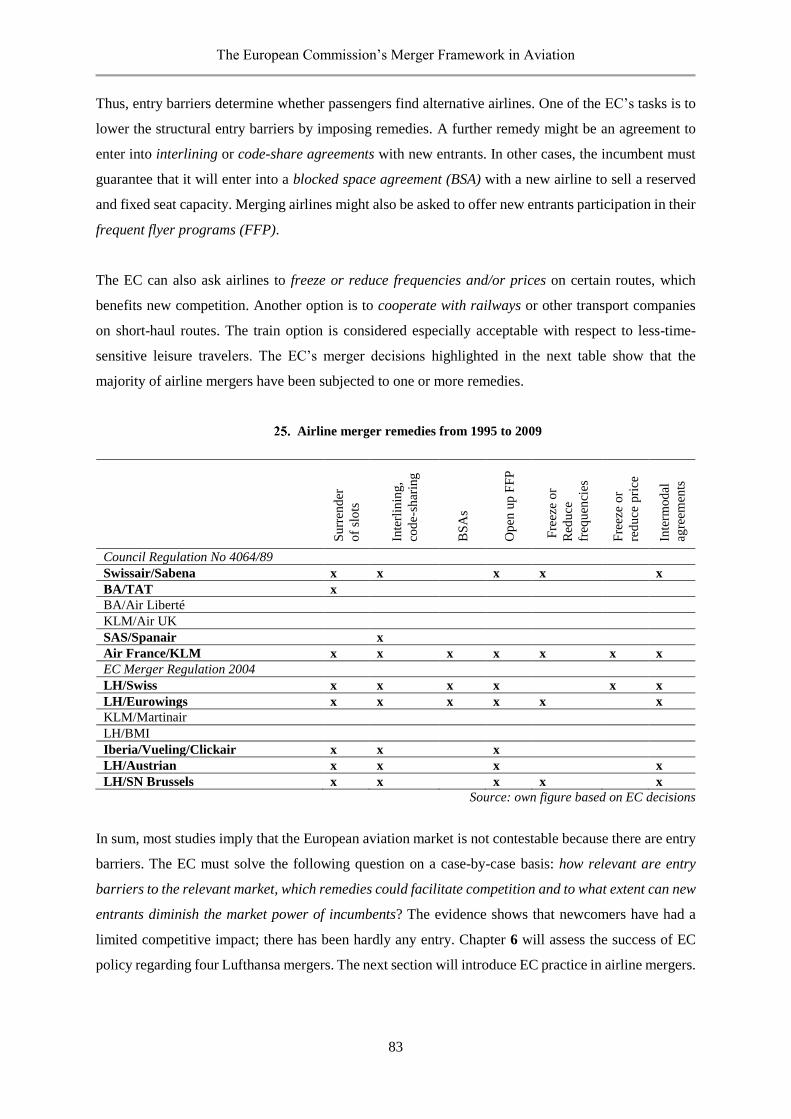
The European Commission’s Merger Framework in Aviation
83
Thus, entry barriers determine whether passengers find alternative airlines. One of the EC’s tasks is to
lower the structural entry barriers by imposing remedies. A further remedy might be an agreement to
enter into interlining or code-share agreements with new entrants. In other cases, the incumbent must
guarantee that it will enter into a blocked space agreement (BSA) with a new airline to sell a reserved
and fixed seat capacity. Merging airlines might also be asked to offer new entrants participation in their
frequent flyer programs (FFP).
The EC can also ask airlines to freeze or reduce frequencies and/or prices on certain routes, which
benefits new competition. Another option is to cooperate with railways or other transport companies
on short-haul routes. The train option is considered especially acceptable with respect to less-time-
sensitive leisure travelers. The EC’s merger decisions highlighted in the next table show that the
majority of airline mergers have been subjected to one or more remedies.
Airline merger remedies from 1995 to 2009
Su
rren
der
of
slo
ts
Inte
rlin
ing
,
cod
e-sh
arin
g
BS
As
Op
en u
p F
FP
Fre
eze
or
Red
uce
freq
uen
cies
Fre
eze
or
red
uce
pri
ce
Inte
rmod
al
agre
emen
ts
Council Regulation No 4064/89
Swissair/Sabena x x x x x
BA/TAT x
BA/Air Liberté
KLM/Air UK
SAS/Spanair x
Air France/KLM x x x x x x x
EC Merger Regulation 2004
LH/Swiss x x x x x x
LH/Eurowings x x x x x x
KLM/Martinair
LH/BMI
Iberia/Vueling/Clickair x x x
LH/Austrian x x x x
LH/SN Brussels x x x x x
Source: own figure based on EC decisions
In sum, most studies imply that the European aviation market is not contestable because there are entry
barriers. The EC must solve the following question on a case-by-case basis: how relevant are entry
barriers to the relevant market, which remedies could facilitate competition and to what extent can new
entrants diminish the market power of incumbents? The evidence shows that newcomers have had a
limited competitive impact; there has been hardly any entry. Chapter 6 will assess the success of EC
policy regarding four Lufthansa mergers. The next section will introduce EC practice in airline mergers.

The European Commission’s Merger Framework in Aviation
84
4.4 THE PRACTICE: DEVELOPMENT OF THE EC-RELEVANT MARKET DEFINITION
“More effective competition policy means less need for regulation” (Vickers, 2003, p. 3).
The OECD (2000) already called attention to the importance of the relevant market definition and the
fear of definitions that are too broad or too narrow. This section will introduce the similarities and
differences in the airline merger processes approved by the European Commission.
Németh and Niemeier (2012) assessed the development of the definition of the relevant market after
the European airline industry was liberalized. Figure 28 summarizes the results. Since the paper was
published in 2012, I will briefly summarize the main airline takeovers since that time. First, Lufthansa
sold bmi to IAG (the holding company of British Airways) in March 2012 (M. 6447).
Second, the EC blocked the Aegean Airlines/Olympic Air takeover in January 2011, saying that “it is
the duty of the Commission to prevent the creation of monopolies” (EC, 2011, p. 1). However, it was
approved in October 2013, when the same Commissioner, Joaquín Almuna, said: “Olympic would be
forced to leave the market soon in any event” (EC, 2013, p. 1). This was the third case in the last two
decades in which the EC accepted the failing firm doctrine (for more about this approach, see Chapter
5). Olympic, creating operating losses of €15m in 2012, had never made a profit (Financial Times,
2013). The former flag carrier of Greece had many troubles with the EC. After several investigations
about state aid, the EC required the airline to pay back more than €850m to Greece. Unsurprisingly, it
never happened (Németh, 2011b).
Third, Ryanair had not given up on taking over Aer Lingus in the time between the three negative EC
decisions (M. 4439, 2007; M. 5434, 2009; and M. 6663, 2013). The merger was rejected for three
reasons: both airlines operated from the same country and the same hub (Dublin airport); both were
LCCs; and finally the number of overlapping routes was very high (22 would have become monopolies).
The first and last claims were also mentioned in the Aegean/Olympic case, but after the first denial in
2011, the airlines reduced the common routes without competitors from nine to five. After three
unsuccessful bids from Ryanair (most recently in July 2015), the EC allowed IAG to take over Aer
Lingus (M. 7541). As a main remedy, the merged entity would provide up to five daily slot pairs at
London Gatwick to Dublin and Belfast.
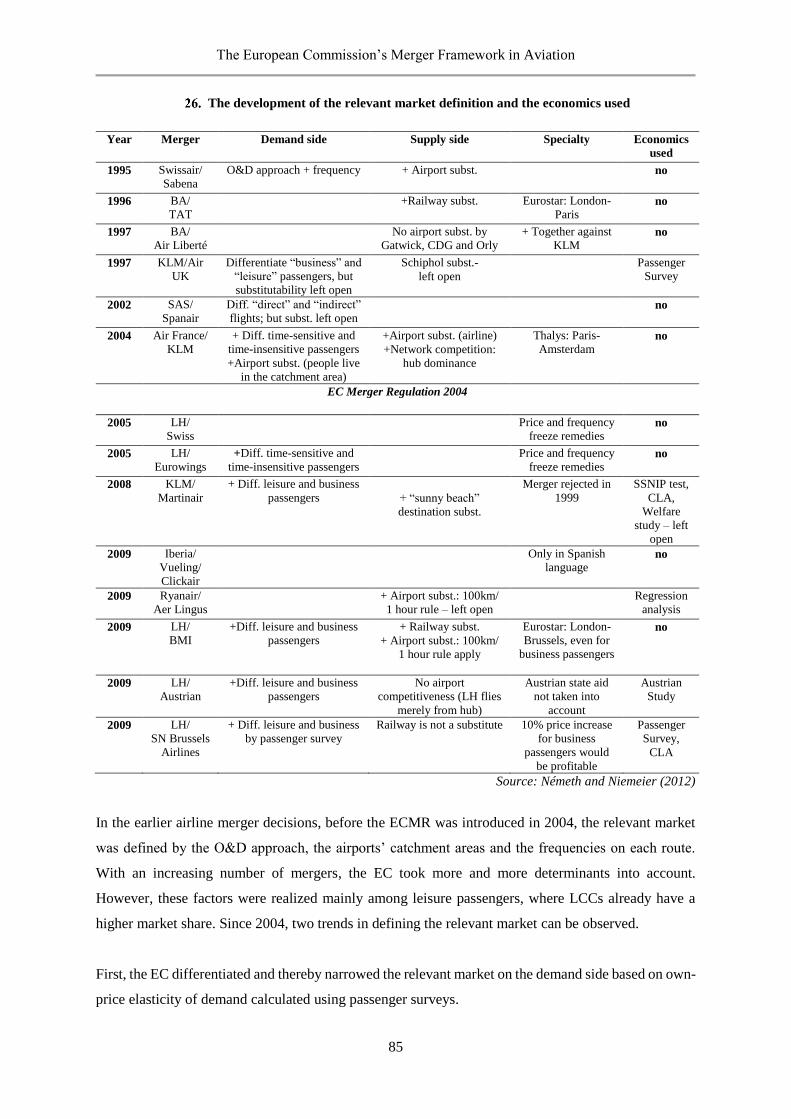
The European Commission’s Merger Framework in Aviation
85
The development of the relevant market definition and the economics used
Year Merger Demand side Supply side Specialty Economics
used
1995 Swissair/
Sabena
O&D approach + frequency + Airport subst. no
1996 BA/
TAT +Railway subst. Eurostar: London-
Paris
no
1997 BA/
Air Liberté No airport subst. by
Gatwick, CDG and Orly
+ Together against
KLM no
1997 KLM/Air
UK
Differentiate “business” and
“leisure” passengers, but
substitutability left open
Schiphol subst.-
left open Passenger
Survey
2002 SAS/
Spanair
Diff. “direct” and “indirect”
flights; but subst. left open no
2004 Air France/
KLM
+ Diff. time-sensitive and
time-insensitive passengers
+Airport subst. (people live
in the catchment area)
+Airport subst. (airline)
+Network competition:
hub dominance
Thalys: Paris-
Amsterdam no
EC Merger Regulation 2004
2005 LH/
Swiss Price and frequency
freeze remedies no
2005 LH/
Eurowings
+Diff. time-sensitive and
time-insensitive passengers
Price and frequency
freeze remedies no
2008 KLM/
Martinair
+ Diff. leisure and business
passengers
+ “sunny beach”
destination subst.
Merger rejected in
1999
SSNIP test,
CLA,
Welfare
study – left
open
2009 Iberia/
Vueling/
Clickair
Only in Spanish
language no
2009 Ryanair/
Aer Lingus
+ Airport subst.: 100km/
1 hour rule – left open
Regression
analysis
2009 LH/
BMI
+Diff. leisure and business
passengers
+ Railway subst.
+ Airport subst.: 100km/
1 hour rule apply
Eurostar: London-
Brussels, even for
business passengers
no
2009 LH/
Austrian
+Diff. leisure and business
passengers
No airport
competitiveness (LH flies
merely from hub)
Austrian state aid
not taken into
account
Austrian
Study
2009 LH/
SN Brussels
Airlines
+ Diff. leisure and business
by passenger survey
Railway is not a substitute 10% price increase
for business
passengers would
be profitable
Passenger
Survey,
CLA
Source: Németh and Niemeier (2012)
In the earlier airline merger decisions, before the ECMR was introduced in 2004, the relevant market
was defined by the O&D approach, the airports’ catchment areas and the frequencies on each route.
With an increasing number of mergers, the EC took more and more determinants into account.
However, these factors were realized mainly among leisure passengers, where LCCs already have a
higher market share. Since 2004, two trends in defining the relevant market can be observed.
First, the EC differentiated and thereby narrowed the relevant market on the demand side based on own-
price elasticity of demand calculated using passenger surveys.
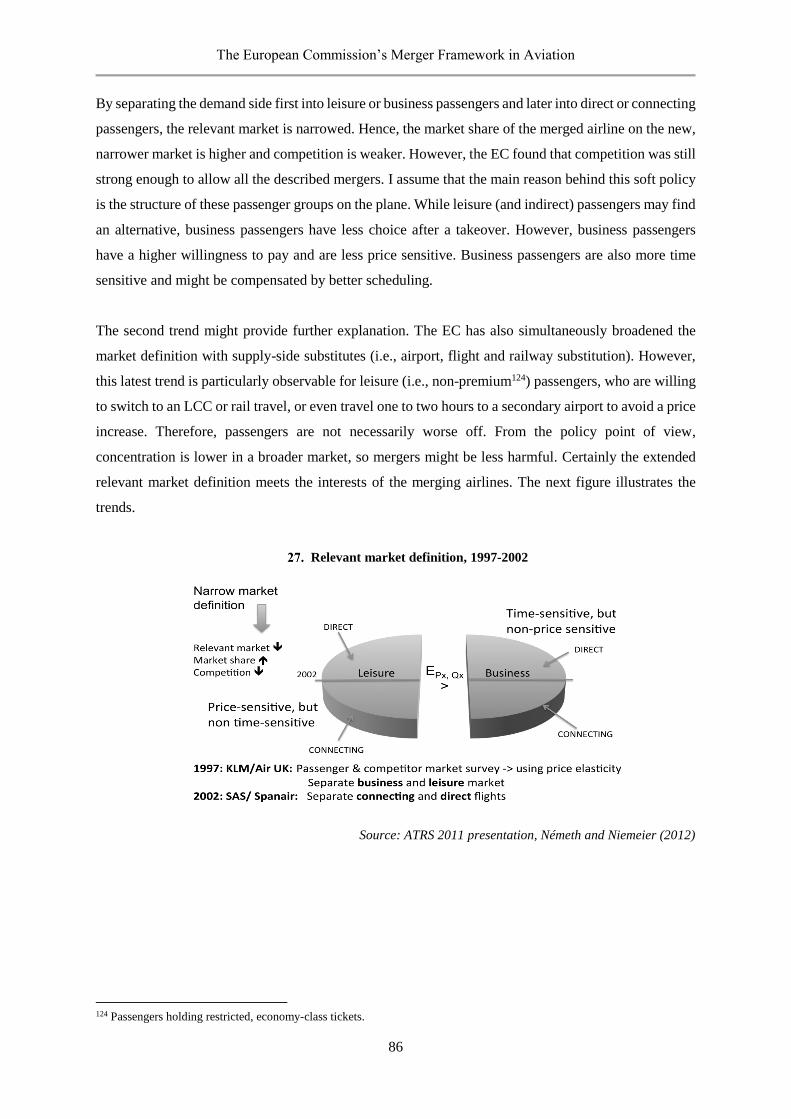
The European Commission’s Merger Framework in Aviation
86
By separating the demand side first into leisure or business passengers and later into direct or connecting
passengers, the relevant market is narrowed. Hence, the market share of the merged airline on the new,
narrower market is higher and competition is weaker. However, the EC found that competition was still
strong enough to allow all the described mergers. I assume that the main reason behind this soft policy
is the structure of these passenger groups on the plane. While leisure (and indirect) passengers may find
an alternative, business passengers have less choice after a takeover. However, business passengers
have a higher willingness to pay and are less price sensitive. Business passengers are also more time
sensitive and might be compensated by better scheduling.
The second trend might provide further explanation. The EC has also simultaneously broadened the
market definition with supply-side substitutes (i.e., airport, flight and railway substitution). However,
this latest trend is particularly observable for leisure (i.e., non-premium124) passengers, who are willing
to switch to an LCC or rail travel, or even travel one to two hours to a secondary airport to avoid a price
increase. Therefore, passengers are not necessarily worse off. From the policy point of view,
concentration is lower in a broader market, so mergers might be less harmful. Certainly the extended
relevant market definition meets the interests of the merging airlines. The next figure illustrates the
trends.
Relevant market definition, 1997-2002
Source: ATRS 2011 presentation, Németh and Niemeier (2012)
124 Passengers holding restricted, economy-class tickets.
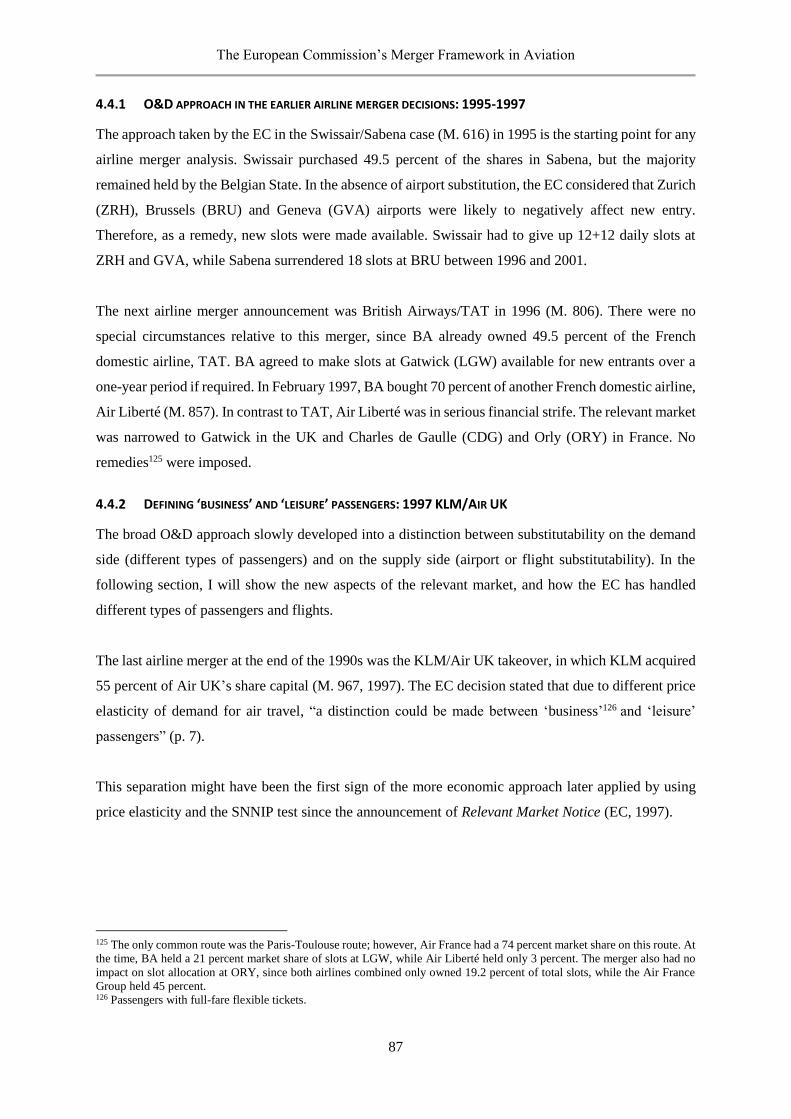
The European Commission’s Merger Framework in Aviation
87
4.4.1 O&D APPROACH IN THE EARLIER AIRLINE MERGER DECISIONS: 1995-1997
The approach taken by the EC in the Swissair/Sabena case (M. 616) in 1995 is the starting point for any
airline merger analysis. Swissair purchased 49.5 percent of the shares in Sabena, but the majority
remained held by the Belgian State. In the absence of airport substitution, the EC considered that Zurich
(ZRH), Brussels (BRU) and Geneva (GVA) airports were likely to negatively affect new entry.
Therefore, as a remedy, new slots were made available. Swissair had to give up 12+12 daily slots at
ZRH and GVA, while Sabena surrendered 18 slots at BRU between 1996 and 2001.
The next airline merger announcement was British Airways/TAT in 1996 (M. 806). There were no
special circumstances relative to this merger, since BA already owned 49.5 percent of the French
domestic airline, TAT. BA agreed to make slots at Gatwick (LGW) available for new entrants over a
one-year period if required. In February 1997, BA bought 70 percent of another French domestic airline,
Air Liberté (M. 857). In contrast to TAT, Air Liberté was in serious financial strife. The relevant market
was narrowed to Gatwick in the UK and Charles de Gaulle (CDG) and Orly (ORY) in France. No
remedies125 were imposed.
4.4.2 DEFINING ‘BUSINESS’ AND ‘LEISURE’ PASSENGERS: 1997 KLM/AIR UK
The broad O&D approach slowly developed into a distinction between substitutability on the demand
side (different types of passengers) and on the supply side (airport or flight substitutability). In the
following section, I will show the new aspects of the relevant market, and how the EC has handled
different types of passengers and flights.
The last airline merger at the end of the 1990s was the KLM/Air UK takeover, in which KLM acquired
55 percent of Air UK’s share capital (M. 967, 1997). The EC decision stated that due to different price
elasticity of demand for air travel, “a distinction could be made between ‘business’126 and ‘leisure’
passengers” (p. 7).
This separation might have been the first sign of the more economic approach later applied by using
price elasticity and the SNNIP test since the announcement of Relevant Market Notice (EC, 1997).
125 The only common route was the Paris-Toulouse route; however, Air France had a 74 percent market share on this route. At
the time, BA held a 21 percent market share of slots at LGW, while Air Liberté held only 3 percent. The merger also had no
impact on slot allocation at ORY, since both airlines combined only owned 19.2 percent of total slots, while the Air France
Group held 45 percent. 126 Passengers with full-fare flexible tickets.
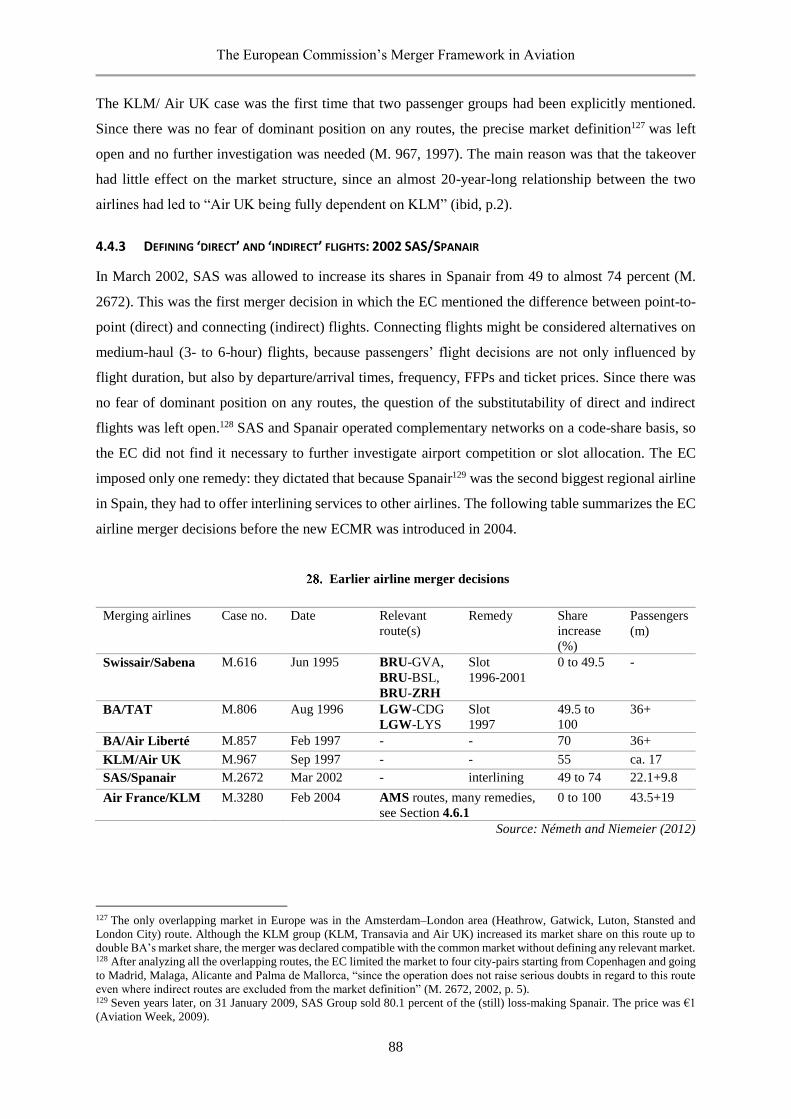
The European Commission’s Merger Framework in Aviation
88
The KLM/ Air UK case was the first time that two passenger groups had been explicitly mentioned.
Since there was no fear of dominant position on any routes, the precise market definition127 was left
open and no further investigation was needed (M. 967, 1997). The main reason was that the takeover
had little effect on the market structure, since an almost 20-year-long relationship between the two
airlines had led to “Air UK being fully dependent on KLM” (ibid, p.2).
4.4.3 DEFINING ‘DIRECT’ AND ‘INDIRECT’ FLIGHTS: 2002 SAS/SPANAIR
In March 2002, SAS was allowed to increase its shares in Spanair from 49 to almost 74 percent (M.
2672). This was the first merger decision in which the EC mentioned the difference between point-to-
point (direct) and connecting (indirect) flights. Connecting flights might be considered alternatives on
medium-haul (3- to 6-hour) flights, because passengers’ flight decisions are not only influenced by
flight duration, but also by departure/arrival times, frequency, FFPs and ticket prices. Since there was
no fear of dominant position on any routes, the question of the substitutability of direct and indirect
flights was left open.128 SAS and Spanair operated complementary networks on a code-share basis, so
the EC did not find it necessary to further investigate airport competition or slot allocation. The EC
imposed only one remedy: they dictated that because Spanair129 was the second biggest regional airline
in Spain, they had to offer interlining services to other airlines. The following table summarizes the EC
airline merger decisions before the new ECMR was introduced in 2004.
Earlier airline merger decisions
Merging airlines Case no. Date Relevant
route(s)
Remedy Share
increase
(%)
Passengers
(m)
Swissair/Sabena M.616 Jun 1995 BRU-GVA,
BRU-BSL,
BRU-ZRH
Slot
1996-2001
0 to 49.5 -
BA/TAT M.806 Aug 1996 LGW-CDG
LGW-LYS
Slot
1997
49.5 to
100
36+
BA/Air Liberté M.857 Feb 1997 - - 70 36+
KLM/Air UK M.967 Sep 1997 - - 55 ca. 17
SAS/Spanair M.2672 Mar 2002 - interlining 49 to 74 22.1+9.8
Air France/KLM M.3280 Feb 2004 AMS routes, many remedies,
see Section 4.6.1
0 to 100 43.5+19
Source: Németh and Niemeier (2012)
127 The only overlapping market in Europe was in the Amsterdam–London area (Heathrow, Gatwick, Luton, Stansted and
London City) route. Although the KLM group (KLM, Transavia and Air UK) increased its market share on this route up to
double BA’s market share, the merger was declared compatible with the common market without defining any relevant market. 128 After analyzing all the overlapping routes, the EC limited the market to four city-pairs starting from Copenhagen and going
to Madrid, Malaga, Alicante and Palma de Mallorca, “since the operation does not raise serious doubts in regard to this route
even where indirect routes are excluded from the market definition” (M. 2672, 2002, p. 5). 129 Seven years later, on 31 January 2009, SAS Group sold 80.1 percent of the (still) loss-making Spanair. The price was €1
(Aviation Week, 2009).
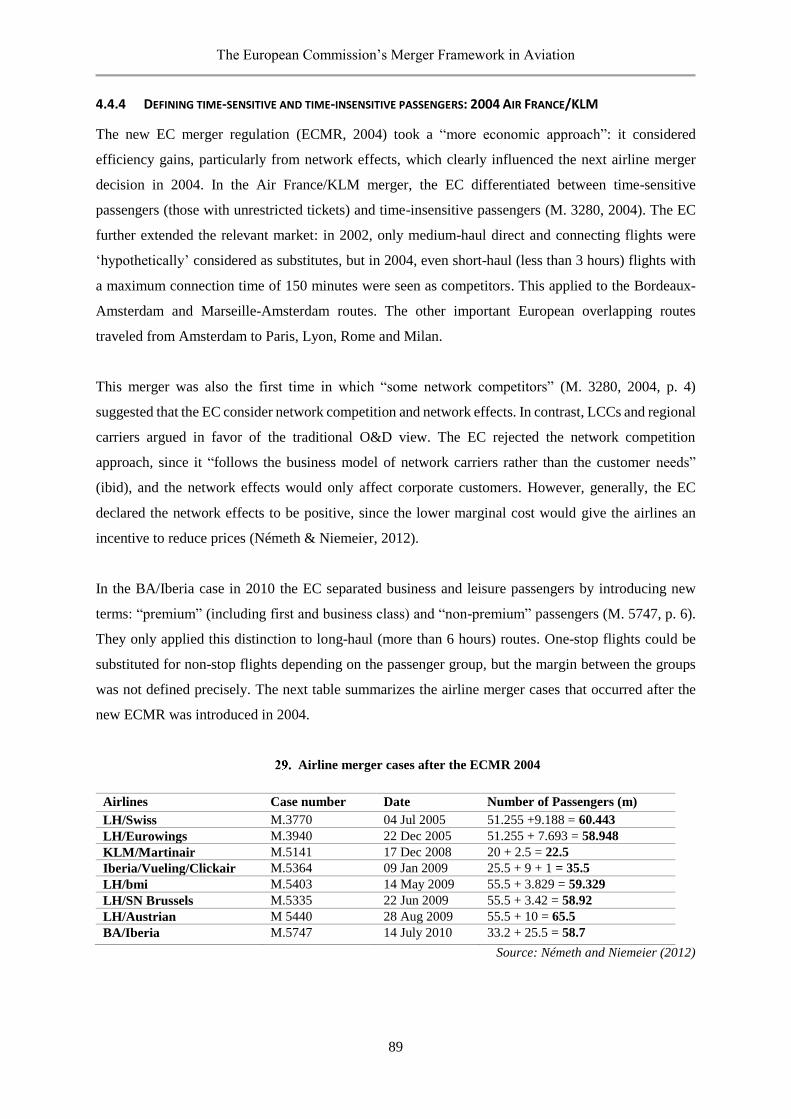
The European Commission’s Merger Framework in Aviation
89
4.4.4 DEFINING TIME-SENSITIVE AND TIME-INSENSITIVE PASSENGERS: 2004 AIR FRANCE/KLM
The new EC merger regulation (ECMR, 2004) took a “more economic approach”: it considered
efficiency gains, particularly from network effects, which clearly influenced the next airline merger
decision in 2004. In the Air France/KLM merger, the EC differentiated between time-sensitive
passengers (those with unrestricted tickets) and time-insensitive passengers (M. 3280, 2004). The EC
further extended the relevant market: in 2002, only medium-haul direct and connecting flights were
‘hypothetically’ considered as substitutes, but in 2004, even short-haul (less than 3 hours) flights with
a maximum connection time of 150 minutes were seen as competitors. This applied to the Bordeaux-
Amsterdam and Marseille-Amsterdam routes. The other important European overlapping routes
traveled from Amsterdam to Paris, Lyon, Rome and Milan.
This merger was also the first time in which “some network competitors” (M. 3280, 2004, p. 4)
suggested that the EC consider network competition and network effects. In contrast, LCCs and regional
carriers argued in favor of the traditional O&D view. The EC rejected the network competition
approach, since it “follows the business model of network carriers rather than the customer needs”
(ibid), and the network effects would only affect corporate customers. However, generally, the EC
declared the network effects to be positive, since the lower marginal cost would give the airlines an
incentive to reduce prices (Németh & Niemeier, 2012).
In the BA/Iberia case in 2010 the EC separated business and leisure passengers by introducing new
terms: “premium” (including first and business class) and “non-premium” passengers (M. 5747, p. 6).
They only applied this distinction to long-haul (more than 6 hours) routes. One-stop flights could be
substituted for non-stop flights depending on the passenger group, but the margin between the groups
was not defined precisely. The next table summarizes the airline merger cases that occurred after the
new ECMR was introduced in 2004.
Airline merger cases after the ECMR 2004
Airlines Case number Date Number of Passengers (m)
LH/Swiss M.3770 04 Jul 2005 51.255 +9.188 = 60.443
LH/Eurowings M.3940 22 Dec 2005 51.255 + 7.693 = 58.948
KLM/Martinair M.5141 17 Dec 2008 20 + 2.5 = 22.5
Iberia/Vueling/Clickair M.5364 09 Jan 2009 25.5 + 9 + 1 = 35.5
LH/bmi M.5403 14 May 2009 55.5 + 3.829 = 59.329
LH/SN Brussels M.5335 22 Jun 2009 55.5 + 3.42 = 58.92
LH/Austrian M 5440 28 Aug 2009 55.5 + 10 = 65.5
BA/Iberia M.5747 14 July 2010 33.2 + 25.5 = 58.7
Source: Németh and Niemeier (2012)
The European Commission’s Merger Framework in Aviation
90
4.5 COMPETITIVE ASSESSMENT
“There is no guarantee that making markets more competitive will generally enhance welfare”
(Schmalensee, 1988, p. 677).
4.5.1 GROWING HIGH-SPEED RAILWAY COMPETITION
Supply-side substitution130 takes into account any other available (primary and secondary) airports in
the overlapping catchment area, other airlines, other modes of transport and even the likely substitution
of “sun and beach” destinations131 in the most recent merger cases.
Competition by railways became a significant supply-side factor in the last two decades. The Eurostar
line between London and Paris was already defined as a competitor for airlines in early 1996 during the
BA/TAT merger. After its introduction in 1995, Eurostar carried 2.5 million passengers in its first year.
The new railway service led to a decline in air passenger transport of more than 19 percent in 1996 (M.
806, 1996).
The Thalys high-speed rail line between Paris and Amsterdam was considered to be a competitor for
time-insensitive passengers during the KLM/Air France case in 2004. The Thalys offered six daily
trains, while Air France and KLM each operated seven flights a day. The flight took 3 hours; the train
took 4 hours and 9 minutes. Therefore, “Thalys does not allow for a typical business return trip within
the same day” (M. 3280, 2004, p. 16).
During the Lufthansa/bmi case in 2009, Eurostar was considered to be a substitute between London and
Brussels, also for business passengers. The market power of the airlines was therefore decreased by the
Eurostar train service on this route. In 2009, the travel time was 2 hours by train compared to 1 hour 15
minutes by direct flight (M. 5403, 2009). Therefore, the train attracted business travelers as well.
Given the EU policy of improving the high-speed train network, one can expect that intermodal
competition will play a more important role132 in the future. From the competition policy’s point of
view, this means that the more substitutes enter the market, the less market power airlines will have and
the more probable the clearance of airline mergers will become. The following figure illustrates the
increasing role of railways in airline merger decisions.
130 Supply-side substitution is defined in §20 as follows: “suppliers are able to switch production to the relevant products and
market them in the short term without incurring significant additional costs or risks in response to small and permanent changes
in relative prices” (EC, 1997, p. 4). 131 In 2008, the EC considered a “certain degree of substitutability between various holiday destinations” mainly in the
Caribbean, which they called “sun and beach” destinations (M. 5141, p. 36). 132 See, for example, Givoni (2008) on the railway as a substitute for airlines.
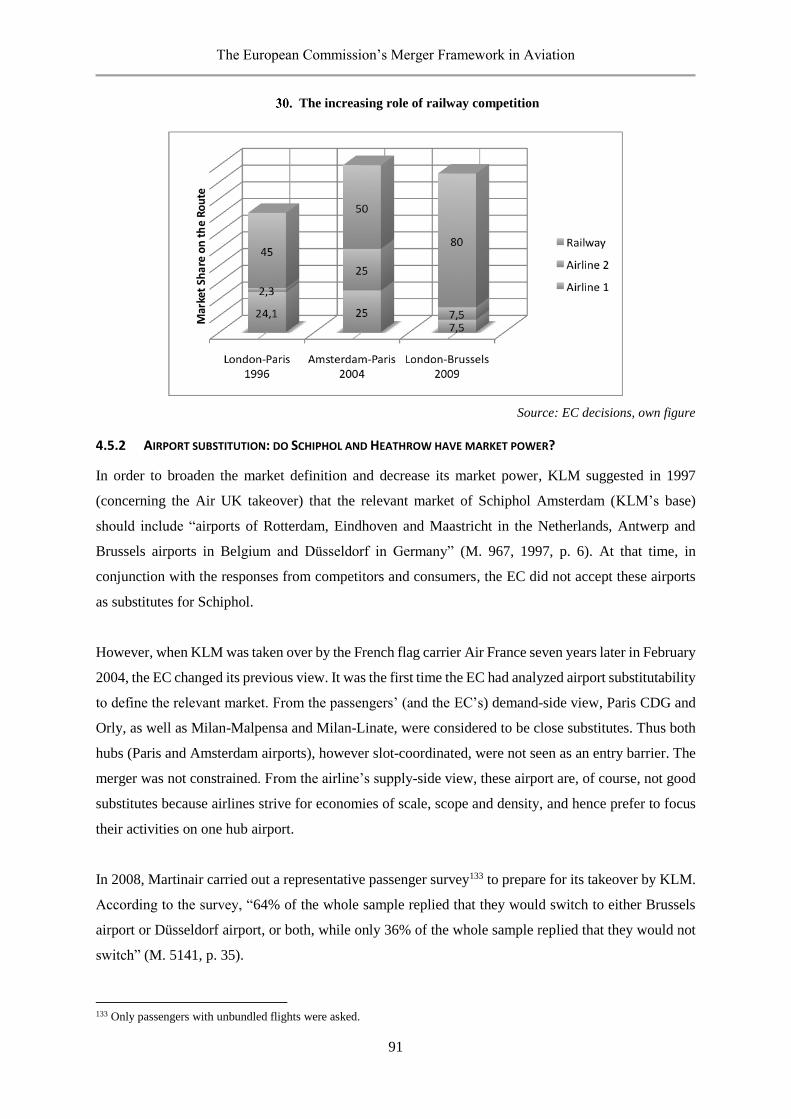
The European Commission’s Merger Framework in Aviation
91
The increasing role of railway competition
Source: EC decisions, own figure
4.5.2 AIRPORT SUBSTITUTION: DO SCHIPHOL AND HEATHROW HAVE MARKET POWER?
In order to broaden the market definition and decrease its market power, KLM suggested in 1997
(concerning the Air UK takeover) that the relevant market of Schiphol Amsterdam (KLM’s base)
should include “airports of Rotterdam, Eindhoven and Maastricht in the Netherlands, Antwerp and
Brussels airports in Belgium and Düsseldorf in Germany” (M. 967, 1997, p. 6). At that time, in
conjunction with the responses from competitors and consumers, the EC did not accept these airports
as substitutes for Schiphol.
However, when KLM was taken over by the French flag carrier Air France seven years later in February
2004, the EC changed its previous view. It was the first time the EC had analyzed airport substitutability
to define the relevant market. From the passengers’ (and the EC’s) demand-side view, Paris CDG and
Orly, as well as Milan-Malpensa and Milan-Linate, were considered to be close substitutes. Thus both
hubs (Paris and Amsterdam airports), however slot-coordinated, were not seen as an entry barrier. The
merger was not constrained. From the airline’s supply-side view, these airport are, of course, not good
substitutes because airlines strive for economies of scale, scope and density, and hence prefer to focus
their activities on one hub airport.
In 2008, Martinair carried out a representative passenger survey133 to prepare for its takeover by KLM.
According to the survey, “64% of the whole sample replied that they would switch to either Brussels
airport or Düsseldorf airport, or both, while only 36% of the whole sample replied that they would not
switch” (M. 5141, p. 35).
133 Only passengers with unbundled flights were asked.
The European Commission’s Merger Framework in Aviation
92
As a result, Brussels, Dusseldorf and Amsterdam were regarded as substitutable and belonging to the
same long-haul market. This furthermore implies that Schiphol airport has no market power134 and
hence no remedies were imposed.
The KLM/Martinair merger is of special interest as airport substitution was newly interpreted by the
EC. Martinair exclusively served intercontinental destinations; hence no overlapping European routes
existed at the end of 2008. The EC applied airport substitutability and even the “sun and beach”
destination substitutability from a new perspective: “tour operators and travel agents indicated that a
proportion of between 5% and 25% of Dutch leisure passengers would switch their point of departure
to Brussels or Düsseldorf if prices for flights to long-haul holiday destinations from Amsterdam were
to increase by 5-10%” (ibid). This result shows a strong substitutability between these airports for
holiday destinations.
In 2009, Lufthansa purchased a further 50 percent share in bmi, which was added to its existing 29
percent share (M. 5403). Lufthansa had acquired sole control over the UK Company, British Midlands
(bmi), which held 56 slots at the coveted London Heathrow Airport.
Referring back to the Ryanair/Aer Lingus merger, this case (M.5403) was the first time the EC applied
the airport substitutability “100 km/1 hour”135 rule by defining the relevant market.
In summary, by broadening the definition of the relevant market with airport substitution, the market
power of the affected airline will decline and the EC will tend to allow a merger to take place. To the
contrary, when assessing the relevant market in the BA/Iberia case in 2010, the EC changed its view
and argued that since London Heathrow plays a leading role in transatlantic routes, no other London
airport can be a competitor.
134 In contrast to this finding, the GAP’s (2010) study found that Schiphol airport definitely has market power concerning
O&D passengers for the provision of infrastructure to airlines. However, the market power concerning transfer passengers is
limited. The study also carried out a passenger survey with SSNIP analysis and concluded that Schiphol is a dominant airport
with economic market power. 135 A secondary airport is in the catchment area of a city if it lies within 100 km or one-hour driving distance from the city
center.
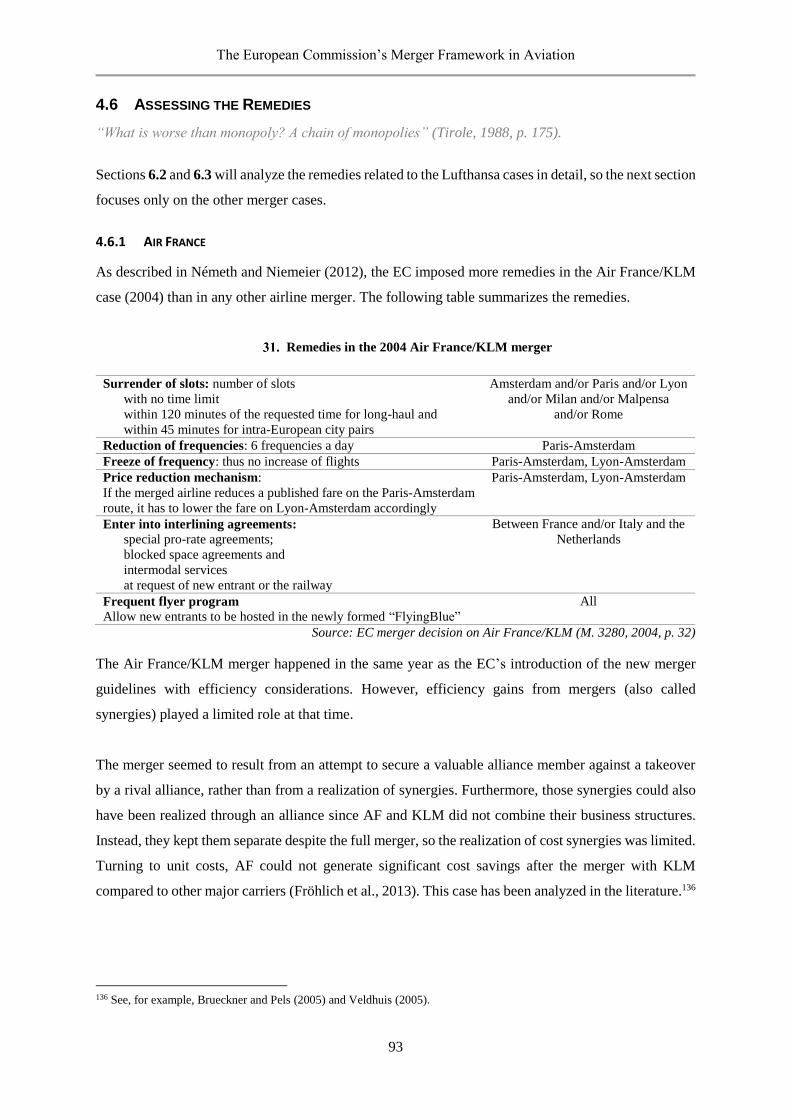
The European Commission’s Merger Framework in Aviation
93
4.6 ASSESSING THE REMEDIES
“What is worse than monopoly? A chain of monopolies” (Tirole, 1988, p. 175).
Sections 6.2 and 6.3 will analyze the remedies related to the Lufthansa cases in detail, so the next section
focuses only on the other merger cases.
4.6.1 AIR FRANCE
As described in Németh and Niemeier (2012), the EC imposed more remedies in the Air France/KLM
case (2004) than in any other airline merger. The following table summarizes the remedies.
Remedies in the 2004 Air France/KLM merger
Surrender of slots: number of slots
with no time limit
within 120 minutes of the requested time for long-haul and
within 45 minutes for intra-European city pairs
Amsterdam and/or Paris and/or Lyon
and/or Milan and/or Malpensa
and/or Rome
Reduction of frequencies: 6 frequencies a day Paris-Amsterdam
Freeze of frequency: thus no increase of flights Paris-Amsterdam, Lyon-Amsterdam
Price reduction mechanism:
If the merged airline reduces a published fare on the Paris-Amsterdam
route, it has to lower the fare on Lyon-Amsterdam accordingly
Paris-Amsterdam, Lyon-Amsterdam
Enter into interlining agreements: special pro-rate agreements;
blocked space agreements and
intermodal services
at request of new entrant or the railway
Between France and/or Italy and the
Netherlands
Frequent flyer program Allow new entrants to be hosted in the newly formed “FlyingBlue”
All
Source: EC merger decision on Air France/KLM (M. 3280, 2004, p. 32)
The Air France/KLM merger happened in the same year as the EC’s introduction of the new merger
guidelines with efficiency considerations. However, efficiency gains from mergers (also called
synergies) played a limited role at that time.
The merger seemed to result from an attempt to secure a valuable alliance member against a takeover
by a rival alliance, rather than from a realization of synergies. Furthermore, those synergies could also
have been realized through an alliance since AF and KLM did not combine their business structures.
Instead, they kept them separate despite the full merger, so the realization of cost synergies was limited.
Turning to unit costs, AF could not generate significant cost savings after the merger with KLM
compared to other major carriers (Fröhlich et al., 2013). This case has been analyzed in the literature.136
136 See, for example, Brueckner and Pels (2005) and Veldhuis (2005).
The European Commission’s Merger Framework in Aviation
94
4.6.2 BRITISH AIRWAYS
There was only one slot remedy imposed in the British Airways/TAT decision, since the high-speed
railway between London and Paris was supposed to be a strong competitor in the coming years. In the
Iberia/Vueling/Clickair case137 the slot transfer obligations were “unlimited in duration” (M. 5364,
2009, p. 9). This is interesting, given that prior to this ruling the longest remedy period was defined to
be five years.138
British Airways (BA) — which aimed to “create a leading European airline group” (British Airways,
2009, p. 1) — took over a 55 percent market share in its Oneworld alliance partner, Iberia, at the end
of 2010. The British flag carrier promised a strong global strategic position, while “slots and
destinations [are] to be protected for the benefit of the group” (ibid, p. 15). Unluckily for the airline, the
EC had a different view regarding slot protection.
In its worst case scenario, BA would have to give up 49 slots139 at London Heathrow airport without
any compensation. The 60-minute slot window was the most rigorous in European airline merger
history; until 2010, a 90-minute window was applied for intercontinental slots.
The merger between Iberia and BA differs from the other mergers in that there was an attempt to build
a new branded corporation that mentioned neither of the two brands. Furthermore, the two networks
seem to be more complementary than the networks of KLM and Air France or Lufthansa and Swiss,
because Iberia focuses on South America and BA on North America. A further difference is that the
airlines were integrated before the merger within the Oneworld alliance in 1999, while Lufthansa/Swiss
and AF/KLM had not been alliance partners before their mergers (Fröhlich et al., 2013).
Since the relevant routes and slots are all related to long-haul intercontinental routes, it is beyond the
framework of European airline mergers. This case alone is worth investigating in a separate study.
137 In early 2009, Iberia bought the Spanish LCCs Vueling and Clickair. The EC defined six Spanish domestic routes and seven
European city-pairs as relevant: “The Parties undertake to make slot(s) available in Barcelona and/or Venice and/or Rome
and/or Nice and/or Athens and/or Madrid and/or Naples and/or Ibiza and/or Paris... at Barcelona and/or Malaga and/or Santiago
de Compostela and/or Seville and/or Granada and/or Oviedo and/or Bilbao and/or Ibiza and/or Valencia and/or Alicante” (M.
5364, 2009, p. 5). 138 However, this case is difficult to evaluate. Apart from the Spanish language used in the decision, there is no clear rule about
whether the slots should be provided at all the listed airports or just at one of them. 139 Concerning four routes starting from London, BA might give up 49 slots at Heathrow or Gatwick airports, but only if the
competitors has already exhausted their own slot portfolio (ibid, p. 18). The EC (not the airlines) decides which airlines will
obtain these slots. The first criterion is the competitive constraint, followed by the price offered for a slot. Overlapping (thus
anticompetitive) effects were realized on seven transatlantic routes.
The European Commission’s Merger Framework in Aviation
95
4.7 CONCLUSIONS
Chapter 4 analyzed the European merger framework in aviation and found a further reason for the softer
merger policy since 2004. The EC has widened its notion of the relevant market, which explains the
merger approvals in the 2000s, even without considering efficiency claims.
Mergers, most of them with remedies, were cleared due to quality and variety reasons. Variety also
includes variety of substitutes (e.g., railway, indirect flights, LCCs and secondary airports within 100
km or a one-hour driving distance) and a broader relevant market, where the merger merely increases
concentration. This is particularly true on the leisure (non-premium) market, where passengers are price
sensitive, but not time sensitive.
Quality increase (e.g., improved schedule and extended FFP) might benefit business (premium)
passengers, who are time sensitive but less sensitive to price changes. The EC first considered a quality
increase from network effects in 2004, during the KLM/Air France takeover concerning corporate
(business) passengers. However, the exact network effects have remained theoretical and unquantified
since then.
When looking at the development of the relevant market definition, we can conclude that the
convergence of EC merger policy with US antitrust policy was successful in particular ways. There
have been numerous attempts to improve merger policy: gathering efficiency (at least theoretically) into
the main goals of the EC; introducing the effect-based more economic approach; implementing
remedies to motivate competition; testing econometric methodologies (SSNIP, CLA and fixed-effects
price correlation); and precisely separating different markets (consumer groups).
Government intervention, particularly competition policy in the EU, aims to ensure free competition in
order to maintain or improve economic welfare. When takeovers are not allowed, inefficient airlines
might fail and leave the market. Are airline mergers a second-best solution to survive a potential
bankruptcy? Should merger policy defend failing firms by approving takeovers? Chapter 5 will review
airline performance, the reasons behind inefficiency and the welfare consequences of failures of
European airlines.
Airline Performance: Inefficiency, Bankruptcy and Welfare
96
5 AIRLINE PERFORMANCE: INEFFICIENCY, BANKRUPTCY AND WELFARE
“Deregulation of the airline industry has been a ‘nearly unqualified success, despite the industry’s
unusual vulnerability to recessions, acts of terrorism and war.’ The benefits to consumers have been
estimated at in excess of $20 billion a year… () Consumers do complain that standards of service have
fallen. So they have – because passengers are unwilling to pay for them.” – Alfred Kahn, the ‘father of
airline deregulation’ in The Economist (2003, p. 90).
5.1 INTRODUCTION
As introduced in Chapter 2, next to cost efficiency and new market assessment, the main driving force
behind mergers and acquisitions (M&As) is probably the advantage due to common revenue
management. Economic models, described in Chapter 3, support the idea that consolidation generally
leads to increased prices, and therefore to a competitive advantage for the merging companies.
Performance could improve, but growing in size also brings risks.
Chapter 4 showed that almost every European airline M&A in the last 20 years was related to nearly
insolvent airlines. Taking over a smaller carrier with financial difficulties may challenge merging
airlines and even result in a common bankruptcy (e.g., Swissair/Sabena). On one side there is a trend to
merge airlines, but on the other side we also observe a wave of smaller airline bankruptcies (see Chapter
6). It seems that less efficient carriers are either taken over or become insolvent and disappear.
This observation raises the questions Chapter 5 will attempt to answer. Which factors lead to the
bankruptcy of a formerly more or less successful carrier and what can we learn from it? What are the
consequences of airline bankruptcies from the consumer’s point of view? Section 5.2 will introduce the
different approaches used to measure airline efficiency. Case studies will address the reasons for
worsening performance of a failing flag carrier (5.3) and the consequences of airline failure on welfare
and market structure (5.4).
Network airlines such as flag carriers face fierce competition from LCCs. The situation of former
national monopoly airlines in Central Eastern Europe (CEE) is a special one, and this chapter will focus
on them. After the EU accession of ten CEE countries in 2004 and 2007, small national flag carriers
had to give up their international air service agreements and implement new rules (Németh, 2011b).
The challenge in the transition countries to adapt the European liberalized market was enormous and
often ended in privatization then re-privatization, state aid investigation or even bankruptcy (Németh,
2011b). Some of the carriers could not keep up with increasing competition and failed. The Hungarian
flag carrier perfectly represents the challenges of the European airline industry and the answers of the
EC competition policy. This chapter investigates the failure of Malév Hungarian Airlines.
Airline Performance: Inefficiency, Bankruptcy and Welfare
97
In this relationship, we assume that market stability might be a further reason behind soft merger policy.
Without new investors, airline failures in the short-run shift up the supply curve, quantity decreases and
prices increase. This may create a loss in consumer surplus, until new airlines enter the market. This
argument is known as the failing firm doctrine (§89-90 of the ECMG, 2004), which the EC officially
accepted in airline cases as late as 2013. The European Commission (EC) considered that “Olympic is
a failing firm which absent the Transaction would most likely exit the market, it is not necessary for the
Commission to assess in every detail the Notifying Party’s efficiency claims” (M. 6796, p. 132).
Efficiency arguments became important to counterbalance the competitive harm. Though, if a firm were
failing anyway, there would be no competitive harm and thus no need for an efficiency defense. It is in
the interest of not only the EC, but also the airline owners (states, investors, banks) and the airlines
themselves that takeovers occur before airlines go bankrupt. Managerial theories describe reasons (e.g.,
better bargaining power and reputation). One major point is that airline owners (notably states) can in
that way leverage slot allocation by preventing slots from being reallocated by the slot pool (e.g., see
the LH/SWISS case). Airplanes and other fixed assets (e.g., computer reservation systems) can be sold
even after insolvency, but slots play a significant role from the takeover airline’s point of view. Landing
rights and networks (markets) are the most important properties an airline has. When the expected value
of a takeover is less than slot value minus price, the takeover airline should wait until bankruptcy.140
Aegean paid €72m for the assets of Olympic, which consisted of the brand name, bilateral traffic rights
and its 14 leased Q100 and Q400 aircraft. Olympic’s loss had been €130m in the three years before
merger (CAPA, 2013a).
The failing firm doctrine is based on the assumption that bankruptcy and exit are unavoidable in the
absence of a takeover. However, this theory does not consider new entries, who could fill the gap after
the failing carrier leaves the routes. Therefore, the failing firm argument could protect takeover firms
from new competition by definition and, in extreme cases, support monopoly-building. The observation
leads us back to the theoretical debate on market failure versus government failure in Chapter 1.
In sum, without government intervention, pure market conditions should promote new entry and
competition. The question remains: can new entry fill the gap created by airline exit? Our study in
Section 5.4 offers an empirical exercise related to airline network replacement after bankruptcy and
finds various evidence. This chapter offers insight into why carriers fail and what happens if an airline
leaves a market, since this could be the default option if a merger is not permitted.
140 One can calculate the expected value and compare it to the airlines’ debts and the share prices of the takeovers. With the
help of probability density functions and case scenarios, one could define the probability of winning the slot lottery. The higher
the probability to win and the less the expected slot remedies, the more probable it is that the airline would choose the ‘buy’
strategy. Likewise, in the four LH takeovers, Lufthansa ‘won’ 306 destinations and ‘lost’ 20 relevant routes with 350 slot
remedies. I appreciate the helpful comments from Kevin Wainwright, who provided the idea of a slot lottery.
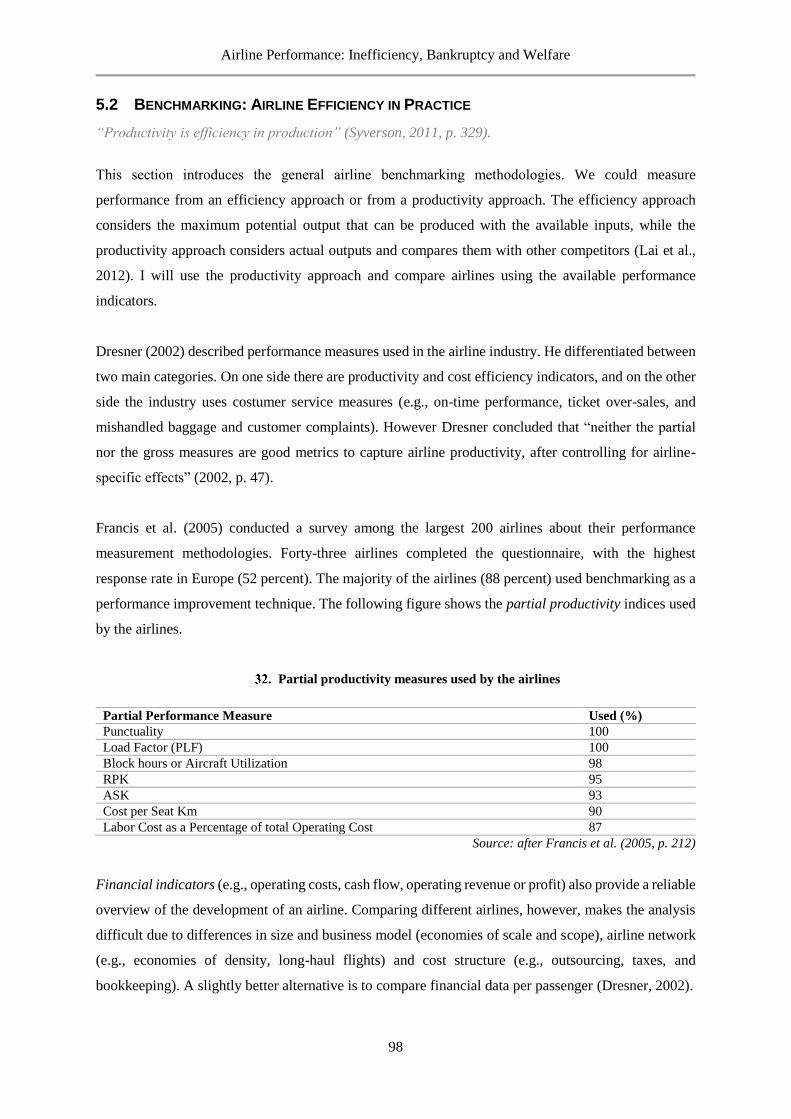
Airline Performance: Inefficiency, Bankruptcy and Welfare
98
5.2 BENCHMARKING: AIRLINE EFFICIENCY IN PRACTICE
“Productivity is efficiency in production” (Syverson, 2011, p. 329).
This section introduces the general airline benchmarking methodologies. We could measure
performance from an efficiency approach or from a productivity approach. The efficiency approach
considers the maximum potential output that can be produced with the available inputs, while the
productivity approach considers actual outputs and compares them with other competitors (Lai et al.,
2012). I will use the productivity approach and compare airlines using the available performance
indicators.
Dresner (2002) described performance measures used in the airline industry. He differentiated between
two main categories. On one side there are productivity and cost efficiency indicators, and on the other
side the industry uses costumer service measures (e.g., on-time performance, ticket over-sales, and
mishandled baggage and customer complaints). However Dresner concluded that “neither the partial
nor the gross measures are good metrics to capture airline productivity, after controlling for airline-
specific effects” (2002, p. 47).
Francis et al. (2005) conducted a survey among the largest 200 airlines about their performance
measurement methodologies. Forty-three airlines completed the questionnaire, with the highest
response rate in Europe (52 percent). The majority of the airlines (88 percent) used benchmarking as a
performance improvement technique. The following figure shows the partial productivity indices used
by the airlines.
Partial productivity measures used by the airlines
Partial Performance Measure Used (%)
Punctuality 100
Load Factor (PLF) 100
Block hours or Aircraft Utilization 98
RPK 95
ASK 93
Cost per Seat Km 90
Labor Cost as a Percentage of total Operating Cost 87
Source: after Francis et al. (2005, p. 212)
Financial indicators (e.g., operating costs, cash flow, operating revenue or profit) also provide a reliable
overview of the development of an airline. Comparing different airlines, however, makes the analysis
difficult due to differences in size and business model (economies of scale and scope), airline network
(e.g., economies of density, long-haul flights) and cost structure (e.g., outsourcing, taxes, and
bookkeeping). A slightly better alternative is to compare financial data per passenger (Dresner, 2002).
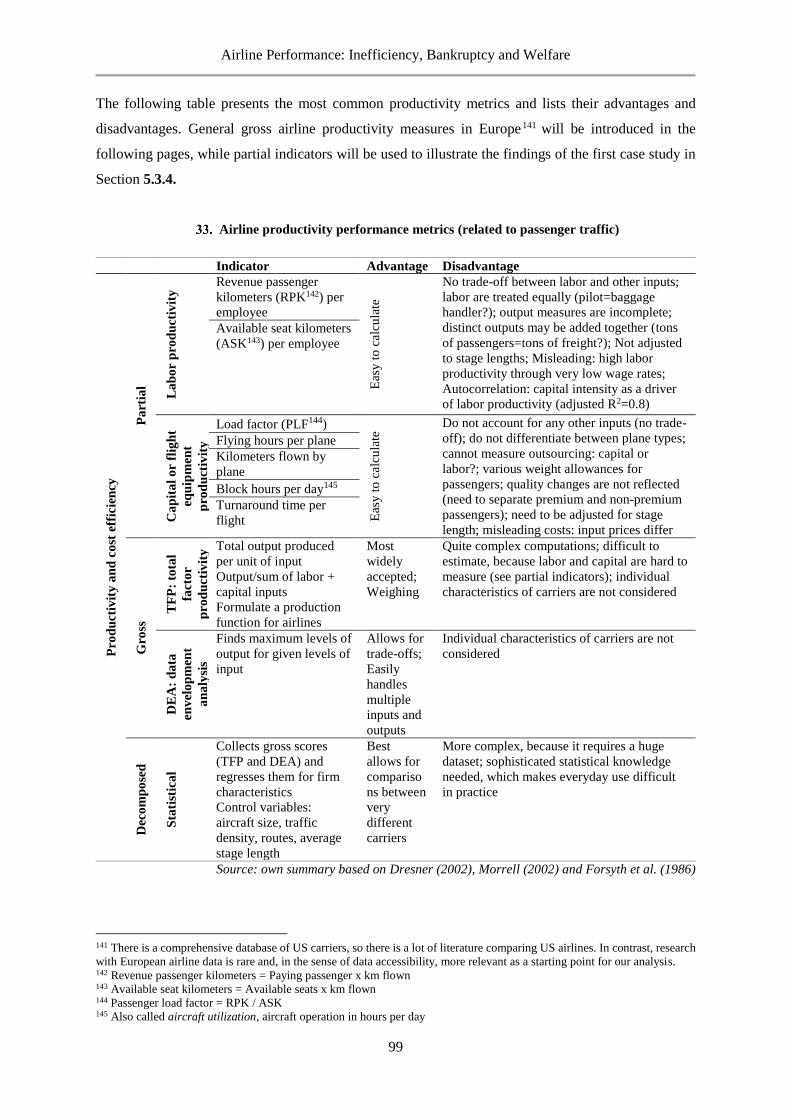
Airline Performance: Inefficiency, Bankruptcy and Welfare
99
The following table presents the most common productivity metrics and lists their advantages and
disadvantages. General gross airline productivity measures in Europe 141 will be introduced in the
following pages, while partial indicators will be used to illustrate the findings of the first case study in
Section 5.3.4.
Airline productivity performance metrics (related to passenger traffic)
Indicator Advantage Disadvantage
Pro
du
ctiv
ity
an
d c
ost
eff
icie
ncy
Pa
rtia
l
La
bo
r p
rod
uct
ivit
y Revenue passenger
kilometers (RPK142) per
employee
Eas
y t
o c
alcu
late
No trade-off between labor and other inputs;
labor are treated equally (pilot=baggage
handler?); output measures are incomplete;
distinct outputs may be added together (tons
of passengers=tons of freight?); Not adjusted
to stage lengths; Misleading: high labor
productivity through very low wage rates;
Autocorrelation: capital intensity as a driver
of labor productivity (adjusted R2=0.8)
Available seat kilometers
(ASK143) per employee
Ca
pit
al
or
flig
ht
equ
ipm
ent
pro
du
ctiv
ity
Load factor (PLF144)
Eas
y t
o c
alcu
late
Do not account for any other inputs (no trade-
off); do not differentiate between plane types;
cannot measure outsourcing: capital or
labor?; various weight allowances for
passengers; quality changes are not reflected
(need to separate premium and non-premium
passengers); need to be adjusted for stage
length; misleading costs: input prices differ
Flying hours per plane
Kilometers flown by
plane
Block hours per day145
Turnaround time per
flight
Gro
ss
TF
P:
tota
l
fact
or
pro
du
ctiv
ity
Total output produced
per unit of input
Output/sum of labor +
capital inputs
Formulate a production
function for airlines
Most
widely
accepted;
Weighing
Quite complex computations; difficult to
estimate, because labor and capital are hard to
measure (see partial indicators); individual
characteristics of carriers are not considered
DE
A:
da
ta
env
elo
pm
ent
an
aly
sis
Finds maximum levels of
output for given levels of
input
Allows for
trade-offs;
Easily
handles
multiple
inputs and
outputs
Individual characteristics of carriers are not
considered
Dec
om
po
sed
Sta
tist
ica
l
Collects gross scores
(TFP and DEA) and
regresses them for firm
characteristics
Control variables:
aircraft size, traffic
density, routes, average
stage length
Best
allows for
compariso
ns between
very
different
carriers
More complex, because it requires a huge
dataset; sophisticated statistical knowledge
needed, which makes everyday use difficult
in practice
Source: own summary based on Dresner (2002), Morrell (2002) and Forsyth et al. (1986)
141 There is a comprehensive database of US carriers, so there is a lot of literature comparing US airlines. In contrast, research
with European airline data is rare and, in the sense of data accessibility, more relevant as a starting point for our analysis. 142 Revenue passenger kilometers = Paying passenger x km flown 143 Available seat kilometers = Available seats x km flown 144 Passenger load factor = RPK / ASK 145 Also called aircraft utilization, aircraft operation in hours per day
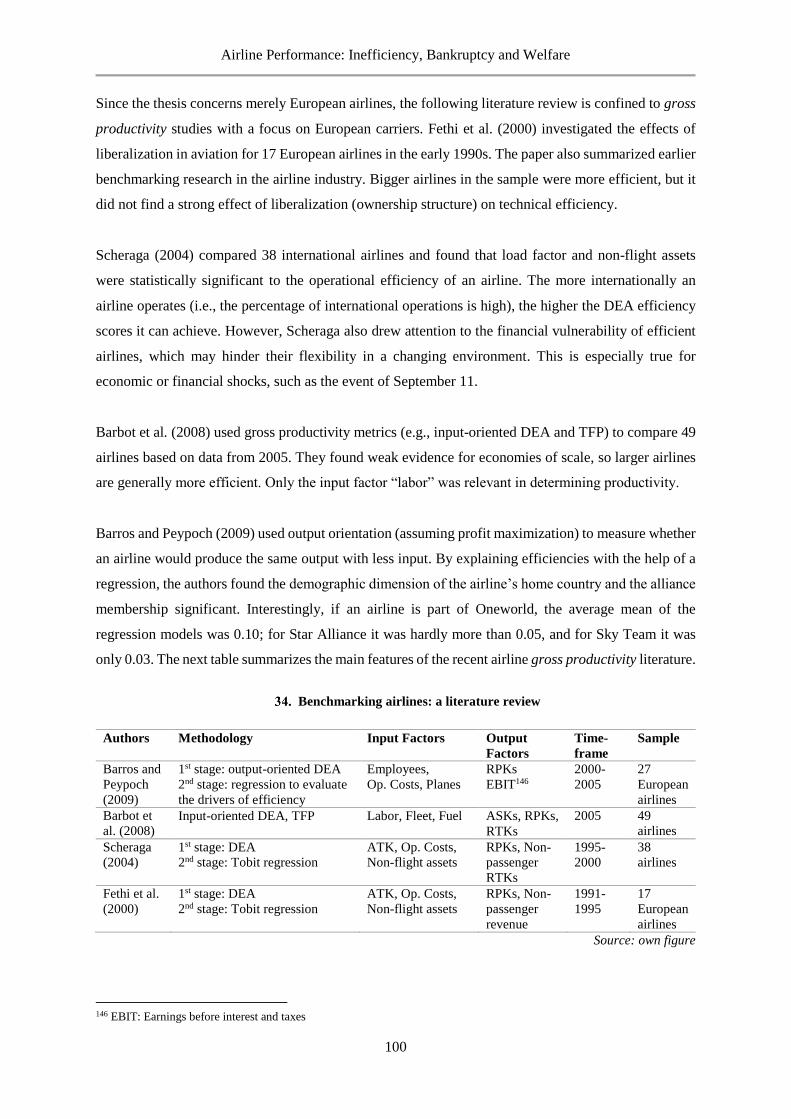
Airline Performance: Inefficiency, Bankruptcy and Welfare
100
Since the thesis concerns merely European airlines, the following literature review is confined to gross
productivity studies with a focus on European carriers. Fethi et al. (2000) investigated the effects of
liberalization in aviation for 17 European airlines in the early 1990s. The paper also summarized earlier
benchmarking research in the airline industry. Bigger airlines in the sample were more efficient, but it
did not find a strong effect of liberalization (ownership structure) on technical efficiency.
Scheraga (2004) compared 38 international airlines and found that load factor and non-flight assets
were statistically significant to the operational efficiency of an airline. The more internationally an
airline operates (i.e., the percentage of international operations is high), the higher the DEA efficiency
scores it can achieve. However, Scheraga also drew attention to the financial vulnerability of efficient
airlines, which may hinder their flexibility in a changing environment. This is especially true for
economic or financial shocks, such as the event of September 11.
Barbot et al. (2008) used gross productivity metrics (e.g., input-oriented DEA and TFP) to compare 49
airlines based on data from 2005. They found weak evidence for economies of scale, so larger airlines
are generally more efficient. Only the input factor “labor” was relevant in determining productivity.
Barros and Peypoch (2009) used output orientation (assuming profit maximization) to measure whether
an airline would produce the same output with less input. By explaining efficiencies with the help of a
regression, the authors found the demographic dimension of the airline’s home country and the alliance
membership significant. Interestingly, if an airline is part of Oneworld, the average mean of the
regression models was 0.10; for Star Alliance it was hardly more than 0.05, and for Sky Team it was
only 0.03. The next table summarizes the main features of the recent airline gross productivity literature.
Benchmarking airlines: a literature review
Authors Methodology Input Factors Output
Factors
Time-
frame
Sample
Barros and
Peypoch
(2009)
1st stage: output-oriented DEA
2nd stage: regression to evaluate
the drivers of efficiency
Employees,
Op. Costs, Planes
RPKs
EBIT146
2000-
2005
27
European
airlines
Barbot et
al. (2008) Input-oriented DEA, TFP Labor, Fleet, Fuel ASKs, RPKs,
RTKs
2005 49
airlines
Scheraga
(2004)
1st stage: DEA
2nd stage: Tobit regression
ATK, Op. Costs,
Non-flight assets
RPKs, Non-
passenger
RTKs
1995-
2000
38
airlines
Fethi et al.
(2000)
1st stage: DEA
2nd stage: Tobit regression
ATK, Op. Costs,
Non-flight assets
RPKs, Non-
passenger
revenue
1991-
1995
17
European
airlines
Source: own figure
146 EBIT: Earnings before interest and taxes
Airline Performance: Inefficiency, Bankruptcy and Welfare
101
5.3 CASE STUDY: INEFFICIENT AIRLINES
“Successful joint stock companies which haven’t been granted a State-conferred monopoly have been
conspicuously successful—some of them being conspicuously unsuccessful—at subsequent times in
history.” On Adam Smith’s work (Robbins, 2000, p. 155).
This section targets the following question: how do inefficient airlines survive despite growing
competition? The research147 applies ideas about permanently failing organizations (PFOs) to the
aviation sector, and focuses on the three largest airlines in central and Eastern Europe. The research
question is whether the PFO phenomenon could explain the poor performance of Malév, CSA and LOT
airlines. Elite management interviews provided a rich explanation of events at these airlines and
successfully confirmed the robustness of the permanent failure concept.
The poor performance of the airline industry raises a number of questions about our understanding of
the relationship between organizational behavior, firm strategy and financial performance in market
contexts. Industrial organization and economic theory generally posits that persistently inefficient firms
would be forced to exit the market – especially when the industry is experiencing unprecedented
deregulation.148
Business strategy theories would also suggest that firms that consistently produce below-average
industry returns would be forced to change strategies if they wish to change the trajectory of firm
performance. Yet, in the aviation sector, we see a persistent repetition of seemingly unsuccessful
strategies across airlines and over time.
Thus why is it frequently the case that, in the aviation sector, companies perform poorly over several
years and yet continue to survive despite deregulation and growing competition? On a broader,
conceptual note, our study provides further evidence of the need for organizational, micro-level research
to inform broader strategy and industry-level understanding of firm performance.
5.3.1 EXPLAINING POOR PERFORMANCE
Numerous quantitative studies of performance outcomes have examined why the industry struggles to
generate consistent returns on invested capital (Borenstein, 2011; Button, 2003; Holloway, 2002; IATA,
2011; Pilarski, 2007; and Wojahn, 2012). Five arguments have been identified as the main explanatory
factors concerning the aviation sector.
147 This section is mainly identical to the original text of Akbar, Niemeier and Németh (2014). 148 It is possible for inefficient firms to remain in the market for limited periods if, for example, the efficient firms with market
power keep prices high, giving the inefficient firms a buffer.

Airline Performance: Inefficiency, Bankruptcy and Welfare
102
First, in the last two decades, the industry has experienced severe impacts from progressive phases of
deregulation. Sheltered national markets were exposed to competition, producing significant losses for
incumbents (Creel and Farrell, 2001; Dempsey, 2008; and Dennis, 2007).
Second, there is an economic logic driven by the minimum efficient scale that questions the economic
feasibility of smaller airlines (Caves et al., 1984; Romero-Hernandez and Cabrera, 2005; and Barbot et
al., 2008): if an airline is too small and offers too narrow a range of services, it cannot serve enough
customers to cover its fixed and sunk costs. The network effects of being a larger airline (more
connections to more destinations) also undermines the economic feasibility of smaller airlines since
customers prefer to fly with a larger network airline.
Third, poor industry performance is inextricably related to ownership structures and soft budget
constraints imposed by owners of the airlines, notably the state (Beria et al., 2011; and Doganis, 2002).
Since airline managers know that underperformance will not be punished through liquidation of assets
and exit, they are not forced to operate under market-based efficiency criteria.
Fourth, airlines have invested substantial resources in protecting themselves from competition through
rent-seeking behavior – especially at the national level. The success of this activity has been one of the
main reasons for owners imposing soft budget constraints (Bergamini et al., 2010; and Ciliberto and
Schenone, 2012).
Fifth, deregulated air transport markets might have no stable long-run equilibrium. Airline markets
might be inherently unstable and the lack of profitability is an empty core phenomenon149. Airlines
might collude to avoid empty cores, where prices do not cover costs (Button, 2003).
All five arguments are relevant. Clearly changing market structures and evolving technologies and basic
cost features of the industry would explain performance. However, none of these studies have explored
how internal practices, processes and discourses contribute to the performance of firms at the
organizational level, and nor have they examined the firms’ persistent existence despite poor
performance.
149 After Edgeworth (1881), in presence of an empty core (prices do not cover the costs), competition might be unstable and
inefficient, and there is no Pareto equilibrium. In order to avoid an empty core, airlines collude if costs and demand are strongly
variable (Button, 2003).
Airline Performance: Inefficiency, Bankruptcy and Welfare
103
5.3.2 PERMANENTLY FAILING ORGANIZATIONS
Our study identified a sixth complementary explanation for airline performance: airlines are a category
of organizations that have been characterized as ‘permanently failing.’ This concept, first developed by
Meyer and Zucker (1989), asserts that the continued survival of these firms is contingent on serving the
interests of certain dependent actors and replaces the purely economic interests of shareholders and
owners. The PFO framework has been applied in several industries,150 but this is the first time it has
been applied to the aviation sector. The following sections present some evidence from the elite
interviews.151 The main question is why CEE airlines have been unable to improve productivity.
The first practice of permanent failure is the stubborn belief in deeply and historically embedded
perspectives about the rights and obligation of the firm and its stakeholders. For example, stakeholders
believe that it is unthinkable that the organization should fail or believe that external stakeholders will
not shut the organization down because they have avoided doing so during previous performance crises.
The interviewees also addressed updating the brand. For example, Malév had not changed its staff’s
uniforms since the 1980s and its logo had remained unchanged since the 1990s. The reasons why Malév
was unable to do so were identified as related to the ‘culture’ at the airline, which was somewhat
conservative and backward looking. One manager reflected on the fact that Malév, LOT Polish Airlines
and CSA Czech Airlines had seat technology from the 1980s on their long-haul aircraft. None of them
had in-seat video, and none of them offered fully flat seats in business class.
PFOs display a recurring discrepancy between strategy articulation and implementation. For example,
they break promises made by owners and top management about change and resource allocation or they
significantly delay their implementation. Since this repeats numerous times during the course of an
organization’s history, it increases the lack of trust between external stakeholders and employees, the
media and the wider community. Decision-making time horizons were another theme that emerged
from the interviews. In particular, top managers emphasized that their airlines tended to focus on short-
term decision making across many functions within the company in contradiction to the long-term
strategies articulated by top management. This included limiting budgets for new marketing campaigns,
website development and investing in industry benchmarking data.152
150 Eitel (2004) examined national agencies dependent on governmental support and Seibel (1996) the not-for-profit sector. 151 The interviews, carried out by Akbar, were based on open questions (e.g., what role did the manager have and why; how
does the manager explain and justify their behavior; how does the person rationalize the nature of events and process; how
does the manager explain failure). The managers selected for the interviews were either members of the airlines’ and airports’
Boards of Directors or held positions at a director level within their respective companies. Each interview lasted between one
and two hours. Due to requests for confidentiality, the names and roles of interviewees were kept anonymous. 152 In the case of one airline, the web development team was severely understaffed so only incremental changes to the website
were possible, making it lag behind its competitors. In another instance, the airline would not invest in industry benchmarking
data.
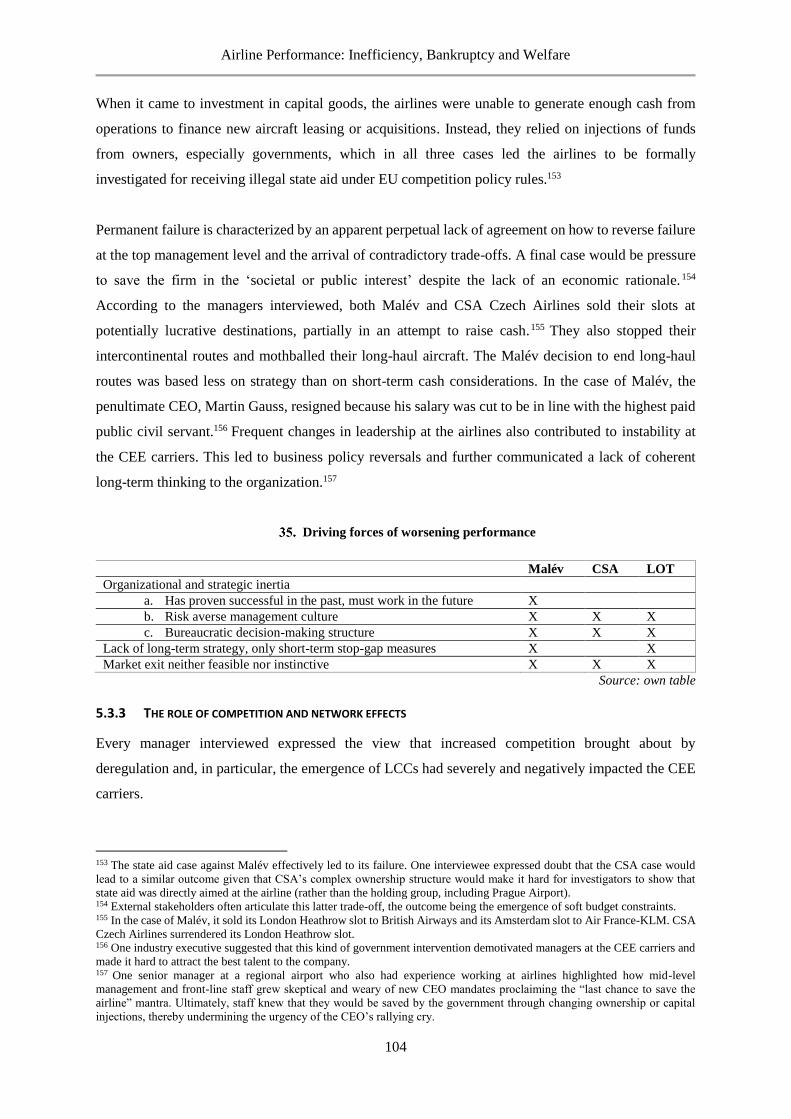
Airline Performance: Inefficiency, Bankruptcy and Welfare
104
When it came to investment in capital goods, the airlines were unable to generate enough cash from
operations to finance new aircraft leasing or acquisitions. Instead, they relied on injections of funds
from owners, especially governments, which in all three cases led the airlines to be formally
investigated for receiving illegal state aid under EU competition policy rules.153
Permanent failure is characterized by an apparent perpetual lack of agreement on how to reverse failure
at the top management level and the arrival of contradictory trade-offs. A final case would be pressure
to save the firm in the ‘societal or public interest’ despite the lack of an economic rationale. 154
According to the managers interviewed, both Malév and CSA Czech Airlines sold their slots at
potentially lucrative destinations, partially in an attempt to raise cash.155 They also stopped their
intercontinental routes and mothballed their long-haul aircraft. The Malév decision to end long-haul
routes was based less on strategy than on short-term cash considerations. In the case of Malév, the
penultimate CEO, Martin Gauss, resigned because his salary was cut to be in line with the highest paid
public civil servant.156 Frequent changes in leadership at the airlines also contributed to instability at
the CEE carriers. This led to business policy reversals and further communicated a lack of coherent
long-term thinking to the organization.157
Driving forces of worsening performance
Malév CSA LOT
Organizational and strategic inertia
a. Has proven successful in the past, must work in the future X
b. Risk averse management culture X X X
c. Bureaucratic decision-making structure X X X
Lack of long-term strategy, only short-term stop-gap measures X X
Market exit neither feasible nor instinctive X X X
Source: own table
5.3.3 THE ROLE OF COMPETITION AND NETWORK EFFECTS
Every manager interviewed expressed the view that increased competition brought about by
deregulation and, in particular, the emergence of LCCs had severely and negatively impacted the CEE
carriers.
153 The state aid case against Malév effectively led to its failure. One interviewee expressed doubt that the CSA case would
lead to a similar outcome given that CSA’s complex ownership structure would make it hard for investigators to show that
state aid was directly aimed at the airline (rather than the holding group, including Prague Airport). 154 External stakeholders often articulate this latter trade-off, the outcome being the emergence of soft budget constraints. 155 In the case of Malév, it sold its London Heathrow slot to British Airways and its Amsterdam slot to Air France-KLM. CSA
Czech Airlines surrendered its London Heathrow slot. 156 One industry executive suggested that this kind of government intervention demotivated managers at the CEE carriers and
made it hard to attract the best talent to the company. 157 One senior manager at a regional airport who also had experience working at airlines highlighted how mid-level
management and front-line staff grew skeptical and weary of new CEO mandates proclaiming the “last chance to save the
airline” mantra. Ultimately, staff knew that they would be saved by the government through changing ownership or capital
injections, thereby undermining the urgency of the CEO’s rallying cry.
Airline Performance: Inefficiency, Bankruptcy and Welfare
105
Since they operated in a price-sensitive leisure market, the CEE carriers rapidly lost demand in the
economy-class segments, forcing them to lower prices and thereby worsen their financial positions.
There were few destinations where LCCs were providing flights that the CEE carriers could operate
profitably.
Most executives interviewed cited the importance of joining one of the global airline alliances. In
principle, joining a global alliance had several benefits. First, it allowed the CEE carriers to co-market,
co-brand and co-sell flights on airlines within the alliance, drastically increasing the number of
destinations available to their passengers.
Second, being a member of a global alliance would allow them to have more of their seats sold on their
flights within the network. In an observation that ran against conventional wisdom in the industry, one
manager observed that membership in an airline alliance was overrated because small CEE carriers
could only participate in short segments toward hub intercontinental airports. Thus the revenue
generated from the sale of a ticket involving intercontinental travel was limited.
Third, the attractiveness of the CEE carriers’ FFPs would be significantly enhanced, as both mileage
earning and redemption possibilities for passengers increased. Fourth, it could allow the CEE carriers
to learn best practices from other airlines in the alliance. One manager observed that Malév’s
membership in Oneworld was less beneficial than LOT Polish Airlines’ membership in Star Alliance
because the latter alliance had much tighter coordination and governing rules between member airlines.
Industry executives interviewed agreed that the impact of competition had affected all airlines. Yet the
CEE carriers were more greatly impacted, one executive observed, partly because they failed to be large
enough to weather the increased price competition. Due to deteriorating cash flows, they were forced
to become smaller, thereby worsening their cash positions.
5.3.4 BENCHMARKING CEE CARRIERS’ PERFORMANCE
Central Eastern European carriers had lower levels of productivity than other European carriers. Their
efficiency scores were in the range of 0.42 to 0.55, while the mean efficiency score was 0.7605 (Barbot
et al., 2008). Facing competition from LCCs, CEE carriers produced the same output with roughly
double the input (Akbar et al., 2014).
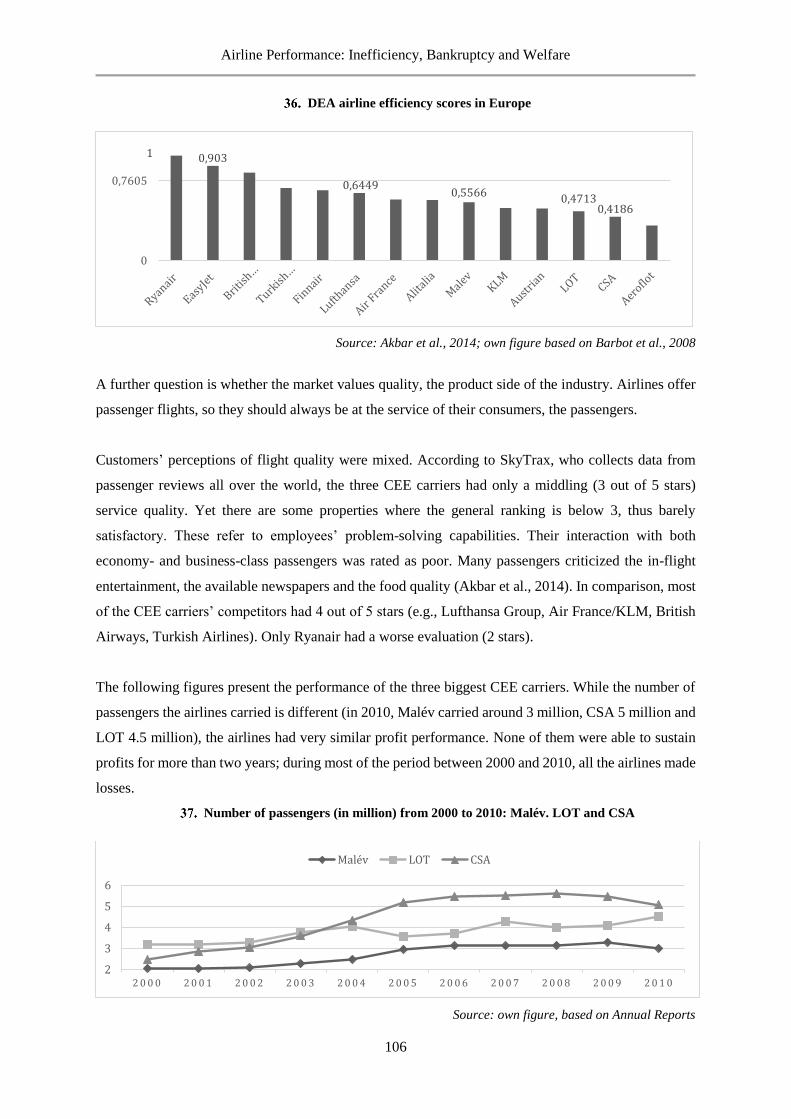
Airline Performance: Inefficiency, Bankruptcy and Welfare
106
DEA airline efficiency scores in Europe
Source: Akbar et al., 2014; own figure based on Barbot et al., 2008
A further question is whether the market values quality, the product side of the industry. Airlines offer
passenger flights, so they should always be at the service of their consumers, the passengers.
Customers’ perceptions of flight quality were mixed. According to SkyTrax, who collects data from
passenger reviews all over the world, the three CEE carriers had only a middling (3 out of 5 stars)
service quality. Yet there are some properties where the general ranking is below 3, thus barely
satisfactory. These refer to employees’ problem-solving capabilities. Their interaction with both
economy- and business-class passengers was rated as poor. Many passengers criticized the in-flight
entertainment, the available newspapers and the food quality (Akbar et al., 2014). In comparison, most
of the CEE carriers’ competitors had 4 out of 5 stars (e.g., Lufthansa Group, Air France/KLM, British
Airways, Turkish Airlines). Only Ryanair had a worse evaluation (2 stars).
The following figures present the performance of the three biggest CEE carriers. While the number of
passengers the airlines carried is different (in 2010, Malév carried around 3 million, CSA 5 million and
LOT 4.5 million), the airlines had very similar profit performance. None of them were able to sustain
profits for more than two years; during most of the period between 2000 and 2010, all the airlines made
losses.
Number of passengers (in million) from 2000 to 2010: Malév. LOT and CSA
Source: own figure, based on Annual Reports
1 0,903
0,64490,5566
0,47130,4186
0
0,7605
2
3
4
5
6
2 0 0 0 2 0 0 1 2 0 0 2 2 0 0 3 2 0 0 4 2 0 0 5 2 0 0 6 2 0 0 7 2 0 0 8 2 0 0 9 2 0 1 0
Malév LOT CSA
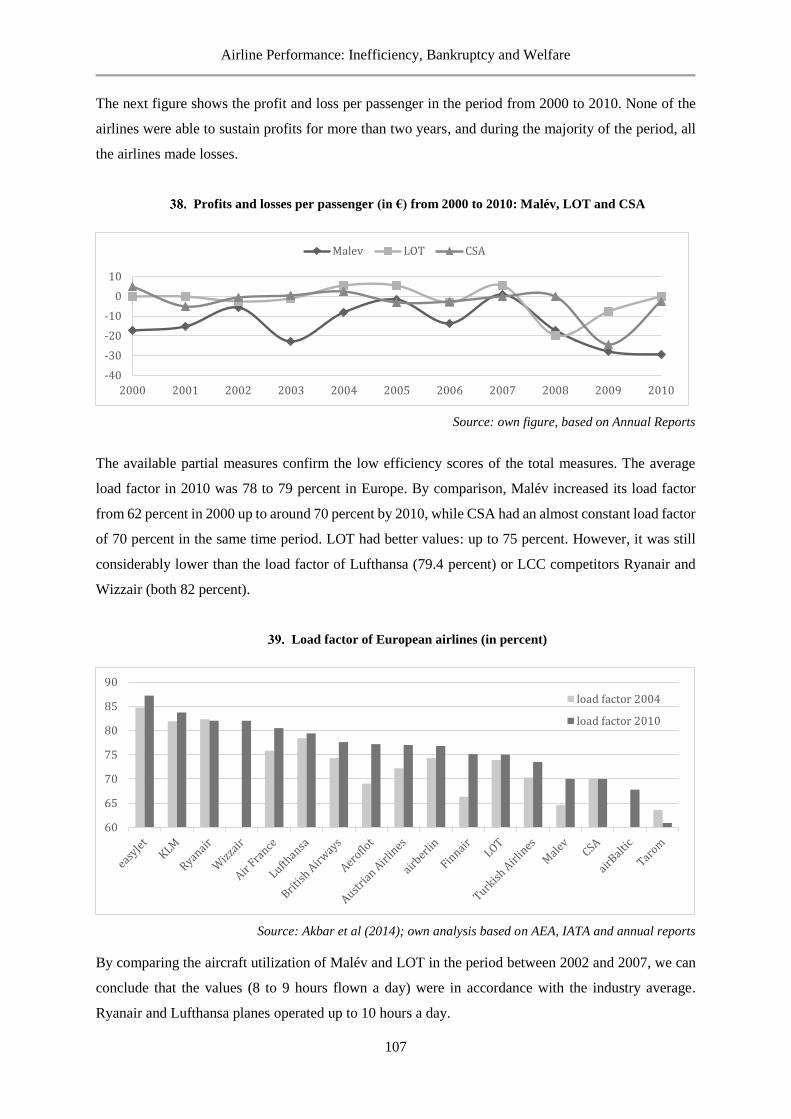
Airline Performance: Inefficiency, Bankruptcy and Welfare
107
The next figure shows the profit and loss per passenger in the period from 2000 to 2010. None of the
airlines were able to sustain profits for more than two years, and during the majority of the period, all
the airlines made losses.
Profits and losses per passenger (in €) from 2000 to 2010: Malév, LOT and CSA
Source: own figure, based on Annual Reports
The available partial measures confirm the low efficiency scores of the total measures. The average
load factor in 2010 was 78 to 79 percent in Europe. By comparison, Malév increased its load factor
from 62 percent in 2000 up to around 70 percent by 2010, while CSA had an almost constant load factor
of 70 percent in the same time period. LOT had better values: up to 75 percent. However, it was still
considerably lower than the load factor of Lufthansa (79.4 percent) or LCC competitors Ryanair and
Wizzair (both 82 percent).
Load factor of European airlines (in percent)
Source: Akbar et al (2014); own analysis based on AEA, IATA and annual reports
By comparing the aircraft utilization of Malév and LOT in the period between 2002 and 2007, we can
conclude that the values (8 to 9 hours flown a day) were in accordance with the industry average.
Ryanair and Lufthansa planes operated up to 10 hours a day.
-40
-30
-20
-10
0
10
2000 2001 2002 2003 2004 2005 2006 2007 2008 2009 2010
Malev LOT CSA
60
65
70
75
80
85
90
load factor 2004
load factor 2010
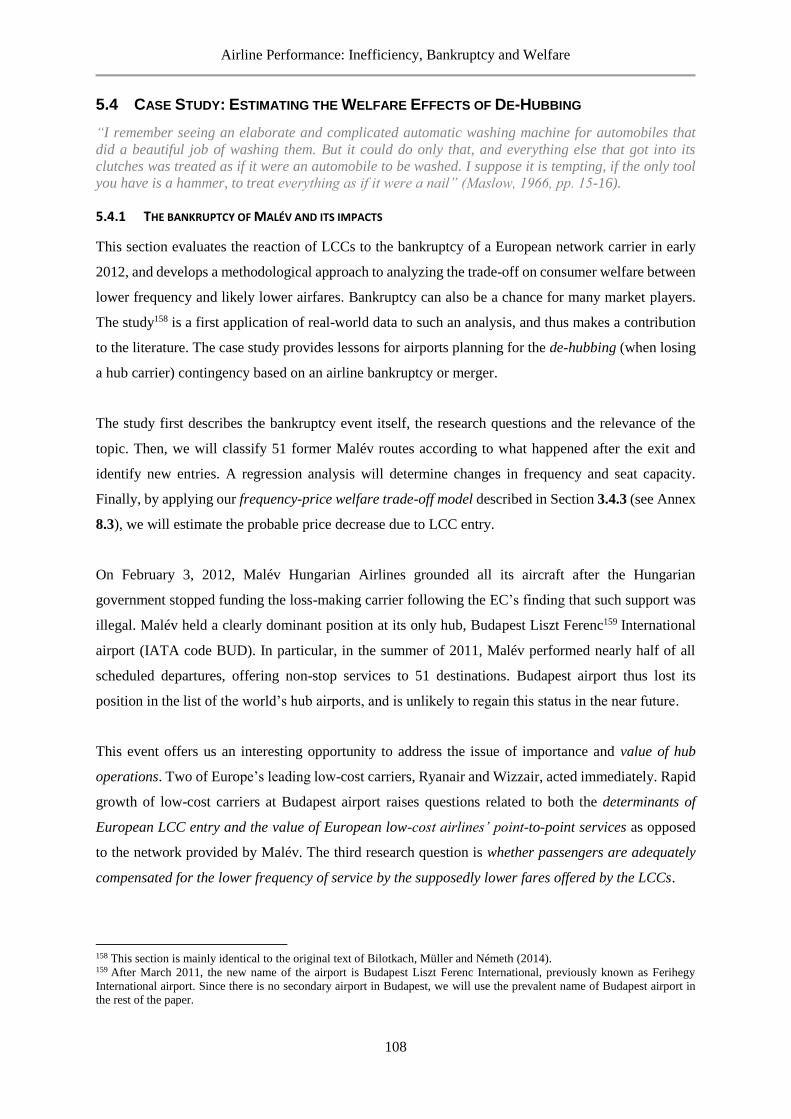
Airline Performance: Inefficiency, Bankruptcy and Welfare
108
5.4 CASE STUDY: ESTIMATING THE WELFARE EFFECTS OF DE-HUBBING
“I remember seeing an elaborate and complicated automatic washing machine for automobiles that
did a beautiful job of washing them. But it could do only that, and everything else that got into its
clutches was treated as if it were an automobile to be washed. I suppose it is tempting, if the only tool
you have is a hammer, to treat everything as if it were a nail” (Maslow, 1966, pp. 15-16).
5.4.1 THE BANKRUPTCY OF MALÉV AND ITS IMPACTS
This section evaluates the reaction of LCCs to the bankruptcy of a European network carrier in early
2012, and develops a methodological approach to analyzing the trade-off on consumer welfare between
lower frequency and likely lower airfares. Bankruptcy can also be a chance for many market players.
The study158 is a first application of real-world data to such an analysis, and thus makes a contribution
to the literature. The case study provides lessons for airports planning for the de-hubbing (when losing
a hub carrier) contingency based on an airline bankruptcy or merger.
The study first describes the bankruptcy event itself, the research questions and the relevance of the
topic. Then, we will classify 51 former Malév routes according to what happened after the exit and
identify new entries. A regression analysis will determine changes in frequency and seat capacity.
Finally, by applying our frequency-price welfare trade-off model described in Section 3.4.3 (see Annex
8.3), we will estimate the probable price decrease due to LCC entry.
On February 3, 2012, Malév Hungarian Airlines grounded all its aircraft after the Hungarian
government stopped funding the loss-making carrier following the EC’s finding that such support was
illegal. Malév held a clearly dominant position at its only hub, Budapest Liszt Ferenc159 International
airport (IATA code BUD). In particular, in the summer of 2011, Malév performed nearly half of all
scheduled departures, offering non-stop services to 51 destinations. Budapest airport thus lost its
position in the list of the world’s hub airports, and is unlikely to regain this status in the near future.
This event offers us an interesting opportunity to address the issue of importance and value of hub
operations. Two of Europe’s leading low-cost carriers, Ryanair and Wizzair, acted immediately. Rapid
growth of low-cost carriers at Budapest airport raises questions related to both the determinants of
European LCC entry and the value of European low-cost airlines’ point-to-point services as opposed
to the network provided by Malév. The third research question is whether passengers are adequately
compensated for the lower frequency of service by the supposedly lower fares offered by the LCCs.
158 This section is mainly identical to the original text of Bilotkach, Müller and Németh (2014). 159 After March 2011, the new name of the airport is Budapest Liszt Ferenc International, previously known as Ferihegy
International airport. Since there is no secondary airport in Budapest, we will use the prevalent name of Budapest airport in
the rest of the paper.
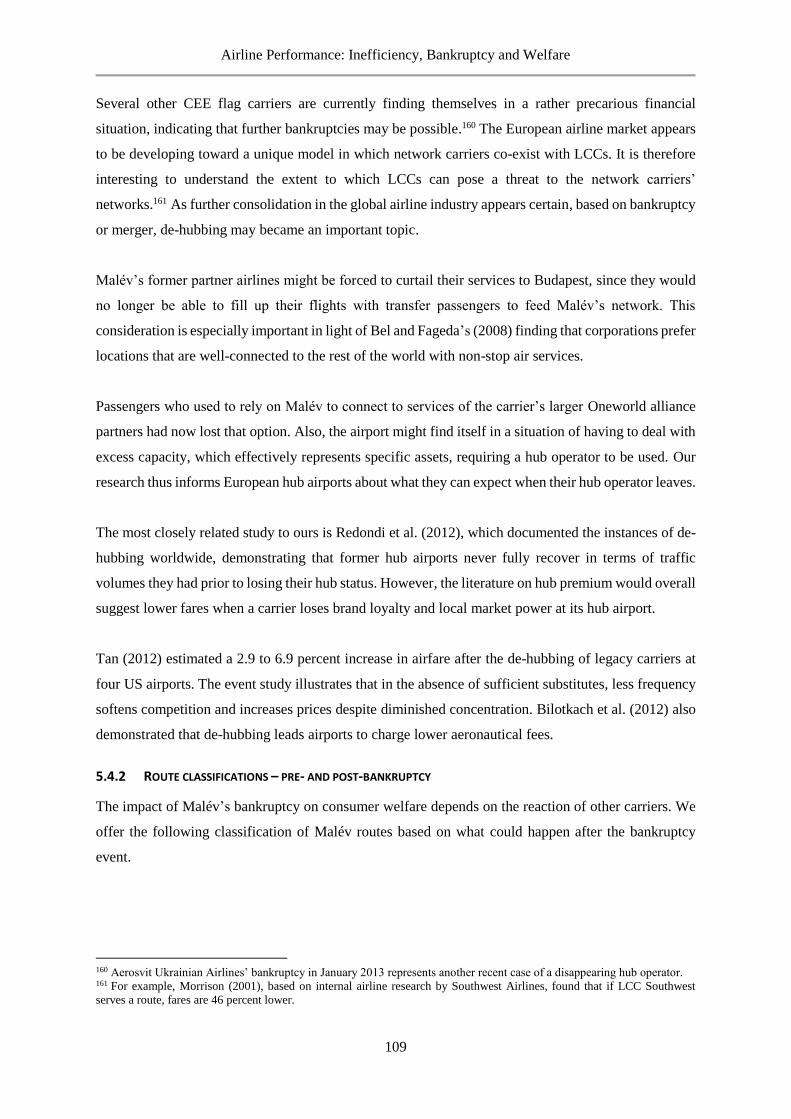
Airline Performance: Inefficiency, Bankruptcy and Welfare
109
Several other CEE flag carriers are currently finding themselves in a rather precarious financial
situation, indicating that further bankruptcies may be possible.160 The European airline market appears
to be developing toward a unique model in which network carriers co-exist with LCCs. It is therefore
interesting to understand the extent to which LCCs can pose a threat to the network carriers’
networks.161 As further consolidation in the global airline industry appears certain, based on bankruptcy
or merger, de-hubbing may became an important topic.
Malév’s former partner airlines might be forced to curtail their services to Budapest, since they would
no longer be able to fill up their flights with transfer passengers to feed Malév’s network. This
consideration is especially important in light of Bel and Fageda’s (2008) finding that corporations prefer
locations that are well-connected to the rest of the world with non-stop air services.
Passengers who used to rely on Malév to connect to services of the carrier’s larger Oneworld alliance
partners had now lost that option. Also, the airport might find itself in a situation of having to deal with
excess capacity, which effectively represents specific assets, requiring a hub operator to be used. Our
research thus informs European hub airports about what they can expect when their hub operator leaves.
The most closely related study to ours is Redondi et al. (2012), which documented the instances of de-
hubbing worldwide, demonstrating that former hub airports never fully recover in terms of traffic
volumes they had prior to losing their hub status. However, the literature on hub premium would overall
suggest lower fares when a carrier loses brand loyalty and local market power at its hub airport.
Tan (2012) estimated a 2.9 to 6.9 percent increase in airfare after the de-hubbing of legacy carriers at
four US airports. The event study illustrates that in the absence of sufficient substitutes, less frequency
softens competition and increases prices despite diminished concentration. Bilotkach et al. (2012) also
demonstrated that de-hubbing leads airports to charge lower aeronautical fees.
5.4.2 ROUTE CLASSIFICATIONS – PRE- AND POST-BANKRUPTCY
The impact of Malév’s bankruptcy on consumer welfare depends on the reaction of other carriers. We
offer the following classification of Malév routes based on what could happen after the bankruptcy
event.
160 Aerosvit Ukrainian Airlines’ bankruptcy in January 2013 represents another recent case of a disappearing hub operator. 161 For example, Morrison (2001), based on internal airline research by Southwest Airlines, found that if LCC Southwest
serves a route, fares are 46 percent lower.
Airline Performance: Inefficiency, Bankruptcy and Welfare
110
1. Malév monopoly, no replacement. 14 routes lost all service as of summer 2012. Alternatives (in
particular, connected flights) imply a substantial increase in travel time, and potentially in the total
cost of travel. Those destinations include Beirut and Damascus162; Tirana, Skopje, Belgrade and
Pristina in the Balkans; and St. Petersburg and Odessa in Russia. Additionally, American Airlines
(Malév’s partner in the Oneworld alliance) chose to discontinue its flights to New York, and Hainan
Airlines stopped flying to Beijing, marking a loss of all long-haul services out of BUD.163 Thus,
these former passengers are definitely worse off.
2. Malév monopoly with legacy carrier entry. We only have two such cases: Lufthansa started flying
to BUD from Hamburg (flights operated by Eurowings, a Lufthansa-owned subsidiary) and Berlin.
Remaining a monopoly, passengers are definitely not better off.
3. Malév duopoly with a legacy carrier; the legacy carrier expands its service. Aeroflot, Air France,
Austrian Airlines and Finnair are the carriers who expanded their services to Budapest from their
hubs following Malév’s bankruptcy. Their frequency, however, tends to be lower than the total
frequency of service by Malév and the corresponding legacy carrier before the bankruptcy.
Competition decreased, along with total frequency of service, so passengers are likely paying higher
fares on the respective routes. At the same time, passengers have gained better access to the
networks of the corresponding network carriers.
4. Malév monopoly with LCC entry. After the bankruptcy, Wizzair entered eight such markets,
Ryanair started its services in three and Air Berlin entered one route.
5. Malév duopoly with a legacy carrier; an LCC enters this route. Some cases of this kind are observed
as well, including Dublin and Warsaw.
6. Malév duopoly with an LCC that expands its service. Wizzair did this in seven separate markets
(Ryanair was not present at BUD in the summer of 2011).
162 We could argue that services to Damascus would have been discontinued regardless of Malév’s fate, due to the civil war
that broke out in Syria around the same time. The only medium-haul flight out of Budapest airport in summer 2012 was Qatar
Airlines’ service to Doha. 163 Interestingly, Aerosvit’s bankruptcy also led to the disappearance of all long-haul services out of Kyiv Boryspil airport.
Airline Performance: Inefficiency, Bankruptcy and Welfare
111
Wizzair is a Hungarian low-cost carrier which has established itself as the leading LCC in Eastern
Europe. Based in Ireland and operating a fleet of over 300 aircraft, Ryanair is the largest LCC in Europe.
Both Ryanair and Wizzair have similar business models.164
We will use the data on frequency and seat capacity for scheduled airline services from Budapest
airport165 included in the 2011 and 2012 summer schedules. Both schedules cover the period from April
through October of the respective year.
The data were aggregated to different levels: airline-destination level data in the first stage, and airport-
market and city-pair market data in the second stage. 166 The data was supplemented with the
information on distances between the airports, the population and the income per capita at the
destination. For the distance (in km), we used Malév Horizon Magazine (2010) and the website
www.aircalculator.com. We retrieved the latest larger urban zone population data from Eurostat (2012)
and OECD. Similarly, the income per capita data came from OECD.167
5.4.3 REGRESSION ANALYSIS AND CONSUMER WELFARE ESTIMATION
In 2011, the schedule included 60,737 flights to 92 airports (79 city-markets). The 2012 summer
schedule included 46,721 flights to 94 airports (72 cities). Therefore, BUD lost about a quarter of its
scheduled flights. The offered seat capacity decreased from 7.5 million to about 6.9 million, about an 8
percent decline. Sixty-two cities maintained scheduled non-stop services out of Budapest airport, but
only 26 were served with a higher frequency.
Yet, over half of cities (35) gained offered seat capacity. One-third of added capacity came from Ryanair
and Wizzair. Lufthansa had become Budapest airport’s third largest airline in terms of flight frequency
(with a 13 percent market share).168
164 Including strictly point-to-point operations (Any passenger wishing to connect from one flight to the next must purchase
two separate tickets. The airlines will not be responsible for any missed connections, irrespective of the reason.), strictly non-
refundable fares, fees for checked luggage and substantial restrictions on carry-on luggage, an absence of frequent flier
programs, an absence of assigned seating (and fees for the right to select a specific seat), extensive use of smaller remote
airports and a single aircraft-type fleet. 165 We would like to thank Patrick Bohl, Head of Airline Development and Strategy at BUD airport, for kindly providing us
the latest schedule data. 166 Point-to-point carriers often use smaller secondary airports. 167 OECD data are at the country level. For destinations outside the EU/OECD countries, we used various data sources (mostly
national statistical agencies) to obtain the latest available figures for population and income per capita. 168 In 2011, Malév was the largest carrier at the airport, followed by Lufthansa and Wizzair (who had approximately an equal
number of flights). In 2012, if we add all the carriers owned by Lufthansa to the picture (Swiss, Austrian, Brussels and German
Wings), the Lufthansa Group became the largest carrier at BUD, with over 23 percent market share (based on number of
flights). Apart from Lufthansa, Wizzair, and Ryanair, no other carrier achieved more than a 5 percent market share in terms of
flight frequency.
Airline Performance: Inefficiency, Bankruptcy and Welfare
112
Using the techniques of generalized least square (GLS) and binary probit maximum likelihood (ML)
estimations,169 we subjected our data to a regression analysis170 and found the following facts. There
was a significant frequency and seat capacity reduction. An average destination lost about 18 percent
of its flights.171 We found that distance and endpoints’ demographic characteristics were not robust
predictors of changes.172
At the same time, replacing Malév with either Ryanair or Wizzair would lead to an overall decline in
the frequency of service. Ryanair appears to add half the frequency withdrawn by Malév; the
corresponding figure for Wizzair is one-third.
There are several determinants of new and discontinued services. The level of per capita income
emerged as a strong predictor of discontinued services. Destinations that had more flights to BUD in
2011 were less likely to be lost. Both LCC carriers were attracted to flights to high-income destinations,
but Wizzair was also attracted to the lower-population destinations.173 While Ryanair appeared to be
seeking shorter-haul routes to higher-income destinations that have generally been underserved,
Wizzair’s strategy appeared to be geared toward replacing Malév’s services.
Brueckner et al. (2013) demonstrated that the entry of an LCC reduces average airfares by about 33
percent, or 20 percent if the LCC serves a secondary airport (we suppose the latter case). Additionally,
we obtained access to fare quotes collected on a number of European routes in 2005.174 The average
one-way LCC-network price differential corresponded to about €43 in 2012. We considered a further
shrink in the price differential by about a quarter175 to €32.25. The following table summarizes the
results on city pairs with lower frequency.
169 The dependent variables were flight frequency and the number of seats. Our control variables were distance, population
and per capita income. We also differentiated between such as indicator variables as island destination (when lacking other
transport modes, and particularly higher tourism, demand on islands might be higher) and destinations served by Malév,
Ryanair and Wizzair. Total and Malév flights were differentiated as well. We used natural logarithms to mitigate the
heteroscedasticity problem (thus, if the variance of the dependent variable is different with different values of the independent
variables; var (ui) ≠ 𝜎 square). 170 Please find the detailed data analysis and the corresponding tables in our research paper. 171 The number drops to 11 percent if we exclude discontinued destinations (those included less populous metropolitan areas
with lower per capita income than average in the sample). 172 With the exception that island destinations appeared to be attracting more services, other things were equal. The latter result
may be related to the strong presence of Ryanair in the British market, coupled with a substantial Hungarian diaspora living
there. 173 The latter result could be explained by the fact that Wizzair, which had an established presence at BUD prior to Malév’s
bankruptcy, could have entered the higher-population destinations before the event. 174 The data were provided by Claudio Piga, who collected airfares net of taxes and fees 14, 21, and 28 days before the flight
departure date. Each number is the average for hundreds to several thousand observations. We are very grateful to Claudio for
giving us this information. 175 First, in contrast to LCCs, network carriers are known to discriminate between one-way and roundtrip passenger fares, so
that network carriers’ lowest one-way fares require purchasing a return ticket. LCCs are more likely to charge a booking fee
and add different fees for add-on services (e.g., checked luggage, seat reservations, in-flight drinks/meals) to the ticket price.
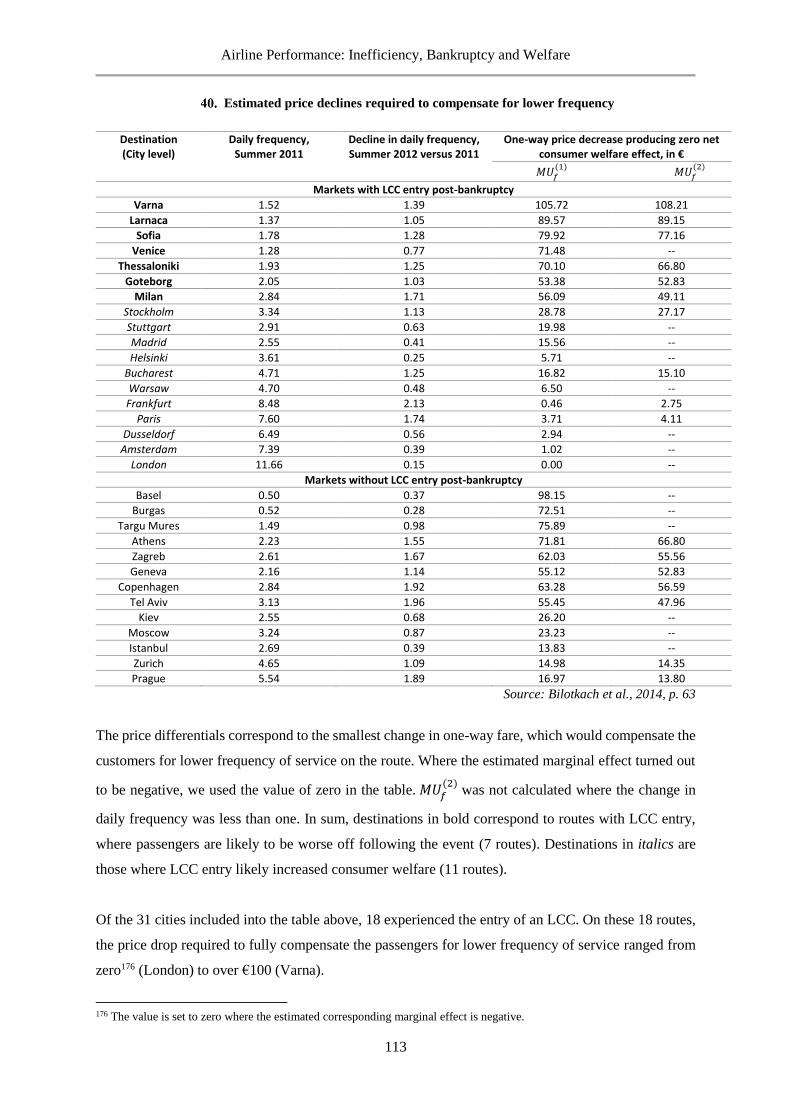
Airline Performance: Inefficiency, Bankruptcy and Welfare
113
Estimated price declines required to compensate for lower frequency
Destination (City level)
Daily frequency, Summer 2011
Decline in daily frequency, Summer 2012 versus 2011
One-way price decrease producing zero net consumer welfare effect, in €
𝑀𝑈𝑓(1)
𝑀𝑈𝑓(2)
Markets with LCC entry post-bankruptcy
Varna 1.52 1.39 105.72 108.21
Larnaca 1.37 1.05 89.57 89.15
Sofia 1.78 1.28 79.92 77.16
Venice 1.28 0.77 71.48 --
Thessaloniki 1.93 1.25 70.10 66.80
Goteborg 2.05 1.03 53.38 52.83
Milan 2.84 1.71 56.09 49.11
Stockholm 3.34 1.13 28.78 27.17
Stuttgart 2.91 0.63 19.98 --
Madrid 2.55 0.41 15.56 --
Helsinki 3.61 0.25 5.71 --
Bucharest 4.71 1.25 16.82 15.10
Warsaw 4.70 0.48 6.50 --
Frankfurt 8.48 2.13 0.46 2.75
Paris 7.60 1.74 3.71 4.11
Dusseldorf 6.49 0.56 2.94 --
Amsterdam 7.39 0.39 1.02 --
London 11.66 0.15 0.00 --
Markets without LCC entry post-bankruptcy
Basel 0.50 0.37 98.15 --
Burgas 0.52 0.28 72.51 --
Targu Mures 1.49 0.98 75.89 --
Athens 2.23 1.55 71.81 66.80
Zagreb 2.61 1.67 62.03 55.56
Geneva 2.16 1.14 55.12 52.83
Copenhagen 2.84 1.92 63.28 56.59
Tel Aviv 3.13 1.96 55.45 47.96
Kiev 2.55 0.68 26.20 --
Moscow 3.24 0.87 23.23 --
Istanbul 2.69 0.39 13.83 --
Zurich 4.65 1.09 14.98 14.35
Prague 5.54 1.89 16.97 13.80
Source: Bilotkach et al., 2014, p. 63
The price differentials correspond to the smallest change in one-way fare, which would compensate the
customers for lower frequency of service on the route. Where the estimated marginal effect turned out
to be negative, we used the value of zero in the table. 𝑀𝑈𝑓(2)
was not calculated where the change in
daily frequency was less than one. In sum, destinations in bold correspond to routes with LCC entry,
where passengers are likely to be worse off following the event (7 routes). Destinations in italics are
those where LCC entry likely increased consumer welfare (11 routes).
Of the 31 cities included into the table above, 18 experienced the entry of an LCC. On these 18 routes,
the price drop required to fully compensate the passengers for lower frequency of service ranged from
zero176 (London) to over €100 (Varna).
176 The value is set to zero where the estimated corresponding marginal effect is negative.
Airline Performance: Inefficiency, Bankruptcy and Welfare
114
Passengers flying to London are probably better off after Malév’s bankruptcy, given the overall small
decrease in frequency of service. At the other extreme, passengers traveling to Varna would probably
not be compensated adequately for the decreased frequency of service and can be expected to be worse
off.
Passengers traveling to seven destinations (Milan, Varna, Sofia, Thessaloniki, Larnaca, Goteborg and
Venice) could potentially be worse off after the bankruptcy event, despite the entry of low-cost carriers
on those routes to replace services that had been provided by Malév. Stockholm is a borderline case.
Passengers traveling to the remaining 10 destinations where total frequency of service decreased and
Malév was replaced by an LCC are likely to be better off.177
In sum, of 51 Malév destinations in 2011, 14 lost all operations in 2012. Passengers traveling on six
routes were better off, at least in terms of higher frequency. Thirty-one destinations lost frequency, but
due to LCC entry on 18 routes, passengers traveling between 11 city pairs might be compensated by
lower prices.
We can thus conclude that the short-time negative effects of a failure have likely been limited.
177 Some shortcomings should be mentioned. We used estimates of marginal effects of frequency reduction on consumer
utility, which are not based on the data that comes from the markets in question. Further, our estimates of likely network-LCC
price differentials are very rough. Also, the marginal effects are likely to vary with passengers’ income and trip purpose, as
well as with the travel time. Last but not least, we only gave brief credit to the fact that LCCs are likely to enter a metropolitan
area with service to smaller airports, without looking deeper into the increase in travel time.
Airline Performance: Inefficiency, Bankruptcy and Welfare
115
5.5 CONCLUSIONS
Chapter 5 introduced different benchmarking approaches to measure performance (efficiency) and
explained general underperformance in aviation. Section 5.2 addressed the fears and (missed)
opportunities of a failing airline and found that management forms the main obstacle to developing
performance. We can learn from the study about hidden barriers when taking over an airline with poor
performance. We showed that Central Eastern European carriers are inefficient relative to competitors,
created losses and were perceived by customers to offer poorer quality services. This suggests that they
were able to survive despite their poor performance, thus the permanent failing organization prevents
exit. Support is embodied in positive coverage of the organization and its activities by the media,
uncritical endorsement by known figures in society or the repeated granting of contracts, particularly
government contracts. This support carries a clear message to stakeholders that the organization and its
activities are legitimate and in need of further financial, moral and political support. However,
continued support deteriorates performance and leads to permanent failure.
The study found qualitative evidence for the persistence of short-term decision making, ongoing
contradictions between articulated strategy and its poor implementation, and frequently assiduous
intervention by governments that, instead of fostering decisive decision making, served to do the
opposite. These factors contributed to reinforcing deeply held beliefs among top and middle
management that they would survive despite the obvious problems they had faced and continue to
confront.
Malév finally failed. The explanation for Malév’s exit can be found in the changing constellation of
interests among external stakeholders in this case – in particular the EC’s refusal to permit state aid.
Evidence from this chapter suggests that the EC’s decision to rule against the subsidy was due to the
Hungarian government’s failure to credibly make the case for continued support for Malév (in contrast
to both CSA Czech and LOT Polish Airlines).
Section 5.4 measured the value of airline networks and the welfare effects of Malév’s bankruptcy. The
evidence showed assorted results: leisure passengers probably benefited from immediate LCC entry,
while business or connecting passengers suffered short-term losses. We estimated the minimum price
reductions to compensate passengers for the, on average, 18 percent lower frequency on 51 former
Malév routes. We found that passengers on 11 routes might be compensated, so they were at least not
worse off after the event. In sum, both the passenger mix and the airport’s reaction affected new entry.
Latter may be constrained by the regulatory framework and has clear policy implications. Our study
provides some lessons for airports to use in planning for the de-hubbing contingency, and the
methodology for addressing the price-frequency trade-off.
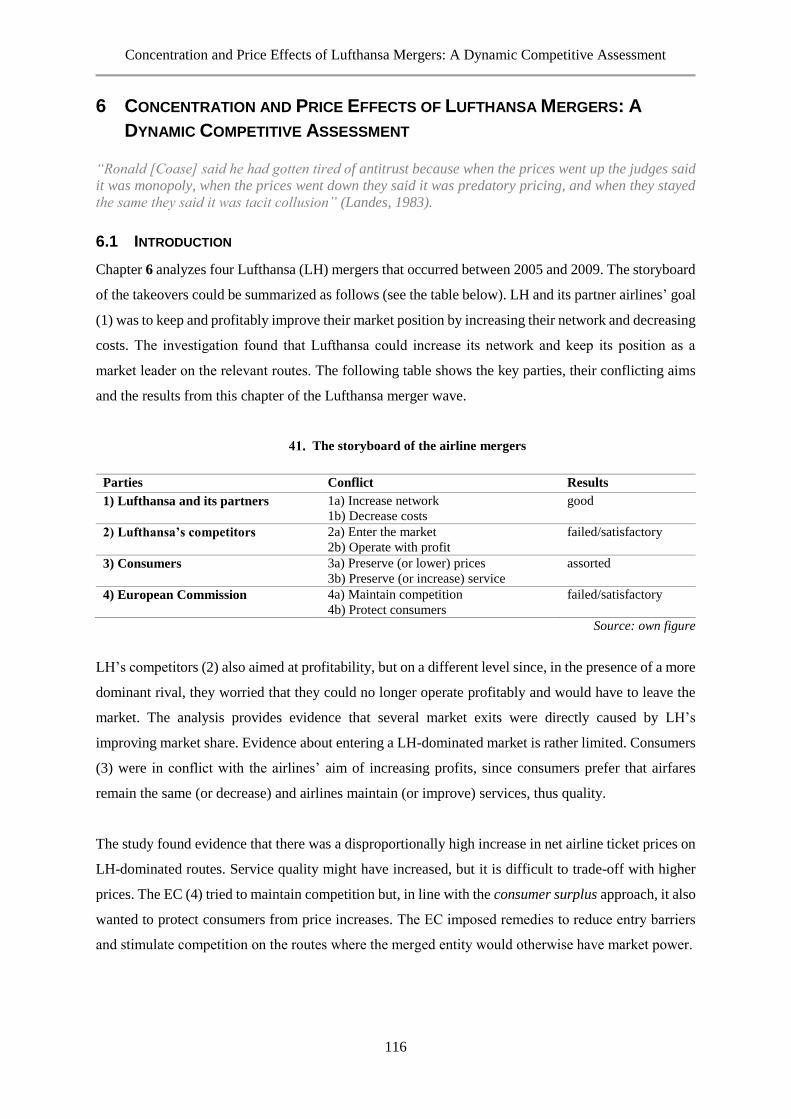
Concentration and Price Effects of Lufthansa Mergers: A Dynamic Competitive Assessment
116
6 CONCENTRATION AND PRICE EFFECTS OF LUFTHANSA MERGERS: A
DYNAMIC COMPETITIVE ASSESSMENT
“Ronald [Coase] said he had gotten tired of antitrust because when the prices went up the judges said
it was monopoly, when the prices went down they said it was predatory pricing, and when they stayed
the same they said it was tacit collusion” (Landes, 1983).
6.1 INTRODUCTION
Chapter 6 analyzes four Lufthansa (LH) mergers that occurred between 2005 and 2009. The storyboard
of the takeovers could be summarized as follows (see the table below). LH and its partner airlines’ goal
(1) was to keep and profitably improve their market position by increasing their network and decreasing
costs. The investigation found that Lufthansa could increase its network and keep its position as a
market leader on the relevant routes. The following table shows the key parties, their conflicting aims
and the results from this chapter of the Lufthansa merger wave.
The storyboard of the airline mergers
Parties Conflict Results
1) Lufthansa and its partners 1a) Increase network
1b) Decrease costs
good
2) Lufthansa’s competitors 2a) Enter the market
2b) Operate with profit
failed/satisfactory
3) Consumers 3a) Preserve (or lower) prices
3b) Preserve (or increase) service
assorted
4) European Commission 4a) Maintain competition
4b) Protect consumers
failed/satisfactory
Source: own figure
LH’s competitors (2) also aimed at profitability, but on a different level since, in the presence of a more
dominant rival, they worried that they could no longer operate profitably and would have to leave the
market. The analysis provides evidence that several market exits were directly caused by LH’s
improving market share. Evidence about entering a LH-dominated market is rather limited. Consumers
(3) were in conflict with the airlines’ aim of increasing profits, since consumers prefer that airfares
remain the same (or decrease) and airlines maintain (or improve) services, thus quality.
The study found evidence that there was a disproportionally high increase in net airline ticket prices on
LH-dominated routes. Service quality might have increased, but it is difficult to trade-off with higher
prices. The EC (4) tried to maintain competition but, in line with the consumer surplus approach, it also
wanted to protect consumers from price increases. The EC imposed remedies to reduce entry barriers
and stimulate competition on the routes where the merged entity would otherwise have market power.
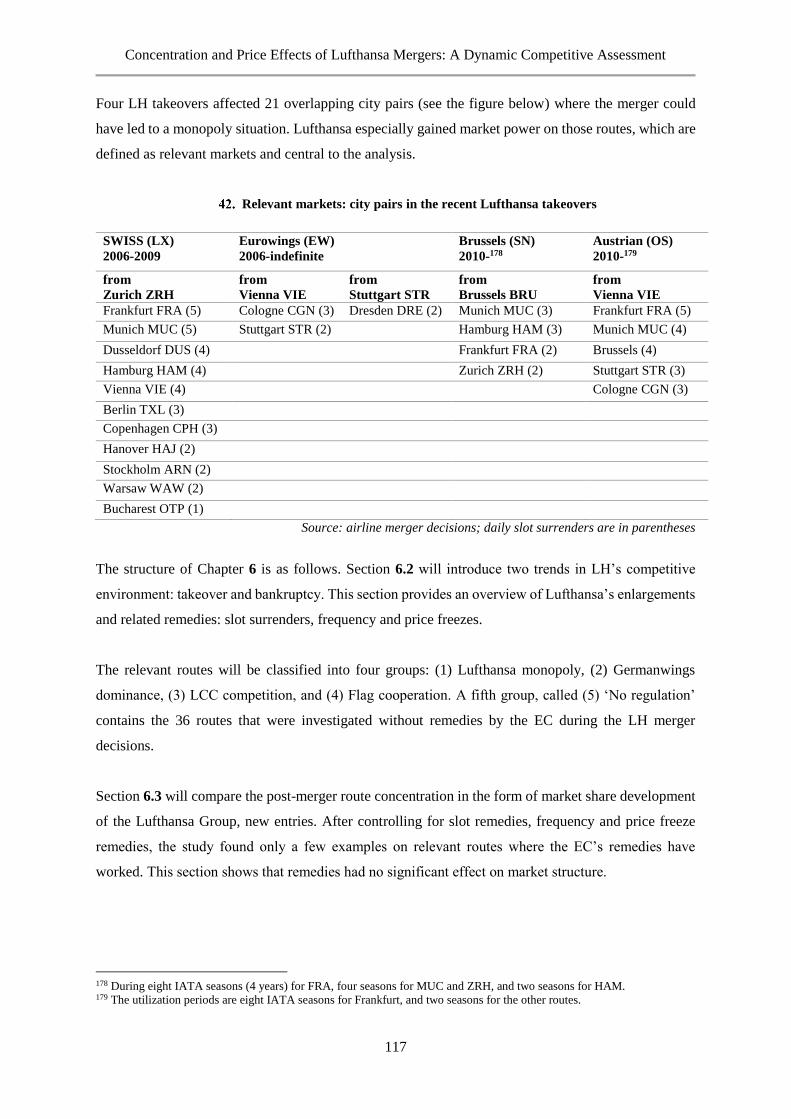
Concentration and Price Effects of Lufthansa Mergers: A Dynamic Competitive Assessment
117
Four LH takeovers affected 21 overlapping city pairs (see the figure below) where the merger could
have led to a monopoly situation. Lufthansa especially gained market power on those routes, which are
defined as relevant markets and central to the analysis.
Relevant markets: city pairs in the recent Lufthansa takeovers
SWISS (LX)
2006-2009
Eurowings (EW)
2006-indefinite
Brussels (SN)
2010-178
Austrian (OS)
2010-179
from
Zurich ZRH
from
Vienna VIE
from
Stuttgart STR
from
Brussels BRU
from
Vienna VIE
Frankfurt FRA (5) Cologne CGN (3) Dresden DRE (2) Munich MUC (3) Frankfurt FRA (5)
Munich MUC (5) Stuttgart STR (2) Hamburg HAM (3) Munich MUC (4)
Dusseldorf DUS (4) Frankfurt FRA (2) Brussels (4)
Hamburg HAM (4) Zurich ZRH (2) Stuttgart STR (3)
Vienna VIE (4) Cologne CGN (3)
Berlin TXL (3)
Copenhagen CPH (3)
Hanover HAJ (2)
Stockholm ARN (2)
Warsaw WAW (2)
Bucharest OTP (1)
Source: airline merger decisions; daily slot surrenders are in parentheses
The structure of Chapter 6 is as follows. Section 6.2 will introduce two trends in LH’s competitive
environment: takeover and bankruptcy. This section provides an overview of Lufthansa’s enlargements
and related remedies: slot surrenders, frequency and price freezes.
The relevant routes will be classified into four groups: (1) Lufthansa monopoly, (2) Germanwings
dominance, (3) LCC competition, and (4) Flag cooperation. A fifth group, called (5) ‘No regulation’
contains the 36 routes that were investigated without remedies by the EC during the LH merger
decisions.
Section 6.3 will compare the post-merger route concentration in the form of market share development
of the Lufthansa Group, new entries. After controlling for slot remedies, frequency and price freeze
remedies, the study found only a few examples on relevant routes where the EC’s remedies have
worked. This section shows that remedies had no significant effect on market structure.
178 During eight IATA seasons (4 years) for FRA, four seasons for MUC and ZRH, and two seasons for HAM. 179 The utilization periods are eight IATA seasons for Frankfurt, and two seasons for the other routes.
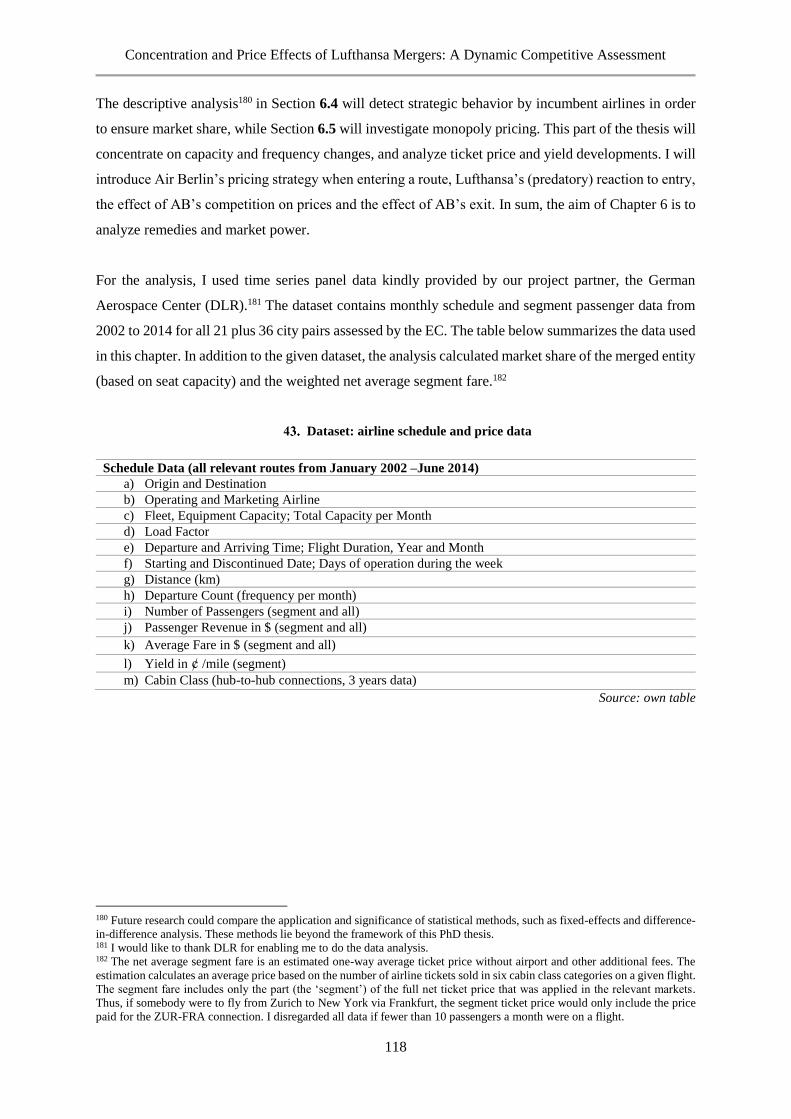
Concentration and Price Effects of Lufthansa Mergers: A Dynamic Competitive Assessment
118
The descriptive analysis180 in Section 6.4 will detect strategic behavior by incumbent airlines in order
to ensure market share, while Section 6.5 will investigate monopoly pricing. This part of the thesis will
concentrate on capacity and frequency changes, and analyze ticket price and yield developments. I will
introduce Air Berlin’s pricing strategy when entering a route, Lufthansa’s (predatory) reaction to entry,
the effect of AB’s competition on prices and the effect of AB’s exit. In sum, the aim of Chapter 6 is to
analyze remedies and market power.
For the analysis, I used time series panel data kindly provided by our project partner, the German
Aerospace Center (DLR).181 The dataset contains monthly schedule and segment passenger data from
2002 to 2014 for all 21 plus 36 city pairs assessed by the EC. The table below summarizes the data used
in this chapter. In addition to the given dataset, the analysis calculated market share of the merged entity
(based on seat capacity) and the weighted net average segment fare.182
Dataset: airline schedule and price data
Schedule Data (all relevant routes from January 2002 –June 2014)
a) Origin and Destination
b) Operating and Marketing Airline
c) Fleet, Equipment Capacity; Total Capacity per Month
d) Load Factor
e) Departure and Arriving Time; Flight Duration, Year and Month
f) Starting and Discontinued Date; Days of operation during the week
g) Distance (km)
h) Departure Count (frequency per month)
i) Number of Passengers (segment and all)
j) Passenger Revenue in $ (segment and all)
k) Average Fare in $ (segment and all)
l) Yield in ȼ /mile (segment)
m) Cabin Class (hub-to-hub connections, 3 years data)
Source: own table
180 Future research could compare the application and significance of statistical methods, such as fixed-effects and difference-
in-difference analysis. These methods lie beyond the framework of this PhD thesis. 181 I would like to thank DLR for enabling me to do the data analysis. 182 The net average segment fare is an estimated one-way average ticket price without airport and other additional fees. The
estimation calculates an average price based on the number of airline tickets sold in six cabin class categories on a given flight.
The segment fare includes only the part (the ‘segment’) of the full net ticket price that was applied in the relevant markets.
Thus, if somebody were to fly from Zurich to New York via Frankfurt, the segment ticket price would only include the price
paid for the ZUR-FRA connection. I disregarded all data if fewer than 10 passengers a month were on a flight.
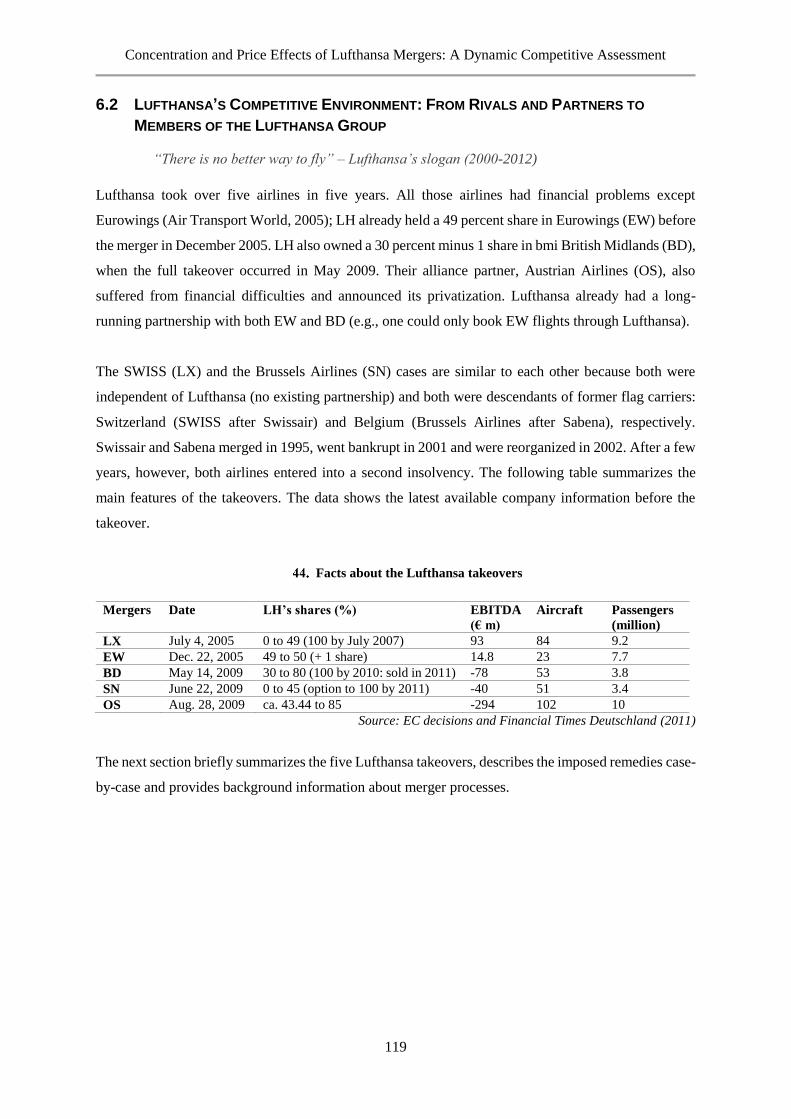
Concentration and Price Effects of Lufthansa Mergers: A Dynamic Competitive Assessment
119
6.2 LUFTHANSA’S COMPETITIVE ENVIRONMENT: FROM RIVALS AND PARTNERS TO
MEMBERS OF THE LUFTHANSA GROUP
“There is no better way to fly” – Lufthansa’s slogan (2000-2012)
Lufthansa took over five airlines in five years. All those airlines had financial problems except
Eurowings (Air Transport World, 2005); LH already held a 49 percent share in Eurowings (EW) before
the merger in December 2005. LH also owned a 30 percent minus 1 share in bmi British Midlands (BD),
when the full takeover occurred in May 2009. Their alliance partner, Austrian Airlines (OS), also
suffered from financial difficulties and announced its privatization. Lufthansa already had a long-
running partnership with both EW and BD (e.g., one could only book EW flights through Lufthansa).
The SWISS (LX) and the Brussels Airlines (SN) cases are similar to each other because both were
independent of Lufthansa (no existing partnership) and both were descendants of former flag carriers:
Switzerland (SWISS after Swissair) and Belgium (Brussels Airlines after Sabena), respectively.
Swissair and Sabena merged in 1995, went bankrupt in 2001 and were reorganized in 2002. After a few
years, however, both airlines entered into a second insolvency. The following table summarizes the
main features of the takeovers. The data shows the latest available company information before the
takeover.
Facts about the Lufthansa takeovers
Mergers Date LH’s shares (%) EBITDA
(€ m)
Aircraft Passengers
(million)
LX July 4, 2005 0 to 49 (100 by July 2007) 93 84 9.2
EW Dec. 22, 2005 49 to 50 (+ 1 share) 14.8 23 7.7
BD May 14, 2009 30 to 80 (100 by 2010: sold in 2011) -78 53 3.8
SN June 22, 2009 0 to 45 (option to 100 by 2011) -40 51 3.4
OS Aug. 28, 2009 ca. 43.44 to 85 -294 102 10
Source: EC decisions and Financial Times Deutschland (2011)
The next section briefly summarizes the five Lufthansa takeovers, describes the imposed remedies case-
by-case and provides background information about merger processes.
Concentration and Price Effects of Lufthansa Mergers: A Dynamic Competitive Assessment
120
6.2.1 LUFTHANSA TAKEOVERS WITH REMEDIES
The LH/SWISS merger had a specific reason for its creation: SWISS (LX) entered its second
bankruptcy after restructuring efforts failed. Lufthansa took advantage of the opportunity to expand
traffic flows and hub structure. The full integration of LX (by July 2007) into the Lufthansa Group
affected 563 weekly services between Germany and Switzerland. Before Lufthansa bought 100 percent
of LX (M. 3770, 2005), the Swiss airline had aimed to join the Oneworld alliance. Its hub airport in
Zurich is a slot-coordinated airport with high barriers to entry for new airlines.
After analyzing the 64 common city-pair markets, the EC had serious concerns. The merger would lead
to a monopoly on 11 routes: from Zurich airport to Frankfurt, Munich, Berlin, Dusseldorf, Hamburg,
Hannover, Stockholm, Copenhagen, Vienna, Warsaw and Bucharest. Therefore, slots had to be given
up for newcomers at Zurich airport between 2006 and 2009. Further, the merged entity could not
increase prices between August 2005 and April 2006 (price freezing) on any of those routes. On the
Stockholm and Warsaw routes, the published fare also had to be reduced (price reduction remedy) every
time the airline decreased fares on comparable routes (determined by the EC) up until the time when a
new airline began serving the route.
Lufthansa increased its shares in Eurowings (EW, the 100 percent owner of Germanwings). It had
previously owned 49 percent of EW183 (M. 3940, 2005). LH and EW already had many common routes,
so the EC found that only three city pairs were threatened by potential market power.184 The only ‘rival’
was the alliance partner, Austrian Airlines. The EC introduced slot remedies from 2006 that would run
indefinitely, and also imposed price freezing remedies from January to November 2006 on all those
routes.
The bmi (BD) merger in 2009185 was a “must-takeover” (M. 5403). LH also acquired the remaining 20
percent from SAS Scandinavian Airlines and became the sole owner of BD (Financial Times, 2009).
No slot remedies were imposed in the LH/bmi case, but the process and the results of the takeover are
interesting.186
183 Lufthansa received 24.9 percent of the Eurowings shares in January 2001, and acquired another 24.1 percent of shares in
September 2001 (Bundeskartellamt, 2001). Interestingly, the EC differentiated between the point-to-point and connecting
markets; however, the German Competition and Regulation authority “Bundeskartellamt” did not in 2001. 184 From Vienna to Cologne and to Stuttgart; as well as from Stuttgart to Dresden; only for time-sensitive business passengers. 185 This section is based on our book chapter Fröhlich et al. (2013) and is therefore mainly identical to the original text. 186 After bmi chairman Sir Michael Bishop exercised his option to sell his shares to Lufthansa in October 2008, Lufthansa
bought 50 percent plus one share in the loss-making British airline. Lufthansa did not want to pay the high price (£298m)
agreed to in a contract in 1999, but Bishop resorted to the High Court. In an out-of-court settlement, Lufthansa agreed to pay
Bishop £175m to give up his option and to pay £48m for the bmi shares. In comparison, Lufthansa paid £91.4m for a 20
percent share package in bmi in 1999. Stephan Gemkow, Lufthansa’s chief financial officer, commented on the purchase:
“There are options that put us in the position to acquire the majority of BMI over a foreseeable timeframe. We are determined
to exercise these options. Beyond that there is no need to hold talks” (The Telegraph, 2008). The quote shows that the airline
did not expect substantial synergies.
Concentration and Price Effects of Lufthansa Mergers: A Dynamic Competitive Assessment
121
Lufthansa took full ownership of bmi and obtained 11 percent of all of the slots at London Heathrow,
becoming the second largest airline at the airport and improving its position in the capacity constrained
market. The takeover strengthened bmi’s position in the Middle East as well (Lufthansa, 2010).
The EC had no objections concerning the possible anticompetitive effects of the merger (M. 5403).
Lufthansa’s former CEO, Wolfgang Mayrhuber, argued that due to the multiple hub strategy,
passengers would have higher network quality, more choices and increased flexibility (2009). However,
bmi’s operating profits (EBIT) have been negative187 since 2007 and LH sold the airline in April 2012
(Lufthansa, 2012).
Only a few weeks after the bmi deal, the EC permitted Lufthansa to take over Brussels Airlines (SN)
(M. 5335, 2009). The evaluation of the affected routes found that the merger would lead to significantly
less competition in four city-pair markets. The merging airlines should have made ten daily slots
available for new entrants at Brussels airport: three to Munich, three to Hamburg, two to Frankfurt and
two to Zurich.
KLM/Air France announced its intention to take over Austrian Airlines (OS) in 2008, but surprisingly
withdrew from the deal. Only Lufthansa made a bid (with a negative price).188 Previously, in July 2002,
the EC had allowed an alliance agreement 189 between OS and LH to run until the end of 2005
(COMP/37.730, 2002). The alliance agreement created a quasi-merger (including revenues and cost
sharing derived from joint services) in the Austria/Germany market (Németh & Remetei-Filep, 2010).
In summary, the financial problems of otherwise-failing airlines initiated the Lufthansa takeovers. LH
had successfully applied the first mover advantage and became the strongest competitor on the 21
investigated relevant markets. Driven by the fear that LH would become too strong and abuse its market
power, the EC launched undertakings (see the table below).
187 Bmi experienced a slow recovery after selling Heathrow slots for £100m and reducing the total number of slots from 87 to
66.Loss-making routes were immediately cancelled after the merger, so the capacity was cut by 20 percent in 2009. All in all,
the annual synergy potentials would have been €20m. Nevertheless, the airline reported net losses of €78m in 2009 and €268m
in 2010 and the first half of 2011 combined. Bmi’s operating margin dropped to minus 26 percent in the first half of 2011
(Morgan Stanley Research, 2010). 188 The EC doubted whether the price paid for Austrian Airlines (€366,269) and a €500m grant received as state aid from
Austria reflected the market price. They also doubted whether the sale was truly open, transparent and unconditional.
Nonetheless, the merger was approved (M. 5440, 2009). 189 In its authorization (after refusing it a year before), the European Commission imposed conditions and obligations to
maintain competition (e.g., slot surrender at congested airports; frequencies freeze; mandatory price cuts; blocked space and
interlining agreements with new entrants or intermodal agreements with railways). The EC concentrated its efforts only on
those markets where the parties’ activities were of a parallel nature and the remedies aimed to remove barriers to entry (Németh
& Remetei-Filep, 2010).

Concentration and Price Effects of Lufthansa Mergers: A Dynamic Competitive Assessment
122
Lufthansa’s merger remedies from 2006 to 2013
Remedy Table 2004 2005 2006 2007 2008 2009 2010 2011 2012 2013
Nr. Frequency freeze (ff) Price freeze (pf) Price reduction (pr) S W S W S W S W S W S W S W S W S W S W
1 ZRH-FRA ff at 11 pf pf 5 5 5 5 5 5
2 ZRH-MUC ff at 10 pf pf 5 5 5 5 5 5
3 ZRH-DUS pf pf 4 4 4 4 4 4
4 ZRH-HAM pf pf 4 4 4 4 4 4
5 ZRH-VIE pf pf 4 4 4 4 4 4
6 ZRH-TXL pf pf 3 3 3 3 3 3
7 ZRH-CPH pf pf 3 3 3 3 3 3
8 ZRH-HAJ pf pf 2 2 2 2 2 2
9 ZRH-ARN pr pf pf 2 2 2 2 2 2
10 ZRH-WAW pr pf pf 2 2 2 2 2 2
11 ZRH-OTP pf pf 1 1 1 1 1 1
12 VIE-CGN ff at 3 pf pf 3 3 3 3 3 3 3 3
13 VIE-STR ff at 5 pf pf 2 2 2 2 2 2 3 3
14 STR-DRS ff at 5 pf pf 2 2 2 2 2 2
15 BRU-MUC 3 3 3 3
16 BRU-HAM 3 3
17 BRU-FRA 2 2 2 2 2 2 2 2
18 BRU-ZRH 2 2 2 2
19 VIE-FRA 5 5 5 5 5 5 5 5
20 VIE-BRU 4 4
21 VIE-MUC 4 4 Source: own figure, based on EC decisions
The aim of these remedies was to limit market power by facilitating entry (e.g., slot remedies on 21
routes), to prevent possible anticompetitive behavior by prescribing behavior after new entry (e.g., “ff”
frequency freezing on five routes) and to ensure that synergies from the merger would be passed on to
consumers and would not result in price increases (e.g., “pf” price freezing on 14 routes and “pr” price
reduction on two routes). The table above illustrates the merger remedies imposed in the Lufthansa
takeovers. The slot remedy periods are highlighted in gray and refer to daily slots. S stands for summer,
while W stands for winter.
These remedies are the crucial points of my analysis in this chapter. Section 6.3 will show that the EC’s
remedies were not successful. Since there were very few new entries on the relevant routes,
concentration increased and opened up opportunities to abuse market power.
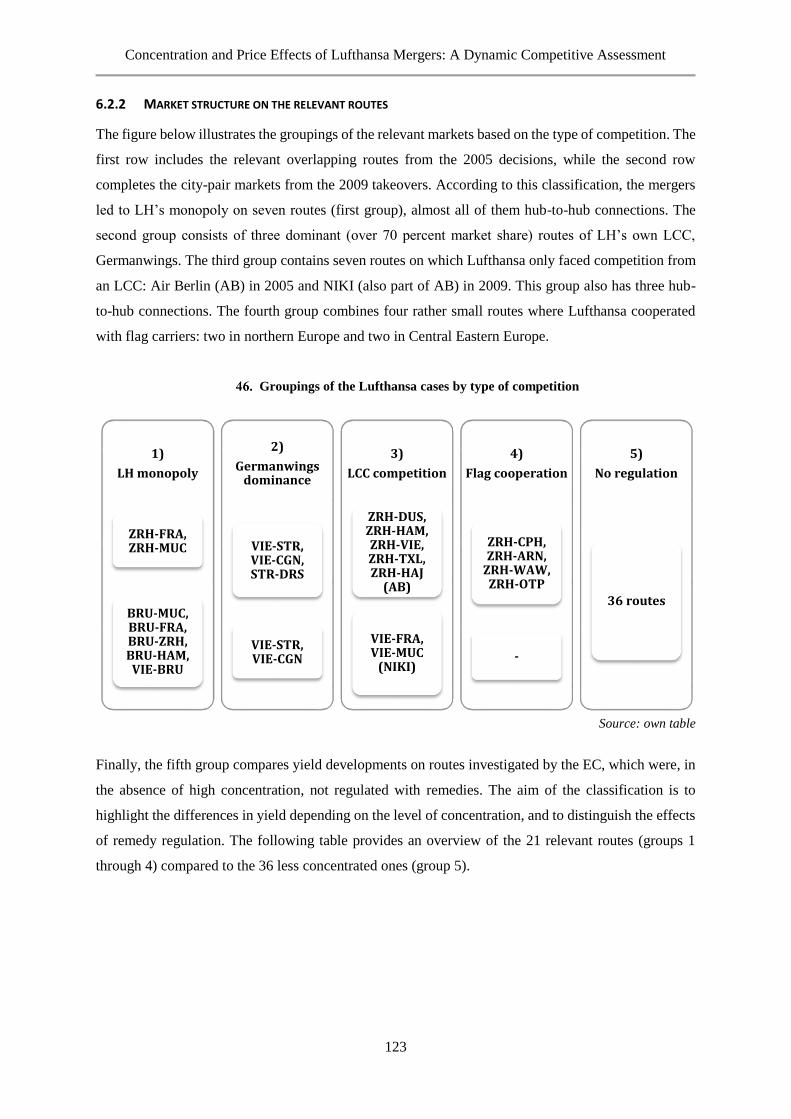
Concentration and Price Effects of Lufthansa Mergers: A Dynamic Competitive Assessment
123
6.2.2 MARKET STRUCTURE ON THE RELEVANT ROUTES
The figure below illustrates the groupings of the relevant markets based on the type of competition. The
first row includes the relevant overlapping routes from the 2005 decisions, while the second row
completes the city-pair markets from the 2009 takeovers. According to this classification, the mergers
led to LH’s monopoly on seven routes (first group), almost all of them hub-to-hub connections. The
second group consists of three dominant (over 70 percent market share) routes of LH’s own LCC,
Germanwings. The third group contains seven routes on which Lufthansa only faced competition from
an LCC: Air Berlin (AB) in 2005 and NIKI (also part of AB) in 2009. This group also has three hub-
to-hub connections. The fourth group combines four rather small routes where Lufthansa cooperated
with flag carriers: two in northern Europe and two in Central Eastern Europe.
Groupings of the Lufthansa cases by type of competition
Source: own table
Finally, the fifth group compares yield developments on routes investigated by the EC, which were, in
the absence of high concentration, not regulated with remedies. The aim of the classification is to
highlight the differences in yield depending on the level of concentration, and to distinguish the effects
of remedy regulation. The following table provides an overview of the 21 relevant routes (groups 1
through 4) compared to the 36 less concentrated ones (group 5).
1)
LH monopoly
ZRH-FRA, ZRH-MUC
BRU-MUC, BRU-FRA, BRU-ZRH, BRU-HAM, VIE-BRU
2)
Germanwings dominance
VIE-STR, VIE-CGN, STR-DRS
VIE-STR, VIE-CGN
3)
LCC competition
ZRH-DUS, ZRH-HAM, ZRH-VIE, ZRH-TXL, ZRH-HAJ
(AB)
VIE-FRA, VIE-MUC
(NIKI)
4)
Flag cooperation
ZRH-CPH, ZRH-ARN,
ZRH-WAW, ZRH-OTP
-
5)
No regulation
36 routes
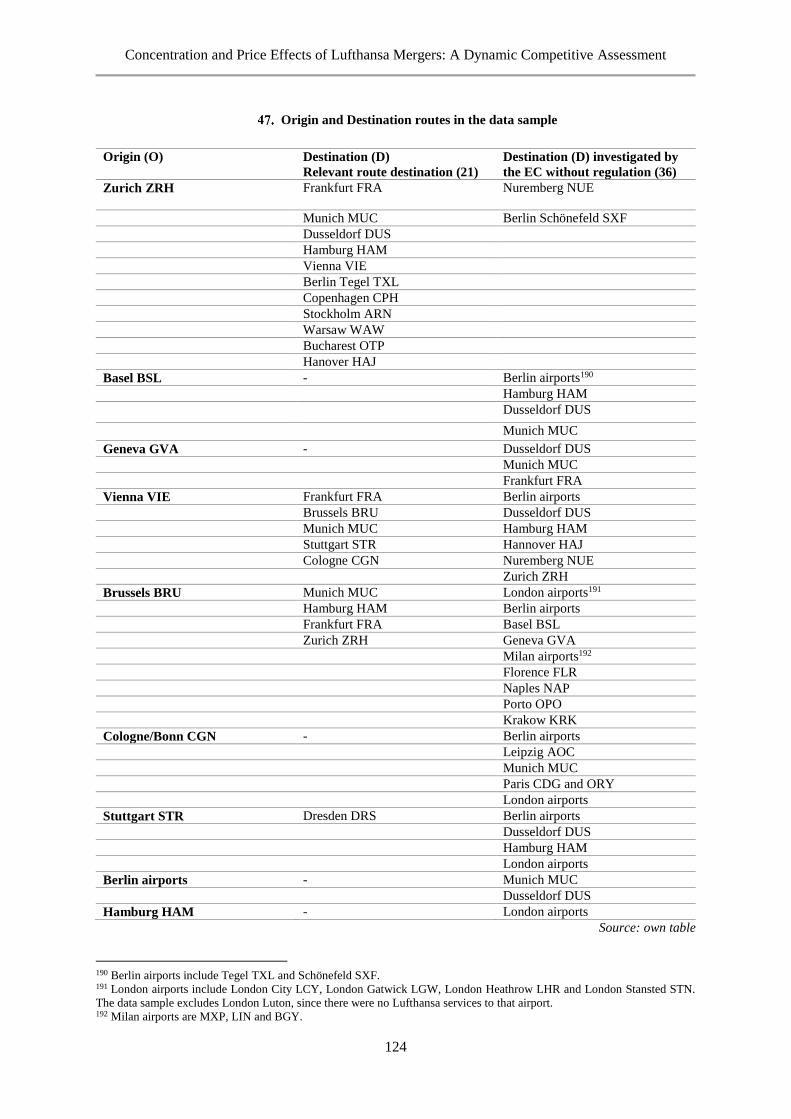
Concentration and Price Effects of Lufthansa Mergers: A Dynamic Competitive Assessment
124
Origin and Destination routes in the data sample
Source: own table
190 Berlin airports include Tegel TXL and Schönefeld SXF. 191 London airports include London City LCY, London Gatwick LGW, London Heathrow LHR and London Stansted STN.
The data sample excludes London Luton, since there were no Lufthansa services to that airport. 192 Milan airports are MXP, LIN and BGY.
Origin (O) Destination (D)
Relevant route destination (21)
Destination (D) investigated by
the EC without regulation (36)
Zurich ZRH Frankfurt FRA Nuremberg NUE
Munich MUC Berlin Schönefeld SXF
Dusseldorf DUS
Hamburg HAM
Vienna VIE
Berlin Tegel TXL
Copenhagen CPH
Stockholm ARN
Warsaw WAW
Bucharest OTP
Hanover HAJ
Basel BSL - Berlin airports190
Hamburg HAM
Dusseldorf DUS
Munich MUC
Geneva GVA - Dusseldorf DUS
Munich MUC
Frankfurt FRA
Vienna VIE Frankfurt FRA Berlin airports
Brussels BRU Dusseldorf DUS
Munich MUC Hamburg HAM
Stuttgart STR Hannover HAJ
Cologne CGN Nuremberg NUE
Zurich ZRH
Brussels BRU Munich MUC London airports191
Hamburg HAM Berlin airports
Frankfurt FRA Basel BSL
Zurich ZRH Geneva GVA
Milan airports192
Florence FLR
Naples NAP
Porto OPO
Krakow KRK
Cologne/Bonn CGN - Berlin airports
Leipzig AOC
Munich MUC
Paris CDG and ORY
London airports
Stuttgart STR Dresden DRS Berlin airports
Dusseldorf DUS
Hamburg HAM
London airports
Berlin airports - Munich MUC
Dusseldorf DUS
Hamburg HAM - London airports
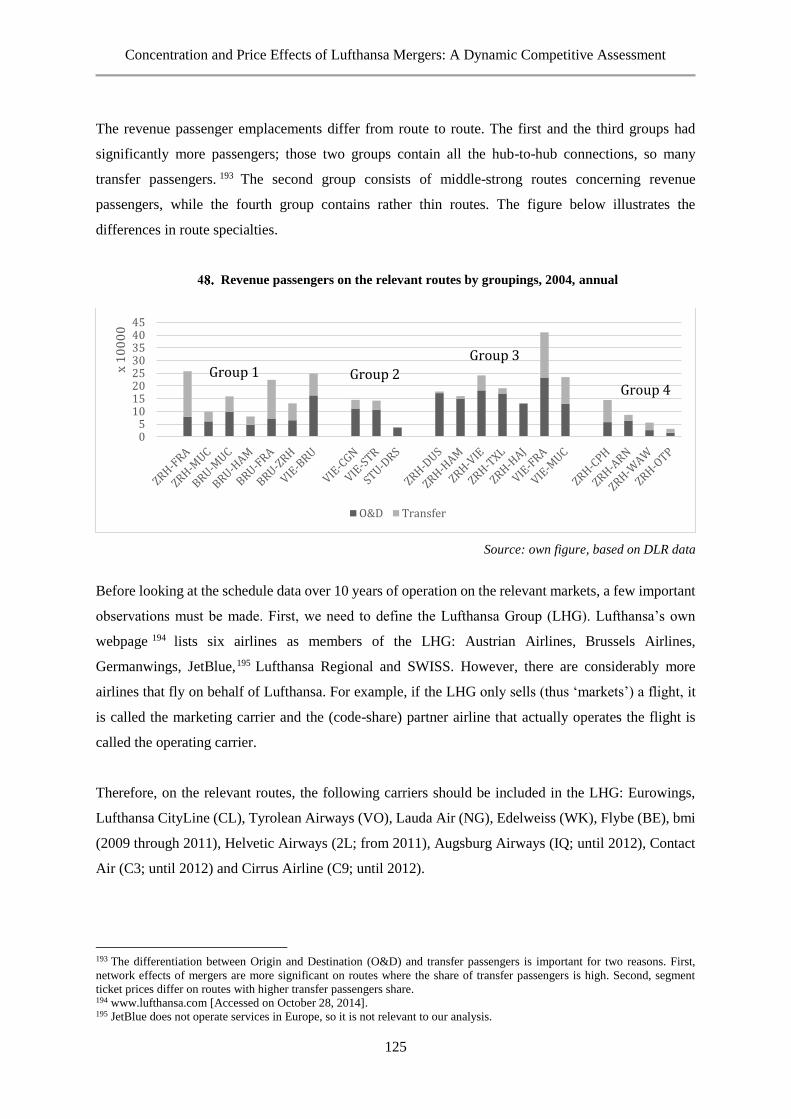
Concentration and Price Effects of Lufthansa Mergers: A Dynamic Competitive Assessment
125
The revenue passenger emplacements differ from route to route. The first and the third groups had
significantly more passengers; those two groups contain all the hub-to-hub connections, so many
transfer passengers. 193 The second group consists of middle-strong routes concerning revenue
passengers, while the fourth group contains rather thin routes. The figure below illustrates the
differences in route specialties.
Revenue passengers on the relevant routes by groupings, 2004, annual
Source: own figure, based on DLR data
Before looking at the schedule data over 10 years of operation on the relevant markets, a few important
observations must be made. First, we need to define the Lufthansa Group (LHG). Lufthansa’s own
webpage 194 lists six airlines as members of the LHG: Austrian Airlines, Brussels Airlines,
Germanwings, JetBlue,195 Lufthansa Regional and SWISS. However, there are considerably more
airlines that fly on behalf of Lufthansa. For example, if the LHG only sells (thus ‘markets’) a flight, it
is called the marketing carrier and the (code-share) partner airline that actually operates the flight is
called the operating carrier.
Therefore, on the relevant routes, the following carriers should be included in the LHG: Eurowings,
Lufthansa CityLine (CL), Tyrolean Airways (VO), Lauda Air (NG), Edelweiss (WK), Flybe (BE), bmi
(2009 through 2011), Helvetic Airways (2L; from 2011), Augsburg Airways (IQ; until 2012), Contact
Air (C3; until 2012) and Cirrus Airline (C9; until 2012).
193 The differentiation between Origin and Destination (O&D) and transfer passengers is important for two reasons. First,
network effects of mergers are more significant on routes where the share of transfer passengers is high. Second, segment
ticket prices differ on routes with higher transfer passengers share. 194 www.lufthansa.com [Accessed on October 28, 2014]. 195 JetBlue does not operate services in Europe, so it is not relevant to our analysis.
05
1015202530354045
x 1
00
00
O&D Transfer
Group 1 Group 2
Group 3
Group 4
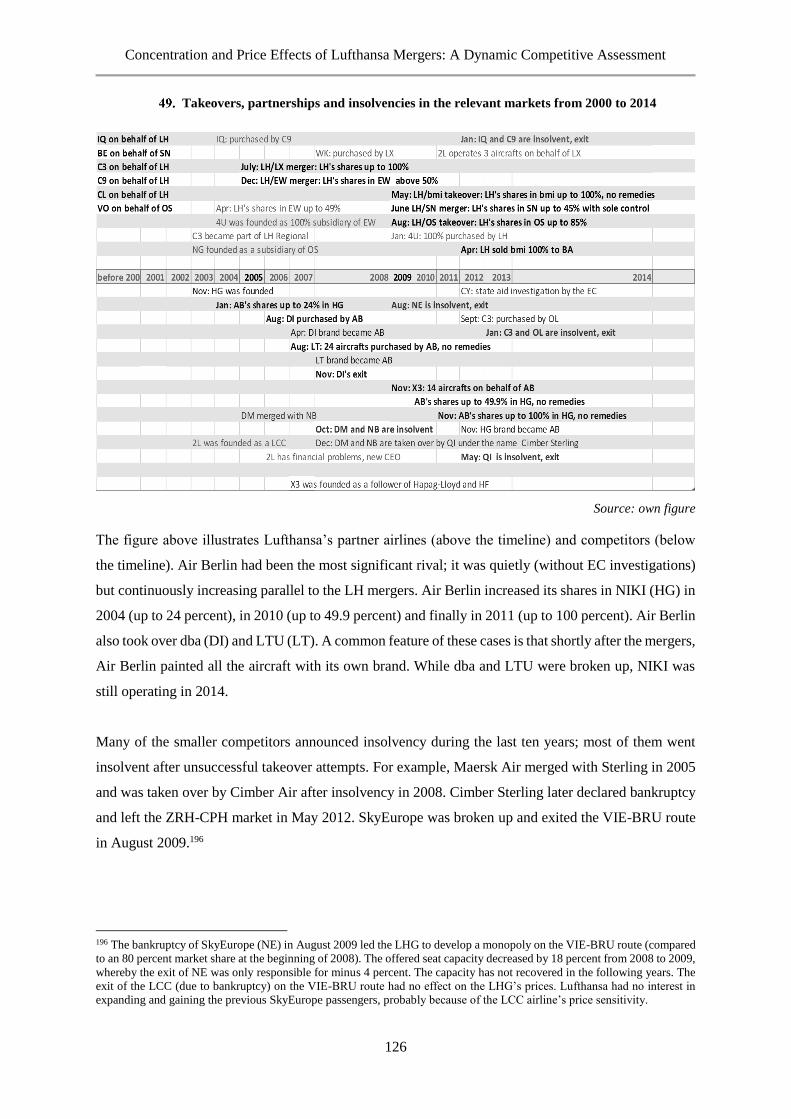
Concentration and Price Effects of Lufthansa Mergers: A Dynamic Competitive Assessment
126
Takeovers, partnerships and insolvencies in the relevant markets from 2000 to 2014
Source: own figure
The figure above illustrates Lufthansa’s partner airlines (above the timeline) and competitors (below
the timeline). Air Berlin had been the most significant rival; it was quietly (without EC investigations)
but continuously increasing parallel to the LH mergers. Air Berlin increased its shares in NIKI (HG) in
2004 (up to 24 percent), in 2010 (up to 49.9 percent) and finally in 2011 (up to 100 percent). Air Berlin
also took over dba (DI) and LTU (LT). A common feature of these cases is that shortly after the mergers,
Air Berlin painted all the aircraft with its own brand. While dba and LTU were broken up, NIKI was
still operating in 2014.
Many of the smaller competitors announced insolvency during the last ten years; most of them went
insolvent after unsuccessful takeover attempts. For example, Maersk Air merged with Sterling in 2005
and was taken over by Cimber Air after insolvency in 2008. Cimber Sterling later declared bankruptcy
and left the ZRH-CPH market in May 2012. SkyEurope was broken up and exited the VIE-BRU route
in August 2009.196
196 The bankruptcy of SkyEurope (NE) in August 2009 led the LHG to develop a monopoly on the VIE-BRU route (compared
to an 80 percent market share at the beginning of 2008). The offered seat capacity decreased by 18 percent from 2008 to 2009,
whereby the exit of NE was only responsible for minus 4 percent. The capacity has not recovered in the following years. The
exit of the LCC (due to bankruptcy) on the VIE-BRU route had no effect on the LHG’s prices. Lufthansa had no interest in
expanding and gaining the previous SkyEurope passengers, probably because of the LCC airline’s price sensitivity.
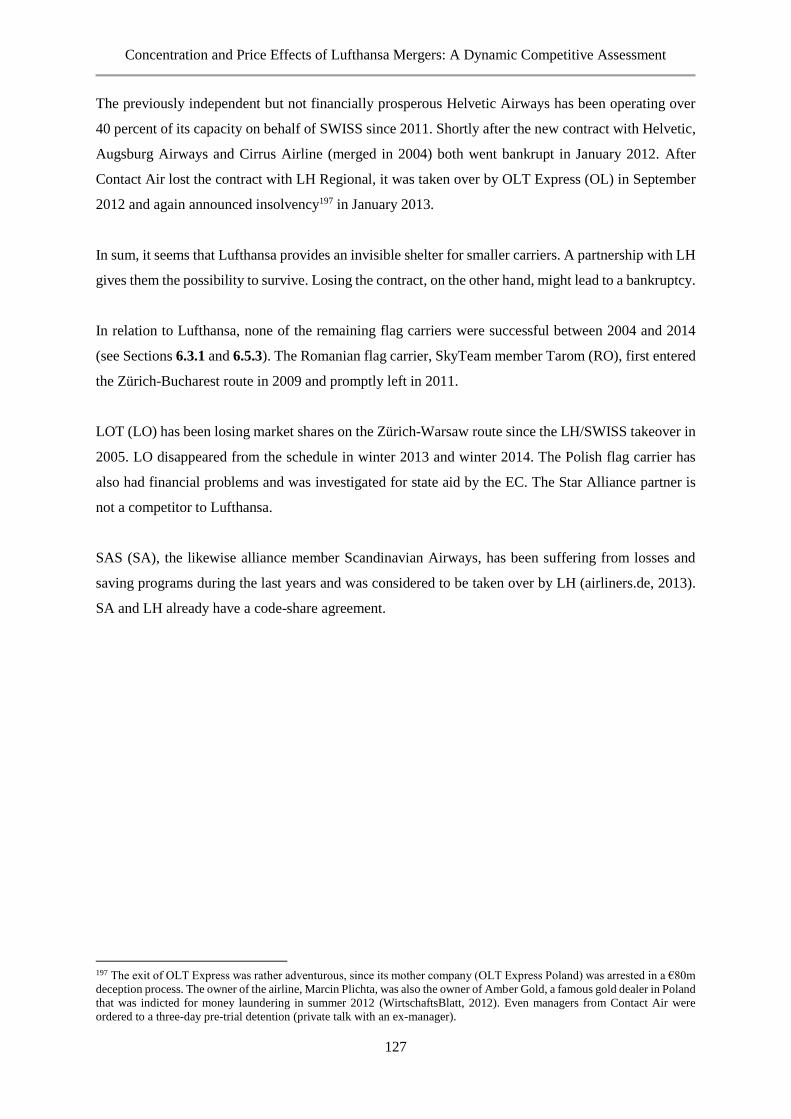
Concentration and Price Effects of Lufthansa Mergers: A Dynamic Competitive Assessment
127
The previously independent but not financially prosperous Helvetic Airways has been operating over
40 percent of its capacity on behalf of SWISS since 2011. Shortly after the new contract with Helvetic,
Augsburg Airways and Cirrus Airline (merged in 2004) both went bankrupt in January 2012. After
Contact Air lost the contract with LH Regional, it was taken over by OLT Express (OL) in September
2012 and again announced insolvency197 in January 2013.
In sum, it seems that Lufthansa provides an invisible shelter for smaller carriers. A partnership with LH
gives them the possibility to survive. Losing the contract, on the other hand, might lead to a bankruptcy.
In relation to Lufthansa, none of the remaining flag carriers were successful between 2004 and 2014
(see Sections 6.3.1 and 6.5.3). The Romanian flag carrier, SkyTeam member Tarom (RO), first entered
the Zürich-Bucharest route in 2009 and promptly left in 2011.
LOT (LO) has been losing market shares on the Zürich-Warsaw route since the LH/SWISS takeover in
2005. LO disappeared from the schedule in winter 2013 and winter 2014. The Polish flag carrier has
also had financial problems and was investigated for state aid by the EC. The Star Alliance partner is
not a competitor to Lufthansa.
SAS (SA), the likewise alliance member Scandinavian Airways, has been suffering from losses and
saving programs during the last years and was considered to be taken over by LH (airliners.de, 2013).
SA and LH already have a code-share agreement.
197 The exit of OLT Express was rather adventurous, since its mother company (OLT Express Poland) was arrested in a €80m
deception process. The owner of the airline, Marcin Plichta, was also the owner of Amber Gold, a famous gold dealer in Poland
that was indicted for money laundering in summer 2012 (WirtschaftsBlatt, 2012). Even managers from Contact Air were
ordered to a three-day pre-trial detention (private talk with an ex-manager).
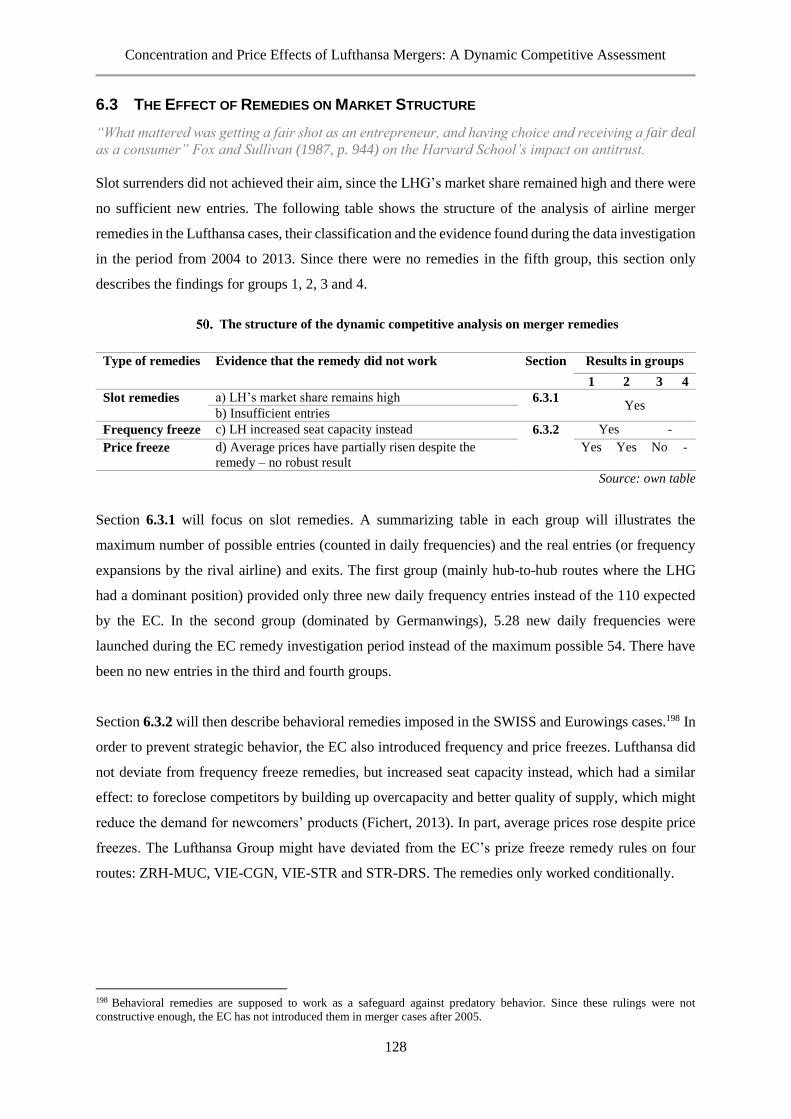
Concentration and Price Effects of Lufthansa Mergers: A Dynamic Competitive Assessment
128
6.3 THE EFFECT OF REMEDIES ON MARKET STRUCTURE
“What mattered was getting a fair shot as an entrepreneur, and having choice and receiving a fair deal
as a consumer” Fox and Sullivan (1987, p. 944) on the Harvard School’s impact on antitrust.
Slot surrenders did not achieved their aim, since the LHG’s market share remained high and there were
no sufficient new entries. The following table shows the structure of the analysis of airline merger
remedies in the Lufthansa cases, their classification and the evidence found during the data investigation
in the period from 2004 to 2013. Since there were no remedies in the fifth group, this section only
describes the findings for groups 1, 2, 3 and 4.
The structure of the dynamic competitive analysis on merger remedies
Type of remedies Evidence that the remedy did not work Section Results in groups
1 2 3 4
Slot remedies a) LH’s market share remains high 6.3.1 Yes
b) Insufficient entries
Frequency freeze c) LH increased seat capacity instead 6.3.2 Yes -
Price freeze d) Average prices have partially risen despite the
remedy – no robust result
Yes
Yes No
-
Source: own table
Section 6.3.1 will focus on slot remedies. A summarizing table in each group will illustrates the
maximum number of possible entries (counted in daily frequencies) and the real entries (or frequency
expansions by the rival airline) and exits. The first group (mainly hub-to-hub routes where the LHG
had a dominant position) provided only three new daily frequency entries instead of the 110 expected
by the EC. In the second group (dominated by Germanwings), 5.28 new daily frequencies were
launched during the EC remedy investigation period instead of the maximum possible 54. There have
been no new entries in the third and fourth groups.
Section 6.3.2 will then describe behavioral remedies imposed in the SWISS and Eurowings cases.198 In
order to prevent strategic behavior, the EC also introduced frequency and price freezes. Lufthansa did
not deviate from frequency freeze remedies, but increased seat capacity instead, which had a similar
effect: to foreclose competitors by building up overcapacity and better quality of supply, which might
reduce the demand for newcomers’ products (Fichert, 2013). In part, average prices rose despite price
freezes. The Lufthansa Group might have deviated from the EC’s prize freeze remedy rules on four
routes: ZRH-MUC, VIE-CGN, VIE-STR and STR-DRS. The remedies only worked conditionally.
198 Behavioral remedies are supposed to work as a safeguard against predatory behavior. Since these rulings were not
constructive enough, the EC has not introduced them in merger cases after 2005.
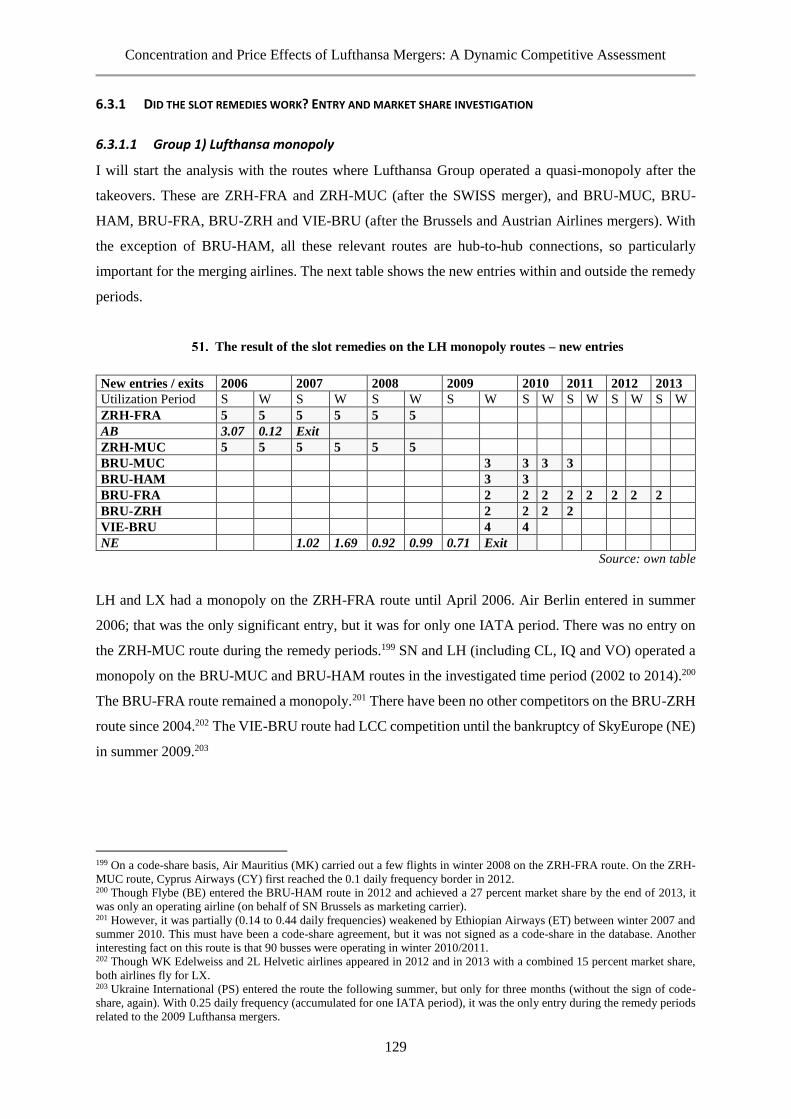
Concentration and Price Effects of Lufthansa Mergers: A Dynamic Competitive Assessment
129
6.3.1 DID THE SLOT REMEDIES WORK? ENTRY AND MARKET SHARE INVESTIGATION
6.3.1.1 Group 1) Lufthansa monopoly
I will start the analysis with the routes where Lufthansa Group operated a quasi-monopoly after the
takeovers. These are ZRH-FRA and ZRH-MUC (after the SWISS merger), and BRU-MUC, BRU-
HAM, BRU-FRA, BRU-ZRH and VIE-BRU (after the Brussels and Austrian Airlines mergers). With
the exception of BRU-HAM, all these relevant routes are hub-to-hub connections, so particularly
important for the merging airlines. The next table shows the new entries within and outside the remedy
periods.
The result of the slot remedies on the LH monopoly routes – new entries
New entries / exits 2006 2007 2008 2009 2010 2011 2012 2013
Utilization Period S W S W S W S W S W S W S W S W
ZRH-FRA 5 5 5 5 5 5
AB 3.07 0.12 Exit
ZRH-MUC 5 5 5 5 5 5
BRU-MUC 3 3 3 3
BRU-HAM 3 3
BRU-FRA 2 2 2 2 2 2 2 2
BRU-ZRH 2 2 2 2
VIE-BRU 4 4
NE 1.02 1.69 0.92 0.99 0.71 Exit
Source: own table
LH and LX had a monopoly on the ZRH-FRA route until April 2006. Air Berlin entered in summer
2006; that was the only significant entry, but it was for only one IATA period. There was no entry on
the ZRH-MUC route during the remedy periods.199 SN and LH (including CL, IQ and VO) operated a
monopoly on the BRU-MUC and BRU-HAM routes in the investigated time period (2002 to 2014).200
The BRU-FRA route remained a monopoly.201 There have been no other competitors on the BRU-ZRH
route since 2004.202 The VIE-BRU route had LCC competition until the bankruptcy of SkyEurope (NE)
in summer 2009.203
199 On a code-share basis, Air Mauritius (MK) carried out a few flights in winter 2008 on the ZRH-FRA route. On the ZRH-
MUC route, Cyprus Airways (CY) first reached the 0.1 daily frequency border in 2012. 200 Though Flybe (BE) entered the BRU-HAM route in 2012 and achieved a 27 percent market share by the end of 2013, it
was only an operating airline (on behalf of SN Brussels as marketing carrier). 201 However, it was partially (0.14 to 0.44 daily frequencies) weakened by Ethiopian Airways (ET) between winter 2007 and
summer 2010. This must have been a code-share agreement, but it was not signed as a code-share in the database. Another
interesting fact on this route is that 90 busses were operating in winter 2010/2011. 202 Though WK Edelweiss and 2L Helvetic airlines appeared in 2012 and in 2013 with a combined 15 percent market share,
both airlines fly for LX. 203 Ukraine International (PS) entered the route the following summer, but only for three months (without the sign of code-
share, again). With 0.25 daily frequency (accumulated for one IATA period), it was the only entry during the remedy periods
related to the 2009 Lufthansa mergers.
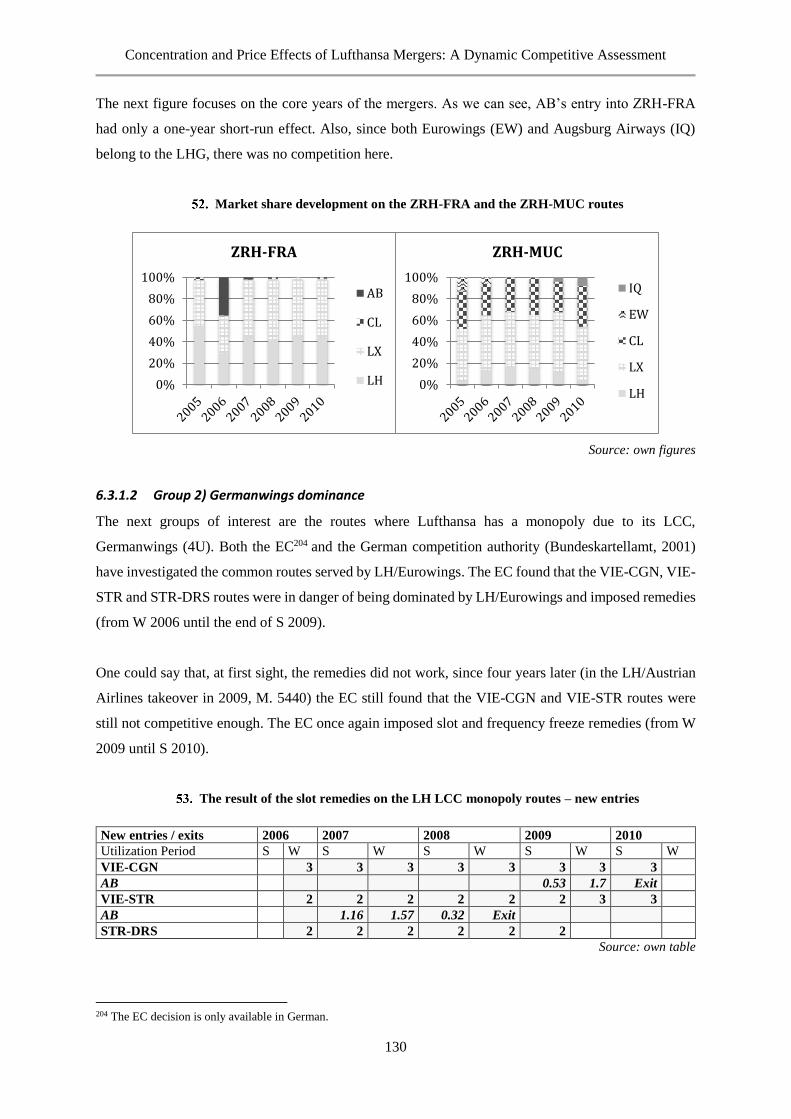
Concentration and Price Effects of Lufthansa Mergers: A Dynamic Competitive Assessment
130
The next figure focuses on the core years of the mergers. As we can see, AB’s entry into ZRH-FRA
had only a one-year short-run effect. Also, since both Eurowings (EW) and Augsburg Airways (IQ)
belong to the LHG, there was no competition here.
Market share development on the ZRH-FRA and the ZRH-MUC routes
Source: own figures
6.3.1.2 Group 2) Germanwings dominance
The next groups of interest are the routes where Lufthansa has a monopoly due to its LCC,
Germanwings (4U). Both the EC204 and the German competition authority (Bundeskartellamt, 2001)
have investigated the common routes served by LH/Eurowings. The EC found that the VIE-CGN, VIE-
STR and STR-DRS routes were in danger of being dominated by LH/Eurowings and imposed remedies
(from W 2006 until the end of S 2009).
One could say that, at first sight, the remedies did not work, since four years later (in the LH/Austrian
Airlines takeover in 2009, M. 5440) the EC still found that the VIE-CGN and VIE-STR routes were
still not competitive enough. The EC once again imposed slot and frequency freeze remedies (from W
2009 until S 2010).
The result of the slot remedies on the LH LCC monopoly routes – new entries
New entries / exits 2006 2007 2008 2009 2010
Utilization Period S W S W S W S W S W
VIE-CGN 3 3 3 3 3 3 3 3
AB 0.53 1.7 Exit
VIE-STR 2 2 2 2 2 2 3 3
AB 1.16 1.57 0.32 Exit
STR-DRS 2 2 2 2 2 2
Source: own table
204 The EC decision is only available in German.
0%
20%
40%
60%
80%
100%
ZRH-FRA
AB
CL
LX
LH 0%
20%
40%
60%
80%
100%
ZRH-MUC
IQ
EW
CL
LX
LH
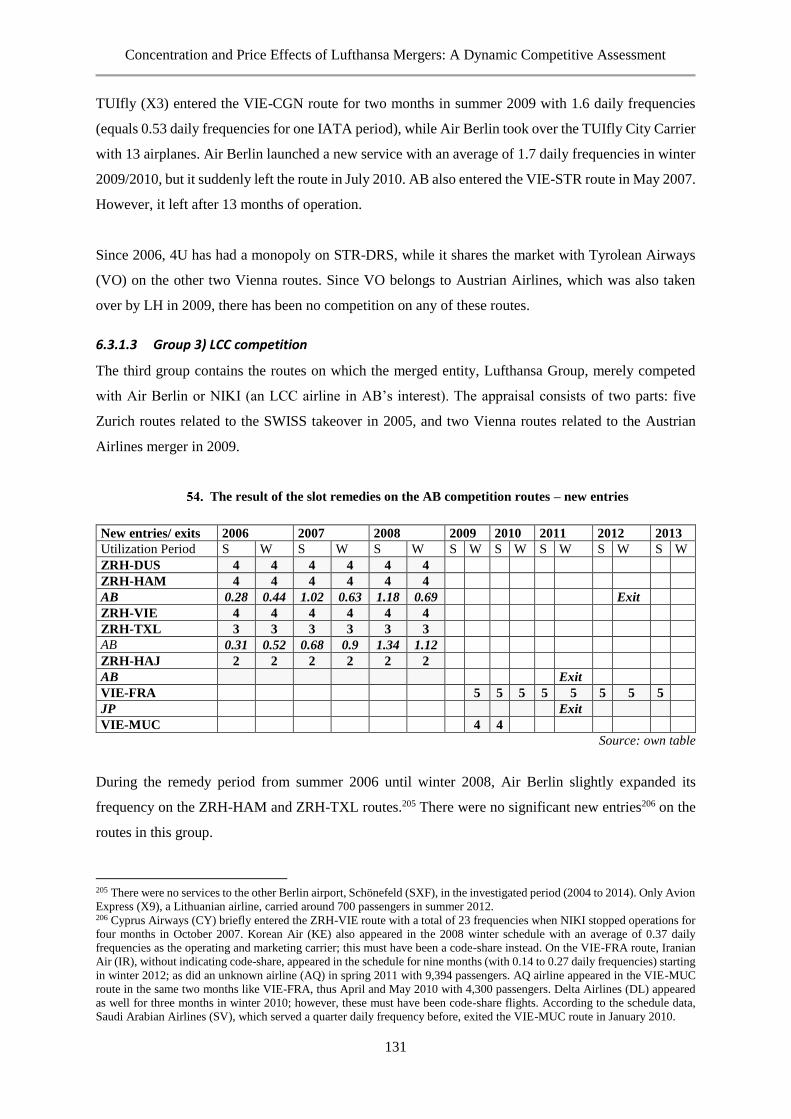
Concentration and Price Effects of Lufthansa Mergers: A Dynamic Competitive Assessment
131
TUIfly (X3) entered the VIE-CGN route for two months in summer 2009 with 1.6 daily frequencies
(equals 0.53 daily frequencies for one IATA period), while Air Berlin took over the TUIfly City Carrier
with 13 airplanes. Air Berlin launched a new service with an average of 1.7 daily frequencies in winter
2009/2010, but it suddenly left the route in July 2010. AB also entered the VIE-STR route in May 2007.
However, it left after 13 months of operation.
Since 2006, 4U has had a monopoly on STR-DRS, while it shares the market with Tyrolean Airways
(VO) on the other two Vienna routes. Since VO belongs to Austrian Airlines, which was also taken
over by LH in 2009, there has been no competition on any of these routes.
6.3.1.3 Group 3) LCC competition
The third group contains the routes on which the merged entity, Lufthansa Group, merely competed
with Air Berlin or NIKI (an LCC airline in AB’s interest). The appraisal consists of two parts: five
Zurich routes related to the SWISS takeover in 2005, and two Vienna routes related to the Austrian
Airlines merger in 2009.
The result of the slot remedies on the AB competition routes – new entries
New entries/ exits 2006 2007 2008 2009 2010 2011 2012 2013
Utilization Period S W S W S W S W S W S W S W S W
ZRH-DUS 4 4 4 4 4 4
ZRH-HAM 4 4 4 4 4 4
AB 0.28 0.44 1.02 0.63 1.18 0.69 Exit
ZRH-VIE 4 4 4 4 4 4
ZRH-TXL 3 3 3 3 3 3
AB 0.31 0.52 0.68 0.9 1.34 1.12
ZRH-HAJ 2 2 2 2 2 2
AB Exit
VIE-FRA 5 5 5 5 5 5 5 5
JP Exit
VIE-MUC 4 4
Source: own table
During the remedy period from summer 2006 until winter 2008, Air Berlin slightly expanded its
frequency on the ZRH-HAM and ZRH-TXL routes.205 There were no significant new entries206 on the
routes in this group.
205 There were no services to the other Berlin airport, Schönefeld (SXF), in the investigated period (2004 to 2014). Only Avion
Express (X9), a Lithuanian airline, carried around 700 passengers in summer 2012. 206 Cyprus Airways (CY) briefly entered the ZRH-VIE route with a total of 23 frequencies when NIKI stopped operations for
four months in October 2007. Korean Air (KE) also appeared in the 2008 winter schedule with an average of 0.37 daily
frequencies as the operating and marketing carrier; this must have been a code-share instead. On the VIE-FRA route, Iranian
Air (IR), without indicating code-share, appeared in the schedule for nine months (with 0.14 to 0.27 daily frequencies) starting
in winter 2012; as did an unknown airline (AQ) in spring 2011 with 9,394 passengers. AQ airline appeared in the VIE-MUC
route in the same two months like VIE-FRA, thus April and May 2010 with 4,300 passengers. Delta Airlines (DL) appeared
as well for three months in winter 2010; however, these must have been code-share flights. According to the schedule data,
Saudi Arabian Airlines (SV), which served a quarter daily frequency before, exited the VIE-MUC route in January 2010.
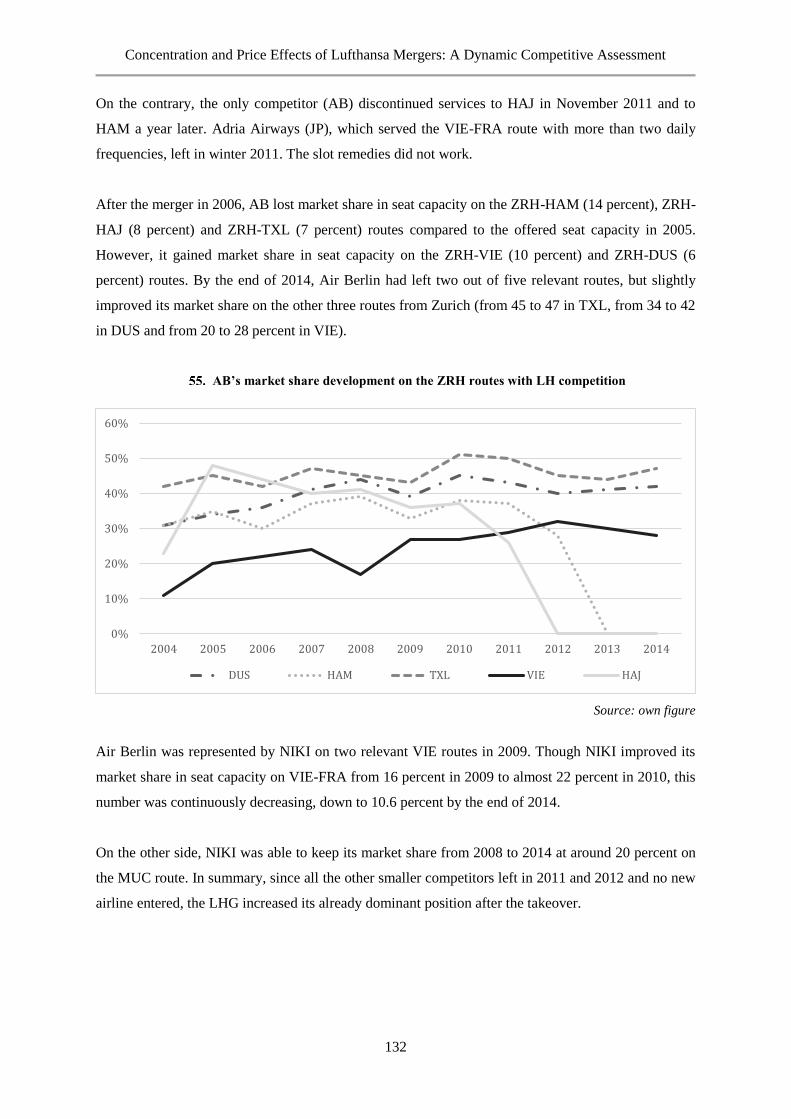
Concentration and Price Effects of Lufthansa Mergers: A Dynamic Competitive Assessment
132
On the contrary, the only competitor (AB) discontinued services to HAJ in November 2011 and to
HAM a year later. Adria Airways (JP), which served the VIE-FRA route with more than two daily
frequencies, left in winter 2011. The slot remedies did not work.
After the merger in 2006, AB lost market share in seat capacity on the ZRH-HAM (14 percent), ZRH-
HAJ (8 percent) and ZRH-TXL (7 percent) routes compared to the offered seat capacity in 2005.
However, it gained market share in seat capacity on the ZRH-VIE (10 percent) and ZRH-DUS (6
percent) routes. By the end of 2014, Air Berlin had left two out of five relevant routes, but slightly
improved its market share on the other three routes from Zurich (from 45 to 47 in TXL, from 34 to 42
in DUS and from 20 to 28 percent in VIE).
AB’s market share development on the ZRH routes with LH competition
Source: own figure
Air Berlin was represented by NIKI on two relevant VIE routes in 2009. Though NIKI improved its
market share in seat capacity on VIE-FRA from 16 percent in 2009 to almost 22 percent in 2010, this
number was continuously decreasing, down to 10.6 percent by the end of 2014.
On the other side, NIKI was able to keep its market share from 2008 to 2014 at around 20 percent on
the MUC route. In summary, since all the other smaller competitors left in 2011 and 2012 and no new
airline entered, the LHG increased its already dominant position after the takeover.
0%
10%
20%
30%
40%
50%
60%
2004 2005 2006 2007 2008 2009 2010 2011 2012 2013 2014
DUS HAM TXL VIE HAJ
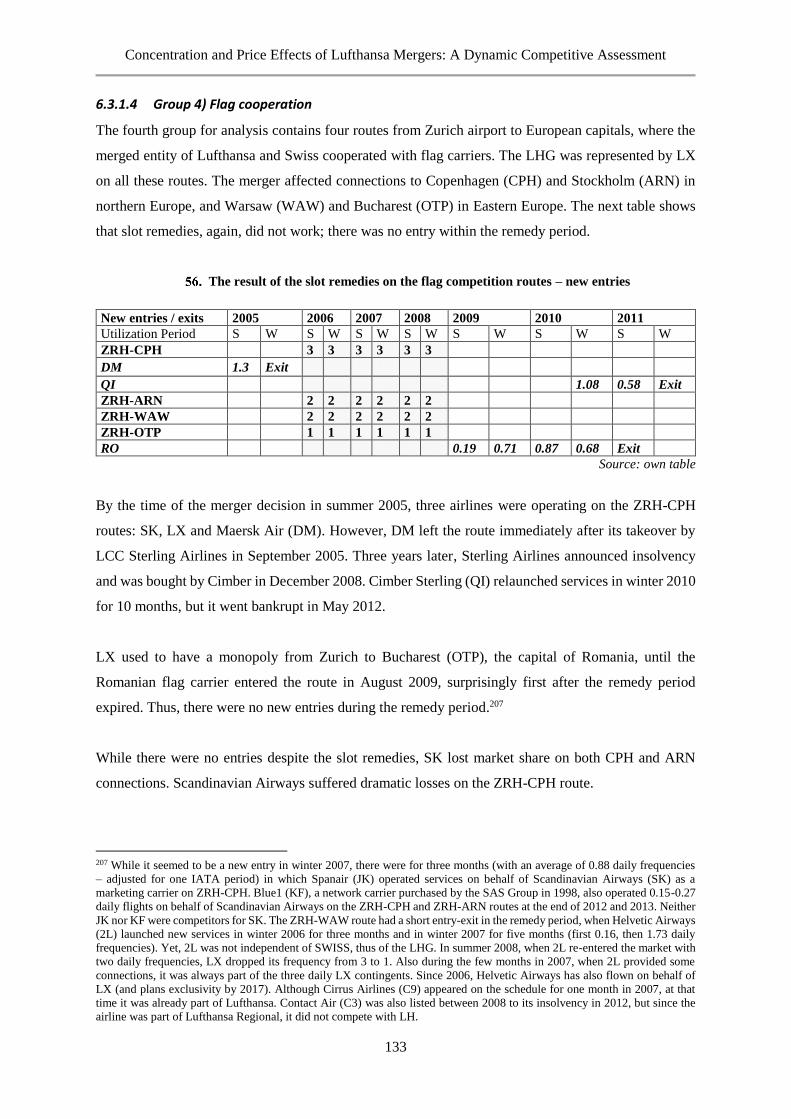
Concentration and Price Effects of Lufthansa Mergers: A Dynamic Competitive Assessment
133
6.3.1.4 Group 4) Flag cooperation
The fourth group for analysis contains four routes from Zurich airport to European capitals, where the
merged entity of Lufthansa and Swiss cooperated with flag carriers. The LHG was represented by LX
on all these routes. The merger affected connections to Copenhagen (CPH) and Stockholm (ARN) in
northern Europe, and Warsaw (WAW) and Bucharest (OTP) in Eastern Europe. The next table shows
that slot remedies, again, did not work; there was no entry within the remedy period.
The result of the slot remedies on the flag competition routes – new entries
New entries / exits 2005 2006 2007 2008 2009 2010 2011
Utilization Period S W S W S W S W S W S W S W
ZRH-CPH 3 3 3 3 3 3
DM 1.3 Exit
QI 1.08 0.58 Exit
ZRH-ARN 2 2 2 2 2 2
ZRH-WAW 2 2 2 2 2 2
ZRH-OTP 1 1 1 1 1 1
RO 0.19 0.71 0.87 0.68 Exit
Source: own table
By the time of the merger decision in summer 2005, three airlines were operating on the ZRH-CPH
routes: SK, LX and Maersk Air (DM). However, DM left the route immediately after its takeover by
LCC Sterling Airlines in September 2005. Three years later, Sterling Airlines announced insolvency
and was bought by Cimber in December 2008. Cimber Sterling (QI) relaunched services in winter 2010
for 10 months, but it went bankrupt in May 2012.
LX used to have a monopoly from Zurich to Bucharest (OTP), the capital of Romania, until the
Romanian flag carrier entered the route in August 2009, surprisingly first after the remedy period
expired. Thus, there were no new entries during the remedy period.207
While there were no entries despite the slot remedies, SK lost market share on both CPH and ARN
connections. Scandinavian Airways suffered dramatic losses on the ZRH-CPH route.
207 While it seemed to be a new entry in winter 2007, there were for three months (with an average of 0.88 daily frequencies
– adjusted for one IATA period) in which Spanair (JK) operated services on behalf of Scandinavian Airways (SK) as a
marketing carrier on ZRH-CPH. Blue1 (KF), a network carrier purchased by the SAS Group in 1998, also operated 0.15-0.27
daily flights on behalf of Scandinavian Airways on the ZRH-CPH and ZRH-ARN routes at the end of 2012 and 2013. Neither
JK nor KF were competitors for SK. The ZRH-WAW route had a short entry-exit in the remedy period, when Helvetic Airways
(2L) launched new services in winter 2006 for three months and in winter 2007 for five months (first 0.16, then 1.73 daily
frequencies). Yet, 2L was not independent of SWISS, thus of the LHG. In summer 2008, when 2L re-entered the market with
two daily frequencies, LX dropped its frequency from 3 to 1. Also during the few months in 2007, when 2L provided some
connections, it was always part of the three daily LX contingents. Since 2006, Helvetic Airways has also flown on behalf of
LX (and plans exclusivity by 2017). Although Cirrus Airlines (C9) appeared on the schedule for one month in 2007, at that
time it was already part of Lufthansa. Contact Air (C3) was also listed between 2008 to its insolvency in 2012, but since the
airline was part of Lufthansa Regional, it did not compete with LH.
Concentration and Price Effects of Lufthansa Mergers: A Dynamic Competitive Assessment
134
While SK had more than a 75 percent market share in total seat capacity on the ZRH-CPH route in
2004, the year before the Lufthansa/SWISS merger, it dropped down to 50 percent by 2006, the year
after the LHG takeover. The trend continued: since 2012, SK has only held a 30 percent market share.
On the other side on the ZRH-ARN route, SK was able to keep its market share of about 35 percent
until 2011, but it has shrunk by 5 percent since 2012.
LOT Polish Airlines (LO) also lost market share after the SWISS takeover on the ZRH-WAW route.
LO suddenly lost 15 percent and its market share in seat capacity dropped down to 25 percent by
summer 2006 and could not recover until 2014. The Romanian state-owned carrier had less success on
ZRH-OTP. During its two-year operation (2009 to 2011), Tarom (RO) achieved an average market
share of 43.5 percent. After the flag carrier left, LX outsourced the connection to Helvetic Airways (2L)
in summer 2012 for three IATA periods. It began operating as a monopoly again.
6.3.2 DID THE FREQUENCY AND PRICE FREEZE REMEDIES WORK?
The EC introduced frequency freeze remedies in five cases: ZRH-FRA, ZRH-MUC, VIE-CGN, VIE-
STR and STR-DRS. Thus, the merged entity was not allowed to add any more frequencies when a new
competitor entered the route (up to three years).
Since there were only three entries apart from Air Berlin and its subsidiary NIKI, I looked at the
Lufthansa Group’s frequency development on three relevant markets: in 2006 on the ZRH-FRA route,
in 2007 on the VIE-STR route and in 2009 on the VIE-CGN route. Frequency freeze remedies aim to
prevent building up overcapacity at the incumbent airline. There was no deviation from the frequency
freeze remedy on any of these connections, but Lufthansa’s sudden strategic capacity increases (instead
of forbidden frequency increases) were probably predatory in nature (see Section 6.4.2 on ZRH-FRA
and Section 6.4.3 on VIE-CGN).
After the merger with Eurowings, LH closed its two daily frequencies on the STR-DRS route.
Germanwings remained a monopoly with the remaining two frequencies, which were continuously
reduced during the current investigation period until the end of 2012. Therefore, imposing a frequency
freeze remedy on the LHG’s five daily connections if there were a new entry seems to be very
unrealistic.
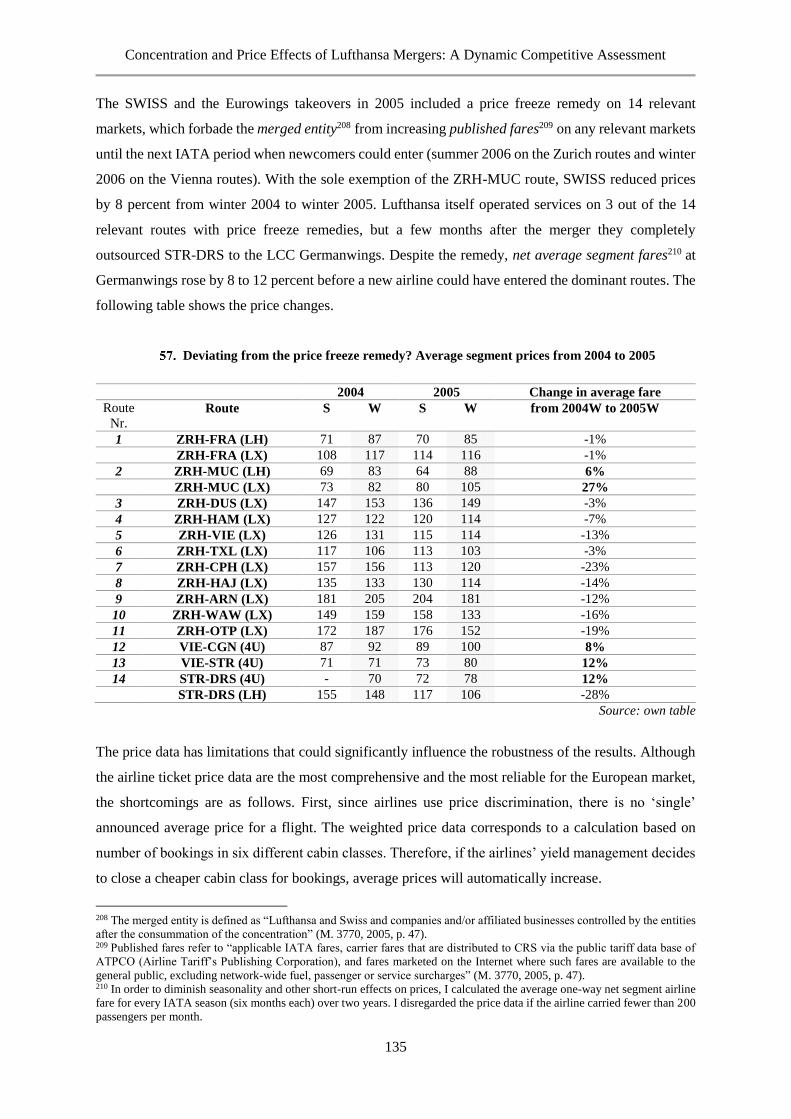
Concentration and Price Effects of Lufthansa Mergers: A Dynamic Competitive Assessment
135
The SWISS and the Eurowings takeovers in 2005 included a price freeze remedy on 14 relevant
markets, which forbade the merged entity208 from increasing published fares209 on any relevant markets
until the next IATA period when newcomers could enter (summer 2006 on the Zurich routes and winter
2006 on the Vienna routes). With the sole exemption of the ZRH-MUC route, SWISS reduced prices
by 8 percent from winter 2004 to winter 2005. Lufthansa itself operated services on 3 out of the 14
relevant routes with price freeze remedies, but a few months after the merger they completely
outsourced STR-DRS to the LCC Germanwings. Despite the remedy, net average segment fares210 at
Germanwings rose by 8 to 12 percent before a new airline could have entered the dominant routes. The
following table shows the price changes.
Deviating from the price freeze remedy? Average segment prices from 2004 to 2005
2004 2005 Change in average fare
Route
Nr. Route S W S W from 2004W to 2005W
1 ZRH-FRA (LH) 71 87 70 85 -1%
ZRH-FRA (LX) 108 117 114 116 -1%
2 ZRH-MUC (LH) 69 83 64 88 6%
ZRH-MUC (LX) 73 82 80 105 27%
3 ZRH-DUS (LX) 147 153 136 149 -3%
4 ZRH-HAM (LX) 127 122 120 114 -7%
5 ZRH-VIE (LX) 126 131 115 114 -13%
6 ZRH-TXL (LX) 117 106 113 103 -3%
7 ZRH-CPH (LX) 157 156 113 120 -23%
8 ZRH-HAJ (LX) 135 133 130 114 -14%
9 ZRH-ARN (LX) 181 205 204 181 -12%
10 ZRH-WAW (LX) 149 159 158 133 -16%
11 ZRH-OTP (LX) 172 187 176 152 -19%
12 VIE-CGN (4U) 87 92 89 100 8%
13 VIE-STR (4U) 71 71 73 80 12%
14 STR-DRS (4U) - 70 72 78 12%
STR-DRS (LH) 155 148 117 106 -28%
Source: own table
The price data has limitations that could significantly influence the robustness of the results. Although
the airline ticket price data are the most comprehensive and the most reliable for the European market,
the shortcomings are as follows. First, since airlines use price discrimination, there is no ‘single’
announced average price for a flight. The weighted price data corresponds to a calculation based on
number of bookings in six different cabin classes. Therefore, if the airlines’ yield management decides
to close a cheaper cabin class for bookings, average prices will automatically increase.
208 The merged entity is defined as “Lufthansa and Swiss and companies and/or affiliated businesses controlled by the entities
after the consummation of the concentration” (M. 3770, 2005, p. 47). 209 Published fares refer to “applicable IATA fares, carrier fares that are distributed to CRS via the public tariff data base of
ATPCO (Airline Tariff’s Publishing Corporation), and fares marketed on the Internet where such fares are available to the
general public, excluding network-wide fuel, passenger or service surcharges” (M. 3770, 2005, p. 47). 210 In order to diminish seasonality and other short-run effects on prices, I calculated the average one-way net segment airline
fare for every IATA season (six months each) over two years. I disregarded the price data if the airline carried fewer than 200
passengers per month.
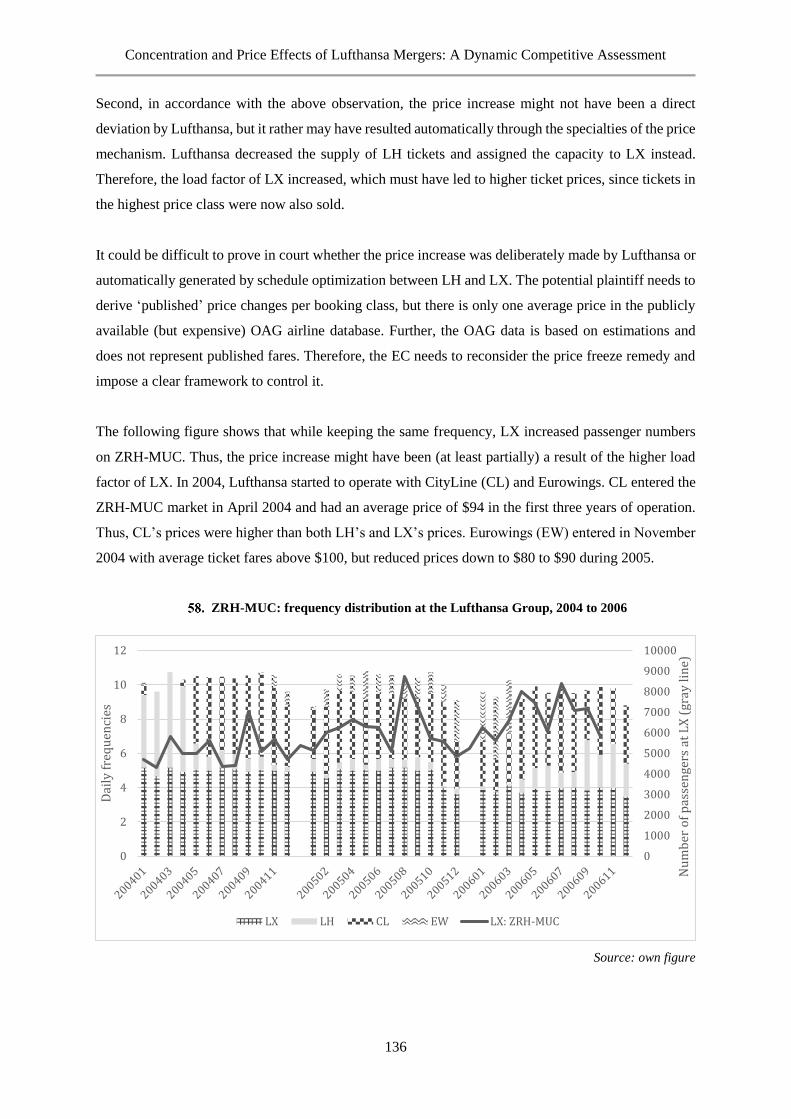
Concentration and Price Effects of Lufthansa Mergers: A Dynamic Competitive Assessment
136
Second, in accordance with the above observation, the price increase might not have been a direct
deviation by Lufthansa, but it rather may have resulted automatically through the specialties of the price
mechanism. Lufthansa decreased the supply of LH tickets and assigned the capacity to LX instead.
Therefore, the load factor of LX increased, which must have led to higher ticket prices, since tickets in
the highest price class were now also sold.
It could be difficult to prove in court whether the price increase was deliberately made by Lufthansa or
automatically generated by schedule optimization between LH and LX. The potential plaintiff needs to
derive ‘published’ price changes per booking class, but there is only one average price in the publicly
available (but expensive) OAG airline database. Further, the OAG data is based on estimations and
does not represent published fares. Therefore, the EC needs to reconsider the price freeze remedy and
impose a clear framework to control it.
The following figure shows that while keeping the same frequency, LX increased passenger numbers
on ZRH-MUC. Thus, the price increase might have been (at least partially) a result of the higher load
factor of LX. In 2004, Lufthansa started to operate with CityLine (CL) and Eurowings. CL entered the
ZRH-MUC market in April 2004 and had an average price of $94 in the first three years of operation.
Thus, CL’s prices were higher than both LH’s and LX’s prices. Eurowings (EW) entered in November
2004 with average ticket fares above $100, but reduced prices down to $80 to $90 during 2005.
ZRH-MUC: frequency distribution at the Lufthansa Group, 2004 to 2006
Source: own figure
0
1000
2000
3000
4000
5000
6000
7000
8000
9000
10000
0
2
4
6
8
10
12
Nu
mb
er o
f p
asse
nge
rs a
t L
X (
gray
lin
e)
Dai
ly f
req
uen
cies
LX LH CL EW LX: ZRH-MUC
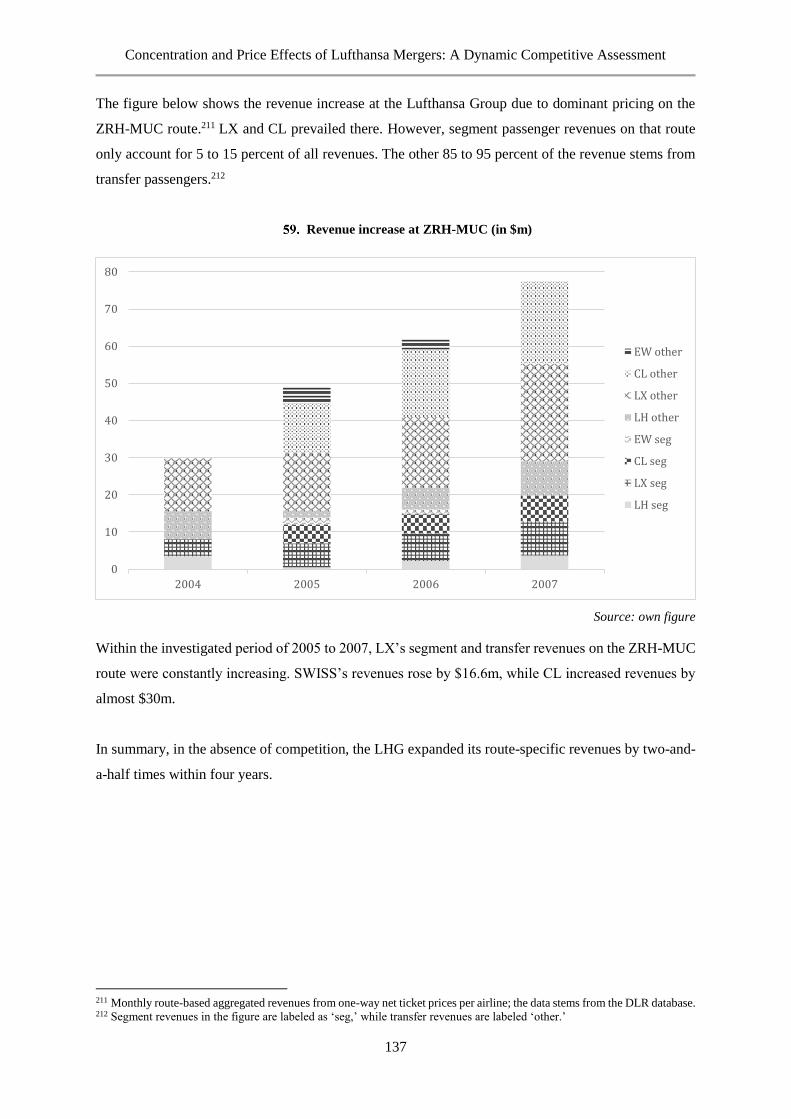
Concentration and Price Effects of Lufthansa Mergers: A Dynamic Competitive Assessment
137
The figure below shows the revenue increase at the Lufthansa Group due to dominant pricing on the
ZRH-MUC route.211 LX and CL prevailed there. However, segment passenger revenues on that route
only account for 5 to 15 percent of all revenues. The other 85 to 95 percent of the revenue stems from
transfer passengers.212
Revenue increase at ZRH-MUC (in $m)
Source: own figure
Within the investigated period of 2005 to 2007, LX’s segment and transfer revenues on the ZRH-MUC
route were constantly increasing. SWISS’s revenues rose by $16.6m, while CL increased revenues by
almost $30m.
In summary, in the absence of competition, the LHG expanded its route-specific revenues by two-and-
a-half times within four years.
211 Monthly route-based aggregated revenues from one-way net ticket prices per airline; the data stems from the DLR database. 212 Segment revenues in the figure are labeled as ‘seg,’ while transfer revenues are labeled ‘other.’
0
10
20
30
40
50
60
70
80
2004 2005 2006 2007
EW other
CL other
LX other
LH other
EW seg
CL seg
LX seg
LH seg
Concentration and Price Effects of Lufthansa Mergers: A Dynamic Competitive Assessment
138
6.3.3 SUMMARY OF THE RESULTS ON REMEDIES
Section 6.3 described how the remedies imposed on market structure, conduct and performance had
limited effects. Remedies aimed to improve competition on the routes negatively affected by the merger,
but the analysis showed that the remedies did not work. New entries (or frequency expansions by rivals)
were rather short run and considerably rarer than expected by the EC. The deficiency of new entries is
not anticompetitive apart from the Lufthansa Group, but needs further explanation. In the later merger
cases (from 2008 forward), the EC explicitly asked Lufthansa’s competitors whether they were
interested in entering particular relevant markets. Thus, potential newcomers were already listed in the
merger decisions, even those who only had two aircraft and 25 employees (Fichert, 2013). This could
have led to a general overestimation of new entries.
Table 60 summarizes the results of Section 6.3. The first column shows the groupings, while the second
column indicates the relevant route. I compared data from the year before the merger with data from
the last year of the remedy period. The third column counts the slot remedies (in the form of daily
frequencies) times the IATA periods (6 months) for which they were in force. The fourth column, called
entry/exit, illustrates the new entries (bold), extensions and exits (in brackets) for the slot remedy
periods. Altogether, there was one entry for three periods (VIE-STR); three entries for one period (ZRH-
FRA and VIE-CGN twice); two frequency extensions for five to six periods (ZRH-HAM and ZRH-
TXL); two exits (VIE-BRU and VIE-FRA) and one periodic route leaving (ZRH-VIE). There were 15.3
new frequencies instead of the maximum possible 350 during the slot remedy periods. The utilization
rate of the slot remedies is 15.3 to 350, thus 4.37 percent.
Compared to the year before the merger (fifth column), LHG increased its presence (weighted by market
share in passenger volume after the slot remedy period expired; sixth column). Lufthansa Group won
market share (seventh column) on most of the connections and it still has nearly a 100 percent market
share on all relevant routes from Brussels.213 In sum, while the LHG’s average market share was 69.9
percent before the merger, it increased to 76.1 percent afterward. Twelve of 21 routes remained highly
concentrated, with LH and its partners holding more than a 70 percent market share.
Ticket price increase became obvious despite regulation, which questions the use and the control of
merger remedies. I found evidence that the LHG probably deviated from the EC’s price freeze remedies
on four relevant routes (ZRH-MUC, VIE-CGN, VIE-STR and STR-DRS), though, because of the
limited price data, the results are not robust.
213 The data on BRU-FRA listed very high passenger numbers for Ethiopian Airways (ET) for five months, which resulted in
a 12.6 percent market share. Since ET is an African carrier, it must have been a code-share agreement with one of the Star
Alliance partners (LH or SN). Therefore, I added their market share to that of the LHG.
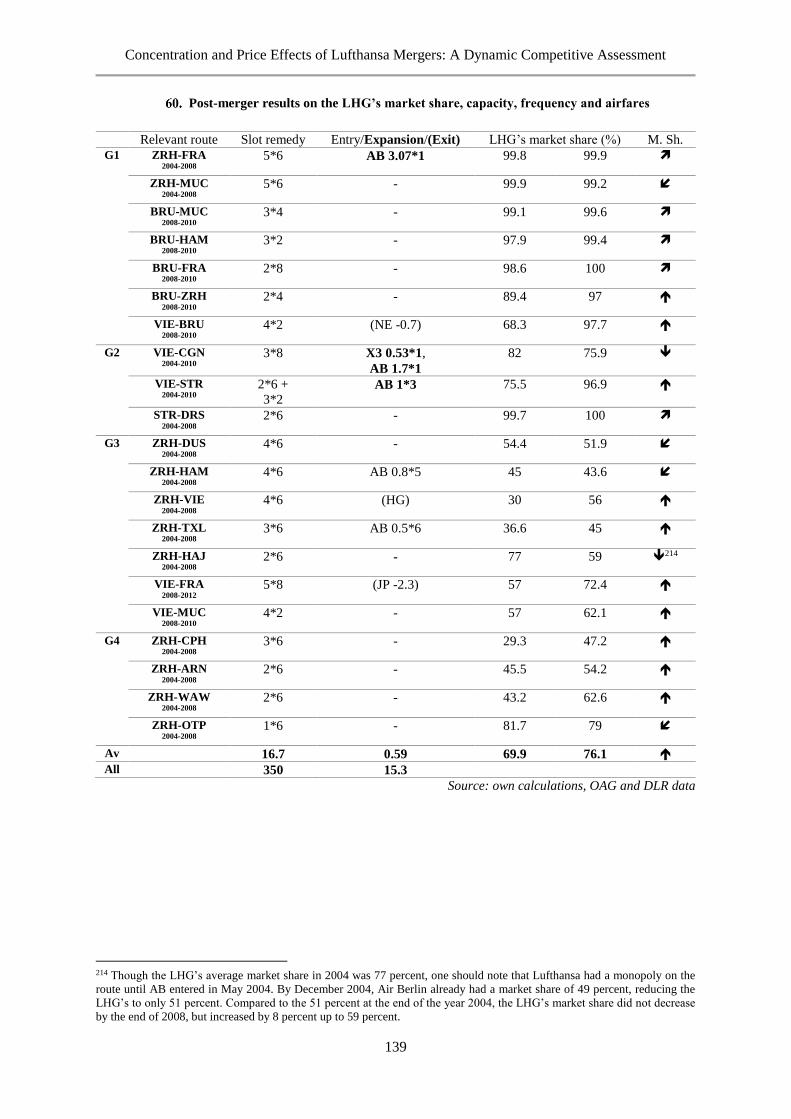
Concentration and Price Effects of Lufthansa Mergers: A Dynamic Competitive Assessment
139
Post-merger results on the LHG’s market share, capacity, frequency and airfares
Relevant route Slot remedy Entry/Expansion/(Exit) LHG’s market share (%) M. Sh.
G1 ZRH-FRA 2004-2008
5*6 AB 3.07*1 99.8 99.9
ZRH-MUC 2004-2008
5*6 - 99.9 99.2
BRU-MUC 2008-2010
3*4 - 99.1 99.6
BRU-HAM 2008-2010
3*2 - 97.9 99.4
BRU-FRA 2008-2010
2*8 - 98.6 100
BRU-ZRH 2008-2010
2*4 - 89.4 97
VIE-BRU 2008-2010
4*2 (NE -0.7) 68.3 97.7
G2 VIE-CGN 2004-2010
3*8 X3 0.53*1,
AB 1.7*1
82 75.9
VIE-STR 2004-2010
2*6 +
3*2
AB 1*3 75.5 96.9
STR-DRS 2004-2008
2*6 - 99.7 100
G3 ZRH-DUS 2004-2008
4*6 - 54.4 51.9
ZRH-HAM 2004-2008
4*6 AB 0.8*5 45 43.6
ZRH-VIE 2004-2008
4*6 (HG) 30 56
ZRH-TXL 2004-2008
3*6 AB 0.5*6 36.6 45
ZRH-HAJ 2004-2008
2*6 - 77 59 214
VIE-FRA 2008-2012
5*8 (JP -2.3) 57 72.4
VIE-MUC 2008-2010
4*2 - 57 62.1
G4 ZRH-CPH 2004-2008
3*6 - 29.3 47.2
ZRH-ARN 2004-2008
2*6 - 45.5 54.2
ZRH-WAW 2004-2008
2*6 - 43.2 62.6
ZRH-OTP 2004-2008
1*6 - 81.7 79
Av 16.7 0.59 69.9 76.1
All 350 15.3
Source: own calculations, OAG and DLR data
214 Though the LHG’s average market share in 2004 was 77 percent, one should note that Lufthansa had a monopoly on the
route until AB entered in May 2004. By December 2004, Air Berlin already had a market share of 49 percent, reducing the
LHG’s to only 51 percent. Compared to the 51 percent at the end of the year 2004, the LHG’s market share did not decrease
by the end of 2008, but increased by 8 percent up to 59 percent.
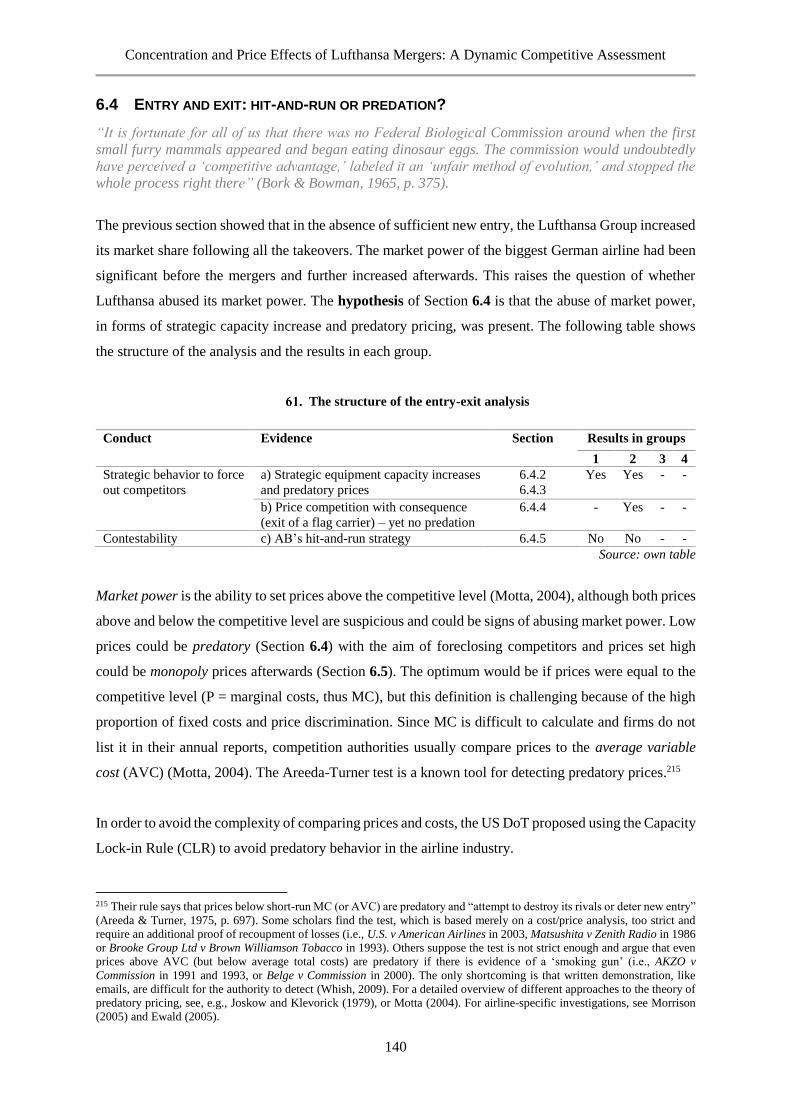
Concentration and Price Effects of Lufthansa Mergers: A Dynamic Competitive Assessment
140
6.4 ENTRY AND EXIT: HIT-AND-RUN OR PREDATION?
“It is fortunate for all of us that there was no Federal Biological Commission around when the first
small furry mammals appeared and began eating dinosaur eggs. The commission would undoubtedly
have perceived a ‘competitive advantage,’ labeled it an ‘unfair method of evolution,’ and stopped the
whole process right there” (Bork & Bowman, 1965, p. 375).
The previous section showed that in the absence of sufficient new entry, the Lufthansa Group increased
its market share following all the takeovers. The market power of the biggest German airline had been
significant before the mergers and further increased afterwards. This raises the question of whether
Lufthansa abused its market power. The hypothesis of Section 6.4 is that the abuse of market power,
in forms of strategic capacity increase and predatory pricing, was present. The following table shows
the structure of the analysis and the results in each group.
The structure of the entry-exit analysis
Conduct Evidence Section Results in groups
1 2 3 4
Strategic behavior to force
out competitors
a) Strategic equipment capacity increases
and predatory prices
6.4.2
6.4.3
Yes Yes - -
b) Price competition with consequence
(exit of a flag carrier) – yet no predation
6.4.4 - Yes - -
Contestability c) AB’s hit-and-run strategy 6.4.5 No No - -
Source: own table
Market power is the ability to set prices above the competitive level (Motta, 2004), although both prices
above and below the competitive level are suspicious and could be signs of abusing market power. Low
prices could be predatory (Section 6.4) with the aim of foreclosing competitors and prices set high
could be monopoly prices afterwards (Section 6.5). The optimum would be if prices were equal to the
competitive level (P = marginal costs, thus MC), but this definition is challenging because of the high
proportion of fixed costs and price discrimination. Since MC is difficult to calculate and firms do not
list it in their annual reports, competition authorities usually compare prices to the average variable
cost (AVC) (Motta, 2004). The Areeda-Turner test is a known tool for detecting predatory prices.215
In order to avoid the complexity of comparing prices and costs, the US DoT proposed using the Capacity
Lock-in Rule (CLR) to avoid predatory behavior in the airline industry.
215 Their rule says that prices below short-run MC (or AVC) are predatory and “attempt to destroy its rivals or deter new entry”
(Areeda & Turner, 1975, p. 697). Some scholars find the test, which is based merely on a cost/price analysis, too strict and
require an additional proof of recoupment of losses (i.e., U.S. v American Airlines in 2003, Matsushita v Zenith Radio in 1986
or Brooke Group Ltd v Brown Williamson Tobacco in 1993). Others suppose the test is not strict enough and argue that even
prices above AVC (but below average total costs) are predatory if there is evidence of a ‘smoking gun’ (i.e., AKZO v
Commission in 1991 and 1993, or Belge v Commission in 2000). The only shortcoming is that written demonstration, like
emails, are difficult for the authority to detect (Whish, 2009). For a detailed overview of different approaches to the theory of
predatory pricing, see, e.g., Joskow and Klevorick (1979), or Motta (2004). For airline-specific investigations, see Morrison
(2005) and Ewald (2005).
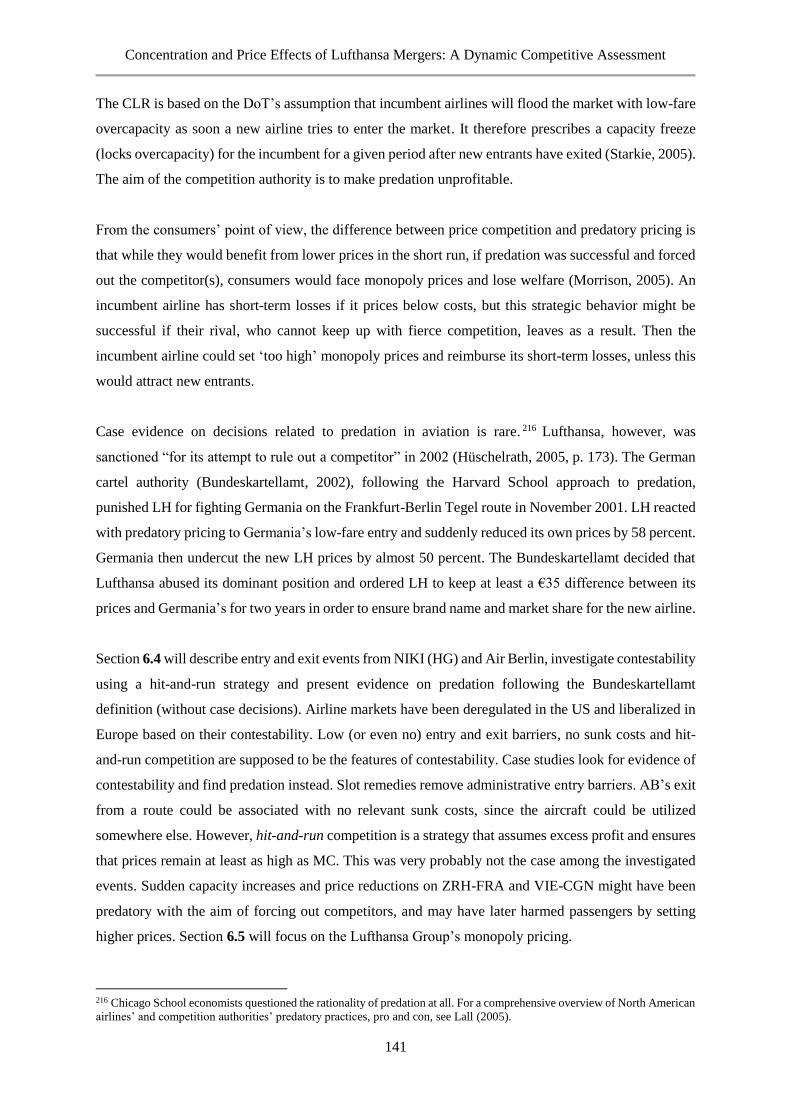
Concentration and Price Effects of Lufthansa Mergers: A Dynamic Competitive Assessment
141
The CLR is based on the DoT’s assumption that incumbent airlines will flood the market with low-fare
overcapacity as soon a new airline tries to enter the market. It therefore prescribes a capacity freeze
(locks overcapacity) for the incumbent for a given period after new entrants have exited (Starkie, 2005).
The aim of the competition authority is to make predation unprofitable.
From the consumers’ point of view, the difference between price competition and predatory pricing is
that while they would benefit from lower prices in the short run, if predation was successful and forced
out the competitor(s), consumers would face monopoly prices and lose welfare (Morrison, 2005). An
incumbent airline has short-term losses if it prices below costs, but this strategic behavior might be
successful if their rival, who cannot keep up with fierce competition, leaves as a result. Then the
incumbent airline could set ‘too high’ monopoly prices and reimburse its short-term losses, unless this
would attract new entrants.
Case evidence on decisions related to predation in aviation is rare. 216 Lufthansa, however, was
sanctioned “for its attempt to rule out a competitor” in 2002 (Hüschelrath, 2005, p. 173). The German
cartel authority (Bundeskartellamt, 2002), following the Harvard School approach to predation,
punished LH for fighting Germania on the Frankfurt-Berlin Tegel route in November 2001. LH reacted
with predatory pricing to Germania’s low-fare entry and suddenly reduced its own prices by 58 percent.
Germania then undercut the new LH prices by almost 50 percent. The Bundeskartellamt decided that
Lufthansa abused its dominant position and ordered LH to keep at least a €35 difference between its
prices and Germania’s for two years in order to ensure brand name and market share for the new airline.
Section 6.4 will describe entry and exit events from NIKI (HG) and Air Berlin, investigate contestability
using a hit-and-run strategy and present evidence on predation following the Bundeskartellamt
definition (without case decisions). Airline markets have been deregulated in the US and liberalized in
Europe based on their contestability. Low (or even no) entry and exit barriers, no sunk costs and hit-
and-run competition are supposed to be the features of contestability. Case studies look for evidence of
contestability and find predation instead. Slot remedies remove administrative entry barriers. AB’s exit
from a route could be associated with no relevant sunk costs, since the aircraft could be utilized
somewhere else. However, hit-and-run competition is a strategy that assumes excess profit and ensures
that prices remain at least as high as MC. This was very probably not the case among the investigated
events. Sudden capacity increases and price reductions on ZRH-FRA and VIE-CGN might have been
predatory with the aim of forcing out competitors, and may have later harmed passengers by setting
higher prices. Section 6.5 will focus on the Lufthansa Group’s monopoly pricing.
216 Chicago School economists questioned the rationality of predation at all. For a comprehensive overview of North American
airlines’ and competition authorities’ predatory practices, pro and con, see Lall (2005).
Concentration and Price Effects of Lufthansa Mergers: A Dynamic Competitive Assessment
142
6.4.1 INTRODUCING AIR BERLIN AS A COMPETITOR TO LUFTHANSA
The following analysis investigates the remedy periods and describes new airline entries into the
relevant routes. However, as the figure below illustrates, all new entries ended in exit. It immediately
raises a question about the reasons behind exit: is it the natural process of contestable competition (a
hit-and-run strategy) or rather strategic behavior to force out competitors (predation)?
Since Air Berlin’s share in the passenger transport market is significantly higher than those of smaller
competitors in the table, the following analysis will focus on the competition between Air Berlin
(including NIKI) and the Lufthansa Group (LHG).217
The (end of) low-cost, regional, flag and Air Berlin competition with Lufthansa
Competition Route Entry Expansion Exit Airline
Air Berlin G1: ZRH-FRA 2006 S - 2008 W AB
G2: VIE-CGN 2009 W - 2010 S AB
G2: VIE-STR 2007 S 2008 W AB
G3: ZRH-HAM 2006 S – 2012 S 2012 W AB
G3: ZRH-TXL 2006 S – 2014 S AB
G3: ZRH-HAJ 2011 W AB
LCC and
regional
G1: VIE-BRU 2007 S - 2009 S NE
G4: ZRH-WAW 2006 W, 2007 W - 2007 S, 2008 S 2L
G4: ZRH-CPH 2004 W - 2005 S DM
2010 W - 2011 S QI
Flag G4: ZRH-OTP 2009 S - 2010 W RO
G3: VIE-FRA 2011 W JP
Source: own table
Air Berlin (AB) started as a low-yield carrier in 2004. Berlin Tegel (TXL) is the base of Air Berlin, the
second biggest German airline. As the figure below illustrates,218 AB then improved its average yields
per mile from $0.22 to $0.38 until summer 2008. AB suffered high losses during the financial crises,
and operated below $0.20 per mile average yields219 in 2012.
217 Cases other than AB will be briefly summarized in footnotes to provide a clearer picture. 218 The data shows monthly average nominal yields on 17 routes where AB competed with the LHG (within the sample of a
combined 57 relevant regulated and non-regulated routes). 219 In comparison, Lufthansa’s average yield per mile was double that in 2012. For the detailed yield development of the LHG,
see Section 6.5.4.
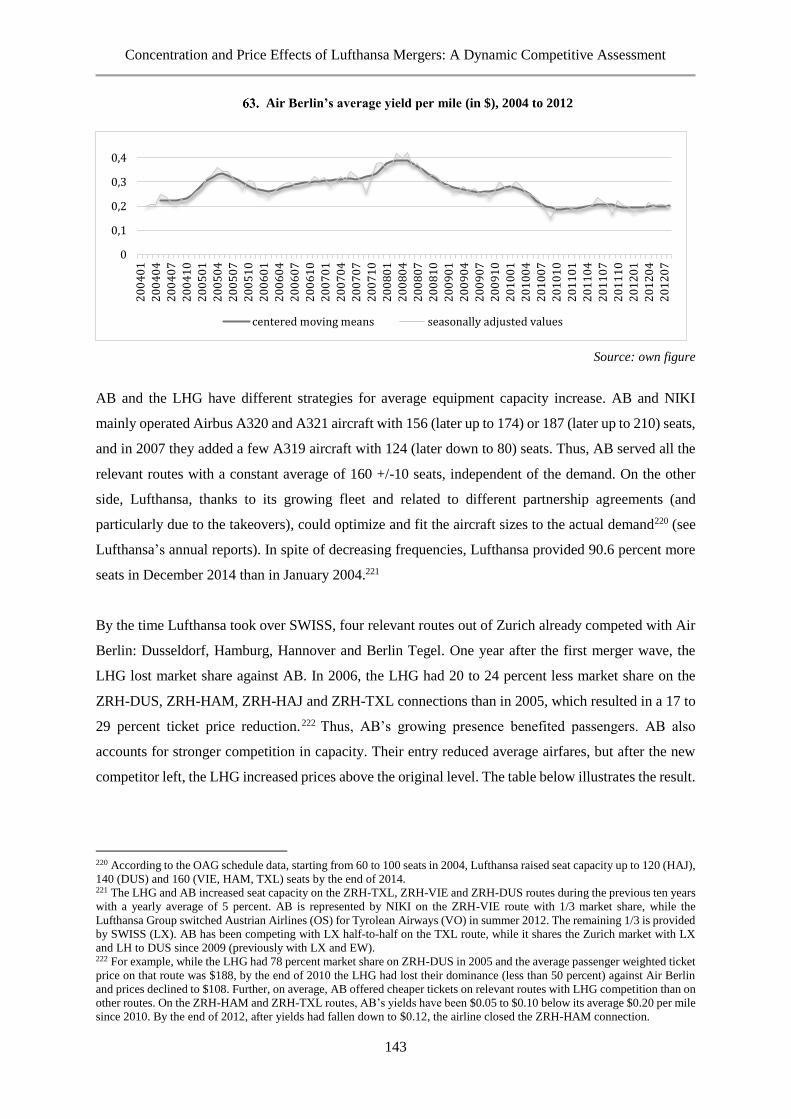
Concentration and Price Effects of Lufthansa Mergers: A Dynamic Competitive Assessment
143
Air Berlin’s average yield per mile (in $), 2004 to 2012
Source: own figure
AB and the LHG have different strategies for average equipment capacity increase. AB and NIKI
mainly operated Airbus A320 and A321 aircraft with 156 (later up to 174) or 187 (later up to 210) seats,
and in 2007 they added a few A319 aircraft with 124 (later down to 80) seats. Thus, AB served all the
relevant routes with a constant average of 160 +/-10 seats, independent of the demand. On the other
side, Lufthansa, thanks to its growing fleet and related to different partnership agreements (and
particularly due to the takeovers), could optimize and fit the aircraft sizes to the actual demand220 (see
Lufthansa’s annual reports). In spite of decreasing frequencies, Lufthansa provided 90.6 percent more
seats in December 2014 than in January 2004.221
By the time Lufthansa took over SWISS, four relevant routes out of Zurich already competed with Air
Berlin: Dusseldorf, Hamburg, Hannover and Berlin Tegel. One year after the first merger wave, the
LHG lost market share against AB. In 2006, the LHG had 20 to 24 percent less market share on the
ZRH-DUS, ZRH-HAM, ZRH-HAJ and ZRH-TXL connections than in 2005, which resulted in a 17 to
29 percent ticket price reduction.222 Thus, AB’s growing presence benefited passengers. AB also
accounts for stronger competition in capacity. Their entry reduced average airfares, but after the new
competitor left, the LHG increased prices above the original level. The table below illustrates the result.
220 According to the OAG schedule data, starting from 60 to 100 seats in 2004, Lufthansa raised seat capacity up to 120 (HAJ),
140 (DUS) and 160 (VIE, HAM, TXL) seats by the end of 2014. 221 The LHG and AB increased seat capacity on the ZRH-TXL, ZRH-VIE and ZRH-DUS routes during the previous ten years
with a yearly average of 5 percent. AB is represented by NIKI on the ZRH-VIE route with 1/3 market share, while the
Lufthansa Group switched Austrian Airlines (OS) for Tyrolean Airways (VO) in summer 2012. The remaining 1/3 is provided
by SWISS (LX). AB has been competing with LX half-to-half on the TXL route, while it shares the Zurich market with LX
and LH to DUS since 2009 (previously with LX and EW). 222 For example, while the LHG had 78 percent market share on ZRH-DUS in 2005 and the average passenger weighted ticket
price on that route was $188, by the end of 2010 the LHG had lost their dominance (less than 50 percent) against Air Berlin
and prices declined to $108. Further, on average, AB offered cheaper tickets on relevant routes with LHG competition than on
other routes. On the ZRH-HAM and ZRH-TXL routes, AB’s yields have been $0.05 to $0.10 below its average $0.20 per mile
since 2010. By the end of 2012, after yields had fallen down to $0.12, the airline closed the ZRH-HAM connection.
0
0,1
0,2
0,3
0,4
20
04
01
20
04
04
20
04
07
20
04
10
20
05
01
20
05
04
20
05
07
20
05
10
20
06
01
20
06
04
20
06
07
20
06
10
20
07
01
20
07
04
20
07
07
20
07
10
20
08
01
20
08
04
20
08
07
20
08
10
20
09
01
20
09
04
20
09
07
20
09
10
20
10
01
20
10
04
20
10
07
20
10
10
20
11
01
20
11
04
20
11
07
20
11
10
20
12
01
20
12
04
20
12
07
centered moving means seasonally adjusted values
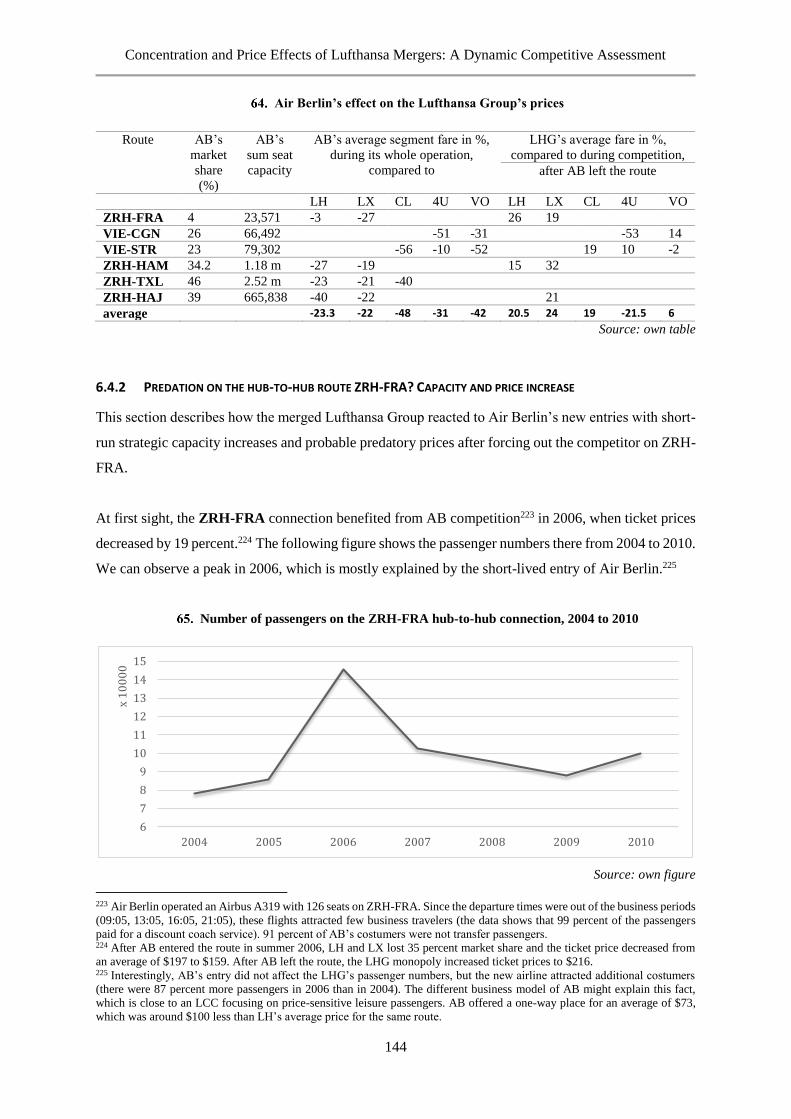
Concentration and Price Effects of Lufthansa Mergers: A Dynamic Competitive Assessment
144
Air Berlin’s effect on the Lufthansa Group’s prices
Route AB’s
market
share
(%)
AB’s
sum seat
capacity
AB’s average segment fare in %,
during its whole operation,
compared to
LHG’s average fare in %,
compared to during competition,
after AB left the route
LH LX CL 4U VO LH LX CL 4U VO
ZRH-FRA 4 23,571 -3 -27 26 19
VIE-CGN 26 66,492 -51 -31 -53 14
VIE-STR 23 79,302 -56 -10 -52 19 10 -2
ZRH-HAM 34.2 1.18 m -27 -19 15 32
ZRH-TXL 46 2.52 m -23 -21 -40
ZRH-HAJ 39 665,838 -40 -22 21
average -23.3 -22 -48 -31 -42 20.5 24 19 -21.5 6
Source: own table
6.4.2 PREDATION ON THE HUB-TO-HUB ROUTE ZRH-FRA? CAPACITY AND PRICE INCREASE
This section describes how the merged Lufthansa Group reacted to Air Berlin’s new entries with short-
run strategic capacity increases and probable predatory prices after forcing out the competitor on ZRH-
FRA.
At first sight, the ZRH-FRA connection benefited from AB competition223 in 2006, when ticket prices
decreased by 19 percent.224 The following figure shows the passenger numbers there from 2004 to 2010.
We can observe a peak in 2006, which is mostly explained by the short-lived entry of Air Berlin.225
Number of passengers on the ZRH-FRA hub-to-hub connection, 2004 to 2010
Source: own figure
223 Air Berlin operated an Airbus A319 with 126 seats on ZRH-FRA. Since the departure times were out of the business periods
(09:05, 13:05, 16:05, 21:05), these flights attracted few business travelers (the data shows that 99 percent of the passengers
paid for a discount coach service). 91 percent of AB’s costumers were not transfer passengers. 224 After AB entered the route in summer 2006, LH and LX lost 35 percent market share and the ticket price decreased from
an average of $197 to $159. After AB left the route, the LHG monopoly increased ticket prices to $216. 225 Interestingly, AB’s entry did not affect the LHG’s passenger numbers, but the new airline attracted additional costumers
(there were 87 percent more passengers in 2006 than in 2004). The different business model of AB might explain this fact,
which is close to an LCC focusing on price-sensitive leisure passengers. AB offered a one-way place for an average of $73,
which was around $100 less than LH’s average price for the same route.
6
7
8
9
10
11
12
13
14
15
2004 2005 2006 2007 2008 2009 2010
x 1
00
00
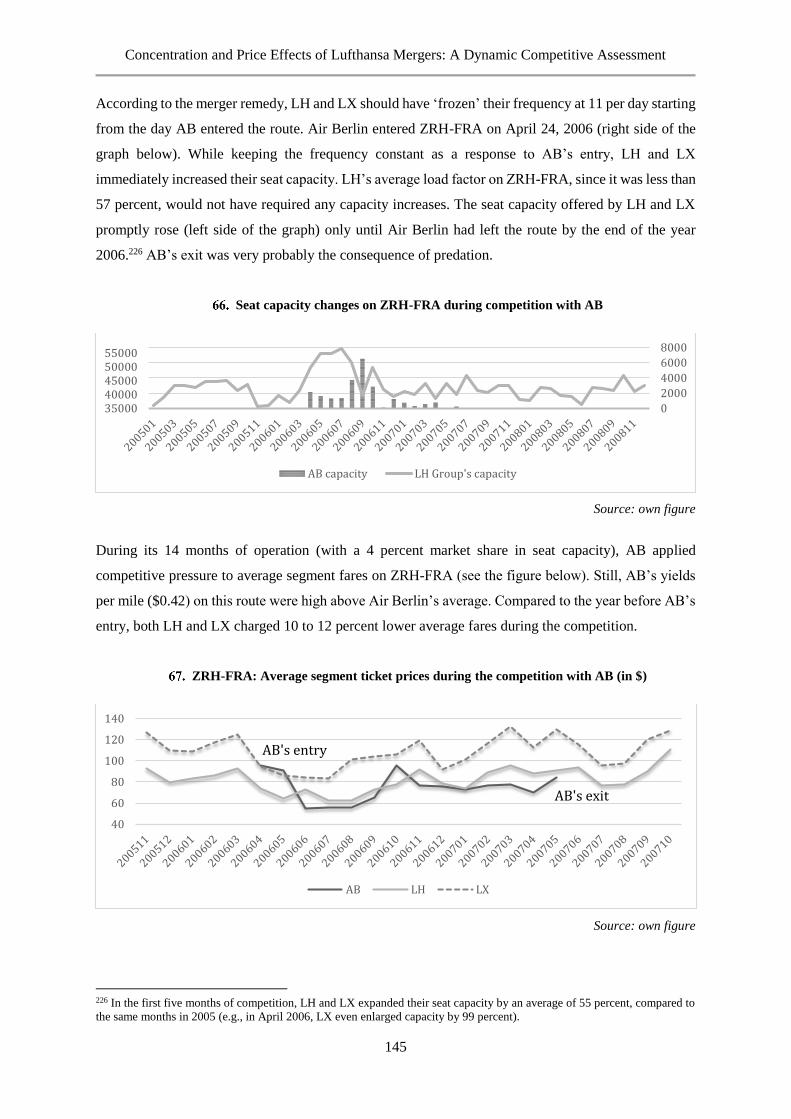
Concentration and Price Effects of Lufthansa Mergers: A Dynamic Competitive Assessment
145
According to the merger remedy, LH and LX should have ‘frozen’ their frequency at 11 per day starting
from the day AB entered the route. Air Berlin entered ZRH-FRA on April 24, 2006 (right side of the
graph below). While keeping the frequency constant as a response to AB’s entry, LH and LX
immediately increased their seat capacity. LH’s average load factor on ZRH-FRA, since it was less than
57 percent, would not have required any capacity increases. The seat capacity offered by LH and LX
promptly rose (left side of the graph) only until Air Berlin had left the route by the end of the year
2006.226 AB’s exit was very probably the consequence of predation.
Seat capacity changes on ZRH-FRA during competition with AB
Source: own figure
During its 14 months of operation (with a 4 percent market share in seat capacity), AB applied
competitive pressure to average segment fares on ZRH-FRA (see the figure below). Still, AB’s yields
per mile ($0.42) on this route were high above Air Berlin’s average. Compared to the year before AB’s
entry, both LH and LX charged 10 to 12 percent lower average fares during the competition.
ZRH-FRA: Average segment ticket prices during the competition with AB (in $)
Source: own figure
226 In the first five months of competition, LH and LX expanded their seat capacity by an average of 55 percent, compared to
the same months in 2005 (e.g., in April 2006, LX even enlarged capacity by 99 percent).
3500040000450005000055000
0
2000
4000
6000
8000
AB capacity LH Group's capacity
40
60
80
100
120
140
AB LH LX
AB's entry
AB's exit

Concentration and Price Effects of Lufthansa Mergers: A Dynamic Competitive Assessment
146
The question is whether the 10 to 12 percent sudden price reduction that coincided with AB’s entry was
the result of price competition or predatory pricing. In the Germania case in 2002, the German
Bundeskartellamt decided that on the TXL-FRA route, Lufthansa “does not cover the average costs per
passenger with the low fare tariff of €105” (Hüschelrath, 2005, p. 177). LH’s prices for ZRH-FRA fell
in part to $62 (ca. €49 in 2006) during the competition with AB.
Predation is probable in this case from two reasons. First, this price was the average (one-way) ticket
price, while in the Germania case it was the lowest ticket price that was stamped as predatory. In other
words, there had been even lower prices than Lufthansa’s $62 on the ZRH-FRA route. Second, the
distance between TXL-FRA is about 270 miles, while the distance between ZRH-FRA is 177 miles.
Thus, while Zurich-Frankfurt is around two-thirds of the Frankfurt-Berlin flight distance, Lufthansa’s
prices on ZRH-FRA were less than half.
6.4.3 PREDATION ON THE HUB-TO-SPOKE ROUTE VIE-CGN?
Air Berlin introduced new services on the VIE-CGN route in 2009, with fares at half the prices of both
Tyrolean Airways (VO) and Germanwings (4U) (see the figure below). While VO adjusted227 to the
lower prices after four months, 4U further increased the significant price difference. On behalf of
Lufthansa, VO replaced its aircraft with bigger airplanes and reduced its frequency from 2.5 down to
1.7 a day. Austrian Airlines (OS) used VO’s remaining 0.8 slots to launch new services in the next
summer period. Net average one-way fares were €81 during OS’s presence from 2010 to 2012.228 The
reason behind the price reductions, and probably behind the exit of AB, was OS’s entry in April 2010
with prices even below AB’s airfares. Three months after OS entered the market, AB left.
VIE-CGN: LH’s and LX’s prices during and after AB competition (in percent)
Source: own figure
227 During the eight months of AB’s presence, VO decreased prices by an average of 36 percent, compared to the year before. 228 After OS closed operation on all routes, the average ticket price on VIE-CGN went up to €130 by 2014.
-100%
-50%
0%
50%
100%
Δ VO av fare Δ 4U av fare
AB's entry and exit
OS's entry and exit
Concentration and Price Effects of Lufthansa Mergers: A Dynamic Competitive Assessment
147
Air Berlin, which is not an LCC, entered the VIE-CGN route by undercutting the LCC Germanwings
by 50 percent. Austrian Airlines’ entry was no hit-and-run, since the flag carrier even undercut AB’s
prices. Comparing AB’s and OS’s average yields (OS’s average yield per mile was about $0.28
according to Figure 83 in Section 6.5.4, while AB’s average yield per mile was $0.25 in the month of
entry, April 2010), we can definitely state that Austrian Airlines could not cover its marginal costs with
the pricing strategy on VIE-CGN. OS’s average one-way ticket price was $55 (at 4,257 offered seats,
half of AB’s seat capacity) in June 2010, when AB decided to leave the market.
When comparing this price to the predatory pricing decision of the German Bundeskartellamt in the
Germania case (Hüschelrath, 2005), one can state that the price of $55 (ca. €41.5) probably did not
cover the average costs of a passenger (even if we consider that average costs had decreased since
2002). Further, the flying distance from VIE-CGN (463 miles) is about 1.7 times longer than the case
decision on TXL-FRA, where Lufthansa’s minimum price should have been €105 (according to the
German competition authority).
Therefore, OS’s entry was rather predatory and done to force out Air Berlin. The evidence is as follows.
First, seat capacity, which had been constant around 17,000 since 2004, suddenly increased by 76
percent (up to 30,000 provided seats) after AB’s entry (first as X3 TUIfly). Therefore, the supply of
seats had already almost doubled by the time OS entered.
Second, OS left the route after one year, but neither VO nor 4U expanded capacity later, which might
be a sign of insufficient demand.
Third, when Austrian Airlines entered, the load factor of both 4U and VO stood at an all-time low (63
and 53 percent, respectively; 10 percent lower than the average of both airlines in the previous two
years). While Germanwings recovered in terms of load factor, both VO and OS fluctuated between 40
and 70 percent until OS finally left the route. Last, AB’s load factor (78 percent during the last three
months) contradicts the idea that there was no place for more airlines.229 Since Lufthansa took over OS
in 2009, it seems that the incumbent airline (LH) reacted to AB’s entry through its subsidiary OS instead
of directly lowering prices. The following figure illustrates the results.
229 On the STR-DRE route, LH outsourced the whole operation for its LCC, Germanwings, closed two out of four daily
frequencies, and increased seat capacity by replacing aircraft with significantly bigger ones. The winners are (leisure)
passengers at first sight, since all three routes provide increased seat capacity. However, there is no place for AB on this
connection, which is mainly dominated by leisure passengers. AB could not successfully enter the markets with Germanwings
dominance.
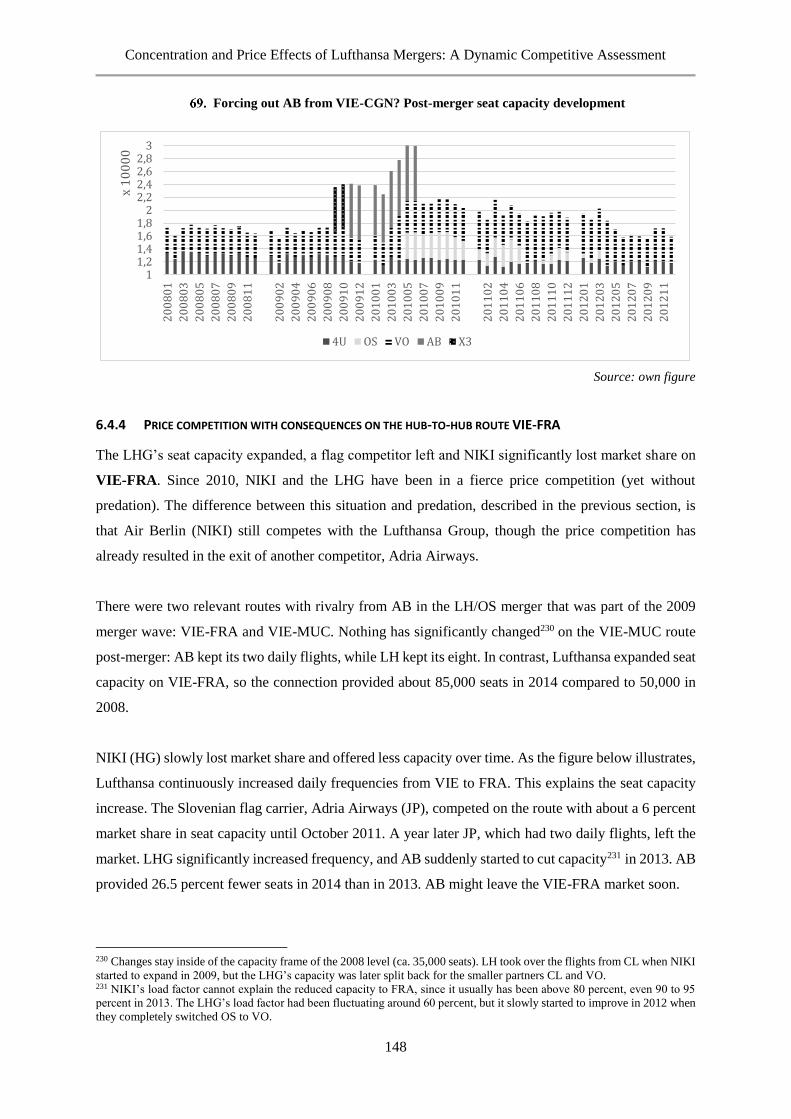
Concentration and Price Effects of Lufthansa Mergers: A Dynamic Competitive Assessment
148
Forcing out AB from VIE-CGN? Post-merger seat capacity development
Source: own figure
6.4.4 PRICE COMPETITION WITH CONSEQUENCES ON THE HUB-TO-HUB ROUTE VIE-FRA
The LHG’s seat capacity expanded, a flag competitor left and NIKI significantly lost market share on
VIE-FRA. Since 2010, NIKI and the LHG have been in a fierce price competition (yet without
predation). The difference between this situation and predation, described in the previous section, is
that Air Berlin (NIKI) still competes with the Lufthansa Group, though the price competition has
already resulted in the exit of another competitor, Adria Airways.
There were two relevant routes with rivalry from AB in the LH/OS merger that was part of the 2009
merger wave: VIE-FRA and VIE-MUC. Nothing has significantly changed230 on the VIE-MUC route
post-merger: AB kept its two daily flights, while LH kept its eight. In contrast, Lufthansa expanded seat
capacity on VIE-FRA, so the connection provided about 85,000 seats in 2014 compared to 50,000 in
2008.
NIKI (HG) slowly lost market share and offered less capacity over time. As the figure below illustrates,
Lufthansa continuously increased daily frequencies from VIE to FRA. This explains the seat capacity
increase. The Slovenian flag carrier, Adria Airways (JP), competed on the route with about a 6 percent
market share in seat capacity until October 2011. A year later JP, which had two daily flights, left the
market. LHG significantly increased frequency, and AB suddenly started to cut capacity231 in 2013. AB
provided 26.5 percent fewer seats in 2014 than in 2013. AB might leave the VIE-FRA market soon.
230 Changes stay inside of the capacity frame of the 2008 level (ca. 35,000 seats). LH took over the flights from CL when NIKI
started to expand in 2009, but the LHG’s capacity was later split back for the smaller partners CL and VO. 231 NIKI’s load factor cannot explain the reduced capacity to FRA, since it usually has been above 80 percent, even 90 to 95
percent in 2013. The LHG’s load factor had been fluctuating around 60 percent, but it slowly started to improve in 2012 when
they completely switched OS to VO.
11,21,41,61,8
22,22,42,62,8
3
20
08
01
20
08
03
20
08
05
20
08
07
20
08
09
20
08
11
20
09
02
20
09
04
20
09
06
20
09
08
20
09
10
20
09
12
20
10
01
20
10
03
20
10
05
20
10
07
20
10
09
20
10
11
20
11
02
20
11
04
20
11
06
20
11
08
20
11
10
20
11
12
20
12
01
20
12
03
20
12
05
20
12
07
20
12
09
20
12
11
x 1
00
00
4U OS VO AB X3
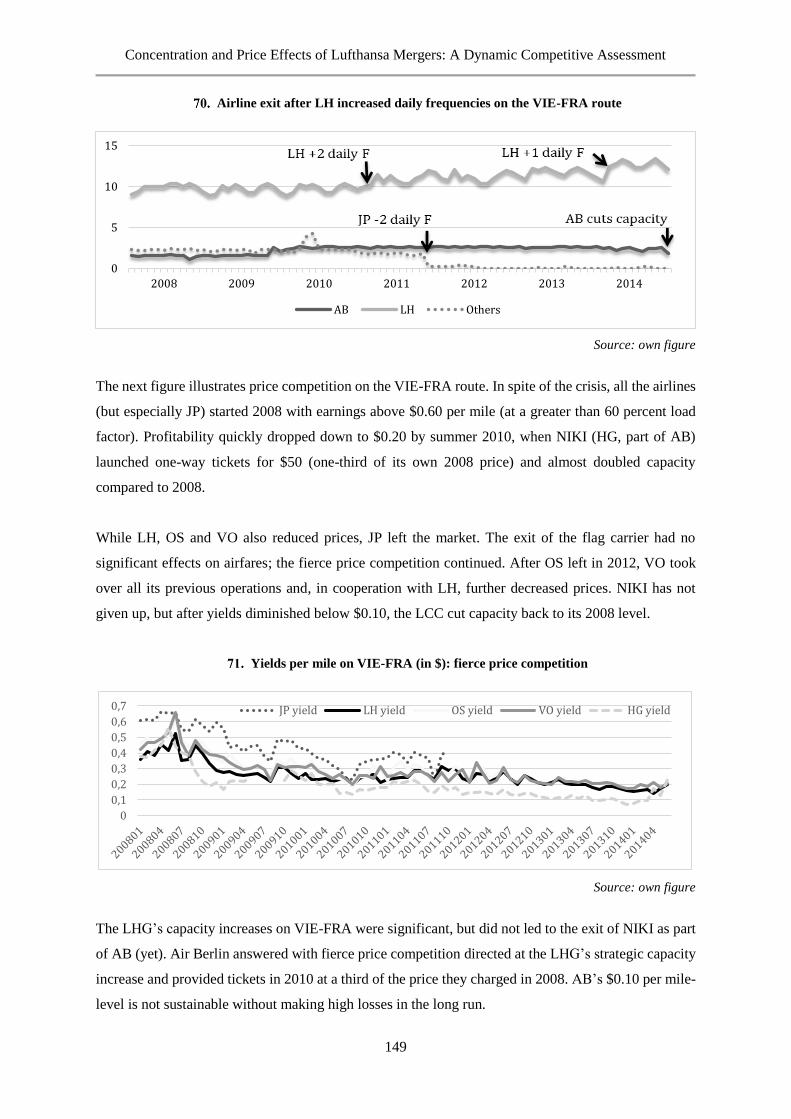
Concentration and Price Effects of Lufthansa Mergers: A Dynamic Competitive Assessment
149
Airline exit after LH increased daily frequencies on the VIE-FRA route
Source: own figure
The next figure illustrates price competition on the VIE-FRA route. In spite of the crisis, all the airlines
(but especially JP) started 2008 with earnings above $0.60 per mile (at a greater than 60 percent load
factor). Profitability quickly dropped down to $0.20 by summer 2010, when NIKI (HG, part of AB)
launched one-way tickets for $50 (one-third of its own 2008 price) and almost doubled capacity
compared to 2008.
While LH, OS and VO also reduced prices, JP left the market. The exit of the flag carrier had no
significant effects on airfares; the fierce price competition continued. After OS left in 2012, VO took
over all its previous operations and, in cooperation with LH, further decreased prices. NIKI has not
given up, but after yields diminished below $0.10, the LCC cut capacity back to its 2008 level.
Yields per mile on VIE-FRA (in $): fierce price competition
Source: own figure
The LHG’s capacity increases on VIE-FRA were significant, but did not led to the exit of NIKI as part
of AB (yet). Air Berlin answered with fierce price competition directed at the LHG’s strategic capacity
increase and provided tickets in 2010 at a third of the price they charged in 2008. AB’s $0.10 per mile-
level is not sustainable without making high losses in the long run.
0
5
10
15
2008 2009 2010 2011 2012 2013 2014
AB LH Others
0
0,1
0,2
0,3
0,4
0,5
0,6
0,7 JP yield LH yield OS yield VO yield HG yield
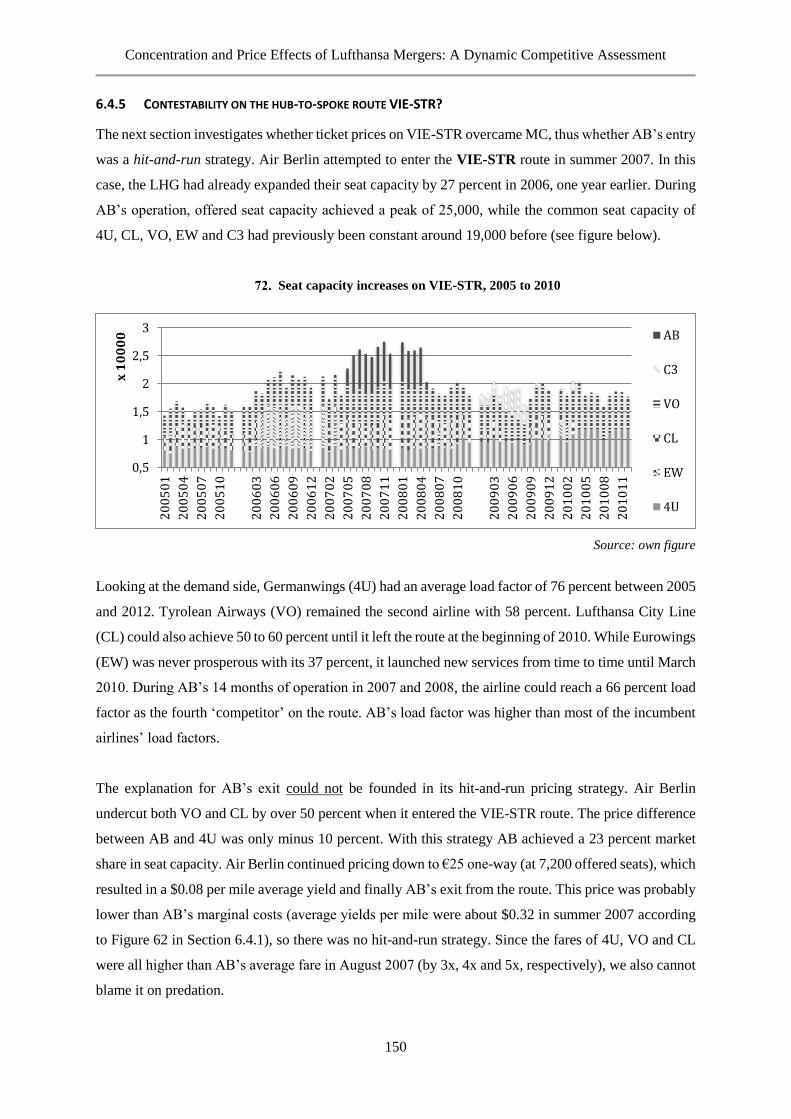
Concentration and Price Effects of Lufthansa Mergers: A Dynamic Competitive Assessment
150
6.4.5 CONTESTABILITY ON THE HUB-TO-SPOKE ROUTE VIE-STR?
The next section investigates whether ticket prices on VIE-STR overcame MC, thus whether AB’s entry
was a hit-and-run strategy. Air Berlin attempted to enter the VIE-STR route in summer 2007. In this
case, the LHG had already expanded their seat capacity by 27 percent in 2006, one year earlier. During
AB’s operation, offered seat capacity achieved a peak of 25,000, while the common seat capacity of
4U, CL, VO, EW and C3 had previously been constant around 19,000 before (see figure below).
Seat capacity increases on VIE-STR, 2005 to 2010
Source: own figure
Looking at the demand side, Germanwings (4U) had an average load factor of 76 percent between 2005
and 2012. Tyrolean Airways (VO) remained the second airline with 58 percent. Lufthansa City Line
(CL) could also achieve 50 to 60 percent until it left the route at the beginning of 2010. While Eurowings
(EW) was never prosperous with its 37 percent, it launched new services from time to time until March
2010. During AB’s 14 months of operation in 2007 and 2008, the airline could reach a 66 percent load
factor as the fourth ‘competitor’ on the route. AB’s load factor was higher than most of the incumbent
airlines’ load factors.
The explanation for AB’s exit could not be founded in its hit-and-run pricing strategy. Air Berlin
undercut both VO and CL by over 50 percent when it entered the VIE-STR route. The price difference
between AB and 4U was only minus 10 percent. With this strategy AB achieved a 23 percent market
share in seat capacity. Air Berlin continued pricing down to €25 one-way (at 7,200 offered seats), which
resulted in a $0.08 per mile average yield and finally AB’s exit from the route. This price was probably
lower than AB’s marginal costs (average yields per mile were about $0.32 in summer 2007 according
to Figure 62 in Section 6.4.1), so there was no hit-and-run strategy. Since the fares of 4U, VO and CL
were all higher than AB’s average fare in August 2007 (by 3x, 4x and 5x, respectively), we also cannot
blame it on predation.
0,5
1
1,5
2
2,5
3
20
05
01
20
05
04
20
05
07
20
05
10
20
06
03
20
06
06
20
06
09
20
06
12
20
07
02
20
07
05
20
07
08
20
07
11
20
08
01
20
08
04
20
08
07
20
08
10
20
09
03
20
09
06
20
09
09
20
09
12
20
10
02
20
10
05
20
10
08
20
10
11
x 1
00
00 AB
C3
VO
CL
EW
4U
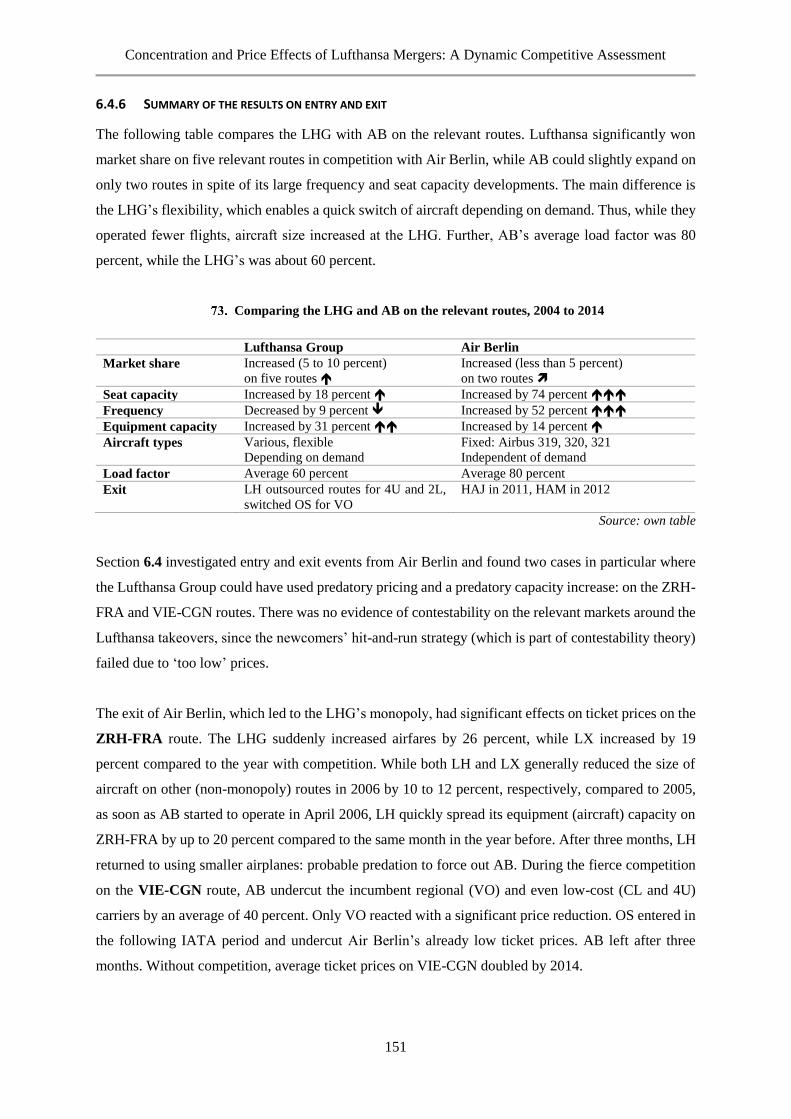
Concentration and Price Effects of Lufthansa Mergers: A Dynamic Competitive Assessment
151
6.4.6 SUMMARY OF THE RESULTS ON ENTRY AND EXIT
The following table compares the LHG with AB on the relevant routes. Lufthansa significantly won
market share on five relevant routes in competition with Air Berlin, while AB could slightly expand on
only two routes in spite of its large frequency and seat capacity developments. The main difference is
the LHG’s flexibility, which enables a quick switch of aircraft depending on demand. Thus, while they
operated fewer flights, aircraft size increased at the LHG. Further, AB’s average load factor was 80
percent, while the LHG’s was about 60 percent.
Comparing the LHG and AB on the relevant routes, 2004 to 2014
Lufthansa Group Air Berlin
Market share Increased (5 to 10 percent)
on five routes
Increased (less than 5 percent)
on two routes
Seat capacity Increased by 18 percent Increased by 74 percent
Frequency Decreased by 9 percent Increased by 52 percent
Equipment capacity Increased by 31 percent Increased by 14 percent
Aircraft types Various, flexible
Depending on demand
Fixed: Airbus 319, 320, 321
Independent of demand
Load factor Average 60 percent Average 80 percent
Exit LH outsourced routes for 4U and 2L,
switched OS for VO
HAJ in 2011, HAM in 2012
Source: own table
Section 6.4 investigated entry and exit events from Air Berlin and found two cases in particular where
the Lufthansa Group could have used predatory pricing and a predatory capacity increase: on the ZRH-
FRA and VIE-CGN routes. There was no evidence of contestability on the relevant markets around the
Lufthansa takeovers, since the newcomers’ hit-and-run strategy (which is part of contestability theory)
failed due to ‘too low’ prices.
The exit of Air Berlin, which led to the LHG’s monopoly, had significant effects on ticket prices on the
ZRH-FRA route. The LHG suddenly increased airfares by 26 percent, while LX increased by 19
percent compared to the year with competition. While both LH and LX generally reduced the size of
aircraft on other (non-monopoly) routes in 2006 by 10 to 12 percent, respectively, compared to 2005,
as soon as AB started to operate in April 2006, LH quickly spread its equipment (aircraft) capacity on
ZRH-FRA by up to 20 percent compared to the same month in the year before. After three months, LH
returned to using smaller airplanes: probable predation to force out AB. During the fierce competition
on the VIE-CGN route, AB undercut the incumbent regional (VO) and even low-cost (CL and 4U)
carriers by an average of 40 percent. Only VO reacted with a significant price reduction. OS entered in
the following IATA period and undercut Air Berlin’s already low ticket prices. AB left after three
months. Without competition, average ticket prices on VIE-CGN doubled by 2014.
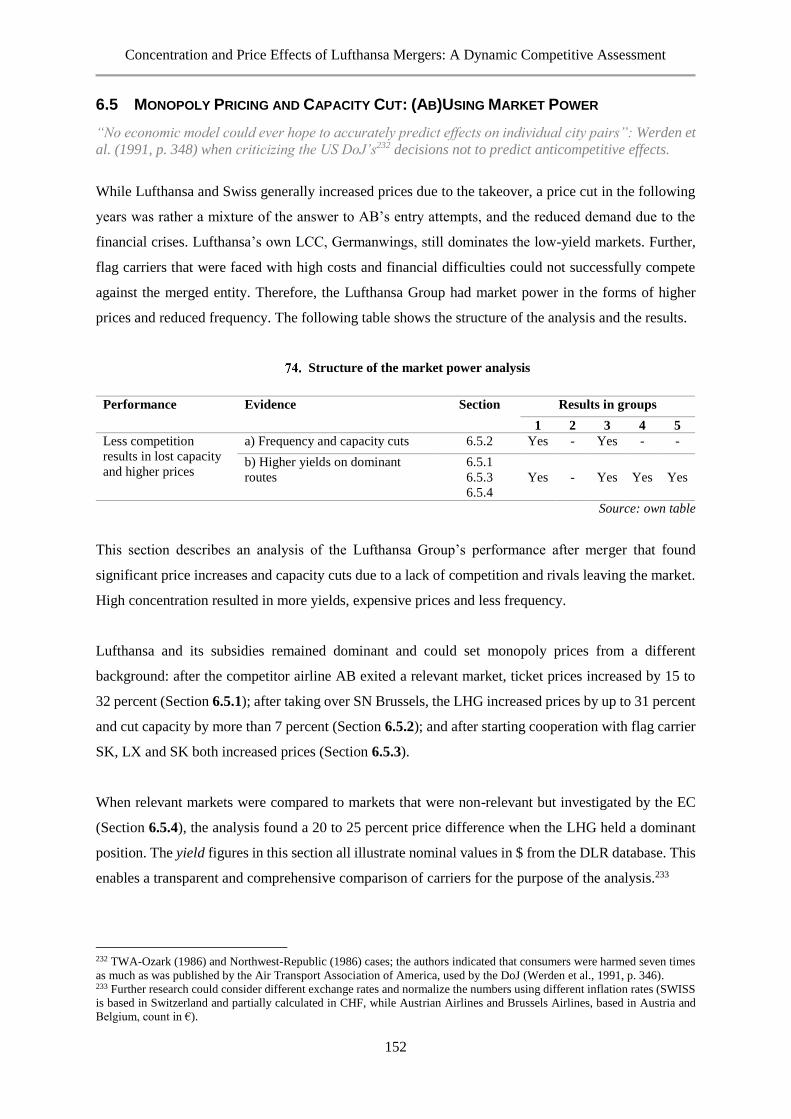
Concentration and Price Effects of Lufthansa Mergers: A Dynamic Competitive Assessment
152
6.5 MONOPOLY PRICING AND CAPACITY CUT: (AB)USING MARKET POWER
“No economic model could ever hope to accurately predict effects on individual city pairs”: Werden et
al. (1991, p. 348) when criticizing the US DoJ’s232 decisions not to predict anticompetitive effects.
While Lufthansa and Swiss generally increased prices due to the takeover, a price cut in the following
years was rather a mixture of the answer to AB’s entry attempts, and the reduced demand due to the
financial crises. Lufthansa’s own LCC, Germanwings, still dominates the low-yield markets. Further,
flag carriers that were faced with high costs and financial difficulties could not successfully compete
against the merged entity. Therefore, the Lufthansa Group had market power in the forms of higher
prices and reduced frequency. The following table shows the structure of the analysis and the results.
Structure of the market power analysis
Performance Evidence Section Results in groups
1 2 3 4 5
Less competition
results in lost capacity
and higher prices
a) Frequency and capacity cuts 6.5.2 Yes - Yes - -
b) Higher yields on dominant
routes
6.5.1
6.5.3
6.5.4
Yes - Yes Yes Yes
Source: own table
This section describes an analysis of the Lufthansa Group’s performance after merger that found
significant price increases and capacity cuts due to a lack of competition and rivals leaving the market.
High concentration resulted in more yields, expensive prices and less frequency.
Lufthansa and its subsidies remained dominant and could set monopoly prices from a different
background: after the competitor airline AB exited a relevant market, ticket prices increased by 15 to
32 percent (Section 6.5.1); after taking over SN Brussels, the LHG increased prices by up to 31 percent
and cut capacity by more than 7 percent (Section 6.5.2); and after starting cooperation with flag carrier
SK, LX and SK both increased prices (Section 6.5.3).
When relevant markets were compared to markets that were non-relevant but investigated by the EC
(Section 6.5.4), the analysis found a 20 to 25 percent price difference when the LHG held a dominant
position. The yield figures in this section all illustrate nominal values in $ from the DLR database. This
enables a transparent and comprehensive comparison of carriers for the purpose of the analysis.233
232 TWA-Ozark (1986) and Northwest-Republic (1986) cases; the authors indicated that consumers were harmed seven times
as much as was published by the Air Transport Association of America, used by the DoJ (Werden et al., 1991, p. 346). 233 Further research could consider different exchange rates and normalize the numbers using different inflation rates (SWISS
is based in Switzerland and partially calculated in CHF, while Austrian Airlines and Brussels Airlines, based in Austria and
Belgium, count in €).
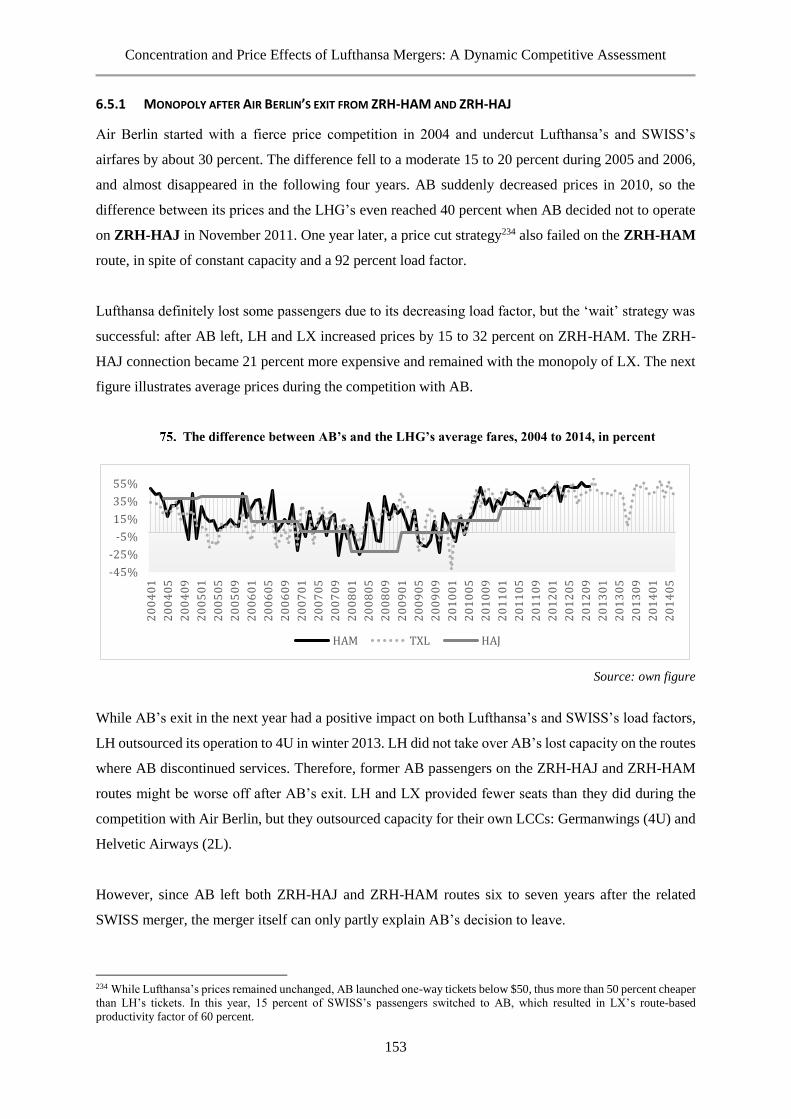
Concentration and Price Effects of Lufthansa Mergers: A Dynamic Competitive Assessment
153
6.5.1 MONOPOLY AFTER AIR BERLIN’S EXIT FROM ZRH-HAM AND ZRH-HAJ
Air Berlin started with a fierce price competition in 2004 and undercut Lufthansa’s and SWISS’s
airfares by about 30 percent. The difference fell to a moderate 15 to 20 percent during 2005 and 2006,
and almost disappeared in the following four years. AB suddenly decreased prices in 2010, so the
difference between its prices and the LHG’s even reached 40 percent when AB decided not to operate
on ZRH-HAJ in November 2011. One year later, a price cut strategy234 also failed on the ZRH-HAM
route, in spite of constant capacity and a 92 percent load factor.
Lufthansa definitely lost some passengers due to its decreasing load factor, but the ‘wait’ strategy was
successful: after AB left, LH and LX increased prices by 15 to 32 percent on ZRH-HAM. The ZRH-
HAJ connection became 21 percent more expensive and remained with the monopoly of LX. The next
figure illustrates average prices during the competition with AB.
The difference between AB’s and the LHG’s average fares, 2004 to 2014, in percent
Source: own figure
While AB’s exit in the next year had a positive impact on both Lufthansa’s and SWISS’s load factors,
LH outsourced its operation to 4U in winter 2013. LH did not take over AB’s lost capacity on the routes
where AB discontinued services. Therefore, former AB passengers on the ZRH-HAJ and ZRH-HAM
routes might be worse off after AB’s exit. LH and LX provided fewer seats than they did during the
competition with Air Berlin, but they outsourced capacity for their own LCCs: Germanwings (4U) and
Helvetic Airways (2L).
However, since AB left both ZRH-HAJ and ZRH-HAM routes six to seven years after the related
SWISS merger, the merger itself can only partly explain AB’s decision to leave.
234 While Lufthansa’s prices remained unchanged, AB launched one-way tickets below $50, thus more than 50 percent cheaper
than LH’s tickets. In this year, 15 percent of SWISS’s passengers switched to AB, which resulted in LX’s route-based
productivity factor of 60 percent.
-45%
-25%
-5%
15%
35%
55%
20
04
01
20
04
05
20
04
09
20
05
01
20
05
05
20
05
09
20
06
01
20
06
05
20
06
09
20
07
01
20
07
05
20
07
09
20
08
01
20
08
05
20
08
09
20
09
01
20
09
05
20
09
09
20
10
01
20
10
05
20
10
09
20
11
01
20
11
05
20
11
09
20
12
01
20
12
05
20
12
09
20
13
01
20
13
05
20
13
09
20
14
01
20
14
05
HAM TXL HAJ
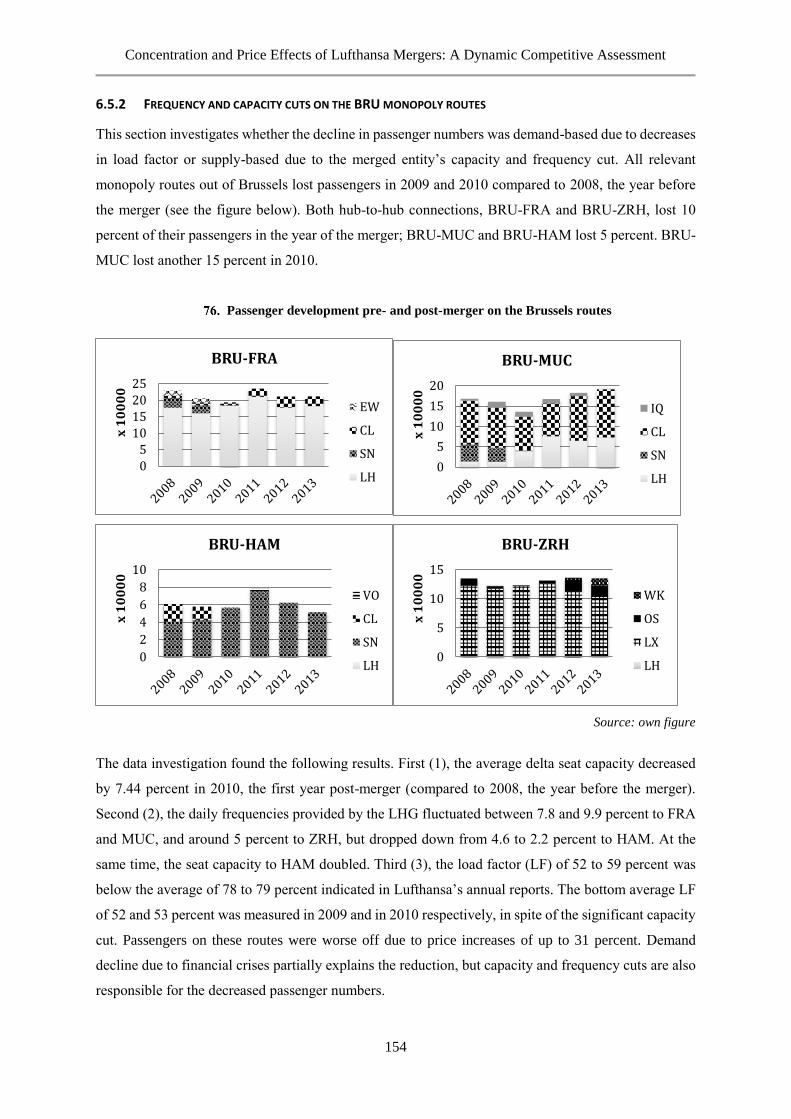
Concentration and Price Effects of Lufthansa Mergers: A Dynamic Competitive Assessment
154
6.5.2 FREQUENCY AND CAPACITY CUTS ON THE BRU MONOPOLY ROUTES
This section investigates whether the decline in passenger numbers was demand-based due to decreases
in load factor or supply-based due to the merged entity’s capacity and frequency cut. All relevant
monopoly routes out of Brussels lost passengers in 2009 and 2010 compared to 2008, the year before
the merger (see the figure below). Both hub-to-hub connections, BRU-FRA and BRU-ZRH, lost 10
percent of their passengers in the year of the merger; BRU-MUC and BRU-HAM lost 5 percent. BRU-
MUC lost another 15 percent in 2010.
Passenger development pre- and post-merger on the Brussels routes
Source: own figure
The data investigation found the following results. First (1), the average delta seat capacity decreased
by 7.44 percent in 2010, the first year post-merger (compared to 2008, the year before the merger).
Second (2), the daily frequencies provided by the LHG fluctuated between 7.8 and 9.9 percent to FRA
and MUC, and around 5 percent to ZRH, but dropped down from 4.6 to 2.2 percent to HAM. At the
same time, the seat capacity to HAM doubled. Third (3), the load factor (LF) of 52 to 59 percent was
below the average of 78 to 79 percent indicated in Lufthansa’s annual reports. The bottom average LF
of 52 and 53 percent was measured in 2009 and in 2010 respectively, in spite of the significant capacity
cut. Passengers on these routes were worse off due to price increases of up to 31 percent. Demand
decline due to financial crises partially explains the reduction, but capacity and frequency cuts are also
responsible for the decreased passenger numbers.
05
10152025
x 1
00
00
BRU-FRA
EW
CL
SN
LH0
5
10
15
20
x 1
00
00
BRU-MUC
IQ
CL
SN
LH
0
2
4
6
8
10
x 1
00
00
BRU-HAM
VO
CL
SN
LH0
5
10
15
x 1
00
00
BRU-ZRH
WK
OS
LX
LH

Concentration and Price Effects of Lufthansa Mergers: A Dynamic Competitive Assessment
155
6.5.3 FLAG CARRIERS: COOPERATION (ZRH-CPH, ZRH-WAW) OR EXIT (ZRH-OTP)
This section investigates yield developments of flag carriers compared to the LHG. The study
differentiates between routes from Zurich into Copenhagen in cooperation with the alliance partner
SAS; into Warsaw in cooperation with alliance partner LOT; and into Bucharest in competition with
the SkyTeam member Tarom.
In northern Europe, Scandinavian Airways (SK) has lost about 63 seats each month since 2005 on the
ZRH-CPH connection. LX always operated three daily frequencies between 2004 and 2014. The
average LX equipment capacity developed from 50 in 2004 to 200 in 2014, so the capacity was one-
fourth as high as in the year before the merger. Right after the takeover, SK reduced its frequency235
from 3.5 to 4 daily connections down to 2.5 to 3 and never recovered. Both LX and SK had very similar
load factors (an average of 72 percent) during the last ten years.
Yields per mile on ZRH-CPH (in $): price correlation after rivals left
Source: own figure
The figure above illustrates the price development on ZRH-CPH. Maersk Air (DM) entered the route
shortly before the LH-LX merger in November 2004 and, until it ceased operations in October 2005,
provided 25 to 30 percent cheaper tickets than LX or SK. However, DM failed to keep the very low
margins236 and left the market (restructured as Sterling Airlines in 2005). After DM left, SK was able
to quickly recover and succeeded in increasing prices by 18 percent in one year. LX adjusted slowly,
and a significant price difference remained between LX and SK until 2010. When Cimber Sterling237
(QI) entered in winter 2010, SK reduced prices by 30 percent, while LX further decreased its already
lower prices by 9 percent.
235 Despite the reduced frequency, SK’s equipment capacity has averaged around 120 (+/- 30 seats) in the last 10 years,
inversely proportional to LX’s seasonal equipment capacity. For example, when LX suddenly increased its equipment capacity
from 150 to 180 in 2009, SK’s dropped from 120 to 85. 236 Both airlines decreased airfares compared to the year before entry: LX by 18 percent, SK by 12 percent. 237 Cimber Sterling is the successor of the meanwhile insolvent Sterling Airlines.
0,1
0,2
0,3
0,4
20
04
01
20
04
05
20
04
09
20
05
01
20
05
05
20
05
09
20
06
01
20
06
05
20
06
09
20
07
01
20
07
05
20
07
09
20
08
01
20
08
05
20
08
09
20
09
01
20
09
05
20
09
09
20
10
01
20
10
05
20
10
09
20
11
01
20
11
05
20
11
09
20
12
01
20
12
05
20
12
09
20
13
01
20
13
05
20
13
09
20
14
01
20
14
05
LX yield SK yield DM yield QI yield
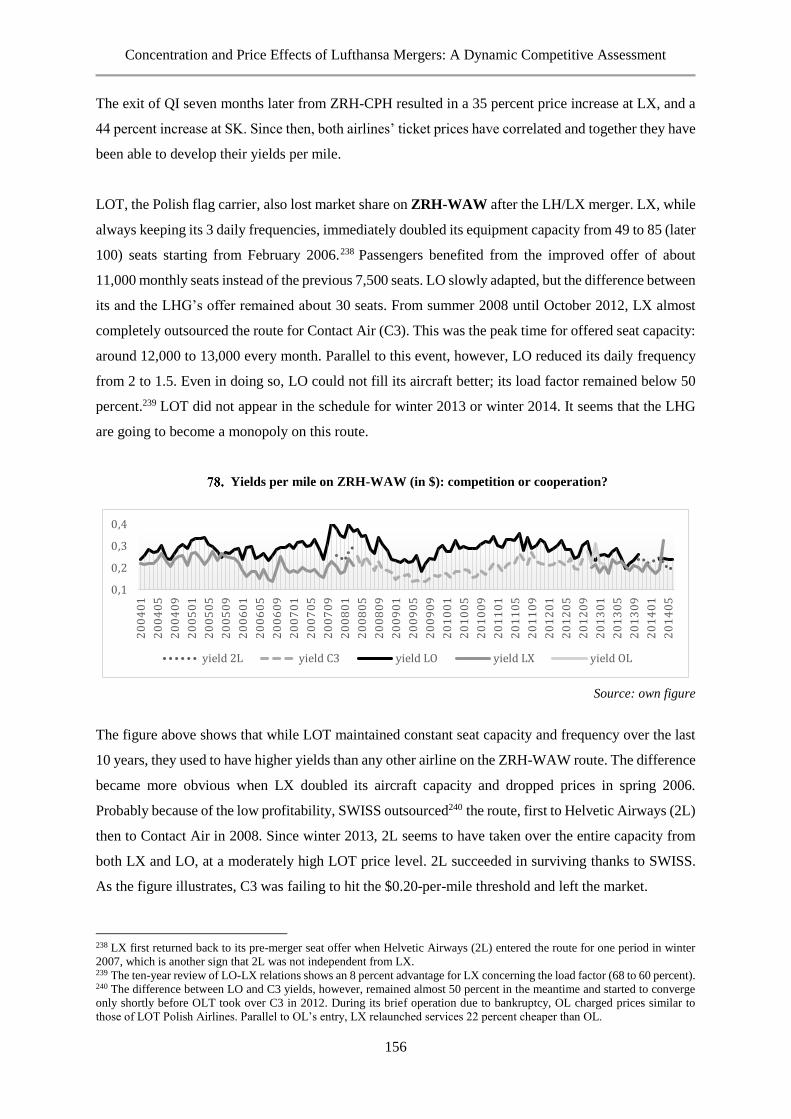
Concentration and Price Effects of Lufthansa Mergers: A Dynamic Competitive Assessment
156
The exit of QI seven months later from ZRH-CPH resulted in a 35 percent price increase at LX, and a
44 percent increase at SK. Since then, both airlines’ ticket prices have correlated and together they have
been able to develop their yields per mile.
LOT, the Polish flag carrier, also lost market share on ZRH-WAW after the LH/LX merger. LX, while
always keeping its 3 daily frequencies, immediately doubled its equipment capacity from 49 to 85 (later
100) seats starting from February 2006.238 Passengers benefited from the improved offer of about
11,000 monthly seats instead of the previous 7,500 seats. LO slowly adapted, but the difference between
its and the LHG’s offer remained about 30 seats. From summer 2008 until October 2012, LX almost
completely outsourced the route for Contact Air (C3). This was the peak time for offered seat capacity:
around 12,000 to 13,000 every month. Parallel to this event, however, LO reduced its daily frequency
from 2 to 1.5. Even in doing so, LO could not fill its aircraft better; its load factor remained below 50
percent.239 LOT did not appear in the schedule for winter 2013 or winter 2014. It seems that the LHG
are going to become a monopoly on this route.
Yields per mile on ZRH-WAW (in $): competition or cooperation?
Source: own figure
The figure above shows that while LOT maintained constant seat capacity and frequency over the last
10 years, they used to have higher yields than any other airline on the ZRH-WAW route. The difference
became more obvious when LX doubled its aircraft capacity and dropped prices in spring 2006.
Probably because of the low profitability, SWISS outsourced240 the route, first to Helvetic Airways (2L)
then to Contact Air in 2008. Since winter 2013, 2L seems to have taken over the entire capacity from
both LX and LO, at a moderately high LOT price level. 2L succeeded in surviving thanks to SWISS.
As the figure illustrates, C3 was failing to hit the $0.20-per-mile threshold and left the market.
238 LX first returned back to its pre-merger seat offer when Helvetic Airways (2L) entered the route for one period in winter
2007, which is another sign that 2L was not independent from LX. 239 The ten-year review of LO-LX relations shows an 8 percent advantage for LX concerning the load factor (68 to 60 percent). 240 The difference between LO and C3 yields, however, remained almost 50 percent in the meantime and started to converge
only shortly before OLT took over C3 in 2012. During its brief operation due to bankruptcy, OL charged prices similar to
those of LOT Polish Airlines. Parallel to OL’s entry, LX relaunched services 22 percent cheaper than OL.
0,1
0,2
0,3
0,4
20
04
01
20
04
05
20
04
09
20
05
01
20
05
05
20
05
09
20
06
01
20
06
05
20
06
09
20
07
01
20
07
05
20
07
09
20
08
01
20
08
05
20
08
09
20
09
01
20
09
05
20
09
09
20
10
01
20
10
05
20
10
09
20
11
01
20
11
05
20
11
09
20
12
01
20
12
05
20
12
09
20
13
01
20
13
05
20
13
09
20
14
01
20
14
05
yield 2L yield C3 yield LO yield LX yield OL
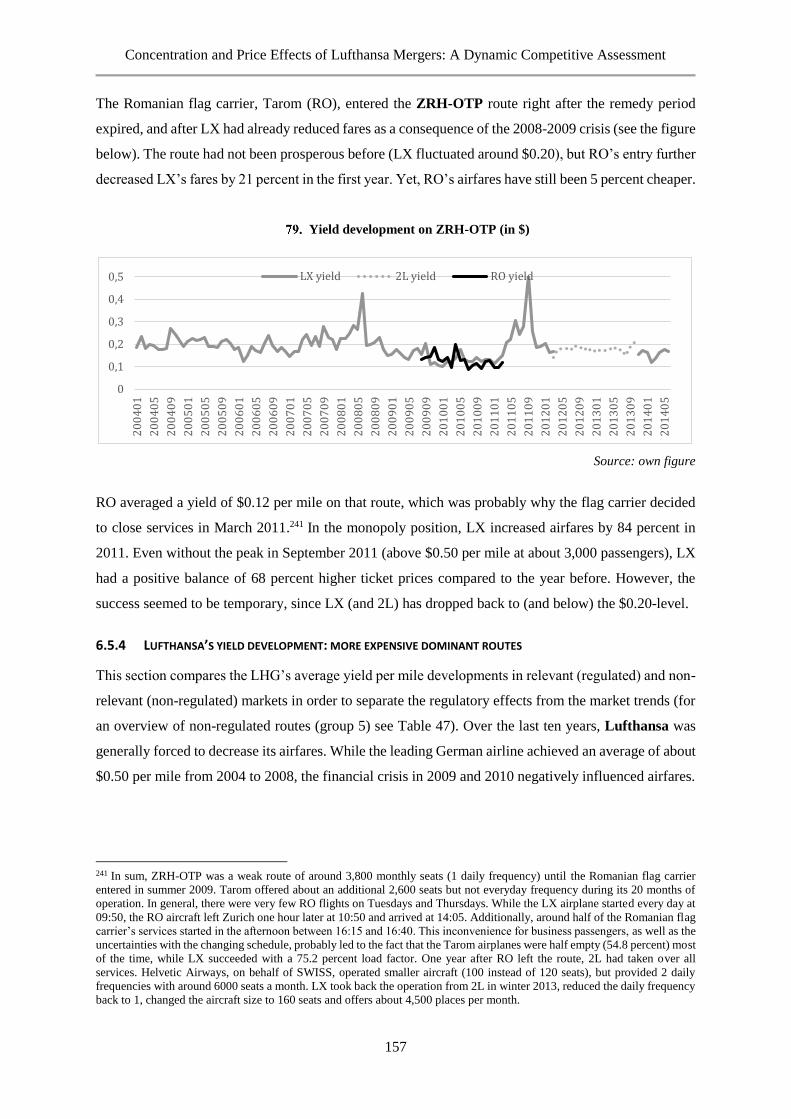
Concentration and Price Effects of Lufthansa Mergers: A Dynamic Competitive Assessment
157
The Romanian flag carrier, Tarom (RO), entered the ZRH-OTP route right after the remedy period
expired, and after LX had already reduced fares as a consequence of the 2008-2009 crisis (see the figure
below). The route had not been prosperous before (LX fluctuated around $0.20), but RO’s entry further
decreased LX’s fares by 21 percent in the first year. Yet, RO’s airfares have still been 5 percent cheaper.
Yield development on ZRH-OTP (in $)
Source: own figure
RO averaged a yield of $0.12 per mile on that route, which was probably why the flag carrier decided
to close services in March 2011.241 In the monopoly position, LX increased airfares by 84 percent in
2011. Even without the peak in September 2011 (above $0.50 per mile at about 3,000 passengers), LX
had a positive balance of 68 percent higher ticket prices compared to the year before. However, the
success seemed to be temporary, since LX (and 2L) has dropped back to (and below) the $0.20-level.
6.5.4 LUFTHANSA’S YIELD DEVELOPMENT: MORE EXPENSIVE DOMINANT ROUTES
This section compares the LHG’s average yield per mile developments in relevant (regulated) and non-
relevant (non-regulated) markets in order to separate the regulatory effects from the market trends (for
an overview of non-regulated routes (group 5) see Table 47). Over the last ten years, Lufthansa was
generally forced to decrease its airfares. While the leading German airline achieved an average of about
$0.50 per mile from 2004 to 2008, the financial crisis in 2009 and 2010 negatively influenced airfares.
241 In sum, ZRH-OTP was a weak route of around 3,800 monthly seats (1 daily frequency) until the Romanian flag carrier
entered in summer 2009. Tarom offered about an additional 2,600 seats but not everyday frequency during its 20 months of
operation. In general, there were very few RO flights on Tuesdays and Thursdays. While the LX airplane started every day at
09:50, the RO aircraft left Zurich one hour later at 10:50 and arrived at 14:05. Additionally, around half of the Romanian flag
carrier’s services started in the afternoon between 16:15 and 16:40. This inconvenience for business passengers, as well as the
uncertainties with the changing schedule, probably led to the fact that the Tarom airplanes were half empty (54.8 percent) most
of the time, while LX succeeded with a 75.2 percent load factor. One year after RO left the route, 2L had taken over all
services. Helvetic Airways, on behalf of SWISS, operated smaller aircraft (100 instead of 120 seats), but provided 2 daily
frequencies with around 6000 seats a month. LX took back the operation from 2L in winter 2013, reduced the daily frequency
back to 1, changed the aircraft size to 160 seats and offers about 4,500 places per month.
0
0,1
0,2
0,3
0,4
0,5
20
04
01
20
04
05
20
04
09
20
05
01
20
05
05
20
05
09
20
06
01
20
06
05
20
06
09
20
07
01
20
07
05
20
07
09
20
08
01
20
08
05
20
08
09
20
09
01
20
09
05
20
09
09
20
10
01
20
10
05
20
10
09
20
11
01
20
11
05
20
11
09
20
12
01
20
12
05
20
12
09
20
13
01
20
13
05
20
13
09
20
14
01
20
14
05
LX yield 2L yield RO yield
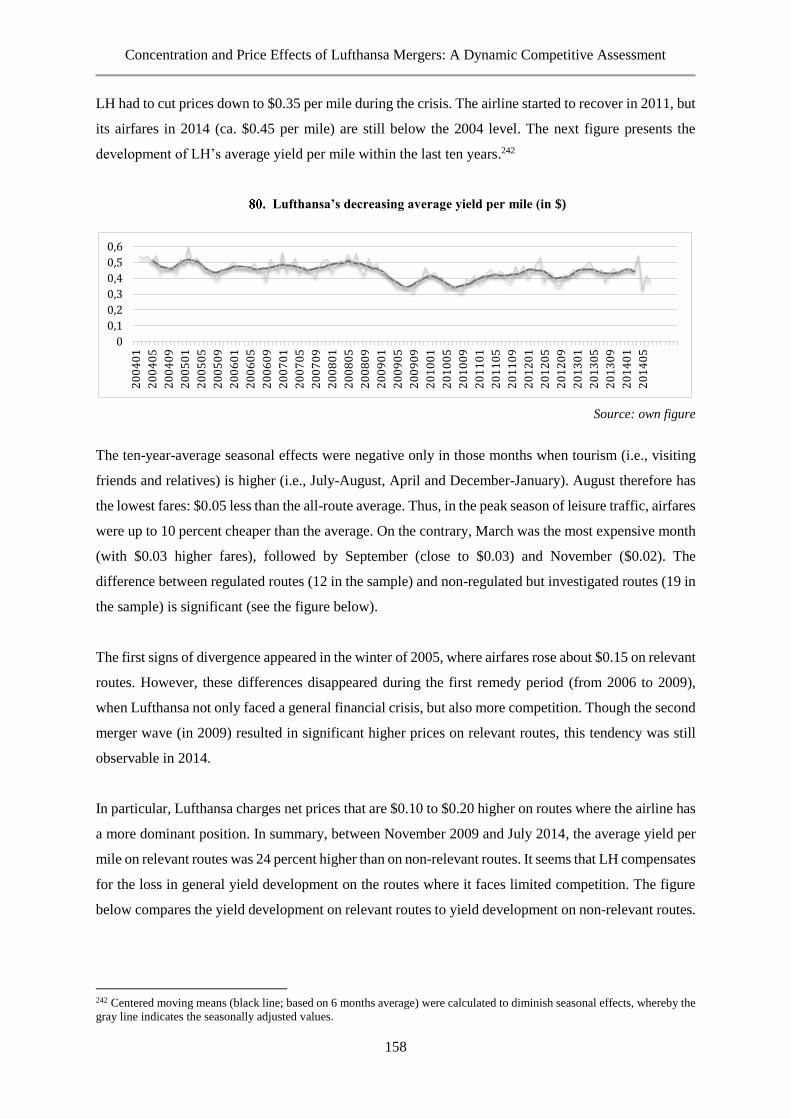
Concentration and Price Effects of Lufthansa Mergers: A Dynamic Competitive Assessment
158
LH had to cut prices down to $0.35 per mile during the crisis. The airline started to recover in 2011, but
its airfares in 2014 (ca. $0.45 per mile) are still below the 2004 level. The next figure presents the
development of LH’s average yield per mile within the last ten years.242
Lufthansa’s decreasing average yield per mile (in $)
Source: own figure
The ten-year-average seasonal effects were negative only in those months when tourism (i.e., visiting
friends and relatives) is higher (i.e., July-August, April and December-January). August therefore has
the lowest fares: $0.05 less than the all-route average. Thus, in the peak season of leisure traffic, airfares
were up to 10 percent cheaper than the average. On the contrary, March was the most expensive month
(with $0.03 higher fares), followed by September (close to $0.03) and November ($0.02). The
difference between regulated routes (12 in the sample) and non-regulated but investigated routes (19 in
the sample) is significant (see the figure below).
The first signs of divergence appeared in the winter of 2005, where airfares rose about $0.15 on relevant
routes. However, these differences disappeared during the first remedy period (from 2006 to 2009),
when Lufthansa not only faced a general financial crisis, but also more competition. Though the second
merger wave (in 2009) resulted in significant higher prices on relevant routes, this tendency was still
observable in 2014.
In particular, Lufthansa charges net prices that are $0.10 to $0.20 higher on routes where the airline has
a more dominant position. In summary, between November 2009 and July 2014, the average yield per
mile on relevant routes was 24 percent higher than on non-relevant routes. It seems that LH compensates
for the loss in general yield development on the routes where it faces limited competition. The figure
below compares the yield development on relevant routes to yield development on non-relevant routes.
242 Centered moving means (black line; based on 6 months average) were calculated to diminish seasonal effects, whereby the
gray line indicates the seasonally adjusted values.
0
0,1
0,2
0,3
0,4
0,5
0,6
20
04
01
20
04
05
20
04
09
20
05
01
20
05
05
20
05
09
20
06
01
20
06
05
20
06
09
20
07
01
20
07
05
20
07
09
20
08
01
20
08
05
20
08
09
20
09
01
20
09
05
20
09
09
20
10
01
20
10
05
20
10
09
20
11
01
20
11
05
20
11
09
20
12
01
20
12
05
20
12
09
20
13
01
20
13
05
20
13
09
20
14
01
20
14
05
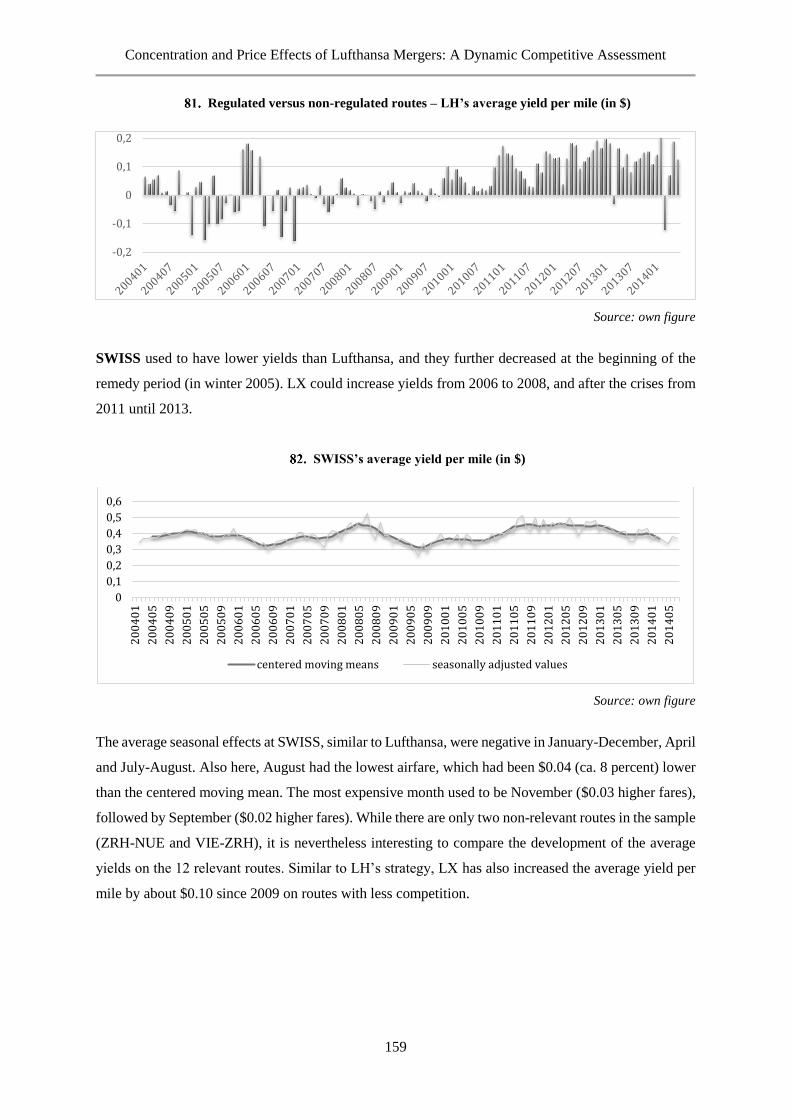
Concentration and Price Effects of Lufthansa Mergers: A Dynamic Competitive Assessment
159
Regulated versus non-regulated routes – LH’s average yield per mile (in $)
Source: own figure
SWISS used to have lower yields than Lufthansa, and they further decreased at the beginning of the
remedy period (in winter 2005). LX could increase yields from 2006 to 2008, and after the crises from
2011 until 2013.
SWISS’s average yield per mile (in $)
Source: own figure
The average seasonal effects at SWISS, similar to Lufthansa, were negative in January-December, April
and July-August. Also here, August had the lowest airfare, which had been $0.04 (ca. 8 percent) lower
than the centered moving mean. The most expensive month used to be November ($0.03 higher fares),
followed by September ($0.02 higher fares). While there are only two non-relevant routes in the sample
(ZRH-NUE and VIE-ZRH), it is nevertheless interesting to compare the development of the average
yields on the 12 relevant routes. Similar to LH’s strategy, LX has also increased the average yield per
mile by about $0.10 since 2009 on routes with less competition.
-0,2
-0,1
0
0,1
0,2
0
0,1
0,2
0,3
0,4
0,5
0,6
20
04
01
20
04
05
20
04
09
20
05
01
20
05
05
20
05
09
20
06
01
20
06
05
20
06
09
20
07
01
20
07
05
20
07
09
20
08
01
20
08
05
20
08
09
20
09
01
20
09
05
20
09
09
20
10
01
20
10
05
20
10
09
20
11
01
20
11
05
20
11
09
20
12
01
20
12
05
20
12
09
20
13
01
20
13
05
20
13
09
20
14
01
20
14
05
centered moving means seasonally adjusted values
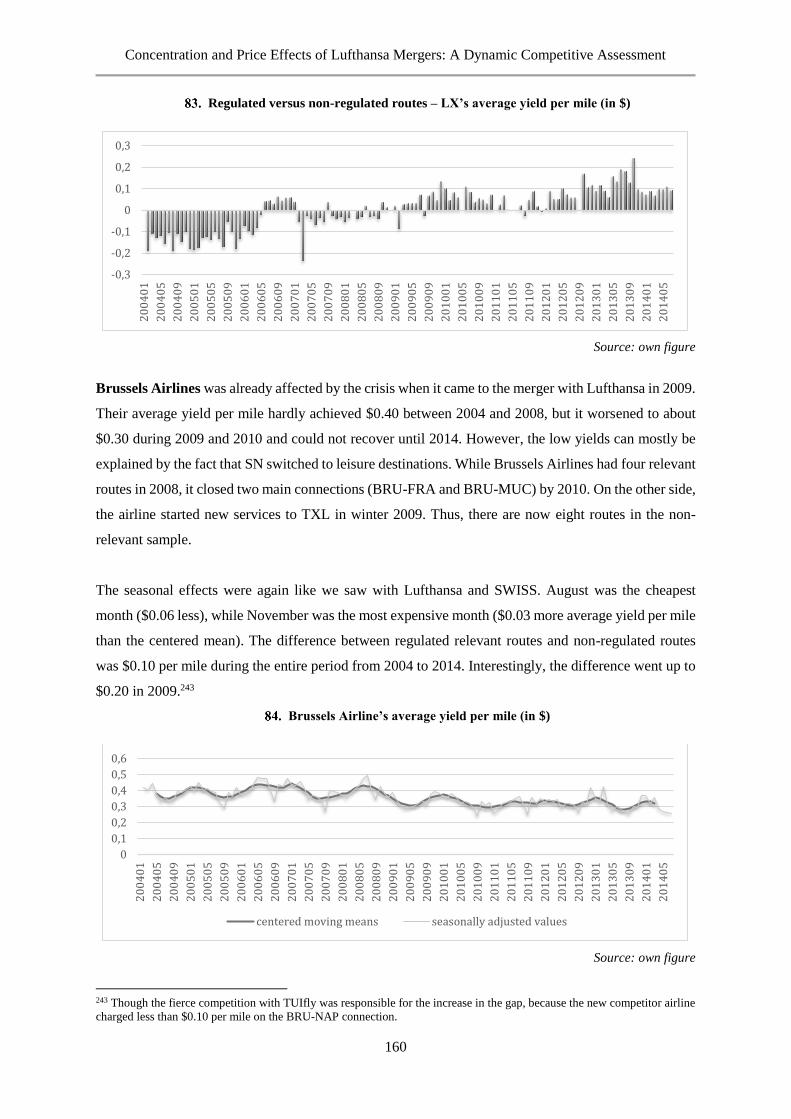
Concentration and Price Effects of Lufthansa Mergers: A Dynamic Competitive Assessment
160
Regulated versus non-regulated routes – LX’s average yield per mile (in $)
Source: own figure
Brussels Airlines was already affected by the crisis when it came to the merger with Lufthansa in 2009.
Their average yield per mile hardly achieved $0.40 between 2004 and 2008, but it worsened to about
$0.30 during 2009 and 2010 and could not recover until 2014. However, the low yields can mostly be
explained by the fact that SN switched to leisure destinations. While Brussels Airlines had four relevant
routes in 2008, it closed two main connections (BRU-FRA and BRU-MUC) by 2010. On the other side,
the airline started new services to TXL in winter 2009. Thus, there are now eight routes in the non-
relevant sample.
The seasonal effects were again like we saw with Lufthansa and SWISS. August was the cheapest
month ($0.06 less), while November was the most expensive month ($0.03 more average yield per mile
than the centered mean). The difference between regulated relevant routes and non-regulated routes
was $0.10 per mile during the entire period from 2004 to 2014. Interestingly, the difference went up to
$0.20 in 2009.243
Brussels Airline’s average yield per mile (in $)
Source: own figure
243 Though the fierce competition with TUIfly was responsible for the increase in the gap, because the new competitor airline
charged less than $0.10 per mile on the BRU-NAP connection.
-0,3
-0,2
-0,1
0
0,1
0,2
0,32
00
40
1
20
04
05
20
04
09
20
05
01
20
05
05
20
05
09
20
06
01
20
06
05
20
06
09
20
07
01
20
07
05
20
07
09
20
08
01
20
08
05
20
08
09
20
09
01
20
09
05
20
09
09
20
10
01
20
10
05
20
10
09
20
11
01
20
11
05
20
11
09
20
12
01
20
12
05
20
12
09
20
13
01
20
13
05
20
13
09
20
14
01
20
14
05
0
0,1
0,2
0,3
0,4
0,5
0,6
20
04
01
20
04
05
20
04
09
20
05
01
20
05
05
20
05
09
20
06
01
20
06
05
20
06
09
20
07
01
20
07
05
20
07
09
20
08
01
20
08
05
20
08
09
20
09
01
20
09
05
20
09
09
20
10
01
20
10
05
20
10
09
20
11
01
20
11
05
20
11
09
20
12
01
20
12
05
20
12
09
20
13
01
20
13
05
20
13
09
20
14
01
20
14
05
centered moving means seasonally adjusted values
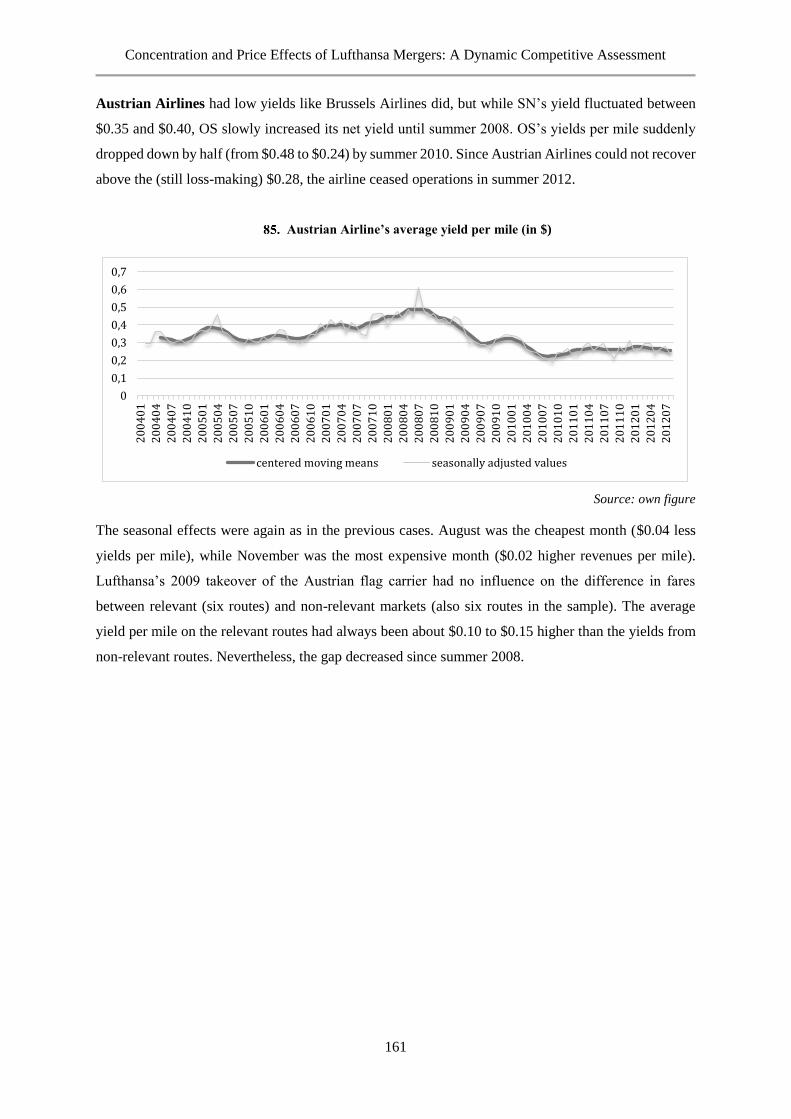
Concentration and Price Effects of Lufthansa Mergers: A Dynamic Competitive Assessment
161
Austrian Airlines had low yields like Brussels Airlines did, but while SN’s yield fluctuated between
$0.35 and $0.40, OS slowly increased its net yield until summer 2008. OS’s yields per mile suddenly
dropped down by half (from $0.48 to $0.24) by summer 2010. Since Austrian Airlines could not recover
above the (still loss-making) $0.28, the airline ceased operations in summer 2012.
Austrian Airline’s average yield per mile (in $)
Source: own figure
The seasonal effects were again as in the previous cases. August was the cheapest month ($0.04 less
yields per mile), while November was the most expensive month ($0.02 higher revenues per mile).
Lufthansa’s 2009 takeover of the Austrian flag carrier had no influence on the difference in fares
between relevant (six routes) and non-relevant markets (also six routes in the sample). The average
yield per mile on the relevant routes had always been about $0.10 to $0.15 higher than the yields from
non-relevant routes. Nevertheless, the gap decreased since summer 2008.
0
0,1
0,2
0,3
0,4
0,5
0,6
0,7
20
04
01
20
04
04
20
04
07
20
04
10
20
05
01
20
05
04
20
05
07
20
05
10
20
06
01
20
06
04
20
06
07
20
06
10
20
07
01
20
07
04
20
07
07
20
07
10
20
08
01
20
08
04
20
08
07
20
08
10
20
09
01
20
09
04
20
09
07
20
09
10
20
10
01
20
10
04
20
10
07
20
10
10
20
11
01
20
11
04
20
11
07
20
11
10
20
12
01
20
12
04
20
12
07
centered moving means seasonally adjusted values
Concentration and Price Effects of Lufthansa Mergers: A Dynamic Competitive Assessment
162
6.5.5 SUMMARY OF THE RESULTS ON MARKET POWER ANALYSIS
Section 6.5 concentrated on probable monopoly pricing and capacity cuts on routes where Lufthansa
remained in the dominant position. The analyzed events are not necessarily merger-specific, but
illustrate a situation that becomes more probable as the market becomes more concentrated.
Air Berlin’s exit from ZRH-HAM (in 2011) and ZRH-HAJ (in 2012) resulted in a monopoly by the
Lufthansa Group, a capacity cut and an immediate price increase with it (Section 6.5.1). The merger of
SN and LH also resulted in less capacity and higher prices on the newly monopolized routes between
Brussels and Germany. The former flag carrier, SN Brussels, disappeared from the schedule of the hub-
to-hub connections BRU-ZRH and BRU-MUC. Thus, Lufthansa had taken over the strategic most
important routes. SN became a monopoly on BRU-HAM, dropped the frequency by half and, in the
absence of competition, increased prices by 31 percent (Section 6.5.2).
Section 6.5.3 presented evidence that smaller airlines (e.g., regional, flag or low-cost carriers) on the
relevant routes used to have two alternatives: partnership or bankruptcy. Being an operating carrier on
behalf of the LHG offers a certain security against insolvency, but losing the cooperation can quickly
lead to failure (e.g., Contact Air). If competition becomes stronger, there is an increased risk that flag
carriers, such as LOT or Tarom, will have to cease operation.
Summarizing the results of Section 6.5.4, LH and LX successfully recovered after the 2009 and 2010
crises; SN stabilized its fares at a slightly lower level, and OS could not recover and closed operation
in 2012. LH was the most expensive airline with a ten-year average of $0.44 per mile, followed by LX
at $0.39, SN at $0.35 and OS at $0.34. Airfares were particularly negatively affected by leisure
competition in August, which was most significant at LX. November seems to be the most prosperous
month for all the airlines.
The indirect impact of regulation can be distinguished by comparing routes in groups 1, 2, 3, 4 to routes
in group 5. Lufthansa and SWISS, in the absence of additional competition on the relevant routes, were
charging about $0.10 higher yields per mile. Given the relatively low yields in the industry, that means
around 20 to 25 percent more expensive airline tickets on the routes where the merged entity
significantly increased concentration, the ‘relevant routes.’
The results from section 6.5 may also serve as first evidence that merger-specific efficiencies (if any)
are not passed through to consumers in the form of cheaper ticket prices.
Concentration and Price Effects of Lufthansa Mergers: A Dynamic Competitive Assessment
163
6.6 CONCLUSIONS
Chapter 6 concentrated on the failure of regulating market power by evaluating the changes in
Lufthansa’s competitive environment affected by the mergers between 2004 and 2014. The study
focused on four takeovers: SWISS, Eurowings, Brussels and Austrian Airlines. It analyzed the merged
airline’s market share, frequency, capacity and pricing on 21 relevant routes defined by the European
Commission.
The chapter introduced the idea that the EC’s priority aim (i.e., to maintain competition) was in conflict
with Lufthansa’s goal to reduce competition and become the market leader. Section 6.2 showed that the
tendency in Lufthansa’s competitive environment was either to enter into a cooperation agreement (and
become part of the LHG) or to exit the market.
Section 6.3 showed that remedies, which should have reduced the LHG’s high concentration due to its
mergers, had limited success in stimulating new entry. The study found that although Lufthansa did not
deviate from the EC rulings on frequency freeze, the airline increased capacity instead. Further, price
freeze remedies in the current form are a ‘gray area’ and should be more precisely defined and
controlled by the EC.
Section 6.4 provided evidence that Lufthansa predated and foreclosed the rival on ZRH-FRA and VIE-
CGN after Air Berlin entered. Capacity increases (despite the frequency freeze remedy) might have
been predatory and probably induced the exit of Air Berlin. Thus, the LHG (ab)used market power to
prevent entries and forced rivals’ exit through strategic capacity increases and/or predatory pricing. The
contestability argument failed on the routes with new entry because of net ticket prices have been
probable below marginal costs (e.g., on the VIE-STR route, Air Berlin operated with only $0.08 per
mile, while AB’s average yield on other routes was more than $0.30 per mile in the same period of
summer 2007). There was no evidence of a hit-and-run strategy.
Section 6.5 investigated the LHG’s price and capacity strategies on dominant routes and found
significant price differences (about 15 to 32 percent) due to high concentration. Sudden frequency or
capacity cuts accrued after rivals left the routes (e.g., ZRH-FRA, VIE-CGN, ZRH-HAM, ZRH-HAJ),
which might prove the DoT’s argument that LHG flooded the market with low-fare overcapacity until
the competitor exits.
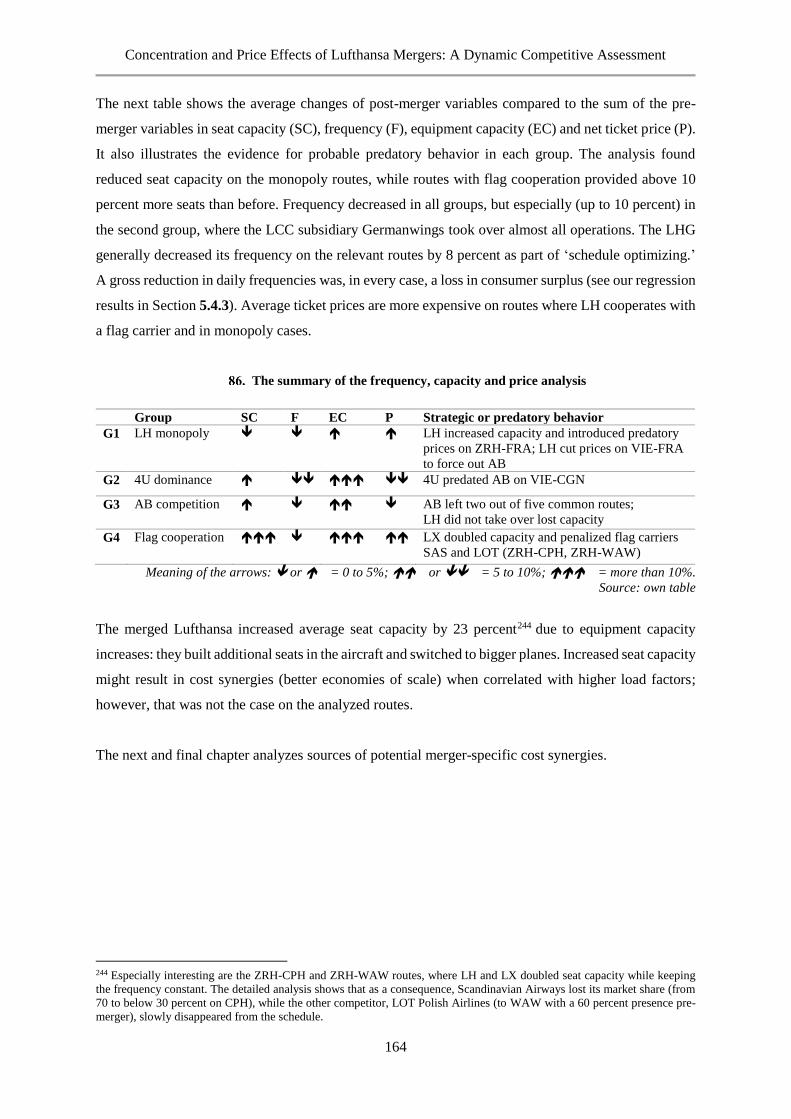
Concentration and Price Effects of Lufthansa Mergers: A Dynamic Competitive Assessment
164
The next table shows the average changes of post-merger variables compared to the sum of the pre-
merger variables in seat capacity (SC), frequency (F), equipment capacity (EC) and net ticket price (P).
It also illustrates the evidence for probable predatory behavior in each group. The analysis found
reduced seat capacity on the monopoly routes, while routes with flag cooperation provided above 10
percent more seats than before. Frequency decreased in all groups, but especially (up to 10 percent) in
the second group, where the LCC subsidiary Germanwings took over almost all operations. The LHG
generally decreased its frequency on the relevant routes by 8 percent as part of ‘schedule optimizing.’
A gross reduction in daily frequencies was, in every case, a loss in consumer surplus (see our regression
results in Section 5.4.3). Average ticket prices are more expensive on routes where LH cooperates with
a flag carrier and in monopoly cases.
The summary of the frequency, capacity and price analysis
Group SC F EC P Strategic or predatory behavior
G1 LH monopoly LH increased capacity and introduced predatory
prices on ZRH-FRA; LH cut prices on VIE-FRA
to force out AB
G2 4U dominance 4U predated AB on VIE-CGN
G3 AB competition AB left two out of five common routes;
LH did not take over lost capacity
G4 Flag cooperation LX doubled capacity and penalized flag carriers
SAS and LOT (ZRH-CPH, ZRH-WAW)
Meaning of the arrows: or = 0 to 5%; or = 5 to 10%; = more than 10%.
Source: own table
The merged Lufthansa increased average seat capacity by 23 percent244 due to equipment capacity
increases: they built additional seats in the aircraft and switched to bigger planes. Increased seat capacity
might result in cost synergies (better economies of scale) when correlated with higher load factors;
however, that was not the case on the analyzed routes.
The next and final chapter analyzes sources of potential merger-specific cost synergies.
244 Especially interesting are the ZRH-CPH and ZRH-WAW routes, where LH and LX doubled seat capacity while keeping
the frequency constant. The detailed analysis shows that as a consequence, Scandinavian Airways lost its market share (from
70 to below 30 percent on CPH), while the other competitor, LOT Polish Airlines (to WAW with a 60 percent presence pre-
merger), slowly disappeared from the schedule.
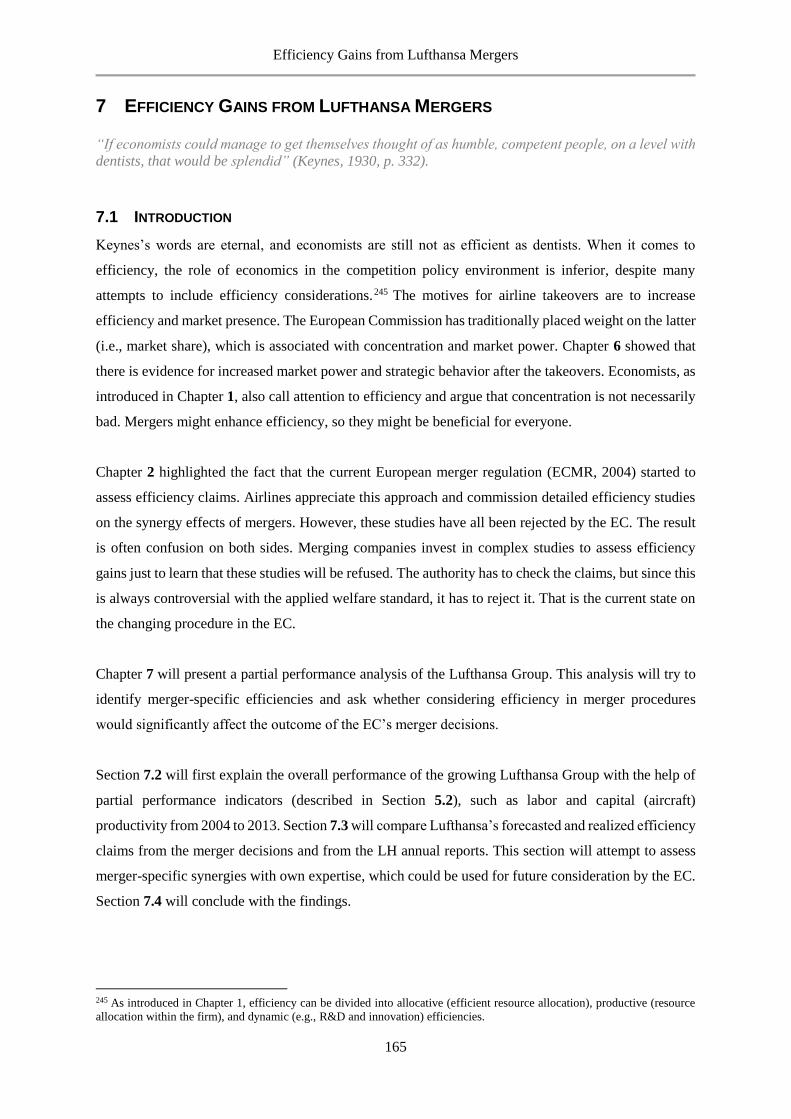
Efficiency Gains from Lufthansa Mergers
165
7 EFFICIENCY GAINS FROM LUFTHANSA MERGERS
“If economists could manage to get themselves thought of as humble, competent people, on a level with
dentists, that would be splendid” (Keynes, 1930, p. 332).
7.1 INTRODUCTION
Keynes’s words are eternal, and economists are still not as efficient as dentists. When it comes to
efficiency, the role of economics in the competition policy environment is inferior, despite many
attempts to include efficiency considerations.245 The motives for airline takeovers are to increase
efficiency and market presence. The European Commission has traditionally placed weight on the latter
(i.e., market share), which is associated with concentration and market power. Chapter 6 showed that
there is evidence for increased market power and strategic behavior after the takeovers. Economists, as
introduced in Chapter 1, also call attention to efficiency and argue that concentration is not necessarily
bad. Mergers might enhance efficiency, so they might be beneficial for everyone.
Chapter 2 highlighted the fact that the current European merger regulation (ECMR, 2004) started to
assess efficiency claims. Airlines appreciate this approach and commission detailed efficiency studies
on the synergy effects of mergers. However, these studies have all been rejected by the EC. The result
is often confusion on both sides. Merging companies invest in complex studies to assess efficiency
gains just to learn that these studies will be refused. The authority has to check the claims, but since this
is always controversial with the applied welfare standard, it has to reject it. That is the current state on
the changing procedure in the EC.
Chapter 7 will present a partial performance analysis of the Lufthansa Group. This analysis will try to
identify merger-specific efficiencies and ask whether considering efficiency in merger procedures
would significantly affect the outcome of the EC’s merger decisions.
Section 7.2 will first explain the overall performance of the growing Lufthansa Group with the help of
partial performance indicators (described in Section 5.2), such as labor and capital (aircraft)
productivity from 2004 to 2013. Section 7.3 will compare Lufthansa’s forecasted and realized efficiency
claims from the merger decisions and from the LH annual reports. This section will attempt to assess
merger-specific synergies with own expertise, which could be used for future consideration by the EC.
Section 7.4 will conclude with the findings.
245 As introduced in Chapter 1, efficiency can be divided into allocative (efficient resource allocation), productive (resource
allocation within the firm), and dynamic (e.g., R&D and innovation) efficiencies.
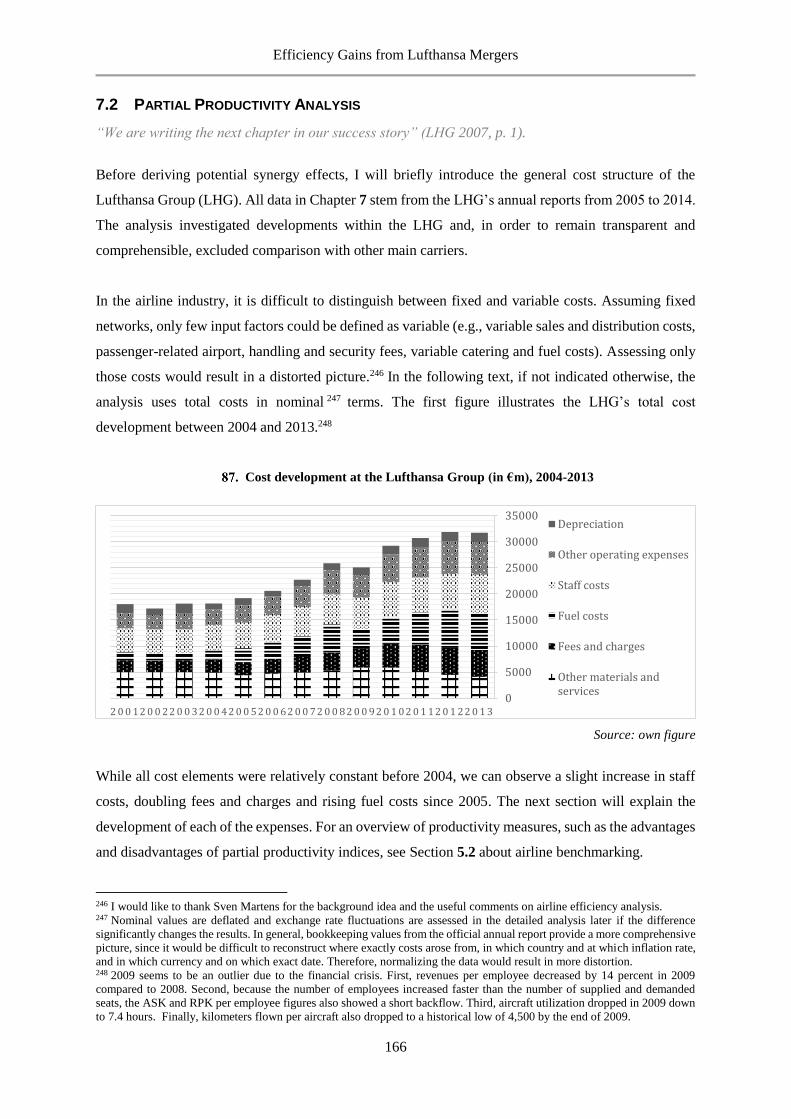
Efficiency Gains from Lufthansa Mergers
166
7.2 PARTIAL PRODUCTIVITY ANALYSIS
“We are writing the next chapter in our success story” (LHG 2007, p. 1).
Before deriving potential synergy effects, I will briefly introduce the general cost structure of the
Lufthansa Group (LHG). All data in Chapter 7 stem from the LHG’s annual reports from 2005 to 2014.
The analysis investigated developments within the LHG and, in order to remain transparent and
comprehensible, excluded comparison with other main carriers.
In the airline industry, it is difficult to distinguish between fixed and variable costs. Assuming fixed
networks, only few input factors could be defined as variable (e.g., variable sales and distribution costs,
passenger-related airport, handling and security fees, variable catering and fuel costs). Assessing only
those costs would result in a distorted picture.246 In the following text, if not indicated otherwise, the
analysis uses total costs in nominal 247 terms. The first figure illustrates the LHG’s total cost
development between 2004 and 2013.248
Cost development at the Lufthansa Group (in €m), 2004-2013
Source: own figure
While all cost elements were relatively constant before 2004, we can observe a slight increase in staff
costs, doubling fees and charges and rising fuel costs since 2005. The next section will explain the
development of each of the expenses. For an overview of productivity measures, such as the advantages
and disadvantages of partial productivity indices, see Section 5.2 about airline benchmarking.
246 I would like to thank Sven Martens for the background idea and the useful comments on airline efficiency analysis. 247 Nominal values are deflated and exchange rate fluctuations are assessed in the detailed analysis later if the difference
significantly changes the results. In general, bookkeeping values from the official annual report provide a more comprehensive
picture, since it would be difficult to reconstruct where exactly costs arose from, in which country and at which inflation rate,
and in which currency and on which exact date. Therefore, normalizing the data would result in more distortion. 248 2009 seems to be an outlier due to the financial crisis. First, revenues per employee decreased by 14 percent in 2009
compared to 2008. Second, because the number of employees increased faster than the number of supplied and demanded
seats, the ASK and RPK per employee figures also showed a short backflow. Third, aircraft utilization dropped in 2009 down
to 7.4 hours. Finally, kilometers flown per aircraft also dropped to a historical low of 4,500 by the end of 2009.
0
5000
10000
15000
20000
25000
30000
35000
2 0 1 32 0 1 22 0 1 12 0 1 02 0 0 92 0 0 82 0 0 72 0 0 62 0 0 52 0 0 42 0 0 32 0 0 22 0 0 1
Depreciation
Other operating expenses
Staff costs
Fuel costs
Fees and charges
Other materials andservices
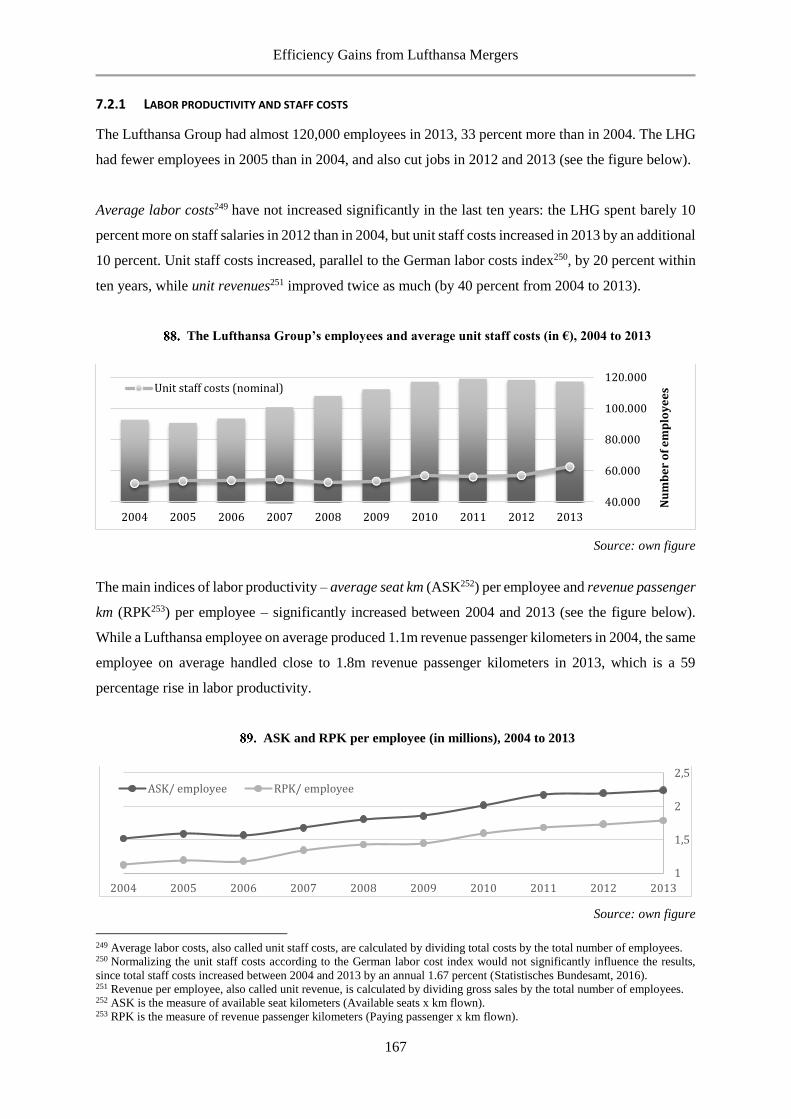
Efficiency Gains from Lufthansa Mergers
167
7.2.1 LABOR PRODUCTIVITY AND STAFF COSTS
The Lufthansa Group had almost 120,000 employees in 2013, 33 percent more than in 2004. The LHG
had fewer employees in 2005 than in 2004, and also cut jobs in 2012 and 2013 (see the figure below).
Average labor costs249 have not increased significantly in the last ten years: the LHG spent barely 10
percent more on staff salaries in 2012 than in 2004, but unit staff costs increased in 2013 by an additional
10 percent. Unit staff costs increased, parallel to the German labor costs index250, by 20 percent within
ten years, while unit revenues251 improved twice as much (by 40 percent from 2004 to 2013).
The Lufthansa Group’s employees and average unit staff costs (in €), 2004 to 2013
Source: own figure
The main indices of labor productivity – average seat km (ASK252) per employee and revenue passenger
km (RPK253) per employee – significantly increased between 2004 and 2013 (see the figure below).
While a Lufthansa employee on average produced 1.1m revenue passenger kilometers in 2004, the same
employee on average handled close to 1.8m revenue passenger kilometers in 2013, which is a 59
percentage rise in labor productivity.
ASK and RPK per employee (in millions), 2004 to 2013
Source: own figure
249 Average labor costs, also called unit staff costs, are calculated by dividing total costs by the total number of employees. 250 Normalizing the unit staff costs according to the German labor cost index would not significantly influence the results,
since total staff costs increased between 2004 and 2013 by an annual 1.67 percent (Statistisches Bundesamt, 2016). 251 Revenue per employee, also called unit revenue, is calculated by dividing gross sales by the total number of employees. 252 ASK is the measure of available seat kilometers (Available seats x km flown). 253 RPK is the measure of revenue passenger kilometers (Paying passenger x km flown).
40.000
60.000
80.000
100.000
120.000
2013201220112010200920082007200620052004
Nu
mb
er
of
em
plo
ye
esUnit staff costs (nominal)
1
1,5
2
2,5
2004 2005 2006 2007 2008 2009 2010 2011 2012 2013
ASK/ employee RPK/ employee
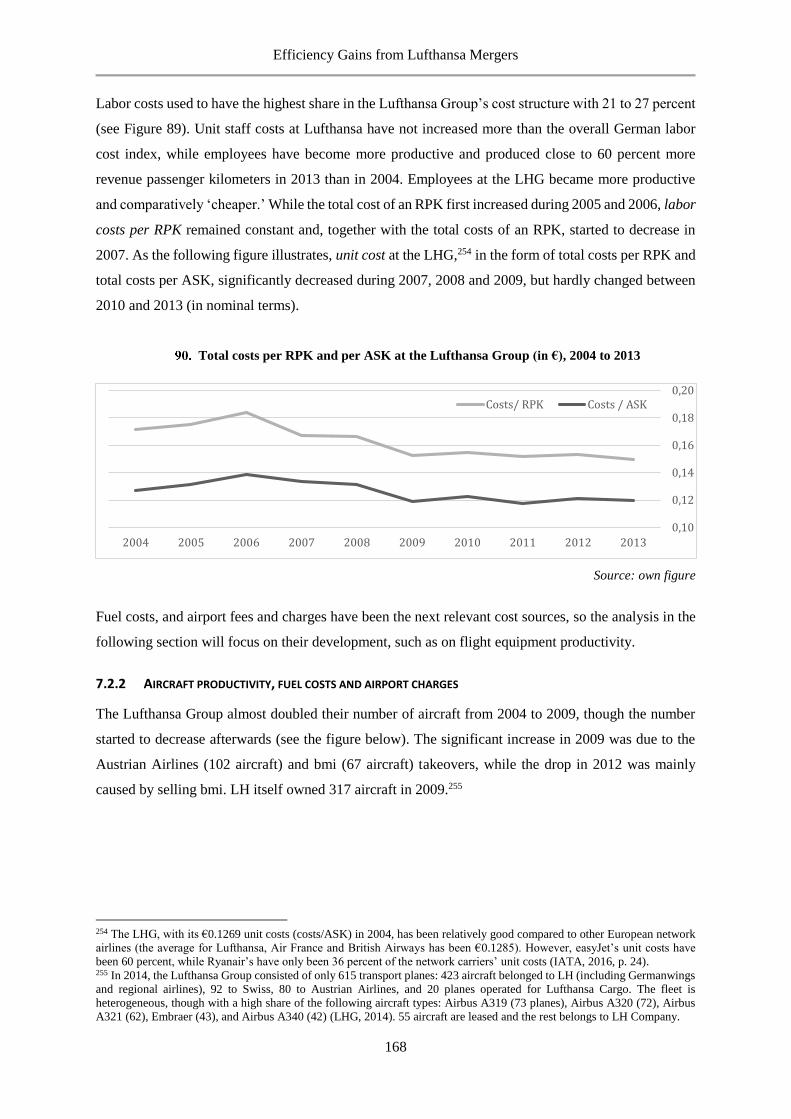
Efficiency Gains from Lufthansa Mergers
168
Labor costs used to have the highest share in the Lufthansa Group’s cost structure with 21 to 27 percent
(see Figure 89). Unit staff costs at Lufthansa have not increased more than the overall German labor
cost index, while employees have become more productive and produced close to 60 percent more
revenue passenger kilometers in 2013 than in 2004. Employees at the LHG became more productive
and comparatively ‘cheaper.’ While the total cost of an RPK first increased during 2005 and 2006, labor
costs per RPK remained constant and, together with the total costs of an RPK, started to decrease in
2007. As the following figure illustrates, unit cost at the LHG,254 in the form of total costs per RPK and
total costs per ASK, significantly decreased during 2007, 2008 and 2009, but hardly changed between
2010 and 2013 (in nominal terms).
Total costs per RPK and per ASK at the Lufthansa Group (in €), 2004 to 2013
Source: own figure
Fuel costs, and airport fees and charges have been the next relevant cost sources, so the analysis in the
following section will focus on their development, such as on flight equipment productivity.
7.2.2 AIRCRAFT PRODUCTIVITY, FUEL COSTS AND AIRPORT CHARGES
The Lufthansa Group almost doubled their number of aircraft from 2004 to 2009, though the number
started to decrease afterwards (see the figure below). The significant increase in 2009 was due to the
Austrian Airlines (102 aircraft) and bmi (67 aircraft) takeovers, while the drop in 2012 was mainly
caused by selling bmi. LH itself owned 317 aircraft in 2009.255
254 The LHG, with its €0.1269 unit costs (costs/ASK) in 2004, has been relatively good compared to other European network
airlines (the average for Lufthansa, Air France and British Airways has been €0.1285). However, easyJet’s unit costs have
been 60 percent, while Ryanair’s have only been 36 percent of the network carriers’ unit costs (IATA, 2016, p. 24). 255 In 2014, the Lufthansa Group consisted of only 615 transport planes: 423 aircraft belonged to LH (including Germanwings
and regional airlines), 92 to Swiss, 80 to Austrian Airlines, and 20 planes operated for Lufthansa Cargo. The fleet is
heterogeneous, though with a high share of the following aircraft types: Airbus A319 (73 planes), Airbus A320 (72), Airbus
A321 (62), Embraer (43), and Airbus A340 (42) (LHG, 2014). 55 aircraft are leased and the rest belongs to LH Company.
0,10
0,12
0,14
0,16
0,18
0,20
2013201220112010200920082007200620052004
Costs/ RPK Costs / ASK
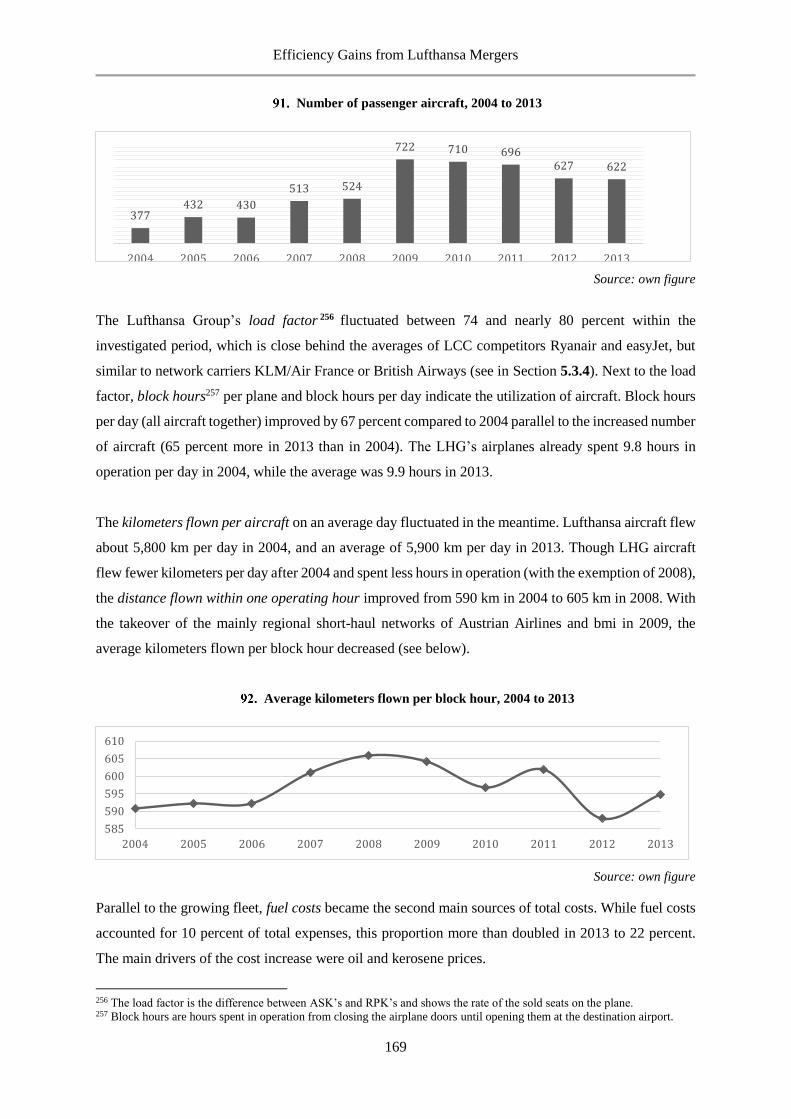
Efficiency Gains from Lufthansa Mergers
169
Number of passenger aircraft, 2004 to 2013
Source: own figure
The Lufthansa Group’s load factor 256 fluctuated between 74 and nearly 80 percent within the
investigated period, which is close behind the averages of LCC competitors Ryanair and easyJet, but
similar to network carriers KLM/Air France or British Airways (see in Section 5.3.4). Next to the load
factor, block hours257 per plane and block hours per day indicate the utilization of aircraft. Block hours
per day (all aircraft together) improved by 67 percent compared to 2004 parallel to the increased number
of aircraft (65 percent more in 2013 than in 2004). The LHG’s airplanes already spent 9.8 hours in
operation per day in 2004, while the average was 9.9 hours in 2013.
The kilometers flown per aircraft on an average day fluctuated in the meantime. Lufthansa aircraft flew
about 5,800 km per day in 2004, and an average of 5,900 km per day in 2013. Though LHG aircraft
flew fewer kilometers per day after 2004 and spent less hours in operation (with the exemption of 2008),
the distance flown within one operating hour improved from 590 km in 2004 to 605 km in 2008. With
the takeover of the mainly regional short-haul networks of Austrian Airlines and bmi in 2009, the
average kilometers flown per block hour decreased (see below).
Average kilometers flown per block hour, 2004 to 2013
Source: own figure
Parallel to the growing fleet, fuel costs became the second main sources of total costs. While fuel costs
accounted for 10 percent of total expenses, this proportion more than doubled in 2013 to 22 percent.
The main drivers of the cost increase were oil and kerosene prices.
256 The load factor is the difference between ASK’s and RPK’s and shows the rate of the sold seats on the plane. 257 Block hours are hours spent in operation from closing the airplane doors until opening them at the destination airport.
622627696710722
524513
430432377
2013201220112010200920082007200620052004
585
590
595
600
605
610
2004 2005 2006 2007 2008 2009 2010 2011 2012 2013
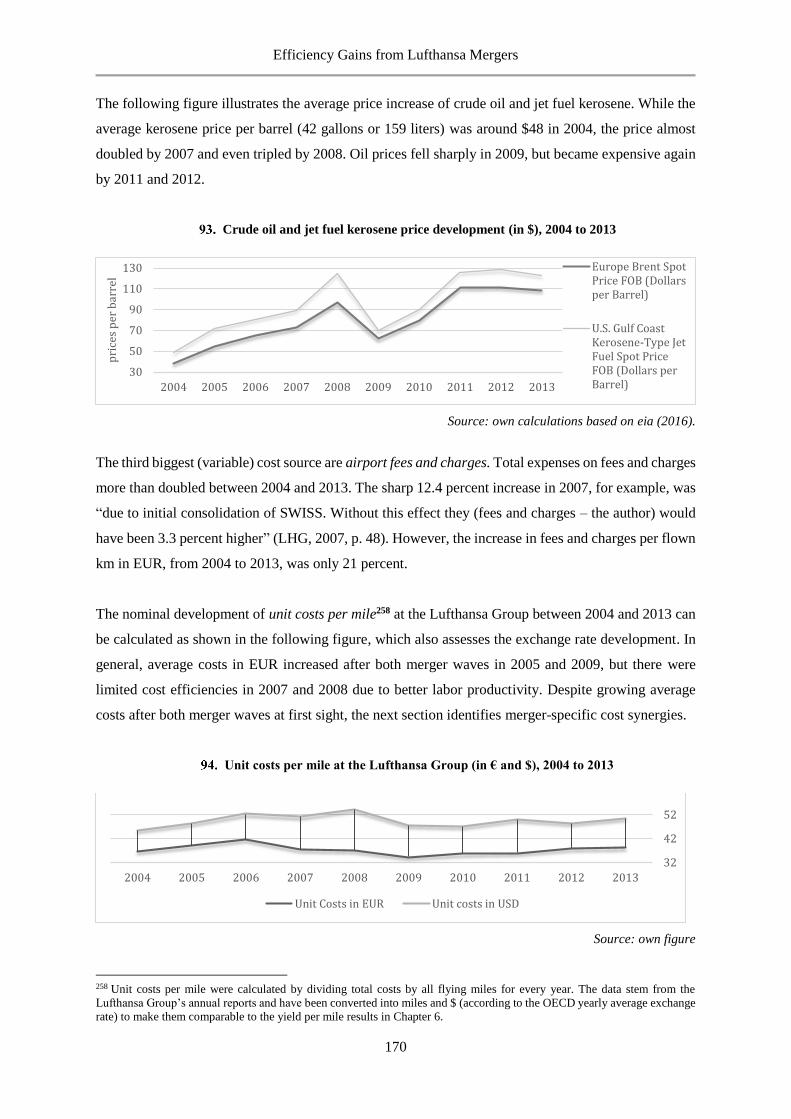
Efficiency Gains from Lufthansa Mergers
170
The following figure illustrates the average price increase of crude oil and jet fuel kerosene. While the
average kerosene price per barrel (42 gallons or 159 liters) was around $48 in 2004, the price almost
doubled by 2007 and even tripled by 2008. Oil prices fell sharply in 2009, but became expensive again
by 2011 and 2012.
Crude oil and jet fuel kerosene price development (in $), 2004 to 2013
Source: own calculations based on eia (2016).
The third biggest (variable) cost source are airport fees and charges. Total expenses on fees and charges
more than doubled between 2004 and 2013. The sharp 12.4 percent increase in 2007, for example, was
“due to initial consolidation of SWISS. Without this effect they (fees and charges – the author) would
have been 3.3 percent higher” (LHG, 2007, p. 48). However, the increase in fees and charges per flown
km in EUR, from 2004 to 2013, was only 21 percent.
The nominal development of unit costs per mile258 at the Lufthansa Group between 2004 and 2013 can
be calculated as shown in the following figure, which also assesses the exchange rate development. In
general, average costs in EUR increased after both merger waves in 2005 and 2009, but there were
limited cost efficiencies in 2007 and 2008 due to better labor productivity. Despite growing average
costs after both merger waves at first sight, the next section identifies merger-specific cost synergies.
Unit costs per mile at the Lufthansa Group (in € and $), 2004 to 2013
Source: own figure
258 Unit costs per mile were calculated by dividing total costs by all flying miles for every year. The data stem from the
Lufthansa Group’s annual reports and have been converted into miles and $ (according to the OECD yearly average exchange
rate) to make them comparable to the yield per mile results in Chapter 6.
30
50
70
90
110
130
2004 2005 2006 2007 2008 2009 2010 2011 2012 2013
pri
ces
per
bar
rel
Europe Brent SpotPrice FOB (Dollarsper Barrel)
U.S. Gulf CoastKerosene-Type JetFuel Spot PriceFOB (Dollars perBarrel)
32
42
52
2013201220112010200920082007200620052004
Unit Costs in EUR Unit costs in USD
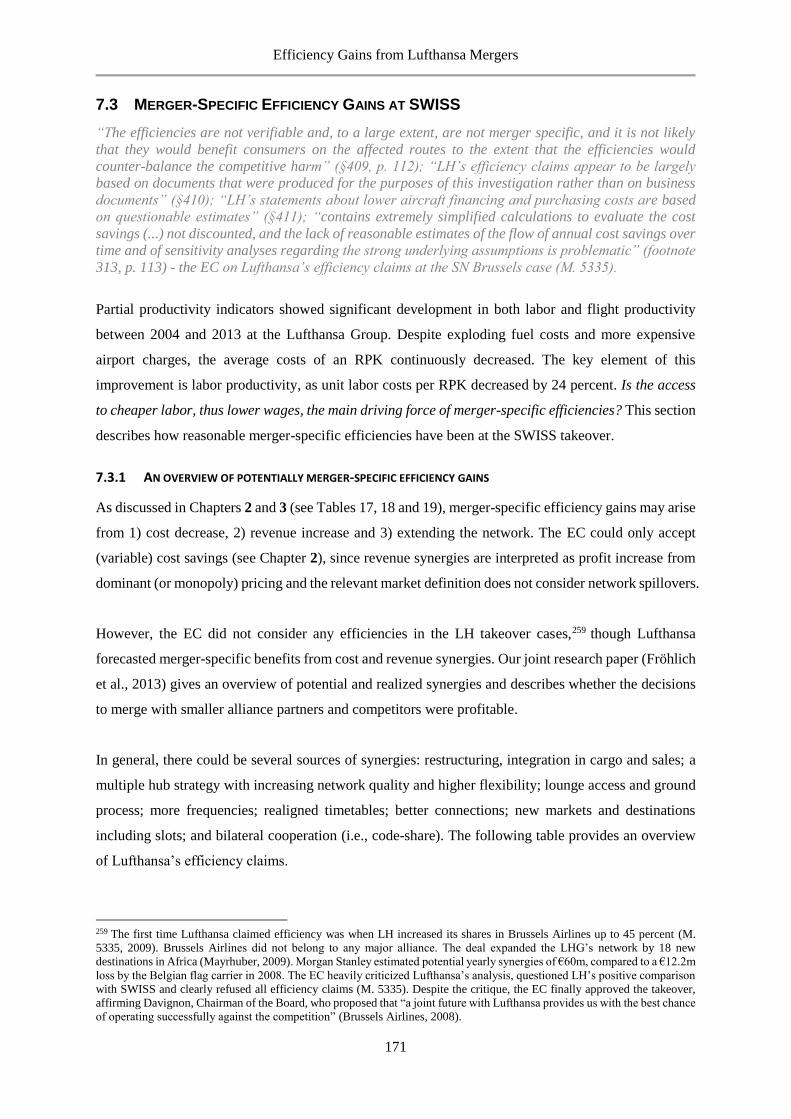
Efficiency Gains from Lufthansa Mergers
171
7.3 MERGER-SPECIFIC EFFICIENCY GAINS AT SWISS
“The efficiencies are not verifiable and, to a large extent, are not merger specific, and it is not likely
that they would benefit consumers on the affected routes to the extent that the efficiencies would
counter-balance the competitive harm” (§409, p. 112); “LH’s efficiency claims appear to be largely
based on documents that were produced for the purposes of this investigation rather than on business
documents” (§410); “LH’s statements about lower aircraft financing and purchasing costs are based
on questionable estimates” (§411); “contains extremely simplified calculations to evaluate the cost
savings (...) not discounted, and the lack of reasonable estimates of the flow of annual cost savings over
time and of sensitivity analyses regarding the strong underlying assumptions is problematic” (footnote
313, p. 113) - the EC on Lufthansa’s efficiency claims at the SN Brussels case (M. 5335).
Partial productivity indicators showed significant development in both labor and flight productivity
between 2004 and 2013 at the Lufthansa Group. Despite exploding fuel costs and more expensive
airport charges, the average costs of an RPK continuously decreased. The key element of this
improvement is labor productivity, as unit labor costs per RPK decreased by 24 percent. Is the access
to cheaper labor, thus lower wages, the main driving force of merger-specific efficiencies? This section
describes how reasonable merger-specific efficiencies have been at the SWISS takeover.
7.3.1 AN OVERVIEW OF POTENTIALLY MERGER-SPECIFIC EFFICIENCY GAINS
As discussed in Chapters 2 and 3 (see Tables 17, 18 and 19), merger-specific efficiency gains may arise
from 1) cost decrease, 2) revenue increase and 3) extending the network. The EC could only accept
(variable) cost savings (see Chapter 2), since revenue synergies are interpreted as profit increase from
dominant (or monopoly) pricing and the relevant market definition does not consider network spillovers.
However, the EC did not consider any efficiencies in the LH takeover cases,259 though Lufthansa
forecasted merger-specific benefits from cost and revenue synergies. Our joint research paper (Fröhlich
et al., 2013) gives an overview of potential and realized synergies and describes whether the decisions
to merge with smaller alliance partners and competitors were profitable.
In general, there could be several sources of synergies: restructuring, integration in cargo and sales; a
multiple hub strategy with increasing network quality and higher flexibility; lounge access and ground
process; more frequencies; realigned timetables; better connections; new markets and destinations
including slots; and bilateral cooperation (i.e., code-share). The following table provides an overview
of Lufthansa’s efficiency claims.
259 The first time Lufthansa claimed efficiency was when LH increased its shares in Brussels Airlines up to 45 percent (M.
5335, 2009). Brussels Airlines did not belong to any major alliance. The deal expanded the LHG’s network by 18 new
destinations in Africa (Mayrhuber, 2009). Morgan Stanley estimated potential yearly synergies of €60m, compared to a €12.2m
loss by the Belgian flag carrier in 2008. The EC heavily criticized Lufthansa’s analysis, questioned LH’s positive comparison
with SWISS and clearly refused all efficiency claims (M. 5335). Despite the critique, the EC finally approved the takeover,
affirming Davignon, Chairman of the Board, who proposed that “a joint future with Lufthansa provides us with the best chance
of operating successfully against the competition” (Brussels Airlines, 2008).
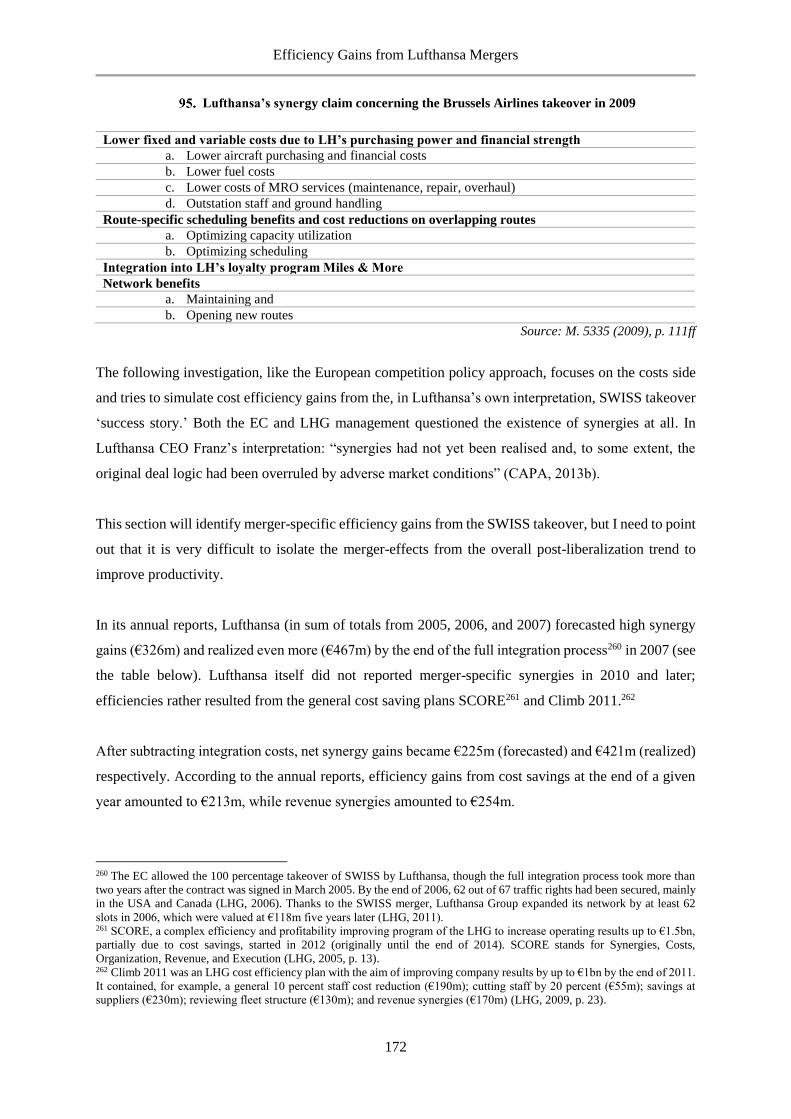
Efficiency Gains from Lufthansa Mergers
172
Lufthansa’s synergy claim concerning the Brussels Airlines takeover in 2009
Lower fixed and variable costs due to LH’s purchasing power and financial strength
a. Lower aircraft purchasing and financial costs
b. Lower fuel costs
c. Lower costs of MRO services (maintenance, repair, overhaul)
d. Outstation staff and ground handling
Route-specific scheduling benefits and cost reductions on overlapping routes
a. Optimizing capacity utilization
b. Optimizing scheduling
Integration into LH’s loyalty program Miles & More
Network benefits
a. Maintaining and
b. Opening new routes
Source: M. 5335 (2009), p. 111ff
The following investigation, like the European competition policy approach, focuses on the costs side
and tries to simulate cost efficiency gains from the, in Lufthansa’s own interpretation, SWISS takeover
‘success story.’ Both the EC and LHG management questioned the existence of synergies at all. In
Lufthansa CEO Franz’s interpretation: “synergies had not yet been realised and, to some extent, the
original deal logic had been overruled by adverse market conditions” (CAPA, 2013b).
This section will identify merger-specific efficiency gains from the SWISS takeover, but I need to point
out that it is very difficult to isolate the merger-effects from the overall post-liberalization trend to
improve productivity.
In its annual reports, Lufthansa (in sum of totals from 2005, 2006, and 2007) forecasted high synergy
gains (€326m) and realized even more (€467m) by the end of the full integration process260 in 2007 (see
the table below). Lufthansa itself did not reported merger-specific synergies in 2010 and later;
efficiencies rather resulted from the general cost saving plans SCORE261 and Climb 2011.262
After subtracting integration costs, net synergy gains became €225m (forecasted) and €421m (realized)
respectively. According to the annual reports, efficiency gains from cost savings at the end of a given
year amounted to €213m, while revenue synergies amounted to €254m.
260 The EC allowed the 100 percentage takeover of SWISS by Lufthansa, though the full integration process took more than
two years after the contract was signed in March 2005. By the end of 2006, 62 out of 67 traffic rights had been secured, mainly
in the USA and Canada (LHG, 2006). Thanks to the SWISS merger, Lufthansa Group expanded its network by at least 62
slots in 2006, which were valued at €118m five years later (LHG, 2011). 261 SCORE, a complex efficiency and profitability improving program of the LHG to increase operating results up to €1.5bn,
partially due to cost savings, started in 2012 (originally until the end of 2014). SCORE stands for Synergies, Costs,
Organization, Revenue, and Execution (LHG, 2005, p. 13). 262 Climb 2011 was an LHG cost efficiency plan with the aim of improving company results by up to €1bn by the end of 2011.
It contained, for example, a general 10 percent staff cost reduction (€190m); cutting staff by 20 percent (€55m); savings at
suppliers (€230m); reviewing fleet structure (€130m); and revenue synergies (€170m) (LHG, 2009, p. 23).
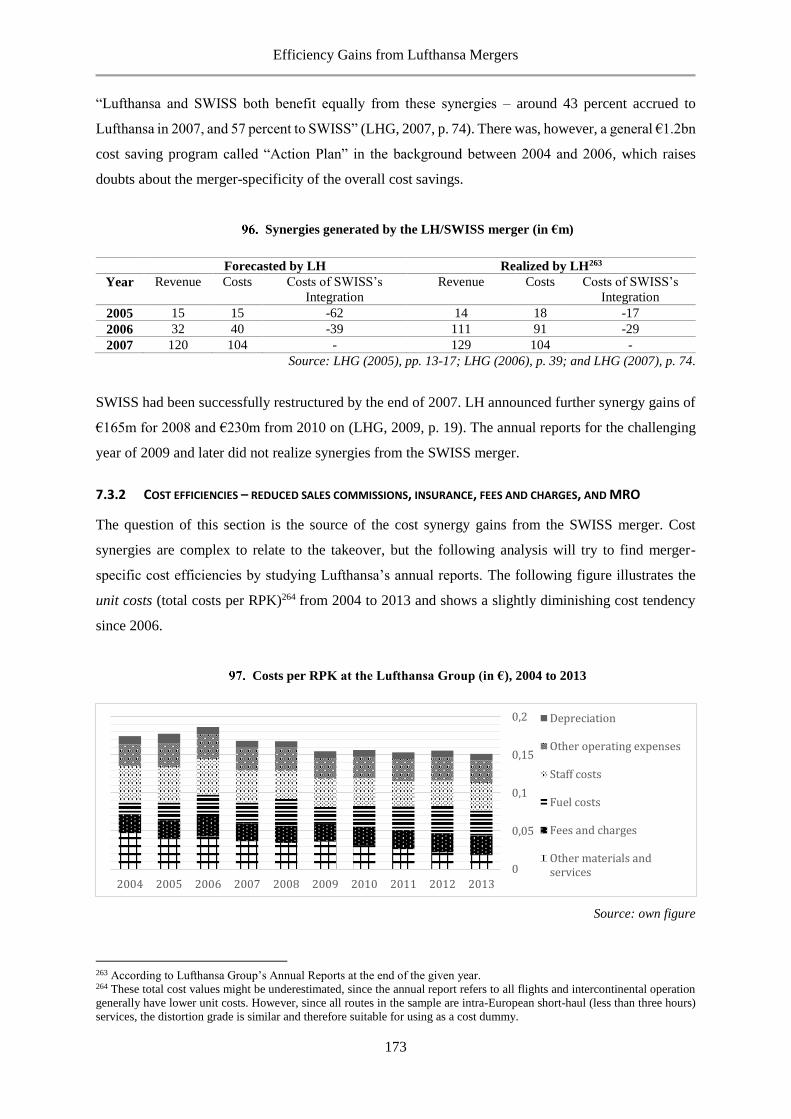
Efficiency Gains from Lufthansa Mergers
173
“Lufthansa and SWISS both benefit equally from these synergies – around 43 percent accrued to
Lufthansa in 2007, and 57 percent to SWISS” (LHG, 2007, p. 74). There was, however, a general €1.2bn
cost saving program called “Action Plan” in the background between 2004 and 2006, which raises
doubts about the merger-specificity of the overall cost savings.
Synergies generated by the LH/SWISS merger (in €m)
Forecasted by LH Realized by LH263
Year Revenue Costs Costs of SWISS’s
Integration
Revenue Costs Costs of SWISS’s
Integration
2005 15 15 -62 14 18 -17
2006 32 40 -39 111 91 -29
2007 120 104 - 129 104 -
Source: LHG (2005), pp. 13-17; LHG (2006), p. 39; and LHG (2007), p. 74.
SWISS had been successfully restructured by the end of 2007. LH announced further synergy gains of
€165m for 2008 and €230m from 2010 on (LHG, 2009, p. 19). The annual reports for the challenging
year of 2009 and later did not realize synergies from the SWISS merger.
7.3.2 COST EFFICIENCIES – REDUCED SALES COMMISSIONS, INSURANCE, FEES AND CHARGES, AND MRO
The question of this section is the source of the cost synergy gains from the SWISS merger. Cost
synergies are complex to relate to the takeover, but the following analysis will try to find merger-
specific cost efficiencies by studying Lufthansa’s annual reports. The following figure illustrates the
unit costs (total costs per RPK)264 from 2004 to 2013 and shows a slightly diminishing cost tendency
since 2006.
Costs per RPK at the Lufthansa Group (in €), 2004 to 2013
Source: own figure
263 According to Lufthansa Group’s Annual Reports at the end of the given year. 264 These total cost values might be underestimated, since the annual report refers to all flights and intercontinental operation
generally have lower unit costs. However, since all routes in the sample are intra-European short-haul (less than three hours)
services, the distortion grade is similar and therefore suitable for using as a cost dummy.
0
0,05
0,1
0,15
0,2
2013201220112010200920082007200620052004
Depreciation
Other operating expenses
Staff costs
Fuel costs
Fees and charges
Other materials andservices
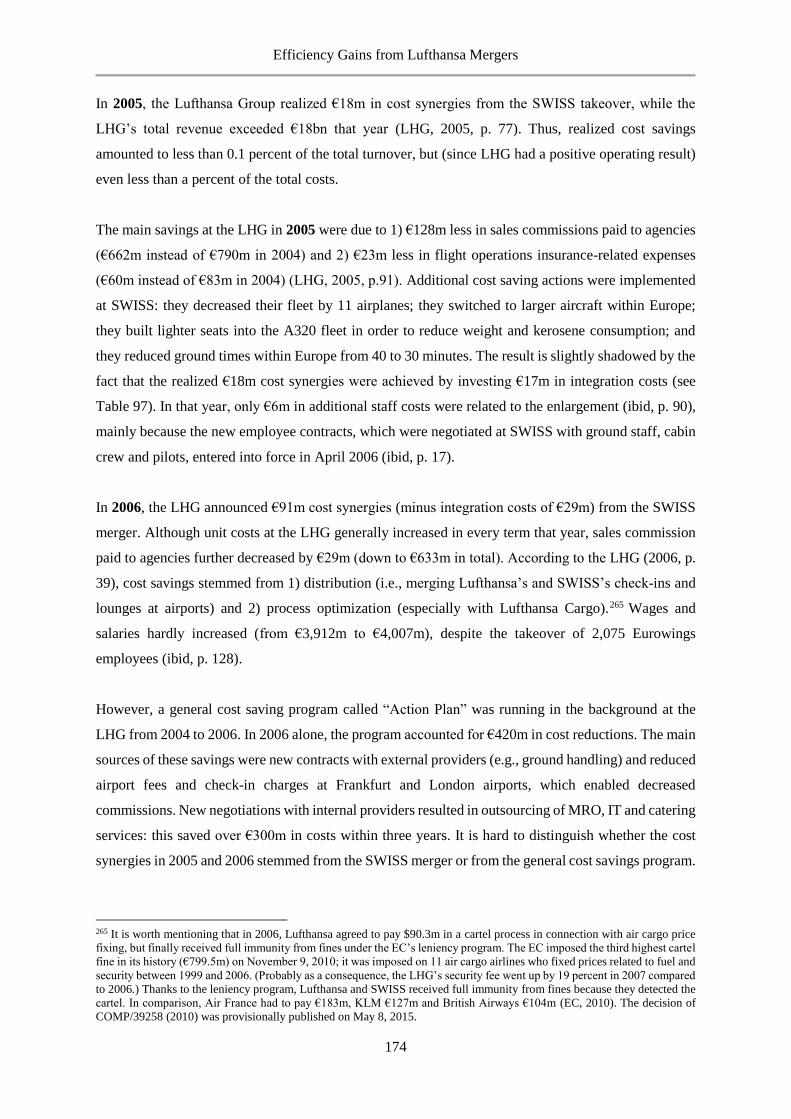
Efficiency Gains from Lufthansa Mergers
174
In 2005, the Lufthansa Group realized €18m in cost synergies from the SWISS takeover, while the
LHG’s total revenue exceeded €18bn that year (LHG, 2005, p. 77). Thus, realized cost savings
amounted to less than 0.1 percent of the total turnover, but (since LHG had a positive operating result)
even less than a percent of the total costs.
The main savings at the LHG in 2005 were due to 1) €128m less in sales commissions paid to agencies
(€662m instead of €790m in 2004) and 2) €23m less in flight operations insurance-related expenses
(€60m instead of €83m in 2004) (LHG, 2005, p.91). Additional cost saving actions were implemented
at SWISS: they decreased their fleet by 11 airplanes; they switched to larger aircraft within Europe;
they built lighter seats into the A320 fleet in order to reduce weight and kerosene consumption; and
they reduced ground times within Europe from 40 to 30 minutes. The result is slightly shadowed by the
fact that the realized €18m cost synergies were achieved by investing €17m in integration costs (see
Table 97). In that year, only €6m in additional staff costs were related to the enlargement (ibid, p. 90),
mainly because the new employee contracts, which were negotiated at SWISS with ground staff, cabin
crew and pilots, entered into force in April 2006 (ibid, p. 17).
In 2006, the LHG announced €91m cost synergies (minus integration costs of €29m) from the SWISS
merger. Although unit costs at the LHG generally increased in every term that year, sales commission
paid to agencies further decreased by €29m (down to €633m in total). According to the LHG (2006, p.
39), cost savings stemmed from 1) distribution (i.e., merging Lufthansa’s and SWISS’s check-ins and
lounges at airports) and 2) process optimization (especially with Lufthansa Cargo).265 Wages and
salaries hardly increased (from €3,912m to €4,007m), despite the takeover of 2,075 Eurowings
employees (ibid, p. 128).
However, a general cost saving program called “Action Plan” was running in the background at the
LHG from 2004 to 2006. In 2006 alone, the program accounted for €420m in cost reductions. The main
sources of these savings were new contracts with external providers (e.g., ground handling) and reduced
airport fees and check-in charges at Frankfurt and London airports, which enabled decreased
commissions. New negotiations with internal providers resulted in outsourcing of MRO, IT and catering
services: this saved over €300m in costs within three years. It is hard to distinguish whether the cost
synergies in 2005 and 2006 stemmed from the SWISS merger or from the general cost savings program.
265 It is worth mentioning that in 2006, Lufthansa agreed to pay $90.3m in a cartel process in connection with air cargo price
fixing, but finally received full immunity from fines under the EC’s leniency program. The EC imposed the third highest cartel
fine in its history (€799.5m) on November 9, 2010; it was imposed on 11 air cargo airlines who fixed prices related to fuel and
security between 1999 and 2006. (Probably as a consequence, the LHG’s security fee went up by 19 percent in 2007 compared
to 2006.) Thanks to the leniency program, Lufthansa and SWISS received full immunity from fines because they detected the
cartel. In comparison, Air France had to pay €183m, KLM €127m and British Airways €104m (EC, 2010). The decision of
COMP/39258 (2010) was provisionally published on May 8, 2015.
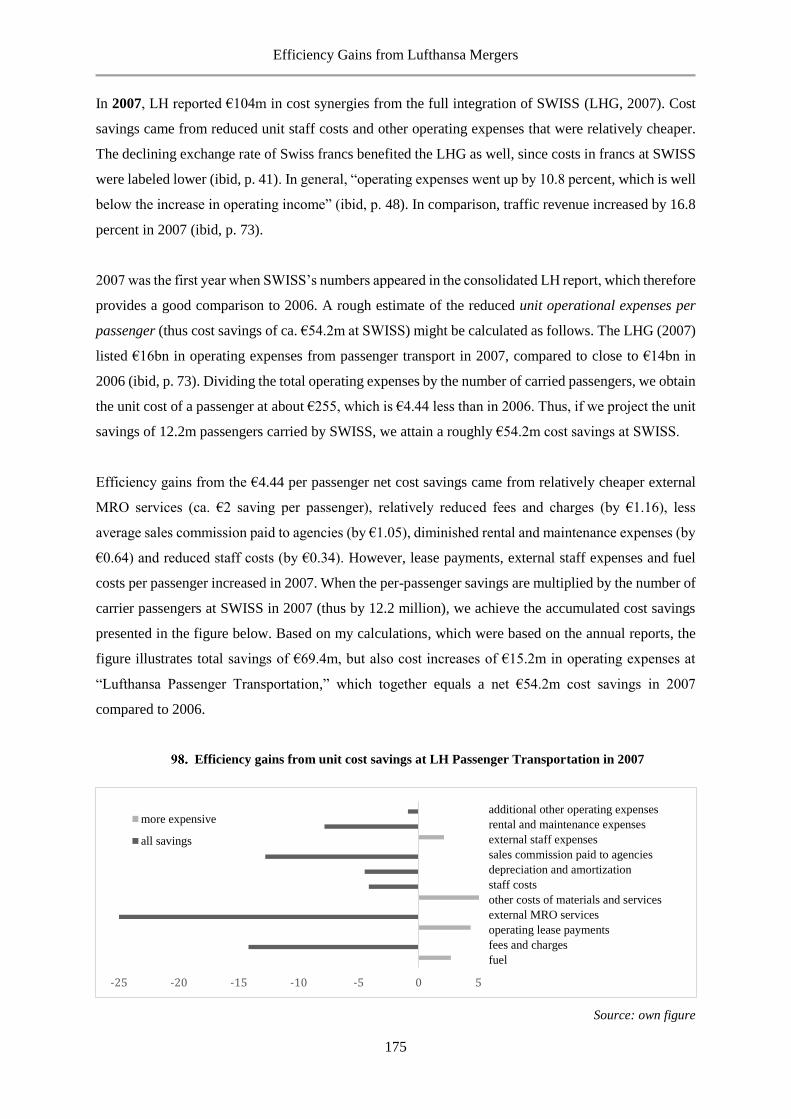
Efficiency Gains from Lufthansa Mergers
175
In 2007, LH reported €104m in cost synergies from the full integration of SWISS (LHG, 2007). Cost
savings came from reduced unit staff costs and other operating expenses that were relatively cheaper.
The declining exchange rate of Swiss francs benefited the LHG as well, since costs in francs at SWISS
were labeled lower (ibid, p. 41). In general, “operating expenses went up by 10.8 percent, which is well
below the increase in operating income” (ibid, p. 48). In comparison, traffic revenue increased by 16.8
percent in 2007 (ibid, p. 73).
2007 was the first year when SWISS’s numbers appeared in the consolidated LH report, which therefore
provides a good comparison to 2006. A rough estimate of the reduced unit operational expenses per
passenger (thus cost savings of ca. €54.2m at SWISS) might be calculated as follows. The LHG (2007)
listed €16bn in operating expenses from passenger transport in 2007, compared to close to €14bn in
2006 (ibid, p. 73). Dividing the total operating expenses by the number of carried passengers, we obtain
the unit cost of a passenger at about €255, which is €4.44 less than in 2006. Thus, if we project the unit
savings of 12.2m passengers carried by SWISS, we attain a roughly €54.2m cost savings at SWISS.
Efficiency gains from the €4.44 per passenger net cost savings came from relatively cheaper external
MRO services (ca. €2 saving per passenger), relatively reduced fees and charges (by €1.16), less
average sales commission paid to agencies (by €1.05), diminished rental and maintenance expenses (by
€0.64) and reduced staff costs (by €0.34). However, lease payments, external staff expenses and fuel
costs per passenger increased in 2007. When the per-passenger savings are multiplied by the number of
carrier passengers at SWISS in 2007 (thus by 12.2 million), we achieve the accumulated cost savings
presented in the figure below. Based on my calculations, which were based on the annual reports, the
figure illustrates total savings of €69.4m, but also cost increases of €15.2m in operating expenses at
“Lufthansa Passenger Transportation,” which together equals a net €54.2m cost savings in 2007
compared to 2006.
Efficiency gains from unit cost savings at LH Passenger Transportation in 2007
Source: own figure
-25 -20 -15 -10 -5 0 5
fuel
fees and charges
operating lease payments
external MRO services
other costs of materials and services
staff costs
depreciation and amortization
sales commission paid to agencies
external staff expenses
rental and maintenance expenses
additional other operating expensesmore expensive
all savings
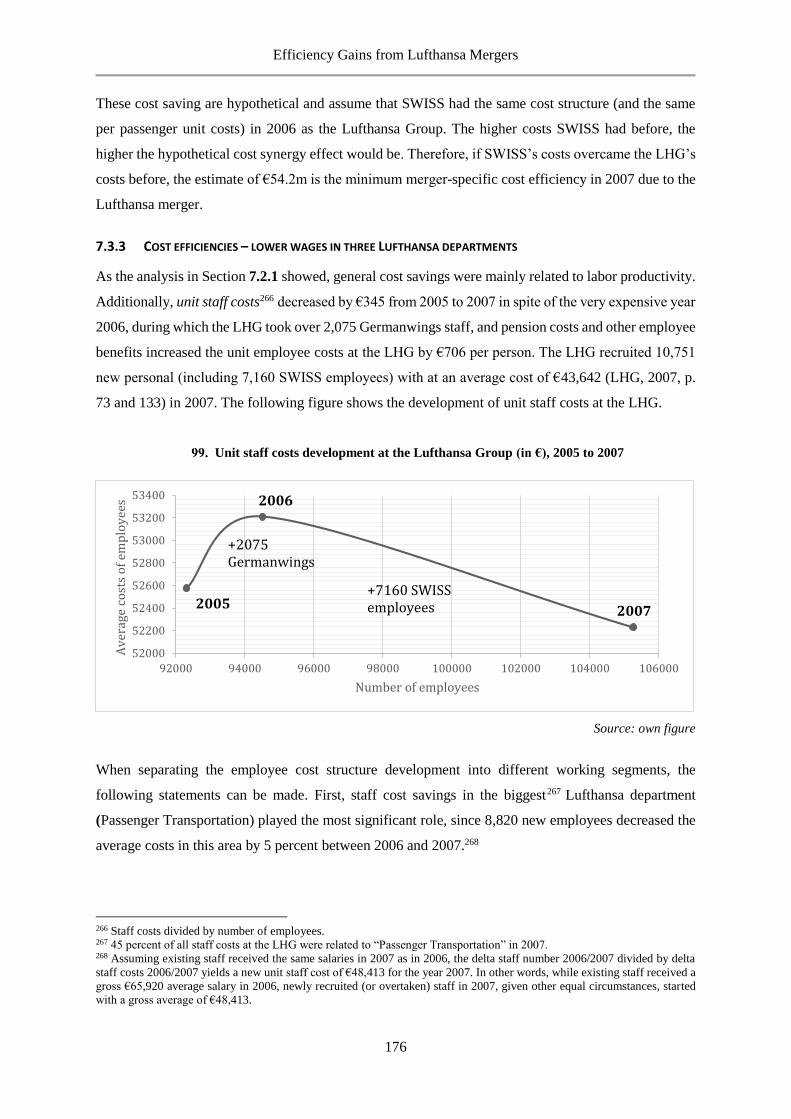
Efficiency Gains from Lufthansa Mergers
176
These cost saving are hypothetical and assume that SWISS had the same cost structure (and the same
per passenger unit costs) in 2006 as the Lufthansa Group. The higher costs SWISS had before, the
higher the hypothetical cost synergy effect would be. Therefore, if SWISS’s costs overcame the LHG’s
costs before, the estimate of €54.2m is the minimum merger-specific cost efficiency in 2007 due to the
Lufthansa merger.
7.3.3 COST EFFICIENCIES – LOWER WAGES IN THREE LUFTHANSA DEPARTMENTS
As the analysis in Section 7.2.1 showed, general cost savings were mainly related to labor productivity.
Additionally, unit staff costs266 decreased by €345 from 2005 to 2007 in spite of the very expensive year
2006, during which the LHG took over 2,075 Germanwings staff, and pension costs and other employee
benefits increased the unit employee costs at the LHG by €706 per person. The LHG recruited 10,751
new personal (including 7,160 SWISS employees) with at an average cost of €43,642 (LHG, 2007, p.
73 and 133) in 2007. The following figure shows the development of unit staff costs at the LHG.
Unit staff costs development at the Lufthansa Group (in €), 2005 to 2007
Source: own figure
When separating the employee cost structure development into different working segments, the
following statements can be made. First, staff cost savings in the biggest267 Lufthansa department
(Passenger Transportation) played the most significant role, since 8,820 new employees decreased the
average costs in this area by 5 percent between 2006 and 2007.268
266 Staff costs divided by number of employees. 267 45 percent of all staff costs at the LHG were related to “Passenger Transportation” in 2007. 268 Assuming existing staff received the same salaries in 2007 as in 2006, the delta staff number 2006/2007 divided by delta
staff costs 2006/2007 yields a new unit staff cost of €48,413 for the year 2007. In other words, while existing staff received a
gross €65,920 average salary in 2006, newly recruited (or overtaken) staff in 2007, given other equal circumstances, started
with a gross average of €48,413.
52000
52200
52400
52600
52800
53000
53200
53400
92000 94000 96000 98000 100000 102000 104000 106000
Av
erag
e co
sts
of
emp
loy
ees
Number of employees
+2075 Germanwings
+7160 SWISSemployees 2007
2006
2005
Efficiency Gains from Lufthansa Mergers
177
If the LHG would have paid the same salaries for new staff in “Passenger Transportation,” the airline
group would have had more than €154m higher staff costs alone in this segment.
Second, changes in catering staff in 2007 resulted in a €76.4m cost savings. While the second biggest269
department (Lufthansa Catering) employed 1,546 more staff, they had fewer total costs in 2007 than in
2006. Following the previous thought, every new staff member in catering had a negative price, thus
would have had to pay €17,464 to work for the company. Because this is, of course, nonsense, we need
to find another explanation.
The LHG asserts the following: “In addition to significant efficiency gains in all countries, the weakness
of the dollar against the euro also played a role, as did the fact that the one-off payment as part of the
new wage settlement in the USA no longer had an impact and the agreed measures began to take effect
(…) new recruitment took place in growth markets especially” (LHG, 2007, p. 97). That statement
proves the assumption from the beginning of the section that access to cheaper labor markets (“growth
markets especially”) is a merger-specific cost efficiency gain.
The third biggest source of cost savings (€20.3 m staff cost savings in 2007) was the smallest Lufthansa
department (Service and Financial Companies). While the department hired 131 more employees, they
had €10m less in total staff costs (€84m instead of €94m) in 2007 than in 2006. That means the
hypothetical marginal cost of one new employee 270 was €-76,336. In other words, keeping the
incumbent staff’s wages constant, every new employee would have had to pay Lufthansa over €76,000
to work for the company in 2007. However, if new employees in 2007 would have received the same
gross average salaries (€78,464) as existing staff in 2006, Lufthansa would have had €20.3m more staff
expenses that year.
These cost saving calculations are hypothetical and based on opportunity costs savings, given the
average salaries of existing staff stay ceteris paribus. New negotiated job contracts, especially part-time
instead of full-time, could explain the drastic reductions in average wages in 2007. We only know that
the average age of Lufthansa employees was 40.3 years, they were 58 percent male and 26.8 percent of
all staff worked part-time (LHG, 2007, p. 62).
269 29 percent of all staff costs at the LHG were related to “Lufthansa Catering” in 2007. 270 When dividing delta staff costs €-10m by delta employee numbers -131.
Efficiency Gains from Lufthansa Mergers
178
7.4 CONCLUSIONS
Chapter 7 investigated efficiency gains within the Lufthansa Group and tried to identify merger-specific
efficiencies from the SWISS merger.
Section 7.2 analyzed partial productivity indices in general at Lufthansa and found that labor
productivity was the driving force behind the development. Revenue passenger kilometer per employee
expanded by 59 percent by 2013 compared to the pre-merger situation in 2004. Employees at Lufthansa
not only became more productive, but even became relatively cheaper. This contributed to the result
that, despite tripling fuel costs and doubling airport charges, unit costs in terms of total costs per RPK
decreased by 15 percent, while they decreased in terms of total costs per ASK by 6 percent between
2004 and 2013. Improving load factor at the LHG explains the difference. At the same time, flight
equipment productivity fluctuated.
Section 7.3 introduced the forecasted and realized merger-specific synergies in the Lufthansa mergers
and controlled them with our own expertise. When concentrating on the SWISS case, the analysis found
about a €157m cost savings in agency commission fees (in 2005 and 2006), €23m in savings related to
insurance and security fees (in 2005) and at least a hypothetical €54.2m unit passenger cost savings
thanks to additional SWISS passengers (in 2007). In sum, at least €234.2m could have been identified
as probable merger-specific cost savings. In comparison, Lufthansa reported €213m in cost synergies
from the SWISS takeover in the first three years post-merger. There were no reported synergies later
on.
Alternatively, following the ‘access to cheaper labor approach,’ a hypothetical opportunity cost
investigation found a possible €250.7m in cost synergies alone in 2007 due to lower wages in three
Lufthansa departments, in particular due to outsourcing and new employee contracts.
In summary, cost synergies were located in 1) economies of scale in marketing (reduced sales
commission, insurance and security fees) and in 2) access to cheaper labor (outsourcing MRO and
catering, and new contracts with cabin staff at SWISS). Assessed cost synergies were probably merger-
specific and mostly driven by the merger (but also by a general cost savings plan in the background),
though one should consider the circumstances and the long-run effects of short-run savings.
Summary
179
SUMMARY
Chapter 1 introduced the theoretical background of the efficiency defense and explained that the
Chicago School has challenged US antitrust policy since the 1970s. Chicago School economists view
concentration as evidence for efficiency and would therefore promote it. The deregulation wave during
the Reagan presidency in the 1980s was dominated by the Chicagoan influence. In contrast, the Harvard
School has had a dominant influence in the European Commission, which continues today. The Harvard
School approach, while protecting consumers, also emphasizes concentration as a sign of market power.
Chapter 1 compared Harvard and Chicago Schools, derived syntheses on competition policy and asked:
Which economic concepts provide the most appropriate tools and the best suitable analytical
framework for assessing market power and efficiency within merger control?
The main purposes of European competition policy in the new century are efficiency and consumer
welfare, but these goals are in conflict. Consumer welfare is preferred to firms’ efficiency. The recent
merger regulation (ECMR, 2004) only allows efficiency considerations if consumers are not harmed by
a potential price increase. It therefore prescribes that efficiencies must be merger-specific, verifiable
and beneficial to consumers. These criteria are challenging to prove.
Williamson’s efficiency defense, the efficiency trade-off model is only applicable under the Total
Welfare standard, allows welfare transfer from consumers to producers. In contrast, the EC focuses on
protecting ‘consumer welfare’ in the framework of the Consumer Surplus standard. The main obstacle
to introducing an efficiency defense is the definition of welfare with a weight on the consumer side.
The EC is generally skeptical of efficiency claims, which the ICN (the International Competition
Network) called “speculative” elements (2006, p. 61). Existing literature supports this view. Chapter
2 revisited the literature on efficiency gains at different stages of airline cooperation and explained the
limitations to considering efficiencies. The research question of Chapter 2 was: Why did the EC refuse
the efficiency gains of airline takeovers but still allow the mergers?
Merger decisions within the EC are based on the merger’s potential anticompetitive effects, but they
are used to reject potential efficiency gains. The EC applies the Structure Conduct Performance (SCP)
model developed by Harvard School economists, in which a concentration usually results in higher
prices and less output. Hence, the economic model presumes that new oligopoly price is above the old
price. Thus, as long as a merger leads to a marginal price increase (a loss in consumer surplus), it harms
consumers. Harming consumers excludes any efficiency considerations.
Summary
180
In other words, even if the current merger regulation would allow higher-price-but-higher-efficiency
counteraction, the applied oligopoly framework excludes any trade-off because a potential price
increase harms consumers. It is a paradox of legislation.
Existing literature shows that efficiencies from mergers probably exist, but in the presence of market
power, these efficiencies are not going to be directly passed through to consumers. Efficiencies do not
result in cheaper ticket prices, but might improve quality and variety. The EC does not directly measure
these efficiencies, but takes them into account.
The aim of Chapter 3 was to introduce models with future relevance for European airline mergers that
would measure price and efficiency effects. The research question was: How should the price effects of
airline consolidation and merger-specific efficiencies be measured?
Most efficiencies can already be exhausted on the strategic-alliance level. Merger-specific efficiencies
arise from a) decreasing costs, b) increasing revenue and c) extending the network. These efficiencies
can be measured descriptively by regression analysis or merger simulation models. In the absence of
internal (marginal) cost data, supply-side efficiencies (changes in costs, particularly due to network
effects) are difficult to calculate. Both qualitative and quantitative analysis therefore focus on the
demand side, especially on airline pricing. There are models to calculate the minimum required
efficiency (MRE) to compensate price increases or even the pass-through rate (PTR), in which extended
efficiencies would be passed through to consumers.
Most models predict a significant (7 to 26 percent) price increase on overlapping routes, but no direct
efficiency gain. The conclusion is that even if there were efficiencies, they would not be passed through
to consumers. Frequency arguments, as part of the quality improvements, are often used as an example
of an efficiency gain by merging airlines. We developed a model to try to estimate the minimum
decrease in price required for the passengers to compensate for a given decrease in frequency. The
model is also applicable to calculate the value of a new frequency depending on the existing number of
frequencies (e.g., if there are already five daily connections, an additional frequency on a route has a
value of €11.70. With other words, passengers would pay up to €11.70 for the quality improvements in
frequency, but if the price increase is more than €11.70, passengers are worse-off.).
Chapter 4 evaluated the EC’s theoretical merger framework with a focus on relevant market. Quality
and variety arguments influenced the EC’s merger approval. The main question of the chapter was:
How much did the more laissez-faire Chicago School approach influence EC merger control in the last
20 years?
Summary
181
The EC has broadened its market definition by airport, mode of transport and flight substitution
concerning leisure passengers since 1995. By definition, concentration is lower in a broader market,
and mergers are therefore less harmful. The more laissez-faire approach might explain the merger
approvals in the 2000s, even without quantitative efficiency claims. Mergers, most of them with
remedies, have been cleared due to quality and variety reasons.
Quality and variety has also appeared in the EC’s relevant market definition. Variety includes a variety
of substitutes (e.g., railway, indirect flights, LCCs and secondary airports within 100 km or a one-hour
driving distance). The result is a broader relevant market, where the merger hardly increases
concentration and thus does not raises concerns about market dominance. This is particularly true on
the leisure (non-premium) market, where passengers are price sensitive but not time sensitive. Increased
quality (e.g., improved schedule and extended FFP) might benefit business (premium) passengers, who
are time-sensitive but less sensitive to price changes. The EC first considered quality increases from
network effects in 2004 during the KLM/Air France takeover concerning corporate (business)
passengers. However, the exact network effects remained indefinite. In sum, more variety benefits
leisure passengers, while quality improvements benefit business passengers.
The convergence of EC merger policy with US antitrust has been successful, in part. Attempts to
improve merger policy include gathering efficiency (at least theoretical) into the main goals of the EC;
introducing the effect-based more economic approach; implementing remedies to motivate competition;
testing econometric methodologies (e.g., SSNIP, CLA and fixed-effects price correlation); and
precisely separating different markets (consumer groups).
Competition policy aims to ensure intense competition in order to maintain or improve economic
welfare. If a takeover is not allowed, inefficient airlines might fail and leave the market. Therefore, at
this point, the thesis investigated the fail option.
Chapter 5 introduced the benchmarking approach to measuring and explaining airline performance
(i.e., efficiency) and inefficiency. The research questions of the case studies in this chapter were: Which
factors lead to a bankruptcy of a carrier and what can we learn from it? What are the consequences of
airline exits from the consumer point of view? The chapter provided insight into why carriers fail and
what happens if an airline leaves the market without government intervention.
The first case study focused on Malév Hungarian Airlines, an inefficient Central Eastern European flag
carrier. The case study addressed the features of a permanently failing organization and found that
management is the main obstacle to developing performance. The continued support of stakeholders,
based on misbeliefs, worsened performance and led to permanent failure.
Summary
182
On February 3, 2012, Malév grounded all its aircraft after the Hungarian government stopped funding
the loss-making carrier following the EC’s finding that such support is illegal. The EC’s decision to
rule against state aid was due to the government’s failure to credibly make the case for continued
support.
The tendency in Europe is that less efficient carriers will either be taken over or become insolvent.
Therefore, I assume that market stability might be another reason behind the EC’s soft merger policy,
which accepted the failing firm doctrine in airline cases as recently as 2013 in the Aegean/Olympic
takeover. The failing firm doctrine states that exit is unavoidable in the absence of a takeover (given no
less anticompetitive purchase alternative). However, this argument could also protect takeover firms
from new competition since, in case of an exit, market conditions should promote new entry and
competition.
The second case study on Malév’s failure examined the conditions of airline network replacement after
bankruptcy. The question is therefore: can new entry in the short run fill the gap caused by airline exits?
It found assorted evidence: leisure passengers probably benefited from immediate LCC entry, while
business or connecting passengers suffered losses. The study estimated the minimum price reductions
required to compensate passengers for lower frequency and found that passengers on 11 routes might
have been compensated. Passengers on the other 40 affected routes were probably worse off in the first
year after the bankruptcy event (e.g., the route Budapest-Goteborg reduced daily frequency from 2 to
1, which might have required a €53 price reduction as compensation for passengers to be better-off).
We concluded that both the passenger mix and the airport’s reaction affect new entry. The results are
of special interest since the exit scenario could be the default option without the EC’s merger
permission. The policy relevance of the results is that the application of the failing firm doctrine is
questionable if immediate new entry in a short period can be expected.
Chapter 6 gave insight into the failure of regulatory approaches that are applied as remedies and the
problems of regulating market power. The main questions were: Did the EC’s remedies prevent market
power? Is the abuse of market power in the forms of predation and monopoly pricing present?
The parallel trend in Lufthansa’s competitive environment (thus on the relevant markets from the
merger decisions) is takeover or bankruptcy. The descriptive analysis on entry, market share, capacity,
frequency and yield investigated 21 overlapping city pairs related to four Lufthansa mergers between
2005 (SWISS and Eurowings) and 2009 (Brussels Airlines and Austrian Airlines) which could have led
to a monopoly. The EC accepted the mergers and acquisitions with remedies, which partly worked. In
order to keep the calculations transparent, the study defined the Lufthansa Group.
Summary
183
The first hypothesis was that remedies have limited effects. The main results are as follows:
1) Slot surrenders did not work, since the LHG’s market share further increased (up to 76 percent
on average).
2) There were no sufficient new entries to counterbalance the LHG’s increasing market share (15.3
new daily airline frequencies instead of the maximum possible 350).
3) Frequency freezes (not to add any more frequencies when a new competitor entered the route)
were not directly violated, but there was evidence of increasing seat capacity instead in two out
of the five cases (see point 6).
4) Frequency decreased overall by an average of 8 percent due to the takeovers. A gross reduction
in frequencies was, in every case, a loss in consumer surplus.
5) Average prices partially increased despite price freezes (in four cases, so not a robust result).
The result is limited by the fact that price data is based on estimations.
The second hypothesis was that the abuse of market power was present in forms of strategic behavior.
Prices substantially above and below the competitive level are both suspicious. Low prices could be
predatory, while high prices could signal a monopoly, both signs of abusing market power. With the
limitation that it is challenging to define the ‘ideal’ competitive price in an industry with price
discrimination and a high proportion of fixed costs, the study found evidence of both substantially low
and high prices. Competition reduces prices, but how much cheaper means hit-and-run competition and
when are prices predatory? The border is the marginal cost. Short-run entries could theoretically be hit-
and-run, but the data investigation found prices below MC. The results are as follows:
6) Short-run capacity increases might be predatory if they aim to force out competitors, as
occurred against Air Berlin (AB) on ZRH-FRA and VIE-CGN. The LHG increased seat
capacity as a reaction to AB’s entries. This behavior induced AB’s exit. In contrast, the LHG
reduced seat capacity on seven monopoly routes.
7) After the LHG lowered price substantially, the new entrant AB left a relevant route. The LHG
then increased prices above the original level. The contestability argument failed (e.g., on the
VIE-STR route) because of the low prices (Air Berlin only had $0.08 per mile, while on other
routes it was more than $0.30). Overall, the LHG lost 20 to 24 percent of its market share on
all the routes where it competed with AB. This competition resulted in 17 to 29 percent cheaper
ticket prices.
8) Average ticket prices are 20 to 25 percent more expensive on routes where the LHG has
increased concentration (i.e., the relevant routes) than on other routes investigated by the EC.
It may also serve as first evidence that merger-specific efficiencies (if any) are not passed
through to consumers in the form of cheaper ticket prices. The mergers accounted for four
monopoly routes out of Brussels, which resulted in an up to 31 percent price increase in the
first year.
Summary
184
Lufthansa kept its position as a market leader and reacted strategically to Air Berlin’s entry. AB’s
strategy failed in most cases because price cuts resulted in Lufthansa’s short-run strategic capacity
increases and AB could not quickly fit capacity.
Chapter 7 investigated merger-specific efficiency gains from the Lufthansa takeovers, especially from
the LH/SWISS case, between 2004 and 2013. In general, the LHG partially improved its productivity,
especially in labor productivity. Savings in labor costs compensated for tripling fuel costs and doubling
airport charges. Unit costs decreased in the form of total costs per RPK, even by 15 percent in nominal
prices.
Merger-specific cost efficiency gains arose from the SWISS takeover, while synergies from other
Lufthansa acquisitions, according to Lufthansa, not yet realized. The descriptive analysis of SWISS
found higher cost efficiencies than those reported by Lufthansa, though my calculations also included
opportunity costs. The main driver of cost savings are: 1) economies of scale in marketing (e.g., reduced
sales commission, insurance and security fees) and 2) access to cheaper labor (e.g., outsourcing MRO
and catering, and negotiating new contracts with SWISS cabin staff). These synergies are merger-
specific and could not have been achieved by an alliance.
Back to the question at the beginning of the work: How is it possible that the European Commission
approved mergers that were found to be anticompetitive? Complex, sometimes controversial policy
goals; nontransparent efficiency and consumer welfare definitions; and the fear of failing firms all
promoted the European Commission’s trend of allowing mergers.
When efficiency is implemented in quality and quality becomes cheaper due to efficiencies, demand
should increase and more passengers should benefit from it. At least according to the economic theory.
According to the data, in the absence of new entry, merging airlines immediately cut frequency
(optimize schedules and rationalize costs) on the relevant dominant routes. Therefore, fewer passengers
probably benefit from the promised quality improvements. Passengers on the other side, who will not
and/or cannot afford quality, like leisure passengers, can switch to LCC competitors as long as they are
in the market. Historical data shows that LCCs (e.g., Air Berlin) enter a market but, due to predation by
the incumbent carrier, leave again in one or two years.
In summary, merger-specific efficiencies are difficult to separate from general achievements to increase
productivity. Further, the EC only considers efficiencies if they are pre-merger verifiable and benefit
consumers (stem from variable cost savings). Moreover, the merger framework in Europe is based on
the Structure-Conduct-Performance model which contradicts efficiencies. Therefore, similar to the
Harvard School, the EC merger policy still emphasizes market power despite efficiencies.
Summary
185
FUTURE RESEARCH, IMPLICATIONS AND LIMITATIONS
The EC had to adapt to the new situation on airline liberalization and started to work on an international
convergence of its merger policy. Though the path is still long, the EC needs to reevaluate its current
competition approach, its view of the relevant market and its use of merger remedies, and ask itself
whether the road toward an efficiency defense is suitable for the European framework.
Efficiency defense remains a hypothetical concept as long efficiencies are not clear and not measurable.
Future research should focus on the measurement of merger-specific efficiencies, particularly on
dynamic and transactional efficiencies. In the current EC framework, a merger that leads to lower prices
due to efficiency gains, which outweigh price increases, would be rejected.
The overall profitability of aviation, and with it the relevance of market power issues, is decreasing.
However, we need to differentiate between leisure and business markets, and also between hub-to-hub
and other markets. Low-cost carriers enter markets by undercutting the incumbent, and network carriers
particularly try to protect their dominant hub-to-hub business routes to retain monopoly pricing. Future
research on relevant market and on market power should therefore particularly focus on business routes
from the hub airport.
We know that remedies in airline merger cases did not work well and, at least in standard oligopoly
theory, the probability of a price increase is higher in a more concentrated market. Competition ensures
the ability to set competitive prices by passing efficiency gains from mergers onto passengers. The
question for science, practice and policy implication remains: how can competition be motivated in
airline markets, what remedies can be imposed and how can remedies (especially price-related
remedies) be controlled?
Current research could be extended by merger consequences on intra-European routes; by discussing
the spill-over effect of mergers on non-overlapping routes; by examining the relevance of synergies
from other European airline mergers (e.g., British Airways/Iberia) or by comparing the features of the
withdrawn merger cases (e.g., Ryanair/Aer Lingus).
The research approach and the methodology could be implemented in other network industries, while
the findings from the passenger airline market could be compared to explain current developments in
other oligopoly markets.
Summary
186
The limitation of the thesis is based on its descriptive methodology and data availability. Price data on
the European passenger airline market does not make it possible to control predatory prices, or to carry
out complex regression analyses or merger simulations with distinct results.
Future research, supposing better data availabiliy, could improve methodology (e.g., by building a
merger simulation model), measure minimum required efficiencies and the efficiency pass through rate
to consumers.
Although the approach of an economist remains dominant during the work, managers and policymakers
can also learn from the reasons behind airline market inefficiencies and derive future consequences of
airline consolidation, entry, failure and exit. To my knowledge, no such comprehensive analysis of
airline merger cases in Europe has been published thus far. Hence the work could serve as a basis for
critical evaluation of mergers, and of the EC merger policy.
The results of the thesis provide guidance for airlines, airports, shareholders and policymakers. Airlines
can learn from the case evidence how to improve performance and how to profit from efficiencies; but
also from the predatory strategies and their policy consequences. Airports can benefit from the lessons
on how to successful reorganize airport planning after de-hubbing, thus losing the hub carrier; but also
from getting an insight into airline practices concerning market power and efficiencies (frequency
decrease, capacity increase, bargaining power in order to reduce airport charges and fees). Policymakers
can learn about the importance of merger-specific efficiencies compared to market power issues.
Finally, we, passengers can learn how to appreciate the value of having the choice and the final word.
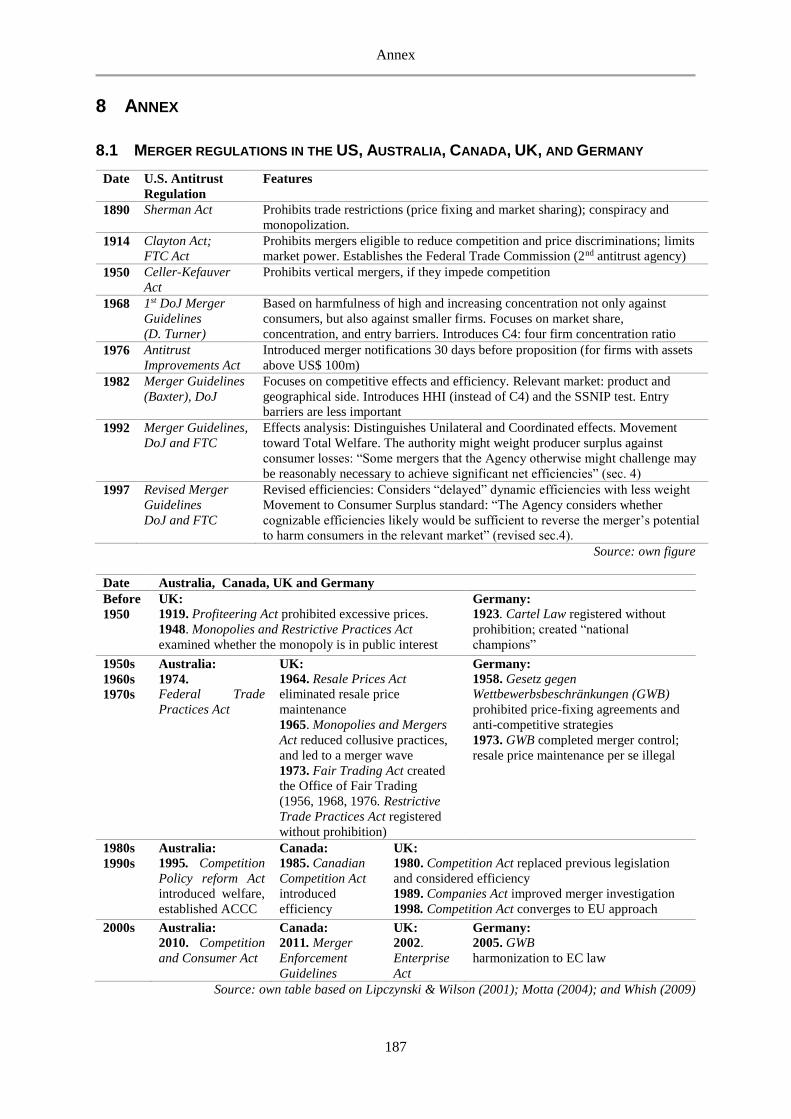
Annex
187
8 ANNEX
8.1 MERGER REGULATIONS IN THE US, AUSTRALIA, CANADA, UK, AND GERMANY
Date U.S. Antitrust
Regulation
Features
1890 Sherman Act Prohibits trade restrictions (price fixing and market sharing); conspiracy and
monopolization.
1914 Clayton Act;
FTC Act
Prohibits mergers eligible to reduce competition and price discriminations; limits
market power. Establishes the Federal Trade Commission (2nd antitrust agency)
1950 Celler-Kefauver
Act
Prohibits vertical mergers, if they impede competition
1968 1st DoJ Merger
Guidelines
(D. Turner)
Based on harmfulness of high and increasing concentration not only against
consumers, but also against smaller firms. Focuses on market share,
concentration, and entry barriers. Introduces C4: four firm concentration ratio
1976 Antitrust
Improvements Act
Introduced merger notifications 30 days before proposition (for firms with assets
above US$ 100m)
1982 Merger Guidelines
(Baxter), DoJ
Focuses on competitive effects and efficiency. Relevant market: product and
geographical side. Introduces HHI (instead of C4) and the SSNIP test. Entry
barriers are less important
1992 Merger Guidelines,
DoJ and FTC
Effects analysis: Distinguishes Unilateral and Coordinated effects. Movement
toward Total Welfare. The authority might weight producer surplus against
consumer losses: “Some mergers that the Agency otherwise might challenge may
be reasonably necessary to achieve significant net efficiencies” (sec. 4)
1997 Revised Merger
Guidelines
DoJ and FTC
Revised efficiencies: Considers “delayed” dynamic efficiencies with less weight
Movement to Consumer Surplus standard: “The Agency considers whether
cognizable efficiencies likely would be sufficient to reverse the merger’s potential
to harm consumers in the relevant market” (revised sec.4).
Source: own figure
Date Australia, Canada, UK and Germany
Before
1950
UK:
1919. Profiteering Act prohibited excessive prices.
1948. Monopolies and Restrictive Practices Act
examined whether the monopoly is in public interest
Germany:
1923. Cartel Law registered without
prohibition; created “national
champions”
1950s
1960s
1970s
Australia:
1974.
Federal Trade
Practices Act
UK:
1964. Resale Prices Act
eliminated resale price
maintenance
1965. Monopolies and Mergers
Act reduced collusive practices,
and led to a merger wave
1973. Fair Trading Act created
the Office of Fair Trading
(1956, 1968, 1976. Restrictive
Trade Practices Act registered
without prohibition)
Germany:
1958. Gesetz gegen
Wettbewerbsbeschränkungen (GWB)
prohibited price-fixing agreements and
anti-competitive strategies
1973. GWB completed merger control;
resale price maintenance per se illegal
1980s
1990s
Australia:
1995. Competition
Policy reform Act
introduced welfare,
established ACCC
Canada:
1985. Canadian
Competition Act
introduced
efficiency
UK:
1980. Competition Act replaced previous legislation
and considered efficiency
1989. Companies Act improved merger investigation
1998. Competition Act converges to EU approach
2000s Australia:
2010. Competition
and Consumer Act
Canada:
2011. Merger
Enforcement
Guidelines
UK:
2002.
Enterprise
Act
Germany:
2005. GWB
harmonization to EC law
Source: own table based on Lipczynski & Wilson (2001); Motta (2004); and Whish (2009)
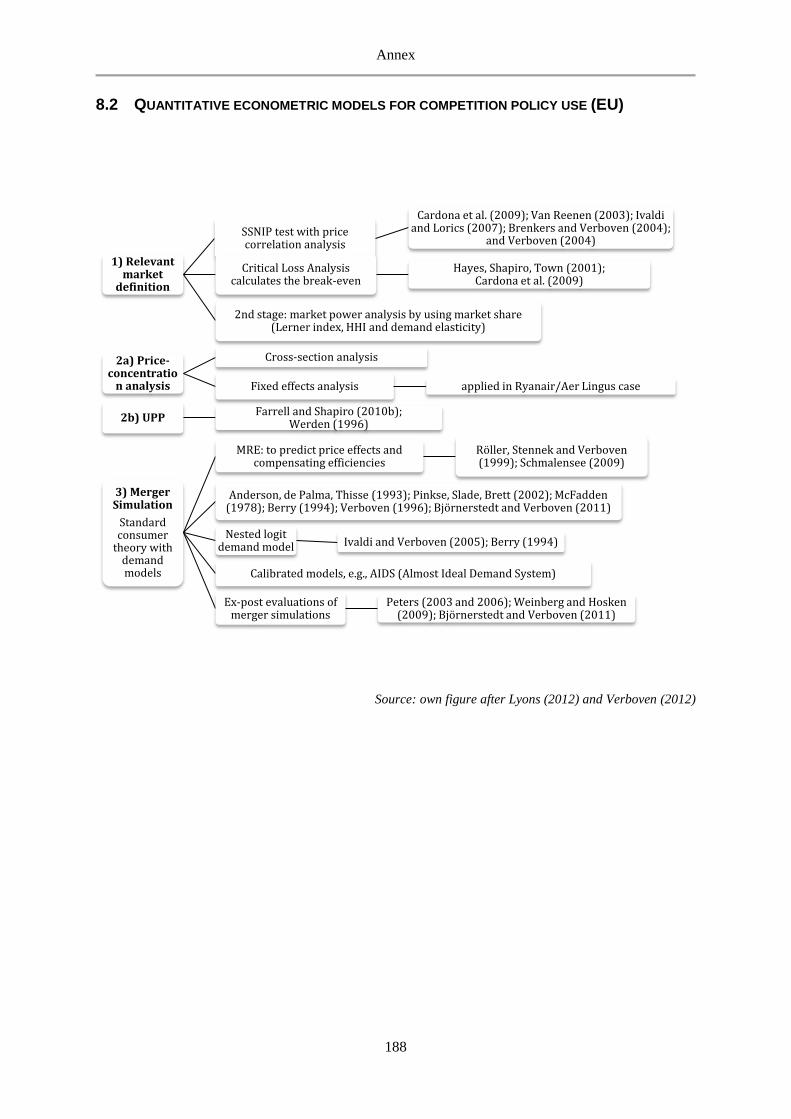
Annex
188
8.2 QUANTITATIVE ECONOMETRIC MODELS FOR COMPETITION POLICY USE (EU)
Source: own figure after Lyons (2012) and Verboven (2012)
1) Relevant market
definition
SSNIP test with price correlation analysis
Cardona et al. (2009); Van Reenen (2003); Ivaldi and Lorics (2007); Brenkers and Verboven (2004);
and Verboven (2004)
Critical Loss Analysis calculates the break-even
Hayes, Shapiro, Town (2001); Cardona et al. (2009)
2nd stage: market power analysis by using market share (Lerner index, HHI and demand elasticity)
2a) Price-concentratio
n analysis
Cross-section analysis
Fixed effects analysis applied in Ryanair/Aer Lingus case
2b) UPPFarrell and Shapiro (2010b);
Werden (1996)
3) Merger Simulation
Standard consumer
theory with demand models
MRE: to predict price effects and compensating efficiencies
Röller, Stennek and Verboven (1999); Schmalensee (2009)
Anderson, de Palma, Thisse (1993); Pinkse, Slade, Brett (2002); McFadden (1978); Berry (1994); Verboven (1996); Björnerstedt and Verboven (2011)
Nested logit demand model Ivaldi and Verboven (2005); Berry (1994)
Calibrated models, e.g., AIDS (Almost Ideal Demand System)
Ex-post evaluations of merger simulations
Peters (2003 and 2006); Weinberg and Hosken (2009); Björnerstedt and Verboven (2011)
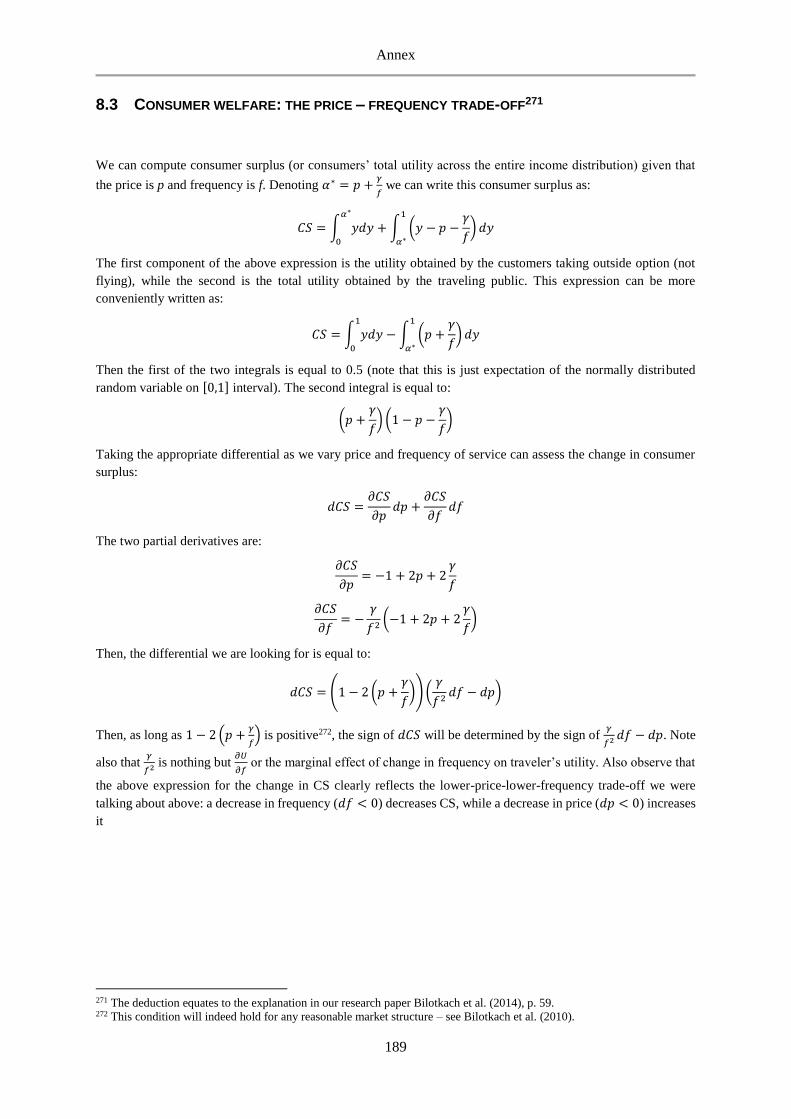
Annex
189
8.3 CONSUMER WELFARE: THE PRICE – FREQUENCY TRADE-OFF271
We can compute consumer surplus (or consumers’ total utility across the entire income distribution) given that
the price is p and frequency is f. Denoting 𝛼∗ = 𝑝 +𝛾
𝑓 we can write this consumer surplus as:
𝐶𝑆 = ∫ 𝑦𝑑𝑦𝛼∗
0
+ ∫ (𝑦 − 𝑝 −𝛾
𝑓) 𝑑𝑦
1
𝛼∗
The first component of the above expression is the utility obtained by the customers taking outside option (not
flying), while the second is the total utility obtained by the traveling public. This expression can be more
conveniently written as:
𝐶𝑆 = ∫ 𝑦𝑑𝑦1
0
− ∫ (𝑝 +𝛾
𝑓) 𝑑𝑦
1
𝛼∗
Then the first of the two integrals is equal to 0.5 (note that this is just expectation of the normally distributed
random variable on [0,1] interval). The second integral is equal to:
(𝑝 +𝛾
𝑓) (1 − 𝑝 −
𝛾
𝑓)
Taking the appropriate differential as we vary price and frequency of service can assess the change in consumer
surplus:
𝑑𝐶𝑆 =𝜕𝐶𝑆
𝜕𝑝𝑑𝑝 +
𝜕𝐶𝑆
𝜕𝑓𝑑𝑓
The two partial derivatives are:
𝜕𝐶𝑆
𝜕𝑝= −1 + 2𝑝 + 2
𝛾
𝑓
𝜕𝐶𝑆
𝜕𝑓= −
𝛾
𝑓2(−1 + 2𝑝 + 2
𝛾
𝑓)
Then, the differential we are looking for is equal to:
𝑑𝐶𝑆 = (1 − 2 (𝑝 +𝛾
𝑓)) (
𝛾
𝑓2𝑑𝑓 − 𝑑𝑝)
Then, as long as 1 − 2 (𝑝 +𝛾
𝑓) is positive272, the sign of 𝑑𝐶𝑆 will be determined by the sign of
𝛾
𝑓2 𝑑𝑓 − 𝑑𝑝. Note
also that 𝛾
𝑓2 is nothing but 𝜕𝑈
𝜕𝑓 or the marginal effect of change in frequency on traveler’s utility. Also observe that
the above expression for the change in CS clearly reflects the lower-price-lower-frequency trade-off we were
talking about above: a decrease in frequency (𝑑𝑓 < 0) decreases CS, while a decrease in price (𝑑𝑝 < 0) increases
it
271 The deduction equates to the explanation in our research paper Bilotkach et al. (2014), p. 59. 272 This condition will indeed hold for any reasonable market structure – see Bilotkach et al. (2010).
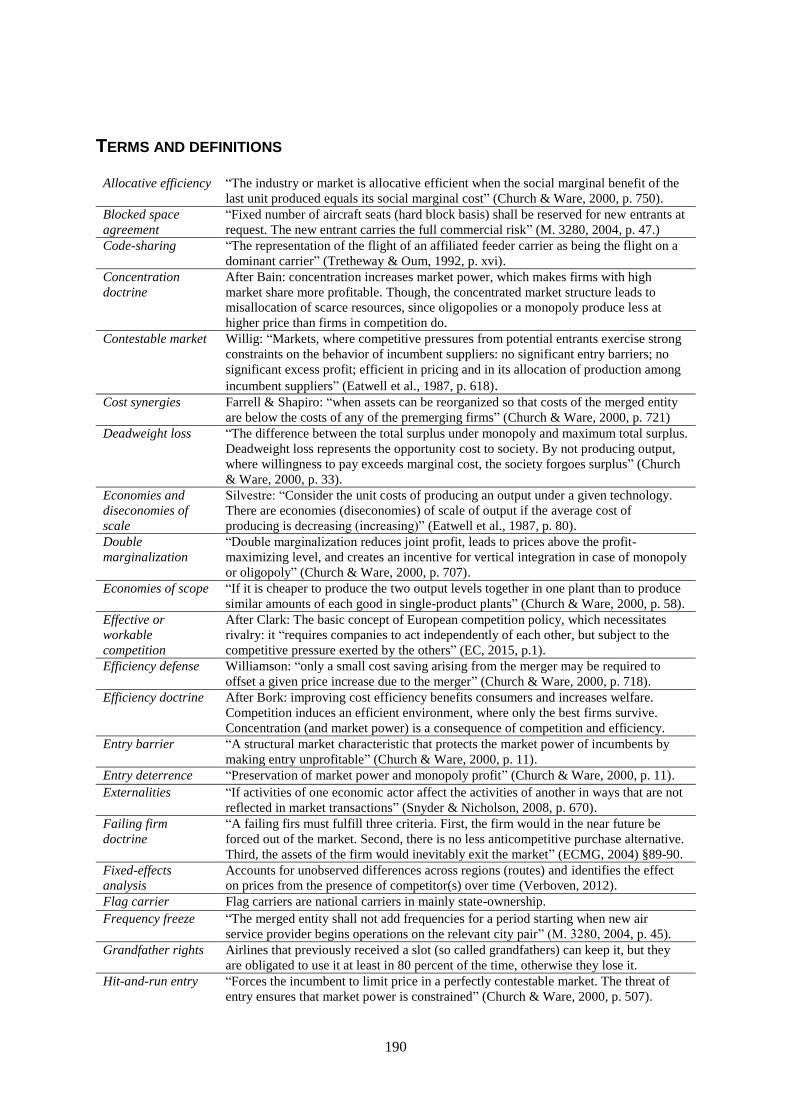
190
TERMS AND DEFINITIONS
Allocative efficiency “The industry or market is allocative efficient when the social marginal benefit of the
last unit produced equals its social marginal cost” (Church & Ware, 2000, p. 750).
Blocked space
agreement
“Fixed number of aircraft seats (hard block basis) shall be reserved for new entrants at
request. The new entrant carries the full commercial risk” (M. 3280, 2004, p. 47.)
Code-sharing “The representation of the flight of an affiliated feeder carrier as being the flight on a
dominant carrier” (Tretheway & Oum, 1992, p. xvi).
Concentration
doctrine
After Bain: concentration increases market power, which makes firms with high
market share more profitable. Though, the concentrated market structure leads to
misallocation of scarce resources, since oligopolies or a monopoly produce less at
higher price than firms in competition do.
Contestable market Willig: “Markets, where competitive pressures from potential entrants exercise strong
constraints on the behavior of incumbent suppliers: no significant entry barriers; no
significant excess profit; efficient in pricing and in its allocation of production among
incumbent suppliers” (Eatwell et al., 1987, p. 618). Cost synergies Farrell & Shapiro: “when assets can be reorganized so that costs of the merged entity
are below the costs of any of the premerging firms” (Church & Ware, 2000, p. 721)
Deadweight loss “The difference between the total surplus under monopoly and maximum total surplus.
Deadweight loss represents the opportunity cost to society. By not producing output,
where willingness to pay exceeds marginal cost, the society forgoes surplus” (Church
& Ware, 2000, p. 33).
Economies and
diseconomies of
scale
Silvestre: “Consider the unit costs of producing an output under a given technology.
There are economies (diseconomies) of scale of output if the average cost of
producing is decreasing (increasing)” (Eatwell et al., 1987, p. 80).
Double
marginalization
“Double marginalization reduces joint profit, leads to prices above the profit-
maximizing level, and creates an incentive for vertical integration in case of monopoly
or oligopoly” (Church & Ware, 2000, p. 707).
Economies of scope “If it is cheaper to produce the two output levels together in one plant than to produce
similar amounts of each good in single-product plants” (Church & Ware, 2000, p. 58).
Effective or
workable
competition
After Clark: The basic concept of European competition policy, which necessitates
rivalry: it “requires companies to act independently of each other, but subject to the
competitive pressure exerted by the others” (EC, 2015, p.1).
Efficiency defense Williamson: “only a small cost saving arising from the merger may be required to
offset a given price increase due to the merger” (Church & Ware, 2000, p. 718).
Efficiency doctrine After Bork: improving cost efficiency benefits consumers and increases welfare.
Competition induces an efficient environment, where only the best firms survive.
Concentration (and market power) is a consequence of competition and efficiency.
Entry barrier “A structural market characteristic that protects the market power of incumbents by
making entry unprofitable” (Church & Ware, 2000, p. 11).
Entry deterrence “Preservation of market power and monopoly profit” (Church & Ware, 2000, p. 11).
Externalities “If activities of one economic actor affect the activities of another in ways that are not
reflected in market transactions” (Snyder & Nicholson, 2008, p. 670).
Failing firm
doctrine
“A failing firs must fulfill three criteria. First, the firm would in the near future be
forced out of the market. Second, there is no less anticompetitive purchase alternative.
Third, the assets of the firm would inevitably exit the market” (ECMG, 2004) §89-90.
Fixed-effects
analysis
Accounts for unobserved differences across regions (routes) and identifies the effect
on prices from the presence of competitor(s) over time (Verboven, 2012).
Flag carrier Flag carriers are national carriers in mainly state-ownership.
Frequency freeze “The merged entity shall not add frequencies for a period starting when new air
service provider begins operations on the relevant city pair” (M. 3280, 2004, p. 45).
Grandfather rights Airlines that previously received a slot (so called grandfathers) can keep it, but they
are obligated to use it at least in 80 percent of the time, otherwise they lose it.
Hit-and-run entry “Forces the incumbent to limit price in a perfectly contestable market. The threat of
entry ensures that market power is constrained” (Church & Ware, 2000, p. 507).
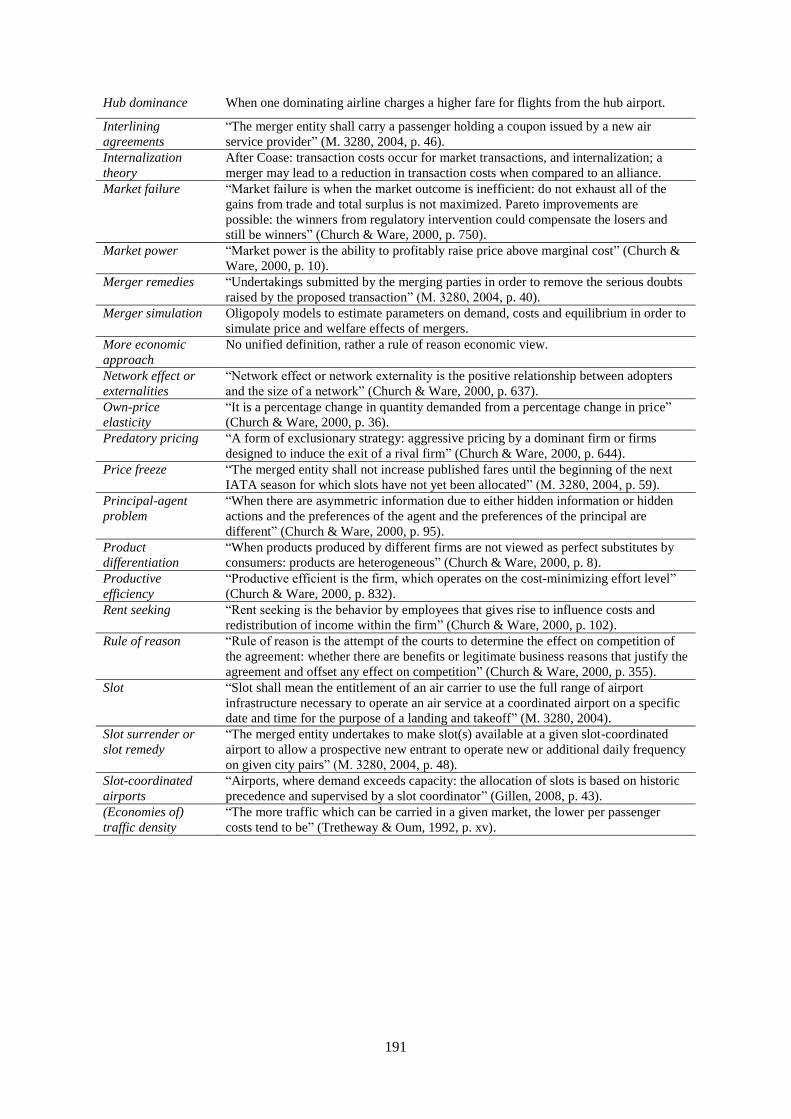
191
Hub dominance When one dominating airline charges a higher fare for flights from the hub airport.
Interlining
agreements
“The merger entity shall carry a passenger holding a coupon issued by a new air
service provider” (M. 3280, 2004, p. 46).
Internalization
theory
After Coase: transaction costs occur for market transactions, and internalization; a
merger may lead to a reduction in transaction costs when compared to an alliance.
Market failure “Market failure is when the market outcome is inefficient: do not exhaust all of the
gains from trade and total surplus is not maximized. Pareto improvements are
possible: the winners from regulatory intervention could compensate the losers and
still be winners” (Church & Ware, 2000, p. 750).
Market power “Market power is the ability to profitably raise price above marginal cost” (Church &
Ware, 2000, p. 10).
Merger remedies “Undertakings submitted by the merging parties in order to remove the serious doubts
raised by the proposed transaction” (M. 3280, 2004, p. 40).
Merger simulation Oligopoly models to estimate parameters on demand, costs and equilibrium in order to
simulate price and welfare effects of mergers.
More economic
approach
No unified definition, rather a rule of reason economic view.
Network effect or
externalities
“Network effect or network externality is the positive relationship between adopters
and the size of a network” (Church & Ware, 2000, p. 637).
Own-price
elasticity
“It is a percentage change in quantity demanded from a percentage change in price”
(Church & Ware, 2000, p. 36).
Predatory pricing “A form of exclusionary strategy: aggressive pricing by a dominant firm or firms
designed to induce the exit of a rival firm” (Church & Ware, 2000, p. 644).
Price freeze “The merged entity shall not increase published fares until the beginning of the next
IATA season for which slots have not yet been allocated” (M. 3280, 2004, p. 59).
Principal-agent
problem
“When there are asymmetric information due to either hidden information or hidden
actions and the preferences of the agent and the preferences of the principal are
different” (Church & Ware, 2000, p. 95).
Product
differentiation
“When products produced by different firms are not viewed as perfect substitutes by
consumers: products are heterogeneous” (Church & Ware, 2000, p. 8).
Productive
efficiency
“Productive efficient is the firm, which operates on the cost-minimizing effort level”
(Church & Ware, 2000, p. 832).
Rent seeking “Rent seeking is the behavior by employees that gives rise to influence costs and
redistribution of income within the firm” (Church & Ware, 2000, p. 102).
Rule of reason “Rule of reason is the attempt of the courts to determine the effect on competition of
the agreement: whether there are benefits or legitimate business reasons that justify the
agreement and offset any effect on competition” (Church & Ware, 2000, p. 355).
Slot “Slot shall mean the entitlement of an air carrier to use the full range of airport
infrastructure necessary to operate an air service at a coordinated airport on a specific
date and time for the purpose of a landing and takeoff” (M. 3280, 2004).
Slot surrender or
slot remedy
“The merged entity undertakes to make slot(s) available at a given slot-coordinated
airport to allow a prospective new entrant to operate new or additional daily frequency
on given city pairs” (M. 3280, 2004, p. 48).
Slot-coordinated
airports
“Airports, where demand exceeds capacity: the allocation of slots is based on historic
precedence and supervised by a slot coordinator” (Gillen, 2008, p. 43).
(Economies of)
traffic density
“The more traffic which can be carried in a given market, the lower per passenger
costs tend to be” (Tretheway & Oum, 1992, p. xv).
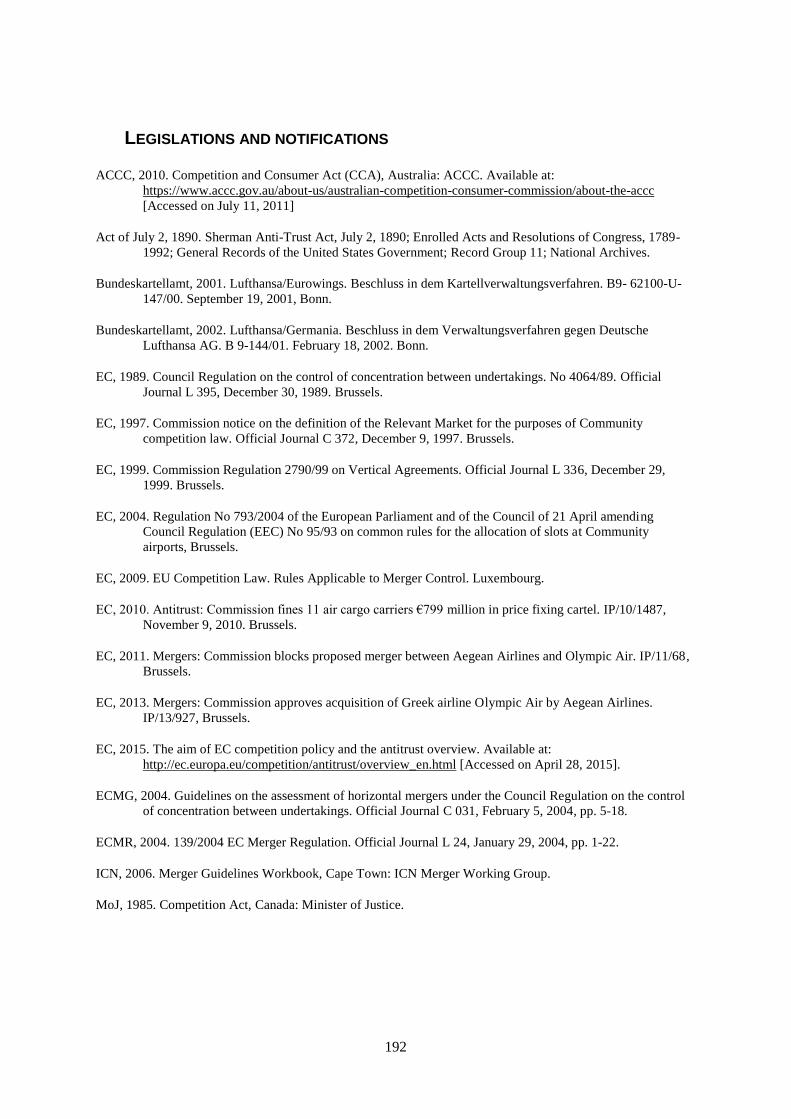
192
LEGISLATIONS AND NOTIFICATIONS
ACCC, 2010. Competition and Consumer Act (CCA), Australia: ACCC. Available at:
https://www.accc.gov.au/about-us/australian-competition-consumer-commission/about-the-accc
[Accessed on July 11, 2011]
Act of July 2, 1890. Sherman Anti-Trust Act, July 2, 1890; Enrolled Acts and Resolutions of Congress, 1789-
1992; General Records of the United States Government; Record Group 11; National Archives.
Bundeskartellamt, 2001. Lufthansa/Eurowings. Beschluss in dem Kartellverwaltungsverfahren. B9- 62100-U-
147/00. September 19, 2001, Bonn.
Bundeskartellamt, 2002. Lufthansa/Germania. Beschluss in dem Verwaltungsverfahren gegen Deutsche
Lufthansa AG. B 9-144/01. February 18, 2002. Bonn.
EC, 1989. Council Regulation on the control of concentration between undertakings. No 4064/89. Official
Journal L 395, December 30, 1989. Brussels.
EC, 1997. Commission notice on the definition of the Relevant Market for the purposes of Community
competition law. Official Journal C 372, December 9, 1997. Brussels.
EC, 1999. Commission Regulation 2790/99 on Vertical Agreements. Official Journal L 336, December 29,
1999. Brussels.
EC, 2004. Regulation No 793/2004 of the European Parliament and of the Council of 21 April amending
Council Regulation (EEC) No 95/93 on common rules for the allocation of slots at Community
airports, Brussels.
EC, 2009. EU Competition Law. Rules Applicable to Merger Control. Luxembourg.
EC, 2010. Antitrust: Commission fines 11 air cargo carriers €799 million in price fixing cartel. IP/10/1487,
November 9, 2010. Brussels.
EC, 2011. Mergers: Commission blocks proposed merger between Aegean Airlines and Olympic Air. IP/11/68,
Brussels.
EC, 2013. Mergers: Commission approves acquisition of Greek airline Olympic Air by Aegean Airlines.
IP/13/927, Brussels.
EC, 2015. The aim of EC competition policy and the antitrust overview. Available at:
http://ec.europa.eu/competition/antitrust/overview_en.html [Accessed on April 28, 2015].
ECMG, 2004. Guidelines on the assessment of horizontal mergers under the Council Regulation on the control
of concentration between undertakings. Official Journal C 031, February 5, 2004, pp. 5-18.
ECMR, 2004. 139/2004 EC Merger Regulation. Official Journal L 24, January 29, 2004, pp. 1-22.
ICN, 2006. Merger Guidelines Workbook, Cape Town: ICN Merger Working Group.
MoJ, 1985. Competition Act, Canada: Minister of Justice.
193
EUROPEAN COMMISSION’S DECISIONS
M. 616 (1995). Swissair/Sabena, July 20, 1995.
M. 806 (1996). British Airways/TAT (II), August 26, 1996.
M. 857 (1997). British Airways/Air Liberté, February 28, 1997.
M. 967 (1997). KLM/Air UK, September 22, 1997.
M. 1524 (1999). Airtours/First Choice, September 22, 1999.
M. 2220 (2001). General Electric/Honeywell, July 3, 2001.
M. 2283 (2001). Schneider/Legrand, October 10, 2001.
M. 2416 (2002). Tetra Laval/Sidel, October 30, 2001.
M. 2672 (2002). SAS/Spanair, March 5, 2002.
M. 3280 (2004). Air France/KLM, February 11, 2004.
M. 3770 (2005). Lufthansa/Swiss, July 4, 2005.
M. 3940 (2005). Lufthansa/Eurowings, December 22, 2005.
M. 4439 (2007). Ryanair/Aer Lingus, June 27, 2007.
M. 5141 (2008). KLM/Martinair, December 17, 2008.
M. 5335 (2009). Lufthansa/SN Airholding (Brussels Airlines), June 22, 2009.
M. 5364 (2009). Iberia/Clickair/Vueling, January 9, 2009.
M. 5403 (2009). Lufthansa/bmi, May 14, 2009.
M. 5434 (2009). Ryanair/Aer Lingus II, January 23, 2009.
M. 5440 (2009). Lufthansa/Austrian Airlines, August 28, 2009.
M, 5747 (2010). British Airways/Iberia. July 14, 2010.
M. 5830 (2011). Olympic/Aegean Airlines, January 26, 2011.
M. 6447 (2012). IAG/bmi, March 30, 2012.
M. 6663 (2013). Ryanair/ Aer Lingus III, February 27, 2013.
M. 6796 (2013). Aegean/Olympic II, October 9, 2013.
M. 7541 (2015). IAG/Aer Lingus, July 14, 2015.
COMP/37.730 (2002). Lufthansa/Austrian Airlines alliance, July 5, 2002.
COMP/39.258 (2010). Airfreight cartel. November 9, 2010.
194
REFERENCES
Abunassar, W. & Koford, K., 1994. A Reestimation of the Air transport Association Study of Airline Fares and
Study of Airline Fares and Concentration. Logistics and Transportation Review 4, pp. 363-378.
Adler, N. & Hanany, E., 2010. Trading capacity and capacity trade-offs. Working paper, Sauder School of
Business, University of British Columbia: Center for Transportation Studies.
Aharoni, Y., 1966. The foreign investment decision process. Boston: Harvard University.
airliners.de, 2013. Lufthansa signalisiert neues Interesse an Scandinavian Airlines. Available at:
http://www.airliners.de, [Accessed on October 29, 2014].
Akbar, Y., Németh, A. & Niemeier, H.-M., 2014. Here we go again. Permanently failing Organisations. Journal
of Air Transport Management 35, pp. 1-11.
Altman, W., 2009. Branson - the global brand builder. Engineering and Technology II, pp. 80-81.
Areeda, P., 1981. Antitrust Analysis. 3rd Edition. Boston: Little, Brown and Company.
Areeda, P. & Turner, D., 1975. Predatory Pricing and Related Practices under Section 2 of the Sherman Act.
Harvard Law Review 88(4), pp. 697-733.
Armantier, O. & Richard, O., 2006. Evidence on pricing form the Continental Airlines and Northwest Airlines
code-share agreement. pp. 91-108. In: Lee, D.(ed.). Airline Economics I., Amsterdam: Elsevier
Arndt, A., 2004. Liberalisierung des Luftverkehrs in der EU – Eine empirische Untersuchung der
Wohlfahrtswirkungen und des Anbieterverhaltens. Frankfurt: Peter Lang.
Arrow, K., 1972. General Economic Equilibrium: Purpose, Analytic Techniques, Collective Choice. Nobel
Memorial Lecture. Economic Sciences, December 12, 1972, pp. 109-131.
Arrow, K. J., 1974. Limited Knowledge and Economic Analysis. The American Economic Review 64(1), pp. 1-
10.
Ashenfelter, O., Ashmore, D., Baker, J. B. & McKernan, S. M., 1998. Identifying the firm-specific cost pass-
through rate, United States: FTC Bureau of Economics.
Air Transport World, 2005. Eurowings enjoys strong 2004 results, moves toward all-jet fleet. By Hoffman, K.
From May 24, 2005. Available at: http://atwonline.com/news/eurowings-enjoys-strong-2004-results-moves-
toward-all-jet-fleet [Accessed on January 6, 2015].
Aviation Week, 2009. SAS finally sells major Spanair stake to consortium. By Shannon, D. Available at:
http://aviationweek.com/awin/sas-finally-sells-major-spanair-stake-consortium [Accessed on March 14,
2009].
Bain, J., 1954. Economies of Scale, Concentration, and the Condition of Entry in Twenty Manufacturing
Industries. The American Economic Review 44(1), pp. 15-39.
Baker, J. B., 1999. Policy Watch. Developments in Antitrust Economics. Journal of Economic Perspectives
13(1), pp. 181-194.
Baker, J. B., 2002. A Preface to Post-Chicago Antitrust. In: Post-Chicago Developments in Antitrust Analysis.
Northampton: Edward Elgar.
Baker, J. B., 2007a. Beyond Schumpeter vs. Arrow: How Antitrust Fosters Innovation. Antitrust Law Journal
74(3), pp. 575-602.
Baker, J. B., 2007b. Market Definition: An Analytical Overview. Antitrust Law Journal 74(1), pp.129-173.
Baldwin, R. & Cave, M., 2008. Understanding Regulation. Theory, Strategy, and Practice. Oxford: Oxford
University Press.
Balfour, J., 2004. EC competition law and airline alliances. Journal of Air Transport Management 10(1), pp. 81-
85.
Ball, M-O., Ausubel, L. M., Berardino, F., Cramton, P., Donohue, G., Hansen, M., and Hoffman, K., 2007.
Market-based alternatives for managing congestion at New York's LaGuardia Airport. The Hague, 1st
Airneth Conference.
195
Barbot, C., Costa, A. & Sochirca, E., 2008. Airlines performance in the new market context: A comparative
productivity and efficiency analysis. Journal of Air Transport Management 14(5), p. 270– 274.
Barla, P. & Constantatos, C., 2006. On the choice between strategic alliance and merger in the airline sector:
The role of strategic effects. Journal of Transport Economics and Policy 40(3), pp. 409-424.
Barros, C. P. & Peypoch, N., 2009. An evaluation of European airlines’ operational performance. International
Journal of Production Economics 122(2), p. 525–533.
Bator, F., 1958. The Anatomy of Market Failure. The Quarterly Journal of Economics 72(3), pp. 351-379.
Baumol, W. J., 1982. Contestable Markets: An Uprising in the Theory of Industry Structure. The American
Economic Review 72(1), pp. 1-15 .
Baumol, W. J. & Willig, R. D., 1981. Fixed Costs, Sunk Costs, Entry Barriers, and Sustainability of Monopoly.
The Quarterly Journal of Economics 96(3), pp. 405-431.
Baye, M., 2009. Managerial Economics and Business Strategy. 6th ed. Boston: McGraw-Hill International.
Baye, M. & Hunter, 2010. Antitrust insights, London: NERA Economic Consulting.
Bel, G. & Fageda, X., 2008. Getting There Fast: Globalization, Intercontinental Flights and Location of
Headquarters. Journal of Economic Geography 8(4), pp. 471-495.
Bergamini, E., Gitto, S. & Mancuso, P., 2010. Restructuring the Alitalia business model. Journal of Air
Transport Management 16(1), pp. 16-19.
Beria, P., Niemeier, H.-M. & Fröhlich, K., 2011. Alitalia - the failure of a national carrier. Journal of Air
Transport Management 17(4), pp. 215-220.
Berry, S., 1992. Estimation of a model of entry in the airline industry. Econometrica 60(4), pp. 889-917.
Bian, L. & McFetridge, D., 2000. The efficiencies defense in merger cases: implications of alternative
standards. Canadian Journal of Economics 33(2), pp. 297-318.
Bilotkach, V., Cloghterty, J., Müller, J. & Zhang, A., 2012. Regulation, Privatization, and the Airport Charges:
Panel Data Evidence from European Airports. Journal of Regulatory Economics 42(1), pp. 73-94.
Bilotkach, V., Fageda, X. & Flores-Fillol, R., 2010. Scheduled Service versus Personal Transportation: The
Role of Distance. Regional Science and Urban Economics, Volume 40(1), pp. 60-72.
Bilotkach, V. & Hüschelrath, K., 2012. Airline alliances and antitrust policy: The role of efficiencies. Journal of
Air Transport Management 21, pp. 76-84.
Bilotkach, V., Müller, J. & Németh, A., 2014. Estimating the consumer welfare effects of de-hubbing: The case
of Malév Hungarian Airline. Transportation Research Part E: Logistics and Transportation Review 66, pp.
51-65.
Bilotkach, V. & Pai, V., 2014. Hubs versus airport dominance. Transportation Science. Published online: May
29, 2014, Permalink: http://dx.doi.org/10.1287/trsc.2014.0530, pp.166-179.
Bishop, S. & Walker, M., 2010. The Economics of EC Competition Law: Concepts, Application and
Measurement. 3rd ed. London: Sweet & Maxwell.
Blumenthal, W., 2010. Scope and Specificity in the 2010 Guidelines: A Pretty Good Balance. Antitrust 25(1),
pp.10-14.
Borenstein, S., 1989. Hubs and high fares: dominance and market power in the US airline industry. RAND
Journal of Economics 20(3), pp. 344-365.
Borenstein, S., 2011. Why can't US airlines make money? American Economic Review Papers and Proceedings
101(5), pp. 233-237.
Bork, R., 1993. The Antitrust Paradox. A Policy at War with itself. (1st ed. from 1978). New York: The Free
Press.
Bork, R. & Bowman, W., 1965. The Crisis in Antitrust. Columbia Law Review 65(3), pp. 363-376.
Brander, J. & Lewis, T., 1986. Oligopoly and Financial Structure: the Limited Liability Effect. American
Economic Review 76(5), pp. 956-970.
196
British Airways, 2009. The creation of a leading European airline group. Company presentation, November 12,
2009, pp. 1-18.
Brueckner, J. K., Dyer, N. J. & Spiller, P. T., 1992. Fare determination in airline hub-and-spoke networks.
RAND Journal of Economics 23(3), pp. 309-333.
Brueckner, J. K. & Spiller, P. T., 1991. Competition and mergers in airline networks. International Journal of
Industrial Organization 9(3), pp. 323-342.
Brueckner, J. K., Lee, D. & Singer, E., 2013. Airline Competition and Domestic U.S. Airfares: A
Comprehensive Reappraisal. Economics of Transportation 2(1), pp. 1-17.
Brueckner, J. K. & Pels, E., 2005. European airline mergers, alliance consolidation, and consumer welfare.
Journal of Air Transport Management 11(1), pp. 27-41.
Brussels Airlines, 2008. Brussels Airline and Lufthansa. Available at: https://www.brusselsairlines.com/en-
be/corporate/partnerships/brussels-airlines-and-lufthansa.aspx [Accessed on January 17, 2011].
Buccirossi, P., Ciari, L., Duso, T., Fridolfsson, S-O., Spagnolo, G. & Vitale, C., 2008. Ex-Post Review of
Merger Control Decisions. Brussels: European Commission.
Budzinski, O. & Kuchinke, B., 2012. Deal or No Deal? - Consensual Arrangements as an Instrument of
European Competition Policy. Ilmenau Economics Discussion Papers 17(76), pp. 1-40.
Budzinski, O. & Ruhmer, I., 2009. Merger Simulation in Competition Policy: A survey. Journal of Competition
Law and Economics 6(2), pp. 277-319.
Budzinski, O. & Wacker, K., 2007. The Prohibition of the proposed Springer-ProSieben Sat.1 Merger: How
Much Economics in German Merger Control? Journal of Competition Law and Economics 3(2), pp. 281-
306.
Button, K., 2003. Does the theory of the 'core' explain why airlines fail to cover their long-run costs of capital?
Journal of Air Transport Management 9(1), pp. 5-14.
CAPA, 2013a. Aegean Airlines' acquisition of Olympic: approved by The European Commission, but questions
remain. Available at: http://centreforaviation.com/analysis/aegean-airlines-acquisition-of-olympic-approved-
by-european-commission-but-questions-remain-133583 [Accessed on January 27, 2014].
CAPA, 2013b. Lufthansa CEO Christoph Franz: the SCORE so far, as the carrier refocuses strategy and
operations. Available at: http://centreforaviation.com/analysis/lufthansa-ceo-christoph-franz-the-score-so-
far-as-the-carrier-refocuses-strategy-and-operations-113978 [Accessed on June 14, 2013].
Carlsson, F., 2002. Price and Frequency Choice under Monopoly and Competition in Aviation Markets,
Göteborg University: Working Papers in Economics no. 71.
Carlton, D. W., Landes, W. M. & Posner, R. A., 1980. Benefits and costs of airline mergers: a case study. The
Bell Journal of Economics 11(1), pp. 65-83.
Caves, D. W., Christensen, W. & Tretheway, W. M., 1984. Economies of Density versus Economies of Scale:
Why Trunk and Local Service Costs Differ? RAND Journal of Economics 15(4), pp. 471-489.
Christiansen, A., 2009. Der "More Economic Approach" in der EU-Fusionskontrolle. Entwicklung,
konzeptionelle Grundlagen und kritische Analyse. Frankfurt am Main: Peter Lang.
Church, J. R. & Ware, R., 2000. Industrial Organization: A strategic approach. Boston: McGraw Hill.
Ciliberto, F. & Schenone, C., 2012. Bankruptcy and product-market competition: evidence from the airline
industry. International Journal of Industrial Organization 30(6), pp. 564-577.
Ciliberto, F. & Williams, J., 2010. Limited access to airport facilities and market power in the airline industry.
Journal of Law and Economics 53(3), pp. 467-495.
Clark, J., 1940. Toward a Concept of Workable Competition. The American Economic Review 30(2), pp. 241-
256.
Coase, R., 1937. The Nature of the Firm. Economica 4(16), pp. 386-405.
Conrady, R., Fichert, F. & Sterzenbach, R., 2009. Luftverkehr. 4th ed. München: Oldenbourg.
Cooper, M., 2011. Mergers between major airlines: The anti-competitive and anti-consumer effects of the
creation of a private cartel, Washington, DC: Consumer Federation of America.
197
Creel, M. & Farrell, M., 2001. Economies of scale in the US airline industry after deregulation: a Fourier series
approximation. Transportation Research Part E: Logistics and Transportation Review 37(5), pp. 321-336.
Czerny, A., Forsyth, P., Gillen, D. & Niemeier, H.-M., 2008. Airport Slots. International Experiences and
Options for Reform. Aldershot: Ashgate.
Daughety, A. F., 1990. Beneficial Concentration. The American Economic Review 80(5), pp. 1231-1237.
Davis, P. & Garcés, E., 2010. Quantitative Techniques for Competition and Antitrust Analysis. Princeton:
Princeton University Press.
De la Mano, M., Pesaresi, E. & Stehman, O., 2007. Econometric and survey evidence in the competitive
assessment of the Ryanair-Aer Lingus merger. Competition Policy Newsletter 3, pp. 73-81.
Deane, P., 1993. The evolution of economic ideas. 7th ed. (1st ed. from 1978). Cambridge: Cambridge University
Press.
Dempsey, P. S., 2002. Predation, competition and antitrust law: turbulence in the airline. Journal of Air Law and
Commerce 67, pp. 685-840.
Dempsey, P. S., 2008. The financial performance of the airline industry post-deregulation. Houston Law Review
45, pp. 421-485.
Dempsey, P. S., 2010. Airline alliances. Montreal: McGill University.
Demsetz, H., 1982. Barriers to Entry. The American Economic Review 72(1), pp. 47-57.
Dennis, N., 2007. End of the free lunch? The responses of traditional European airlines to the low-cost carrier
threat. Journal of Air Transport Management 13(5), pp. 311-321.
Dodgson, J. S., 1994. Competition policy and the liberalisation of European aviation. Transportation 21(4), pp.
355-370.
Doganis, R., 2002. Flying Off Course: The Economics of International Airlines. 3rd ed. London: Routledge.
Doganis, R., 2006. Airline business in the 21st Century. 2nd ed. London: Routledge.
Dresner, M., 2002. Metrics in the Airline Industry. In: Handbook of Airline Economics. New York: Aviation
Week, pp. 43-50.
Drexl, J., Kerber, W. & Podszun, R., 2011. Competition Policy and the Economic Approach: Foundations and
Limitations. Cheltenham: Edward Elgar Publishing Limited.
Dunn, A., 2008. Do low-quality products affect high-quality entry? Multi-product firms and nonstop entry in
airline markets. International Journal of Industrial Organization 26(5), pp. 1074-1089.
Dunning, J., 1981. International production and the multinational enterprise, London: Allen and Unwin.
Eatwell, J., Milgate, M. & Newman, P., 1987. The new Palgrave. A dictionary of economics. Volume I-II.
London: The Macmillan Press Limited.
Economides, N., 1996. The Economics of Networks. International Journal of Industrial Organization 14(6), pp.
673-699.
eia, 2016. U.S. Energy Information Administration. Available at: www.eia.gov [Accessed on October 7, 2015].
Eitel, D., 2004. The dynamics of chronic failure. Public Money Management 24(4), pp. 243-250.
Eurostat, 2012. European statistics on population. Available at:
http://epp.eurostat.ec.europa.eu/tgm/table.do?tab=table&init=1&plugin=1&language=en&pcode=tgs00080
[Accessed on October 31, 2012].
Evans, W. N. & Kessides, I. N., 1994. Living by the „golden rule”: multimarket contact in the US airline
industry. The Quaterly Journal of Economics, 109(2), pp. 341-366.
Ewald, C., 2005. Predatory pricing in the airline industry as a challenge to competition law enforcement. In:
Forsyth, P., Gillen, D., Mayer, O. & Niemeier, H-M. (editors). Competition versus predation in aviation
markets. Burlington: Ashgate, pp. 183-202.
Farrell, J. & Shapiro, C., 1990. Horizontal Mergers: An Equilibrium Analysis. American Economic Review
80(1), pp. 107-126.
198
Farrell, J. & Shapiro, C., 2010. Antitrust Evaluation of Horizontal Mergers: An Economic Alternative to Market
Definition. The B.E. Journal of Theoretical Economics 10(1), pp. 1-41.
Farrell, J. & Shapiro, C., 2010. Recapture, pass-through, and market definition. Antitrust Law Journal 76(3), pp.
585-604.
Fethi, M. D., Jackson, P. M. & Weyman-Jones, T. G., 2000. Measuring the efficiency of European airlines: an
application of DEA and Tobit Analysis, University of Leicester: EPRU.
Fichert, F., 2008. Regulation, Deregulation and Competition Policy in Transport Markets. In: I. R. Perspectives
(ed.). Network Industries between Competition and Regulation. Münster: LIT Publishing, pp. 129-141.
Fichert, F., 2013. Verkehrswesen - Theorie und Praxis. Berlin: LIT Verlag.
Financial Times Deutschland, 2011. Ready for Take-over. January 7, 2011.
Financial Times, 2009. Lufthansa to take control of BMI. By Done, K. & Wiesmann, G., June 23, 2009.
Financial Times, 2013. Brussels allows Aegean bid for Olympic in "failing firm" defence. By Barker, A. and
Hope, K., October 9, 2013.
Flores-Fillol, R. & Moner-Colonques, R., 2007. Strategic Formation of Airline Alliances. Journal of Transport
Economics and Policy 41(3), pp. 427-449.
Forsgren, M., 2008. Theories of the multinational firm, Cheltenham: Edward Elgar.
Forsyth, P. J., Hill, R. & Trengove, C., 1986. Measuring Airline Efficiency. Fiscal Studies. The Journal of
Applied Public Economics 7(1), pp. 61-81.
Fox, E., 2012. Against Goals. Fordham Law Revies 81(5), pp. 2157-2161.
Fox, E. M. & Sullivan, L. A., 1987. Antitrust-Retrospective and Prospective: Where are we come from? Where
are we going? New York University Law Review 62, pp. 936-988.
Francis, G., Humpres, I. & Fry, J., 2005. The nature and prevalence of the use of performance measurement
techniques by airlines. Journal of Air Transport Management 11(4), pp. 207-217.
Friedman, M., 1953. Essays in positive economics. Chicago: University of Chicago Press.
Fritsch, M., Wein, T. & Ewers, H.-J., 2005. Marktversagen und Wirtschaftspolitik. 6. ed. München: Vahlen.
Fritz, T., 2005. Cooperation and Integration as Strategic Options in the Airline Industry - A theoretical
assessment. In: W. Delfmann (ed.). Strategic management in the aviation industry. Aldershot: Ashgate, pp.
223-254.
Froeb, L., Tschantz, S. & Werden, G., 2005. Pass-through rates and price effects of mergers. International
Journal of Industrial Organization 23(9-10), pp. 703-715.
Fröhlich, K., Hellmers, J., Holtz, M, Grimme; W., Németh, A. & Niemeier, H-M., 2013. An assessment of the
synergies and the success of cross-border airline mergers and acquisitions in Europe, In: Forsyth, P., Gillen,
D., Hüschelrath, K., Niemeier, H-M. &Wolf, H. (editors). 2013. Liberalisation in Aviation. Surrey: Ashgate,
pp. 197-220.
Fröhlich, K., Müller, J., Németh, A., Niemeier, H-M., Njoya, E. T., and Paskin, R., 2011. Vertical Structure of
Air Transport: Problems for Competition and Regulation. Working paper. Melbourne, GARS.
FVW, 2007. Spannungsvolle Partnerschaft. By Jegminat, G. Das Magazin für Touristik und Business Travel 8,
pp. 68-70.
GAP, 2010. Study of the economic market power on the relevant market(s) for aviation and aviation-related
services on the Amsterdam Airport Schiphol, Berlin: Netherlands Competition Authority.
Gellhorn, E. & Kovacic, W., 1994. Antitrust Law and Economics. 4th ed. St. Paul: West Publishing Co.
Gellmann Research Associates, 1994. A study of international airline code sharing, Washington, DC.:
Department of Transport.
Gillen, D., 2008. Airport Slots: A Primer. In: A. Czerny, P. Forsyth, D. Gillen & H. Niemeier (editors). Airport
Slots. Aldershot: Ashgate, pp. 41-59.
199
Givoni, M., 2008. The network effect of aircraft and high-speed train substitution under airline and railway
integration. In: M. Giaoutzi & P. Nijkamp (editors). Network strategies in Europe. Burlington: Ashgate, pp.
207-218.
Glaum, M., 1996. Internationalisierung und Unternehmenserfolg. Wiesbaden: Springer.
Goolsbee, A. & Syverson, C., 2008. How do incumbents respond to the threat of entry? Evidence from the
major airlines. Quarterly Journal of Economics 123(4), pp. 1611-1633.
Götsch, B. & Albers, S., 2005. Synergy allocation in strategic airline alliances. In: W. Delfmann (ed.). Strategic
management in the aviation industry. Aldershot: Ashgate, pp. 275-303.
Gudmundson, S. V. & Lechner, C., 2006. Multilateral airline alliances: Balancing strategic constraints and
opportunities. Journal of Air Transport Management 12(3), pp. 153-158.
Hanlon, J. P., 2003. Global Airlines: competition in a transnational industry. 2nd ed. Amsterdam: Butterworth-
Heinemann.
Harberger, A. C., 1954. Monopoly and resource allocation. The American Economic Review 44(2), pp. 77-87.
Hawk, B., 1990. The EEC Merger Regulation: The first step toward one-stop merger control. Antitrust Law
Journal 59(1), pp. 195-235.
Hazledine, T., 1998. Rationalism Rebuffed? Lessons from Modern Canadian and New Zealand Competition
Policy. Review of Industrial Organization 13(1/2), pp. 243-264.
Heitzer, B., 2008. Consumer Surplus as a standard of competition policy. Paris, European Competition Day.
Herdzina, K., 1999. Wettbewerbspolitik. 5th ed. Stuttgart: Lucius und Lucius.
Hicks, J., 1941. The Rehabilitation of Consumer's Surplus. The Review of Economic Studies 8(2), pp. 108-116.
Hildebrand, D., 2009. The Role of Economic Analysis in the EC Competition Rules. 3rd ed. Alphen aan den
Rijn: Wolters Kluwer.
Holloway, S., 2002. Airlines: Managing to make money. Burlington, VT: Asghate.
Horan, H., 2010. Double Marginalization and the Counter-Revolution Against Liberal Airline Competition.
Transportation Law Journal 37(3), pp. 251-291.
Hovenkamp, H., 2009. The Neal Report and the Crisis in Antitrust. University of Iowa Legal Studies Research
Paper 9, February 24, 2009.
Hovenkamp, H., 2010a. Harvard, Chicago, and Transaction Cost Economics in Antitrust Analysis. University of
Iowa Legal Studies Research Paper 35, November 10, 2010.
Hovenkamp, H., 2010b. The Harvard and Chicago Schools and the Dominant Firm. University of Iowa Legal
Studies Research Paper 19, June 21, 2010.
Hüschelrath, K., 2005. The Lufthansa-Germania case at a glance. In: In: Forsyth, P., Gillen, D., Mayer, O. &
Niemeier, H-M. (editors). Competition versus predation in aviation markets. Burlington: Ashgate, pp. 173-
181.
Hüschelrath, K., 2009. Competition Policy Analysis. An Integrated Approach. Mannheim: Physica.
Hüschelrath, K. & Müller, K., 2013. The competitive effects of firm exit: Evidence from the US airline industry.
Economics of Transportation 2(2), pp. 72-85.
IATA, 2010. Slot-coordinated airports. Available at: http://www.iata.org/pressroom/airlines-
international/august-2010/Pages/06.aspx [Accessed on September 30, 2011].
IATA, 2011. Vision 2050, Singapore: International Air Transport Association.
IATA, 2016. Airline Cost Performance. IATA Economics briefing No. 5, Montreal: IATA.
Iatrou, K. & Alamdari, F., 2005. The empirical analysis of the impact of alliances on airline operations. Journal
of Air Transport Management 11(3), pp. 127-134.
Iatrou, K. & Oretti, M., 2007. Airline Choices for the Future: from Alliances to Mergers. Aldershot: Ashgate.
Ivaldi, M., Jullien, B., Rey, P., Seabright, P., and Tirole, J., 2003. The Economics of Unilateral Effects. Interim
Report for the DG Competition, European Commission, Toulouse: IDEI.
200
Ivaldi, M. & Verboven, F., 2005. Quantifying the effects from horizontal mergers in European competition
policy. International Journal of Industrial Organization 23(9-10), pp. 669-691.
Joskow, A. S., Werden, G. J. & Johnson, R. L., 1994. Entry, exit, and performance in airline markets.
International Journal of Industrial Organization 12(4), pp. 457-471.
Joskow, P. & Klevorick, A., 1979. A framework for analyzing predatory pricing policy, New Haven: Yale Law
School.
Kahn, A. E., 1995. The Economics of Regulation. Principles and Institutions. 6th ed. Cambridge: MIT Press.
Kamien, M. I. & Zang, I., 1990. The limits of monopolization through aquisition. The Quarterly Journal of
Economics 105(2), pp. 465-499.
Kay, J., 2004. The Truth About Markets. Why Some Nations are Rich but Most Remain Poor. London: Penguin
Books.
Keynes, J., 1930. Economic Possibilities for Our Grandchildren. In: Johnson, E., 1978. Collected Writings of
John Maynard Keynes. 9th ed. Cambridge: Cambridge University Press.
Kim, E. H. & Singal, V., 1993. Mergers and market power: evidence from the airline industry. The American
Economic Review 83(3), pp. 549-569.
Kleymann, B. & Seristö, H., 2001. Levels of airline alliance membership: balancing risks and benefits. Journal
of Air Transport Management 7(5), pp. 303-310.
Klumpp, U., 2005. Die "Efficiency Defense" in der Fusionskontrolle. Baden-Baden: Nomos.
Knieps, G., 2004. Limits to the (De-)Regulation of Transport Services. Working paper, University of Freiburg:
Institute for Transport Economics and Regional Policy.
Knieps, G., 2008. Wettbewerbsökonomie. 3rd ed. Berlin: Springer.
Knieps, G. & Neuscheler, T., 2009. Reformansätze bei der Vergabe von Start- und Landerechten auf Flughäfen.
In: G. Knieps & H. Weiß (editors). Fallstudien zur Netzökonomie. Wiesbaden: Gabler, pp. 111-138.
Knorr, A. & Arndt, A., 2004. Alliance strategy and the fall of Swissair: a comment. Journal of Air Transport
Management 10(2), pp. 119-123.
Kolasky, W. & Dick, A., 2003. The Merger Guidelines and the Integration of Efficiencies into Antitrust Review
of Horizontal Mergers. ABA: Antitrust Law Journal 71(1), pp. 207-251.
Kornai, J., 1980. Economics of Shortage. Amsterdam: North-Holland.
Kovacic, W. & Shapiro, C., 2000. Antitrust Policy: A Century of Economic and Legal Thinking. Journal of
Economic Perspectives 14(1), pp. 43-60.
Kühn, K.-U., 1997. Germany. In: Global Competition Policy. Washington, DC: Institute for International
Economics, pp. 115-150.
Kwoka, J. & Shumilkina, E., 2010. The price effect of eliminating potential competition: evidence from an
airline merger. The Journal of Industrial Economics 58(4), pp. 767-793.
Laaser, C.-F., 2001. Vor- und Nachteile globaler Allianzen im Luftverkehr. In: A. Knorr (ed). Europäischer
Luftverkehr - Wem nützen strategische Allianzen. Bergisch-Gladbach: DVWG, pp. 70-111.
Laffont, J.-J. & Tirole, J., 1991. Privatization and Incentives. Journal of Law, Economics & Organization,
Special Issue, January 7, 1991. pp. 84-105.
Lai, P.-L., Potter, A. & Beynon, M., 2012. The Development of Benchmarking Techniques in Airport
Performance Evaluation Research. Transportation Journal 51(3), pp. 305-337.
Lall, A., 2005. Predatory pricing: still a rare occurance? In: Forsyth, P., Gillen, D., Mayer, O. & Niemeier, H-M.
(editors). Competition versus predation in aviation markets. Burlington: Ashgate, pp. 37-56.
Landes, W., 1983. The Fire of Truth: A Remembrance of Law and Economics at Chicago, 1932-1970. In: Kitch,
E.W. (ed). Journal of Law and Economics 26(1), pp. 163-234.
Larouche, P., 2000. Relevant Market Definition in Network Industries: Air Transport and Telecommunications.
Competition and Regulation in Network Industries 1(4), pp. 407-446.
201
Lederman, M., 2007. Do enhancements to loyalty programs affect demand? The impact of international frequent
flyer partnerships on domestic airline demand. RAND Journal of Economics 38(4), pp. 1134-1158.
Lederman, M., 2008. Are frequent flyer programs a cause of the 'hub premium'? Journal of Economics &
Management Strategy 17(1), pp. 35-66.
Lee, D. & Luengo-Prado, M. J., 2005. The impact of passenger mix on reported "hub premiums" in the US
airline industry. Southern Economic Journal 72(2), pp. 372-394.
Leibenstein, H., 1966. Allocative efficiency vs. "X-efficiency". The American Economic Review 53(3), pp.
392-415.
Levin, D., 1990. Horizontal Mergers: the 50-per cent Benchmark. American Economic Review 80(5), pp. 1238-
1245.
LHG, 2005, 2006, 2007, 2009, 2011, 2014. Annual Reports, Cologne: Lufthansa Group. Available at:
http://investor-relations.lufthansagroup.com/en/finanzberichte/annual-report/2014.html [Last accessed on
September 30, 2015].
Lufthansa, 2010. Lufthansa Investor Day. Prock-Schauer, W., Frankfurt: Lufthansa Group.
Lufthansa, 2012. Lufthansa to sell bmi. Available at: http://www.lufthansagroup.com/en/press/news-
releases/singleview/archive/2012/april/20/article/2125.html [Accessed on July 21, 2015].
Lijesen, M. G., 2006. A mixed logit based valuation of frequency in civil aviation from SP-data. Transportation
Research Part E: Logistics and Transportation Review 42(2), pp. 82-94.
Lijesen, M. G., Rietveld, P. & Nijkamp, P., 2001. Hub premiums in European civil aviation. Transport Policy
8(3), pp. 193-199.
Lin, J.-S. C., Dresner, M. & Windle, R., 2002. Determinants of price reactions to entry in the US airline
industry. Transportation Journal 41(2/3), pp. 5-22.
Lipczynski, J. & Wilson, J., 2001. Industrial Organisation. An Analysis of Competitive Market. London:
Pearson.
Littlechild, S., 1981. Misleading Calculations of the Social Costs of Monopoly Power. The Economic Journal
91(362), pp. 348-363.
Lyons, B. R., 2003. Could Politicians Be More Right Than Economists? A Theory of Merger Standards. EUI
Working Papers 14, European University Institute: Robert Schuman Centre for Advanced Studies.
Lyons, B. R., 2004. Reform of European Merger Policy. Review of International Economics 12(2), pp. 246-261.
Lyons, B. R., 2012. Economics of Mergers. Chania: CRESSE. Summer School and Conference in Competition
and Regulation.
Malév Horizon Magazine, September 2010, Budapest.
Mankiw, N. G. & Taylor, M. P., 2011. Economics. 2nd ed. Andover: Cengage Learning EMEA.
Maslow, A. H., 1966. Psychology of Science: A Reconnaissance. (Ed 2004). Maurice Bassett Publishing.
Mason, E., 1937. Monopoly in Law and Economics. The Yale Law Journal 47(1), pp. 34-49.
Mason, E., 1939. Price and Production Policies of Large-Scale Enterprise. The American Economic Review
29(1), pp. 61-74.
Mayrhuber, W., 2009. On solid strategic track in turbulent times. Seeheim: Lufthansa Training.
Mercuro, N. & Medema, S. G., 2006. Economics and the Law: From Posner to Post-Modernism and Beyond.
2nd ed. Princeton: Princeton University Press.
Merkert, R. & Morrell, P. S., 2012. Mergers and aquisitions in aviation - Management and economic
perspectives on the size of airlines. Transportation Research Part E: Logistics and Transportation Review
48(4), pp. 853-862.
Meyer, M. & Zucker, L., 1989. Permanently Failing Organizations. Newbury Park, CA: Sage Publications.
Monti, M., 2002. Review of the EC Merger Regulation - Roadmap for the reform project. Brussels, British
Chamber of Commerce, pp. 1-11.
202
Morck, R. & Yeung, B., 1992. Internalization. An event study test. Journal of International Economics 33(1-2),
pp. 41-56.
Morrell, P., 2002. Capital productivity and the Role of Capital Intensity in Airline Labor Productivity. In:
Handbook of Airline Economics. New York: Aviation Week, pp. 487-500.
Morrison, S. A., 2001. Actual, adjacent, and potential competition, estimating the full effect of Southwest
Airlines. Journal of Transport Economics and Policy 35(2), pp. 239-256.
Morrison, S. A. & Winston, C., 1995. The evolution of the airline industry. Washington, DC: The Brookings
Institution.
Morrison, S. A. & Winston, C., 1989. Enhancing the Performance of the Deregulated Air Transportation
System. Brookings Papers on Economic Activity. Microeconomics, pp. 61-123.
Morrison, W.G., 2005. A case of beer and pretzels. In: Forsyth, P., Gillen, D., Mayer, O. & Niemeier, H-M.
(editors). Competition versus predation in aviation markets. Burlington: Ashgate, pp. 237-247.
Motta, M., 2004. Competition Policy. Cambridge: Cambridge University Press.
Morgan Stanley Research, 2010. Deutsche Lufthansa AG. August 6, 2010, London: MSR.
Neher, D., Russo, D. & Zona, J., 2013. Lessons from the Superior-ICG Merger. George Mason Law Review
12(2), pp. 289-318.
Németh, A., 2011a. (Market) Power of European Airlines. Working paper. Sydney: ATRS Air Transport
Research Society.
Németh, A., 2011b. Strategies for Eastern European Airlines: The case of Malév Hungarian Airline. Avaiable
at: http://www.crninet.com/2011/c12c.pdf, Brussels: CRNI Competition and Regulation in Network
Industries.
Németh, A. & Niemeier, H.-M., 2012. Airline mergers in Europe - An overview on the market definition of the
EU commission. Journal of Air Transport Management 22, pp. 45-52.
Németh, A. & Remetei-Filep, Á., 2010. The Economic Analysis of Airline Consolidation: Whether the
Commission got the Economics Right. Working paper. Amsterdam: GARS German Aviation Research
Society
New York Times, 1991. United Bid Gets Assets of Pan Am. By Salpukas, A., December 10, 1991.
New York Times, 1992. Redrawing the International Air Map. By MacNeille, S., March 1, 1992.
New York Times, 2004. Aaron Director, Economist, Dies at 102. By Martin, D., September 16, 2004.
Nicholson, W. & Snyder, C., 2010. Theory and Application of Intermediate Microeconomics. 11th ed. Canada:
South-Western Cengage Learning.
OECD, 2000. Airline Mergers and Alliances, Paris: OECD Organisation for Economic Co-operation and
Development.
Oliveira, A., 2008. An empirical model of low-cost carrier entry. Transportation Research Part A: Policy and
Practice 42(4), pp. 673-695.
Oum, T., Park, J. & Zhang, A., 2000. Globalization and Strategic Alliances: The Case of Airline Industry. New
York: Pergamon.
Park, J.-H., 1997. Strategic airline alliance: modelling and empirical analysis. Doctoral dissertation. Vancouver:
University of British Columbia.
Pavlova, T., 2011. Case Handler, European Commission DG Competition [Interview] November 11, 2011.
Brussels
Peeperkorn, L. & Verouden, V., 2007. The Economics of Competition. In: The EC Law of Competition. 2nd ed.
Oxford: Oxford University Press, pp. 3-86.
Pepall, L., Richards, D. & Norman, G., 2011. Contemporary Industrial Organization. A Quantitative Approach.
Danvers: Wiley.
Perry, M. K. & Porter, R. H., 1985. Oligopoly and the incentive for horizontal merger. The American Economic
Review 75(1), pp. 219-227.
203
Peters, C., 2003. Evaluating the Performance of Merger Simulation: Evidence from the US Airline Industry,
Northwestern University: The Center for the Study of Industrial Organization.
Pilarski, A., 2007. Why can't we make money in aviation? London: Ashgate.
Pitofsky, R., 2008. How the Chicago School Overshot the Mark. The Effect of Conservative Economic Analysis
on U.S. Antitrust. Oxford: Oxford University Press.
Posner, R., 2007. Economic Analysis of Law. 7th ed. New York: Aspen Publishing.
Redondi, R., Malighetti, P. & Paleari, S., 2012. De-hubbing of airports and their recovery patterns. Journal of
Air Transport Management 18(1), pp. 1-4.
Reiss, P. C. & Spiller, P. T., 1989. Competition and Entry in Small Airline Markets. Journal of Law and
Economics 32(2), pp. 179-202.
Renckens, A., 2007. Welfare Standards, Substantive Tests, and Efficiency Considerations in Merger Policy:
Defining the Efficiency Defense. Journal of Competition Law and Economics 3(2), pp. 149-179.
Rey, P., 2003. Toward a Theory of Competition Policy. In: Advances in Economics and Econometrics.
Cambridge: Cambridge University Press, pp. 82-132.
Robbins, L., 2000. A History of Economic Thought. The LSE Lectures. 5th ed. Princeton: Princeton University
Press.
Röller, L.-H., Stennek, J. & Verboven, F., 2000. Efficiency Gains from Mergers. The Research Institute of
Industrial Economics, Issue 543, December 20, 2000.
Roll, R., 1986. The Hubris Hypothesis of Corporate Takeovers. Journal of Business 59(2), pp. 197-216.
Romero-Hernandez, M. & Cabrera, H., 2005. Economies of density, network size and spatial scope in the
European airline industry, UC Berkeley, CA: Institute of Transportation Studies.
Rosenbluth, G., 1955. Measures of concentration. In: Stigler, G. (ed). Business Concentration and Price Policy.
Massachusetts: NBER National Bureau of Economic Research, pp. 57-99.
Rose, N. L., 2012. After Airline Deregulation and Alfred E. Kahn. American Economic Review 102(3), pp.
376-80.
Salant, S. W., Switzer, S. & Reynolds, R. J., 1983. Losses from horizontal merger: The effects of an exogenous
change in industry structure on Cournot-Nash equilibrium. The Quarterly Journal of Economics 98(2), pp.
185-199.
Salop, S. C. & Scheffman, D. T., 1983. Raising Rivals' Costs. The American Economic Review 73(2), pp. 267-
271.
Samuelson, P. & Nordhaus, W., 1989. Economics. 13th ed. New York: McGraw-Hill.
Scheffman, D. T. & Higgins, R. S., 2003. Twenty years of raising rivals' costs: history, assessment, and future.
George Mason Law Review 12(2), pp. 371-387.
Scheraga, C. A., 2004. Operational efficiency versus financial mobility in the global airline industry: a data
envelopment and Tobit analysis. Transportation Research Part A: Policy and Practice 38(5), pp. 383-404.
Scherer, F. M., 1970. Industrial Market Structure and Economic Performance. Chicago: RAND McNally.
Scherer, F. M., 1986. Innovation and Growth: Schumpeterian Perspectives. Cambridge: The MIT Press
Classics.
Scherer, F. M., 2008. Conservative Economics and Antitrust: A Variety of Influences. In: How the Chicago
School Overshoot the Mark. The Effect of Conservative Economic Analysis on U.S. Antitrust. Oxford:
Oxford University Press, pp. 30-39.
Scherer, F. M. & Ross, D., 1990. Industrial Market Structure and Economic Performance. 3rd ed. Boston:
Houghton Mifflin.
Schmalensee, R., 1988. Industrial Economics: An Overview. The Economic Journal 98(392), pp. 643-681.
Schmalensee, R., 2009. Should New Merger Guidelines Give UPP Market Definition? Antitrust Chronicle 12.
Scitovsky, T., 1951. The State of Welfare Economics. The American Economic Review 41(3), pp. 303-315.
204
Seth, A., 1990. Value creation in aquisitions: A re-examination of performance issues. Strategic Management
Journal 11(2), pp. 99-115.
Shapiro, C., 1989. The Theory of Business Strategy. RAND Journal of Economics 20(1), pp. 125-137.
Shapiro, C., 2010. A tribute to Oliver Williamson: Antitrust Economics. California Management Review 52(2),
pp. 138-146.
Shavell, S., 2004. Foundations of Economic Analysis of Law. Cambridge: The Belknap Press of Harvard
University Press.
Shove, G., 1942. The Place of Marshall's Principles in the Development of Economic Theory. The Economic
Journal 52(208), pp. 294-329.
Shy, O., 2010. A Short Survey of Network Economics. Review of Industrial Organization 38(2), pp. 119-149.
Sinclair, R. A., 1995. An empirical model of entry and exit in airline markets. Review of Industrial Organization
10(5), pp. 541-557.
Singal, V., 1996. Airline mergers and multimarket contact. Managerial and Decision Economics 17(6), pp. 559-
574.
Smith, A., 1776. The Wealth of Nations. 5th (2003) ed. New York: Bantam Classic.
Snyder, C. & Nicholson, W., 2008. Microeconomic Theory. Basic Principles and Extensions. 10th ed. Mason:
South-Western Cengage Learning.
Socorro, M. P., 2007. Mergers under uncertainty: The effects of debt financing. The Manchenster School 75(5),
pp. 580-597.
Spector, D., 2003. Horizontal mergers, entry, and efficiency defences. International Journal of Industrial
Organization 21(10), pp. 1591-1600.
Starkie, D., 2005. A capacity lock-in rule. In: Forsyth, P., Gillen, D., Mayer, O. & Niemeier, H-M. (editors).
Competition versus predation in aviation markets. Burlington: Ashgate, pp. 289-303.
Starkie, D., 2008. Aviation Markets. Studies in Competition and Regulatory Reform. Hampshire: Ashgate.
Statistisches Bundesamt, 2016. German statistic data. Available from:
https://www.destatis.de/DE/ZahlenFakten/GesamtwirtschaftUmwelt/VerdiensteArbeitskosten/Arbeitskosten
Lohnnebenkosten/Tabellen/IndexJaehrlich.html [Accessed on January 13, 2016].
Stigler, G. J., 1957. Perfect competition, historically contemplated. Journal of Political Economy 65, pp. 1-17.
Stigler, G. J., 1971. The theory of economic regulation. The Bell Journal of Economics and Management
Science 2(1), pp. 3-21.
Stigler, G. J., 1982a. The Economists and the Problem of Monopoly. The American Economic Review 72(2),
pp. 1-11.
Stigler, G. J., 1982b. Nobel-Prize lecture. Available at: http://www.nobelprize.org/nobel_prizes/economic-
sciences/laureates/1982/stigler-facts.html [Accessed on November 4, 2013].
Stiglitz, J., 2009. Regulation and Failure. In: New Perspectives on Regulation. Cambridge: The Tobin Project,
pp. 11-23.
Stragier, J., 2002. EC Competition Policy in the Aviation Sector: State of Play and Outlook. March 22, 2002.
Conference Paper. Lisbon, GEBTA Guild of European Business Travel Agents.
Syverson, C., 2011. What determines productivity? Journal of Economic Literature 49(2), pp. 326-365.
The Economist, 2003. Competition is all. December 4, 2003, p. 90.
The Telegraph, 2008. Bmi set for takeover by Lufthansa. By Osborne, A., April 26, 2008.
Thurlow, C. & Aiello, G., 2007. National pride, global capital. A socio semiotic analysis of transnational visual
branding in the airline industry. Visual Communication 6(3), pp. 305-344.
Tirole, J., 1988. The theory of industrial organization. Boston: MIT Press.
Tretheway, M. W., 1989. Frequent Flyer Programs: Marketing Bonanza or Anti-Competitive Tool? Journal of
the Transportation Research Forum 1, pp. 195-201.
205
Tretheway, M. W. & Kincaid, I. S., 2005. The effect of market structure on airline prices: A review of empirical
results. Journal of Air Law and Commerce 70, pp. 467-498.
Tretheway, M. W. & Oum, T. H., 1992. Airline Economics. Foundations for Strategy and Policy. Vancouver:
Centre for Transportation Studies.
van den Bergh, R., 2007. The 'More Economic Approach' and the Pluralist Tradition of European Competition
Law. Comment on Christian Kirchner. In: The More Economic Approach to European Competition Law.
Tübingen: Mohr Siebeck, pp. 27-36.
Vanberg, V., 2011. The Freiburg School: Walter Eucken and Ordoliberalism. Freiburg Discussion Papers on
Constitutional Economics 4, pp. 1-21.
Veldhuis, J., 2005. Impact of the Air France - KLM merger for airlines, airports and air transport users. Journal
of Air Transport Management 11(1), pp. 9-18.
Verboven, F., 2012. Quantitative Analysis for Competition Policy. Chania: CRESSE. Summer School and
Conference in Competition and Regulation.
Vickers, J., 2003. Competition economics. London: Royal Institution, pp. 1-8.
Viscusi, W., Harrington, J. & Vernon, J., 2005. Economics of Regulation and Antitrust. Cambridge: The MIT
Press.
Wan, X., Zou, L. & Dresner, M., 2009. Assessing the price effects of airline alliances on parallel routes.
Transportation Research Part E: Logistics and Transportation Review 45(4), pp. 627-641.
Werden, G., 1996. A Robust Test for Consumer Welfare Enhancing Mergers Among Sellers of Differentiated
Products. Journal of Industrial Economics 44(4), pp. 409-413.
Werden, G., 2011. Consumer welfare and competition policy. In: Competition Policy and the Economic
Approach. Cheltenham: Edward Elgar, pp. 11-43.
Werden, G. & Froeb, L. M., 1994. The effects of mergers in differentiated products industries: Logit demand
and merger policy. Journal of Law, Economics and Organization 10(2), pp. 407-426.
Werden, G., Joskow, A. S. & Johnson, R. L., 1991. The effects of mergers on price and output: two case studies
from the airline industry. Managerial and Decision Economics 12(5), pp. 341-352.
Weyl, E. G. & Fabinger, M., 2013. Pass-through as as economic tool: Principles of incidence under imperfect
competition. Journal of Political Economy 121(3), pp. 528-583.
Whish, R., 2009. Competition Law. Oxford: Oxford University Press.
White, B., 1992. Countervailing Power: Different Rules for Different Markets? Conduct and Context in
Antitrust Law and Economics. Duke Law Journal 41(5), pp. 1045-1094.
Williamson, O. E., 1968. Economies as an Antitrust Defense: The Welfare Tradeoffs. The American Economic
Review 58(1), pp. 18-36.
Williamson, O. E., 1975. Markets and Hierarchies - Analysis and Antitrust Implications: A Study in the
Economics of Internal Organization. New York: The Free Press.
Williamson, O. E., 1981. The Economics of Organization: The Transaction Cost Approach. American Journal of
Sociology 87(3), pp. 548-577.
WirtschaftsBlatt, 2012. Neue Details zum Betrugsfall Amber Gold. Available at:
http://wirtschaftsblatt.at/home/nachrichten/europa_cee/1291836/Neue-Details-zum-Betrugsfall-Amber-Gold
[Accessed on March 10, 2015].
Wojahn, O., 2012. Why does the airline industry over-invest? Journal of Air Transport Management 19, pp. 1-8.
Wolf, H., 2001. Network effects of bilaterals; implications for the German air transport policy. Air Transport
Management 7(1), pp. 63-74.
Youssef, W. & Hansen, M., 1994. Consequences of Strategic Alliances between international Airlines. The case
of Swissair and SAS. Transportation Research Part A: Policy and Practice 28(5), pp. 415-431.
Zhang, A., Hui, Y. V. & Leung, L., 2004. Air cargo alliances and competition in passenger markets.
Transportation Research Part E: Logistics and Transportation Review 40(2), pp. 83-100.