Do financial markets care about SRI? Evidence from mergers...
25
1 Do financial markets care about SRI? Evidence from mergers and acquisitions by Nihat Aktas*, Eric de Bodt, and Jean-Gabriel Cousin This draft: March 3, 2009 ABSTRACT. Mergers and acquisitions offer a framework for shedding new light on the stock market performance of socially responsible investments. Innovest’s Intangible Value Assessment (IVA) ratings provide a measure of firms’ ability to cope with social and environment risks. Using these ratings, this research demonstrates the positive relation between acquirer gains and the level of the targets’ social and environmental risk management practices. This result does not emerge when the target has a higher rating than the acquirer. Thus, the findings suggest that the stock market rewards the acquirer for realizing socially and environmentally responsible investments. KEYWORDS. Socially responsible investments, merger and acquisition, event study, abnormal returns Aktas de Bodt Cousin Address EMLYON Business School 23 av. Guy de Collongue 69130 Ecully France Université de Lille 2 Lille School of Management 1 place Déliot - BP381 59020 Lille Cédex France Université de Lille 2 Lille School of Management 1 place Déliot - BP381 59020 Lille Cédex France Voice +33-4-7833-7847 +33-3-2090-7477 Voice: +33-3-2090-7477 Fax +32-4-7833-7928 +33-3-2090-7629 Fax: +33-3-2090-7629 E-mail [email protected] [email protected] [email protected] *Corresponding author
Transcript of Do financial markets care about SRI? Evidence from mergers...
1
Do financial markets care about SRI? Evidence from mergers and acquisitions
by
Nihat Aktas*, Eric de Bodt, and Jean-Gabriel Cousin
This draft: March 3, 2009
ABSTRACT. Mergers and acquisitions offer a framework for shedding new light on the stock market performance of socially responsible investments. Innovest’s Intangible Value Assessment (IVA) ratings provide a measure of firms’ ability to cope with social and environment risks. Using these ratings, this research demonstrates the positive relation between acquirer gains and the level of the targets’ social and environmental risk management practices. This result does not emerge when the target has a higher rating than the acquirer. Thus, the findings suggest that the stock market rewards the acquirer for realizing socially and environmentally responsible investments. KEYWORDS. Socially responsible investments, merger and acquisition, event study, abnormal returns
Aktas de Bodt Cousin
Address
EMLYON Business School 23 av. Guy de Collongue 69130 Ecully France
Université de Lille 2 Lille School of Management 1 place Déliot - BP381 59020 Lille Cédex France
Université de Lille 2 Lille School of Management 1 place Déliot - BP381 59020 Lille Cédex France
Voice +33-4-7833-7847 +33-3-2090-7477 Voice: +33-3-2090-7477 Fax +32-4-7833-7928 +33-3-2090-7629 Fax: +33-3-2090-7629
E-mail [email protected] [email protected] [email protected]
*Corresponding author
Do financial markets care about SRI? Evidence from mergers and
acquisitions
Socially responsible investing (SRI)1 has developed to a remarkable extent worldwide.
According to the Social Investment Forum (2007), assets in SRI portfolios have increased by
more than 324% (from $639 billion in 1995 to $2.71 trillion in 2007), while in the same
period, total assets under professional management increased by less than 260% ($7 trillion to
$25.1 trillion). The same trend appears in Europe (e.g., see Eurosif’s 2008 study on European
SRI).2
The rapid development of the SRI market has attracted interest from the academic
community, yet debate still rages regarding whether financial markets care about social and
environmental dimensions. Empirical results have been mixed. Derwall et al. (2005) argue
that SRI improves portfolio performance, according to the eco-efficiency scores they use to
rank U.S. companies and construct mutually exclusive portfolios. The portfolio that features
stocks with the highest scores outperforms the portfolio of stocks with lower scores by 6%
per annum during 1997–2003. Bauer et al. (2005) instead report that SRI funds in the United
States and United Kingdom yield the same risk-adjusted return, on average, as traditional
funds. In a more recent international study, Renneboog et al. (2008) indicate that SRI funds in
the United States, United Kingdom, and many continental European and Asia-Pacific
countries underperform their domestic benchmarks by –2.2% to –6.5% per annum. This
result seems consistent with the proposition that investors pay a price for their ethics. Fisher-
Vanden and Thorburn (2008) reveal that voluntary corporate environmental initiatives yield
negative stock performance, according to a sample of 58 U.S. firms that joined Climate
Leaders, a program related to climate change, and that suffered significantly negative
abnormal returns around the date of their announcement. This result suggests that corporate
commitments to reduce greenhouse gas emissions may conflict with shareholder value
maximization goals.
In view of these contradictory results, the question of whether SRI provides value
creation or destruction for shareholders remains largely open. We therefore conduct an
analysis based on mergers and acquisitions (M&A) to shed a new light on this question. We
focus on a sample of listed acquirers and measure wealth effects according to stock market
reactions (i.e., abnormal returns,3 from event study methodology) to the announcement. Thus,
we can analyze the impact of targets’ social and environmental performance on acquirer
gains. Our measure of the target firm’s environmental and social performance comes from the
Innovest group’s social and environmental performance ratings.
To the best of our knowledge, social and environmental dimensions in M&A decisions
generally have been overlooked in finance literature.4 Yet M&A markets offer interesting
frameworks for complementary insights on the ability of SRI to generate financial
performance. In M&A transactions, the investor is a company, not a fund manager or an
individual investor, so acquirer stock price reactions to the announcement of an investment
decision provides a direct measure of the gain associated with the decision. Moreover,
because we relate the financial performance of the acquirer to the environmental performance
of the target company, we avoid endogeneity issues (i.e., is environmental performance a
cause or a consequence of financial performance?).5
We organize the remainder of this article as follows: In the next section, we present our
research questions more in detail. Then, we consider the sample of M&As, Innovest ratings,
and empirical methods. After we discuss the empirical analysis and results, we provide a
summary and conclusion.

Research question: Does socially responsible investment pay?
Within our M&A framework, the investor represents the acquiring company. Significant
corporate finance literature investigates the determinants of an acquirer’s abnormal returns
around M&A decision announcements and identifies the most important as the payment
means, the target’s status, the relative size of the deal, and uncertainty about the target’s
valuation (for a review, see Betton et al., 2008). We propose adding a novel determinant to
this list, namely, the target’s ability to cope with social and environmental risks (i.e., social
and environmental performance of the target).
If SRIs are value-creating decisions, acquirer abnormal returns should have a positive
relationship with the level of social and environmental performance of the target. Several
arguments support this value-creation hypothesis. For example, a signaling effect may be
associated with the acquisition of socially responsible targets. Some authors also argue that
increased social and environmental performance can enhance a firm’s input–output
efficiency, generate new market opportunities, or signal management quality (e.g., Fombrun
and Shanley, 1990; Porter and van der Linde, 1995). Therefore, acquiring a socially
responsible firm could be a signal, sent by the acquirer, about willingness to increase or
maintain social and environmental screening and manage social and environment risks.
Therefore, we hypothesize:
Hypothesis 1: If socially and environmentally responsible investments create
value, acquirer abnormal returns should relate positively to the target’s social
and environmental performance.
However, according to theory that posits a market for corporate control analysis (Manne,
1965), positive acquirer abnormal returns may be compatible with SRIs as value-destroying
investment strategies. That is, social and environmental responsibility might be achieved only
to the detriment of the firm’s financial performance. Walley and Whitehead (1994) argue, for
example, that adopting ethical standards will translate into higher output prices, which
negatively affects the competitiveness and profitability of the firm. If social responsibility
cannot be achieved without destroying shareholder value, socially responsible companies
should be more frequent targets of takeover bids. The theory of the market for corporate
control also posits that managers of wealth-destroying companies get replaced by more
efficient management teams (Manne, 1965; Jensen and Ruback, 1983), implying that the
takeover market exerts external controls on managers who deviate from behavior that
maximizes shareholder wealth. An exemplary case involves Mittal (the acquirer) and Arcelor
(the target), in which the riskier company, from a social and environmental point of view,
took over a more SRI-aware company.6 We consider whether this result generalizes to a
broader sample of M&A operations. Moreover, if stock markets value SRI negatively,
according to the disciplinary view of mergers, stock markets’ reactions should be more
positive when the social and environmental rating of the target is greater than that of the
bidder. Then the positive bidder abnormal returns would reflect the anticipation of wealth
creation, due to the replacement of inefficient target management teams. We therefore posit
Hypothesis 2. According to the market for corporate control theory, socially
responsible firms are more often targets of (disciplinary) takeovers.
Hypothesis 3. Gain to the acquirer increases when a less socially responsible
firm takes over a more socially responsible firm.
Data and methods
Environmental and social performance
To measure the firm’s ability to cope with social and environmental risks, we use data
obtained from Innovest Strategic Value Advisors (hereafter, Innovest), a financial service
leader that analyzes the economic impact of environmental and social issues. The Innovest

group provides several ratings of firms’ environmental, social, and governance performance;
we use the Intangible Value Assessment (IVA), which is a composite measure of 120
performance factors, including innovation capacity, product liability, governance, human
capital, emerging markets, and environmental opportunities and risk. We also employ two
specific components of the IVA score: environmental (ENV) and social (SOC) ratings.
Several recent articles use these ratings as well (e.g., Becker and Gluck, 2004; Derwall et al.,
2005; Ringov and Zollo, 2007). However, to the best of our knowledge, ours is the first study
to use Innovest ratings as potential determinants of wealth effects associated with M&A
transactions.
Companies earn high IVA, ENV, and SOC scores by exhibiting low environmental or
social risks and a strong strategic position that enables them to capture environmentally or
socially based profit opportunities. Innovest’s methodology not only reflects historical
environmental and social performance but also identifies future environmental and social
risks and opportunities. As another strength, the Innovest method rates firms relative to other
firms in their industry.
The Innovest database provides IVA ratings for 2000–2007. Because social and
environmental performance ratings have low variability (Derwall et al., 2005), we extrapolate
this notation three years backward, to 1997. Table I describes the Innovest ratings, which go
from AAA (best) to CCC (worst).
Merger and acquisition announcements
We extract the M&A sample from the Thomson Securities Data Company (SDC)
database. We impose the following sample selection criteria: (1) completed deals announced
between 1997 and 2007, (2) deal size greater than $1 million, (3) percentage held by the

bidder after the deal equal to 100%, and (4) Innovest ratings available for both the bidder and
the target.
The last criterion reduces the sample size drastically. Our sample therefore encompasses
125 different deals for which we have at least one of the three Innovest ratings (IVA, ENV,
or SOC) for both the bidder and the target. Table II provides the sample distribution by
announcement year. Our sample deals concentrate in the most recent time period (i.e.,
72.80% of the deals were announced during 2005–2007), likely because coverage by the
Innovest database is greater for more recent periods. Table III presents the number of
observations for which we can match M&A deals with Innovest ratings. The availability of
control variables constraints the size of samples used in the regression analyses further.
Abnormal stock performance
Since Fama et al. (1969) published their study, the accepted method for isolating the
impact of a particular event on market valuations is theevent study methodology. In the first
step, we construct a model for normal returns, that is, the individual firm returns that would
have occurred in the absence of the event. We use the following market model to estimate
these normal returns:
Rjt = αj + βjRMt + εjt, (1)
where Rjt is the observed return for firm j on day t; RMt is a concurrent local country stock
market index; αj and βj are, respectively, the estimated ordinary least squares (OLS)
regression intercept and slope; and εjt is a regression residual.7 The stock market data come
from Datastream. We estimate the market model parameters over the period from event day –
250 to event day –10, where event day 0 is the acquisition announcement date. Before
computing the corresponding returns, we convert all local prices and stock indexes into USD
denominated prices, using the appropriate exchange rate.8 The abnormal return (AR) for day t

corresponds to the difference between the observed return on day t and that estimated using
the market model:
ARjt = Rjt – (αj + βjRMt). (2)
To compute the cumulative abnormal return (CAR), we determine, for each firm, the
abnormal return across the three days around the announcement day (from day –1 to day +1,
where day 0 is the announcement day).
At the deal level (considering both the bidder and the target), we form a value-weighted
portfolio of the two firms and use market-model adjusted returns around the initial
acquisition announcements. When the bidder and target are listed on different stock exchange
markets, we include their local indexes in the market model regression. The countries
involved in the sample, the corresponding local stock market indexes, and their currencies
appear in Table IV.
In Table V, we report the average CAR for the acquirer, the target, and the deal. The
average acquirer CAR is negative (–1.15%) without being significant, largely consistent with
prior literature, which shows that acquirers’ CARs around the announcement date equal zero
or are slightly negative. For example, the average acquirer CAR is –0.7% in Andrade et al.
(2001) study of U.S. bidders and –0.15% for a sample of 583 international acquirers
investigated by Aktas et al. (2004). Neither result is statistically significant at conventional
levels.9
The average target CAR is 10.25%, significantly lower than in previous U.S. studies.
Mulherin and Boone (2000) find a target CAR of 20.2% in a sample of 281 combinations
during 1990–1999, and Andrade et al. (2001) report a 15.9% return during 1990–1998.
However, Campa and Hernando (2004) report an average CAR of 3.93% for European
targets, and Aktas et al. (2004) find an average target CAR of 10.15% for a sample of
international deals passed the regulatory actions of the European Commission.
For the combined firms (acquirer plus target), Table V displays significant wealth
creation effects for shareholders around the announcement day. The average CAR at the deal
level is 1.17%, with a p-value of 0.00. Thus, our sample deals appear to be synergistic
combinations, and much of the synergy gains accrue to target shareholders. The deal CAR is
very close to previously reported results (e.g., 1.5%, Aktas et al., 2004, 2007; 1.4%, Andrade
et al., 2001).
We also provide the average takeover premium in Table V, obtained from SDC. It
corresponds to the share price offered by the acquirer to target shareholders, deflated by the
stock price of the target one week prior to the announcement date. The average one-week
premium offered by the acquirer is 22.13%, lower than the 32.84% premium reported by
Wang and Xie (2009) for U.S. acquirers.
In the next section, we explore whether the quality of the target in terms of its social and
environmental risk management (as reflected by Innovest rating) influences the firms’ and
deal’s abnormal returns and takeover premiums.
Findings
Do socially responsible investments pay?
In Table VI, we present multivariate regression analyses, in which the variable of interest is
the target rating. We use a discrete version of the variable and apply the following coding:
The variable takes a value of 0 for the lowest rating (CCC, see Table I), and it increases by
increments of 1 as it moves to the next higher rating. The variable takes a value of 6 for the
highest AAA rating.10 Thus, the variable increases with the ability of the target to cope with
environmental and social risks.
Regarding the econometric approach to the regressions, to address non-normality and
small sample issues, we use a percentile t-bootstrap approach for the statistical tests of

significance (see Efron and Tibshirani 1993). From the original data matrix, we draw,
through replacements, 1,000 bootstrap samples with the same number of observations as in
the original sample. For each of these bootstrap samples, we run an OLS regression with
White-adjusted standard errors to obtain the heteroskedactic robust student statistic of the
coefficients for the bootstrap samples. We then remove from the estimated bootstrap t-
statistics their average value to simulate the null hypothesis of no effect (zero value for the
coefficient of interest). The adjusted bootstrap t-statistics provide the empirical distribution
for comparison against the t-statistic obtained from the original data, which produces a
bootstrap p-value estimate. The use of White-adjusted standard errors to compute t-statistics
enables us to cope with heteroscedasticity.
In Panel A of Table VI, the dependent variable is the acquirer’s three-day abnormal
returns. Both the general IVA rating and its two components (ENV and SOC) have
significant positive impacts on the acquirer’s CARs. Stock markets seem to value socially
and environmentally responsible investment decisions. In terms of the control variables,
unrelated deals and acquisition fully paid in cash generate higher abnormal returns for the
acquirer shareholders. The target CAR thus does not seem to depend on its own rating (see
Panel B). However, the social component of the IVA rating is marginally significant, with a
p-value of 0.10. At the deal level, the most value-creating deals are combinations with targets
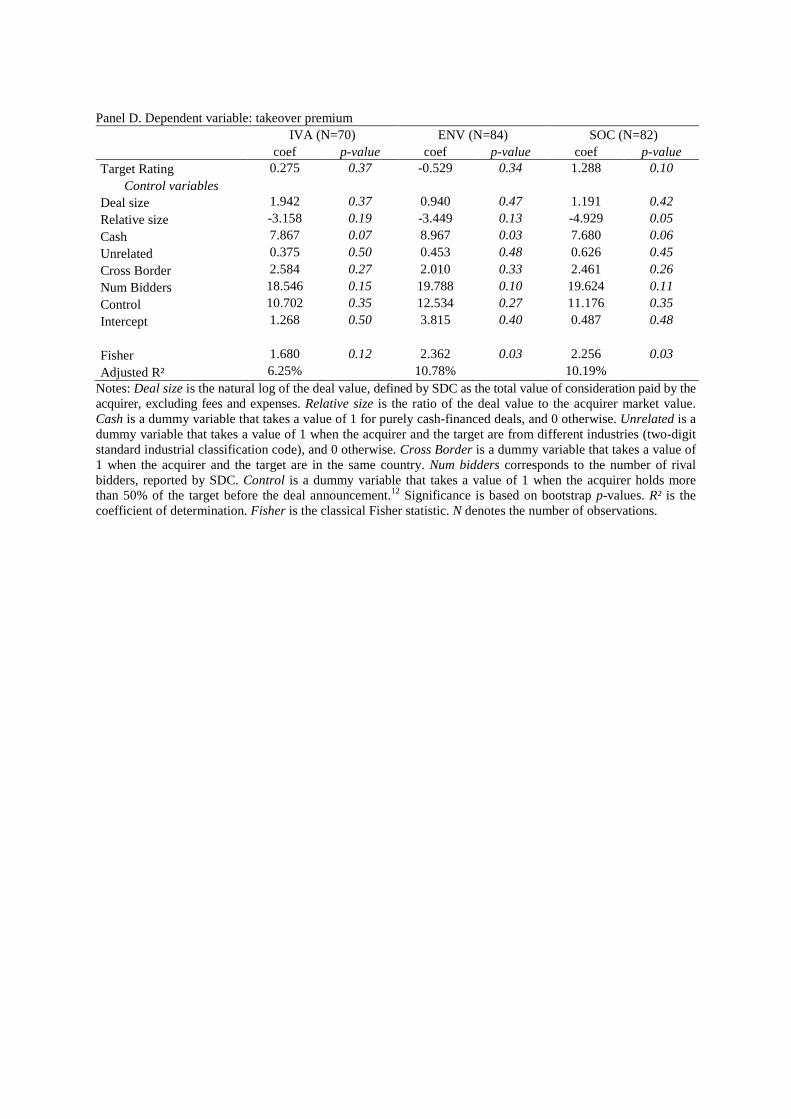
that have earned higher environmental ratings (see Panel C). In Panel D, the dependent
variable is the premium. The coefficient of the variable of interest is only marginally
significant (p-value = 0.10) for the social rating, which suggests that the acquirer pays a
higher premium only for target with a better ability to cope with social risk.
Overall, our result supports the idea that socially responsible investing benefits acquirer
shareholders. That is, SRI represents a positive net present value project, according to
financial markets’ assessments. However, one question remains about the source of this gain:

Does the market reward the bidder’s expected increased (or maintained) ability to cope with
social and environmental risks, or does it sanction the target for wasting shareholder
resources on SRI projects that do not maximize wealth? To address this issue, we provide
additional analyses in Tables VII and VIII.
Who has the highest social and environmental performance?
The two-entry Table VII compares the ratings of the bidder and the target. The grey area
denotes the deals for which the rating of the target is higher than that for the bidder. For the
IVA rating, the target earns a higher rating than the bidder in 29% of the cases (19 of 65
deals).11 The proportion is almost the same for the environmental and social ratings
(unreported). This simple descriptive statistic seems to contradict the idea that companies
with higher social and environmental performance are more subject to disciplinary takeovers
because they are diverting their financial resources. On average, our results instead suggest
that the bidder tends to be at least as good as the target in its social and environmental risk
management.
In a second analysis, we define a dummy variable to identify the deals for which the
notation of the target is higher than that of the bidder, then replicate the regressions in Panel
A of Table VI with this additional variable to assess whether the market positively values
lower SRI bidders taking over higher SRI targets. As we show in Table VIII, investors seem
indifferent whether the target has a higher social and environmental rating than the bidder.
Our results also do not support the view that takeovers of socially and environmentally high-
performing company have a disciplinary motive. In the cross-section, the stock market
appears to reward the quality of the target (i.e., target rating variable is statistically
significant) and not the difference in ratings between the bidder and the target (i.e., the new
dummy variable is not significant).
Finally, we study the evolution of the acquirer’s rating after the deal. But because our
sample is very limited after the deal completion, we provide simply a descriptive analysis.
After acquiring a better target, the IVA rating of the bidder never declines, but it improves in
33% of the 48 cases. For the ENV rating, negative revision occurs in 21% of the cases,
compared with 31% positive revisions among the 69 cases. Finally, for the SOC rating, out of
66 cases, we find only 10% negative results for the acquirers and 45% positive results.
These additional analyses prompt us to reject Hypotheses 2 and 3 and confirm our
validation of Hypothesis 1. Our results support the idea that socially responsible investing
pays for shareholders, at least within the framework of M&A decisions.
Concluding remarks
Relying on an original empirical framework, we analyze whether socially responsible
investing benefits shareholders. The use of merger and acquisition decisions of listed
companies reveals the stock market reactions to SRI announcements (i.e., acquisition of
targets with social and environmental performance ratings). Our findings suggest that
acquirer gains relate positively to the target’s ability to cope with social and environmental
risks. Furthermore, more synergistic deals occur with targets that exhibit better social and
environmental performance. Furthermore, we provide some evidence that our sample of
M&A deals is not driven by disciplinary motives.
Acknowledgements
We are grateful to Innovest Strategic Value Advisors for providing the environmental and
social notations and to Perrine Dutronc and Helen Bollaert for their helpful comments.
References
Aktas, N., E. de Bodt and R. Roll: 2004, ‘Market Response to European Regulation of
Business Combinations’, Journal of Financial and Quantitative Analysis 38, 721–746.
Aktas, N., E. de Bodt and R. Roll: 2007, ‘Is European M&A Regulation Protectionist?’,
Economic Journal 116, 1–26.
Allaire, V., L. Balmayer, H. Basset, F. Desfournaux, S. Niglio and J. Nangis: 2006, ‘OPA de
Mittal sur Arcelor’, La lettre du Sentinel 39 (Juillet–Août), 10–17.
Andrade, G., M. Mitchell and E. Stafford: 2001, ‘New Evidence and Perspectives on
Mergers’, Journal of Economic Perspectives 15, 103–120.
Bauer, R., K. Koedijk and R. Otten: 2005, ‘International Evidence on Ethical Mutual Fund
Performance and Investment Style’, Journal of Banking and Finance 29, 1751–1767.
Becker, Y., and K. Gluck: 2004, ‘Can Environmental Factors Improve Stock Selection?’,
Journal of Asset Management 5, 220-222.
Betton, S., B.E. Eckbo, and K.S. Thorburn: 2008, ‘Corporate Takeovers’, in: Eckbo, B.E.
(Ed.), Handbook of Corporate Finance, Empirical Corporate Finance. Elsevier, North-
Holland, Vol. 2, 291–429.
Brown, S. and J. Warner: 1980, ‘Measuring Security Price Performance’, Journal of
Financial Economics 8, 205–258.
Brown, S. and J. Warner: 1985. ‘Using Daily Stock Returns: The Case of Event Studies’,
Journal of Financial Economics 14, 3–31.
Campa, J. and I. Hernando: 2004, ‘Shareholder Value Creation in European M&As’,
European Financial Management 10, 47-82.
Derwall, J., N. Guenster, R. Bauer and K. Koedijk: 2005, ‘The Eco-efficiency Premium
Puzzle’, Financial Analysts Journal 61, 51–63.
Efron, B. and R.J. Tibshirani: 1993, An Introduction to the Bootstrap, Chapman & Hall,
London.
Eurosif: 2006, ‘The European SRI Study’, available at http://www.eurosif.org.
Fama, E., L. Fisher, M. Jensen and R. Roll: 1969, ‘The Adjustment of Stock Prices to New
Information’, International Economic Review 10, 1–21.
Fisher-Vanden, K. and K.S. Thorburn: 2008, ‘Voluntary Corporate Environmental Initiatives
and Shareholder Wealth’, ECGI Finance Working Paper N°200, 34 pages.
Fombrun, C. and M. Shanley: 1990, ‘What’s in a name? Reputation Building and Corporate
Strategy’, Academy of Management Journal 33, 233–258.
Jensen, M.C. and R.S. Ruback: 1983, ‘The Market for Corporate Control: The Scientific
Evidence’, Journal of Financial Economics 11, 5–50.
Lin, C. and Y. Wei: 2006, ‘The Role of Business Ethics in Merger and Acquisition Success:
An Empirical Study’, Journal of Business Ethics 69, 95–109.
Manne, H.G.: 1965, ‘Mergers and the Market for Corporate Control’, Journal of Political
Economy 73, 110–120.
Moeller, S.B., F.P. Schlingemann and R.M. Stulz: 2004, ‘Firm Size and the Gains from
Acquisitions’, Journal of Financial Economics 73, 201–228.
Mulherin, J. and A. Boone: 2000, ‘Comparing Acquisitions and Divestitures’, Journal of
Corporate Finance 6, 117–139.
Peeters, A. : 2006, ‘Les Accords Cadres Internationaux, Nouveaux Espaces de Négociation
Globale’, L’Année Sociale (Revue éditée par l’Institut de Sociologie de l’Université Libre
de Bruxelles), 245–248.
Porter, M.E. and C. van der Linde: 1995, ‘Green and Competitive: Ending the Stalemate’,
Harvard Business Review (September–October), 120–135.
Renneboog, L., J. Ter Horst and C. Zhang: 2008, ‘The Price of Ethics and Stakeholder
Governance: The Performance of Socially Responsible Mutual Funds’, Journal of
Corporate Finance 14, 302–322.
Ringov, D. and M. Zollo: 2007, ‘Corporate Responsibility from a Socio-Institutional
Perspective: The Impact of National Culture on Corporate Social Performance’, Corporate
Governance 7, 476–485.
Social Investment Forum: 2007, ‘Report on Responsible Investing Trends in the US’,
available at http://www.socialinvest.org.
Syrjälä, J. and T. Takala: 2008, ‘Ethical Aspects in Nordic Business Mergers: The Case of
Electro-business’, Journal of Business Ethics 80, 531–545.
Walley, N. and B. Whitehead: 1994, ‘It’s not Easy Being Green’, Harvard Business Review
(May–June), 46–52.
Wang, C. and F. Xie: 2009, ‘Corporate Governance Transfer and Synergistic Gains from
Mergers and Acquisitions’, Review of Financial Studies 22, 829–858.

TABLE I Description of Innovest ratings
AAA
Notation Description
AAA
A company with minimal, well-identified environmental/social risks and liabilities, and with a strong ability to meet any losses which might materialize. Extremely well-positioned to handle any foreseeable tightening of regulatory requirements, and strongly positioned strategically to capitalize on environmentally/socially-driven profit opportunities.
AA
A company with environmental/social risks and liabilities which have been well-identified and provided for. This position is unlikely to be impaired by any foreseeable tightening of regulatory requirements. The company is well-positioned strategically to capitalize on environmentally/socially driven profit opportunities.
A
A company with large but well-identified environmental/social risks and liabilities, and sufficient financial and managerial strength to absorb all but exceptional risks. Able, also, to finance any currently proposed regulatory requirements. Above average positioning with respect to profit opportunities.
BBB A company with strong managerial capability, but one where environmental/social risks and liabilities are a potential source of loss, though not on any material scale. Average level of positioning vis a vis profit opportunities.
BB A company with good managerial capability, but one where environmental/social risks and liabilities are a potential source of material loss. Below-average level of strategic positioning.
B A company whose environmental/social risks and liabilities create a strong likelihood of material losses in both profitability and competitive position. Significantly below-average strategic positioning.
CCC
A company where there are significant doubts about management's ability to handle its environmental/social risks and liabilities, and where these are likely to create a serious loss. Well below-average ability to capitalize on environmentally/socially-driven profit opportunities.
Source: Innovest Strategic Value Advisors, IVA Methodology, Year 2007.
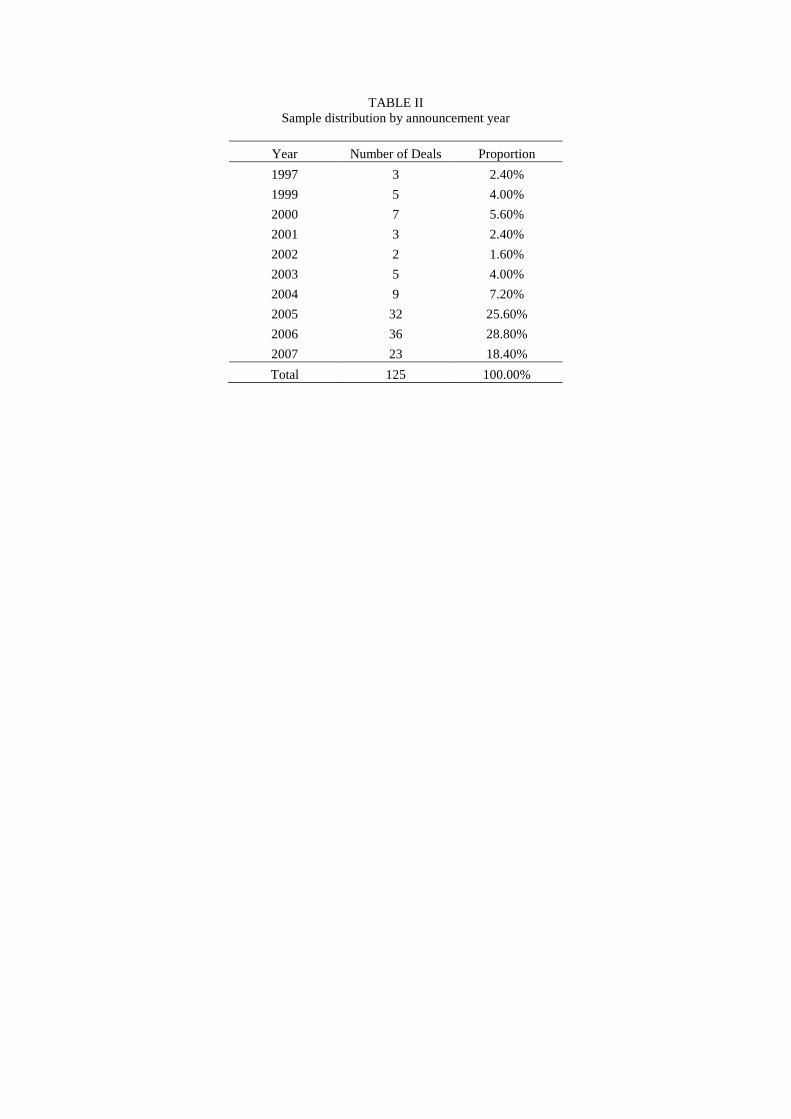
TABLE II Sample distribution by announcement year
Year Number of Deals Proportion
1997 3 2.40%
1999 5 4.00%
2000 7 5.60%
2001 3 2.40%
2002 2 1.60%
2003 5 4.00%
2004 9 7.20%
2005 32 25.60%
2006 36 28.80%
2007 23 18.40%
Total 125 100.00%
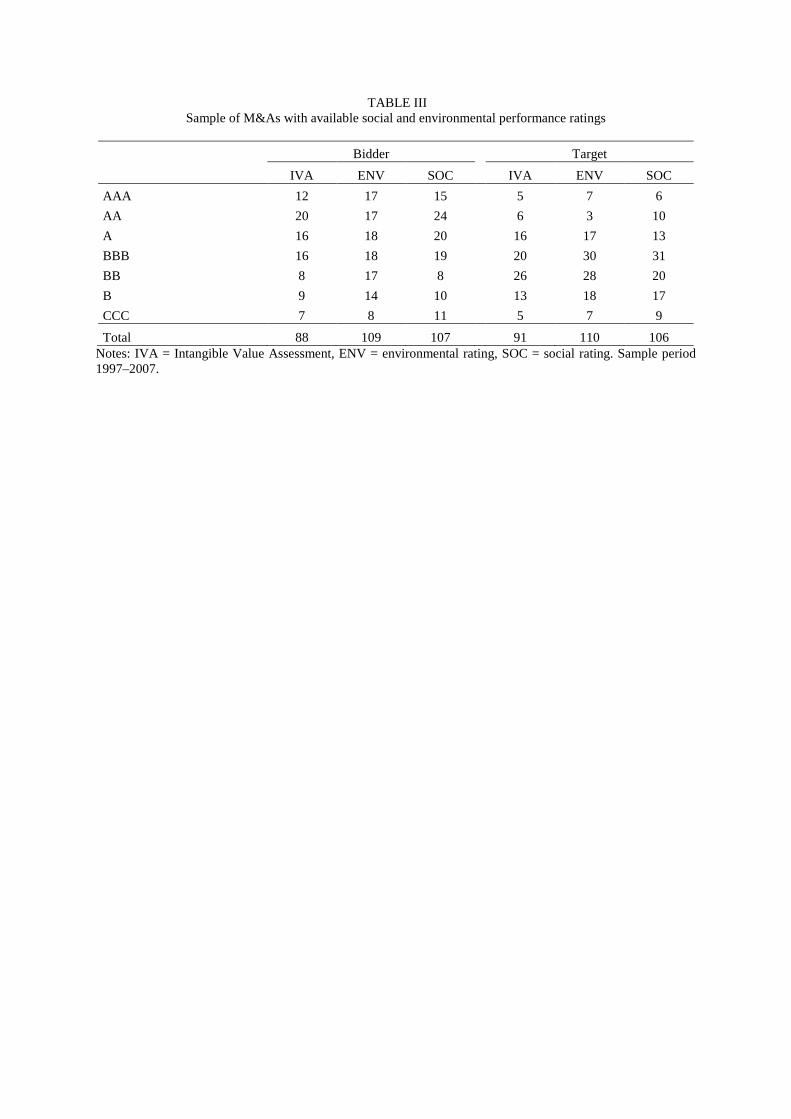
TABLE III Sample of M&As with available social and environmental performance ratings
Bidder Target
IVA ENV SOC IVA ENV SOC
AAA 12 17 15 5 7 6
AA 20 17 24 6 3 10
A 16 18 20 16 17 13
BBB 16 18 19 20 30 31
BB 8 17 8 26 28 20
B 9 14 10 13 18 17
CCC 7 8 11 5 7 9
Total 88 109 107 91 110 106 Notes: IVA = Intangible Value Assessment, ENV = environmental rating, SOC = social rating. Sample period 1997–2007.
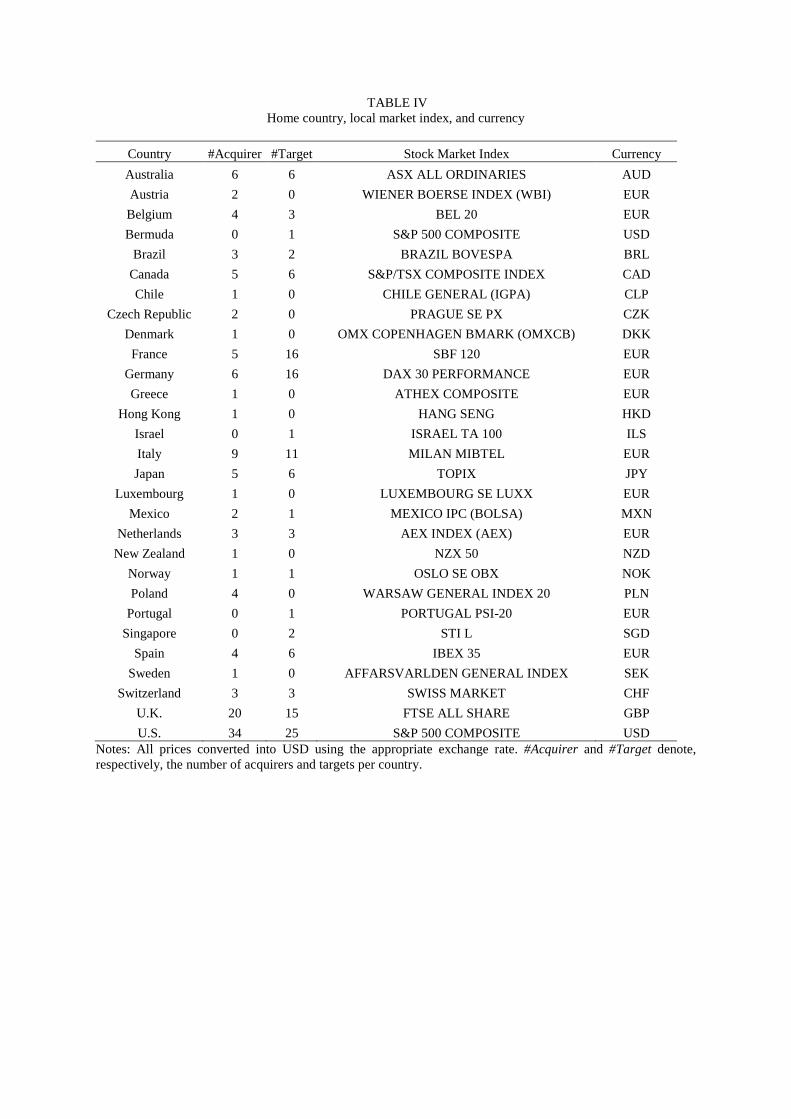
TABLE IV Home country, local market index, and currency
Country #Acquirer #Target Stock Market Index Currency
Australia 6 6 ASX ALL ORDINARIES AUD
Austria 2 0 WIENER BOERSE INDEX (WBI) EUR
Belgium 4 3 BEL 20 EUR
Bermuda 0 1 S&P 500 COMPOSITE USD
Brazil 3 2 BRAZIL BOVESPA BRL
Canada 5 6 S&P/TSX COMPOSITE INDEX CAD
Chile 1 0 CHILE GENERAL (IGPA) CLP
Czech Republic 2 0 PRAGUE SE PX CZK
Denmark 1 0 OMX COPENHAGEN BMARK (OMXCB) DKK
France 5 16 SBF 120 EUR
Germany 6 16 DAX 30 PERFORMANCE EUR
Greece 1 0 ATHEX COMPOSITE EUR
Hong Kong 1 0 HANG SENG HKD
Israel 0 1 ISRAEL TA 100 ILS
Italy 9 11 MILAN MIBTEL EUR
Japan 5 6 TOPIX JPY
Luxembourg 1 0 LUXEMBOURG SE LUXX EUR
Mexico 2 1 MEXICO IPC (BOLSA) MXN
Netherlands 3 3 AEX INDEX (AEX) EUR
New Zealand 1 0 NZX 50 NZD
Norway 1 1 OSLO SE OBX NOK
Poland 4 0 WARSAW GENERAL INDEX 20 PLN
Portugal 0 1 PORTUGAL PSI-20 EUR
Singapore 0 2 STI L SGD
Spain 4 6 IBEX 35 EUR
Sweden 1 0 AFFARSVARLDEN GENERAL INDEX SEK
Switzerland 3 3 SWISS MARKET CHF
U.K. 20 15 FTSE ALL SHARE GBP
U.S. 34 25 S&P 500 COMPOSITE USD Notes: All prices converted into USD using the appropriate exchange rate. #Acquirer and #Target denote, respectively, the number of acquirers and targets per country.

TABLE V Abnormal returns and takeover premium
Acquirer CAR
(N=125) Target CAR
(N=118) Deal CAR (N=118)
Premium (N=115)
Average -1.15% 10.25% 1.17% 22.13%
p-value 0.12 0.00 0.01 0.00
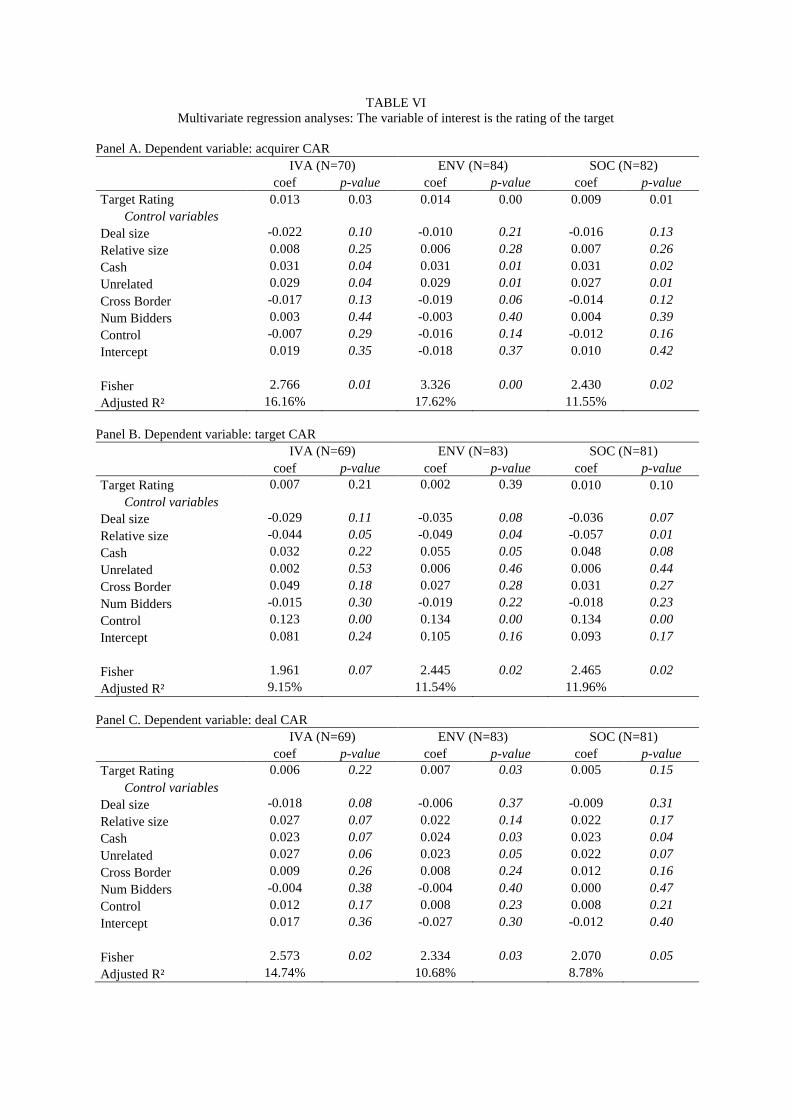
TABLE VI Multivariate regression analyses: The variable of interest is the rating of the target
Panel A. Dependent variable: acquirer CAR IVA (N=70) ENV (N=84) SOC (N=82) coef p-value coef p-value coef p-value Target Rating 0.013 0.03 0.014 0.00 0.009 0.01
Control variables Deal size -0.022 0.10 -0.010 0.21 -0.016 0.13
Relative size 0.008 0.25 0.006 0.28 0.007 0.26
Cash 0.031 0.04 0.031 0.01 0.031 0.02
Unrelated 0.029 0.04 0.029 0.01 0.027 0.01
Cross Border -0.017 0.13 -0.019 0.06 -0.014 0.12
Num Bidders 0.003 0.44 -0.003 0.40 0.004 0.39
Control -0.007 0.29 -0.016 0.14 -0.012 0.16
Intercept 0.019 0.35 -0.018 0.37 0.010 0.42
Fisher 2.766 0.01 3.326 0.00 2.430 0.02
Adjusted R² 16.16% 17.62% 11.55% Panel B. Dependent variable: target CAR IVA (N=69) ENV (N=83) SOC (N=81) coef p-value coef p-value coef p-value Target Rating 0.007 0.21 0.002 0.39 0.010 0.10
Control variables Deal size -0.029 0.11 -0.035 0.08 -0.036 0.07
Relative size -0.044 0.05 -0.049 0.04 -0.057 0.01
Cash 0.032 0.22 0.055 0.05 0.048 0.08
Unrelated 0.002 0.53 0.006 0.46 0.006 0.44
Cross Border 0.049 0.18 0.027 0.28 0.031 0.27
Num Bidders -0.015 0.30 -0.019 0.22 -0.018 0.23
Control 0.123 0.00 0.134 0.00 0.134 0.00
Intercept 0.081 0.24 0.105 0.16 0.093 0.17
Fisher 1.961 0.07 2.445 0.02 2.465 0.02
Adjusted R² 9.15% 11.54% 11.96% Panel C. Dependent variable: deal CAR IVA (N=69) ENV (N=83) SOC (N=81) coef p-value coef p-value coef p-value Target Rating 0.006 0.22 0.007 0.03 0.005 0.15
Control variables Deal size -0.018 0.08 -0.006 0.37 -0.009 0.31
Relative size 0.027 0.07 0.022 0.14 0.022 0.17
Cash 0.023 0.07 0.024 0.03 0.023 0.04
Unrelated 0.027 0.06 0.023 0.05 0.022 0.07
Cross Border 0.009 0.26 0.008 0.24 0.012 0.16
Num Bidders -0.004 0.38 -0.004 0.40 0.000 0.47
Control 0.012 0.17 0.008 0.23 0.008 0.21
Intercept 0.017 0.36 -0.027 0.30 -0.012 0.40
Fisher 2.573 0.02 2.334 0.03 2.070 0.05
Adjusted R² 14.74% 10.68% 8.78%
Panel D. Dependent variable: takeover premium
IVA (N=70) ENV (N=84) SOC (N=82) coef p-value coef p-value coef p-value Target Rating 0.275 0.37 -0.529 0.34 1.288 0.10
Control variables Deal size 1.942 0.37 0.940 0.47 1.191 0.42
Relative size -3.158 0.19 -3.449 0.13 -4.929 0.05
Cash 7.867 0.07 8.967 0.03 7.680 0.06
Unrelated 0.375 0.50 0.453 0.48 0.626 0.45
Cross Border 2.584 0.27 2.010 0.33 2.461 0.26
Num Bidders 18.546 0.15 19.788 0.10 19.624 0.11
Control 10.702 0.35 12.534 0.27 11.176 0.35
Intercept 1.268 0.50 3.815 0.40 0.487 0.48
Fisher 1.680 0.12 2.362 0.03 2.256 0.03
Adjusted R² 6.25% 10.78% 10.19% Notes: Deal size is the natural log of the deal value, defined by SDC as the total value of consideration paid by the acquirer, excluding fees and expenses. Relative size is the ratio of the deal value to the acquirer market value. Cash is a dummy variable that takes a value of 1 for purely cash-financed deals, and 0 otherwise. Unrelated is a dummy variable that takes a value of 1 when the acquirer and the target are from different industries (two-digit standard industrial classification code), and 0 otherwise. Cross Border is a dummy variable that takes a value of 1 when the acquirer and the target are in the same country. Num bidders corresponds to the number of rival bidders, reported by SDC. Control is a dummy variable that takes a value of 1 when the acquirer holds more than 50% of the target before the deal announcement.12 Significance is based on bootstrap p-values. R² is the coefficient of determination. Fisher is the classical Fisher statistic. N denotes the number of observations.

TABLE VII
Two-entry table to compare bidder and target IVA ratings
Bidder
Target
AAA AA A BBB BB B CCC Total
AAA 3 0 0 1 0 0 0 4
AA 1 0 2 1 0 0 0 4
A 2 3 3 3 0 0 1 12
BBB 0 5 2 3 2 2 1 15
BB 1 5 1 4 3 3 3 20
B 1 3 0 1 1 0 0 6
CCC 1 0 0 0 1 2 0 4
Total 9 16 8 13 7 7 5 65

Table VIII Multivariate regression analyses
IVA (N=70) ENV (N=84) SOC (N=82) coef p-value coef p-value coef p-value Target Rating 0.013 0.04 0.013 0.01 0.009 0.02 Dum (Target Rating > Bidder Rating) -3E-5 0.44 7E-5 0.26 -4E-6 0.59
Control variables
Deal size -0.022 0.12 -0.010 0.21 -0.016 0.13
Relative size 0.008 0.24 0.006 0.26 0.007 0.29
Cash 0.031 0.05 0.031 0.02 0.031 0.02
Unrelated 0.029 0.03 0.029 0.01 0.027 0.02
Cross Border -0.017 0.11 -0.019 0.07 -0.014 0.12
Num Bidders 0.003 0.41 -0.003 0.41 0.004 0.45
Control -0.007 0.31 -0.016 0.10 -0.012 0.17
Intercept 0.020 0.38 -0.017 0.39 0.010 0.39
Fisher 2.420 0.02 2.919 0.01 2.130 0.04
Adjusted R² 14.79% 16.52% 10.32% Notes: Deal size is the natural log of the deal value, defined by SDC as the total value of consideration paid by the acquirer, excluding fees and expenses. Relative size is the ratio of the deal value to the acquirer market value. Cash is a dummy variable that takes a value of 1 for purely cash-financed deals, and 0 otherwise. Unrelated is a dummy variable that takes a value of 1 when the acquirer and the target are from different industries (two-digit standard industrial classification code), and 0 otherwise. Cross Border is a dummy variable that takes a value of 1 when the acquirer and the target are in the same country. Num bidders corresponds to the number of rival bidders, reported by SDC. Control is a dummy variable that takes a value of 1 when the acquirer holds more than 50% of the target before the deal announcement. Significance is based on bootstrap p-values. R² is the coefficient of determination. Fisher is the classical Fisher statistic. N denotes the number of observations.
1 According to the definition provided by the Social Investment Forum (2007), SRI is “an investment process that considers the social and environmental consequences of investments, both positive and negative, within the context of rigorous financial analysis.” 2 The study is available on Eurosif’s Web site at www.eurosif.org. 3 In an efficient market, abnormal returns around an announcement date measures the wealth creation for shareholders. 4 Some studies in other research fields appraise, within an M&A context, the relationship among companies’ ethical behaviors (e.g., ensuring employee security, caring practices), organizational commitment, and employee job performance (e.g., Lin and Wei, 2006; Syrjälä and Takala, 2008). 5 The direction of causation is not well established (Fisher-Vanden and Thorburn, 2008). It is unclear whether SRI improves performance of the firm or if well-performing companies are more willing to realize SRI because they have the necessary financial resources to do so. 6 In this merger, classified as a hostile takeover by the financial press, Arcelor’s management was accused of
caring more about investing resources in environmentally friendly plants than about maximizing shareholder value (Allaire et al., 2006). Mittal had significantly fewer social responsibility practices at the time of the merger (Peeters, 2006). 7 Brown and Warner (1980, 1985) confirm the robustness of the short-term event study method to the choice of the return generating process. 8 Aktas et al. (2004) demonstrate the robustness of the event study method to the use of local versus U.S. dollar–denominated prices and local versus world indexes. 9 However, recent empirical studies focusing on larger samples report slightly positive (1.5%) but significant abnormal returns for U.S. acquirers (e.g., Moeller et al. 2004). The positive abnormal returns in these studies result mainly from the inclusion of smaller and private target deals as well.

10 The discrete coding of the variable of interest assumes that the variation in quality between two subsequent ratings is homogeneous throughout the rating scheme. The use of a score version of the rating, instead of the discrete rating, does not alter our conclusions. The results are available on request from the authors. 11 This proportion is statistically less than 0.5. The corresponding t-statistic equals 3.7, computed using the following formula: t-statistic = (0.50 – p)/[p*(1-p)/N]1/2, where p is the proportion of targets with higher rating than bidders (29%), and N is the sample size. 12 To increase the sample size, we also considered a few deals for which the bidder holds more than 50% of the target before the deal announcement. We used this control variable in the regression.