Evidence Based Value Analysis - OR Manager
51
Transcript of Evidence Based Value Analysis - OR Manager


Evidence Based Value Analysis:
An Objective Assessment of Costs
Charlotte Guglielmi MA,BSN,RN,CNOR
Perioperative Nurse Specialist
Beth Israel Deaconess Medical Center
Boston, MA
Adam Robinson BS
Manager, Field Operations
Covidien

Disclosures
Charlotte Guglielmi
None
Adam Robinson
Covidien

BIDMC at a Glance
318,335
Radiology Visits
6,100 Full-Time Employees(Excluding Research)
621 Licensed beds
25,997Surgeries
41,125 Inpatient Discharges
Level 1 Trauma Center Roof-top heliport
4776 Births
524,521 Outpatient
Clinical Visits
56,589
Emergency Department
Visits
22, 035 Out patient
GI procedures
3,4998
Cardiac
Catheterizations
22,345
Radiation Oncology
Procedures

Perioperative Services
o Overall
• 400 FTE
• Budget $75 million (Staff - $35 million & Supply $40 million)
• Academic Teaching Center with Level 1 Trauma Center
• 3 Operating Suites – 40 Rooms
o 25,997 Surgeries
• All adult services except heart & lung transplants
o Peri-Anesthesia
• 3 PACUs & Pre-op Areas as well as a PAT Clinic
o CPD
• 3 sites servicing ORs, L&D and 74 clinics
• Items processed in 2012 = 243,000

The Value Analysis Enablers
• 1996 – Merger between Beth Israel and Deaconess
Hospitals
• 2002 – Financial Crisis
• 2004 – Financial Turnaround
• 2010 – GPO Conversion
• 2012 – Regional Purchasing Coalition

Challenges
• Emotional product categories
• GPO provided numerous opportunities
with attractive savings targets
• Resource constraints to implement
• New Product Requests
Too many requests, not enough resources

The Evolution of Value Analysis
2002
Resource Management
1. Cost containment
2. Cost reduction
2010
Clinical Quality Value Analysis (TM)
1. Non-salary cost reduction
2. GPO conversion/RPC
2012
Evidenced-based Value Analysis
1. Clinical Evidence
2. Clinical Benefit
3. Cost Impact
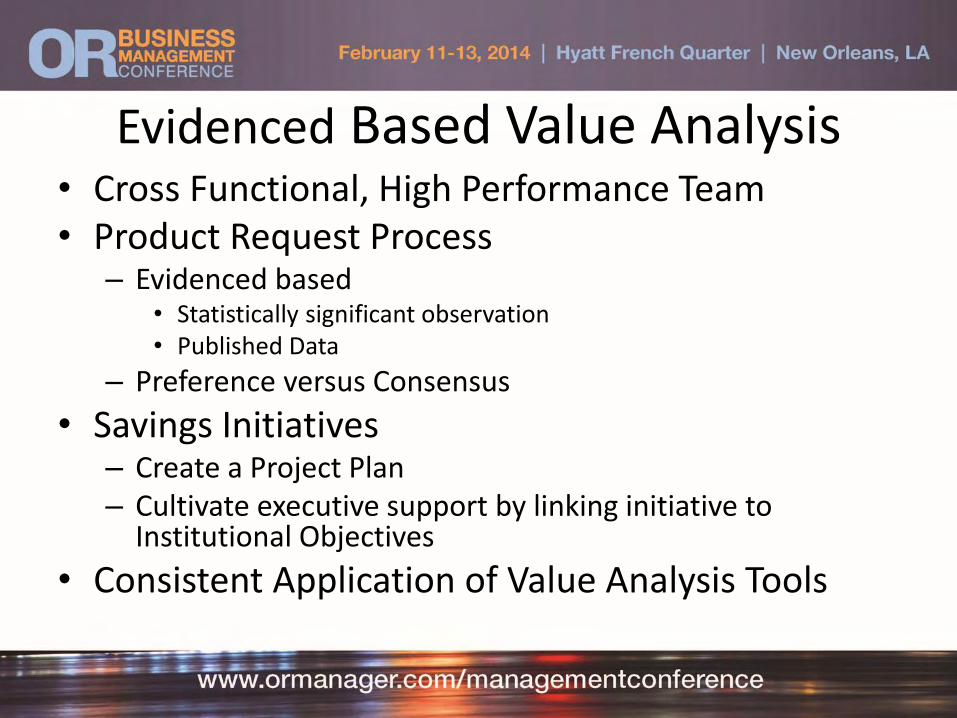
Evidenced Based Value Analysis• Cross Functional, High Performance Team• Product Request Process
– Evidenced based• Statistically significant observation• Published Data
– Preference versus Consensus
• Savings Initiatives– Create a Project Plan– Cultivate executive support by linking initiative to
Institutional Objectives
• Consistent Application of Value Analysis Tools

Creating the Cross-Functional TeamFunctional Roles
Physic ian Nursing Administ rat ion
Surgeon Associate Chief Nurse Business Director
ENT Perioperative Services
Co-Chair Co-Chair Co-Chair
Surgeon Nurse Manager Director, CQVA
Ortho East & West OR
Surgeon Nurse Manager Clinical Contract Manager
OB-GYN Cardiovascular
Nurse Specialist Materials Manager
Perioperative Services
East Campus Clinical Advisors
ENT/Cysto/GYN/GU/Ortho/PlasticFinancial Analyst
West Campus Clinical Advisors
CV/Ortho/Neuro/Thoracic/Bariatric
Leadership


Redefining the Processassess current state

Redefining the Process“fast track” requests that do not raise costs

The Role Clinical Evidence• Devise a methodology to stratify value of clinical
evidence
• US Preventative Services Task Force (1)
– Level I: Evidence obtained from at least one properly designed randomized
controlled trial.
– Level II-1: Evidence obtained from well-designed controlled trials
without randomization.
– Level II-2: Evidence obtained from well-designed cohort or case-control analytic
studies, preferably from more than one center or research group.
– Level II-3: Evidence obtained from multiple time series with or without the
intervention. Dramatic results in uncontrolled trials might also be regarded as this
type of evidence.
– Level III: Opinions of respected authorities, based on clinical experience,
descriptive studies, or reports of expert committees
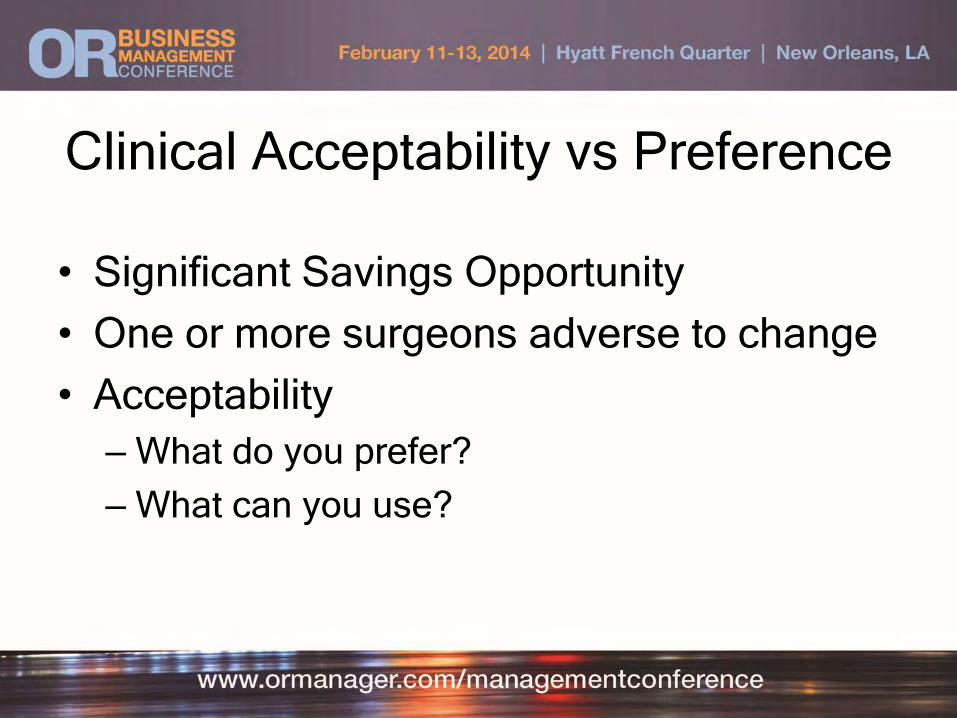
Clinical Acceptability vs Preference
• Significant Savings Opportunity
• One or more surgeons adverse to change
• Acceptability
– What do you prefer?
– What can you use?

Clinical Acceptability vs Preference
• Develop an Evaluation Tool– Engage clinicians and/or vendor to develop an
evaluation
– Three Level Lickert Scale • Disagree (“0”)
• Neither Agree or Disagree (“1”)
• Agree (“2”)
– Engage all clinical touchpoints• MD’s
• RN’s
• ST’s
• Ensure you survey clinical acceptability!

Case Studies
• Standardization of Hemostasis
• Qualifying Instrument Purchases
• Trocars
• Managing Waste

Case Study #1
Hemostat Standardization
• Project Charter
• Savings Goal – 20% cost reduction
• Clinical Evidence/Application
• Action Plan
• Results

PROJECT CHARTER
Project Name: Standardization of
Hemostasis Products
Project Leader:Chip McIntosh
Project Sponsor: Charlotte Guglielmi
Goal: Reduce spending on hemostasis agents by 20% from the current spend
Links to Institutional Goals:- Meeting/exceeding operating budgets- Improve reliability through standardization- Maximize efficient utilization of staff, equipment & supplies
Problem/Opportunity:There are multiple hemostasis agents currently used in our ORs purchased at a spend rate of $900,000/year. The greatest opportunity for improvement and standardization is in neurosurgery, ortho spine and then cardiac surgery. This team will review costs and evidence for agents currently used.
Scope: East and West ORsProject Completion: 12/31/2013
Suggested Approach:1. Look at lists of all agents for Surgicel and Surgiflo to review all hemostatic agents currently used at BIDMC2. Review Instructions for Use (IFUs) to determine appropriateness of applications by surgeon and services3. Consider reducing the number of products and sizes4. Identify specific surgeon use for products 5. Identify which agents are used by a single service

Hemostat Cohort
Description Name Size (cc)Cost per unit of
purchase
Cost per CC
1
Open repair of large vessels as an adjunct to staples or sutures.
Bioglue5 $$$ $$$$
10 $$$$ $
Fibrin Sealant adjunct to hemostatis Evicel Fibrin2 $ $$$5 $$ $$
2If hemostasis cannot be achieved by ligation or pressure
Surgifoam
12 $ $$$50 $$ $$
100 $$$ $
3
Used adjunctively in surgical procedures to assist in the control of capillary, venous, and small arterial hemorrhage when ligation or other conventional methods of control areimpractical or ineffective
Surgicel Absorbable 207 $ $
Nu Knit Surgicel 348 $$ $$
Hemostat Surgicel Fibrillar
103 $$$ $$$
Value Analysis

Proposed solutionHemostatic
AgentAction Rationale
Savings Estimate
EvicelStandardize
to 2 cc
1. Reduce waste - 4 cc is generally used when a 5 cc is pulled2. Less Inventory3. Less confusion for staff
$15,200
BioglueConvert
to Evicel 2 cc
1. Less Inventory2. Less confusion for staff3. Evicel ~ 1 yr to break down vs Bioglue ~ stays intact for life
$18,000
SurgicelConvert
to NuKnit
1. On aortic procedures, 74 units of Surgicel are routinely used2. Surgeons have evaluated NuKnit and agreed to use 5 units of NuKnit3. All agents are bacteria static and absorb within ~ 2 weeks
$188,000 -$564,000
SurgifoamEliminateextra small Surgifoam
1. Only used 27 times in past year2. Has expired on the shelf3. Highest cost/cc4. Replaced by larger sizes
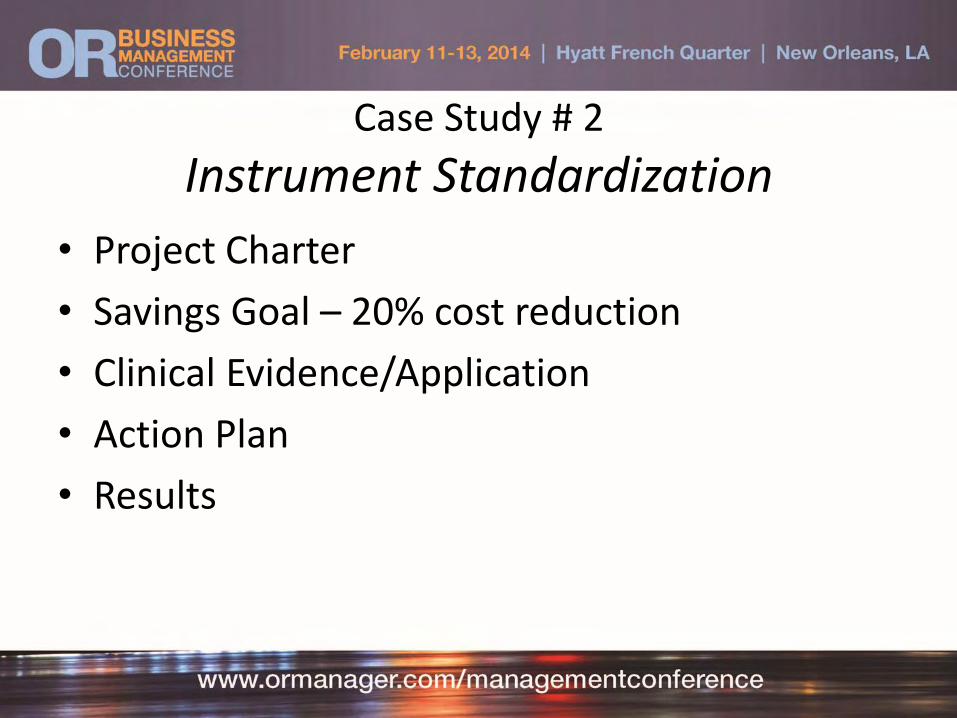
Case Study # 2
Instrument Standardization
• Project Charter
• Savings Goal – 20% cost reduction
• Clinical Evidence/Application
• Action Plan
• Results

PROJECT CHARTER
Project Name: Eye Service Instrument
Standardization and IUSS Reduction
Project Leader:Deb Martinez
Charlotte Guglielmi
Project Sponsor: Elena Canacari
Goals:1. Reduce IUSS rate of 27-44% to 2-5%2. Reduce # of kits and instrumentation
Links to Institutional Goals:- Improve reliability through standardization- Maximize efficient utilization of staff, equipment & supplies
Problem/Opportunity:Instrument kits are no standardized. Unused instruments in kits are leading to wasted process, set-up, and count times. Number of kits may not be adequete to support case volume. Eliminating unused instruments and establishing an adequete instrument/kit inventory could reduce IUSS.
Scope: East ORsProject Completion: 5/17/2013
Suggested Approach:1.Develop methodology and tools2. Recommend instrument acquisition to reduce IUSS3. Template process to spread the learning

Value AnalysisIdentify Instruments Used
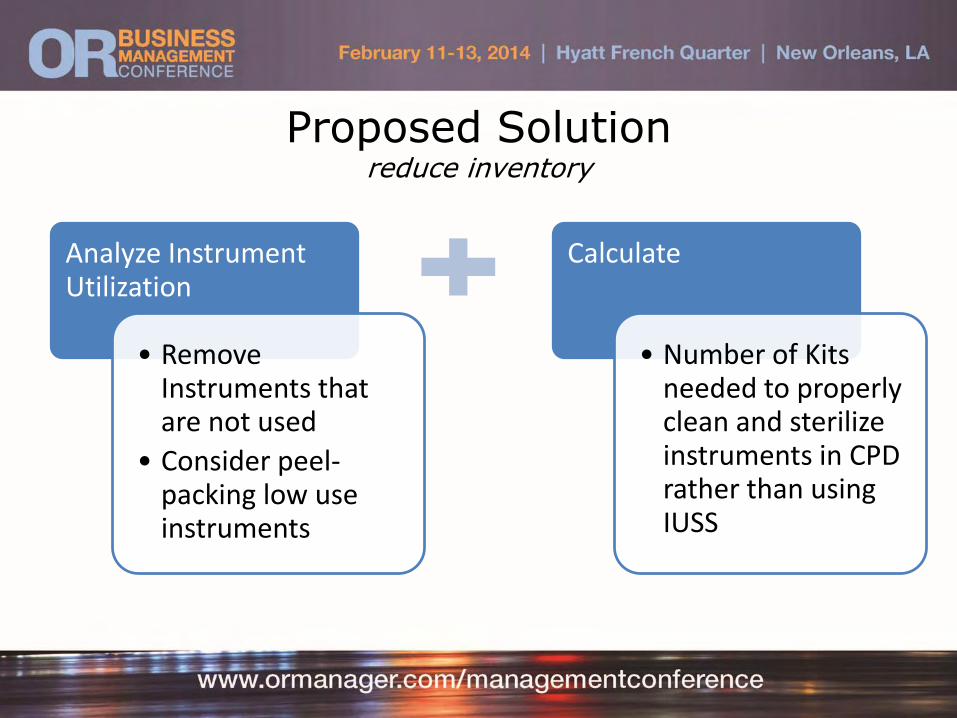
Proposed Solutionreduce inventory
Analyze Instrument Utilization
• Remove Instruments that are not used
• Consider peel-packing low use instruments
Calculate
• Number of Kits needed to properly clean and sterilize instruments in CPD rather than using IUSS

Value AnalysisCalculate Average Turnover Time

Proposed SolutionUse evidence to justify purchase
CPD Time
Determine time needed by CPD to properly clean and sterilize instruments and deliver to OR
Case Time
Use representative or average case times to calculate the
number of kits required
Decision to Purchase
If time study justifies, purchase additional kits as needed
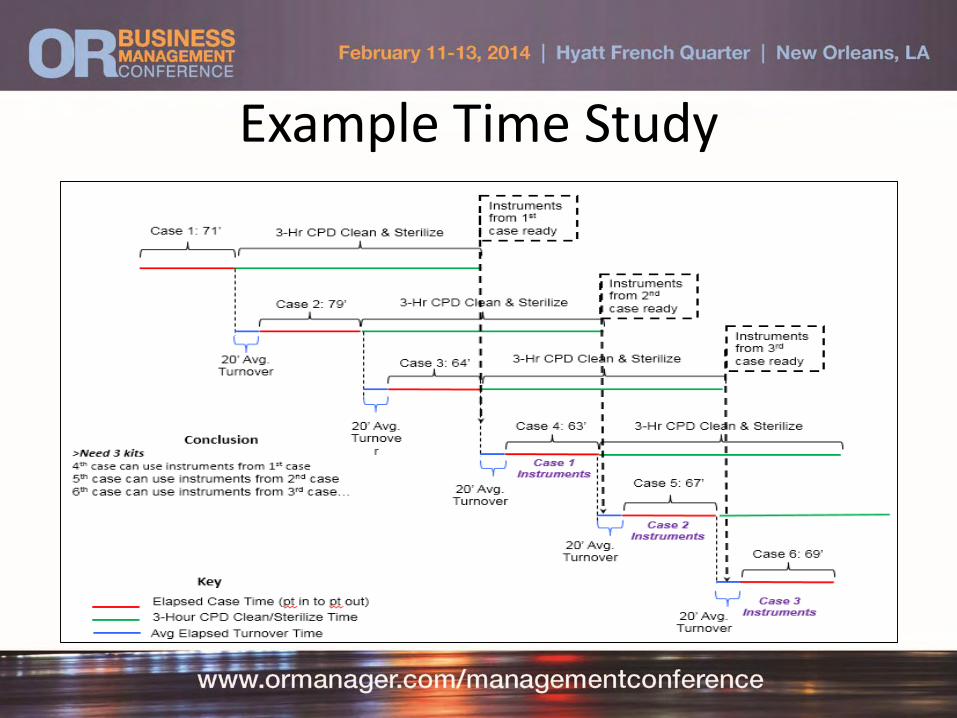
Example Time Study

ResultsPurchased additional kits, dramatically reduced IUSS
• Purchase of two (2) additional BIOM Kits for a total of three (3) kits
• Over six month period, IUSS was only needed on four days – well within goal (2-5%)
1 1
2
4
3
5
3
1
2 2
3 3
2
3 3
4
2
3
1 1
2
111
3 3
4
1 1 1
0
1
2
3
4
5
6
IUS
S C
yc
les
Date

Staff Reinforcement
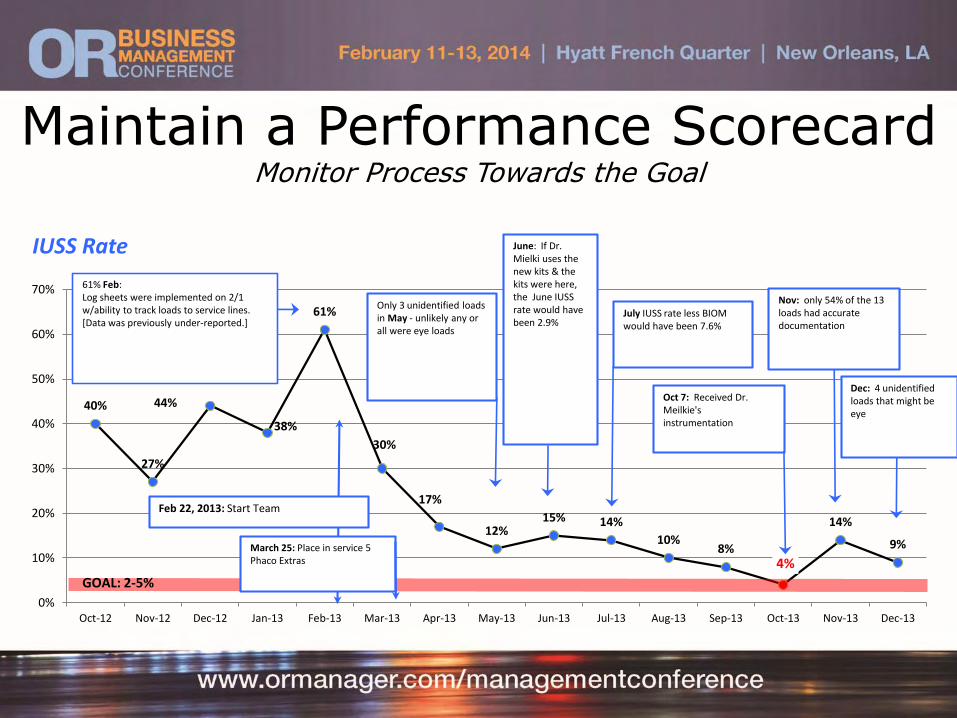
Maintain a Performance ScorecardMonitor Process Towards the Goal
40%
27%
44%
38%
61%
30%
17%
12%15% 14%
10%8%
4%
14%
9%
0%
10%
20%
30%
40%
50%
60%
70%
Oct-12 Nov-12 Dec-12 Jan-13 Feb-13 Mar-13 Apr-13 May-13 Jun-13 Jul-13 Aug-13 Sep-13 Oct-13 Nov-13 Dec-13
IUSS Rate
July IUSS rate less BIOM would have been 7.6%
Oct 7: Received Dr. Meilkie's instrumentation
June: If Dr. Mielki uses the new kits & the kits were here, the June IUSS rate would have been 2.9%
Only 3 unidentified loads in May - unlikely any or all were eye loads
61% Feb:Log sheets were implemented on 2/1 w/ability to track loads to service lines. [Data was previously under-reported.]
GOAL: 2-5%
March 25: Place in service 5 Phaco Extras
Nov: only 54% of the 13 loads had accurate documentation
Feb 22, 2013: Start Team
Dec: 4 unidentified loads that might be eye

Staff Feedback
“Since I started working on this
project, when I see a log that is
incomplete, I seek out my colleague
who ran the IUSS load and have them
complete the log.”(comment from RN team member 9/2013)

Leverage the Experience
• Service by Service Review of IUSS
• Apply the metrics to requests for addition instrument purchases outside of annual budget
• Apply the metrics for projected service line growth

Case Study # 3
Trocar Standardization
• Project Charter
• Savings Goal – 20% cost reduction
• Clinical Evidence/Application
• Action Plan
• Results

Project CharterProject Name:
Trocar Standardization
Project Leader:Chip McIntoshAdam Robinson
Project Sponsor: Chris Awtry
Goals:1. Reduce trocar costs by leveraging GPO/RPC contracting2. Increase utilization of lower cost sleeves for alt port sites
Links to Institutional Goals:- Improve reliability through standardization- Meeting/exceeding operating budgets- Maximize efficient utilization of staff, equipment & supplies
Problem/Opportunity:90 surgeons use 11,000 trocars per year at a total cost of $467,000. Five different types of trocars are used, manufactured by two companies. The team will use evidence and enduser feedback to determine clinical acceptability of standardization.
Scope: East ORsWest ORsProject Completion: 6/30/2013
Suggested Approach:1. Analyze potential impact of GPO/RPC Contract2. Through surgeon analysis of the clinical evidence, develop patient selection criteria3. Implement recommendations 4. Track progress to goal
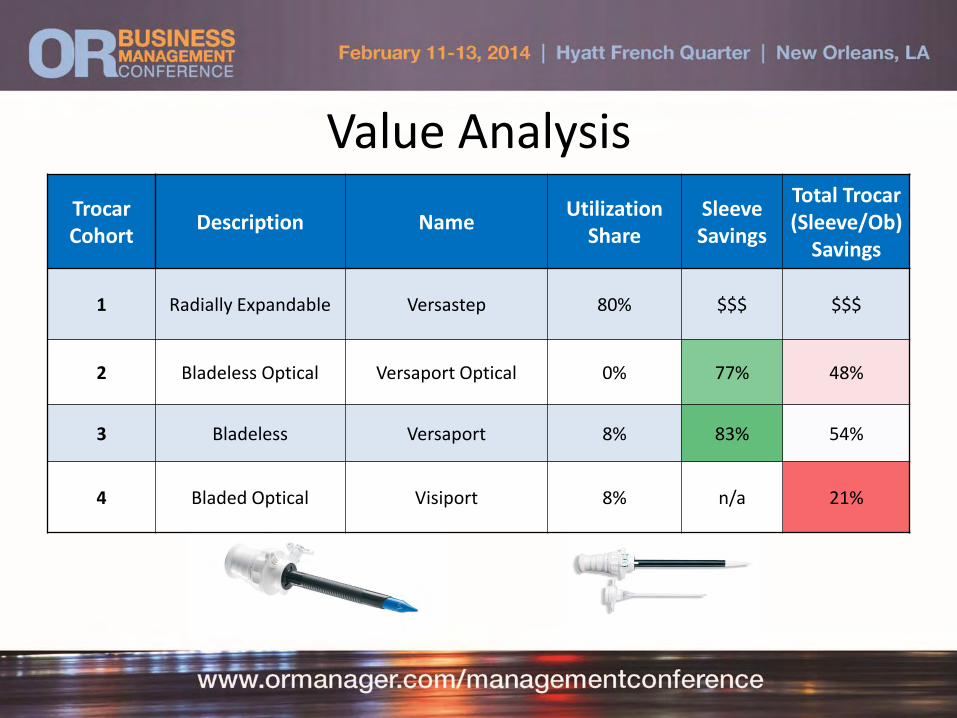
Value Analysis
Trocar Cohort
Description NameUtilization
ShareSleeve Savings
Total Trocar (Sleeve/Ob)
Savings
1 Radially Expandable Versastep 80% $$$ $$$
2 Bladeless Optical Versaport Optical 0% 77% 48%
3 Bladeless Versaport 8% 83% 54%
4 Bladed Optical Visiport 8% n/a 21%

Physician Review of Evidence• Cross Functional Group of Surgeons across
several institutions reviewed published clinical evidence
• “85+%” of cases can be safely done with bladeless trocars
• Exceptions include patients with the following risk factors:
• Morbidly obese patients (BMI > 40 kg/m2)
• Previous abdominal surgery with strong suspicion of adhesions
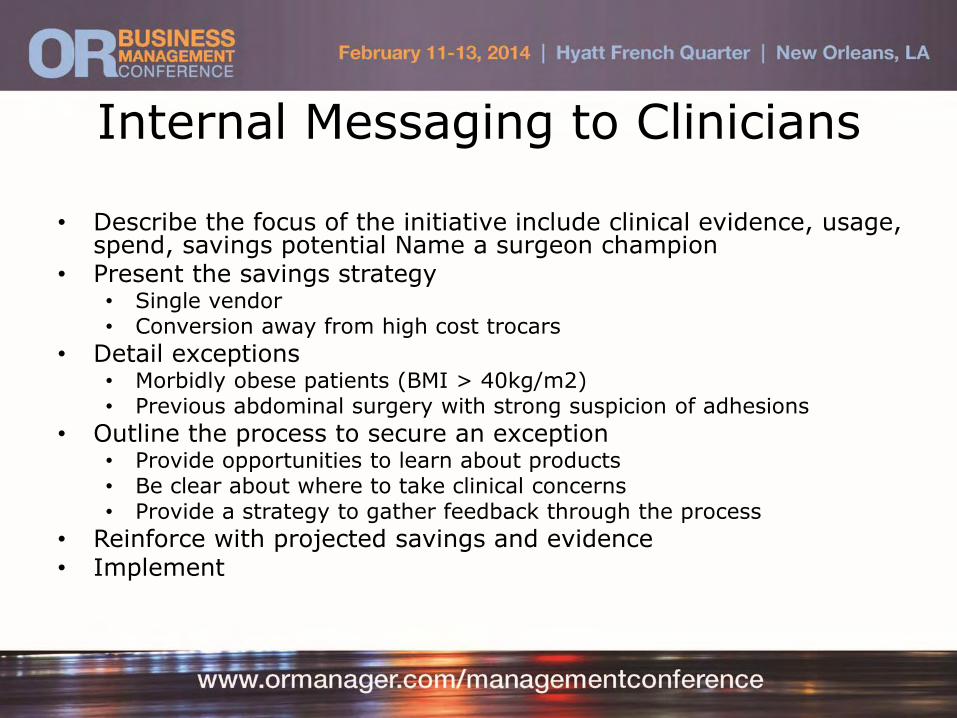
Internal Messaging to Clinicians
• Describe the focus of the initiative include clinical evidence, usage, spend, savings potential Name a surgeon champion
• Present the savings strategy• Single vendor• Conversion away from high cost trocars
• Detail exceptions• Morbidly obese patients (BMI > 40kg/m2)• Previous abdominal surgery with strong suspicion of adhesions
• Outline the process to secure an exception• Provide opportunities to learn about products• Be clear about where to take clinical concerns• Provide a strategy to gather feedback through the process
• Reinforce with projected savings and evidence• Implement

Exemption Requests

Analyze the Current Utilization
0.0%
10.0%
20.0%
30.0%
40.0%
50.0%
60.0%
Applied Medical Bluntport Versaport Versastep Visiport
Preferred Trocar as of February 2012n = 28

Post-Conversion Feedback
3
4 2
1 21
1
43
12 1
4
78
5
54 5
2
66
1
13 21 2 4 3
0
5
10
15
20
25
30
Versaport15mm
bladeless
Versaport12mm
bladeless
Versaport5mm
bladeless
Versaport5mm
bladelessoptical
Versaport15mmbladed
Versaport12mmbladed
Versaport5mm bladed
Do Not Use Unacceptable Barely acceptable Acceptable Very Good Superior

Address ConcernsClinically Acceptable vs. Clinically Preferred
Yes36%
No32%
Not a concern32%
Would you use a bladed trocar in lieu of a bladeless trocar to reduce insertion force?

Case Study # 4
Managing Wasted Items
• Project Charter
• Savings Goal – 20% cost reduction
• Action Plan
• Results

PROJECT CHARTERProject Name:
Intraoperative Waste Reduction
Project Leader:Charlotte Guglielmi
Project Sponsor: Nick Foundas, Elena Canacari
Goal: Reduce incidence of intraoperative waste. A 20% reduction would save $110,000
Links to Institutional Goals:- Meeting/exceeding operating budgets- Maximize efficient utilization of staff, equipment & supplies
Problem/Opportunity:Waste currently accounts for $550,000/year in lost expenses. The greatest opportunity for improvement is in orthopedics and general surgery. This team will review means for data capture and intervention to reduce rate of waste
Scope: East and West ORsProject Completion: 12/31/2011
Suggested Approach:1. Implement data capture in intraoperative record to improve insight into waste reasons2. Review data by service, work with clinical staff to understand root cause3. Educate Surgeons4. Open high cost items only if needed

System Architectureenable data visibility

Value AnalysisService FY08ORTHO $259,631CARDIAC $67,435NEURO $58,155GEN $42,597PLASTIC $25,978PODIATRY $21,662GYN $16,189VASCULAR $14,418TRANSPLANT $13,449UROLOGY $11,008EYE $8,659THORACIC $6,565ENT $4,109DENT\ORAL $392

Waste by Surgeon
Surgeon OCT NOV DEC JAN FEB MAR APR MAY JUN JUL AUG SEP YTD
C
ol
u
m
n1 Total Spend Waste %
Surgeon A $1,022 $1,665 $4,897 $4,292 $855 $4,125 $4,467 $3,625 $14,416 $4,030 $1,229 $5,040 $49,663 $3,066,103 1.6%
Surgeon B $1,546 $1,947 $2,058 $2,839 $1,567 $1,118 $623 $817 $2,648 $1,607 $1,055 $298 $18,122 $681,412 2.7%
Surgeon C $3,608 $563 $4,096 $1,371 $1,387 $744 $1,104 $3,281 $148 $868 $17,168 $1,102,998 1.6%
Surgeon D $10 $160 $321 $139 $14,197 $6 $876 $78 $185 $15,973 $1,215,753 1.3%
Surgeon E $1,088 $919 $284 $831 $319 $0 $26 $4,082 $3,474 $514 $2,946 $14,483 $1,241,204 1.2%
Surgeon F $261 $100 $100 $456 $91 $1,815 $960 $72 $161 $3,302 $4,400 $88 $11,804 $825,065 1.4%
Surgeon G $1,739 $154 $423 $1,748 $795 $553 $1,032 $532 $439 $387 $996 $1,033 $9,831 $723,161 1.4%
Surgeon H $4,860 $3,996 $10 $904 $2 $7 $9,779 $92,700 10.5%
Surgeon I $1,067 $8 $160 $1,005 $2,644 $2,082 $473 $1,380 $72 $8,892 $1,127,453 0.8%
Surgeon J $1,263 $1,463 $140 $37 $106 $295 $355 $1,153 $813 $703 $1,192 $388 $7,908 $500,389 1.6%

Proposed Solution
• 10 Surgeons account for half the waste
• Focus on Orthopedics and GYN services
• Show data to surgeons– Control message through surgeon champion
– Deidentify to remove “blame”
• Action Plan– High cost devices unopened until needed
– Improve intraoperative sizing

Results
$0
$200,000
$400,000
$600,000
FY08 FY09 FY10
$32,000Reduction
$135,000Reduction

Thank you!
Questions?