Evaluation of the discriminatory power of plant dna ... · 76 Saadullah et al. Int. J. Biosci. 2016...
12
75 Saadullah et al. Int. J. Biosci. 2016 RESEARCH PAPER OPEN ACCESS Evaluation of the discriminatory power of plant dna barcodes rbcl & matk between species of fabaceae Saadullah¹ * , Zaheer-ud-Din Khan¹, Muhammad AShfaq², Zaib-u-Nisa¹ 1 Department of Botany, GC University, Lahore Pakistan 2 Biodiversity Institute Ontario (BIO), University of Guelph, Canada Key words: DNA barcoding, Fabaceae, rbcl, matK, Identification. http://dx.doi.org/10.12692/ijb/8.5.75-86 Article published on May 18, 2016 Abstract For species identification, .DNA barcoding is a novel diagnostic technique, the aim of which is to contribute towards wide range of ecological and conservation studies. In this study, we evaluated the capacity of the core DNA barcodes rbcla and matK for identifying 62 plant specimen belonging to 22 species of Fabaceae. All plant specimen were collected from district Dera Ghazi Khan, Punjab, Pakistan. In this research work, highest mean pairwise interspecific distance showed by matK and lowest for rbcl. Based on ‘best match’ and ‘best close match’ analysis function of TaxonDNA , both matK and rbcl was best with almost 73% correct identification, while based on ‘all species barcodes’ analysis, rbcl and matK gave the lowest percentage of correct species identifications 64.51% & 51.11%, respectively. By using MEGA5, for each marker neighbor joining (N/J) trees based on Kimur-2-parameter (K2P) were produced. In tree based analysis, species were considered to be discriminated. that form separate clusters in the tree with a bootstrap support >50%.. In this study both plant DNA barcodes in combination (rbcl +matK) showed best discriminatory power between different species of Fabaceae. * Corresponding Author: Saadullah [email protected] International Journal of Biosciences | IJB | ISSN: 2220-6655 (Print), 2222-5234 (Online) http://www.innspub.net Vol. 8, No. 5, p. 75-86, 2016
Transcript of Evaluation of the discriminatory power of plant dna ... · 76 Saadullah et al. Int. J. Biosci. 2016...
75 Saadullah et al.
Int. J. Biosci. 2016
RESEARCH PAPER OPEN ACCESS
Evaluation of the discriminatory power of plant dna barcodes
rbcl & matk between species of fabaceae
Saadullah¹*, Zaheer-ud-Din Khan¹, Muhammad AShfaq², Zaib-u-Nisa¹
1Department of Botany, GC University, Lahore Pakistan
2Biodiversity Institute Ontario (BIO), University of Guelph, Canada
Key words: DNA barcoding, Fabaceae, rbcl, matK, Identification.
http://dx.doi.org/10.12692/ijb/8.5.75-86 Article published on May 18, 2016
Abstract
For species identification, .DNA barcoding is a novel diagnostic technique, the aim of which is to contribute
towards wide range of ecological and conservation studies. In this study, we evaluated the capacity of the core
DNA barcodes rbcla and matK for identifying 62 plant specimen belonging to 22 species of Fabaceae. All plant
specimen were collected from district Dera Ghazi Khan, Punjab, Pakistan. In this research work, highest mean
pairwise interspecific distance showed by matK and lowest for rbcl. Based on ‘best match’ and ‘best close match’
analysis function of TaxonDNA , both matK and rbcl was best with almost 73% correct identification, while
based on ‘all species barcodes’ analysis, rbcl and matK gave the lowest percentage of correct species
identifications 64.51% & 51.11%, respectively. By using MEGA5, for each marker neighbor joining (N/J) trees
based on Kimur-2-parameter (K2P) were produced. In tree based analysis, species were considered to be
discriminated. that form separate clusters in the tree with a bootstrap support >50%.. In this study both plant
DNA barcodes in combination (rbcl +matK) showed best discriminatory power between different species of
Fabaceae.
* Corresponding Author: Saadullah [email protected]
International Journal of Biosciences | IJB |
ISSN: 2220-6655 (Print), 2222-5234 (Online)
http://www.innspub.net
Vol. 8, No. 5, p. 75-86, 2016

76 Saadullah et al.
Int. J. Biosci. 2016
Introduction
As we monitor the biological consequences of world
climate change and try to preserve species diversity
from accelerating habitat destruction. We understand
very little about the diversity of plant life and animals,
residing in lots of unique ecosystems on the earth.
Scientists agreed that the every year price of
extinction has expanded from approximately one
species per million to a 100-1,000 per million. This
means that lots of plant and animals are being lost
every year. Maximum of those species that have not
yet been identified. By using classical taxonomy its
not possible to catalog natural diversity earlier than it
disappears.
With more than 18000 species belonging to 650
genera, Fabaceae is the world’s 3rd largest family of
angiosperm and 2nd largest family of medicinal plants
including 490 species which have been used for
conventional drug treatments and a few are
endangered because of overexploitation. Adulterants
are frequently added in drugs from many important
medicinal plant species. Entirely based on
conventional morphological characteristics it's very
difficult to discriminate among medicinal species and
their adulterants. A vast range of molecular
techniques have been used to overcome this problem
which increased the performance and resulted in
unique concept of “DNA barcoding” as a way to
identify and classify species. In 2003, this novel
concept of DNA bracoding was put forward by a
Canadian scientist Dr Paul D.N. Hebert. With this
new concept of DNA barcoding a small segment of
DNA from a specific region of genomes can be a
distinguishing feature for all organisms. As a
Linnaean binomial is an abbreviated label for the
morphology of a species, this short sequence is also
an abbreviated label for the genome of the species.
With the help of advanced technology, faster
sequencing with minimum cost and advanced on line
digital public library of sequences, this abbreviated
label of genome (barcode key) will revolutionize all
aspects of life (Ausubel, 2009). By using DNA
barcoding markers, usually plant species are
inherently more difficult to discriminate than animal
species (Fazekas et al., 2009). After evaluation of
different barcode loci, two plastid markers rbcl and
matK was approved as standard barcodes for plants
(CBOL Plant Working Group, 2009). Now DNA
barcoding has turn out to be a global initiative and it
has standardized the molecular identifications by the
use of globally agreed protocols and segments of DNA
(Hebert et al., 2003; CBOL Plant Working group,
2009).
In Pakistan 82 genera with 587 species belonging to
Fabaceae are reported. In Pakistan, yet no progress
has been made towards the development of DNA
based biodiversity inventories as a result all areas are
still under collected. Primarily based on conventional
botanical sampling and identification, in Pakistan
taxonomists were able to identify a total of 6000
species that are being degraded at a fast pace and lots
of species may face a major risk of extinction (Zabta,
2010). Aim of this study was to
test whether the rbcla and matK regions are
powerful marker for identification and authentication
of species of the family Fabaceae. In this research
work as a tool for rapid and dependable taxonomic
identity, for plant species of family Fabaceae, a bi-
locus barcodes of two plastid markers (rbcl and
matK) were generated. All wild plant species were
collected from district Dera Ghazi Khan (70 38E and
30 03N), Punjab, Pakistan.
Materials and methods
All wild plant specimen belonging to fabaceae had
been collected from District Dera Ghazi Khan (70
38E and 30 03N), Punjab, Pakistan. For tissue
sampling a minimum one and maximum six
specimen from the fresh leaves of each collected
plant specimen have been preserved in air tight
plastic bags with small amount of silica gel. Every
sample of plant tissue was about 0.5 cm² in size. All
plant specimen were identified and herbarium
specimens were prepared as per Jain and Rao’s (1977)
manual and deposited as voucher specimen in Dr.
Sultan herbarium of GC university, Lahore. In this
study, we analyzed 62 and 45 sequences of rbcl and
matK belonging to 22 and 20 species respectively.
Out of total 23 collected species, 19 species have both
77 Saadullah et al.
Int. J. Biosci. 2016
rbcla and matK barcodes. Three species like Acacia
nilotica (5 sequences); Bauhinia variegate (1
sequence) and Prosopis juliflora have no matK
sequences while there was no rbcla sequence of
Abutilon indicum (Table-1).
DNA extraction, amplification and sequencing
Under a project “GCUDG” on BOLD, extraction of
DNA was carried out from silica gel dried leaves. At
the Canadian Centre for DNA Barcoding (CCDB),
university of Guelph, DNA extraction, PCR
amplification and sequencing was done. By following
standard protocol, the labeled tubes of 96- well box
were loaded with tissue samples taken from silica gel
dried leaves
(http://ibol.org/wpcontent/uploads/2011/04/Sample
_Submission_Package-Plant.pdf). By using the semi-
auomated method for plant DNA extractions, tissue
lysis and DNA extraction have been executed
(http://www.ccdb.ca/CCDB_DOCS/CCDB_DNA_Ext
raction-plant life.pdf) (Ivanova et al., 2008).
According to the standard protocol of CCDB, PCR
products for rbcl and matK were obtained
(http://www.ccdb.ca/CCDB_DOCS/CC
DB_Amplification-flora.pdf). The primers rbcla- F
(ATGTCACCACAAA CAGAGACTAAAGC) (Levin et
al., 2003) and rbcla-R
(GTAAAATCAAGTCCACCRCG) (Kress & Erickson
2007) had been used for the sequencing of 552 bp
rbcl barcode while the 773 bp long matK barcode was
acquired with the matK-KIM primers, MatK- 1RKIM-
f (CCCAGTCCATCTGGAAATCTTGGTTC) and MatK-
3FKIM-r (GTACAGTACTTTTGTGTTTACGAG)
described at
http://www.ccdb.ca/CCDB_DOCS/CCDB_PrimerSet
s-plants.pdf. Purification and bi-dierectional
sequencing of PCR products was also carried at CCDB
(Hajibabaei et al., 2006).
Sequence alignments and molecular analysis
By using CODONCODE aligner, assembling and
editing of sequences of both barcodes was done
(CodonCode company, Dedham, MA, U.S.A.).
Separate analysis of nucleotide sequences of each
barcode of matK and rbcl was done. Using default
parameters under the profile alignment option on
MEGA5, multiple sequence alignments were carried
out with ClustalW (Tamura et al., 2011). For
‘Neighbor joining’ cluster analysis of both barcodes
(matK and rbcl),1 consensus barcode of all species
was obtained by using the ‘Consensus Barcode
Generator’ function of TaxonDNA because in the
data set there were more than one sequence for most
of the species (Meier et al., 2006). Among taxa,
patterns of sequence divergence were visualized by
means of neighbor-joining (NJ) analysis which was
performed on MEGA5 (Tamura et al.,2011). For
assessment of node support, bootstrap test with 500
replicates was carried out on MEGA5, (Felsenstein,
1985). Sequence distances were computed with
Kimura 2-Parameter (K2P) evolutionary model
(Kimura, 1980).
From aligned sequence data, the accuracy of species
assignments of the samples were tested by using ‘best
match’, ‘best close match’ and ‘all species barcodes’
functions of TaxonDNA. ‘Best match’ “best close
match” and all species barcode’ of each sequence was
determined by its comparison with all other
sequences in the aligned data set. For each locus or
combined loci in the dataset, distribution of pairwise
interspecific and intraspecific distances was analyzed
by the ‘pairwise summary’ function of TaxonDNA
(Meier et al., 2006).
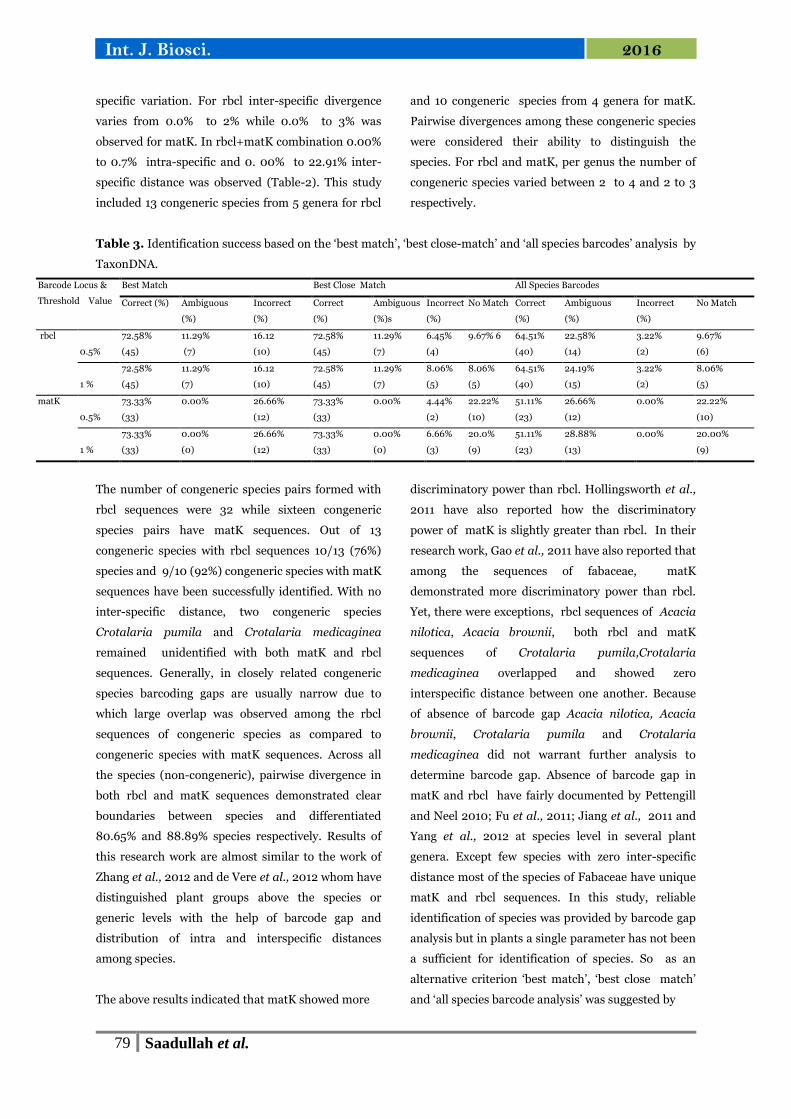
Results and discussion
PCR amplification and bidirectional sequencing of
rbcl and matK markers
The important criteria for the assessment of utility of
DNA barcodes is success of PCR amplification along
with sequence recoverability from both gene regions
rbcl and matK. The amplification success in both
barcodes rbcl and matK was 91% (65/67) and 68%
(45/67 ) respectively. The aligned sequence length of
rbcl was 505-552 bp and 724-846 bp of matK (Table-
1). In bidirectional sequencing recovery, for most of
the PCR amplicon 552 bp long target sequence of rbcl
mostly showed no variation in sequence length while
matK showed significant variation in its sequence
length. Our results supported the earlier studies of

78 Saadullah et al.
Int. J. Biosci. 2016
Kress et al., 2005 and Kress and Erickson, 2007 in
which high PCR amplification and sequencing success
with no variation in sequence length of rbcl was
reported. Moreover, Maia et al., 2012 reported 100%
PCR amplification and sequencing success in rbcl.
This research work also support the previous
research work of Zhang et al., 2012 which reported
highly variable PCR success rate of matK, ranged
between 40% to 97%. Although, in this study no
repeat sequences were documented in matK as
documented by Fazekas et al., 2010 which influenced
the sequencing quality.
Table 1. List of collected plant specimen with maximum number of sequences and base pairs of both DNA
barcodes matK and rbcl.
Serial Number Plant name Maximum Number of
Sequences
No. of Bases in matK
Barcodes
No. of Bases in rbcl
Barcodes
1 Abutilon indicum 5 795 Nil
2 Acacia brownii 1 810 552
3 Acacia modesta 1 789 551
4 Acacia nilotica 5 Nil 552
5 Albizia lebbeck 3 784 528
6 Argyrolobium roseum 2 787 552
7 Astragalus adscendens 1 782 510
8 Astragalus onobrychis 5 784 552
9 Astragalus purshii 1 724 552
10 Atylosia aphylla 1 764 552
11 Bauhinia variegate 1 Nil 552
12 Cassia occidentalis 1 494 552
13 Crotalaria medicaginea 1 783 505
14 Crotalaria pumila 2 784 521
15 Dalbergia sissoo 5 846 552
16 Indigofera hechstetteri 1 802 552
17 Indigofera sessiflora 2 794 552
18 Indigofera suffruticosa 2 792 529
19 Lathyrus aphaca 5 846 552
20 Medicago polymorpha 6 846 540
21 Melilotus officinalis 6 781 552
22 Prosopis cineraria 5 846 552
23 Prosopis juliflora 5 Nil 552
Table 2. Summary of the pairwise intraspecific and interspecific distances in the barcode loci of different species
of Fabaceae.
Intraspecific distances (%) Interspecific distances (%)
Barcode loci Minimum Maximum Minimum Maximum
rbcl 0.00% 0.45% 0.00% 2.00%
matK 0.00% 0.50% 0.00% 3.00%
rbcl+matK 0.00% 0.07% 0.00% 22.91%
Intra / Inter specific Divergence
By using the criteria of DNA ‘barcode gap’ the
distributions of intra vs. inter-specific variability have
been compared. On the basis of ‘barcode gap’, a
species is considered as distinct from it is nearest
neighbor if its minimum inter-specific distance
between nearest neighbor is greater than its
maximum intra-specific distance. In this study,
among the 62 sequences of species belonging to
Fabaceae the percent intra-specific divergence ranges
from 0.0% to 0.45% and 0.0% to 0.50% for rbcl and
matK respectively (Table-2). In this intra-specific
distance analysis, 82.22% and 98%, sequences of
matK and rbcl respectively demonstrated no intra-
79 Saadullah et al.
Int. J. Biosci. 2016
specific variation. For rbcl inter-specific divergence
varies from 0.0% to 2% while 0.0% to 3% was
observed for matK. In rbcl+matK combination 0.00%
to 0.7% intra-specific and 0. 00% to 22.91% inter-
specific distance was observed (Table-2). This study
included 13 congeneric species from 5 genera for rbcl
and 10 congeneric species from 4 genera for matK.
Pairwise divergences among these congeneric species
were considered their ability to distinguish the
species. For rbcl and matK, per genus the number of
congeneric species varied between 2 to 4 and 2 to 3
respectively.
Table 3. Identification success based on the ‘best match’, ‘best close-match’ and ‘all species barcodes’ analysis by
TaxonDNA.
Barcode Locus &
Threshold Value
Best Match Best Close Match All Species Barcodes
Correct (%) Ambiguous
(%)
Incorrect
(%)
Correct
(%)
Ambiguous
(%)s
Incorrect
(%)
No Match Correct
(%)
Ambiguous
(%)
Incorrect
(%)
No Match
rbcl
0.5%
72.58%
(45)
11.29%
(7)
16.12
(10)
72.58%
(45)
11.29%
(7)
6.45%
(4)
9.67% 6 64.51%
(40)
22.58%
(14)
3.22%
(2)
9.67%
(6)
1 %
72.58%
(45)
11.29%
(7)
16.12
(10)
72.58%
(45)
11.29%
(7)
8.06%
(5)
8.06%
(5)
64.51%
(40)
24.19%
(15)
3.22%
(2)
8.06%
(5)
matK
0.5%
73.33%
(33)
0.00% 26.66%
(12)
73.33%
(33)
0.00% 4.44%
(2)
22.22%
(10)
51.11%
(23)
26.66%
(12)
0.00%
22.22%
(10)
1 %
73.33%
(33)
0.00%
(0)
26.66%
(12)
73.33%
(33)
0.00%
(0)
6.66%
(3)
20.0%
(9)
51.11%
(23)
28.88%
(13)
0.00%
20.00%
(9)
The number of congeneric species pairs formed with
rbcl sequences were 32 while sixteen congeneric
species pairs have matK sequences. Out of 13
congeneric species with rbcl sequences 10/13 (76%)
species and 9/10 (92%) congeneric species with matK
sequences have been successfully identified. With no
inter-specific distance, two congeneric species
Crotalaria pumila and Crotalaria medicaginea
remained unidentified with both matK and rbcl
sequences. Generally, in closely related congeneric
species barcoding gaps are usually narrow due to
which large overlap was observed among the rbcl
sequences of congeneric species as compared to
congeneric species with matK sequences. Across all
the species (non-congeneric), pairwise divergence in
both rbcl and matK sequences demonstrated clear
boundaries between species and differentiated
80.65% and 88.89% species respectively. Results of
this research work are almost similar to the work of
Zhang et al., 2012 and de Vere et al., 2012 whom have
distinguished plant groups above the species or
generic levels with the help of barcode gap and
distribution of intra and interspecific distances
among species.
The above results indicated that matK showed more
discriminatory power than rbcl. Hollingsworth et al.,
2011 have also reported how the discriminatory
power of matK is slightly greater than rbcl. In their
research work, Gao et al., 2011 have also reported that
among the sequences of fabaceae, matK
demonstrated more discriminatory power than rbcl.
Yet, there were exceptions, rbcl sequences of Acacia
nilotica, Acacia brownii, both rbcl and matK
sequences of Crotalaria pumila,Crotalaria
medicaginea overlapped and showed zero
interspecific distance between one another. Because
of absence of barcode gap Acacia nilotica, Acacia
brownii, Crotalaria pumila and Crotalaria
medicaginea did not warrant further analysis to
determine barcode gap. Absence of barcode gap in
matK and rbcl have fairly documented by Pettengill
and Neel 2010; Fu et al., 2011; Jiang et al., 2011 and
Yang et al., 2012 at species level in several plant
genera. Except few species with zero inter-specific
distance most of the species of Fabaceae have unique
matK and rbcl sequences. In this study, reliable
identification of species was provided by barcode gap
analysis but in plants a single parameter has not been
a sufficient for identification of species. So as an
alternative criterion ‘best match’, ‘best close match’
and ‘all species barcode analysis’ was suggested by

80 Saadullah et al.
Int. J. Biosci. 2016
Meier et al., 2006.
Best Close Match and All Species Barcode Analysis
The analysis on the basis of ‘best match’, ‘best close
match’ and ‘all species barcodes’ was done by using
TaxonDNA (Meier et al., 2006). All above mentioned
parameters were employed to test the accuracy of
species assignments. By using above parameters
closest match of a sequence was determined by its
comparisons with all the other sequences. According
to Xiang et al., 2011 and Zhang et al.,2012, large
number of researchers have applied these statistics in
barcode studies for species assignments. On the
basis of frequency distribution of pairwise intra-
specific distances similarity threshold is established.
The threshold was set at a value below which 95% of
all intra-specific were found (Meier et al., 2006).
Fig. 1. Phylogenetic Tree of rbcl.
The evolutionary history was inferred using the Neighbor-Joining method . The optimal tree with the sum of
branch length = 0.16217251 is shown. The percentage of replicate trees in which the associated taxa clustered
together in the bootstrap test (500 replicates) are shown next to the branches. The tree is drawn to scale, with
branch lengths in the same units as those of the evolutionary distances used to infer the phylogenetic tree. The
evolutionary distances were computed using the Kimura 2-parameter method and are in the units of the number
of base substitutions per site. The analysis involved 22 nucleotide sequences. Codon positions included were
1st+2nd+3rd+Noncoding. All positions containing gaps and missing data were eliminated. There were a total of
469 positions in the final dataset. Evolutionary analyses were conducted in MEGA5.
The query sequence is assigned to a species with
which it shows the smallest genetic distance. Within
this study, the rbcl and matK sequences of individual
samples were queried against sequences reference
barcode library of GCUDG project on BOLD. A
successful identification was considered to be
achieved if both sequences were from the same
species otherwise mismatched sequences were
considered as failure. At 0.5% and 1% threshold
values, % age of correct species identifications
according to ‘best match’ and ‘best close match’
analysis, were 72.58% and 73.33% in rbcl and matK
respectively (Table-3). At both above mentioned
threshold values, in ‘best close match’ analysis
“ambiguous” identification were 11.29% and 0.00% in
rbcl and matK respectively while incorrect
identification have been 16.12% in rbcl and
26.66% in matK. In ‘best match’ and “best close

81 Saadullah et al.
Int. J. Biosci. 2016
match” analysis of rbcl, % age of sequences without
any match at 0.5% and 1% were different and exact
same situation was observed in matK also (Table-3).
In rbcl, at 0.5% and 1% threshold, %age of sequences
without any match were 9.67% and 8.06% while in
matK %age of sequences without any match at 0.5%
and 1% were 25.22% and 20.00% respectively (Table-
3). On the basis of ‘all species barcodes’ analysis, the
identification success by both barcodes rbcl and
matK was lower than ‘best match’ and ‘best close
match’ analysis as the correct identifications by rbcl
and matK were 64.51% and 51.11% respectively while
% age of ambiguous identification and no match by
rbcl was different at both threshold, same situation
was bserved for matK (Table-3). Based on ‘all species
barcodes’, analysis matK with 0.00% of incorrect
species identication performed well than rbcl (3.22%)
(Table-3). In the ‘best match’, ‘best close match’ and
‘all species barcodes’ analysis, “correct identification”
means that the hit in the database with smallest
genetic distances is from same species as that of the
query; “ambiguous identification” signifies that
several hits from our database were found to give the
same smallest genetic distance towards the query
sequence; “incorrect identification” signifies that the
hit having the smallest genetic distance is not from
the expected species.
Fig. 2. Phylogenetic Tree of matK.
The evolutionary history was inferred using the Neighbor-Joining method . The optimal tree with the sum of
branch length = 0.58950767 is shown. The percentage of replicate trees in which the associated taxa clustered
together in the bootstrap test (500 replicates) are shown next to the branches.The tree is drawn to scale, with
branch lengths in the same units as those of the evolutionary distances used to infer the phylogenetic tree. The
evolutionary distances were computed using the Kimura 2-parameter method and are in the units of the number
of base substitutions per site. The analysis involved 20 nucleotide sequences. Codon positions included were
1st+2nd+3rd+Noncoding. All positions containing gaps and missing data were eliminated. There were a total of
348 positions in the final dataset. Evolutionary analyses were conducted in MEGA5.
In this research work, among tested loci there was no
consistency in species identification success, as in
‘best match’ and ‘best close match’ analysis, matK
with 73.33% identification success showed slightly
better performance than rbcl (72.58%) while in ‘all
species barcodes’ analysis rbcl with 64.51%
performed better than the matK 51.11% (Table-2). In
2010, Mattio and Payri in their study on DNA
barcoding of Sargassum species have reported that
the species identification success was different

82 Saadullah et al.
Int. J. Biosci. 2016
among different loci. In a study by Xiang et al., 2011,
matK emerged as the best barcode for identification
of species in the genus Holcoglossum. In contrast,
according to Newmaster et al., 2008, matK did not
show good results in identification of species of
Myristicaceae and identification success was not more
than 48.6%. As being a plant DNA barcode the
performance of rbcl hasn't been very promising in
many plant groups. In 2010, Ren et al., have
reported only 10% identification success of Alnus
species by rbcl. For identification of closely related
species of Lysimachia L. (Myrsinaceae), Zhang et al.,
in 2012 have reported very poor performance by rbcl
which ranged from 25.7 % – 32.3%. Little and
Stevenson, in 2007 and Ferguson in 2012 have
criticized the distance based method because for
distinguishing taxonomic groups the determination of
a single universal threshold of genetic distance is
extremely difficult.
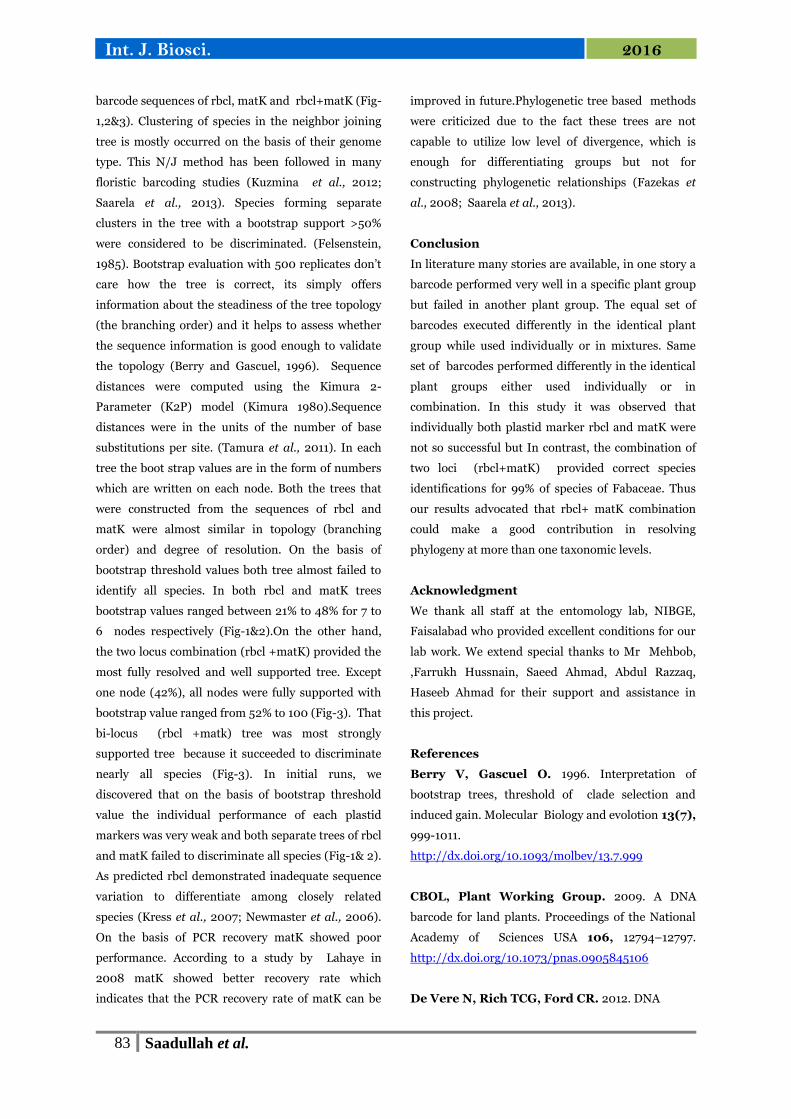
Fig. 3. Phylogenetic Tree of rbcl + matK.
The evolutionary history was inferred using the Neighbor-Joining method . The bootstrap consensus tree inferred
from 500 replicates [2] is taken to represent the evolutionary history of the taxa analyzed . Branches
corresponding to partitions reproduced in less than 50% bootstrap replicates are collapsed. The percentage of
replicate trees in which the associated taxa clustered together in the bootstrap test (500 replicates) are shown
next to the branches. The evolutionary distances were computed using the Kimura 2-parameter method and are
in the units of the number of base substitutions per site. The analysis involved 23 nucleotide sequences. Codon
positions included were 1st+2nd+3rd+Noncoding. All positions containing gaps and missing data were
eliminated. There were a total of 1011 positions in the final dataset. Evolutionary analyses were conducted in
MEGA5.
The great variation of barcode gap across the different
plant groups is a fact, which strongly supports this
criticism. Moreover, assigning group specific
threshold is not reliable when the estimated intra-
group divergence does not represent the entire range
of the distribution (Fazekas et al., 2008). In 2012, a
study conducted on DNA based evolutionary
analysis of Lespedeza (Fabaceae), Xu et al. have
reported that incongruent signal have been showed by
nuclear and plastid markers. So on the basis of above
mentioned study, incongruence between sequences of
matK and rbcl can not be ruled out.
Neighbor Joining (N/J) Phylogentic Analysis
In this study, by using MEGA5, three neighbor joinig
trees were constructed from the aligned consensus
83 Saadullah et al.
Int. J. Biosci. 2016
barcode sequences of rbcl, matK and rbcl+matK (Fig-
1,2&3). Clustering of species in the neighbor joining
tree is mostly occurred on the basis of their genome
type. This N/J method has been followed in many
floristic barcoding studies (Kuzmina et al., 2012;
Saarela et al., 2013). Species forming separate
clusters in the tree with a bootstrap support >50%
were considered to be discriminated. (Felsenstein,
1985). Bootstrap evaluation with 500 replicates don’t
care how the tree is correct, its simply offers
information about the steadiness of the tree topology
(the branching order) and it helps to assess whether
the sequence information is good enough to validate
the topology (Berry and Gascuel, 1996). Sequence
distances were computed using the Kimura 2-
Parameter (K2P) model (Kimura 1980).Sequence
distances were in the units of the number of base
substitutions per site. (Tamura et al., 2011). In each
tree the boot strap values are in the form of numbers
which are written on each node. Both the trees that
were constructed from the sequences of rbcl and
matK were almost similar in topology (branching
order) and degree of resolution. On the basis of
bootstrap threshold values both tree almost failed to
identify all species. In both rbcl and matK trees
bootstrap values ranged between 21% to 48% for 7 to
6 nodes respectively (Fig-1&2).On the other hand,
the two locus combination (rbcl +matK) provided the
most fully resolved and well supported tree. Except
one node (42%), all nodes were fully supported with
bootstrap value ranged from 52% to 100 (Fig-3). That
bi-locus (rbcl +matk) tree was most strongly
supported tree because it succeeded to discriminate
nearly all species (Fig-3). In initial runs, we
discovered that on the basis of bootstrap threshold
value the individual performance of each plastid
markers was very weak and both separate trees of rbcl
and matK failed to discriminate all species (Fig-1& 2).
As predicted rbcl demonstrated inadequate sequence
variation to differentiate among closely related
species (Kress et al., 2007; Newmaster et al., 2006).
On the basis of PCR recovery matK showed poor
performance. According to a study by Lahaye in
2008 matK showed better recovery rate which
indicates that the PCR recovery rate of matK can be
improved in future.Phylogenetic tree based methods
were criticized due to the fact these trees are not
capable to utilize low level of divergence, which is
enough for differentiating groups but not for
constructing phylogenetic relationships (Fazekas et
al., 2008; Saarela et al., 2013).
Conclusion
In literature many stories are available, in one story a
barcode performed very well in a specific plant group
but failed in another plant group. The equal set of
barcodes executed differently in the identical plant
group while used individually or in mixtures. Same
set of barcodes performed differently in the identical
plant groups either used individually or in
combination. In this study it was observed that
individually both plastid marker rbcl and matK were
not so successful but In contrast, the combination of
two loci (rbcl+matK) provided correct species
identifications for 99% of species of Fabaceae. Thus
our results advocated that rbcl+ matK combination
could make a good contribution in resolving
phylogeny at more than one taxonomic levels.
Acknowledgment
We thank all staff at the entomology lab, NIBGE,
Faisalabad who provided excellent conditions for our
lab work. We extend special thanks to Mr Mehbob,
,Farrukh Hussnain, Saeed Ahmad, Abdul Razzaq,
Haseeb Ahmad for their support and assistance in
this project.
References
Berry V, Gascuel O. 1996. Interpretation of
bootstrap trees, threshold of clade selection and
induced gain. Molecular Biology and evolotion 13(7),
999-1011.
http://dx.doi.org/10.1093/molbev/13.7.999
CBOL, Plant Working Group. 2009. A DNA
barcode for land plants. Proceedings of the National
Academy of Sciences USA 106, 12794–12797.
http://dx.doi.org/10.1073/pnas.0905845106
De Vere N, Rich TCG, Ford CR. 2012. DNA

84 Saadullah et al.
Int. J. Biosci. 2016
barcoding the native flowering plants and conifers of
Wales. PLoS ONE 7, 37945.
http://dx.doi.org/10.1371/journal.pone.0037945
Fazekas AJ, Burgess KS, Kesanakurti PR,
Percy DM, Hajibabaei M. 2008. Assessing the
utility of coding and non-coding genomic regions for
plant DNA barcoding. PLoS ONE 3, 1–12.
Fazekas AJ, Kesanakurti PR, Burgess KS,
Percy DM, Graham SW, Barrett SCH,
Newmaster SG. 2009. Are plant species inherently
harder to discriminate than animal species using
DNA barcoding markers? Molecular Ecology
Resources 9(1), 130–139.
http://dx.doi.org/10.1111/j.1755-0998.2009.02652.x
Fazekas AJ, Steeves R, Newmaster SG. 2010.
Improving sequencing quality from PCR products
containing long mononucleotide repeats.
Biotechniques 48, 277–281.
http://dx.doi.org/10..2144/000113369
Felsenstein J. 1985. Confidence limits on
phylogenies. An approach using the bootstrap.
Evolution 39, 783-791.
Ferguson JWH. 2002. On the use of genetic
divergence for identifying species. Biological Journal
of Linnaean Society 75, 509–516.
http://dx.doi.org/10.1046/j.1095-8312.2002.00042.x
Fu YM, Jiang WM, Fu CX. 2011. Identification of
species within Tetrastigma (Miq.) Planch. (Vitaceae)
based on DNA barcoding techniques. Journal of
Systematics and Evolution 49, 237–245.
http://dx.doi.org/10.1111/j.1759-6831.2011.00126.x
Gao T, Sun Z, Yao H, Song J, Zhu Y, Ma
X , Chen S. 2011. Identification of Fabaceae plants
using the DNA barcode matK. Planta Medica 77, 92–
94.
http://dx.doi.org/10.1055/s-0030-1250050
Gonzalez MA, Baralot C, Engel J, Mori SA,
Pétronell P, Riéra B, Roger A, Thébaud C,
Chave J. 2009. Identification of Amazonian Trees
with DNA Barcodes. PLoS ONE 4(10), 7483.
http://dx.doi.org/10.1371/journal.pone.0007483
Hajibabaei M, Janzen DH, Burns JM,
Hallwachs Vand, Hebert PDN. 2006. DNA
barcodes distinguish species of tropical Lepidoptera.
Proceeding of the National Academy of Sciences USA
103, 968–971.
http://dx.doi.org/10.1073/pnas.0510466103
Hebert PDN, Cywinska A, Ball SL, De Waard
JR. 2003. Biological identifications through DNA
barcodes. Proceedings of the Royal Society of London
Series B. Biological Sciences 270, 313–321.
http://dx.doi.org/10.1098/rspb.2002.2218
Ivanova NV, Fazekas AJ, Hebert PDN. 2008.
Semi-automated, membrane based protocol for DNA
isolation from plants. Plant Molecular Biology
Reporter 26, 186–198.
http://dx.doi.org/10.1007/s11105-008-0029-4
Jain SK, Rao RR. 1977. A Handbook of Field and
Herbarium Methods. Today and Tomorrow’s Printers
& Publishers, New Delhi.
Ausubel JH. 2009. A botanical macroscope.
Proceeding of the National Academy of Sciences USA
106(31), 1256–1257.
http://dx.doi.org/10.1073/pnas.0906757106
Jiang YC, Ding L, Zhang R, Yang Y, Zhou,
Tang L. 2011. Identification of the genus
Epimedium with DNA barcodes. Journal of Medicinal
Plants Research 5, 6413–6417.
http://dx.doi.org/10.5897/JMPR11.545
Kimura M. 1980. A simple method for estimating
evolutionary rates of base substitutions through
comparative studies of nucleotide sequences. Journal
of molecular evolution 16, 111-120.
Kress WJ, Wurdack KJ, Zimmer EA, Weigt

85 Saadullah et al.
Int. J. Biosci. 2016
LA, Janzen DH. 2005. Use of DNA barcodes to
identify flowering plants. Proceeding of the National
Academy of Sciences USA. 102, 8369–8374.
http://dx.doi.org/10.1073/pnas.0503123102
Kress WJ, Erickson DL. 2007. A two-locus global
DNA barcode for land plants: the coding rbcl gene
complements the non-coding trnH-psbA spacer
region. PLoS ONE 2(6), 508.
http://dx.doi.org/10.1371/journal.pone.0000508
Kuzmina ML, Johnson K, Barron HR, Hebert
PDN. 2012. Identification of the vascular plants of
Churchill, Manitoba, using a DNA barcode library.
BioMed Central Ecology 12, 25.
http://dx.doi.org/10.1186/1472-6785-12-25
Lahaye RM, Van Der Bank, Bogari. 2008. DNA
barcoding the floras of biodiversity hotspots.
Proceeding of the National Academy of Science USA
105, 2923–2928.
http://dx.doi.org/10.1073/pnas.0709936105
Little DP, Stevenson DW. 2007. A comparison of
algorithms for the identification of specimens using
DNA barcodes, Examples from gymnosperms.
Cladistics 23, 1–21.
http://dx.doi.org/10.1111/j.1096-0031.2006.00126.x
Levin RA, Wagner W, Hoch PC. 2003. Family-
level relationships of Onagraceae based on
chloroplast rbcl and ndhF data. American Journal of
Botany 90, 107–115.
http://dx.doi.org/10.3732/ajb.90.1.107
Maia VH, Mata CS, Franco LO, Cardoso MA,
Cardoso SRS. 2012. DNA barcoding Bromeliaceae:
achievements and pitfalls. PLoS ONE 7(1), 29877.
http://dx.doi.org/10.1371/journal.pone.0029877
Mattio L, Payri C. 2010. Assessment of five
markers as potential barcodes for identifying
Sargassum subgenus Sargassum species
(Phaeophyceae, Fucales). Cryptogamie Algologie 31,
467–485.
Meier R, Shiyang K, Vaidya G, Ng PKL. 2006.
DNA barcoding and taxonomy in Diptera: a tale of
high intraspecific variability and low identification
success. Systematic Biology 55(5), 715–728.
http://dx.doi.org/10.1080/10635150600969864
Newmaster SG, Fazekas AJ, Ragupathy S.
2006. DNA barcoding in land plants: Evaluation of
rbcl in a multigene tiered approach. Canadian
Journal of Botany 84, 335–441.
http://dx.doi.org/10.1139/b06-047
Newmaster SG, Fazekas J, Steevea RAD,
Janovec J. 2008. Testing candidate plant barcode
regions in the Myristicaceae. Molecular Ecology
Resources 8, 480–490.
http://dx.doi.org/10.1111/j.1471-8286.2007.02002.x
Peter Hollingsworth M, Sean Graham W,
Damon Little P. 2011. Choosing and Using a Plant
DNA Barcode. PLoS ONE 6(5), 19254.
http://dx.doi.org/10.1371/journal.pone.0019254
Pettengill J.B, Neel MC. 2010. An evaluation of
candidate plant DNA barcodes and assignment
methods in diagnosing 29 species in the genus
Agalinis (Orobanchaceae). American Journal of
Botany 97, 1391–1406.
http://dx.doi.org/10.3732/ajb.0900176
Ren BQ, Xiang XG, Chen ZD. 2010. Species
identification of Alnus (Betulaceae) using nrDNA and
cpDNA genetic markers. Molecular Ecology
Resources 10, 594–605.
http://dx.doi.org/10.1111/j.1755-0998.2009.02815.x
Saarela JM, Sokoloff PC, Gillespie LJ,
Consaul LL, Bull RD. 2013. DNA barcoding the a
Canadian Arctic Flora: core plastid barcodes
(rbcl+matK) for 490 Vascular Plant Species. PLoS
ONE 8, 36.
http://dx.doi.org/10.1371/journal.pone.0077982
Tamura K, Peterson D, Peterson N. 2011.
MEGA5: molecular evolutionary genetics analysis

86 Saadullah et al.
Int. J. Biosci. 2016
using maximum likelihood, evolutionary distance,
and maximum parsimony methods. Molecular
Biology and Evolution 28, 2731–2739.
http://dx.doi.org/10.1093/molbev/msr121
Xiang XG, Hu H, Wang W, Jin XH. 2011. DNA
barcoding of the recently evolved genus
Holcoglossum (Orchidaceae: Aeridinae): a test of
DNA barcode candidates. Moecular Ecology
Resources 11, 1012–1021.
http://dx.doi.org/10.1111/j.1755-0998.2011.03044.x
Xu B, Wu N, Gao XF, Zhang LB. 2012. Analysis
of DNA sequences of six chloroplast and nuclear
genes suggests incongruence, introgression, and
incomplete lineage sorting in the evolution of
Lespedeza (Fabaceae). Molecular Phylogenetics and
Evolution 62, 346–358.
http://dx.doi.org/10.1016/j.ympev.2011.10.007
Yang JB, Wang YP, Moller M, Gao LM, Wu D.
2012. Applying plant DNA barcodes to identify
species of Parnassia (Parnassiaceae). Moecular
Ecology Resources. 12, 267–275.
http://dx.doi.org/10.1111/j.1755-0998.2011.03095.x
Zabta Shinwari K. 2010. Medicinal plants research
in Pakistan. Journal of Medicinal Plants Research
4(3), 161-176.
Zhang CY, Wang FY, Yan HF, Hao G, Hu CM.
2012. Testing DNA barcoding in closely related
groups of Lysimachia L. (Myrsinaceae). Molecular
Ecology Resources 12, 98–108.
http://dx.doi.org/10.1111/j.1755-0998.2011.03076.x