Pavement Management Systems Pavement Preservation Pavement Rehabilitation Overview Dr. Nick Vitillo.

University of Rhode Island University of Rhode Island
DigitalCommons@URI DigitalCommons@URI
Open Access Dissertations
2016
Evaluation of Pavement Rehabilitation Strategies on Route 165 Evaluation of Pavement Rehabilitation Strategies on Route 165
and Prediction Performance and Prediction Performance
Kathleen Wilson University of Rhode Island, [email protected]
Follow this and additional works at: https://digitalcommons.uri.edu/oa_diss
Recommended Citation Recommended Citation Wilson, Kathleen, "Evaluation of Pavement Rehabilitation Strategies on Route 165 and Prediction Performance" (2016). Open Access Dissertations. Paper 463. https://digitalcommons.uri.edu/oa_diss/463
This Dissertation is brought to you for free and open access by DigitalCommons@URI. It has been accepted for inclusion in Open Access Dissertations by an authorized administrator of DigitalCommons@URI. For more information, please contact [email protected].

DOCTOR OF PHILOSOPHY DISSERTATION
OF
KATHLEEN WILSON
APPROVED:
Thesis Committee:
Major Professor
K .Wayne Lee
Natacha E. Thomas
Farhad Atash
Nasser H. Zawia
DEAN OF THE GRADUATE SCHOOL
UNIVERSITY OF RHODE ISLAND
2016

ABSTRACT
Many roads in Rhode Island are coming to their intended design life and are now
considered in poor condition. Significant number of roads with severe deterioration is being
rehabilitated through full depth reclamations (FDR) with various additives. FDR can rejuvenate
subbase and pavement structures. Route 165 in Exeter, Rhode Island, was selected as a test road
with four different treatments and a control. The road had severe pavement distresses such as
alligator cracking, pot holes, shoving and raveling and was not a candidate for a resurfacing. The
road had a FDR in 2013 which included a control section, three test sections with additives which
consisted of calcium chloride, asphalt emulsion, and Portland cement, and a geo-grid section.
Triaxial testing was performed on the subbase materials and subgrade soils before and after the
FDR treatments to determine the resilient modulus. The results of the material testing were used to
predict the performance of each of the test sections by using AASHTOWare Pavement ME Design
software.
The 200 mm (8.0 in.) rehabilitated base/subbase layer was covered with 62.5 mm (2.5 in.)
Hot Mix Asphalt (HMA) with Warm Mix Asphalt (WMA) additive base and 50 mm (2 in.) surface.
The maximum sizes of base and surface aggregate were 19 mm (3/4 in.) and 12.5 mm (1/2 in.),
respectively. Properties of HMA mixtures with WMA additives including dynamic modulus were
determined as input parameters and for further analysis
Of the five test sections, it was predicted that the pavement with the FDR layer stabilized with
Portland cement would perform the best overall. Next is calcium chloride followed by the control
(no additive), geo-grid and asphalt emulsion.
A condition survey was conducted in 2015 winter, but there was no surface distresses found
on any of the five test sections. A plan for long term performance evaluation has been developed,
and an optimal strategy has been recommended, i.e., predicting performances before rehabilitating
any broken roads.

iii
ACKNOWLEDGEMENTS
I would like to thank Professor K. Wayne Lee for the guidance and support over the course
of this study. I also thank my dissertation committee members, Professor Natacha Thomas and
Professor Farhad Atash; and dissertation defense committee members, Professor Chris Hunter and
Professor Arun Shukla.
A research project entitled “Evaluation of Pavement Rehabilitation Strategies on Route
165 and Prediction of Performance” was submitted for funding to the Rhode Island Department of
Transportation (RIDOT) by the Department of Civil & Environmental Engineering at the
University of Rhode Island (URI) in April, 2003. A Research and Technology Development
Cooperative Agreement was subsequently entered into by the RIDOT and the URI for conducting
research involving the field performance of five tests sections on Route 165, Exeter, RI.
Introductory works, which preceded the start of the project, involved preparing a scope of
work and project cost as well as sampling of Route 165 materials by another research grant from
URI. Purchasing of a computer program from AASHTO was done in November, 2015. I am
indebted to Messrs. Colin Franco and Michael Sock of Research and Technology Development
Section, and Mr. Michael Byrne of Material Section of RIDOT.

iv
TABLE OF CONTENTS
ABSTRACT ………………………………………………………………. ii
ACKNOWLEDGEMENTS …..………………………………………………. iii
TABLE OF CONTENTS ……..………………………………………………. iv
LIST OF TABLES ……..……………………………………………………….. vi
LIST OF FIGURES ….. ……………………………………………………….. viii
1. INTRODUCTION ….. ………………………………………………. 1
1.1 Objectives of Study ……………………………………… 2
1.2 Significance of Study …………………………………..… 4
2. Rehabilitation of Route 165 ………………………………………… 7
2.1 History ………………………………… ……………. 7
2.2 Pre-Construction Material Testing …………………….. 8
2.3 Methodologies and/or Procedures …………………….. 8
3. Performance Prediction of Rehabilitated Asphalt Pavement with
AASHTOWare Pavement ME Design Software …….……… 26
3.1 Resilient Modulus of Subgrade Soils ……………………… 27
3.2 Resilient Modulus of Existing Subbase …………………… 27
3.3 Resilient Modulus of Full Depth Reclamation (FDR) of
New Base/Subbase ………………………………………… 28

v
3.4 Determination of Physical Properties of Asphalt
Base and Surface Layers ………………………………….. 29
3.5 Traffic Spectrum Obtained from Weigh-in Motion
(WIM) Data ……………………………………………….. 30
3.6 Climate Data ……………………………………………...... 31
3.7 Prediction of Performance with AASHTOWare Pavement
ME Design Software …………………………………………… 31
3.7.1 Prediction of Performance for Control Test Section
(Cold FDR) …………………………………………………… 35
3.7.2 Prediction of Performance for the Calcium Chloride Section .. 35
3.7.3 Prediction of Performance for Portland Cement
Concrete Section …………………………………………… 36
3.7.4 Prediction of Performance for Geo-Grid Section ……………. 36
3.7.5 Prediction of Performance for Asphalt Emulsion Section ……. 37
3.7.6 Summary …………………………………………………... 37
4. Evaluation of Performance of Rehabilitated Asphalt Pavement …………… 55
4.1 Surface Distresses and Field Condition Survey ………………………….. 55
4.1.1 Permanent Deformation and Rutting ……………………….. 56
4.1.2 Fatigue Cracking …….……………………………………… 56
4.1.3 Thermal Cracking …………………………………………… 56
4.2 Serviceability and Roughness ……………………………………………… 56
4.2.1 International Roughness Index ………………………………. 56
4.3 Structural Capacity and Deflection ………………………………………… 57
4.4 Analysis of Ground Penetrating Radar (GPR) ……………………………….. 59
4.5 Comparative Analysis between Performance Prediction and Evaluation ……. 60
4.5.1 Control Test Section ……………………………………….. 61
4.5.2 Calcium Chloride Section …………………………………… 61
4.5.3 Portland Cement Section ……………………………………. 62

vi
4.5.4 Asphalt Emulsion Section …………………………………. 62
4.5.5 Geogrid Section ……………………………………………. 63
4.6 Selection of Best Alternatives Based on Short-Term Evaluation ……………. 63
4.6.1 Forecasting Future Performance through Tieing with
Pavement Structural Health Index (PSHI) …………………. 63
4.6.2 Optimal Strategies for Rehabilitation ………………………… 64
4.7 Guidelines for Long-term Evaluation and Optimal Rehabilitation Design
Strategies …………………………………………………………………….. 64
5. Conclusions and Recommendations ……………………………………………. 76
5.1 Findings ……………………………………………………… 76
5.2 Recommendations …………………………………………... 79
5.3 Conclusions …………………………………………………... 80
6. BIBLIOGRAPHY ………………………………………………………………… 81
7. Appendix A. MED Reports ……….……………………………………………… 83
8. Appendix B. Asphalt Properties ………………………………………………. 142
9. Appendix C. Monthly Traffic Reports …………………………………………… 146
10. Appendix D. Windshield Surveys and dTIMS Report ……………………..…... 160
11. Appendix E. Construction IRI ……………………………….…………….…. 171
12. Appendix F. FWD Reports ………………………………….…………………. 174
13. Appendix G. Ground Penetrating Radar Report ……………………………… 192
14. Appendix H. RIDOT Full Depth Reclamations Specifications ………………… 194
15. Appendix Modified MED Reports …………………………………………….. 205

vii
LIST OF TABLES
2.1 Soil Survey for Rhode Island ……………………………………………. 12
2.2 Nuclear Guage Readings for Route 165 …………………………………… 13
2.3 Locations of Test Section …………………………………………………. 14
2.4 Summary of Physical Properties of Selected Subgrade Soils
from the Route 165 Site …………………………………………………….. 15
2.5 Summary of Physical Properties of Selected 1980s RAP
blends from the Route 165 Site ……………………………………….……. 16
2.6 Summary of Physical Properties of Selected FDR RAP/virgin
Aggregate from Rte 165 Site ……………………………………………….. 17
2.7 Cardi 12.5 mm mix – RI 165 ………………………………………………… 18
2.8 Cardi 12.5 mm mix – RI 165 ………………………………………………… 19
3.1 Materials Testing for Route 165 ………………………………………………39
3.2 Resilient Moduli of Sampled 1980s RAP/Virgin
Blends Route 165 Site ……………………………………………………… 40
3.3 Summary of Resilient Moduli for Selected FDR with
and Without Additives ……………………………………………………… 41
3.4 Summary of Basic Properties of the FDR Blends ………………………….. 42
3.5 Physical Properties of Class 19 HMA Base Layer ………………………….. 43
3.6 Creep Compliance of both Mixtures with Respect to Creep Time …………. 44
3.7 Monthly Traffic Counts from December 2014- Nov 2015 ………………….. 45
3.8 Control (Cold Recycled) Distress Prediction Summary for 20 Years ……….. 46
3.9 Calcium Chloride Section Data Results for 20 Years ……………………… 47
3.10 Portland Cement Section Prediction Summary for 20 Years ……………… 48
3.11 Asphalt Emulsion Section Distress Prediction Summary ………………… 49
3.12 Geo-Grid Section Distress Prediction Summary ………………………….. 50
3.13 Comparison of Performance Predictions 51

viii
4.1 Comparison of Performance Predictions on MED IRI
and Contractor’s Run ……………………………………………………… 66
4.2 Comparison Between Subbase and URI Lab Results vs Hogg
Method FWD Results ……………………………………………………… 67
4.3 Comparison of Years to Predicted Threshold Distress ………………………. 68
4.4 Control Section (Cold Recycled) Pavement Performance ………………….. 69
4.5 Calcium Chloride Pavement Performance ……………………………………70
4.6 Portland Cement Runs to Increase Pavement Performance …………………. 71
4.7 Asphalt Emulsion Pavement Performance ………………………………….. 72
4.8 Geo-grid Pavement Performance ……………………………………………. 73
4.9 Comparison of Years of Predicted Threshold Distress and Cost ……………. 74
4.10 Cost Comparison for Thicker Class 19 Base Course ……………………… 75

ix
LIST OF FIGURES
1-5 Locus Map …………………………………………………………………. 6
2.1 Cross Section of Route 165 after Rehabilitation in 1986 …………………. 20
2.2 Cross Section of Route 165 with Control Test Section …………………….. 21
2.3 Cross Section of Route 165 with Calcium Chloride Section ………………. 22
2.4 Cross Section of Route 165 with Emulsion Section ………………………. 23
2.5 Cross Section of Route 165 with Portland Cement Section ………………. 24
2.6 Cross Section of Route 165 with Geo-Grid Section ……………………… 25
3.1 Grain Size Distribution for all 1980 RAP/Virgin Blend Samples ………… 52
3.2 Grain Size Distribution for all FDR Samples. ……………………………… 53
3.3 Vehicle Classification According to FHWA ………………………………. 54

1
Chapter 1
INTRODUCTION
It has been estimated that the amount of miles of truck traffic on our highways will
be increasing and surpassing all other modes of freight shipments in the near future. Tractor
trailers and heavy vehicles account for a majority of the damage done to highways (Lee and
Peckham et al. 1990). The states, especially Rhode Island, are having a hard time keeping
up with and paying for maintenance and rehabilitation (M&R). This means there will be
more wear done to our highways than ever before, and the states will have to do more M&R
with less funding. To meet upcoming highway demand, the Rhode Island Department of
Transportation (RIDOT) has been testing alternative subbase material strategies such as full
depth reclamations (FDR) and has been expanding their use.
RIDOT wants to build a better road, to have less physical maintenance and to control
costs. The final product according to RIDOT is a high performance road. Reclaiming a
roadway can fulfill RIDOTs wants by increasing the stiffness of the subbase and increase
the pavement life.
Achieving higher performance at a 30% to 50% cost savings can be realized with a
full reclamation according to pavement recycling systems. Reclaimed materials are retained
and reused on site, consequently reducing trucking costs for new materials.
Lifecycle cost savings: lower maintenance
Environmental: recycles in-place material
Uses value of existing pavement

2
In-depth: eliminates cracking patterns
Minimizes costly import/export
Structural upgrade to base: R-Value, strength
Shorter construction time, less disruption
(http://www.pavementrecycling.com).
In the 1980, RIDOT had a program to reclaim pavements throughout the state. In
2013, Route 165 was slated to re-reclaimed. An idea was formed to use four different
strategies and a control (Figure 1.1). The objectives of this project are: to test the existing
subbase materials before and after full depth reclamation, to predict the performance of
different subbase strategies and to evaluate the short-term and long-term performance over
time.
1.1 Objective of Study
Route 165 is a unique candidate for research because it is seven miles long without
many intersections, the subgrade layer has a high water table and there is severe frost action
in winter. The objectives of the present research project are as follows:
1. Predict the performance of five test sections on Route 165 which include the
following subtasks:
* Collect and/or determine environmental inputs including temperature,
moisture and Freeze-Thaw etc.
* Work with a URI research team to collect and/or determine basic
properties and resilient modulus of the existing subbase materials of Route 165.

3
* Collect and/or determine properties of reclaimed base/subbase materials
on the five test sections on Route 165.
* Collect and/or determine properties of two and a half inches of Class 19
warm mix asphalt (WMA) (19 mm Superpave) asphalt base (through working
with RIDOT Material Section and Villanova University, Pennsylvania) on Route
165.
* Collect and/or determine properties of two inch Class 12.5 WMA (12.5
mm superpave) asphalt surface (through working with RIDOT Material section
and Villanova University, Pennsylvania) on Route 165.
* Collect Weigh-In-Motion (WIM) data from the RIDOT Traffic Research
Section for initial two-way average annual daily truck traffic (AADTT), percent
trucks in design Lane, percent trucks in design lane, percent trucks in design
directions, and operational speed on Route 165.
* Predict performance including rutting, fatigue cracking, thermal cracking
and roughness in terms of International Roughness Index (IRI) using
AASHTOWare Pavement ME Design (MED).
2. Perform a visual condition survey on Route 165.
3. Secure falling weight deflectometer (FWD) testing data from RIDOT on Route 165
after construction.
* Analyze data including deflection basin.

4
4. Collect profilometer test data from RIDOT to evaluate the smoothness after
construction.
5. Evaluate distresses, if any, and determine which layer has weakness.
6. Evaluate the five different strategies and recommend the best one for future RIDOT
rehabilitation projects from the Route 165 project. The five strategies are a control,
calcium chloride, asphalt emulsion, Portland Cement, and geo-grid. RIDOT has
used calcium chloride and cold recycled mix but not Portland cement no asphalt
emulsion. Geo-grid has been used in the state for drainage problem areas.
7. Provide an optimal design and strategies for future RIDOT rehabilitation projects.
* Assist future testing and evaluation after the 2016 summer.
The outcome of this research project will provide a guideline for future maintenance
and rehabilitation (M&R) projects.
1.2 Significance of Study
Chapter two discusses the construction methodologies and/or procedures
performed on Route 165. It was important to keep the different test strategies as uniform
as possible to have a comparison study. The special job specifications for the contractor
were written to keep the depth of reclamation constant. Chapter three provides the results
of the different subbase strategy tests such as sieve analysis, resilient modulus, and
densities. Collection and compilation of the WIM station data on average annual daily
truck traffic (AADTT), WMA mixes, material properties of the subbase and subgrade, and
climate data. Performance comparisons and ranking between the different MED
strategies. Chapter four consists of surface distresses and field condition surveys, forward
5
calculations of FWD deflections, serviceability and roughness, comparative analysis
between prediction and evaluation of the test strategies, best alternatives base on short
term evaluations and optimal strategies. Chapter 5 provides the conclusion and
recommendations of this research and guidelines for long-term evaluation and optimal
rehabilitation design.

6

7
Chapter 2
Rehabilitation of Rhode Island Route 165
2.1 History
Route 165 was last reconstructed in 1986. The roadway was reclaimed to a depth of 125
mm (5 in.) and mixed with calcium chloride. The pavement thickness, after resurfacing, was 37.5
mm (1-1/2 in.) of bituminous surface course and 62.5 mm (2-1/2 in.) of bituminous modified binder
course over a 125 mm (5 in.) cold recycled base layer mixed with a ratio of 1:2 bituminous
pavement/gravel and 200 mm (8 in.) of existing gravel subbase layer (Figure 2.1).
A geotechnical engineering exploration and analysis was conducted at the request of RIDOT
by V.A. Nacci and Associates, Consulting Soil, and Foundation Engineers on September 25, 1987.
It may be noted that, Route 165 was originally built on soft deposits (swamp). Depending on the
nature of the soft deposit, “construction” dealt with this in one of two ways: one was by removal of
the unsuitable material and the other was by “floating the embankment on the soft soil, often with
considerable settlement” (Nacci et al., 1987).
Eleven test borings were completed for the reconstruction, which found embankments
consisting of sand, some gravel, silt, fibrous organic deposits (peat), and organic silt. Other test
borings indicated that Route 165 was built on glacial till and stratified kame deposits. There were
pockets in the granite bedrock near the surface, which contributed to a high water table. An
exploration and analysis found an additional seven areas of swamp deposits.
Table 2.1 shows the various soil types and properties, and American Association of State
and Highway Transportation Officials (AASHTO) classifications of the soil ranges from A-1 to A-
4 (USDOA 1981). Soils within Route 165 has a low shrink-swell potential but has a potential for
frost action. Route 165 is not comprised of any clay materials, therefore the plasticity index is zero.
Areas of Route 165 that contain Adrian, Walpole, and Ridgebury have severe wetness, low strength,
and severe frost action.

8
The RIDOT, throughout the years, has performed both material and pavement testing on
this roadway primarily through RIDOT maintenance programs. Skid tests measuring pavement
smoothness were performed in 2003, 2006, and 2010 (see Appendix H). The results show that in
2003, Route 165 had skid numbers between 52 and 58. In 2010, the skid number ranged from 50 to
56 while the 2006 data showed values between 43 to 49. Overall, Route 165 has shown a noticeable
decrease in pavement smoothness and rideability.
2.2 Pre-Construction Material Testing
In 2012, the RIDOT Material Section, in conjunction with the URI Department of Civil and
Environmental Engineering, performed testing on the unbound materials from five sample areas
within Route 165. The areas where field samples were taken are in the general vicinity of the poorer
numbers of skid tests. Twelve field samples were taken between November 27, 2012 and December
6, 2012. Nuclear gauge readings were taken at the sample areas at the same time to measure in-situ
dry density, wet density, water contents, and percent moisture. Stationing, utility pole numbers, and
planned treatment areas were recorded to insure future samples were taken in the same locations
(Table 2.2). The 2012 samples were taken to URI for resilient modulus testing, and the results from
RIDOT/URITC Project Number 000154 were used as parameters to run the AASHTOware ME
pavement program (Bradshaw et al. 2015).
2.3 Methodologies and/or Procedures
A test road, i.e., Route 165 in Exeter was rehabilitated and used to predict and evaluate the
performance of different strategies. Four test sections used the full depth eight-inch FDR
base/subcase, and three of them were stabilized with calcium chloride, asphalt emulsion, and
Portland cement. The fifth test section was reconstructed with geo-grid and six inches of filter stone
sandwiched between the layers. The control section was reclaimed in a similar method as the rest of
the reclaimed test sections and no additives was used. All four test and one control section were

9
paved with two and a half inch thick Class 19 HMA base and two inches Class 12.5 HMA surface.
As previously mentioned, Route 165 is approximately seven miles long consisting of seven hills and
valleys. The reclaimed test sections were given at least one hill and valley. The geo-grid section has
only a small section for this research project and each test section has a different segment length and
area of construction (see Table 2.3).
Based on the RIDOT Job Specifications, each of the reclaimed test sections and the geo-
grid section were designed to conform to the same material gradation with 95% to 100% passing a
three inch sieve and 2% to 15% passing a number 200 sieve to achieve a comparable performance
between the test sections. The contractor had to comply with not having any stone, rock, cobble, or
asphalt material being more than four inches in width or length. Cross sections of each test section
are shown in Figures 2.2 through 2.6.
Equipment used consisted of: reclaimer, vibratory sheepsfoot rollers and motorized graders.
Compaction was in accordance with AASHTO T180, Method D to a uniform density of no less than
95% of maximum and pavement operations took place during acceptable temperature ranges.
However, a sudden downpour during Portland cement placement and washed all the material away.
The Portland cement section was then regraded and new Portland cement applied.
Full depth reclamation (FDR) with calcium chloride consisted of using a calcium chloride
(CaCl2) solution. This procedure used AASHTO M 144 specifications for calcium chloride with a
solution being at 35% +/- 1%, alkali chloride 2% maximum as NaCl, and magnesium at 0.1%
maximum as MgCl. From the RIDOT’s Specification 406.9901: A calcium pressure distributer was
used to distribute the CaCl2 solution at a rate of 0.1 to 2 gallons per square yard with a spray bar
length of up to 20 feet. The distributor shall be equipped with a digital volumetric accumulator
meter capable of measuring gallons applied and distance traveled. The volume and measuring device

10
shall be equipped with a power unit for the pump so that the application is by pressure, not gravity.
The spray nozzles and pressure system shall provide a sufficient and uniform fan–shaped spray of
material throughout the entire length of the spray bar at all times while operating, and shall be
adjustable laterally and vertically. The spray shall completely cover the roadway surface receiving
the treatment (RIDOT SPC 406.9901).
Full depth reclamation with bituminous stabilizer consisted of using an asphalt emulsion of
grade MS-2 or HFMS-2. This procedure used AASHTO M.03.03.4 144 specifications for asphalt
emulsion. From the RIDOT’s Specification 406.9903: The asphalt emulsion distributor shall be
capable of applying asphalt emulsion in measured quantities at any rate from 0.1 to 1.5 gallons per
square yard of roadway surface, at any length of spray bar up to 12 feet. It shall be capable of
maintaining the application rate to a tolerance of +0.03 gals/yd2 regardless of change in grade, width
or direction of the road. It shall be equipped with a thermometer for the emulsion and a digital
volumetric accumulator meter capable of measuring gallons applied and distance traveled. The
volume and measuring device shall be equipped with a power unit for the pump so that application
is by pressure, not gravity. The spray nozzles and pressure system shall provide a sufficient and
uniform fan-shaped spray of material throughout the entire length of the spray bar at all times while
operating, and shall be adjustable both laterally and vertically. The spray shall completely and
uniformly cover the roadway surface receiving the treatment (RIDOT SPC 406.9901).
Based on RIDOT’s Specification 406.9904, Portland cement was spread by
distributing a measured amount of cement in front of the reclaimer. The spreader uniformly
blended cement and existing materials to the specified percentage +/- three pounds /square
yard (across the roadway. The Contractor was required to provide a method for verifying
that the correct amount of cement was being applied. Additionally, the cement spreader was

11
equipped with a tractor-trailer utilizing “a Drop behind system” which was pressure
controlled. Each day the operator would calibrate the drop to make sure the correct
application was being applied. The trailer was filled four to five times daily with bulk
delivery trucks. Three pounds per square yard comes out to be four percent Portland cement
mix.
A section of geo-grid mechanically stabilized layer was placed as another test section for a
comparison. Distributors of the Tensar International Corporation Technologies were highly
interested in demonstrating their product and made claims to its durability and strength. RIDOT
decided to use geo-grid along with the reclaimed sections to have a complete test road. The Tensar
product was used in an area of the road that has a high seasonal water table.
The physical properties of each 2013 test sections were determined at URI and are shown
in Tables 2.4 through 2.6. Physical properties of selected subgrade soils from Route 165 site sample
locations are presented in Table 2.4 (Bradshaw et al. 2015). Physical properties of selected 1980s
RAP blends from Route 165 site is presented in Table 2.5. (Bradshaw et al. 2015). Physical
properties of selected FDR RAP blends of Route 165 site is presented in Table 2.6. (Bradshaw et al.
2015).
The rehabilitated eight inch base/subbase were covered with two and a half (2.5) inches of
Class 19 WMA base and two inches of Class 12.5 WMA surface layer as shown in Figures 2.2 to
2.6. A summary of some of the volumetric data for the Class 12.5 WMA surface materials is shown
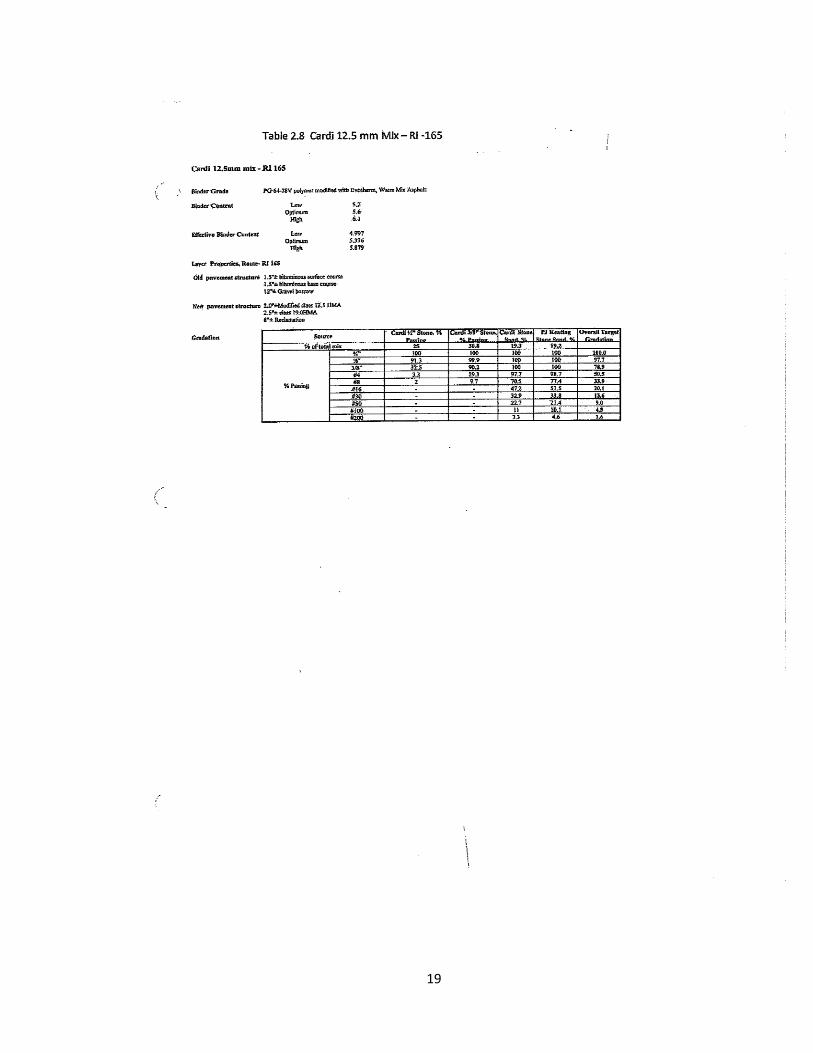
in Tables 2.7 and 2.8.

12

13

14
Table 2.3 Locations of Test Sections
Test Section Station Square
yards Elevations Locations
Utility
Pole
Locations
Segment
Length in
feet
Control Section 48+50 to 75+00 9,000 303 67+25 369 2,650
Calcium Chloride 0+00 to BK 44+82 to 48+50 31,000 396 39+25 304 9,332
Portland Cement 75+00 to 232+00 52,335 144 117+88 400 15,700
Bituminous Stabilizer 267+00 to 333+00 22,000 397 282+00 518 6,600
Geo Grid 232+00 to 267+00 12,500 367 258+60 506 3,500

15
Table 2.4 Summary of Physical Properties of Selected Subgrade Soils from Route 165 Site
Location of Sample
Number
Max Dry
Density
kN/m3
Max Dry
Density
(lbs/ft3)
Optimum
Water
Content
(%)
Specimen
Dry
Density
kN/m3
Specimen
Dry
Density
(lbs/ft3)
Specimen
Water
Content
(%)
Specimen
Relative
Water
Content
(%)
7 Control 21.1 134.3 5.2 19.8 126.1 5.3 94.0
11a Control 21.1 134.3 3.9 20 127.3 3.6 95.0
11b Control 21.1 134.3 3.9 20 127.3 3.7 95.0
12a CaCl2 21.5 136.9 4.0 20.2 128.6 4.0 94.0
12b CaCl2 21.5 136.9 4.0 20.2 128.6 3.5 94.0
2 Portland Cement 21.6 137.5 3.8 20.4 129.9 4.0 94.0
Bradshaw et al., 2015

16
Table 2.5 Summary of Physical Properties of Selected 1980s RAP Blends from Route 165 Site
Location of Sample
Number
Rap
Content
(%)
Max Dry
Density
kN/m3
Max Dry
Density
(lbs/ft3)
Optimum
Water
Content
(%)
Specimen
Dry
Density
kN/m3
Specimen
Dry
Density
(lbs/ft3)
Specimen
Water
Content
(%)
Specimen
Relative
Water
Content
(%)
11 Control 20 21.3 135.6 4.7 20.6 131.1 3.3 97.0
12 CaCl2 40 21 133.7 4.4 19.9 126.7 4.6 95.0
9 Asphalt Emulsion 26 20.9 133.1 5.4 20 127.3 5.0 96.0
4a Portland Cement 25 21 133.7 3.6 19 121.0 3.5 91.0
4b Portland Cement 25 21 133.7 3.6 20 127.3 3.4 95.0
6 Portland Cement 15 21 133.7 3.7 20.4 129.9 3.5 97.0
8a Geo-Grid 25 21.5 136.9 3.2 20.1 128.0 2.5 93.0
8b Geo-Grid 25 21.5 136.9 3.2 20.6 131.1 3.3 96.0
8c Geo-Grid 25 21.5 136.9 3.2 19.6 124.8 8.5 91.0
8d Geo-Grid 25 21.5 136.9 3.2 20.5 130.5 3.4 95.0
Bradshaw et al., 2015

17
Table 2.6 Summary of Physical Properties of Selected FDR RAP/Virgin Aggregate Blends from Route 165 Site
Location of Sample
Number
Max Dry
Density
kN/m3
Max Dry
Density
(lbs/ft3)
Optimum
Water
Content
(%)
Specimen
Dry
Density
kN/m3
Specimen
Dry
Density
(lbs/ft3)
Specimen
Water
Content
(%)
Specimen
Relative
Water
Content
(%)
7A Control 21.2 135.0 3.9 20.4 129.9 3.6 96.0
7b Control 21.2 135.0 3.9 20.4 129.9 3.6 96.0
1 CaCl2 (24 hours) 21.2 135.0 3.4 20.6 131.1 3.4 (3.3) 97.0
5 Asphalt Emulsion
(5 Days) 20.5 130.5 4.0 19.8 126.1 4 (3.7) 97.0
4a Portland Cement
(4 Hours) 20.7 131.8 3.4 20.0 127.3 3.3 (2.3) 97.0
4b Portland Cement
(7 Days) 20.7 131.8 3.4 20.0 127.3 3.4 (.77) 97.0
Bradshaw et al 2015
Notes: 1. The curing time is given in parenthesis.
2. The water content of the specimen after curing is given in parenthesis.
3. Maximum dry density and specimen dry densitity values have been corrected for oversized
particles and represent field values.

18
19

20

21

22

23

24

25

26
Chapter 3
Performance Prediction of Rehabilitated Asphalt Pavement
with AASHTOWare Pavement ME Design Software
Previously, Rhode Island used the 1993 American Association of State Highway
and Transportation Officials (AASHTO) Guide for Design of Pavement Structures to design
the pavement thickness and subbase layers. The guide used graphs to calculate traffic
equivalency values, freeze-thaw factors, and resilient modulus to find a design structural
number.
The new updated method uses truck traffic, climate data, WMA mixture and subbase
material properties for a mechanistic empirical design (Refer to Appendix A). There are
three hierarchical levels in AASHTOWare Pavement ME Design (MED):
Level 1. Uses laboratory i.e. resilient modulus, HMA mixture properties that is
project specific or a library of test materials results.
Level 2. Input values are estimated for correlations and regression equations
Level 3. Input parameters are estimated or global defaults are used. (AASHTO et
al., 2015)
There are several WMA properties that are needed to be inputted into the Pavement
ME program to perform a Level 1 design. The RIDOT performs fifteen AASHTO and
ASTM testing on its materials and warm mix asphalt as shown in Table 3-1 for all its
construction projects. These tests are the MED inputs that are needed to predict

27
longitudinal cracking, alligator cracking, transverse cracking, rutting or other
permanent deformation, IRI, and reflection cracking over a selected design life.
3.1 Resilient Modulus of Subgrade Soils
As discussed in Chapter 2, subbase and subgrade soil samples were collected during
construction for testing. According to the results of a sieve analysis on the material, the
subbase consisted of gravelly sand or A-1-b AASHTO classification which is consistent
with the material shown for that location in the 1981 Soil Survey of Rhode Island; this soil
was also found under a previous URI study (Lee et al. 2003). The URI study reported
resilient modulus (Mr), which is deviator stress over recoverable strain, values for Rhode
Island subgrade soils ranged from 7,506 psi to 9,304 psi (Lee et al. 2003) and an Idaho
study for comparison shows the same types of gravel material ranged from 8,000 psi to
19,000 psi (Hardcastle et al. 1993).
3.2 Resilient Modulus of Existing Subbase.
Before the Full Depth Reclamation (FDR), four inches of asphalt pavement were
removed from the roadbed for ten test sections located throughout the length of the road.
Approximately twelve inches of existing subbase layer including five inches of previously
recycled material were collected. It should be noted, the collected samples were mix with
seven inches of the existing gravel borrow and the five inches of previously reclaimed
material was not tested separately. Resilient moduli of the ten subbase test sections were

28
determined by using triaxial chamber apparatus according to AASHTO T 307-99 procedure.
Resilient moduli values are presented in Table 3.2.
The laboratory resilient moduli values varied from 17, 000 psi to 74,000 psi.
Subsequent material testing of the ten samples for the percent RAP content using AASHTO
T 308, are shown in Table 2.5. For the 1980 old recycled mixture, the subbase samples
have an asphalt content between fifteen and forty percent with most of the samples having
a pavement content of twenty-five percent.
A grain size distribution, AASHTO T 27, Figure 3.2 sieve analysis shows the
samples as relatively uniform (Bradshaw, et al., 2015). The samples show that the
contractor performed a good job of reclaiming.
3.3 Resilient Modulus of New Full Depth Reclamation (FDR) of New Base/Subbase
In construction, four inches of old asphalt surface and base layers were reclaimed
into four inches of previously reclaimed subbase, and a new eight-inch homogeneous FDR
base/subbase layer was formed. Samples were taken, before the new construction FDR
base/subbase layer were mixed with the three different strategies, to URI for testing. Before
triaxial testing, four samples were mixed with additives in the lab according to RIDOT
specifications for Route 165. Out of the six samples two control FDR samples were tested
without additives, one sample was mixed with CaCl2, one sample was mixed with asphalt

29
emulsion, and two samples were mixed with Portland cement. For the Portland cement
samples, one was cured for 4 hours and the other 7 days before testing.
The resilient moduli of FDR base/subbase layer were determined by using AASHTO
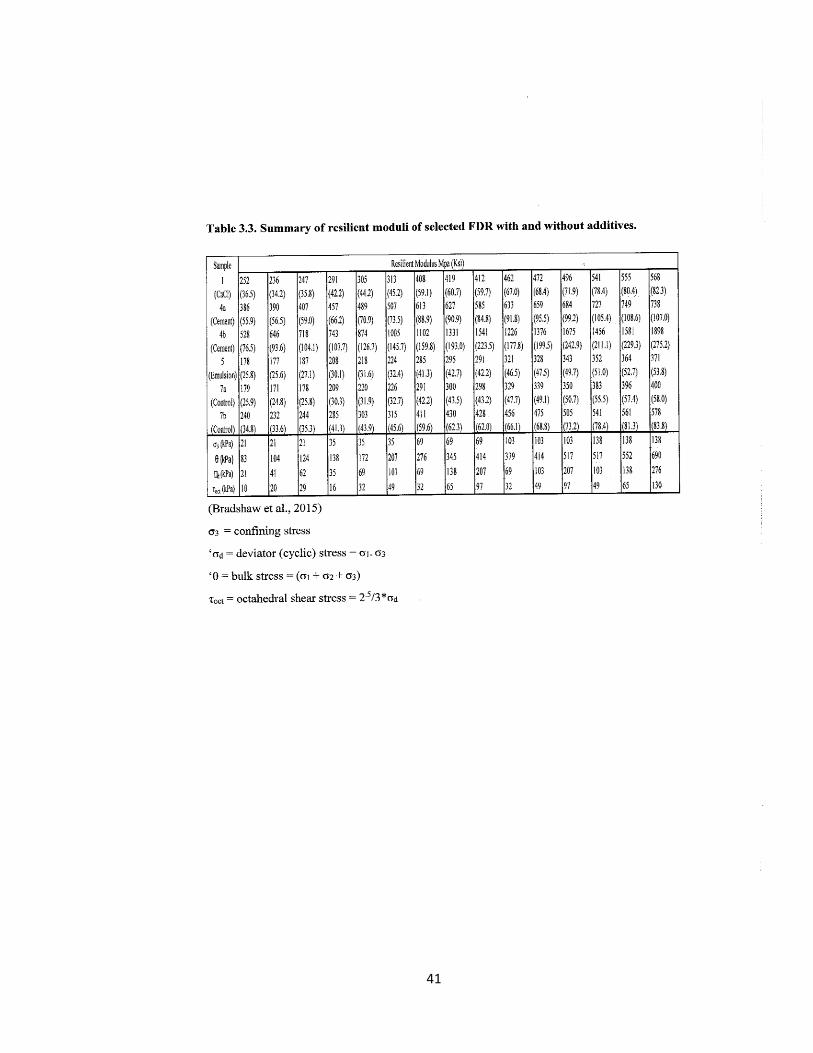
T307-99, and results are shown in Table 3.3 (Bradshaw et al., 2015).
Six samples for the percent asphalt (RAP) content, maximum dry unit weight,
optimum moisture content and Dry unit weight shown in Table 3.4 and a grain size
distribution, Figure 3.3, show the samples as relatively uniform (Bradshaw et al., 2015).
3.4 Determination of Physical Properties of Asphalt Base and Surface Layers
The Route 165 project used two and one half inches of Class 19 WMA for the base
layer and two inches of Class 12.5 WMA for the surface layer. Mechanical properties of
WMA including Dynamic modulus, (EHMA, E*) for the surface and base layers were acquired
from Villanova University and Cardi Corporation’s WMA testing, and are shown in
Appendix B. An example of the physical Properties of Class 19 WMA base layer is shown
in Table 3.5, and are used as input parameters for MED software.
Creep compliance was acquired from a URI study, and used as an input parameter
for the MED software (Lee et al., 2014). The creep compliance results are used according
30
to the MEPDG for new pavement only. Those values are shown in Table 3.6. Creep
compliance is a test for thermal low temperature cracking.
3.5 Traffic Spectrum Obtained from Weigh-in-Motion (WIM) Data
All truck traffic data inputted into the MED software came from a WIM station on
Route 165, and was obtained from RIDOT Research Section. Data included average annual
daily traffic (AADT) which is broken down into vehicle classification, monthly adjustment
factors, hourly adjustment factors, daily vehicle counts and percent trucks in design
direction. The average annual daily truck traffic (AADTT) is calculated for Class 4 to Class
13 vehicles. FHWA Vehicle Classifications according to their class are shown in Figure
3.3. The AADTT from December, 2014 to November, 2015 is 150. The percent trucks in
design direction was calculated at 51/49. Heavy trucks is cumulatively calculated as 295,762
truck vehicles over ten years and 627,848 truck vehicles in the highest design direction.
These values are calculated by calculating the number of trucks per year and adding each
year together for ten or twenty years with a 1.3% increase in truck traffic and multiplying
that number by .51(the design direction).
Monthly traffic counts from December 2014 to November 2015 are broken down
into truck traffic counts and percent vehicles for each class are shown in Table 3.7. Monthly
traffic reports and percent trucks in design direction are shown in Appendix C.

31
3.6 Climate Data
Climate is an important parameter in the MED and has to be downloaded from (hcd)
files from the website www.me-design.com. The download from the website comprises of
climate data for all 50 states of United States from 1997 to 2005. (AASHTO is in the process
of updating their files to current climate data this spring). The closest active weather station
to Route 165 is at TF Green Airport, Warwick. The downloaded climate data includes
monthly temperature, precipitation, sunshine, air temperature, maximum frost and wind
speed. Summaries of the climate data are shown on pages six and seven of the MED output
reports. Shown in Appendix A.
MED uses the climate data for transverse cracks (non-load cracks), enhanced
integrated climate model (EICM) calculates the WMA temperatures on an hourly basis and
MED uses those hourly temperatures to estimate the WMA properties (creep compliance
and indirect tensile strength) to calculate the tensile stress throughout the WMA surface
(AASHTO et al., 2015).
3.7 Prediction of Performance with AASHTOWare Pavement ME Design Software
In the present study, the five test sections were run using the MED. There are six
design parameters needed and have been explained in Sections 3.1 through 3.6.
Resilient Modulus
Lab values from URI

32
HMA properties for Class 12.5 WMA and Class 19 WMA
Creep compliance
Effective binder content
Air voids
Asphalt Dynamic modulus
Asphalt Binder
Traffic
AADTT
Vehicle classification
Percent trucks in Design lane
Climate
Green Airport, Warwick
Projected pavement design life
Estimated
Pavement layer make up
Ground penetrating radar

33
Performance distress prediction outputs will include:
AC bottom-up fatigue cracking (% lane area)
AC top-down fatigue cracking (ACTDFC) (ft/mile)
AC thermal cracking (ft/mile)
Permanent deformation - AC only (in)
Permanent deformation - total pavement (in)
Terminal IRI (in/mile)
Distress or performance indicators terms for asphalt pavements are important to
recognize and accurately identify them in the field.
AC bottom-up fatigue cracking (alligator cracking) is caused by repeated
wheel loads and on pavements has an alligator pattern. They originate from
the bottom of an asphalt layer and travel up to the surface. Bottom up
cracking show up as multiple short, longitudinal or transverse cracks in the
wheel path.
AC top-down fatigue cracking (top down cracking) is also caused by
repeated wheel loads but the cracking is parallel to the pavement centerline.
Longitudinal cracks originate from the top and go down. Raveling and/or
rack deterioration can occur along the edges of these cracks. These cracks
do not look like alligator cracks.

34
AC thermal cracking are non-wheel load cracking due to low temperatures
or thermal cycling.
Permanent deformation - AC only (reflection transverse cracking) is a non-
wheel load cracking induced by reflection from transverse joint or crack in
underlying pavement.
Permanent deformation is a surface depression in the wheel path resulting
from plastic or permanent deformation in each layer. The rut depth is
representative of the maximum vertical difference in elevation between the
transverse profile on the HMA surface and a wire-line across the lane width.
MED also computes the rut depths within the HMA, unbound aggregate
layers and foundation. (AASHTO et al., 2015).
Terminal IRI’s functional adequacy is quantified by pavement smoothness
for both flexible and rigid pavements. Rough roads lead to user discomfort
but higher vehicle costs.
From Table 3.3, shows five confining stresses of 21 kPa, 35kPa, 69 kPa, 103 kPa,
and 138 kPa. Each confining stress has three deviator stresses and three Mr values. The
mean Mr values for the four test sections for the 35 kPa confining stress are used in this
study. The 35 kPA was selected because the 21 kPA appears too low. In the future when
the pavement is measured in the field and downloaded from dTIMS for the five distresses,
a determination can be made for which confining stress is the best fit. The MED can be

35
rerun with a higher confining pressure and the predictions re-evaluated. This method is how
the MED will be calibrated for future projects.
3.7.1 Prediction of Performance for Control Test Section (Cold Recycled)
The control test section on Route 165 was reclaimed to a depth of eight inches and
did not receive any additives. After the FDR, as shown in Figure 2.2, a one inch of old 1980
recycled blend with the old CaCl2 subbase material was assumed left and is represented in
the MED.
Table 3.8 shows the MED output from using the Mr from laboratory testing. There
is one predicted design output failure for AC top-down fatigue cracking (longitudinal
cracking). The target and predicted values are from the MED control URI generated report
page 1. Shown in Appendix A.
3.7.2 Prediction of Performance for the Calcium Chloride Section
The calcium chloride section was full depth recycled and mixed with CaCl2 to a
depth of eight inches on Route 165. After the FDR, as shown in Figure 2.3, a one inch of
old recycled blend with CaCl2 is assumed left and is represented in the MED.

36
Table 3.9 shows the MED output from using the Mr from laboratory tests. There is
one predicted design output failure for AC top-down fatigue cracking (longitudinal
cracking). The target and predicted values are from the MED Calcium chloride URI
generated report page 1. Shown in Appendix A.
3.7.3 Prediction of Performance for Portland Cement Section
The Portland cement section was full depth recycled to a depth of eight inches with
the cement mixed throughout. A one inch of old recycled blend mixed with CaCl2 is
assumed left and is represented in the MED, Figure 2.4.
There were two Portland cement samples tested for this project. Sample 4a was
mixed with Portland cement (PC) and tested after four hours, while sample 4b was mixed
with PC and tested after 7 days. The Portland cement section on Route 165 was micro
cracked after four hours and traffic was allowed on the newly compacted surface. Since
micro cracking prevents the PC to gain any more stiffness, sample 4a is used in this study.
The MED was run with the layer thicknesses and Mr as shown below in Table
3.11. There are no predicted output failures. The target and predicted values are from the
MED Portland Cement URI generated report page 1. Shown in Appendix A.
3.7.4 Prediction of Performance for Asphalt Emulsion Section
The asphalt emulsion section was full depth recycled to a depth of eight inches with
only the first three inches mixed with emulsion as shown in Figure 2.5.

37
The MED was run with the layer thicknesses and Mr as shown below in Table 3.10.
There is one predicted design output failure for AC top-down fatigue cracking (longitudinal
cracking).
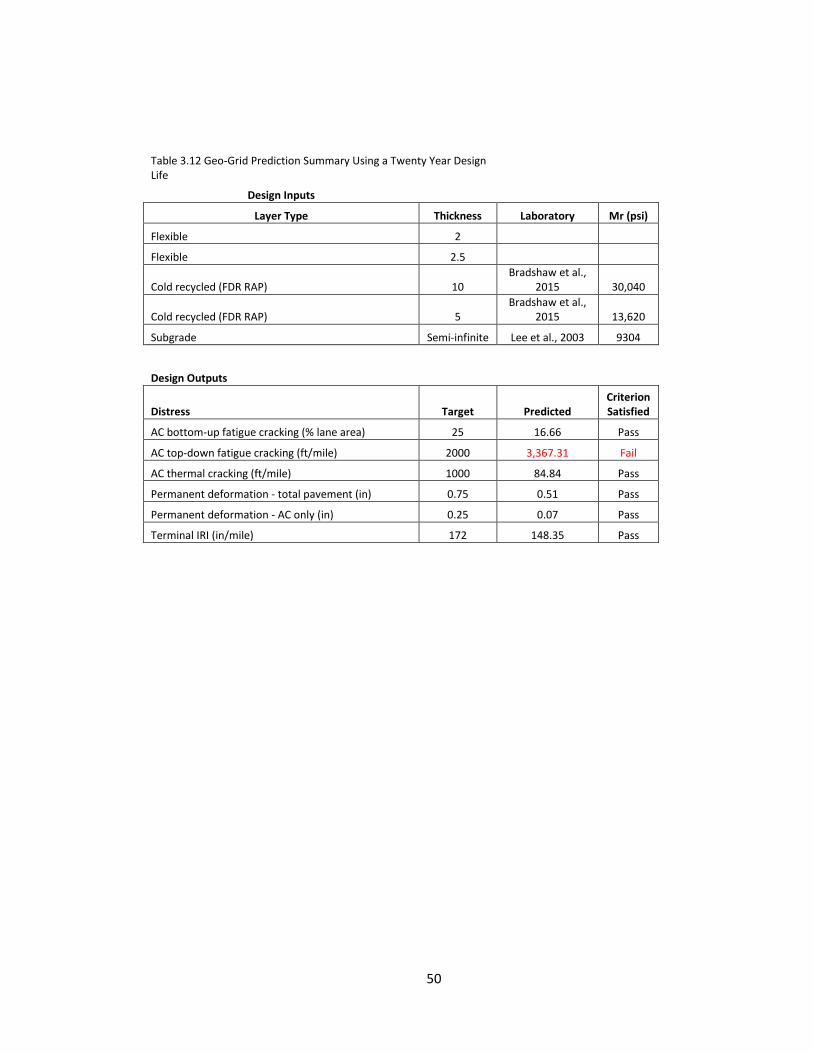
3.7.5 Prediction of Performance for Geo-Grid Section
The Tensar geo-grid section used full depth recycled material to a depth of ten inches
and did not receive any additives. To install the geo-grid, sixteen inches of subbase were
removed from the road after FDR and stockpiled. The geo-grid was installed on top of the
subgrade and six inches of filter stone were placed on the geo-grid. Another geo grid layer
was placed over the filter stone and ten inches of FDR were placed and compacted, Figure
2.6. For this test, the control material for sample 7b Mr mean values for confining stress
of 35 kPa were used from Table 3.3.
The MED was run with the layer thicknesses and Mr as shown below in Table 3.12.
There is one predicted design output failure for AC top-down fatigue cracking (longitudinal
cracking).
3.7.6 Summary
The comparison between the control and the other four test sections are shown below
in Table 3.13. The most prevalent distress, in the four test sections, is in the asphalt layer.
AC top down fatigue cracking (longitudinal cracking) for the control, CaCl2, asphalt

38
emulsion and geo-grid predicted cracking will be greater than the estimated twenty year
target of two thousand feet per mile. The Portland cement section is the only test section
that did not have any predicted distresses for twenty years. The higher the AC top down
cracking, the earlier the threshold distress is noted. The years to predicted threshold distress
comes from the third table on page thirteen of each of the test sections MED reports. Shown
in Appendix A.
Having AC top down fatigue cracking (longitudinal cracking) means the pavement
layer of four and half inches in not thick enough for the actual truck traffic loading. Either
the Class 12.5 WMA or the Class 19 WMA layer should have been thicker. Since the cost
of the Class 19 WMA was thirty dollars less than the Class 12.5 WMA, using the Class
19WMA will save on cost.
The test sections in order of best performance are: Portland cement, CaCl2, control,
geo-grid and asphalt emulsion with the smallest amount of cracking and highest predicted
threshold distresses in years. All the test sections predict that there will not be any
permanent deformation in the subbase or AC layer, or AC bottom up fatigue cracking
(alligator cracking). The higher resilient moduli, the better the results for less distresses.

39
Table 3. 1 Material Testing for Route 165
Laboratory Unbound Materials
AASHTO T 88 Particle Size Analysis of Soils URI
T 265
Laboratory Determination of Moisture Content of
Soils URI
T 307
Determining of Resilient modulus of Soils and
Aggregate Materials URI
ASTM D2487 Classification of Soils for Engineering Purposes URI
Asphalt Binder
AASHTO T 315
Determining the Rheological Properties of Asphalt
Binder Using a Dynamic Shear Rheometer (DSR)
RIDOT Materials
Section
T 316
Determination of Asphalt Binder Using Rotational
Viscometer
RIDOT Materials
Section
Hot Mix Asphalt
AASHTO T 27 Sieve Analysis of Fine and Course Aggregates
RIDOT Materials
Section
T 84 Specific Gravity and Absorption of Fine Aggregates
RIDOT Materials
Section
T 85
Specific Gravity and Absorption of Course
Aggregates
RIDOT Materials
Section
T 166
Bulk Specific Gravity of Compacted Hot Mix Asphalt
(HMA) Using Saturated Surface Dry
RIDOT Materials
Section
T 209
Theoretical Maximum Specific Gravity (GMM) and
Density of Hot Mix Asphalt Paving Mixtures
RIDOT Materials
Section
T 308
Determining the Asphalt Binder Content of Hot Mix
Asphalt (HMA) by the Ignition Method RIDOT Materials Section
T 312 Preparing and Determining the Density of Asphalt
Mixture Specimens by Means of the Superpave
Gyratory Compactor RIDOT Materials Section
T 342 Determining Dynamic Modulus of Hot Mix Asphalt RIDOT Materials Section
In Situ Deflection Measurements (FWD)
Material Specification
M 320 Performance-Graded Asphalt Binder Villanova University
M 323 Superpave Volumetric Mix Design Villanova University
Standard Practices and Terminology
R 37
Application of Ground Penetrating Road Radar (GPR)
to Highways RIDOT Material Section
R 43 Quantifying Roughness of Pavement Vendor

40
41

42

43

44

45

46
Table 3.8 Control Section (Cold Recycled) Distress Prediction Summary Using a Twenty Year Design Life
Design Inputs
Layer Type Thickness Laboratory Mr (psi)
Flexible 2
Flexible 2.5
Cold recycled (FDR RAP) 8 Bradshaw et al.,
2015 37,655
Non-stabilized (1980 Virgin RAP) 1 Bradshaw et al.,
2015 30,650
Non-stabilized (Ex. gravel borrow) 8 Lee et al., 2003 13,620
Subgrade Semi-infinite Lee et al., 2003 9304
Design Outputs
Distress Target Predicted Criterion Satisfied
AC bottom-up fatigue cracking (% lane area) 25.00 8.28 Pass
AC top-down fatigue cracking (ft/mile) 2,000.00 2,800.40 Fail
AC thermal cracking (ft/mile) 1,000.00 84.34 Pass
Permanent deformation - total pavement (in) 0.75 0.52 Pass
AC only permanent deformation (in) 0.25 0.07 Pass
Terminal IRI (in/mile) 172.00 147.61 Pass

47
Table 3.9 Calcium chloride (CaCl2) Section Prediction Summary Using a Twenty Year Design Life
Design Inputs
Layer Type Thickness Laboratory Mr (psi)
Flexible 2.00
Flexible 2.50
Cold recycled (FDR RAP) 8.00 Bradshaw et al., 2015 43,890
Non-stabilized (1980 Virgin RAP) 1.00 Bradshaw et al., 2015 31,510
Non-stabilized (Ex. gravel borrow) 8.00 Lee et al., 2003 13,620
Subgrade Semi-infinite Lee et al., 2003 9,304
Design Outputs
Distress Target Predicted Criterion Satisfied
AC bottom-up fatigue cracking (% lane area) 25.00 5.63 Pass
AC top-down fatigue cracking (ft/mile) 2,000.00 2,585.29 Fail
AC thermal cracking (ft/mile) 1,000.00 84.84 Pass
Permanent deformation - total pavement (in) 0.75 0.51 Pass
Permanent deformation - AC only (in) 0.25 0.07 Pass
Terminal IRI (in/mile) 172.00 147.20 Pass

48
Table 3.10 Portland Cement Section Distress Prediction Summary using a Twenty Year Design Life
Design Inputs
Layer Type Thickness Laboratory Mr (psi)
Flexible 2.00
Flexible 2.50
Cold recycled (FDR RAP) 8.00 Bradshaw et a l ., 2015 70,240.00
Non-stabi l i zed (1980 Virgin RAP) 1.00 Bradshaw et a l ., 2015 27,170.00
Non-stabi l i zed (Ex. gravel borrow) 8.00 Lee et a l ., 2003 13,620.00
Subgrade Semi-infini te Lee et a l ., 2003 9,304.00
Design outputs
Distress Target Predicted
Criterion
Satisfied
AC bottom-up fatigue cracking (% lane area) 25.00 2.19 Pass
AC top-down fatigue cracking (ft/mi le) 2,000.00 1,782.67 Pass
AC thermal cracking (ft/mi le) 1,000.00 84.84 Pass
Permanent deformation - tota l pavement (in) 0.75 0.49 Pass
Permanent deformation - AC only (in) 0.25 0.07 Pass
Terminal IRI (in/mi le) 172.00 145.42 Pass

49
Table 3.11 Asphalt Emuls ion Prediction Summary Us ing a Twenty Year Des ign Li fe
Design Inputs
Layer Type Thickness Laboratory Mr (psi)
Flexible 2
Flexible 2.5
Cold recycled (FDR RAP) 3 Bradshaw et a l ., 2015 31,420
Cold recycled (FDR RAP) 5 Bradshaw et a l ., 2015 26,440
Non-stabi l i zed (Ex. gravel borrow) 8 Lee et a l ., 2003 13,620
Subgrade Semi-infini te Lee et a l ., 2003 9304
Design Outputs
Distress Target Predicted
Criterion
Satisfied
AC bottom-up fatigue cracking (% lane area) 25 17.38 Pass
AC top-down fatigue cracking (ft/mi le) 2000 3502.66 Fai l
AC thermal cracking (ft/mi le) 1000 84.84 Pass
Permanent deformation - tota l pavement (in) 0.75 0.54 Pass
Permanent deformation - AC only (in) 0.25 0.07 Pass
Terminal IRI (in/mi le) 172 149.55 Pass
50
Table 3.12 Geo-Grid Prediction Summary Using a Twenty Year Design Life
Design Inputs
Layer Type Thickness Laboratory Mr (psi)
Flexible 2
Flexible 2.5
Cold recycled (FDR RAP) 10 Bradshaw et al.,
2015 30,040
Cold recycled (FDR RAP) 5 Bradshaw et al.,
2015 13,620
Subgrade Semi-infinite Lee et al., 2003 9304
Design Outputs
Distress Target Predicted Criterion Satisfied
AC bottom-up fatigue cracking (% lane area) 25 16.66 Pass
AC top-down fatigue cracking (ft/mile) 2000 3,367.31 Fail
AC thermal cracking (ft/mile) 1000 84.84 Pass
Permanent deformation - total pavement (in) 0.75 0.51 Pass
Permanent deformation - AC only (in) 0.25 0.07 Pass
Terminal IRI (in/mile) 172 148.35 Pass

51
Table 3.13 Comparison of Performance Predictions
Design Outputs Control CaCl2
Asphalt
Emulsion
Portland
Cement Geo-Grid
Distress Target Predicted Predicted Predicted Predicted Predicted
AC bottom-up fatigue cracking (% lane area) 25.00 8.28 5.63 17.38 2.85 16.66
AC top-down fatigue cracking (ACTDFC) (ft/mile) 2,000.00 2,800.40 2,585.29 3,502.66 1,782.67 3,367.31
AC thermal cracking (ft/mile) 1,000.00 84.34 84.34 84.84 84.34 84.34
Permanent deformation - AC only (in) 0.25 0.07 0.07 0.07 0.07 0.07
Permanent deformation - total pavement (in) 0.75 0.52 0.51 0.54 0.49 0.51
Terminal IRI (in/mile) 172.00 147.61 147.20 149.55 145.42 148.35
Years to predicted threshold distress ACTDFC (Years) 8 10 4.0 25 5

52

53

54

55
Chapter 4
Evaluation of Performance of Rehabilitated Asphalt Pavement
4.1 Surface Distresses and Field Condition Survey
On December 21, 2015, pavement windshield surveys were conducted on
Route 165 by both URI Graduate students and Professor K. Wayne Lee and the results of
these surveys are shown in Appendix D. Five pavement sections (10 feet wide x 100 feet
in length) were selected near utility poles, previous FWD testing sites, and permanent land
markers, for ease of identification.
The pavement sections did not show any low, moderate or severe pavement
distresses such as rutting or cracking but there were signs of minor raveling of the pavement.
No major defects were expected since the pavement was recently placed in the summer of
2014. As a result, these December field surveys would become the base line for continuous
monitoring of this road by URI students.
In addition to conducting the windshield surveys, the Rhode Island Department of
Transportation has on-going contracts with vendors whose responsibilities include
measuring the IRI, rutting and cracking using vehicles equipped with computers, cameras,
and lasers. Information is down-loaded into a Deighton’s Total Infrastructure Management
System (dTIMS) management database in the form of photographs, pavement defect data,
and locations. DTIMS functions include three types of scoring: (1) a cross tab
transformation to rate distresses and severity levels; (2) expression and formula
transformations to place a deduct value from sample areas and calculate a pavement
condition index (PCI), respectively; and structured table outputs with column and rows.

56
(Lecture – Pavement Management System at RIDOT, 10/15/15). A copy of the Distress
report is also in Appendix D. Below is an accounting of the distress found:
4.1.1 Permanent Deformation and Rutting
No deformation or rutting to report.
4.1.2 Fatigue Cracking
No fatigue cracking to report.
4.1.3 Thermal Cracking
No thermal cracking to report.
4.2 Serviceability and Roughness
4.2.1 International Roughness Index
MED predicts terminal International Roughness Index (IRI) or smoothness in inches
per mile. Using parameters which are input into the program, the target, predicted, and
reliability models are calculated and are shown on page one of the MED reports. The
targeted value of 172 inch/miles is considered the upper limit found acceptable by
AASHTOWare, IRI values under 95 inch/mile are ranked as acceptable. Table 4.1 shows
both the results of the individual test pavement reports from MED and the final IRI which
were done by the RIDOT Material Section for bonus/penalty performance. Page 12 of each
of the MED reports (Refer to Appendix A) show that the starting IRI is between 70 and 95

57
inch/mile. The contractor’s final IRI, shown in Appendix E, came in as low as 58 inch/mile
to 88 inch/mile for the west bound lane, as available. All of the test sections passed and the
MED predicts the IRI will not reach the upper 172 inch/mile limit for approximately twenty
years. The contactor received a bonus for his IRI results.
Currently, RIDOT performs regular IRI tests on its roadways to monitor pavement
performance over time. Based on pavement performance and distress type, Page 12 of the
MED Analysis Output Charts show the IRI values increasing over time. Thus, based on
these distresses and calculated MED IRI, it seems feasible that RIDOT would be able to
compare their field generated values to the predicted charts in order to track performance of
the MED.
4.3 Structural Capacity and Deflection
In an effort to predict roadway deflection, the RIDOT recently utilized its recently
refurbished Kuab Falling Weight Deflectometer (FWD) on Route 165 which, incidentally,
was one of the first roads it was used on. FWD results can be used to determine in situ
resilient moduli of both the subgrade and subbase by back and forward calculations. RIDOT
has been using FWD on their roads for years but, unfortunately, was neither able to
internally interpret the results nor perform back calculations successfully. Until now, an
unexpected discovery was made on interpreting the FWD deflections through the Long
Term Pavement Performance Hogg Method (Refer to Appendix F).

58
The results of the resilient moduli from both Figures 3.3 and the Hogg Method
shown in Table 4.2 show promise but warrant further evaluation. It is assumed that the
better Mr values from the Hogg Method are due to the calibrated sensors and computer
upgrades.
The Hogg Method uses a Long Term Pavement Performance (LTPP) Excel
spreadsheet to calculate moduli which can then be used to predict pavement performance.
Deflection data, corresponding back-calculated moduli, or other deflection-based
parameters strongly relate to pavement performance, and the premise of mechanistic-
empirical design methods is to control stresses and strains as a response to traffic.” (LTPP,
2006). The Hogg Method is based on the work of J. Boussinesq, 1885, whose equations
estimate vertical soil stresses:
θz= Q(3z3)/2π (R2 +z2)5/2 1
Q = point load
z = depth from ground surface to the place where θ z is desired
R = horizontal distance from point load to the place where θ z is desired.
There are cautions, however, with the use of the Hogg Method which state that the
forward-calculated modulus data is not intended to replace back-calculated or any other
form of modulus of elasticity measurements. The question becomes how realistic are the
estimates for pavement evaluation and/or design? There are four approaches to evaluate

59
and determine in situ stiffness, and distresses (LTPP, 2006) and they are (1) the triaxial tests,
(2) AASHTOPavement ME design, (3) dTIMS and the (4) Hogg Method. The dTIMS
results can be compared to the predictions of the MED which in turn can be used back
calculate the Mr. The Mr values can then be verified by laboratory testing and the Hogg
Method. Any previously reclaimed roadway which had been reclaimed can be de-
constructed, if you will, to verify all parameters.
4.4 Analysis of Ground Penetrating Radar (GPR)
Ground penetrating Radar (GPR) was performed on Route 165 in June, 2015
after the final surface course was placed. The original, existing pavement thickness for each
test section varied from 4.13 inches to 4.55 inches. The average core thickness for the Class
12.5 WMA pavement was 2.29 inches and the average pavement thickness for the 19mm
pavement was 2.81 inches. The GPR was used to confirm that the roadway was being
constructed according to RIDOT specifications. In areas where the pavement thickness
varied between 4.13 and 4.21 inches, the west-bound geo-grid test, Portland cement, and
recycled sections need to be monitored for possible premature cracking because of the
relatively small pavement thickness. (Pavement thickness is an input parameter within both
the Hogg Method and MED). (Refer to Appendix G)

60
4.5 Comparative Analysis between Performance Prediction and Evaluation
After the MED reports for the five test sections were run, the MED output
showed AC top down fatigue cracking (longitudinal cracking) as the only output distress
in four of the five test sections (Table 4.3). The predicted distress was over the target or
threshold value. The target value represents the amount of distress that would trigger some
type of major rehabilitation activity (AASHTO, 2015). According to the MED report, using
the asphalt emulsion and Portland cement test sections, for example, it would take five years
to reach the two thousand feet per mile for AC top down cracking for the asphalt emulsion
but twenty years for Portland cement. AC top down cracking is due to the pavement layer
being too thin and a low Mr. In the test sections as shown in Table 4.4 to Table 4.7, extra
pavement thickness, cost analysis, and years to failure, MED inputs were re-run to see what
would cause the predicted AC top down cracking to go below the two thousand target
threshold.
Thus, based on the aforementioned, we know that it will take a number of years
before the threshold distress can be predicted for the five test sections i.e control, CaCl2,
asphalt emulsion, Portland cement, and geo-grid. We do know that year number eight is the
“unofficial” time where pavements start showing distress and will most likely need to
receive some form of maintenance treatment e.g crack sealing; chip seal. That said, the
asphalt emulsion and geo-grid test sections are predicted to need treatment in four and five
years in this study, with predicted AC top down cracking of 3,502 ft/mile and 3,367 ft/mile.

61
It was surprising to see how high the AC top down fatigue cracking number in the asphalt
emulsion test section because the material has been successfully used as an FDR additive in
many states.
4.5.1 Control Test Section
According to Table 4.4, the control section was predicted to reach a threshold
distress in AC top down cracking in eight years. If the pavement thickness had been
increased by one inch, all of the predicted values would have been below the target
thresholds for twenty years. The down side to this would have been the approximately
$526,000 in additional costs for 8,552 tons of asphalt pavement. The yearly cost for eight
years is $332,676 and $159,368 for twenty years. The total cost with the extra asphalt
pavement, the control test section ranks two out of five.
4.5.2 Calcium Chloride Section
The CaCl2 section is predicted to reach a threshold of 2,585 linear feet of AC
top down fatigue cracking (longitudinal cracking) in ten years see Table 4.5. If the pavement
thickness had been increased by one inch, all of the predicted values would have been below
the target thresholds for twenty years. The down side to this would have been the
approximately $526,000 in additional costs for 8,552 tons of asphalt pavement. The yearly

62
cost for ten years is $364,715 and $208,655 for twenty years. The total cost with the extra
pavement, the calcium chloride section ranks four out of five.
4.5.3 Portland Cement Section
In Table 4.6, the Portland cement section, which had the highest Mr of any
of the other sections, should not show any distress until roughly year thirty and it is in the
terminal IRI (in/mile). In spite of this, the cement was not allowed to fully cure for seven
days and thus micro-cracked after four hours. From Table 3.5, the Mr would have been
126,000 psi (mean of the Mr for the 35 kPa confining stress) if traffic had not been allowed
on the travel lane. Both the width of the road and the traffic volumes prevented one lane
from being closed for the seven days since a detour was not feasible. The cost for twenty-
five years would be $158,206. The total cost with the extra pavement, the Portland cement
section ranks first out of five.
4.5.4 Asphalt Emulsion Section
According to Table 4.7, the asphalt emulsion section was predicted to reach a threshold
distress in AC top down cracking in four years. If the pavement thickness had been increased
by one and a half inch, all of the predicted values would have been below the target
thresholds. The down side to this would be the increased cost of 12,828 tons of asphalt
needed to reach the additional thickness. The $788,000 is a high price to pay for fifteen
additional service years. But the cost for four years would be $742,351 and $187,916 for
twenty years. The total cost with the extra pavement, the calcium chloride section ranks three
out of five.

63
4.5.5 Geogrid Section
According to Table 4.8, the geo-grid section was predicted to reach a threshold
distress in AC top down cracking in five years. If the pavement thickness had been increased
by one and a half inch, all of the predicted values would be below the target thresholds and
the pavement would not see any predicted cracking for twenty years. The down side would
be the increased cost of $788,000.00 for 12,828 tons of asphalt pavement. The up side,
however, would be an increase in fifteen additional service years. The yearly cost for ten
years is $1,326,543 and $357,933 for twenty years. The total cost with the extra pavement,
the geo-grid section ranks five out of five.
4.6 Selection of Best Alternatives Based on Short-Term Evaluation
4.6.1 Forecasting Future Performance through Tie-ins with Pavement Structural
Health Index (PSHI)
MED can fit within the states’ preservation system by using performance indicators
that dTIMS does not. For instance, dTIMS catalogues IRI, rutting, cracking and
deformation through yearly field surveys, while MED uses AADTT, resilient modulus,
pavement layer make-up, HMA properties, and climate to predict the same pavement
distresses over time. DTIMS surveys the surface course and MED predicts the subsurface
conditions. Thus, MED predictions can be adjusted accordingly.

64
4.6.2 Optimal Strategies for Rehabilitation
One finding of the MED, is determining the right combination of subbase Mr to
pavement thickness. MED makes it very easy to run multiple models for worst and best
case scenarios. Resurfacings and reclamations should have Mr values checked before
construction to find if an additive would benefit the subbase stiffness. Monitoring pavement
PSHI can catch a road before it deteriorates too far, but the subbase Mr should be evaluated
before treatment is determined. For example, too many times RIDOT has milled two inches
and put back two inches of pavement on a road only to have the pavement break up in a
short amount of time. The MED reported output shows how longitudinal cracking can be a
sign of too thin of a pavement thickness.
4.7 Guidelines for Long-Term Evaluation and Optimal Rehabilitation Design Strategies
A material database consisting of resilient moduli, pavement core data and
sieve analysis needs to be created for easy reference for Design Engineers. The RIDOT has
years of collected data but unfortunately no “on-line” database. URI, on the other hand,
has already done extensive resilient moduli testing with seasonal variations on subbase and
subgrade materials and needs to incorporate these results into the state’s database. The
results of the testing should be included in one main database along with any new testing
done. (Lee et al., 2001)
LTPP currently has a Microsoft Excel Program that uses falling weight
deflectometer (FWD) deflections to predict resilient moduli of the asphalt layers, subbase
and subgrade materials. The program, however, requires pavement and subbase thicknesses

65
as input parameters which a GPR can provide. FWD testing is already being performed on
state highways and this information should be appropriately documented and compiled into
a database.
The Materials Sections has equipment that performs tests that the Design
Engineer needs to incorporate into their designs. A list of capabilities of this equipment
should be shared.
RIDOT’s Pavement Committee, currently made up of personnel from the Materials,
Design, and Construction Sections, oversees all pavement designs on both reconstruction
and resurfacing projects. Usually the only information available/discussed during the
meetings include sieve analysis data, pavement cores, and traffic AADT. It is a mistake not
to have subbase Mr and MED reports at that meeting.

66
Table 4.1 Comparison of Performance Predictions for IRI
Design Outputs Control CaCl2
Asphalt
Emulsion
Portland
Cement Geo-grid
Distress Target Predicted Predicted Predicted Predicted Predicted
Terminal IRI (in/mile) 172.00 144.78 143.93 145.39 142.65 144.00
Average Final rideability Results Rte 165 - WB (in/mi)
Left/right lane. Initial IRI = 63 58.4/46.9 44/40.43 65.8/88.9 64.3/52.9 63.7/56.7
Values from the RIDOT Material Section

67
Table 4. 2 Comparison Between subbase URI Lab Results vs Hogg Method FWD Results
Material
Type Sample
Lab results* Range in psi
Confining Stress 21 kPa to
138 kPa Average lab Results psi Hogg Model Range in psi
Average Hogg
Method Mr - psi
Cold
Recycled 7a 25,961 - 58,015 41,988 33,961-62,284 51,942
Cold
Recycled 7b 34,809 - 83,831 59,320 33,961-62,284 51,942
CaCl 1 36,549 - 82,381 59,465 47,749-62,608 53,598
Cement 4
hour 4a 55,984 - 107,037 81,510 40,940-58,273 50,486
Cement 7
day 4b 76,579 - 275,281 175,930 40,940-58,273 50,486
Asphalt
Emulsion 5 25,816 -53,808 39,812 36,596-47,076 41,959
Geo-Grid Not Tested 23,164 - 40,997 34,414
* Bradshaw, Costa, Giampa, Genovesi, and Hernberg, 2015

68
Table 4.3 Comparison of Years to Predicted Threshold Distress
Design Outputs Control CaCl2
Asphalt
Emulsion
Portland
Cement Geo-Grid
Distress Target Predicted Predicted Predicted Predicted Predicted
AC bottom-up fatigue cracking (% lane area) 25.00 8.28 5.63 17.38 2.85 16.66
AC top-down fatigue cracking (ACTDFC) (ft/mile) 2,000.00 2,800.40 2,585.29 3,502.66 1,782.67 3,367.31
AC thermal cracking (ft/mile) 1,000.00 84.34 84.34 84.84 84.34 84.34
Permanent deformation - AC only (in) 0.25 0.07 0.07 0.07 0.07 0.07
Permanent deformation - total pavement (in) 0.75 0.52 0.51 0.54 0.49 0.51
Terminal IRI (in/mile) 172.00 147.61 147.20 149.55 145.42 148.35
Years to predicted threshold distress ACTDFC (Years) 8 10 4 25 5

69
Table 4.4 Control Section (Cold Recycled) - Pavement Performance
Design Outputs 2.5" Class 19 WMA
Base
Additional 1" of Class 19 WMA Base
(3.5")
Distress Target Predicted Predicted
AC bottom-up fatigue cracking (% lane area) 25.00 8.28 2.01
AC top-down fatigue cracking (ft/mile) 2,000.00 2,800.40 1,840.61
AC thermal cracking (ft/mile) 1,000.00 84.34 84.34
Permanent deformation - total pavement (in) 0.75 0.52 0.47
AC only permanent deformation (in) 0.25 0.07 0.07
Terminal IRI (in/mile) 172.00 147.61 144.71
1" Additional tons of asphalt for 7 miles 0 4,276.00
Class 19 WMA @ $61.50/ton cost 0 $262,974.00
Years to predicted threshold distress ACTDFC (Years) 8 20
Additional years of Service 0 12
Cost Analysis per Year for the Control Section (Cold Recycled) (2.5")
Unit cost Item Quantity Amount
$92.50 2" Class 12 WMA * 21,380 Ton $1,238,303
$61.50 2.5" Class 19 WMA 20,135 Ton $1,238,303
$1.50 8" Subbase 123,200 SY $184,800
Total $2,661,405
8 year Life cycle cost / year $332,676
Cost Analysis per Year for the Control Section (Cold Recycled) (3.5")
Unit cost Pavement Thickness Item Quantity Unit Amount
$92.50 2" Class 12 WMA * 20,135 Ton $1,238,303
$61.50 3.5" Class 19 WMA 28,687 Ton $1,764,251
$1.50 8" Subbase 123,200 SY $184,800
Total $3,187,353
20 year Life cycle cost /year $159,368
* WMA quantity had extra tons for berm and paved waterways.

70
Figure 4.5 Calcium Chloride Pavement Performance
Design Outputs 2.5" Class 19 WMA Base
Additional 1" of Class 19 WMA
Base (3.5")
Distress Target Predicted Predicted
AC bottom-up fatigue cracking (% lane area) 25.00 5.63 1.94
AC top-down fatigue cracking (ft/mile) 2,000.00 2,585.29 1,635.07
AC thermal cracking (ft/mile) 1,000.00 84.84 84.84
Permanent deformation - total pavement (in) 0.75 0.51 0.47
Permanent deformation - AC only (in) 0.25 0.07 0.07
Terminal IRI (in/mile) 172.00 147.20 144.47
Years to predicted threshold distress ACTDFC (years) 10.00 20.00
1 " Additional tons of asphalt for 7 miles 0.00 8,552.00
Class 19 WMA @ $61.50/ton 0 $525,948.00
Additional years of service 0 10
Cost Analysis per Year for Calcium Chloride (2.5") Unit cost Pavement Thickness Item Quantity Unit Amount
$92.50 2" Class 12 WMA * 21,380 Ton $1,977,650.00
$61.50 2.5" Class 19 WMA 20,135 Ton $1,238,302.50
$3.50 8" Subbase 123,200 SY $431,200.00
Total $3,647,152.50
10 year Life cycle cost / Year $364,715.25
Cost Analysis per Year for Calcium Chloride (3.5") Unit cost Pavement Thickness Item Quantity Unit Amount
$92.50 2" Class 12 WMA * 21,380 Ton $1,977,650.00
$61.50 3.5" Class 19 WMA 28,687 Ton $1,764,250.50
$3.50 8" Subbase 123,200 SY $431,200.00
Total $4,173,100.50
20 year Life Cycle Cost /Year $208,655.03
* WMA quantity had extra tons for berm and paved waterways.

71
Figure 4.6 Portland Cement Pavement Performance for 25 years
Design Outputs 2.5" Class 19
WMA Base
Distress Target Predicted
AC bottom-up fatigue cracking (% lane area) 25.00 2.80
AC top-down fatigue cracking (ft/mile) 2,000.00 1,990.66
AC thermal cracking (ft/mile) 1,000.00 84.84
Permanent deformation - total pavement (in) 0.75 0.51
Permanent deformation - AC only (in) 0.25 0.08
Terminal IRI (in/mile) 172.00 160.78
Years to predicted threshold distress ACTDFC (years) 25.00
Additional tons of asphalt 0.00
Additional cost per ton $61.50 0
Additional years of service past 20 years 5
Cost Analys is per Year for the Portland Cement (2.5")Cost Analys is per Year for the Portland Cement (2.5")
Unit cost Pavement Thickness Item Quantity Unit Amount
$92.50 2" Class 12 WMA * 21,380 Ton $1,977,650.00
$61.50 2.5" Class 19 WMA 20,135 Ton $1,238,302.50
$6.00 8" Subbase 123,200 SY $739,200.00
Total $3,955,152.50
25 year Life cycle cost / Year $158,206.10
* WMA quanti ty had extra tons for berm and paved waterways .

72
Table 4.7 Asphalt Emulsion Pavement Performance
Design Outputs 2.5" Class 19 WMA Base
Additional 1.5" of Class
19 WMA Base (4")
Distress Target Predicted Predicted
AC bottom-up fatigue cracking (% lane area) 25.00 17.38 1.95
AC top-down fatigue cracking (ft/mile) 2,000.00 3502.66 1,744.64
AC thermal cracking (ft/mile) 1,000.00 84.84 84.84
Permanent deformation - total pavement (in) 0.75 0.54 0.46
Permanent deformation - AC only (in) 0.25 0.07 0.07
Terminal IRI (in/mile) 172.00 149.55 144.38
Years to predicted threshold distress ACTDFC (years) 4.00 20.00
1.5 " Additional tons of asphalt for 7 miles 0.00 12,828.00
Class 19 WMA @ $61.50/ton cost 0 $788,922.00
Additional years of service 0 16
Cost Analysis per Year for the Asphalt Emulsion (2.5")
Unit cost Pavement Thickness Item Quantity Unit Amount
$92.50 2" Class 12 WMA * 21,380 Ton $1,238,302.50
$61.50 2.5" Class 19 WMA 20,135 Ton $1,238,302.50
$4.00 8" Subbase 123,200 SY $492,800.00
Total $2,969,405.00
4 year Life cycle cost / Year $742,351.25
Cost Analysis per Year for the Asphalt Emulsion (4")
Unit cost Pavement Thickness Item Quantity Unit Amount
$92.50 2" Class 12 WMA * 21,380 Ton $1,238,302.50
$61.50 4" Class 19 WMA 32,963 Ton $2,027,224.50
$4.00 8" Subbase 123,200 SY $492,800.00
Total $3,758,327.00
20 year Life Cycle Cost /Year $187,916.35
* WMA quantity had extra tons for berm and paved waterways.

73
Cost Analysis per Year for the Geo-Grid Section (2.5") Unit cost Pavement Thickness Item Quantity Unit Amount
$92.50 2" Class 12 WMA * 21,380 Ton $1,238,302.50
$61.50 2.5" Class 19 WMA 20,135 Ton $1,238,302.50
$1.50 10" Cold recycled (FDR RAP) 32,963 SY $49,444.50
$15.00 Geo-grid Layer 246,400 SY $3,696,000.00
$20.00 6" Filter stone 20,533 CY $410,666.67
Total $6,632,716.17
5 year Life Cycle Cost / Year $1,326,543.23
Cost Analysis per Year for the Geo-Grid Section (4") Unit cost Pavement Thickness Item Quantity Unit Amount
$92.50 2" Class 12 WMA * 21,380 Ton $1,238,302.50
$61.50 4" Class 19 WMA 28,687 Ton $1,764,250.50
$1.50 10" Cold recycled (FDR RAP) 32,963 SY $49,444.50
$15.00 Geo-grid Layer 246,400 SY $3,696,000.00
$20.00 6" Filter Stone 20,533 CY $410,666.67
Total $7,158,664.17
20 year Life Cycle Cost /Year $357,933.21
* WMA quantity had extra tons for berm and paved waterways.
Table 4.8 Geo-Grid Pavement Performance for 20 years
Design Outputs 2.5" Class 19
WMA Base
Additional 1.5" of Class
19 WMA Base (4")
Distress Target Predicted Predicted
AC bottom-up fatigue cracking (% lane area) 25.00 16.66 1.94
AC top-down fatigue cracking (ft/mile) 2,000.00 3,367.31 1,734.15
AC thermal cracking (ft/mile) 1,000.00 84.84 84.34
Permanent deformation - total pavement (in) 0.75 0.51 0.45
Permanent deformation - AC only (in) 0.25 0.07 0.07
Terminal IRI (in/mile) 172.00 148.35 143.69
Years to predicted threshold distress ACTDFC (years) 5.00 20.00
1.5 " Additional tons of asphalt 7 miles 0.00 12,828.00
Class 19 WMA @ $61.50/ton cost 0 $788,922.00
Additional years of service 0 15

74
Table 4.9 Comparison of Years of Predicted Threshold Distress and Cost
Des ign Outputs Control CaCl2
Asphalt
Emuls ion
Portland
Cement Geo-Grid
Distress Target Predicted Predicted Predicted Predicted Predicted
Class 19 WMA as built 2.5" 2.5" 2.5" 2.5" 2.5"
AC bottom-up fatigue cracking (% lane area) 25.00 8.28 5.63 17.38 2.85 16.66
AC top-down fatigue cracking (ACTDFC) (ft/mi le) 2,000.00 2,800.40 2,585.29 3,502.66 1,782.67 3,367.31
AC thermal cracking (ft/mi le) 1,000.00 84.34 84.34 84.84 84.34 84.34
Permanent deformation - AC only (in) 0.25 0.07 0.07 0.07 0.07 0.07
Permanent deformation - tota l pavement (in) 0.75 0.52 0.51 0.54 0.49 0.51
Terminal IRI (in/mi le) 172.00 147.61 147.20 149.55 145.42 148.35
Years to predicted threshold dis tress ACTDFC (Years ) 8 10 4 25 5
Cost of pavement s tructure (Class 12.5, Class 19, subbase) $2,661,405 $3,647,153 $2,969,405 $3,955,153 $6,632,716
Cost of pavement s tructure/ACTDFC per year for 7 mi les $332,676 $364,715 $742,351 $158,206 $1,326,543

75
Table 4.10 Cost Comparison for Thicker Class 19 Base Course
Des ign Outputs Control CaCl2
Asphalt
Emuls ion
Portland
Cement Geo-Grid
Distress Target Predicted Predicted Predicted Predicted Predicted
Class 19 WMA revised thickness 3.5" 3.5" 4" 2.5" 4"
AC bottom-up fatigue cracking (% lane area) 25.00 2.01 1.94 1.95 2.85 1.95
AC top-down fatigue cracking (ACTDFC) (ft/mi le) 2,000.00 1,840.61 1,635.07 1,744.64 1,782.67 1,744.64
AC thermal cracking (ft/mi le) 1,000.00 84.34 84.84 84.84 84.34 84.84
Permanent deformation - AC only (in) 0.25 0.47 0.47 0.46 0.07 0.46
Permanent deformation - tota l pavement (in) 0.75 0.07 0.07 0.07 0.49 0.07
Terminal IRI (in/mi le) 172.00 144.71 144.47 144.38 145.42 144.38
Years to predicted threshold dis tress ACTDFC (Years ) 20 20 20 25 20
Cost of pavement s tructure (Class 12.5, Class 19, subbase) $3,187,353 $4,173,101 $3,758,327 $3,955,153 $7,158,664
Cost of pavement s tructure/ACTDFC per year for 7 mi les $159,368 $208,655 $187,916 $158,206 $357,933

76
Chapter 5
Conclusions and Recommendations
5.1 Findings
Five test sections with FDR and various additives were established on Rt. 165 in Exeter, RI
to study the performance of the road with the help of the Rhode Island Department of Transportation
(RIDOT). This study included research, laboratory triaxial testing of subbase materials and
subgrade soils, rehabilitation performance predictions by AASHTOWare Pavement ME Design
software, and a condition survey to come up with long term performance monitoring and optimum
pavement rehabilitation strategies.
There were several findings while investigating the performance of the five test sections.
Pavement Distress and Cost
Of the five test sections, the section with Portland cement performed the best overall in
having the least amount of distresses and the longest predicted service life; next is calcium
chloride, followed by cold recycled (control), geo-grid, and asphalt emulsion. Table 4.8 shows
the comparison of years of predicted threshold distress and cost for AC top down fatigue
cracking (ACTDFC) in feet per mile. The AC top-down fatigue cracking and predicted years
were

77
obtained from the AASHTOWare Pavement ME design software using the lab tested resilient
moduli. According to the prediction models, in Table 4.8, the Portland cement section was the
only section that doesn’t fail in the ACTDFC. In addition, is predicted to last over twenty-five
years. The other test sections are predicted to reach the ACTDFC between five and ten years.
The costs of the pavement structure for all the sections were between 2.6 million to 6.6 million
dollars. The asphalt emulsion and geo-grid sections are not cost effective since they are
predicted to reach threshold distress in a very short amount of time.
Permanent Deformations, AC Bottom Up, Fatigue Cracking and Thermal Cracking
None of the test sections are predicted to have permanent deformation, AC bottom up
fatigue, or thermal AC cracking for over a twenty year period as shown in Table 4.3. Terminal
IRI is predicted to be sixteen percent below the target goal for twenty years. Other distresses
such as permanent deformation in the asphalt layer and AC bottom up fatigue cracking are
predicted not to be present for twenty years. As discussed, AC top down fatigue cracking fails
in all of the test sections except for Portland cement.
Portland Cement Section
It appears that Portland cement is an excellent additive, but the curing time can be a problem
on narrow roads like Route 165 where detours are not possible. Detours drive up the costs for
the project because of the additional traffic control and the delays to the traveling public.
Portland cement should be considered for future projects only where a detour is feasible. Route
165 has

78
150 heavy trucks per day, and would benefit greatly from a more durable pavement like Portland
cement. However this roadway could not support a detour therefore used alternating traffic was
used for construction.
Resilient Modulus
The various test sections had different lab calculated resilient moduli. The higher the Mr
value used, the less AC top down fatigue cracking. When comparing Tables 3.2 and 4.3, the
pavement layers and reclamation depths are held constant. The only real change is the resilient
modulus and the only distress that failed is the AC top down fatigue cracking. Portland cement
has the highest Mr values and the predicted cracking is not expected to exceed the threshold for
25 years.
Condition Survey
Condition surveys from the dTIMS database can be used to verify the MED predictions of
the five test sections. For this project, a windshield survey was completed after construction
in 2015 and an automated survey for download into dTIMS. RIDOT will track the pavement
performance for years to determine the best performance section.
Pavement Performance
Table 4.9 compares the predicted threshold distress and cost over twenty years for thicker
Class 19.0 WMA base courses comparing the five test sections. The control, calcium chloride,
asphalt emulsion and geo-grid test sections would be able to pass all distress targets over twenty
years by increasing the thickness of the Class 19 WMA by one inch to one and a half inches.
Table 4.9 provides material costs and the total cost per year for all the test sections. Table 4.8

79
compares the cost/year of each test section on Route 165. The order from least expensive to
most expensive section is Portland cement, calcium chloride, control, asphalt emulsion, and geo-
grid. Compare that to Table 4.9 for costs associated with the ideal pavement thickness and the
order changes slightly as follows: Portland cement, control, calcium chloride, asphalt emulsion
and geo-grid.
5.2 Recommendations
There are several recommendations that will be presented to RIDOT on how to increase
pavement performance. They are:
1. Perform triaxial tests and FWD testing on subbase material on future FDR projects in the
planning stage of design. Any subbase material which has less than 25,000 psi of resilient
modulus should be modified with an additive to increase its stiffness. The number of triaxial
tests and FWDs can be determined by how distressed the pavement is. The poorer the pavement
condition, the more testing should be done to determine the cause of failure.
2. MED and PHSI have great potential to predict and monitor future performance of FDR roads.
Thus, RIDOT may consider using both tools for the design of new reclaimated pavement
structures.
3. The Hogg Method should be investigated to see if its results can be used as MED input data.
The Excel program can be modified and calibrated to lab results to better fit the state’s subbase
material. Triaxial tests can also be used to verify the Hogg Method results.
4. It is recommended that Portland cement should be used as an additive if there is heavy truck
traffic and the pavement is wide enough to support detours or lane closures for at least the seven
day recommended curing time without traffic loads.
5. Asphalt emulsion could be investigated further on another state road. Increasing the depth of
the layer that contains emulsion from three inches to five or six inches could improve

80
performance, but it will increase the cost. We could analyze our predictions against the
condition survey data from dTIMS to see how close the predictions were to the MED.
6. RIDOT leases the MED program from AASHTO on a yearly basis and should be renewed.
Earlier versions of the MED were slow, but new software provides not only important prediction
information but also runs in less than five minutes. The information that can be derived from
MED can be highly useful if dTIMS, GPR, triaxial tests and/or FWDs are used in conjunction
with the MED.
7. Collecting the data for the MED inputs took two weeks for all the test sections. All the
information to do a Level 1 analysis is available but it is scattered throughout the RIDOT
Departments. A library of pavement material, subbase resilient moduli, AADTT, cores, and
GPR can improve collection time and prevent unnecessary extra testing.
8. If the RIDOT’s falling weight deflectometer and ground penetrating radar are to be used to
determine the pavement stiffness and pavement thickness, these machines need to be calibrated
on a regular basis and receive scheduled maintenance.
5.3 Conclusions
Overall, the Portland cement test section has the highest predicted performance, but is
difficult to construct due to curing time and traffic detours on Route 165. Calcium chloride and the
control sections were least expensive, but needed to have a thick base course which would increase
cost. Geo-grid is typically used in poor drainage areas with high water tables on highways and has
a high cost. Asphalt emulsions can work if either the asphalt emulsion is mixed to a deeper depth or
an additional inch and a half of base course is used.
It should be interesting to see in the coming years how well the MED predictions for the test
sections compare with the future distresses.

81
6. BIBLIOGRAPHY
American Association of State Highway and Transportation Officials, 2009. “A
Synthesis of Safety Implications of Oversize/Overweight Commercial
Vehicles”. Washington, D.C.
AASHTO, 1993. AASHTO “Guide for Design of Pavement Structures”, Washington, D.C.
AASHTO, 2015. “Mechanistic-Empirical Pavement Design Guide – A Manual of Practice, 2nd
Edition”, Washington D.C.
Bradshaw, A., Costa, J., Giampa, J., 2015. “Resilient Moduli of Reclaimed Asphalt Pavement
Aggregate Subbase Blend’s, Rhode Island Department of Transportation, Research
No. URITC Project No. 000154.
Bradshaw, A., Costa, J., Giampa, J., Genovesi, J., and Hernberg, A, 2015. “Development of a
Research Quality Resilient Modulus Testing Capabilities at URI”. Rhode Island
Department of Transportation, Research No. URITC Project No. 000154.
Federal Highway Administration, 2006. “Review of the Long-Term Pavement Performance
Backcalculation Results – Final Report”, Report No. HRT-05-150, Washington, DC,
Federal Highway Administration.
Federal Highway Administration, 2012. “Simplified Techniques for Evaluation and
Interpretation of Pavement Deflections for Network-Level Analysis”, Report No.
FHWA-HRT-12-023. Washington, D.C.
George, K.P., 2004. “Prediction of Resilient Modulus from Soil Index Properties”. University
of Mississippi Department of Civil Engineering.
George, K.P., 2003.”Falling Weight Deflectometer for Estimating Subgrade Resilient
Modulus”. University of Mississippi Department of Civil Engineering.
Hardcastle, J.H., 1993. “Subgrade Resilient Modulus for Idaho Pavements”, FHWA-RP-110-
D Idaho Department of Transportation, Boise.
Holtz, R.D., and Kovacs, W.D., 1981. “An Introduction to Geotechnical Engineering”,
Prentice-Hall, Inc, New Jersey.
(http://www.pavementrecycling.com/products/pavementRestructuring.aspx).
Jin, M.,K.W.Lee and W.D. Kovacs, 1994. “Seasonal Variation of Resilient Modulus of
Subgrade Soils for Flexible Pavement Design”, ASCE Journal of Transportation
Engineering.
Lee, K.W., Marcus, A.S., Mooney, K., Vajjhala, S., Kraus,E., and Park, K.,
2003.“Development of Flexible Pavement for Use with the 1993 AASHTO Pavement
Design Procedures”, Rhode Island Department of Transportation, Research Report
No. FHWA-RIDOT-RTD-03-6.

82
Lee, K.W., Marcus, A.S., and Mao, H.X., 1994. “Determination of Effective Soil Resilient
Modulus and Estimation of Layer Coefficients for Unbound Layers of Flexible
Pavement in Rhode Island”, Rhode Island Department of Transportation, Research
Report No. 1 (URI-CVET-94-1).
Lee, K.W., Mueller, M., and Singh, A., 2014. ”Cold In-Place Recycling as a Sustainable
Pavement Practice” URI Department of Civil and Environmental Engineering.
Lee, K. W. and W. Peckham, (1990). “An Assessment of Damage Caused to Pavements by
Heavy Trucks in New England”, Transportation Research Record No. 1286,
TRB/NRC
Nacci, V.A, “Geotechnical Engineering Exploration and Analysis for the Proposed 3R
Highway Improvement to Route 165, Exeter, Rhode Island”.
Pavement Design Procedures, “Final Report to RIDOT”, FHWA-RIDOT-RTD-03-6, URI,
Kingston, RI.
RIDOT, (2013). Specification from Rhode Island Contract 2012-CH-018. Rhode Island
Department of Transportation.
Transportation Research Board, National Research Council, 2008. “Falling Weight
Deflectometer Usage”. Transportation Research Board, Washington, D.C.
United States (US) Department of Agriculture (DOA) Soil Conservation Services (1981).” Soil
Survey of Rhode Island”, in cooperation with Rhode Island Agricultural Experiment
Station.
U.S. Department of Transportation, FHWA, 2004. “Significant Findings from Full Scale
Accelerated Pavement Testing”. Synthesis 325, US Department of Transportation.
U.S. Department of Transportation, FHWA, 2005. “Evaluation of the Engineering
Characteristics of RAP/Aggregate Blends”. FHWA/MT-05-008/8117-24, US
Department of Transportation.
Yoder, E.J. and Witczak, M.W., 1975. “Principles of Pavement Design”, John Wiley
$& Sons, Inc, New Jersey.