Evaluation of Chlorine Dioxide Gas Generator
32
United States Environmental Protection Agency Evaluation of Chlorine Dioxide Gas Generator Office of Research and Development National Homeland Security Research Center
Transcript of Evaluation of Chlorine Dioxide Gas Generator
United StatesEnvironmental ProtectionAgency
Evaluation of Chlorine Dioxide Gas GeneratorOffice of Research and DevelopmentNational Homeland SecurityResearch Center

EPA/600/R-06/048 April 2006
Technology Evaluation Report Evaluation of Sporicidal Decontamination Technology Sabre Technical Services Chlorine Dioxide Gas Generator
By James V. Rogers, William R. Richter, Young W. Choi, Jack D. Waugh, Michael L. Taylor, Karen B. Riggs, Harry J. Stone, Zachary J. Willenberg, and Robert T. Krile Battelle 505 King Avenue Columbus, Ohio 43201
Joseph P. Wood Task Order Project Officer National Homeland Security Research Center Office of Research and Development U.S. Environmental Protection Agency Mail Code E343-06 Research Triangle Park, NC 27711
ii
Notice
The U.S. Environmental Protection Agency (EPA), through its Office of Research and Development’s
National Homeland Security Research Center (NHSRC), funded and managed this technology
evaluation. This was achieved under a Blanket Purchase Agreement (BPA) with General Services
Administration contract number GS23F0011L-3 with Battelle. This report has been peer and
administratively reviewed and has been approved for publication as an EPA document. Mention of trade
names or commercial products does not constitute endorsement or recommendation for use.
ii
Foreword
The U.S. Environmental Protection Agency (EPA) is charged by Congress with protecting the nation’s
air, water, and land resources. Under a mandate of national environmental laws, the Agency strives to
formulate and implement actions leading to a compatible balance between human activities and the
ability of natural systems to support and nurture life. To meet this mandate, the EPA’s Office of
Research and Development (ORD) provides data and scientific support that can be used to solve
environmental problems and to build the scientific knowledge base needed to manage our ecological
resources wisely, to understand how pollutants affect our health, and to prevent or reduce environmental
risks.
In September 2002, EPA announced the formation of the National Homeland Security Research Center
(NHSRC). The NHSRC is part of the Office of Research and Development; it manages, coordinates, and
supports a variety of research and technical assistance efforts. These efforts are designed to provide
appropriate, affordable, effective, and validated technologies and methods for addressing risks posed by
chemical, biological, and radiological terrorist attacks. Research focuses on enhancing our ability to
detect, contain, and clean up in the event of such attacks.
NHSRC’s team of scientists and engineers is dedicated to understanding the terrorist threat,
communicating the risks, and mitigating the results of attacks. Guided by the roadmap set forth in EPA’s
Strategic Plan for Homeland Security, NHSRC ensures rapid production and distribution of security
related products.
The NHSRC has developed the Technology Testing and Evaluation Program (TTEP) in an effort to
provide reliable information regarding the performance of homeland security related technologies. TTEP
provides independent, quality assured performance information that is useful to decision makers in
purchasing or applying the tested technologies. It provides potential users with unbiased, third-party
information that can supplement vendor-provided information.
Stakeholder involvement in TTEP ensures that user needs and perspectives are incorporated into the test
design so that useful performance information is produced for each of the tested technologies. The
technology categories of interest include detection and monitoring, water treatment, air purification,
decontamination, and computer modeling tools for use by those responsible for protecting buildings,
drinking water supplies and infrastructure and for decontaminating structures and the outdoor
environment.
The evaluation reported herein was prepared by Battelle as part of TTEP. Information on NHSRC and
TTEP can be found at http://www.epa.gov/ordnhsrc/index.htm.
iii

Acknowledgments
The authors wish to acknowledge the support of all those who helped plan and conduct the evaluation,
analyze the data, and prepare this report. We also would like to thank Mr. Carlton Kempter, U.S.
Environmental Protection Agency’s Office of Pesticide Programs, and Dr. Philip Koga, U.S. Army
Research, Development, and Engineering Command, for their reviews of this report.
iv
Contents
Notice.........................................................................................................................................................ii
Foreword ...................................................................................................................................................iii
Acknowledgments..................................................................................................................................... iv
Abbreviations/Acronyms .........................................................................................................................vii
Executive Summary ................................................................................................................................viii
1.0 Introduction ........................................................................................................................................ 1
2.0 Technology Description ..................................................................................................................... 2
3.0 Quality Assurance/Quality Control .................................................................................................... 3
3.1 Equipment Calibration.......................................................................................................... 3
3.2 Audits.................................................................................................................................... 3
3.2.1 Performance Evaluation Audit.................................................................................. 3
3.2.2 Technical Systems Audit .......................................................................................... 3
3.2.3 Data Quality Audit .................................................................................................... 3
3.3 QA/QC Reporting ................................................................................................................... 3
3.4 Data Review............................................................................................................................ 4
4.0 Test Results ........................................................................................................................................ 5
4.1 Decontamination Efficacy .................................................................................................... 5
4.1.1 Quantitative Assessment of the Log Reduction of Viable
Organisms ................................................................................................................. 5
4.1.2 Qualitative Assessment of Residual Spores............................................................ 10
4.1.3 Qualitative Assessment of Biological Indicators and Spore Strips ........................ 11
4.2 Damage to Coupons............................................................................................................ 17
4.3 Other Factors....................................................................................................................... 17
4.3.1 Operator Control ..................................................................................................... 17
5.0 Performance Summary ..................................................................................................................... 20
6.0 References ........................................................................................................................................ 22
v
Figures
Figure 2-1. Sabre Technical Services Bench-Scale Chlorine Dioxide Gas Generator............................ 2
Figure 4-1. Representative Plated Liquid Culture Assessment Samples............................................... 16
Figure 4-2. Temperature and Relative Humidity Measurements from a Single Experiment ................ 18
Figure 4-3. Representative Chlorine Dioxide Concentration from a Single
Experiment.......................................................................................................................... 19
Tables
Table 4-1. Decontamination of Bacillus anthracis Ames Spores .......................................................... 7
Table 4-2. Decontamination of Bacillus subtilis Spores ........................................................................ 8
Table 4-3. Decontamination of Geobacillus stearothermophilus Spores .............................................. 9
Table 4-4. Mean Log Reduction for Spores ......................................................................................... 10
Table 4-5. Liquid Culture Assessment of Coupons Inoculated with Bacillus anthracis Ames Spores
following Extraction ........................................................................................................... 12
Table 4-6. Liquid Culture Assessment of Coupons Inoculated with Bacillus subtilis Spores following
Extraction............................................................................................................................ 13
Table 4-7. Liquid Culture Assessment of Coupons Inoculated with Geobacillus stearothermophilus
Spores following Extraction ............................................................................................... 14
Table 4-8. Representative Liquid Cultures of Biological Indicators/Spore Strips............................... 15
vi
Abbreviations/Acronyms
ATCC American Type Culture Collection
C
CFU
Celsius
colony-forming unit
ClO2 chlorine dioxide
cm centimeter
CT concentration x time
EPA U.S. Environmental Protection Agency
hr hour
L liter
min minute
mL milliliter
NHSRC National Homeland Security Research Center
ppm parts per million
QA quality assurance
QC quality control
QMP quality management plan
RH relative humidity
SD standard deviation
TSA technical systems audit
TTEP Technology Testing and Evaluation Program
vii
Executive Summary
The U.S. Environmental Protection Agency’s (EPA) National Homeland Security Research Center
(NHSRC), Technology Testing and Evaluation Program (TTEP) helps to protect human health and the
environment from adverse impacts resulting from acts of terror. One way this is accomplished is by carrying
out performance tests on homeland security technologies. Under TTEP, Battelle recently evaluated the
performance of the Sabre Technical Services chlorine dioxide gas generator. The objective of testing the
Sabre chlorine dioxide gas generator was to evaluate its ability to decontaminate Bacillus anthracis Ames
spores and two surrogates, Bacillus subtilis (ATCC 19659) and Geobacillus stearothermophilus (ATCC
12980), on indoor surface materials.
The Sabre chlorine dioxide gas generator uses chlorine dioxide fumigation for decontamination of biological
agents. The following performance characteristics of the Sabre chlorine dioxide gas generator were
evaluated:
Decontamination efficacy
— Quantitative assessment of the log reduction of viable organisms
— Qualitative assessment of residual spores
— Qualitative assessment of biological indicators and spore strips
Qualitative assessment of material surface damage following decontamination.
The Sabre chlorine dioxide gas generator demonstrated statistically significant decontamination efficacy for
B. anthracis Ames, B. subtilis (ATCC 19659), and G. stearothermophilus (ATCC 12980) on test coupons
(1.9 cm by 7.5 cm) of seven materials:
Industrial-grade carpet
Bare wood (pine lumber)
Glass
Decorative laminate (Formica®, white matte finish)
Galvanized metal ductwork
Painted (latex, flat) wallboard paper
Painted (latex, semi-gloss) concrete cinder block.
Within the limits of the evaluation methodology, the Sabre chlorine dioxide gas generator was effective at
eliminating extractable, viable spores from all test coupons under the conditions of this test. After
decontamination, no viable spores were extracted from any test coupons contaminated with either B. anthracis Ames, B. subtilis, or G. stearothermophilus spores. In more than 95% of the cases, qualitative
analysis showed that no residual microbial organisms were present on the test coupons that had been
decontaminated, extracted, and immersed in growth media. In only 5% of the test coupons, extractable,
viable microorganisms (either added by inoculation, i.e., B. anthracis Ames, B. subtilis, or
G. stearothermophilus spores, or endogenous) were found after decontamination and extraction. The only
qualitative (visual) damage observed for any of the test coupons subjected to the Sabre chlorine dioxide gas
generator was a bleaching effect on the industrial carpet.
viii
1.0 Introduction
The U.S. Environmental Protection Agency’s (EPA) National Homeland Security Research Center
(NHSRC) is helping to protect human health and the environment from adverse impacts resulting from acts
of terror. With an emphasis on decontamination and consequence management, water infrastructure
protection, and threat and consequence assessment, NHRSC is working to develop tools and information that
will help detect the intentional introduction of chemical or biological contaminants in buildings or water
systems, contain these agents, decontaminate buildings and/or water systems, and dispose materials resulting
from cleanups.
NHSRC’s Technology Testing and Evaluation Program (TTEP) works in partnership with recognized testing
organizations; with stakeholder groups consisting of buyers, vendor organizations, scientists, and permitters;
and with participation of individual technology developers in carrying out performance tests on homeland
security technologies. In response to the needs of stakeholders, TTEP evaluates the performance of
innovative homeland security technologies by developing test plans, conducting evaluations, collecting and
analyzing data, and preparing peer-reviewed reports. All evaluations are conducted in accordance with
rigorous quality assurance (QA) protocols to ensure the generation of high quality data and defensible
results. TTEP provides unbiased, third-party information supplementary to vendor-provided information that
is useful to decision makers in purchasing or applying the evaluated technologies. Stakeholder involvement
ensures that user needs and perspectives are incorporated into the evaluation design to produce useful
performance information for each evaluated technology.
Under TTEP, Battelle recently evaluated the performance of the Sabre Technical Services chlorine dioxide
gas generator. The objective of testing the Sabre chlorine dioxide gas generator was to evaluate its ability to
decontaminate Bacillus anthracis Ames spores and two surrogates, Bacillus subtilis (ATCC 19659) and
Geobacillus stearothermophilus (ATCC 12980), on representative indoor surface materials. This evaluation
was conducted according to a peer-reviewed test/QA plan(1)
that was developed according to the
requirements of the quality management plan (QMP) for the TTEP program.(2)
The following performance
characteristics of the Sabre chlorine dioxide gas generator were evaluated:
Decontamination efficacy
— Quantitative assessment of the log reduction of viable organisms
— Qualitative assessment of residual spores
— Qualitative assessment of biological indicators and spore strips
Qualitative assessment of material surface damage following decontamination.
1
2.0 Technology Description
The following is a description of the Sabre chlorine dioxide gas generator based on information provided
by the vendor. The information provided below was not confirmed in this evaluation.
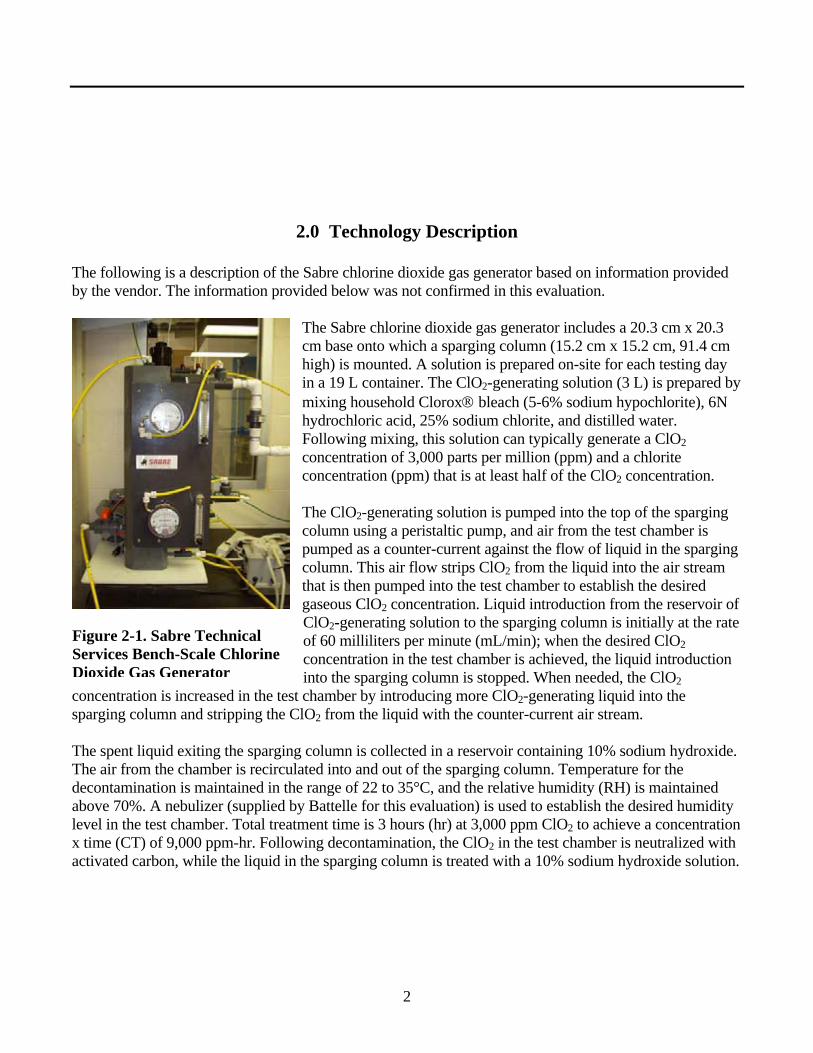
The Sabre chlorine dioxide gas generator includes a 20.3 cm x 20.3
cm base onto which a sparging column (15.2 cm x 15.2 cm, 91.4 cm
high) is mounted. A solution is prepared on-site for each testing day
in a 19 L container. The ClO2-generating solution (3 L) is prepared by
mixing household Clorox® bleach (5-6% sodium hypochlorite), 6N
hydrochloric acid, 25% sodium chlorite, and distilled water.
Following mixing, this solution can typically generate a ClO2
concentration of 3,000 parts per million (ppm) and a chlorite
concentration (ppm) that is at least half of the ClO2 concentration.
The ClO2-generating solution is pumped into the top of the sparging
column using a peristaltic pump, and air from the test chamber is
pumped as a counter-current against the flow of liquid in the sparging
column. This air flow strips ClO2 from the liquid into the air stream
that is then pumped into the test chamber to establish the desired
gaseous ClO2 concentration. Liquid introduction from the reservoir of
ClO2-generating solution to the sparging column is initially at the rate
of 60 milliliters per minute (mL/min); when the desired ClO2
concentration in the test chamber is achieved, the liquid introduction
into the sparging column is stopped. When needed, the ClO2
Figure 2-1. Sabre Technical Services Bench-Scale ChlorineDioxide Gas Generator
concentration is increased in the test chamber by introducing more ClO2-generating liquid into thesparging column and stripping the ClO2 from the liquid with the counter-current air stream.
The spent liquid exiting the sparging column is collected in a reservoir containing 10% sodium hydroxide.
The air from the chamber is recirculated into and out of the sparging column. Temperature for the
decontamination is maintained in the range of 22 to 35°C, and the relative humidity (RH) is maintained
above 70%. A nebulizer (supplied by Battelle for this evaluation) is used to establish the desired humidity
level in the test chamber. Total treatment time is 3 hours (hr) at 3,000 ppm ClO2 to achieve a concentration
x time (CT) of 9,000 ppm-hr. Following decontamination, the ClO2 in the test chamber is neutralized with
activated carbon, while the liquid in the sparging column is treated with a 10% sodium hydroxide solution.
2
3.0 Quality Assurance/Quality Control
Quality assurance/quality control (QC) procedures were performed in accordance with the program
QMP(2)
and the test/QA plan(1)
for this evaluation. QA/QC procedures are summarized below.
3.1 Equipment Calibration
All equipment (e.g., pipettes, incubators, biological safety cabinets) used at the time of evaluation was
verified as being certified, calibrated, or validated.
3.2 Audits
3.2.1 Performance Evaluation Audit
No performance evaluation audit was performed for biological agents and surrogates because
quantitative standards for these biological materials do not exist. The confirmation procedure, controls,
blanks, and method validation efforts support the biological evaluation results.
3.2.2 Technical Systems Audit
Battelle QA staff conducted a technical systems audit (TSA) on June 9, 2005 to ensure that the
evaluation was being conducted in accordance with the test/QA plan(1)
and the QMP.(2)
As part of the
TSA, test procedures were compared to those specified in the test/QA plan; and data acquisition and
handling procedures were reviewed. Observations and findings from the TSA were documented and
submitted to the Battelle Task Order Leader for response. None of the findings of the TSA required
corrective action. TSA records were permanently stored with the TTEP QA Manager.
3.2.3 Data Quality Audit
At least 10% of the data acquired during the evaluation were audited. A Battelle QA auditor traced the
data from the initial acquisition, through reduction and statistical analysis, to final reporting to ensure
the integrity of the reported results. All calculations performed on the data undergoing the audit were
checked.
3.3 QA/QC Reporting
Each audit was documented in accordance with the QMP.(2)
The results of the TSA were submitted to
the EPA.
3
3.4 Data Review
Records generated in the evaluation received a QC/technical review and a QA review before they were
used to calculate, evaluate, or report evaluation results. All data were recorded by Battelle staff. The
person performing the review was involved in the experiments and added his/her initials and the date to
a hard copy of the record being reviewed. This hard copy was returned to the Battelle staff member who
stored the record.
4
4.0 Test Results
The Sabre chlorine dioxide gas generator was evaluated for decontamination efficacy against a
biological warfare agent and two surrogates on seven indoor surfaces. The evaluation followed the EPA-
approved Technology Testing and Evaluation Program Test/QA Plan for Evaluation of Sporicidal Decontamination Technologies (Version 1).
(1) Various structural, decorative, and functional surfaces
typically found inside an office building or a mass transit station were used to evaluate the sporicidal
decontamination technology. The test surfaces (coupons measuring 1.9 cm x 7.5 cm) are listed below:
Industrial-grade carpet
Bare wood (pine lumber)
Glass
Decorative laminate (Formica®, white matte finish)
Galvanized metal ductwork
Painted (latex, flat) wallboard paper
Painted (latex, semi-gloss) concrete cinder block.
The biological agent used to evaluate the sporicidal decontamination technology was B. anthracis Ames
spores. To provide correlations with the B. anthracis results, the surrogates, B. subtilis (ATCC 19659)
and G. stearothermophilus (ATCC 12980), were used.
The following sections summarize the results of these evaluations.
4.1 Decontamination Efficacy
No viable spores were found in extracts of the test coupons contaminated with B. anthracis Ames, B. subtilis, and G. stearothermophilus spores after decontamination by the Sabre chlorine dioxide gas
generator.
4.1.1 Quantitative Assessment of the Log Reduction of Viable Organisms
Decontamination efficacy was calculated as the log reduction in viable organisms achieved by the
decontamination technology. Efficacy (E) was calculated for each of the triplicate coupons of each
biological agent or surrogate and test coupon as:
E = log10 N/N’ where N was the average number of viable organisms recovered from the triplicate positive control
coupons (i.e., those inoculated, but not subjected to decontamination) and N′ was the number of viable
organisms recovered from each test coupon after decontamination. If no viable organisms were
5
recovered from a test coupon after decontamination, the value 1 was substituted for N′. (This is a typical
microbiological practice, since any number divided by zero is infinity.) Since the value 1 is greater than
the observed value of zero, the estimated efficacy with this substitution becomes a lower bound for the
true efficacy.
For all seven test materials, the results were statistically significant for decontamination (95%
confidence that efficacy exceeds 0) (Tables 4-1, 4-2, and 4-3). For the quantitative assessment using
dilution plating, no colony-forming units (CFU) of any of the three organisms used for the evaluation
were observed in the extracts of the test coupons that had been inoculated then decontaminated.
Calculating the corresponding efficacy resulted in mean log reduction values of at least 7.14, 6.73, and
6.25 for B. anthracis Ames, B. subtilis, and G. stearothermophilus spores, respectively.
Table 4-4 contains a summary of the mean log reductions obtained for each of the three organisms on
each of the seven test materials. It should be noted that average percent recoveries of inoculated
organisms as shown in Tables 4-1, 4-2, and 4-3 were, at times, well under 25%. In fact, the lowest
average percent recovery was 2.34% [± 1.2 standard deviation (SD)]. These low recoveries of inoculated
organisms may be attributed to interactions (adherence or sorption) to the material comprising each test
coupon. These recoveries are similar to the recoveries achieved in previous TTEP testing.(3-5)
Note also
that in the present evaluation as well as previous studies,(3-5)
recoveries obtained for B. anthracis Ames
are generally not the same as the recoveries obtained for the surrogates, B. subtilis and G. stearothermophilus. To put the impact of a low percent recovery into perspective, in the case of the
painted wallboard paper (Table 4-2) a total of 80,000,000 spores were placed or inoculated onto the
painted wallboard paper and the number of spores recovered was 5,312,000. Thus, a considerable
number of spores was recovered and was available for assessment of the decontamination. The standard
deviations for the extractions were consistent, lending confidence in the reliability of the measurements.
The mean (± SD) calculated concentration multiplied by time (CT) value for all of the decontamination
runs for this evaluation was 9,205 ± 90.03 ppm-hr.
The lack of any observable (recoverable) organisms for decontaminated coupons prevented application
of the statistical analysis approach used in previous decontamination technology evaluations.(3-5)
Because no viable spores were extracted from any test coupon, the calculated efficacy values of the
triplicate test coupons of each agent/surrogate and material were identical. As stated above, the
calculated efficacy values were lower bounds based on replacing the number of viable organisms after
decontamination in the denominator of the efficacy calculation with the value 1. Since these efficacy
values are lower bounds, they do not provide information on the coupon-to-coupon variability in
efficacy. Hence, they do not provide a basis for the analysis of variance approach used in previous
evaluations(3-5)
to determine if the observed efficacy values are (1) statistically significantly greater than
zero and (2) statistically significantly different from each other (between agent/surrogates for a
particular material or across materials within a specific agent/surrogate). The statistical significance
between agent/surrogate and material groups could not be determined.
6
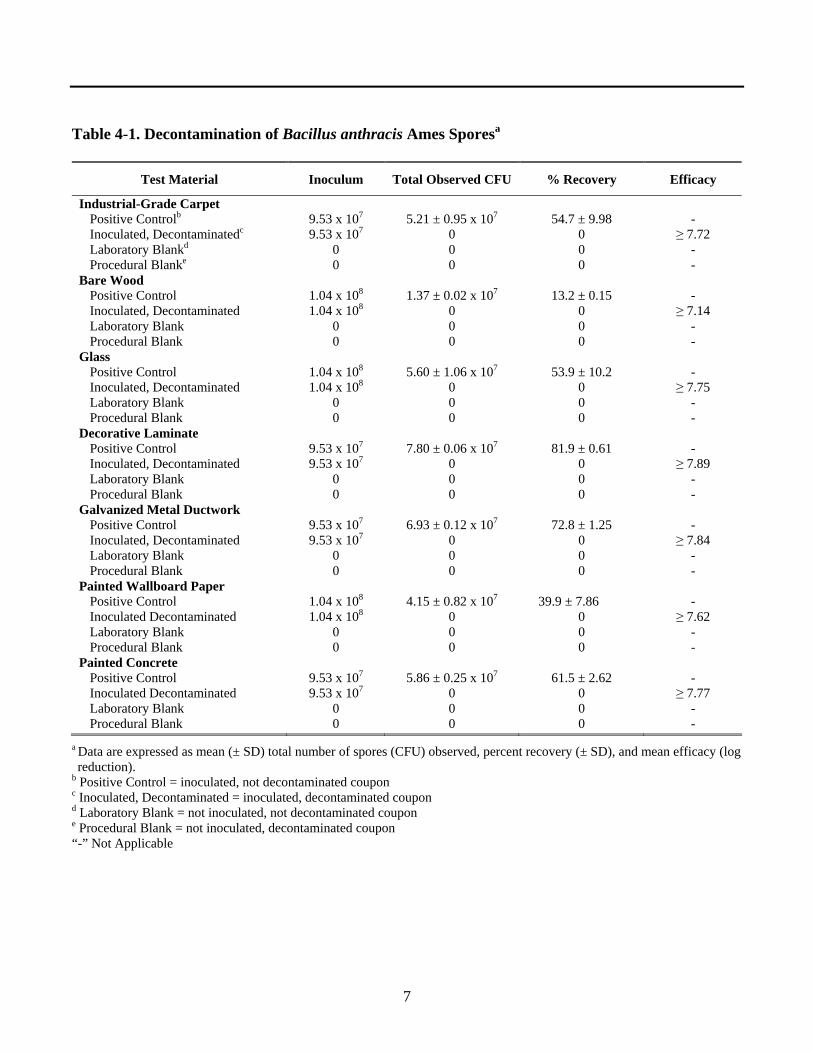
Table 4-1. Decontamination of Bacillus anthracis Ames Sporesa
Test Material Inoculum Total Observed CFU % Recovery Efficacy
Industrial-Grade Carpet Positive Control
b
Inoculated, Decontaminatedc
Laboratory Blankd
Procedural Blanke
9.53 x 10⁷
9.53 x 10⁷
0
0
5.21 ± 0.95 x 10⁷
0
0
0
54.7 ± 9.98
0
0
0
-
≥ 7.72
-
-
Bare Wood
Positive Control
Inoculated, Decontaminated
Laboratory Blank
Procedural Blank
1.04 x 10⁸
1.04 x 10⁸
0
0
1.37 ± 0.02 x 10⁷
0
0
0
13.2 ± 0.15
0
0
0
-
≥ 7.14
-
-
Glass Positive Control
Inoculated, Decontaminated
Laboratory Blank
Procedural Blank
1.04 x 10⁸
1.04 x 10⁸
0
0
5.60 ± 1.06 x 10⁷
0
0
0
53.9 ± 10.2
0
0
0
-
≥ 7.75
-
-
Decorative Laminate Positive Control
Inoculated, Decontaminated
Laboratory Blank
Procedural Blank
9.53 x 10⁷
9.53 x 10⁷
0
0
7.80 ± 0.06 x 10⁷
0
0
0
81.9 ± 0.61
0
0
0
-
≥ 7.89
-
-
Galvanized Metal Ductwork Positive Control
Inoculated, Decontaminated
Laboratory Blank
Procedural Blank
9.53 x 10⁷
9.53 x 10⁷
0
0
6.93 ± 0.12 x 10⁷
0
0
0
72.8 ± 1.25
0
0
0
-
≥ 7.84
-
-
Painted Wallboard Paper Positive Control
Inoculated Decontaminated
Laboratory Blank
Procedural Blank
1.04 x 10⁸
1.04 x 10⁸
0
0
4.15 ± 0.82 x 10⁷
0
0
0
39.9 ± 7.86
0
0
0
-
≥ 7.62
-
-
Painted Concrete Positive Control
Inoculated Decontaminated
Laboratory Blank
Procedural Blank
9.53 x 10⁷
9.53 x 10⁷
0
0
5.86 ± 0.25 x 10⁷
0
0
0
61.5 ± 2.62
0
0
0
-
≥ 7.77
-
-
a Data are expressed as mean (± SD) total number of spores (CFU) observed, percent recovery (± SD), and mean efficacy (log
reduction). b Positive Control = inoculated, not decontaminated coupon
c Inoculated, Decontaminated = inoculated, decontaminated coupon
d Laboratory Blank = not inoculated, not decontaminated coupon
e Procedural Blank = not inoculated, decontaminated coupon
“-” Not Applicable
7
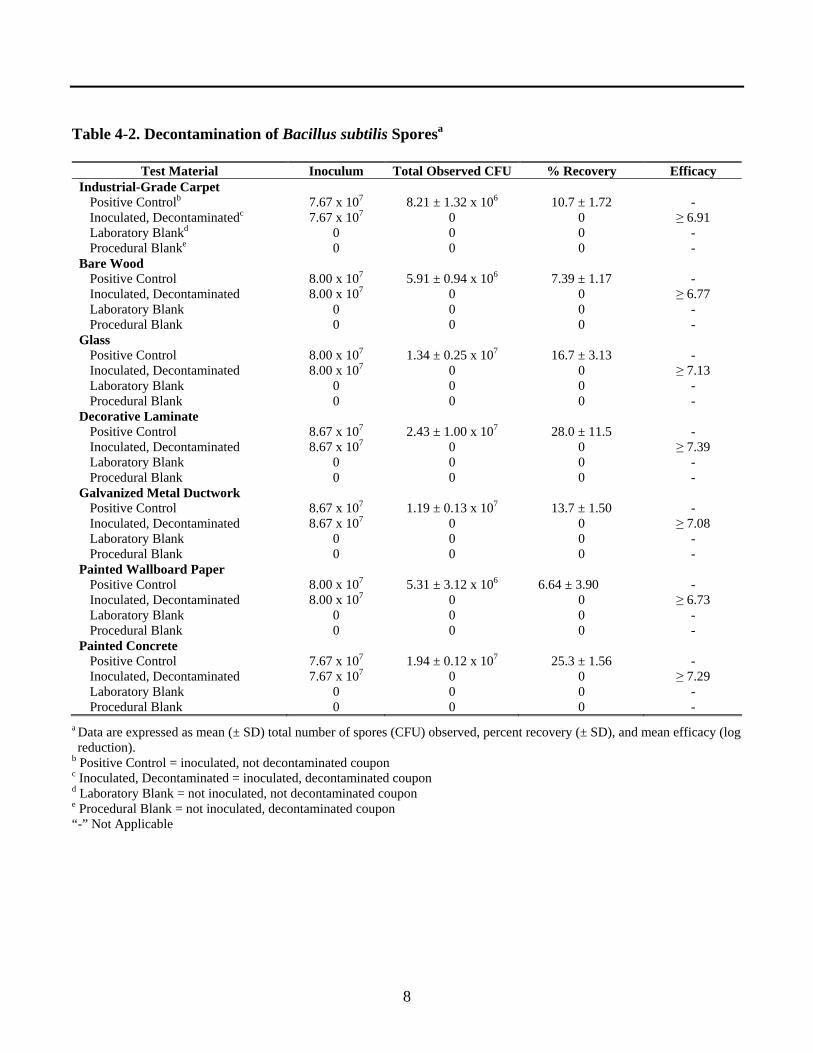
Table 4-2. Decontamination of Bacillus subtilis Sporesa
Test Material Inoculum Total Observed CFU % Recovery Efficacy
Industrial-Grade Carpet Positive Control
b
Inoculated, Decontaminatedc
Laboratory Blankd
Procedural Blanke
7.67 x 10⁷
7.67 x 10⁷
0
0
8.21 ± 1.32 x 10⁶
0
0
0
10.7 ± 1.72
0
0
0
-
≥ 6.91
-
-
Bare Wood Positive Control
Inoculated, Decontaminated
Laboratory Blank
Procedural Blank
8.00 x 10⁷
8.00 x 10⁷
0
0
5.91 ± 0.94 x 10⁶
0
0
0
7.39 ± 1.17
0
0
0
-
≥ 6.77
-
-
Glass Positive Control
Inoculated, Decontaminated
Laboratory Blank
Procedural Blank
8.00 x 10⁷
8.00 x 10⁷
0
0
1.34 ± 0.25 x 10⁷
0
0
0
16.7 ± 3.13
0
0
0
-
≥ 7.13
-
-
Decorative Laminate Positive Control
Inoculated, Decontaminated
Laboratory Blank
Procedural Blank
8.67 x 10⁷
8.67 x 10⁷
0
0
2.43 ± 1.00 x 10⁷
0
0
0
28.0 ± 11.5
0
0
0
-
≥ 7.39
-
-
Galvanized Metal Ductwork Positive Control
Inoculated, Decontaminated
Laboratory Blank
Procedural Blank
8.67 x 10⁷
8.67 x 10⁷
0
0
1.19 ± 0.13 x 10⁷
0
0
0
13.7 ± 1.50
0
0
0
-
≥ 7.08
-
-
Painted Wallboard Paper Positive Control
Inoculated, Decontaminated
Laboratory Blank
Procedural Blank
8.00 x 10⁷
8.00 x 10⁷
0
0
5.31 ± 3.12 x 10⁶
0
0
0
6.64 ± 3.90
0
0
0
-
≥ 6.73
-
-
Painted Concrete Positive Control
Inoculated, Decontaminated
Laboratory Blank
Procedural Blank
7.67 x 10⁷
7.67 x 10⁷
0
0
1.94 ± 0.12 x 10⁷
0
0
0
25.3 ± 1.56
0
0
0
-
≥ 7.29
-
-
a Data are expressed as mean (± SD) total number of spores (CFU) observed, percent recovery (± SD), and mean efficacy (log
reduction). b Positive Control = inoculated, not decontaminated coupon
c Inoculated, Decontaminated = inoculated, decontaminated coupon
d Laboratory Blank = not inoculated, not decontaminated coupon
e Procedural Blank = not inoculated, decontaminated coupon
“-” Not Applicable
8
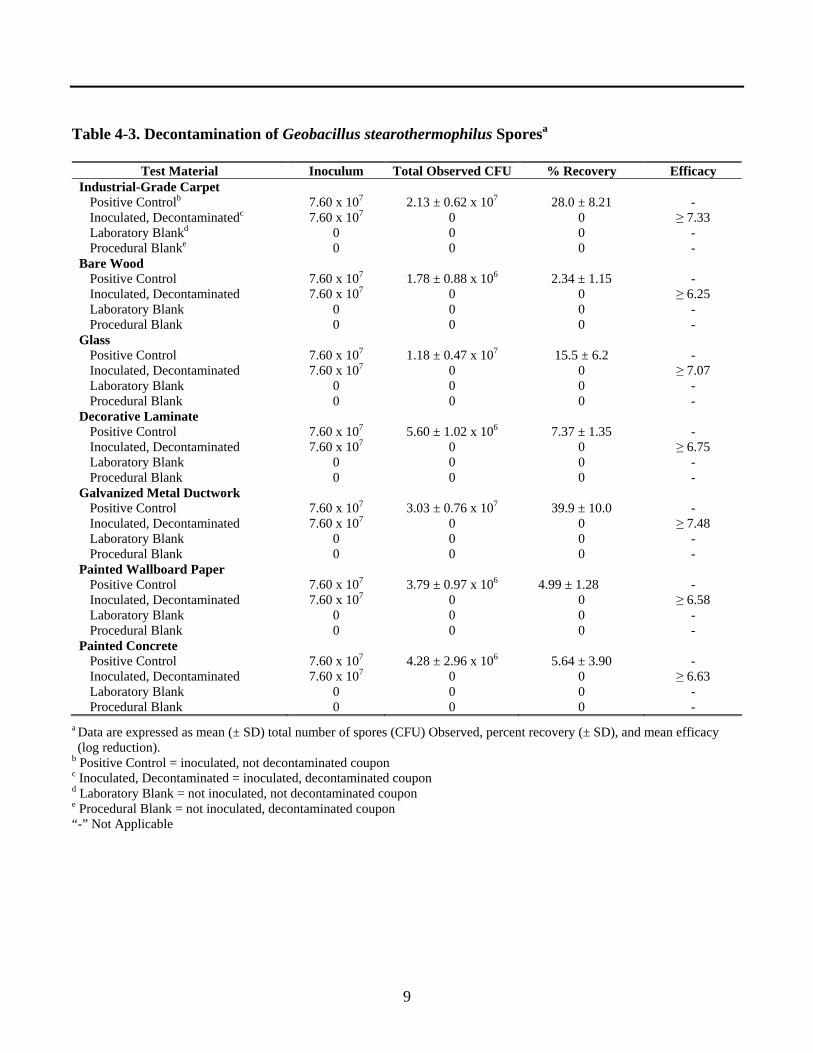
Table 4-3. Decontamination of Geobacillus stearothermophilus Sporesa
Test Material Inoculum Total Observed CFU % Recovery Efficacy
Industrial-Grade Carpet Positive Control
b
Inoculated, Decontaminatedc
Laboratory Blankd
Procedural Blanke
7.60 x 10⁷
7.60 x 10⁷
0
0
2.13 ± 0.62 x 10⁷
0
0
0
28.0 ± 8.21
0
0
0
-
≥ 7.33
-
-
Bare Wood Positive Control
Inoculated, Decontaminated
Laboratory Blank
Procedural Blank
7.60 x 10⁷
7.60 x 10⁷
0
0
1.78 ± 0.88 x 10⁶
0
0
0
2.34 ± 1.15
0
0
0
-
≥ 6.25
-
-
Glass Positive Control
Inoculated, Decontaminated
Laboratory Blank
Procedural Blank
7.60 x 10⁷
7.60 x 10⁷
0
0
1.18 ± 0.47 x 10⁷
0
0
0
15.5 ± 6.2
0
0
0
-
≥ 7.07
-
-
Decorative Laminate Positive Control
Inoculated, Decontaminated
Laboratory Blank
Procedural Blank
7.60 x 10⁷
7.60 x 10⁷
0
0
5.60 ± 1.02 x 10⁶
0
0
0
7.37 ± 1.35
0
0
0
-
≥ 6.75
-
-
Galvanized Metal Ductwork Positive Control
Inoculated, Decontaminated
Laboratory Blank
Procedural Blank
7.60 x 10⁷
7.60 x 10⁷
0
0
3.03 ± 0.76 x 10⁷
0
0
0
39.9 ± 10.0
0
0
0
-
≥ 7.48
-
-
Painted Wallboard Paper Positive Control
Inoculated, Decontaminated
Laboratory Blank
Procedural Blank
7.60 x 10⁷
7.60 x 10⁷
0
0
3.79 ± 0.97 x 10⁶
0
0
0
4.99 ± 1.28
0
0
0
-
≥ 6.58
-
-
Painted Concrete Positive Control
Inoculated, Decontaminated
Laboratory Blank
Procedural Blank
7.60 x 10⁷
7.60 x 10⁷
0
0
4.28 ± 2.96 x 10⁶
0
0
0
5.64 ± 3.90
0
0
0
-
≥ 6.63
-
-
a Data are expressed as mean (± SD) total number of spores (CFU) Observed, percent recovery (± SD), and mean efficacy
(log reduction). b Positive Control = inoculated, not decontaminated coupon
c Inoculated, Decontaminated = inoculated, decontaminated coupon
d Laboratory Blank = not inoculated, not decontaminated coupon
e Procedural Blank = not inoculated, decontaminated coupon
“-” Not Applicable
9
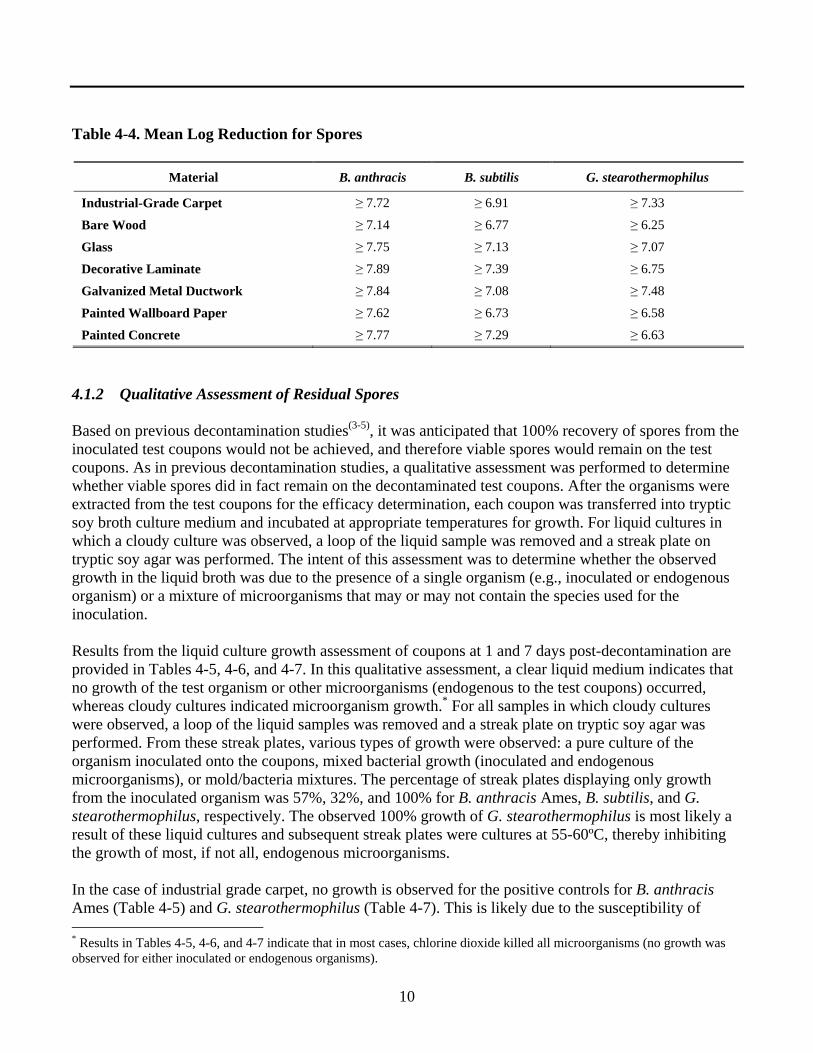
Table 4-4. Mean Log Reduction for Spores
Material B. anthracis B. subtilis G. stearothermophilus
Industrial-Grade Carpet ≥ 7.72 ≥ 6.91 ≥ 7.33
Bare Wood ≥ 7.14 ≥ 6.77 ≥ 6.25
Glass ≥ 7.75 ≥ 7.13 ≥ 7.07
Decorative Laminate ≥ 7.89 ≥ 7.39 ≥ 6.75
Galvanized Metal Ductwork ≥ 7.84 ≥ 7.08 ≥ 7.48
Painted Wallboard Paper ≥ 7.62 ≥ 6.73 ≥ 6.58
Painted Concrete ≥ 7.77 ≥ 7.29 ≥ 6.63
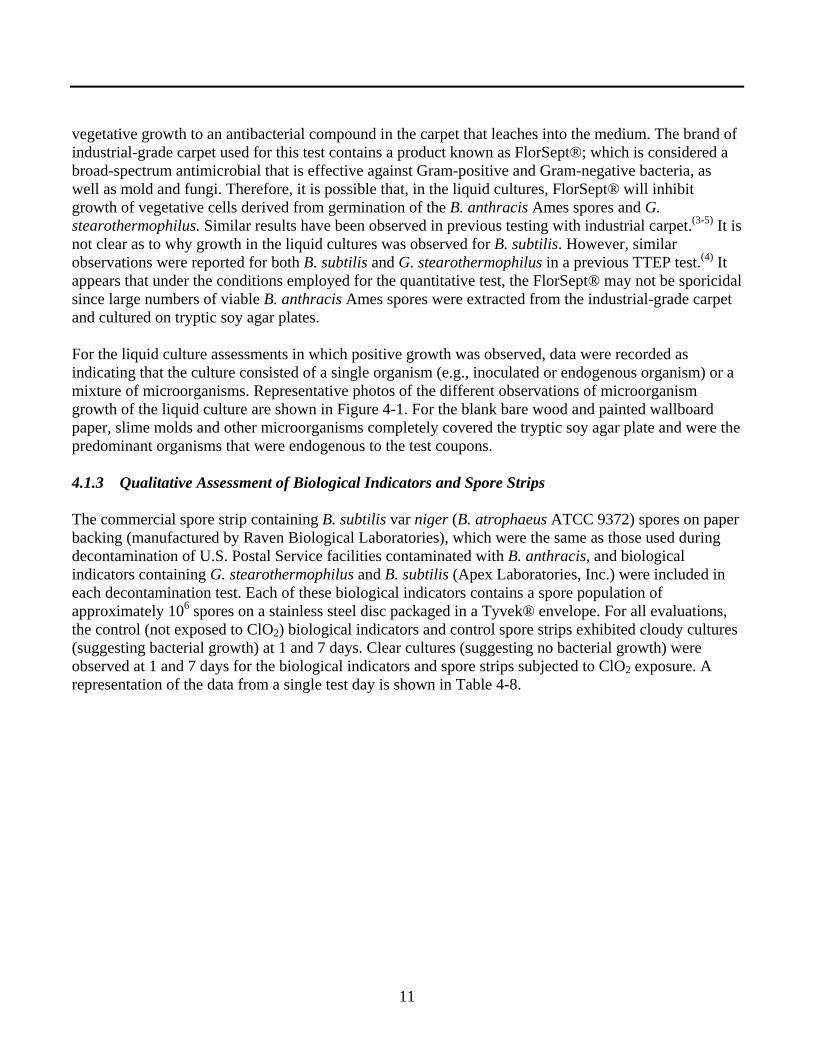
4.1.2 Qualitative Assessment of Residual Spores
Based on previous decontamination studies(3-5)
, it was anticipated that 100% recovery of spores from the
inoculated test coupons would not be achieved, and therefore viable spores would remain on the test
coupons. As in previous decontamination studies, a qualitative assessment was performed to determine
whether viable spores did in fact remain on the decontaminated test coupons. After the organisms were
extracted from the test coupons for the efficacy determination, each coupon was transferred into tryptic
soy broth culture medium and incubated at appropriate temperatures for growth. For liquid cultures in
which a cloudy culture was observed, a loop of the liquid sample was removed and a streak plate on
tryptic soy agar was performed. The intent of this assessment was to determine whether the observed
growth in the liquid broth was due to the presence of a single organism (e.g., inoculated or endogenous
organism) or a mixture of microorganisms that may or may not contain the species used for the
inoculation.
Results from the liquid culture growth assessment of coupons at 1 and 7 days post-decontamination are
provided in Tables 4-5, 4-6, and 4-7. In this qualitative assessment, a clear liquid medium indicates that
no growth of the test organism or other microorganisms (endogenous to the test coupons) occurred,
whereas cloudy cultures indicated microorganism growth.* For all samples in which cloudy cultures
were observed, a loop of the liquid samples was removed and a streak plate on tryptic soy agar was
performed. From these streak plates, various types of growth were observed: a pure culture of the
organism inoculated onto the coupons, mixed bacterial growth (inoculated and endogenous
microorganisms), or mold/bacteria mixtures. The percentage of streak plates displaying only growth
from the inoculated organism was 57%, 32%, and 100% for B. anthracis Ames, B. subtilis, and G. stearothermophilus, respectively. The observed 100% growth of G. stearothermophilus is most likely a
result of these liquid cultures and subsequent streak plates were cultures at 55-60ºC, thereby inhibiting
the growth of most, if not all, endogenous microorganisms.
In the case of industrial grade carpet, no growth is observed for the positive controls for B. anthracis Ames (Table 4-5) and G. stearothermophilus (Table 4-7). This is likely due to the susceptibility of
* Results in Tables 4-5, 4-6, and 4-7 indicate that in most cases, chlorine dioxide killed all microorganisms (no growth was
observed for either inoculated or endogenous organisms).
10
vegetative growth to an antibacterial compound in the carpet that leaches into the medium. The brand of
industrial-grade carpet used for this test contains a product known as FlorSept®; which is considered a
broad-spectrum antimicrobial that is effective against Gram-positive and Gram-negative bacteria, as
well as mold and fungi. Therefore, it is possible that, in the liquid cultures, FlorSept® will inhibit
growth of vegetative cells derived from germination of the B. anthracis Ames spores and G. stearothermophilus. Similar results have been observed in previous testing with industrial carpet.
(3-5) It is
not clear as to why growth in the liquid cultures was observed for B. subtilis. However, similar
observations were reported for both B. subtilis and G. stearothermophilus in a previous TTEP test.(4)
It
appears that under the conditions employed for the quantitative test, the FlorSept® may not be sporicidal
since large numbers of viable B. anthracis Ames spores were extracted from the industrial-grade carpet
and cultured on tryptic soy agar plates.
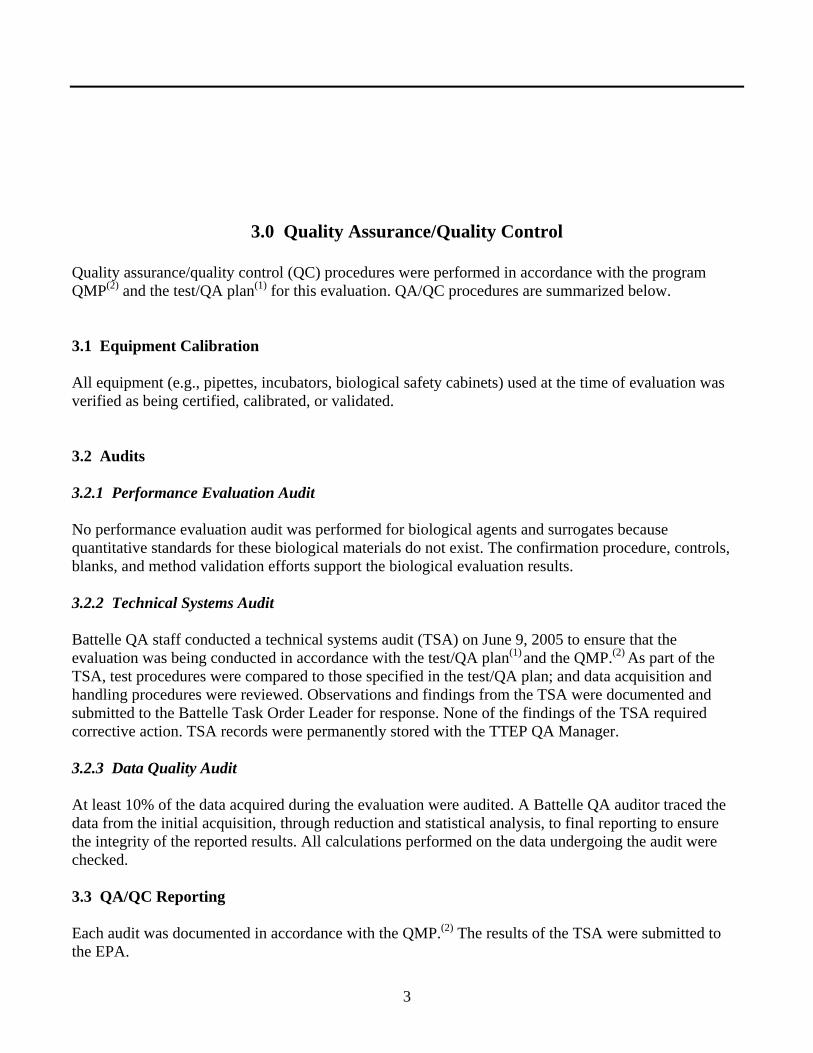
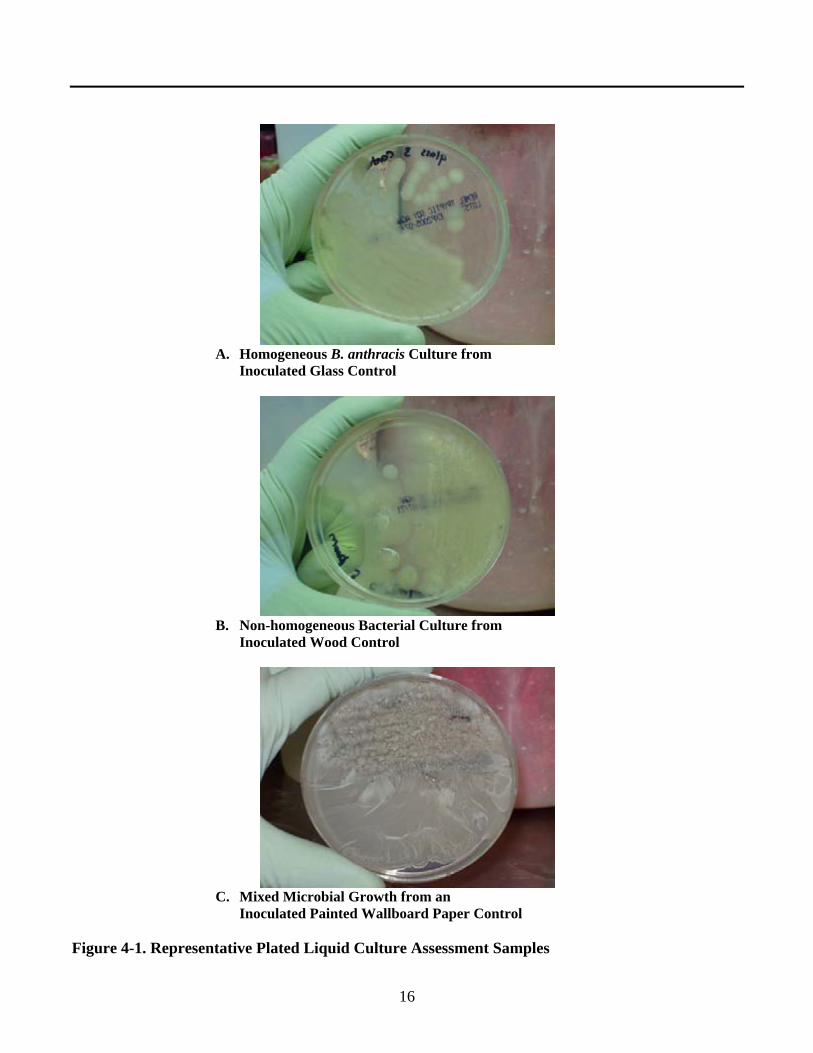
For the liquid culture assessments in which positive growth was observed, data were recorded as
indicating that the culture consisted of a single organism (e.g., inoculated or endogenous organism) or a
mixture of microorganisms. Representative photos of the different observations of microorganism
growth of the liquid culture are shown in Figure 4-1. For the blank bare wood and painted wallboard
paper, slime molds and other microorganisms completely covered the tryptic soy agar plate and were the
predominant organisms that were endogenous to the test coupons.
4.1.3 Qualitative Assessment of Biological Indicators and Spore Strips The commercial spore strip containing B. subtilis var niger (B. atrophaeus ATCC 9372) spores on paper
backing (manufactured by Raven Biological Laboratories), which were the same as those used during
decontamination of U.S. Postal Service facilities contaminated with B. anthracis, and biological
indicators containing G. stearothermophilus and B. subtilis (Apex Laboratories, Inc.) were included in
each decontamination test. Each of these biological indicators contains a spore population of
approximately 106 spores on a stainless steel disc packaged in a Tyvek® envelope. For all evaluations,
the control (not exposed to ClO2) biological indicators and control spore strips exhibited cloudy cultures
(suggesting bacterial growth) at 1 and 7 days. Clear cultures (suggesting no bacterial growth) were
observed at 1 and 7 days for the biological indicators and spore strips subjected to ClO2 exposure. A
representation of the data from a single test day is shown in Table 4-8.
11
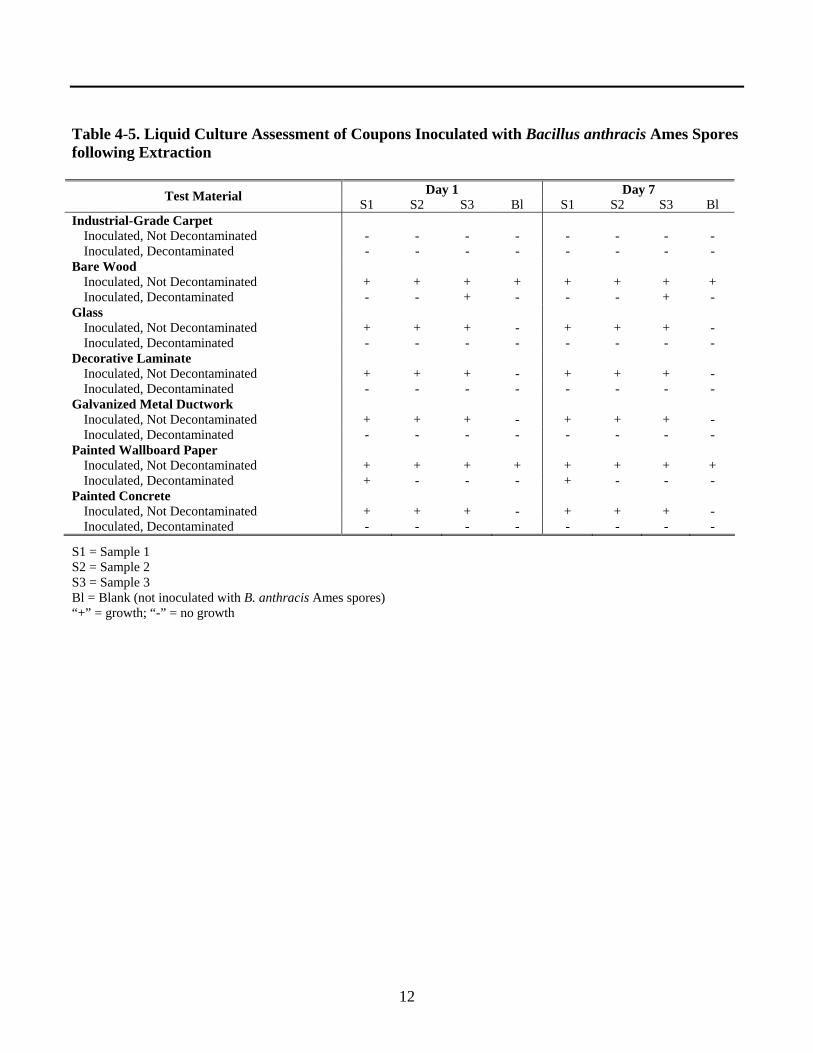
Table 4-5. Liquid Culture Assessment of Coupons Inoculated with Bacillus anthracis Ames Spores following Extraction
Day 1 Day 7 Test Material S1 S2 S3 Bl S1 S2 S3 Bl
Industrial-Grade Carpet Inoculated, Not Decontaminated - - - - - - - -
Inoculated, Decontaminated - - - - - - - -
Bare Wood Inoculated, Not Decontaminated + + + + + + + +
Inoculated, Decontaminated - - + - - - + -
Glass Inoculated, Not Decontaminated + + + - + + + -
Inoculated, Decontaminated - - - - - - - -
Decorative Laminate Inoculated, Not Decontaminated + + + - + + + -
Inoculated, Decontaminated - - - - - - - -
Galvanized Metal Ductwork Inoculated, Not Decontaminated + + + - + + + -
Inoculated, Decontaminated - - - - - - - -
Painted Wallboard Paper
Inoculated, Not Decontaminated + + + + + + + +
Inoculated, Decontaminated + - - - + - - -
Painted Concrete Inoculated, Not Decontaminated + + + - + + + -
Inoculated, Decontaminated - - - - - - - -
S1 = Sample 1
S2 = Sample 2
S3 = Sample 3
Bl = Blank (not inoculated with B. anthracis Ames spores)
“+” = growth; “-” = no growth
12
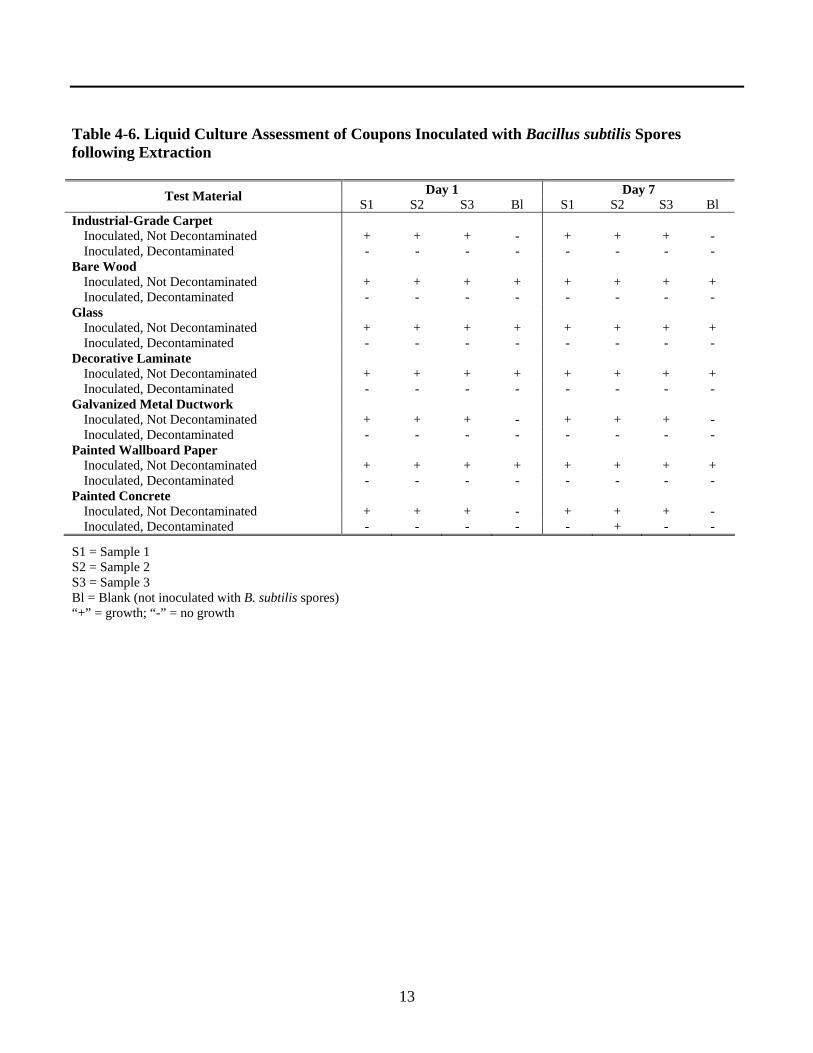
Table 4-6. Liquid Culture Assessment of Coupons Inoculated with Bacillus subtilis Spores following Extraction
Day 1 Day 7 Test Material S1 S2 S3 Bl S1 S2 S3 Bl
Industrial-Grade Carpet Inoculated, Not Decontaminated + + + - + + + -
Inoculated, Decontaminated - - - - - - - -
Bare Wood Inoculated, Not Decontaminated + + + + + + + +
Inoculated, Decontaminated - - - - - - - -
Glass Inoculated, Not Decontaminated + + + + + + + +
Inoculated, Decontaminated - - - - - - - -
Decorative Laminate Inoculated, Not Decontaminated + + + + + + + +
Inoculated, Decontaminated - - - - - - - -
Galvanized Metal Ductwork Inoculated, Not Decontaminated + + + - + + + -
Inoculated, Decontaminated - - - - - - - -
Painted Wallboard Paper
Inoculated, Not Decontaminated + + + + + + + +
Inoculated, Decontaminated - - - - - - - -
Painted Concrete Inoculated, Not Decontaminated + + + - + + + -
Inoculated, Decontaminated - - - - - + - -
S1 = Sample 1
S2 = Sample 2
S3 = Sample 3
Bl = Blank (not inoculated with B. subtilis spores)
“+” = growth; “-” = no growth
13
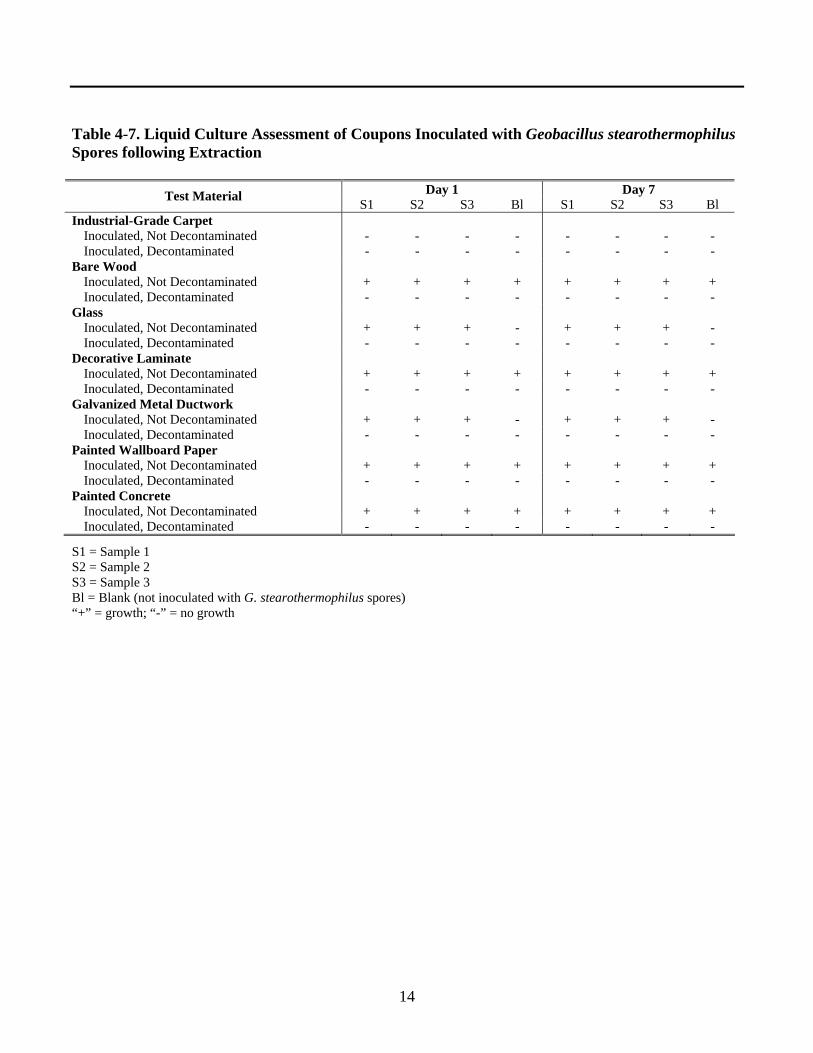
Table 4-7. Liquid Culture Assessment of Coupons Inoculated with Geobacillus stearothermophilus Spores following Extraction
Day 1 Day 7 Test Material S1 S2 S3 Bl S1 S2 S3 Bl
Industrial-Grade Carpet Inoculated, Not Decontaminated - - - - - - - -
Inoculated, Decontaminated - - - - - - - -
Bare Wood Inoculated, Not Decontaminated + + + + + + + +
Inoculated, Decontaminated - - - - - - - -
Glass Inoculated, Not Decontaminated + + + - + + + -
Inoculated, Decontaminated - - - - - - - -
Decorative Laminate Inoculated, Not Decontaminated + + + + + + + +
Inoculated, Decontaminated - - - - - - - -
Galvanized Metal Ductwork Inoculated, Not Decontaminated + + + - + + + -
Inoculated, Decontaminated - - - - - - - -
Painted Wallboard Paper
Inoculated, Not Decontaminated + + + + + + + +
Inoculated, Decontaminated - - - - - - - -
Painted Concrete Inoculated, Not Decontaminated + + + + + + + +
Inoculated, Decontaminated - - - - - - - -
S1 = Sample 1
S2 = Sample 2
S3 = Sample 3
Bl = Blank (not inoculated with G. stearothermophilus spores)
“+” = growth; “-” = no growth
14
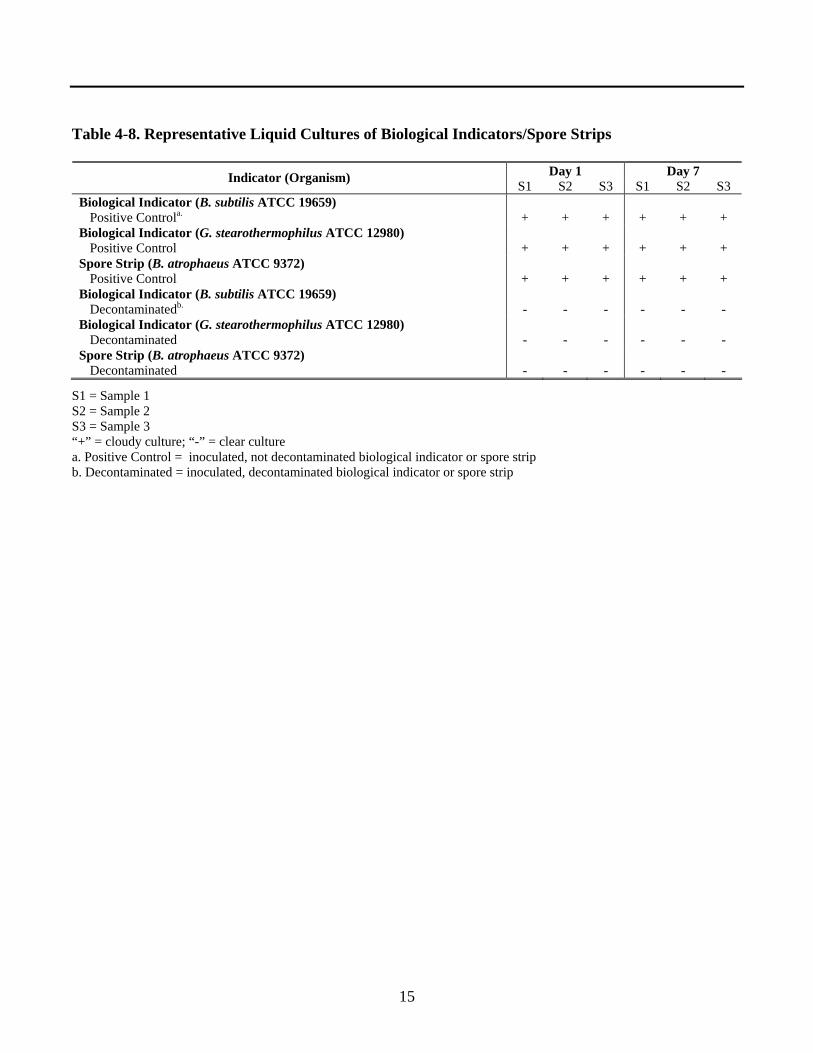
Table 4-8. Representative Liquid Cultures of Biological Indicators/Spore Strips
Day 1 Day 7 Indicator (Organism) S1 S2 S3 S1 S2 S3
Biological Indicator (B. subtilis ATCC 19659) Positive Control
a.+ + + + + +
Biological Indicator (G. stearothermophilus ATCC 12980) Positive Control + + + + + +
Spore Strip (B. atrophaeus ATCC 9372) Positive Control + + + + + +
Biological Indicator (B. subtilis ATCC 19659) Decontaminated
b.- - - - - -
Biological Indicator (G. stearothermophilus ATCC 12980) Decontaminated - - - - - -
Spore Strip (B. atrophaeus ATCC 9372) Decontaminated - - - - - -
S1 = Sample 1
S2 = Sample 2
S3 = Sample 3
“+” = cloudy culture; “-” = clear culture
a. Positive Control = inoculated, not decontaminated biological indicator or spore strip
b. Decontaminated = inoculated, decontaminated biological indicator or spore strip
15
A. Homogeneous B. anthracis Culture from
Figure 4-1. Repres
Inoculated Glass Control
B. Non-homogeneous Bacterial Culture from Inoculated Wood Control
C. Mixed Microbial Growth from an
e
Inoculated Painted Wallboard Paper Control
ntative Plated Liquid Culture Assessment Samples
16
4.2 Damage to Coupons
Before and after decontamination of the test coupons, the decontaminated coupons were visually
inspected; and any obvious changes in the color, reflectivity, and apparent roughness of the coupon
surfaces were recorded. No damage (e.g., change in surface texture, color) or visible change was
observed during this evaluation to any of the test coupons with the exception of industrial carpet.
Exposure to the ClO2 appeared to produce a bleaching effect (all colors in the multicolor weave were
affected) of the industrial carpet.
4.3 Other Factors 4.3.1 Operator Control
On each day of testing, the ClO2-generating solution was prepared fresh by mixing household Clorox®
bleach (5-6% sodium hypochlorite), 6N hydrochloric acid, 25% sodium chlorite, and distilled water
according to the vendor’s instructions. Titrations determined that in the ClO2-generating solutions
prepared, the ClO2 concentration ranged from 3642 to 4182 ppm and the chlorite concentration ranged
from 2934 to 3912 ppm.
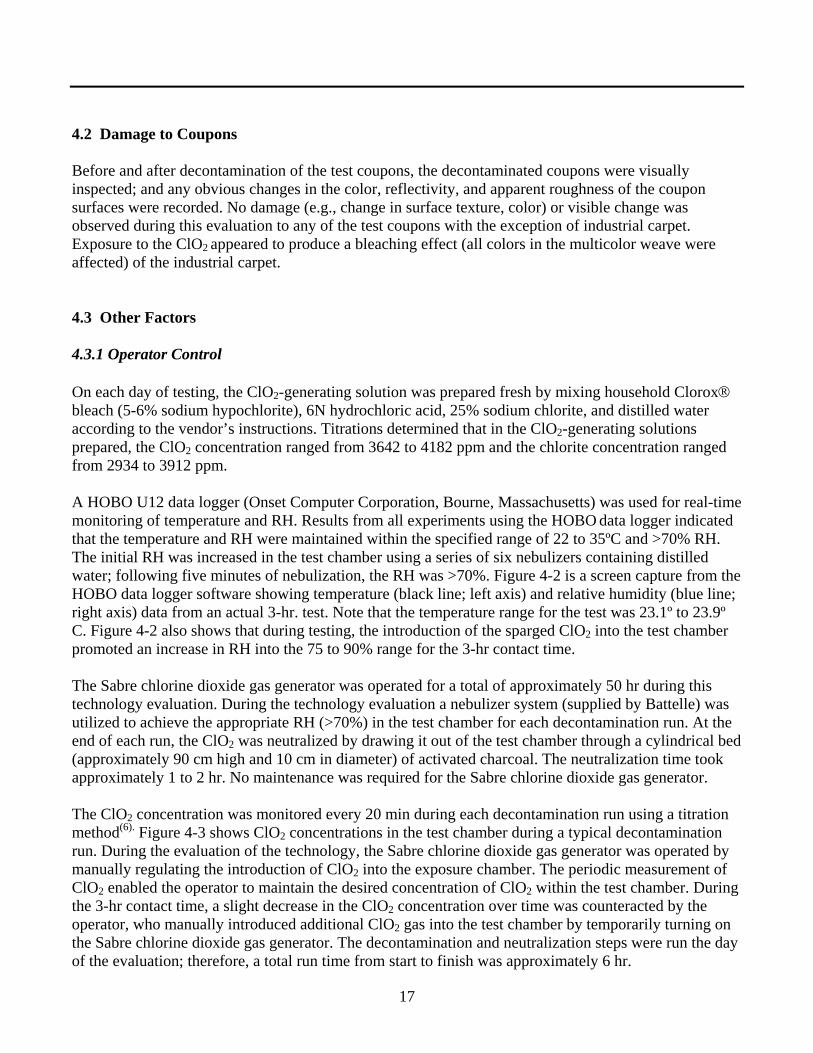
A HOBO U12 data logger (Onset Computer Corporation, Bourne, Massachusetts) was used for real-time
monitoring of temperature and RH. Results from all experiments using the HOBO data logger indicated
that the temperature and RH were maintained within the specified range of 22 to 35ºC and >70% RH.
The initial RH was increased in the test chamber using a series of six nebulizers containing distilled
water; following five minutes of nebulization, the RH was >70%. Figure 4-2 is a screen capture from the
HOBO data logger software showing temperature (black line; left axis) and relative humidity (blue line;
right axis) data from an actual 3-hr. test. Note that the temperature range for the test was 23.1º to 23.9º
C. Figure 4-2 also shows that during testing, the introduction of the sparged ClO2 into the test chamber
promoted an increase in RH into the 75 to 90% range for the 3-hr contact time.
The Sabre chlorine dioxide gas generator was operated for a total of approximately 50 hr during this
technology evaluation. During the technology evaluation a nebulizer system (supplied by Battelle) was
utilized to achieve the appropriate RH (>70%) in the test chamber for each decontamination run. At the
end of each run, the ClO2 was neutralized by drawing it out of the test chamber through a cylindrical bed
(approximately 90 cm high and 10 cm in diameter) of activated charcoal. The neutralization time took
approximately 1 to 2 hr. No maintenance was required for the Sabre chlorine dioxide gas generator.
The ClO2 concentration was monitored every 20 min during each decontamination run using a titration
method(6).
Figure 4-3 shows ClO2 concentrations in the test chamber during a typical decontamination
run. During the evaluation of the technology, the Sabre chlorine dioxide gas generator was operated by
manually regulating the introduction of ClO2 into the exposure chamber. The periodic measurement of
ClO2 enabled the operator to maintain the desired concentration of ClO2 within the test chamber. During
the 3-hr contact time, a slight decrease in the ClO2 concentration over time was counteracted by the
operator, who manually introduced additional ClO2 gas into the test chamber by temporarily turning on
the Sabre chlorine dioxide gas generator. The decontamination and neutralization steps were run the day
of the evaluation; therefore, a total run time from start to finish was approximately 6 hr.
17
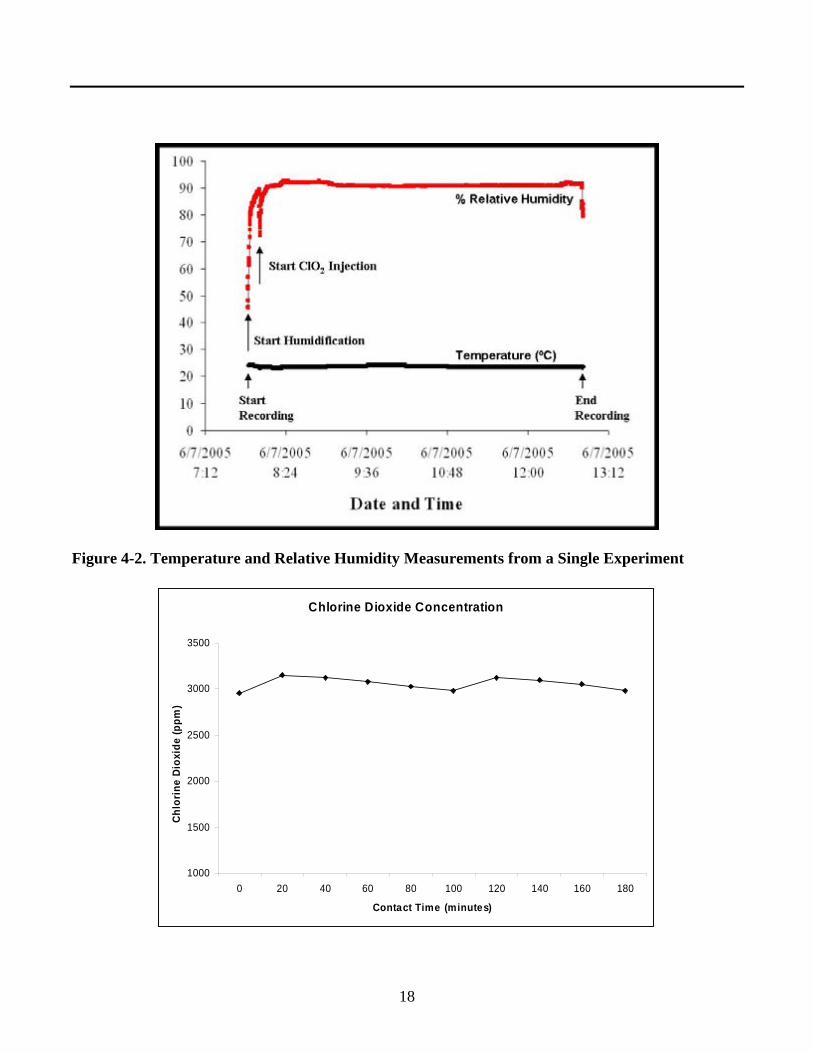
Figure 4-2. Temperature and Relative Humidity Measurements from a Single Experiment
Chlorine Dioxide Concentration
1000
1500
2000
2500
3000
3500
0 20 40 60 80 100 120 140 160 180
Contact Time (minutes)
Chlo
rine
Diox
ide
(ppm
)
18
Figure 4-3. Representative Chlorine Dioxide Concentration from a Single Experiment
19
5.0 Performance Summary
• The results of all decontamination tests of the Sabre chlorine dioxide gas generator were the
same – no viable spores were found in extracts of any test coupons contaminated with B. anthracis Ames, B. subtilis (ATCC 19659), and G. stearothermophilus (ATCC12980) spores
after decontamination by the Sabre chlorine dioxide gas generator.
• With no viable spores extracted from any test coupon, mean log reduction values were
unbounded but have been conservatively reported (by replacing the “0” value with “1” in the
efficacy calculation) to be at least 7.14, 6.73, and 6.25 for B. anthracis Ames, B. subtilis, and G. stearothermophilus respectively (these are the maximum values that can be achieved within the
limits of the evaluation).
• The Sabre chlorine dioxide gas generator demonstrated statistically significant decontamination
efficacy for each of the three test organisms on all seven types of test coupons. Because of the
lack of any detectable viable organisms after decontamination, it was not possible to determine
or draw conclusions about the differential efficacy between agent/surrogates and material groups.
• While no viable spores were extracted from any test coupon after decontamination, differences in
the initial number of spores on the coupons resulted in decontamination efficacy values varying
across the seven test coupons for all three organisms. For B. anthracis Ames, there was a mean
log reduction in viable spores from every test coupon of at least 7.1.
• To assess whether or not viable spores remained in or on the coupons following decontamination
and subsequent extraction (to quantitate extractable, viable spores), both extracted control and
extracted decontaminated coupons were placed in tryptic soy broth and incubated for 7 days. The
contents of the tubes were examined at 1 and 7 days for cloudiness as an indicator of growth. In
most cases, qualitative analysis showed that viable residual organisms were not present on the
decontaminated and extracted coupons.
• However, in a few cases, this qualitative analysis indicated that viable inoculated or other
endogenous microorganisms in or on the test coupons were still present after decontamination
and extraction. For the decontaminated samples, cloudy cultures were observed in only three
coupons (bare wood, painted wallboard paper, and painted concrete) at days 1 and 7 (see Tables
4-4 and 4-5). These results suggest that in most of the inoculated coupons subjected to ClO2
exposure, no viable organisms were present on the coupons following decontamination and
extraction.
20
• In a few cases, growth was observed in tubes containing blank and control coupons and in these
instances, a sample of the culture was further analyzed by plating on tryptic soy agar and
incubating the plates overnight.
• In most cases, the organisms from the liquid cultures that grew on the plates demonstrated
morphology consistent with that of the organism used for inoculation. However, in some cases
these samples demonstrated a range of microorganism growth, particularly in the case of the bare
wood and painted wallboard paper test coupons, were mold and other microorganisms were
found.
• The growth on the non-inoculated decontaminated blanks may have been due to ineffective
disinfection (the 70% isopropanol wipe did not sterilize the internal portions of the coupons)
prior to inoculating the coupons.
• A qualitative evaluation of the performance of the Sabre chlorine dioxide gas generator showed
that the control (not exposed to ClO2) biological indicators and spore strips cultured in tryptic
soy broth displayed growth (cloudy) at both 1 and 7 days.
• Cultures of biological indicators and spore strips exposed to ClO2 displayed no growth (clear) at
1 and 7 days. Based on these results, the Sabre chlorine dioxide gas generator inactivated in all
cases spore loads of approximately 1 x 10⁶ spores per indicator or spore strip.
• The only visual damage observed for any of the test coupons subjected to the Sabre chlorine
dioxide gas generator was a bleaching effect on the industrial carpet.
21
6.0 References
1. Technology Testing and Evaluation Program Test/QA Plan for Evaluation of Sporicidal Decontamination Technologies, Version 1, Battelle, Columbus, Ohio, February 2005.
2. Quality Management Plan (QMP) for the Technology Testing and Evaluation Program (TTEP), Version 1, Battelle, Columbus, Ohio, January 2005.
3. Rogers JV, Sabourin CL, Taylor ML, Riggs K, Choi YW, Richter WR, Rudnicki DC.
BIOQUELL, Inc. Clarus™ Hydrogen Peroxide Gas Generator. Report submitted to U.S. EPA
Environmental Technology Verification, Building Decontamination Technology Center, March
2004. (http://www.epa.gov/etv/verifications/vcenter11-1.html).
4. Rogers JV, Sabourin CL, Taylor ML, Riggs K, Choi YW, Richter WR, Rudnicki DC.
CERTEK® Inc. 1414RH Formaldehyde Generator/Neutralizer. Report submitted to U.S. EPA
Environmental Technology Verification, Building Decontamination Technology Center, August
2004, (http://www.epa.gov/etv/verifications/vcenter11-2.html).
5. Rogers JV, Sabourin CL, Taylor ML, Riggs K, Choi YW, Richter WR, Rudnicki DC.
CDG TECHNOLOGY, Inc. Bench-Scale Chlorine Dioxide Generator: Biological Agent
Decontamination. Report submitted to U.S. EPA Environmental Technology Verification, Building
Decontamination Technology Center, September 2004,
(http://www.epa.gov/etv/verifications/vcenter11-3.html).
6. American Water Works Association Method 4500-ClO2E, “Chlorine Dioxide by
Amperometric Method II”, (modified).
22