EVALUATING EFFECTIVENESS OF BEST MANAGEMENT … · - 1 - SECTION 319 NONPOINT SOURCE POLLUTION...
117
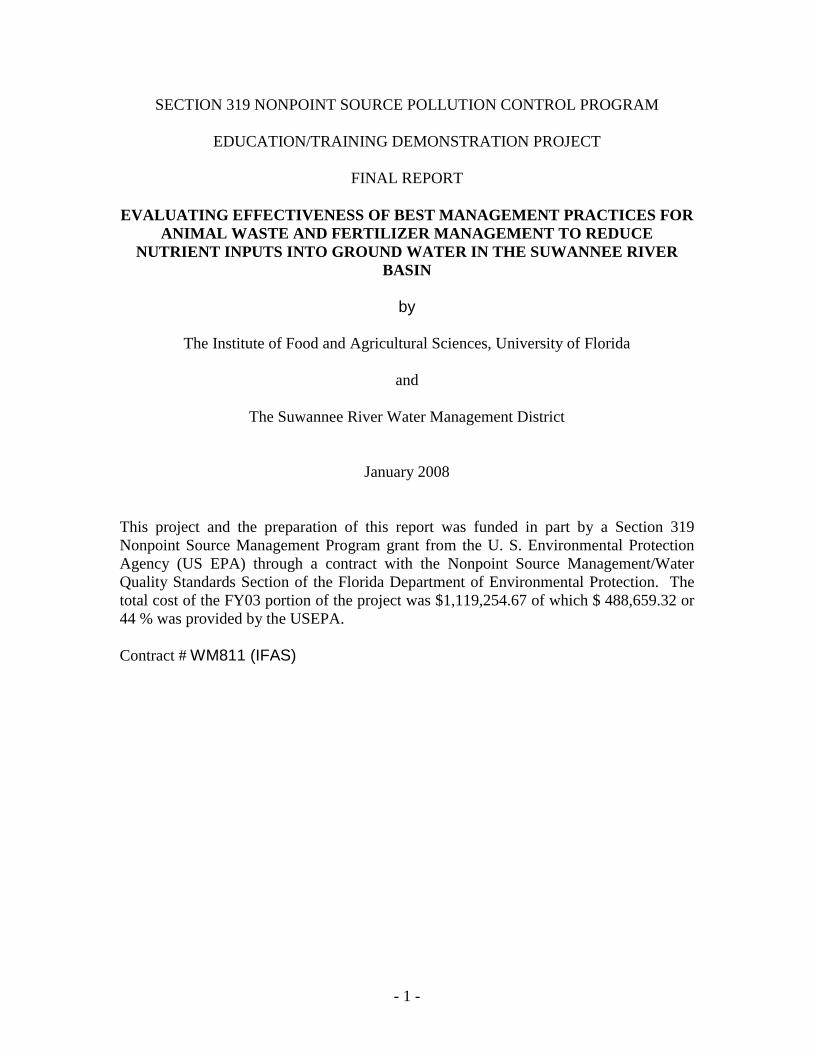
- 1 - SECTION 319 NONPOINT SOURCE POLLUTION CONTROL PROGRAM EDUCATION/TRAINING DEMONSTRATION PROJECT FINAL REPORT EVALUATING EFFECTIVENESS OF BEST MANAGEMENT PRACTICES FOR ANIMAL WASTE AND FERTILIZER MANAGEMENT TO REDUCE NUTRIENT INPUTS INTO GROUND WATER IN THE SUWANNEE RIVER BASIN by The Institute of Food and Agricultural Sciences, University of Florida and The Suwannee River Water Management District January 2008 This project and the preparation of this report was funded in part by a Section 319 Nonpoint Source Management Program grant from the U. S. Environmental Protection Agency (US EPA) through a contract with the Nonpoint Source Management/Water Quality Standards Section of the Florida Department of Environmental Protection. The total cost of the FY03 portion of the project was $1,119,254.67 of which $ 488,659.32 or 44 % was provided by the USEPA. Contract # WM811 (IFAS)
Transcript of EVALUATING EFFECTIVENESS OF BEST MANAGEMENT … · - 1 - SECTION 319 NONPOINT SOURCE POLLUTION...
- 1 -
SECTION 319 NONPOINT SOURCE POLLUTION CONTROL PROGRAM
EDUCATION/TRAINING DEMONSTRATION PROJECT
FINAL REPORT
EVALUATING EFFECTIVENESS OF BEST MANAGEMENT PRACTICES FOR ANIMAL WASTE AND FERTILIZER MANAGEMENT TO REDUCE
NUTRIENT INPUTS INTO GROUND WATER IN THE SUWANNEE RIVER BASIN
by
The Institute of Food and Agricultural Sciences, University of Florida
and
The Suwannee River Water Management District
January 2008
This project and the preparation of this report was funded in part by a Section 319 Nonpoint Source Management Program grant from the U. S. Environmental Protection Agency (US EPA) through a contract with the Nonpoint Source Management/Water Quality Standards Section of the Florida Department of Environmental Protection. The total cost of the FY03 portion of the project was $1,119,254.67 of which $ 488,659.32 or 44 % was provided by the USEPA. Contract # WM811 (IFAS)
- 2 -
EXCUTIVE SUMMARY
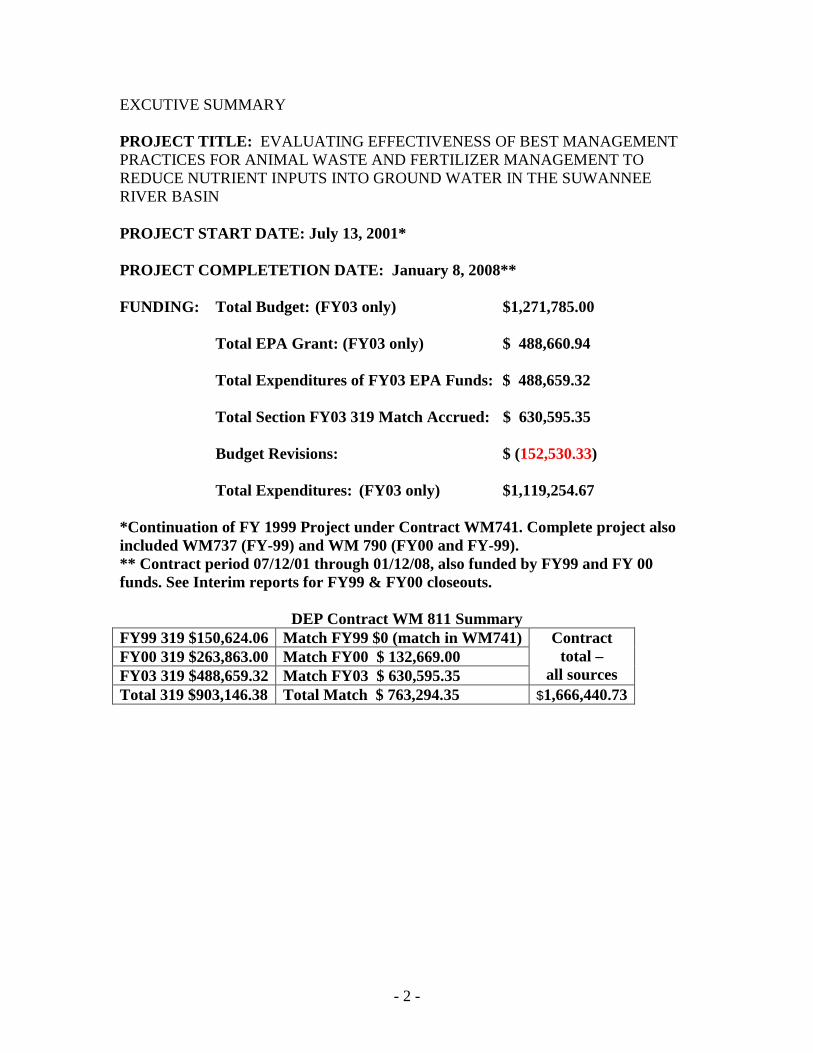
PROJECT TITLE: EVALUATING EFFECTIVENESS OF BEST MANAGEMENT PRACTICES FOR ANIMAL WASTE AND FERTILIZER MANAGEMENT TO REDUCE NUTRIENT INPUTS INTO GROUND WATER IN THE SUWANNEE RIVER BASIN PROJECT START DATE: July 13, 2001* PROJECT COMPLETETION DATE: January 8, 2008** FUNDING: Total Budget: (FY03 only) $1,271,785.00 Total EPA Grant: (FY03 only) $ 488,660.94 Total Expenditures of FY03 EPA Funds: $ 488,659.32 Total Section FY03 319 Match Accrued: $ 630,595.35 Budget Revisions: $ (152,530.33) Total Expenditures: (FY03 only) $1,119,254.67 *Continuation of FY 1999 Project under Contract WM741. Complete project also included WM737 (FY-99) and WM 790 (FY00 and FY-99). ** Contract period 07/12/01 through 01/12/08, also funded by FY99 and FY 00 funds. See Interim reports for FY99 & FY00 closeouts.
DEP Contract WM 811 Summary FY99 319 $150,624.06 Match FY99 $0 (match in WM741)FY00 319 $263,863.00 Match FY00 $ 132,669.00 FY03 319 $488,659.32 Match FY03 $ 630,595.35
Contract total –
all sources Total 319 $903,146.38 Total Match $ 763,294.35 $1,666,440.73

- 3 -
SUMMARY of ACCOMPLISHMENTS This demonstration project consisted of three parts as noted below. Part one was the main component of the project while parts two and three were subsequently added to the project during renewal phases. Part 1. EVALUATING EFFECTIVENESS OF BEST MANAGEMENT PRACTICES FOR ANIMAL WASTE AND FERTILIZER MANAGEMENT TO REDUCE NUTRIENT INPUTS INTO GROUND WATER IN THE SUWANNEE RIVER BASIN Pre- and post-BMP monitoring of groundwater and soil nitrate concentrations were conducted at representative farm scale sites (row crop farm, poultry farm, and dairy farm) under actual production conditions to document and verify the effectiveness of selected BMPs. Monitoring wells were installed at the farms to provide coverage of the various components of each farm. Well depth was selected to sample ground water as it entered the aquifer, i.e., the upper meter of the aquifer. The soil profile, to the depth of the continuous clay layer, was sampled at depth intervals of 0.5-m intervals to a depth of 2 m followed by 1-m intervals to the clay layer. Row Crop Farm BMPs were demonstrated on a 140 acre center pivot irrigated field where the landowner applied normal practices on half of the field and project-selected BMPs were used on the other half of the field. BMPs consisted of reduction in fertilizer amounts and improved timing of fertilizer applications to anticipate crop needs. Irrigation BMPs were designed to better reflect environmental (ET and rainfall) and soil moisture conditions. As part of the irrigation management program, new nozzles were installed on the center pivot irrigation systems. These new nozzles were designed to cause less bed erosion and yet have high efficiency and uniformity. These nozzles have produced the desired results as evaluated by the Suwannee River Mobil Irrigation Laboratory and are now being recommended by many of the irrigation equipment dealers in the watershed. Overall, there were only small decreases in groundwater nitrate concentrations in the BMP side of the field compared to the grower-managed side. On an annual basis, reductions ranged from 5.4 to 21.1% with an average over the whole period of 13.0%. Average soil profile nitrate concentrations (2 m depth) at the vegetable farm reflected the cropping activities on the field. Highest concentrations were observed during the periods when potatoes and sweet corn were grown reflecting the high fertilizer use with these crops. We were not able to achieve differences in soil nitrate-N concentrations between the farmer-managed and project-managed sides of the pivot. The relatively small differences in amount of N applied between the two halves of the pivot have made it difficult to see differences in both soil and groundwater nitrate-N concentrations. However, we observed a continuing trend in decreasing soil nitrate-N concentrations for both the grower-managed and BMP sides of the field through 2005. This may be attributed to the farmer fine tuning his fertilization and irrigation practices each year so

- 4 -
that both management programs have resulted in lower soil nitrate-N concentrations each year. The increase observed in 2006 can be attributed to higher amounts of N fertilizer applied to both sides of the pivot because the grower had difficulty keeping on top of the fertilizer management protocol develop for one of his crops. Crop yield and quality were not adversely effected by any of the BMPs implemented. In fact, in the case of the potato crops, potato quality was improved because the improved irrigation management reduced the number on lenticels resulting in more potatoes being graded as marketable. Based on the improved efficient use of both fertilizer and irrigation water, it is anticipated that an additional small reductions in groundwater nitrate concentrations will be observed over time. If the soil nitrate-N concentrations are a pre-indicator of what we will eventually see in the groundwater, we should soon see decreasing nitrate-N concentrations in the groundwater over the entire field. Because of the environmental conditions present in the basin (sandy soils, karst topography, intense leaching rainfall) it may be difficult to achieve acceptable nitrate conditions without the implementation of additional BMPs. The use of additional BMPs such as slow-release fertilizers are likely to have significant economic implications for the producers. Our activities have resulted in the development of crop management guides for potatoes and sweet corn crops. These guides are farmer-friendly and were developed to allow the farmer and his field supervisors to implement the plans with minimum input from external aid. The soil, crop and groundwater data were used to test and calibrate models that predict water and nitrate movement through the root and vadose zones. Two existing models, the DSSAT crop model and the Leaching Estimation and Chemistry Model (LEACHM) were used. DSSAT is a shell tool containing several crop models. The SUBSTOR potato model contained within the DSSAT shell was used to predict N and water uptake/leaching in the root zone, evapotranspiration, as well as crop yield and phenological response to water and nutrient management practices. The LEACHM model is a hydrologic model that has more rigorous vadose zone and water flow and contaminant transport routines than the DSSAT model. LEACHM was used to predict water/nitrogen transport within the root zone, through the vadose zone, and to the groundwater. Both model predictions and measured data demonstrated the rapid leaching caused by rains and/or over-irrigation in the well-drained sandy soils at the row crop site. The model demonstrated that in general fertilizer applications are completely leached below the root zone within two weeks of the application. Rapid leaching due to applied irrigation can be avoided by taking precautions to insure no excess water is applied above field capacity which lies at about 6-7% volumetric water content for soil at the row crop site. Modeling results suggested that irrigation historically applied by the farmer could be cut by as much as 30% without stressing the plants. Model predictions and measured

- 5 -
data both indicate only about 30% of the N applied was taken up by the potatoes, which is supported by the literature reviewed. After the model was tested against the observed field data, it was used to predict crop and water quality response for alternative management practices. The results show that by reducing the amount of irrigation, reducing the fertilizer application rate, and improving the timing of fertilizer applications, nitrogen leaching could be reduced by approximately 50% while maintaining acceptable crop yields. Yields seem to stabilize at around the 225 kg N/ha fertilizer rate which is the IFAS recommendation (a reduction of 29% from historic management practices). However, all scenarios modeled indicate that average nitrate concentrations leaching below the root zone will exceed the EPA MCL of 10 mg/L NO3-N during the potato cropping season, even with BMPs implemented during the 2002 season. Thus, it is important to recognize that a cropping system that rotates crops requiring high amount of N with crops requiring low amounts of N, such as various cover crops, peanuts, and cotton may be required to meet the EPA MCL. Poultry Farm A Poultry Farm Conservation Plan was developed by the Natural Resource Conservation Service (NRCS). The BMPs consisted of building a waste storage facility to provide protected temporary storage of litter obtained from one complete house cleanout, a composting facility within the waste storage facility to compost bird mortality, a waste utilization plan to provide recommendations for the amount and timing of application of waste to meet crop nutrient requirements, and fencing to keep grazing animals out of sensitive waters such as sinkholes and wetlands on the property. The NRCS conservation plan, which was implemented in late 2001, calls for more uniform manure application on the various fields. The plan also calls for improved timing of application to coincide better with crop uptake. Groundwater nitrate concentrations at the poultry farm have been the lowest of the three farms being monitored. Average nitrate concentrations ranged between 5 and 12 mg /L nitrate-N. At this time, we have not observed an effect of BMP practices on groundwater quality. However, soil nitrate-N levels have decreased in all components of the poultry farm since the initiation of the BMP program. For example, the amount of nitrate-N in the soil profile (1-m depth), averaged over all farm components was 76 and 26 kg/ha for the years 2000 and 2006, respectively. We feel that this is a precursor of what will eventually be observed in the groundwater. Dairy Farm An animal waste management system and associated operation and maintenance plan was developed for Byrd Dairy by the NRCS. Development of this plan was initiated in early 2000 and went through several iterations until it was finalized in July 2003. During the early stages of plan development, NRCS determined that they could improve on certain aspects of the plan based on experiences with similar plans that were recently implemented on other dairies in the region. In addition, geologic investigations revealed that the clay content of the in-situ soil was not adequate to allow construction of an earthen waste storage pond in accordance NRCS guidelines. These issues both resulted in

- 6 -
delays in completing the plan. Additional delays were encountered when the land owners requested changes in the plan that would better accommodate their farming operation. An acceptable plan to all parties was agreed upon during Fall 2003 but implementation was not initiated until October, 2007. Groundwater nitrate concentrations at the dairy farm were the highest of the land-uses monitored. Average nitrate-N concentrations for the dairy ranged from 30 to 50 mg/L. The highest concentrations (often over 100 mg/L nitrate-N) were observed in one of the wells near the lagoon and in the denuded areas where cattle are feed and lounge before milking. The lowest concentrations were observed in the area that is going to become the sprayfield. These concentrations were generally 20 mg/L or below except when lagoon slurry was applied during the lagoon cleanout process. There were small, but consistent, increases in nitrate concentrations in the sprayfield shortly after slurry application. This suggests that nutrient management plans will have to be followed very carefully on the sprayfield to minimize any effects of nutrients from the irrigated lagoon effluent. Also, groundwater nitrate concentrations may be slow to respond to implemented BMPs at the dairy farm due to the large residual of nitrogen that is present in these soils. Part two. Forage Interim Measure for Nitrogen-based Fertilizers for the Suwannee
River Basin (SRB) The Florida Department of Agricultural and Consumer Services (FDACS) has implemented an “interim measure” for the fertilization of forages in the SRB designed to minimize groundwater quality effects. A demonstration site at the North Florida REC - Suwannee Valley was established in 2001 on a 6.5 acre field to evaluate the effect of the forage interim measure protocol for nitrogen fertilization of new plantings and, subsequently, established stands of Bermudagrass, on groundwater nitrate-N concentrations. Twenty monitoring wells were drilled into the surficial water table. These wells were sampled monthly and the samples were analyzed for nitrate-N. In addition, a seepage spring in a wooded area downstream from the field was sampled at the same time. Soil was sampled to the water table depth at approximately 6-week intervals. Samples were analyzed for ammonium and nitrate. The IFAS protocol for bermudagrass forage production was followed for the N fertilization program. The total amount of N fertilizer for each year ranged from 346 to 433 lb/ac. The higher amounts reflect extra N applied due to oats overseeding during the winter months. Yields ranged from 13,330 to 14,740 lb/ac/year. These yields are mid-way between optimum season and dry season estimated bermudagrass yields in Florida. Recovery of added (N uptake/N applied) ranged from 53 to 66%. The recoveries compare favorably with typical recoveries estimated for Bermudagrass production in Florida. During the initial establishment phases of the Bermudagrass stand, groundwater and spring nitrate-N concentrations were less than 0.2 mg/L. As the regular fertilization program was established in 2003, groundwater nitrate-N concentrations started to increase although considerable fluctuation was observed. The highest average nitrate-N

- 7 -
concentration of ~ 4 mg/L for all wells combined was observed in 2005. Nitrate-N concentrations in the seepage spring also showed increasing trend through 2005. The general trend of increasing nitrate-N concentrations in the groundwater was largely driven by wells in one part of the field, i.e., the eastern end of the field near the wooded area. To evaluate this in more detail, we divided the monitoring wells into transects across the field. It was evident that nitrate-N concentrations for transect 5 wells were higher than concentrations for wells in transects 1-4. The higher concentrations in transect 5 may be related to excess application of fertilizer due to spreader turn-around issues in this area although this cannot be confirmed. This situation was eventually mitigated and nitrate-N concentrations in transect 5 showed a declining trend by the end of the study. Not considering the wells in transect 5, the average pre- and post-fertilization nitrate-N concentrations were 0.12 and 0.77 mg N/L. Thus, the IFAS-recommended fertilization program did increase slightly the nitrate-N concentrations in the groundwater. However, we believe that these increases are smaller than would be caused by most any other anthropogenic activity on the land, whether it be agricultural or residential. Part three. BMP Verification Monitoring Wells at Selected Poultry Farms The Florida Department of Environmental Protection (FDEP) and the Florida Department of Agricultural and Consumer Services (FDACS) determined that groundwater monitoring was needed for verification of poultry BMP efficacy in the Suwannee River Basin. This project was funded to sample the wells and provide nitrate-N analyses on a monthly basis. Evaluation and interpretation of the data is the responsibility of FDEP and is not included in this report. Five poultry farms that had approved nutrient management plans in place were selected jointly by FDEP and FDACS for groundwater monitoring. Monitoring wells were installed on each of the farms by the Suwannee River Management District. Site selection of the wells on the individual farms was based on locations that would represent groundwater incoming to the farms, locations representing certain activities on the farms (e.g., land application of manure), and locations represent groundwater leaving the farm. This selection was done by a team of FDEP and FDACS personnel. Sampling of the poultry farm wells was started in March 2005. Average NO3-N concentrations for individual wells ranged from < 1 to 13 mg/L. Visual examination of the plotted NO3-N values suggests that a three of the wells showed possible decreasing trends (Durden well #4, Edwards well #2, Hass well # 4) and two showed possible increasing trends (Edwards well #3 and Primm well #1). Concentrations in the other wells were either stable or variable with no obvious trends. Ammonium N concentrations were always < 1 mg/L NH4-N and were generally < 0.2 mg/L NH4-N. SRP concentrations were initially relatively high in all the wells. We believe this is likely due to the P content of the drilling muds used in the well installation process. Therefore, average SRP concentrations were based on data from 6/20/06 to 10/02/07. During this time period the overall average SRP concentration for all wells was 0.08 mg/L SRP and the average for individual wells did not exceed 0.5 mg/L SRP.

- 8 -
1.0 INTRODUCTION The project was conducted in the Lower Suwannee River Basin (HUC #03110205), but focus was on the sub-basin, defined by the USDA NRCS, known as the Middle Suwannee River Basin (Figure 1). This is one of Florida’s priority restoration watersheds as set forth in the Unified Watershed Assessment. The project is consistent with the restoration strategies set forth in the Suwannee River Surface Water Improvement and Management (SWIM) Plan. Water quality has been the subject of concern and attention in the Suwannee River Basin for a number of years. Recent data have indicated increasing concentration of nutrients in ground water, spring water, and private drinking water wells. This has brought a needed focus to agency efforts to find nutrient management solutions to the problem. In addition, the state’s participation in the Total Maximum Daily Load (TMDL) Program will require new initiatives for managing nonpoint sources (e.g., for nutrients) for agriculture, and for measuring the use and effectiveness of nonpoint source controls. As a result, public agencies and the agricultural community took the lead in implementing a watershed-based process for BMP development, demonstration, refinement, and implementation to reduce nutrient loadings to ground water and surface water, involving stakeholders throughout the basin. These cooperators have formed the Suwannee River Basin Nutrient Management Working Group (SRBNMWG) and developed an overall basin agreement. Each cooperating agency allocated certain resources toward development, implementation, tracking, and evaluation of BMPs under the agreement. To better address the surface- and groundwater quality concerns in the Lower Suwannee River Basin, the SRBNMWG has been formed. It consists of the following agencies and organizations: • Florida Department of Agriculture and
Consumer Services • Florida Department of Environmental
Protection • Suwannee River Water Management
District • Florida Department of Community Affairs
• Florida Agricultural and Mechanical University
• University of Florida (IFAS)
• Lafayette Soil and Water Conservation District
• Suwannee Soil and Water Conservation District
• Natural Resources Conservation Service (USDA)
• United States Geological Survey (Florida District)
• Florida Cattlemen’s Association • Florida Farm Bureau Federation • Florida Fertilizer and Agrichemical
Association • Florida Forestry Association
• Florida Poultry Federation, Inc. • Florida Rural Water Association • Florida Septic Tank Association • Gold Kist • Sunshine State Milk Producers • Florida Department of Health

- 9 -
Figure 1. The Suwannee River Basin highlighting the Middle Suwannee River Basin, the location of this project.
In addition to the listed entities, the SRBNMWG is open to anyone or to any entity wishing to participate or contribute. The SRBNMWG was formed to help better coordinate the many ongoing water quality management activities and research efforts
- 10 -
within the basin and to better promote strong partnerships between government agencies and the agricultural community. The SRBNMWG has established the following mission:
“Assess sources of nutrient load to the Suwannee River Basin and optimize reductions in loadings to waters of the basin emphasizing voluntary, incentive-based programs for protecting the environment and public health.”
Stakeholder education and information sharing was provided to basin landowners, producers, local governments, and other interested stakeholders with information on the SRBNMWG initiative, progress with adoption of improved practices, resource materials, and other information. Outreach was conducted by annual presentations (or poster) at the Suwannee Valley Education Research Center Field Day (150 - 300 people), Suwannee Valley Field and Greenhouse Vegetable Short course and tradeshow (300 - 400 people) and video/slides of the BMPs evaluated. Pre- and post-BMP monitoring of groundwater and soil nitrate-N concentrations were conducted at representative farm scale sites (vegetable/row crop farm, dairy farm, and poultry farm) under actual production conditions to document and verify the effectiveness of selected BMPs (Table 1). Ground water monitoring wells were installed at the farms to provide coverage of the various components of each farm (Figures 2-4). The management issues for each farm and the proposed BMPs to address these issues are shown in Tables 2-4. Table 1. Description, number of monitoring wells and soil classification for the project farms.
Farm Farm Description Ground water monitoring wells Soil Classification
Vegetable/row crop 57 hectare (140 acre) field irrigated by a center pivot system
14 wells (10 m, 32 ft) Typic Quartzisamments
Dairy 500 cow dairy with milking parlor and lagoon
20 wells (9 m, 30 ft)
Grossarenic Paleudults Typic Quartzisamments
Poultry 22,000 birds/flock, six flocks/year, 412 tons litter/year, 6% mortality
18 wells (21 m, 70 ft)
Grossarenic Paleudults
Table 2. Summary of management issues and how they were addressed by the grower and the BMP program at the row crop farm.
Management Issue Grower Program* BMP Program* Fertilization Management Fertilizer application rates and timing
determined by grower tradition Fertilization program negotiated with the grower with the intent of approaching university guidelines
Irrigation Management Crops irrigated with minimal regard to soil moisture content and crop water requirements
Crops irrigated based on soil moisture content and crop water requirement
* The project was allocated a 57 hectare (140 acre) field irrigated with a center pivot system. The fertilization and irrigation program for half the field was determined by the grower while the program for the second half was designed by project personnel. The grower was generally responsible for implementing both programs.
- 11 -
Table 3. Summary of management issues at the dairy farm showing the pre- and post-BMP scenarios.
Management Issue Pre-BMP Post-BMP Collection and storage of wastes from
milking parlor Waste from milking parlor collected in non-lined lagoon
Lined lagoon constructed*
Manure accumulation in cattle feeding and holding area
Runoff allowed to drain offsite Free stall barn constructed with facilities to collect waste into lined lagoon*
Grazing pasture management Minimal use of grazing pastures Pasture area redesigned to allow herd rotation between pastures
Utilization of nutrients from lagoon effluent
Lagoon effluent was never utilized; evaporation and leakage was sufficient to balance input
Effluent land-applied according to NRCS nutrient management plan
*Lagoon and free stall barn have not been completed at this time.
Table 4. Summary of management issues at the poultry farm showing the pre- and post-BMP scenarios.
Management Issue Pre-BMP Post-BMP Litter storage No litter storage facility Stored under cover and applied per
NRCS crop nutrient management plan Bird mortality Dead birds buried in the ground near
bird houses Composed within the waste storage facility and land applied
Land application of litter Litter spread at time of house clean-out without regard to crop needs and weather
Litter applied according to NRCS nutrient management plan taking into account crop N requirements and timing of application relative to crop needs and weather
Sensitive water bodies (sinkholes and wetlands)
Cattle allowed to graze without restrictions
All sensitive water bodies fenced to exclude cattle

- 12 -
Figure 2. Location of water monitoring and soil sampling sites at the row crop farm (Suwannee Farms).
- 13 -
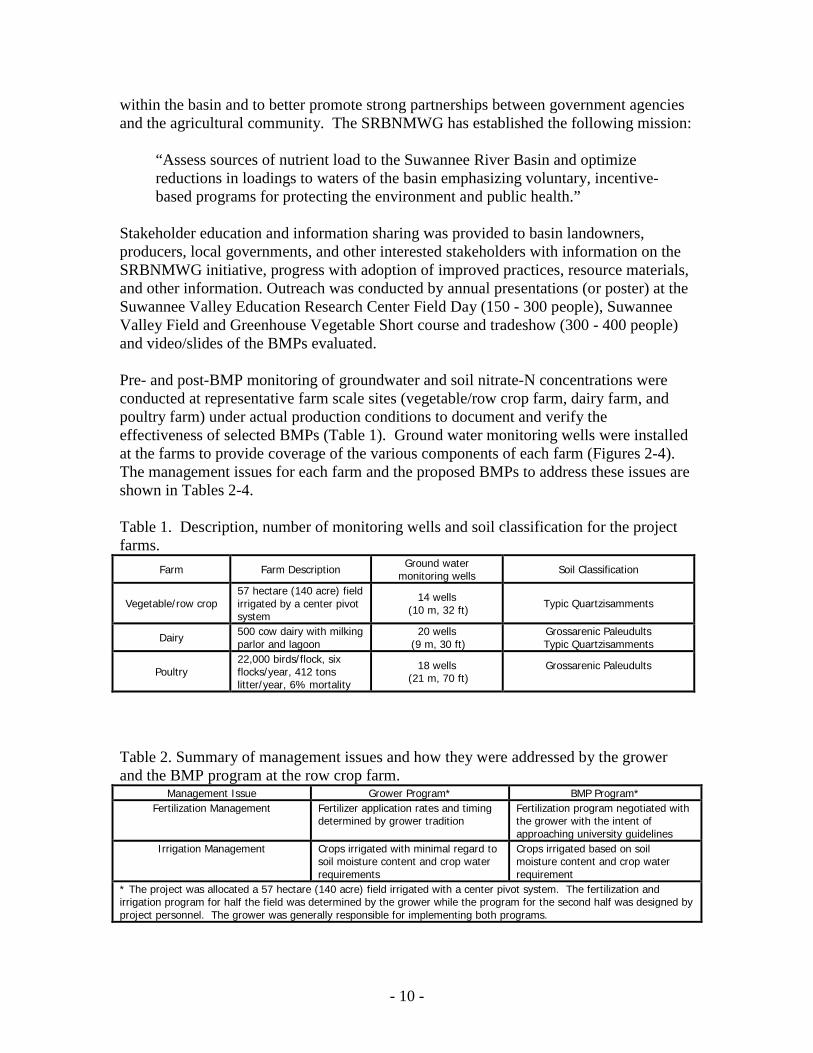
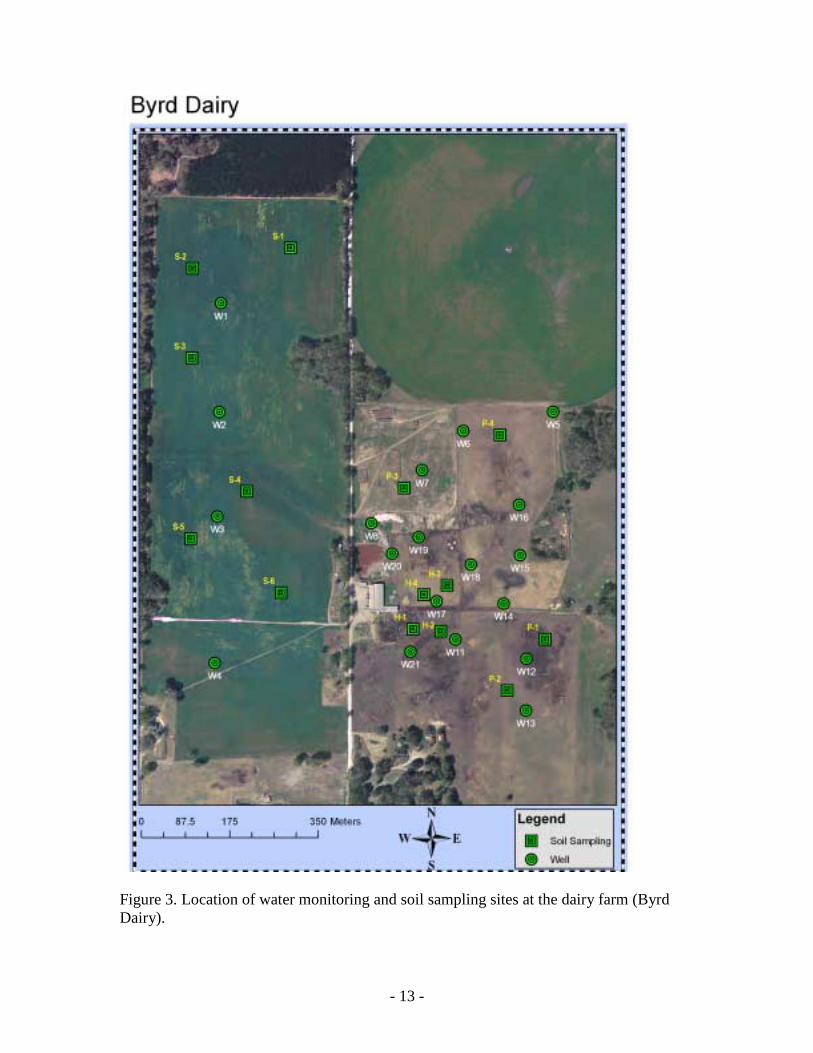
Figure 3. Location of water monitoring and soil sampling sites at the dairy farm (Byrd Dairy).
- 14 -
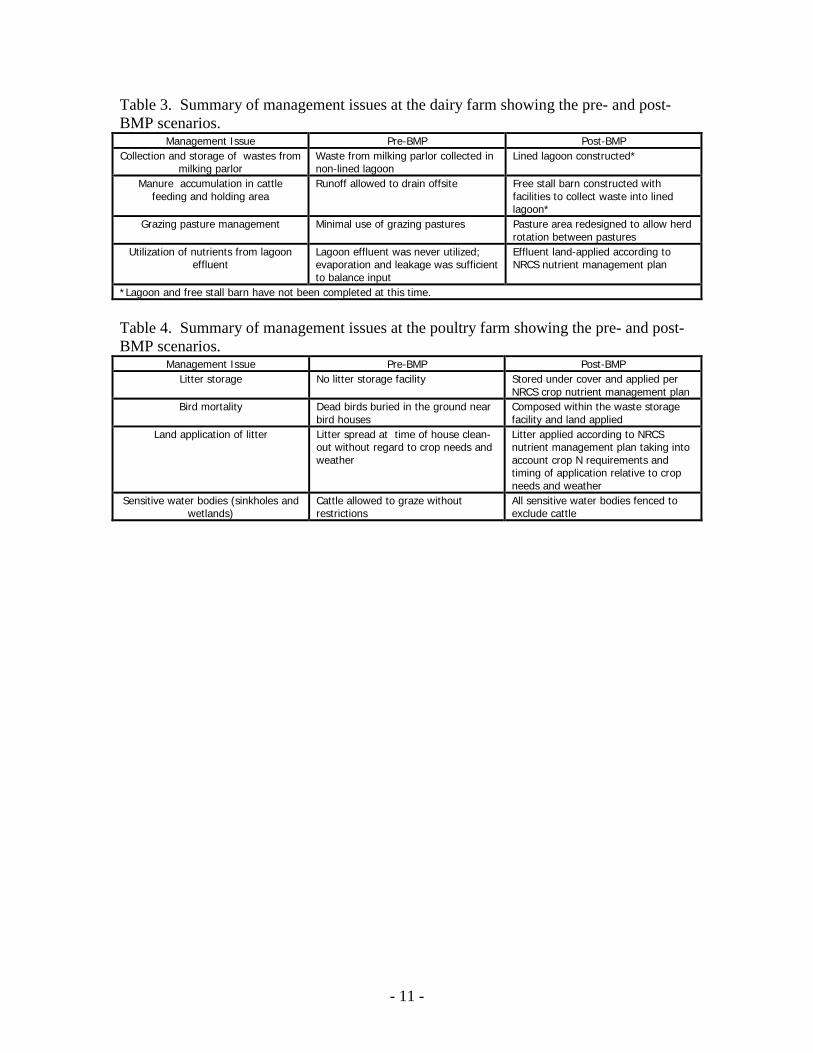
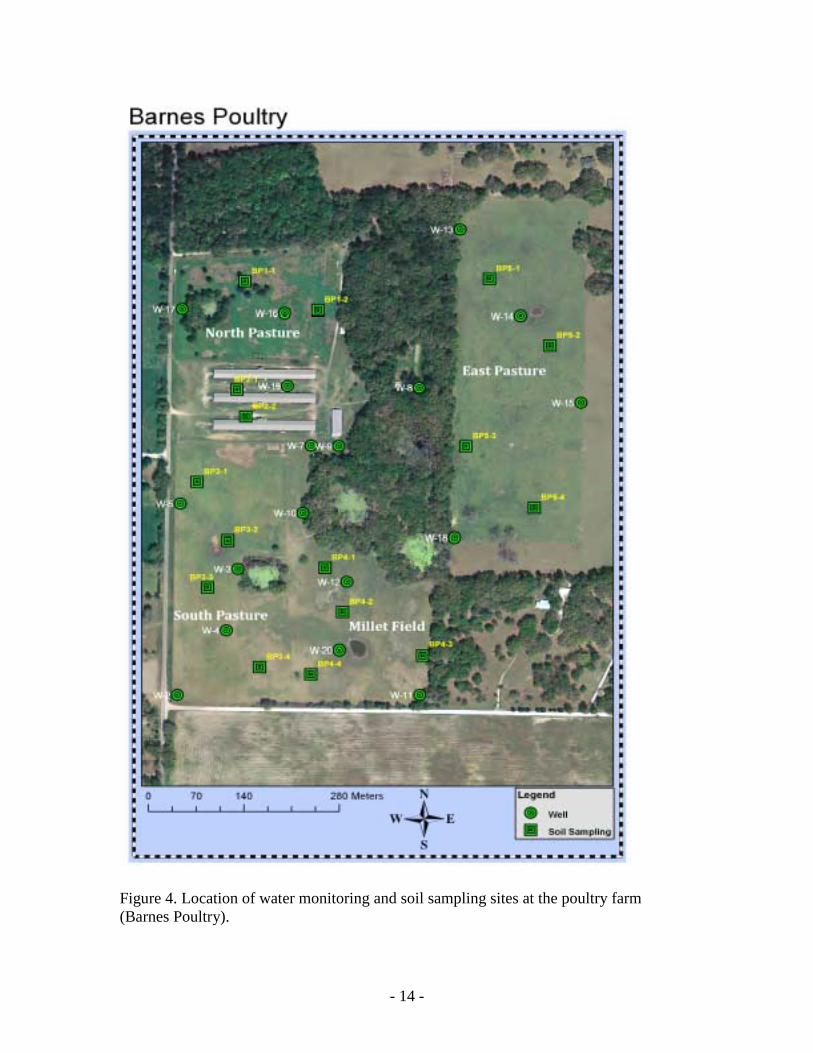
Figure 4. Location of water monitoring and soil sampling sites at the poultry farm (Barnes Poultry).

- 15 -
Description of BMPs
The types of BMPs used in the project were predicated upon the particular type of farming being addressed. In the project, a dairy farm, a poultry farm, and row crop farm were addressed. On the dairy and poultry farms, the BMPs were recommended by the Natural Resources Conservation Service (NRCS) through their conservation plans for each of the farms. BMPs on the dairy farm included a cattle cooling barn to provide a lounging feeding area for the cattle, a lined lagoon to replace an existing unlined lagoon, a rotational cattle grazing plan to better distribute manure on the pastures and to minimize denuded areas within the pastures, and a nutrient management plan for the efficient utilization of nutrients in the lagoon effluent.
The lined waste storage facility will collect water from the milking parlor, the cattle washing area, and the cooling barn. The cooling barn will replace a heavily contaminated feeding and lounging area near the milking parlor. An irrigation system will be installed on a bermudagrass field to distribute effluent from the lined storage facility. A nutrient management plan, including soil, tissue, and effluent sampling will be implemented to insure agronomic rates of nutrient application. The currently existing large pasture fields have been divided into paddocks. Cattle will be rotated among the paddocks to ensure a constant vegetative cover, which is not the case in many areas at the present time. The BMPs on the poultry farm included storage facilities for the litter so that the litter could be applied at appropriate times when nutrients were needed by the crops; previously litter was applied whenever the houses were cleaned without regard to the nutrient needs of the crop. Provisions were made to compost bird mortality within the compost facility instead of burying the birds in the ground in one small area, and a nutrient management plan to efficiently utilize the manure nutrients on the forage/grazing areas of the farm. In addition, sensitive water areas such as sinkholes and wetlands were fenced to keep out grazing cattle.
The row crop farm produced primarily vegetable crops such as potatoes and sweet corn plus cotton and peanuts. The BMPs addressed fertilization and irrigation management practices. The landowner was encouraged to follow the fertilization and irrigation management practices recommended by the Institute of Food and Agricultural Sciences at the University of Florida. BMPs involving nitrogen and irrigation application rate and timing were evaluated with initial emphasis on potatoes (a heavily fertilized and irrigated crop) over three growing seasons. Subsequent to the work on potatoes, BMP development was initiated on sweet corn, a second heavily fertilized and irrigated crop. For sweet corn management practices were developed over one season, with plans to continue for a second season a follow-on project. These activities resulted in the development of crop management guides for these two crops. These guides are farmer friendly and were developed to allow the farmer and his field supervisors to implement the plans with minimum input from external aid.

- 16 -
2.0 PROJECT GOALS, OBJECTIVES, AND ACTIVITIES The goal of this project was to implement BMPs at the farm level to reduce nutrient loadings to ground water from agricultural activities and to evaluate their water quality effectiveness. The information gained from this project, in conjunction with the other ongoing BMP implementation efforts, will help to fulfill the SRBNMWG agreement’s objectives for non-regulatory approaches for reducing nutrient loadings. This will be accomplished through verification of BMPs via pre- and post-BMP water quality demonstration monitoring, stakeholder education and information transfer, and data collection for future development of a user's tool for BMP selection and simulation. This project will consist of three separate components: The implementation and assessment of BMPs on a row cropping farm. The implementation and assessment of BMPs on a dairy farm. The implementation and assessment of BMPs on a poultry farm. The objectives to meet this goal were to: 1. Coordinate cooperative efforts to refine and evaluate agricultural BMPs that are being
conducted by various agencies, agricultural interests, and universities in the Suwannee River Basin (SRB).
The SRBNMWG (now the Suwannee River Partnership) includes forty-six members from Federal, State, Regional, and Local Governments as well as agriculture and other private organizations. The Partnership has coordinated efforts to refine and evaluate agricultural Best Management Practices (BMPs) by a variety of mechanisms but primarily through this Section 319 project. The Partnership began with commodity and other technical committees to outline BMP effectiveness evaluation criteria which lead to the Section 319 project proposal. During the project an interagency group has met quarterly to review data and make recommendations to refine and evaluate BMPs. In addition to the Section 319 project the Partnership has coordinated efforts through the membership steering committee, and by using Florida Department of Agriculture and Consumer Services resources to fund additional BMP Effectiveness research. The Partnership and its members will continue to refine and evaluate agriculture BMPs using computer models and additional farm specific ground water quality monitoring.
2. Improve working relationships and partnerships among the various agencies, agricultural interests, and the universities. Ongoing process through the SRBNMWG.
The Suwannee River Partnership has continued to improve working relationships and partnerships among its members which are the stakeholders in the Suwannee River Basin. The forty-six members that make up the Partnership shows the basin wide support that has been built to promote voluntary incentive-based approaches to improving water quality in the basin. The Partnership now covers the majority of the Suwannee River Water Management District area and plans are being made

- 17 -
to expand the Partnership watershed approach to the rest of the basin in Florida as well as the Upper Suwannee River Basin in Georgia.
3. Evaluate water quality impacts (primarily ground water) from a row cropping system,
dairy farm, and poultry farm in the SRB.
This was accomplished by pre-BMP monitoring of ground waters to establish a baseline groundwater quality from traditional farming practices.
4. Implement BMPs for a row cropping farm, dairy farm, and poultry farm in the SRB.
The BMPs on the row crop farm were developed by the IFAS project team based on the fertilization and irrigation management practices recommended by the Institute of Food and Agricultural Sciences at the University of Florida.
5. Evaluate the water quality effectiveness of Best Management Practices (BMPs) for a
row cropping farm, dairy farm, and poultry farm in the SRB.
This was accomplished by post-BMP monitoring of ground waters to evaluate changes in groundwater quality due to BMP implementation.
6. Collect data from each system for the future development of a personal computer
based user's tool for BMP selection and simulation.
Soil, crop and groundwater data were used to test and calibrate models that predict water and nitrate movement through the root and vadose zones. Two existing models, the DSSAT crop model and the Leaching Estimation and Chemistry Model (LEACHM) were used. DSSAT is a shell tool containing several crop models.
7. Implement information sharing/educational program(s) using IFAS extension service,
Soil and Water Conservation District, and public outreach to disseminate overall environmental impact awareness, types of BMPs for agricultural practices, and the result of the BMPs being evaluated in this project.
Outreach was be conducted by annual presentations (or poster) at the Suwannee Valley Education Research Center Field Day (150 - 300 people), Suwannee Valley Field and Greenhouse Vegetable Short course and tradeshow (300 - 400 people) and video/slides of the BMPs evaluated.
3.0 Long Term Results in Terms of Behavior Modification, Stream/Lake Quality, Ground Water, and/or Watershed Protection changes. BMPs for Row Crop Farms A “farmer-friendly” potato management guide was developed based on our results and experience. It is anticipated that the fertilization and irrigation BMPs recommended in

- 18 -
this management guide will result in a 30% fertilizer reduction and 20-30% irrigation reduction without decreasing yields. The cooperating farmer implemented the BMPs recommended in the guide on his entire potato crop and it is anticipated that other growers in the area will implement these BMPs as they are made aware of them through field days being held in the area. A similar guide was prepared for sweet corn, one of the other crops in the basin requiring significant amounts of N fertilizer. Both of these guides are included in the appendices of this report. As part of the irrigation management program, new nozzles were installed on the center pivot irrigation systems. These new nozzles were designed to cause less bed erosion and yet have high efficiency and uniformity. These nozzles have produced the desired results as evaluated by the Suwannee River Mobil Irrigation Laboratory and are now being recommended by many of the irrigation equipment dealers in the watershed. There were only small decreases in groundwater nitrate concentrations in the BMP side of the field compared to the grower-managed side. Based on the improved efficient use of both fertilizer and irrigation water, it is anticipated that a additional small reductions in groundwater nitrate concentrations will be observed over time. However, because of the environmental conditions present in the basin (sandy soils, karst topography, intense leaching rainfall) it may be difficult to achieve acceptable nitrate conditions without the implementation of additional BMPs. The use of additional BMPs such as slow-release fertilizers are likely to have significant economic implications for the producers. BMPs for Poultry Farms As noted earlier, the BMPs on the poultry farm included storage facilities for the litter so that the litter could applied at appropriate times when nutrients were needed by the crops; previously litter was applied whenever the houses were cleaned without regard to the nutrient needs of the crop. Provisions were made to compost bird mortality within the compost facility instead of burying the birds in the ground in one small area, and a nutrient management plan to efficiently utilize the manure nutrients on the forage/grazing areas of the farm. In addition, sensitive water areas such as sinkholes and wetlands were fenced to keep out grazing cattle. The long-term effect of these BMPs has not been evident to this point in groundwater quality. However, decreases in the nitrate quantities in the soil profile have been observed since BMP implementation and it is anticipated that this will eventually be observed in groundwater nitrate concentrations. The farmer reports that he feels that he is now distributing the litter more uniformly over his farm and making more efficient use of the nutrients in the litter by being able to time litter application relative to crop requirements. He also stated that the composting of bird mortality is much more environmentally-acceptable to him than the previous disposal method, i.e., burying them in the ground in the vicinity of the bird houses. BMPs for Dairy Farms The complete implementation of the BMP for the dairy (animal waste management
- 19 -
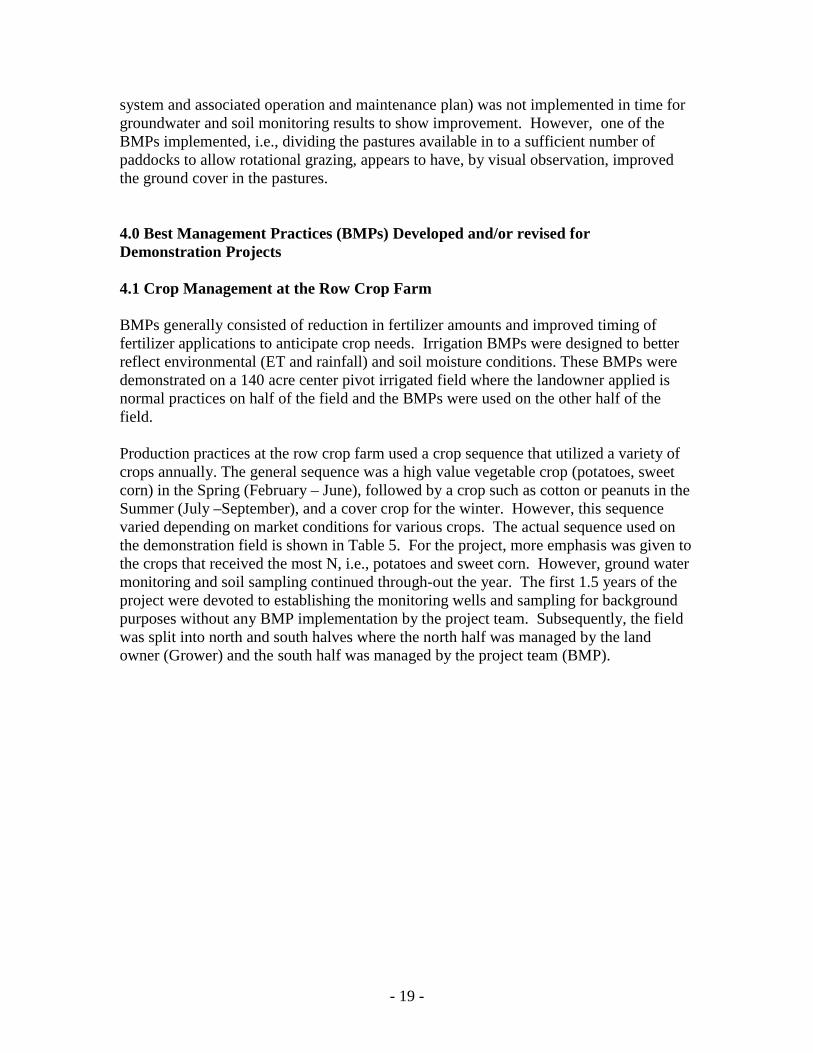
system and associated operation and maintenance plan) was not implemented in time for groundwater and soil monitoring results to show improvement. However, one of the BMPs implemented, i.e., dividing the pastures available in to a sufficient number of paddocks to allow rotational grazing, appears to have, by visual observation, improved the ground cover in the pastures. 4.0 Best Management Practices (BMPs) Developed and/or revised for Demonstration Projects 4.1 Crop Management at the Row Crop Farm BMPs generally consisted of reduction in fertilizer amounts and improved timing of fertilizer applications to anticipate crop needs. Irrigation BMPs were designed to better reflect environmental (ET and rainfall) and soil moisture conditions. These BMPs were demonstrated on a 140 acre center pivot irrigated field where the landowner applied is normal practices on half of the field and the BMPs were used on the other half of the field. Production practices at the row crop farm used a crop sequence that utilized a variety of crops annually. The general sequence was a high value vegetable crop (potatoes, sweet corn) in the Spring (February – June), followed by a crop such as cotton or peanuts in the Summer (July –September), and a cover crop for the winter. However, this sequence varied depending on market conditions for various crops. The actual sequence used on the demonstration field is shown in Table 5. For the project, more emphasis was given to the crops that received the most N, i.e., potatoes and sweet corn. However, ground water monitoring and soil sampling continued through-out the year. The first 1.5 years of the project were devoted to establishing the monitoring wells and sampling for background purposes without any BMP implementation by the project team. Subsequently, the field was split into north and south halves where the north half was managed by the land owner (Grower) and the south half was managed by the project team (BMP).

- 20 -
Table 5. Cropping history and N application rates for the Grower-managed and BMP halves of pivot 12 at the row crop farm.
N lbs/acre Crop Date Grower BMP IFAS
Cover Crop Spring 1999 0 0 0 Peanut Summer 1999 0 0 0 Cover Crop Fall 1999 0 0 0 Sweet Corn Spring 2000 345 345 225 Cotton Summer 2000 214 214 60 Fallow Fall 2000 0 0 0 Potato Spring 2001 280 250 230 Tropical Corn Summer 2001 243 243 210 Fallow Fall 2001 0 0 0 Potato Spring 2002 260 230 230 Peanut Summer 2002 0 0 0 Cover Crop Fall 2002 0 0 0 Sweet Corn Spring 2003 400 360 225 Fallow Summer 2003 0 0 0 Carrots Fall 2003 232 220 175 Sweet Corn Spring 2004 297 244 225 Peanuts Summer 2004 0 0 0 Cover Crop Fall 2004 0 0 0 Sweet Corn Spring 2005 304 320 225 Potato Spring 2006 251 203 200 Sweet Corn Summer 2006 242 246 225 Oats December 2006 117 117 Peanuts May 2007 0 0 0 3185 2992 2230
Spring 2001 Potato Crop The 2001 potato crop, the first that was intensively monitored under this project, was managed with little deviation from the farmer’s historic irrigation and N management practices. The goal for this crop was one of primarily observation and not optimization of management practices. A secondary goal for this crop was to develop a comfortable working relationship with the land owner. Small adjustments in N application rates (313/280 kg/ha) were made between the two halves of the pivot (Table 6) and observations of the irrigation management program were made. Fertilizer was applied in 5 split applications including 38 and 29 kg/ha approximately one month prior to planting. Periodic plant biomass sampling was conducted to obtain moisture content, dry matter content, total nitrogen content and weight of the leaves, stems and tubers. Soil samples were taken biweekly from the soil surface to a depth of 90 cm during the spring potato

- 21 -
growing season in addition to the deep soil samples that were taken every six weeks throughout the year. The samples were taken at 10 locations in the center of the potato plant beds at depths of 0-15, 15-30, 30-60, and 60-90 cm. Table 6. Spring 2001 approximate nitrogen fertilizer schedule and amounts for potato.
Applied Nitrogen
(kg/ha)
Date Julian Day
Grower Half Nitrogen Applied
BMP Half Nitrogen Applied
Fertilizer Type/Application Method
01/18/2001 18 38.2 29.2 34-0-0 pre-plant, in bed 02/15/2001 46 16.8 16.8 10-34-0 starter, at plant 03/05/2001 64 112.3 105.5 18-0-0-3 sidedress, liquid 03/25/2001 84 112.3 94.3 18-0-0-3 sidedress, liquid 04/28/2001 118 33.7 33.7 30-0-0, fertigation
Total N 313 kg/ha 280 kg/ha
Total final yields were 38.7 Mg/ha for the grower half and 33.7 Mg/ha for the BMP half. Twenty-four percent of the applied N (fertilizer + irrigation) was recovered by the potato plants leaving 325 kg N/ha of the 427 kg N/ha applied to be retained in soil as soil organic matter, denitrified to N2 gas, or leached to the ground water. In this sandy soil, leaching to the ground water is likely to be the largest component of the three possibilities. Table 7 summarizes the N applied and the field measured N uptake and yield for the 3 seasons of potatoes monitored at the row crop farm. Table 7. Summary of Nitrogen Application, Uptake and Potato Yield 2001-2003.
Crop N Applied (kg/ha)
N Uptake (kg/ha)
N Lost (kg/ha)
Yield (cwt/ha)
Potatoes N Half 2001
313 101 212 342
Potatoes S Half 2001
280 84 196 296
Potatoes N Half 2002
292 155 137 326
Potatoes S Half 2002
261 132 129 321
Potatoes 2003 (Pivot 35)
279 118 161 349

- 22 -
Spring 2002 Potato Crop In the normal crop rotation followed by the land owner, potatoes would not have been grown on this pivot in 2002 due to increased crop disease potential. However, in winter meetings with the land owner, he agreed to assume the higher level of risk and to accommodate the requests of the project leaders. We negotiated a management plan for the BMP half of the pivot that would involve intensive oversight by project participants for both fertilization and irrigation management (See Appendix 1 – Crop Management Report, EPA Project, Vegetable Farm, Spring Potatoes, 2002). The nutrient management program for the BMP half targeted the IFAS recommended rate for potatoes of 200 lbs of N per acre (approximately 225 kg/ha) and modification of the timing of application. The irrigation of the BMP half was targeted for a 20% reduction compared to the land owners irrigation on the grower half. The spring 2002 potato crop had similar planting details as those of the 2001 crop. Two different management practices were used on the grower and BMP halves of the field in 2002 (Table 8). The grower half of the field received 292 kg/ha of nitrogen fertilizer with the farmer’s typical irrigation management. The BMP half of the field received 261 kg/ha of nitrogen fertilizer with a 21% reduction in applied irrigation. The BMP half irrigation was managed according to weather conditions and crop status, which was monitored daily by Justin Jones from the University of Florida Research Center located in Live Oak, FL and Joel Love, a FDACS employee. Weather data were collected weekly from an onsite weather station adjacent to the field, which include hourly solar radiation, rainfall, and temperature. Table 8. Spring 2002 approximate nitrogen fertilizer schedule and amounts for potatoes.
Date Julian Day Applied Nitrogen (kg/ha)
Fertilizer Type/Application Method
Grower
1/10/2002 10 41 4-10-27, pre-plant in bed 1/15/2002 15 28.5 19-0-0, pre-plant in bed 2/13/2002 44 17 10-34-0, at plant 3/13/2002 72 101.5 19-0-0, sidedress 3/25/2002 84 104 19-0-0, sidedress BMP 1/16/2002 16 90.5 19-0-0, pre-plant in-bed 2/16/2002 47 17 10-34-0, at plant 3/15/2002 74 56 19-0-0, sidedress 3/26/2002 85 97.5 19-0-0, sidedress
- 23 -
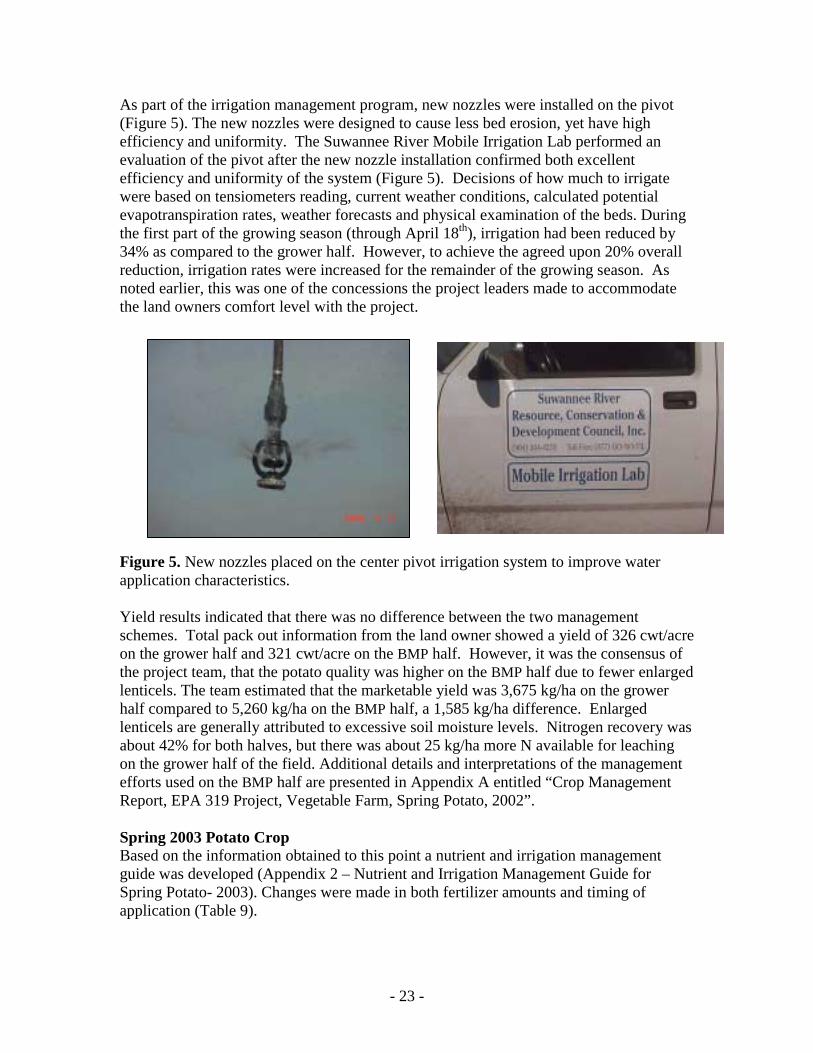
As part of the irrigation management program, new nozzles were installed on the pivot (Figure 5). The new nozzles were designed to cause less bed erosion, yet have high efficiency and uniformity. The Suwannee River Mobile Irrigation Lab performed an evaluation of the pivot after the new nozzle installation confirmed both excellent efficiency and uniformity of the system (Figure 5). Decisions of how much to irrigate were based on tensiometers reading, current weather conditions, calculated potential evapotranspiration rates, weather forecasts and physical examination of the beds. During the first part of the growing season (through April 18th), irrigation had been reduced by 34% as compared to the grower half. However, to achieve the agreed upon 20% overall reduction, irrigation rates were increased for the remainder of the growing season. As noted earlier, this was one of the concessions the project leaders made to accommodate the land owners comfort level with the project.
Figure 5. New nozzles placed on the center pivot irrigation system to improve water application characteristics. Yield results indicated that there was no difference between the two management schemes. Total pack out information from the land owner showed a yield of 326 cwt/acre on the grower half and 321 cwt/acre on the BMP half. However, it was the consensus of the project team, that the potato quality was higher on the BMP half due to fewer enlarged lenticels. The team estimated that the marketable yield was 3,675 kg/ha on the grower half compared to 5,260 kg/ha on the BMP half, a 1,585 kg/ha difference. Enlarged lenticels are generally attributed to excessive soil moisture levels. Nitrogen recovery was about 42% for both halves, but there was about 25 kg/ha more N available for leaching on the grower half of the field. Additional details and interpretations of the management efforts used on the BMP half are presented in Appendix A entitled “Crop Management Report, EPA 319 Project, Vegetable Farm, Spring Potato, 2002”. Spring 2003 Potato Crop Based on the information obtained to this point a nutrient and irrigation management guide was developed (Appendix 2 – Nutrient and Irrigation Management Guide for Spring Potato- 2003). Changes were made in both fertilizer amounts and timing of application (Table 9).

- 24 -
Table 9. Common potato fertilization practices versus BMP fertilization program used for the 2003 potato crop. Crop Stage Common Fertilization
Practice BMP Fertilization Practice
Pre-Bed and Bedding 35 lb/acre 0 lb/acre Planting 15 30 Emergence (cracking) 100 80-90 Plant Height of 4-8 Inches 100 80-90 Supplemental* 30 30 TOTAL 280 220-240 This management guide was subsequently used by the land owner for his entire potato crop in 2003. Since it was not acceptable to grow another crop of potatoes on the demonstration field, we decided to monitor a similar nearby pivot planted to potatoes. Both the fertilizer application and the irrigation were followed very closely by project personnel. It appeared that the management plan developed by the project was being followed quite closely by the farm managers. The one exception to this was an application of 35 lbs of N/acre at the post-bloom stage. This was in response to slight loss of leaf color which the land owner addressed with additional nitrogen. However, the color change was more likely due to the plant’s physiological maturation process. It should be noted, however, that the IFAS recommendations do allow for 30 lbs/acre of additional nitrogen if the field has received a leaching rainfall event and this did occur on at least two occasions (26 inches of rainfall occurred during the growing season). Thus, the N applied to this field only exceeded IFAS recommendations by 20 lbs/acre. This field was the highest yielding field on the farm (320 cwt/acre). According to the packing shed supervisor, it also maintained the highest quality of potatoes. The next highest yield was 284 cwt/acre and the range was 209 – 320 cwt/acre. Dye studies to evaluate potato root distribution and nitrogen movement in potato beds We used a water soluble marking dye to mimic the movement of nitrogen in potato beds and root zones in a commercial potato field. The photos show how the dye is used to mark fertilizer bands in the bed (Figure 6 A and B). Dye tracing illustrated the movement of water in the bed. Following irrigation from the center pivot system, the dye begins to move downward and laterally from the bands (Figure 6 C and D). A dry area forms in the center of the bed directly below the plant crown (Figure 6 E and F) and most of the active roots are in the upper part of the bed (Figure 6 G and H). Managing irrigation to apply water replaced by evapotranspiration maintained the dye (fertilizer) in the root zone for uptake by the plant, even though this management practice led to a somewhat dry area directly below the plant crown. Potato roots were observed extending

- 25 -
to a depth of about 12 inches and laterally to the row middle, the area between adjacent beds (Figure 6 G and H). In addition, potato roots were prevented from penetrating the hard pan (plow pan) about 12 inches below the bed surface (Figure 6 H). Roots can be observed growing into the crack in the hardpan caused by the chisel plow tip (Figure 6 H). The following observations were made about potato root growth from the dye studies: Soluble nutrients can move rapidly in the soil in the potato bed when irrigation water is applied. Applying correct amounts of water minimizes the movement of water below the root zone. Correct irrigation amounts and timing keep the soluble nutrients in the upper portions of the bed. Dye tests showed that potato roots were largely found in the upper 12 inches of the bed and extended laterally into the area between the rows. A hardpan in the field prevented deeper root distribution.

- 26 -
A
Figure 6. Use of dye tracer to mimic N and water movement in a potato bed.
B
C D
E F

- 27 -
Figure 6 (continued). Use of dye tracer to mimic N and water movement in a potato bed. Crop Modeling Although modeling was not one of the specific tasks of the project (data collection for future modeling purposes was one of the tasks), modeling was addressed by two Master of Science students in the Agricultural and Biological Engineering Department at the University of Florida. These are included as appendices in this report. The soil, crop and groundwater data were used to test and calibrate models that predict water and nitrate movement through the root and vadose zones. Two existing models, the DSSAT crop model and the Leaching Estimation and Chemistry Model (LEACHM) were used. DSSAT is a shell tool containing several crop models. The SUBSTOR potato model contained within the DSSAT shell was used to predict N and water uptake/leaching in the root zone, evapotranspiration, as well as crop yield and phenological response to water and nutrient management practices. The LEACHM model is a hydrologic model that has more rigorous vadose zone and water flow and contaminant transport routines than the DSSAT model. LEACHM was used to predict water/nitrogen transport within the root zone, through the vadose zone, and to the groundwater. Modeling was conducted for the potato crops grown in 2001, 2002, and 2003. Figures 7 through 12 summarize the accuracy of the model predictions for nitrogen uptake, nitrogen leaching and total yield for each year. Additional details may be found in Appendices 3 and 4.
G H

- 28 -
0
50
100
150
200
250
300
350
400
450
1/1/01 1/15/01 1/29/01 2/12/01 2/26/01 3/12/01 3/26/01 4/9/01 4/23/01 5/7/01 5/21/01
Date
Nitr
ogen
(kg/
ha)
Predicted N-Uptake N-Applied Predicted N-Leached Measured Uptake
2001 Cumulative Nitrogen Balance
Figure 7. Predicted nitrogen balance and observed nitrogen uptake for the Spring 2001 potato crop.
0
1000
2000
3000
4000
5000
6000
7000
8000
02/15/01 03/07/01 03/27/01 04/16/01 05/06/01
Date
Tube
r Wei
ght (
kg/h
a)
Predicted Measured
2001 Dry tuber yield
Figure 8. Measured versus predicted yield for the Spring 2001 potato crop.

- 29 -
0
50
100
150
200
250
300
1/1/02 1/11/02 1/21/02 1/31/02 2/10/02 2/20/02 3/2/02 3/12/02 3/22/02 4/1/02 4/11/02 4/21/02 5/1/02 5/11/02
Date
Nitr
ogen
(kg/
ha)
N-Uptake (DSSAT) N-Applied (DSSAT) N-Leached (DSSAT) Measured
2002 Cumulative Nitrogen Balance
Figure 9. Predicted nitrogen balance and observed nitrogen uptake for the Spring 2002 potato crop
0
1000
2000
3000
4000
5000
6000
7000
02/12/02 02/22/02 03/04/02 03/14/02 03/24/02 04/03/02 04/13/02 04/23/02 05/03/02 05/13/02 05/23/02
Date
Tube
r Wei
ght (
kg/h
a)
DSSAT measured
2002 Dry tuber yield
Figure 10. Measured versus predicted yield for the Spring 2002 potato crop.
- 30 -
2003 Cumulative Nitrogen Balance
0
50
100
150
200
250
300
15-Jan-03 14-Feb-03 16-Mar-03 15-Apr-03 15-May-03
Date
Nit
rog
en (k
g/ha
)N-A pplied
Predic ted N-Uptake
Predic ted N-Leached
Measured Uptake
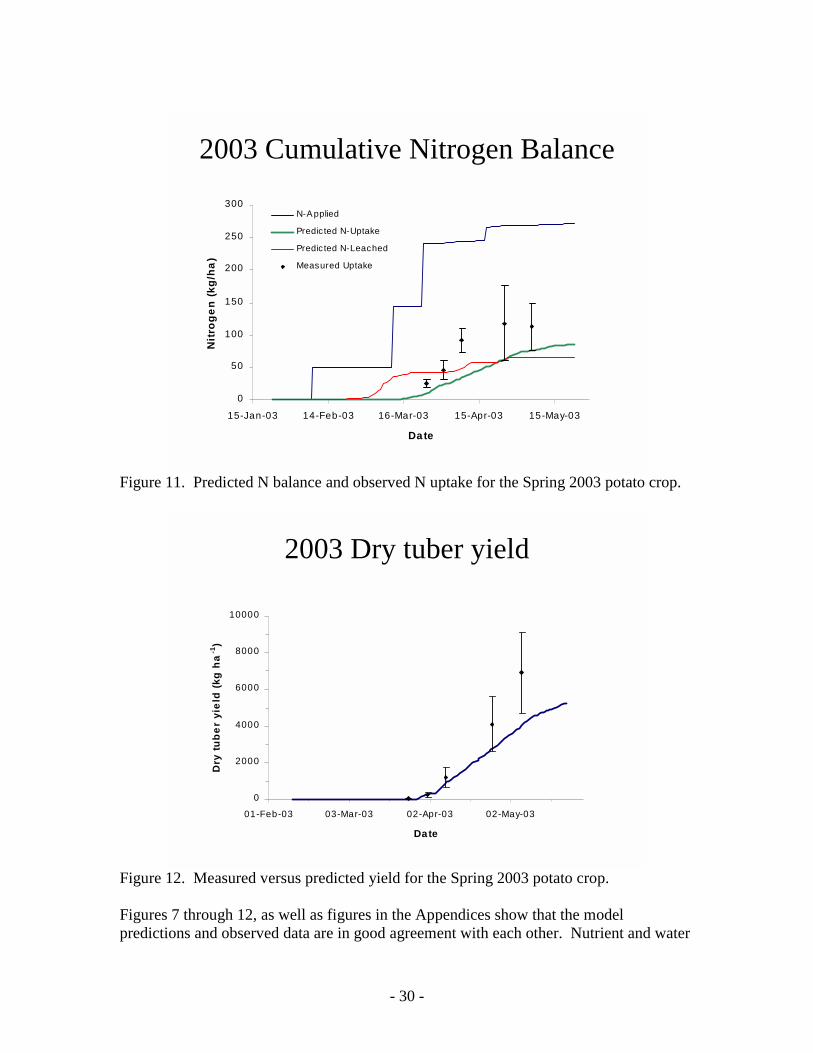
Figure 11. Predicted N balance and observed N uptake for the Spring 2003 potato crop.
2003 Dry tuber yield
0
2000
4000
6000
8000
10000
01-Feb-03 03-Mar-03 02-Apr-03 02-May-03
Date
Dry
tub
er y
ield
(kg
ha
-1)
Figure 12. Measured versus predicted yield for the Spring 2003 potato crop. Figures 7 through 12, as well as figures in the Appendices show that the model predictions and observed data are in good agreement with each other. Nutrient and water

- 31 -
data collected in the field compared well with observed fertilization dates and rates, and closely matched model predictions for both DSSAT and LEACHM. The crop growth model accurately predicted dry tuber yield, phenological development, and plant N concentration but overestimated stem weight and underestimated leaf weight. Simulations run with the crop model appeared consistent with trends observed in other potato studies and provided much insight into plant –nutrient interactions. Both model predictions and measured data demonstrated the rapid leaching caused by rains and/or over-irrigation in the well-drained sandy soils at the row crop site. The model demonstrated that in general fertilizer applications are completely leached below the root zone within two weeks of the application. Rapid leaching due to applied irrigation can be avoided by taking precautions to insure no excess water is applied above field capacity which lies at about 6-7% volumetric water content for soil at the row crop site. Modeling results suggested that irrigation historically applied by the farmer could be cut by as much as 30% without stressing the plants. Model predictions and measured data both indicate only about 30% of the N applied was taken up by the potatoes, which is supported by the literature reviewed. After the model was tested against the observed field data, it was used to predict crop and water quality response for alternative management practices. The results show that by reducing the amount of irrigation, reducing the fertilizer application rate, and improving the timing of fertilizer applications, nitrogen leaching could be reduced by approximately 50% while maintaining acceptable crop yields. Yields seem to stabilize at around the 225 kg N/ha fertilizer rate which is the IFAS recommendation (a reduction of 29% from historic management practices). However, all scenarios modeled indicate that average nitrate concentrations leaching below the root zone will exceed the EPA MCL of 10 mg/L NO3-N during the potato cropping season, even with BMPs implemented during the 2002 season. Thus, it is important to recognize that a cropping system that rotates crops requiring high amount of N with crops requiring low amounts of N, such as various cover crops, peanuts, and cotton may be required to meet the EPA MCL. This is, in fact, what this particular land owner practices on his farm.

- 32 -
20
25
30
35
40
45
50
300 350 400 450 500 550 600 650 700
N Lost (kg/ha)
Yiel
d (M
g/ha
)
N Half
S Half
6mm
5mm
225_4
225_5A
225_5B
225_5C
225_7
202_B
182_B
157_B
Autoirr_50%
Autoirr_75%
Yield vs Nitrogen Applied (Lost)
Figure 13. Yield versus N lost of alternative potato management practices. 4.2 Dairy Conservation Plan for BMP Development An animal waste management system and associated operation and maintenance plan was developed for Byrd Dairy by the NRCS (Appendix 5 – Project Report, T.W. Byrd Dairy Animal Waste Management System (Revised August 6, 2003)) (Appendix 6 – T.W. Byrd Animal Waste Management System Operation and Maintenance Plan). Development of this plan was initiated in early 2000 and has gone through several iterations until it was finalized in July 2003. During the early stages of plan development, NRCS determined that they could improve on certain aspects of the plan based on experiences with similar plans that were recently implemented on other dairies in the region. In addition, geologic investigations revealed that the clay content of the in-situ soil was not adequate to allow construction of an earthen waste storage pond in accordance NRCS guidelines. These issues both resulted in delays in completing the plan. Additional delays were encountered when the land owners requested changes in the plan that would better accommodate their farming operation. Negotiations with the land owners result in a plan that was acceptable to both parties during mid-2003. However, this plan was not implemented during the duration of this study. The waste management system, as designed, will accommodate 600 milk cows, approximately 150 more cows than presently on the property. The plan includes enhancement of the barn and waste collection facilities, improved management of the herd pastures, and improved management/distribution of the nutrients in the waste

- 33 -
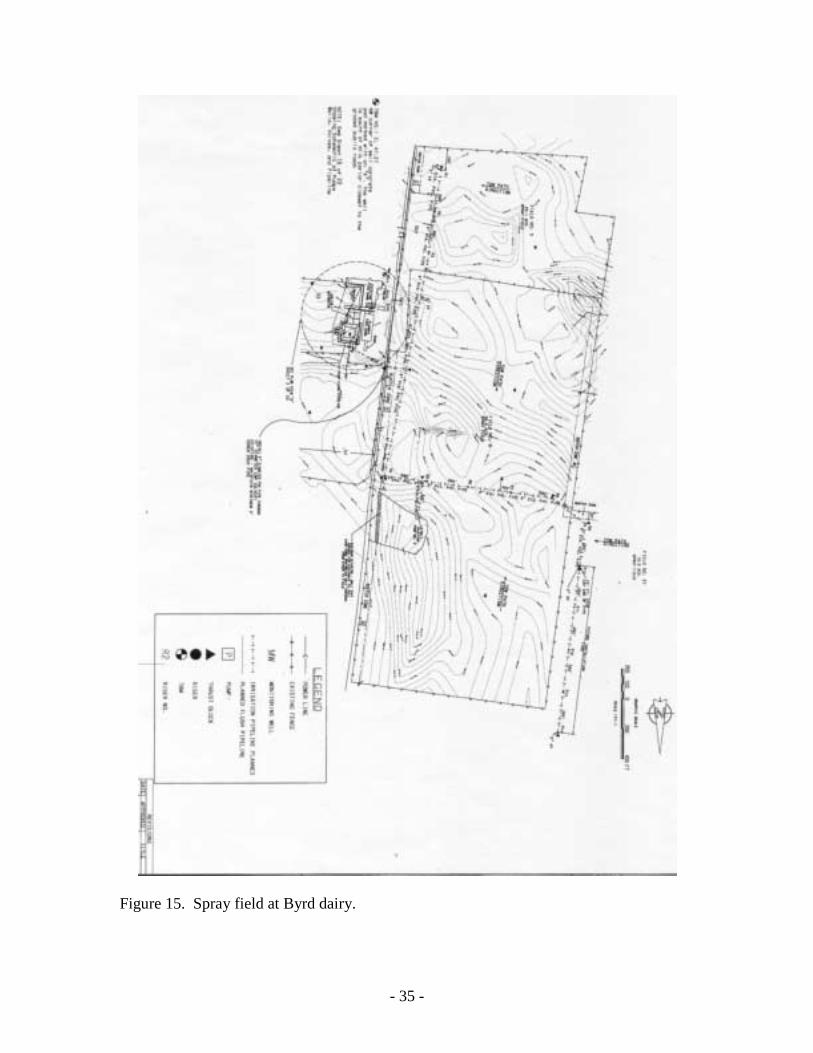
stream. Improvements in the barn and waste collection facilities include a concrete-lined animal waste storage pond (WSP) designed using a water budget analysis of the dairy, a new roofed heavy use area (HUA), and washways which will collect and divert wash water from the facility to the WSP. The WSP is designed to store seven days of waste water plus runoff for a 25-yr 24 hour rainfall event (Figure 14). The waste from the cattle in the milking area and HUAs will be washed down to a solids separator which connects to the WSP. It is anticipated that 50% of the waste from the confinement area will be retained by the solids separator. The solids and effluent will both be applied to a new 116 ha field area planted to Bermuda and overseeded with winter rye. A hard hose traveler irrigation system will be used to distribute the effluent at a rate consistent with the crops nitrogen uptake capacity (Figure 15). Six pastures are planned for the dairy’s three herds, thereby allowing rotation of herds between the pastures (Figure 16). The rotation will allow the grass to be undisturbed for about 21 days providing for optimal regrowth prior to grazing. Fences will be used to control animal placement and movement which will encourage even distribution of wastes. Water troughs will be placed in several locations within each pasture to minimize the formation of high intensity areas. The pastures will be planted with Bermuda grass and small grains and are sized to efficiently utilize approximately 50% of the manure (the other 50% will be deposited in the milking area and collected in the WSP). The cows will be fed in the barn with occasional supplemental feeding in the pastures when necessary. Temporary feeding locations will be rotated to prevent build-up of manure and also to minimize adverse effects on vegetation.

- 34 -
Figure 14. Waste storage pond design for Byrd Dairy.
- 35 -
Figure 15. Spray field at Byrd dairy.

- 36 -
Figure 16. Herd pastures used for rotational grazing at Byrd Dairy.

- 37 -
4.3. Poultry Farm Conservation Plan for BMP Development The Poultry Farm Conservation Plan was developed by the Natural Resource Conservation Service. The BMPs consisted of building a waste storage facility to provide protected temporary storage of litter obtained from one complete house cleanout (Figure 17 A, B, C), a composting facility within the waste storage facility to compost bird mortality, a waste utilization plan to provide recommendations for the amount and timing of application of waste to meet crop nutrient requirements, and fencing (Figure 17 D) to keep grazing animals out of sensitive waters such as sinkholes and wetlands on the property.
Figure 17. BMPs implemented at the poultry farm. Pictures A, B, and C represent the waste storage facility. Picture D shows fencing to keep grazing animals out of sensitive waters, in this case a sink hole.
AB
C D

- 38 -
The poultry farm produces approximately 412 tons of litter per year based on 6 clean-outs per year and 20,000 birds per flock ( 6 flocks per year for each of three houses). Approximately 8% of the litter will be feed to cattle and 92% will be applied on site to bermuda, bahia and millet/rye pasture land. The beef cattle operation includes approximately 75 cattle which is equivalent to 1.5 acres per cow. The litter feed to cattle is equivalent to 13 pounds of N per acre. Annual application rates of 230, 160, and 100 pounds of N will be applied to bermuda, bahai, and millet/rye pastures, respectively. Litter will be applied to the pastures in split applications only during the growing season at the rates shown in Table 10. Table 10. Estimated litter application requirements for crops at the poultry farm.
Crop Litter Application Rate Tons/acre/year Acres Available Litter Required
Tons/year Bermuda 5.4 63.1 341
Bahia 3.7 30.8 115 Millet 1.5 13.4 20 Rye 0.8 22.9 10
130 486
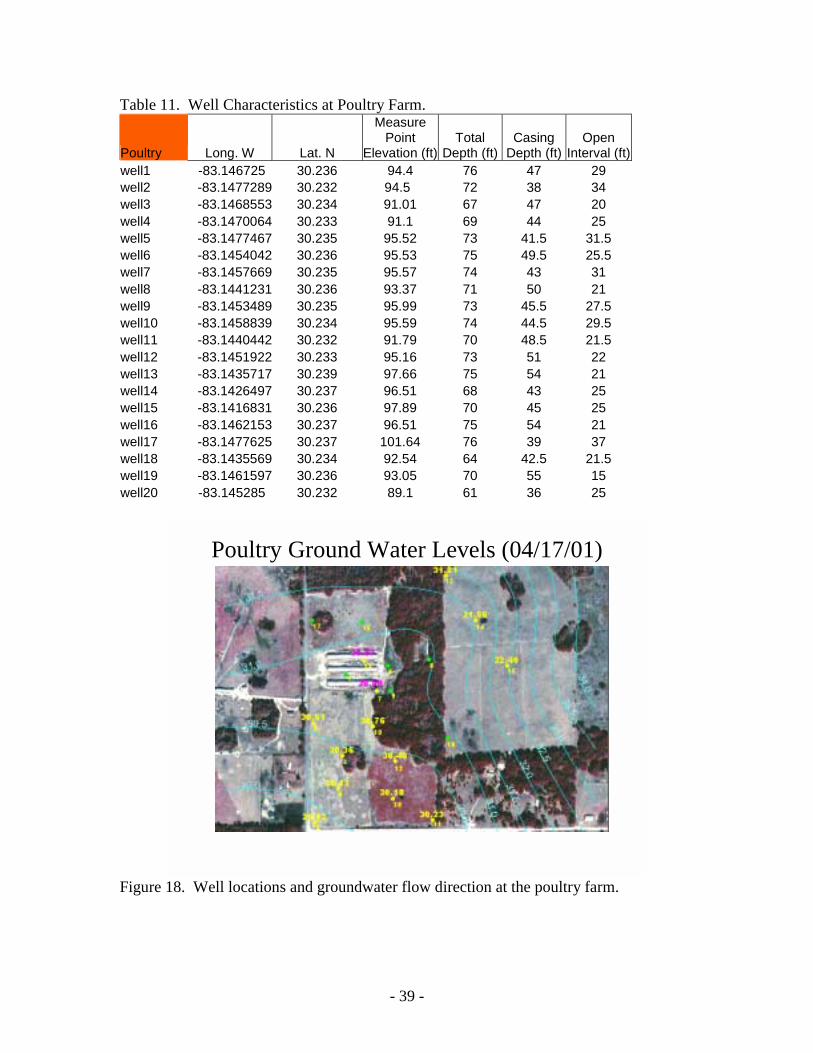
5.0 Monitoring Results Ground Water and Soil Monitoring Procedures Groundwater: Monitoring wells were installed at the three farms to provide coverage of the various components of each arm. Wells were installed to monitor the upper 10-20 feet of the aquifer at the row crop farm; the upper 15-20 feet of the aquifer at the dairy; and the upper 20-30 feet of the aquifer at the poultry farm. Groundwater levels in the wells are being measured biweekly. Data were used to determine seasonal groundwater fluctuation and groundwater flow directions in the Floridan aquifer. Groundwater quality samples were taken biweekly and analyzed for nitrate and orthophosphate. Soil: The soil profile, to the depth of the continuous clay layer (Bt horizon), was sampled with a bucket auger at depth intervals of 0.5-m intervals to a depth of 2 m followed by 1-m intervals to the clay layer. Soils were sampled on a 5-week basis. At the beginning of the study, sample locations were selected at each site to provide a representative coverage of the various farm components, i.e., fields or pivot quadrants. On subsequent sampling dates, sample locations were selected on a 5-meter radius around the initial sample location. Soil water content and nitrate and water-soluble inorganic phosphorus concentrations are being determined from samples composited from each depth interval. Ground Water Monitoring Data Poultry Farm: Table 11 summarizes the well characteristics at the Poultry Farm. Figure 18 shows the locations of the groundwater monitoring wells at the Poultry Farm, as well as the groundwater flow direction estimated from data gathered in Spring 2001. Groundwater generally flows from NE to SW across the Poultry Farm site.
- 39 -
Table 11. Well Characteristics at Poultry Farm.
Poultry Long. W Lat. N
Measure Point
Elevation (ft)Total
Depth (ft)Casing
Depth (ft)Open
Interval (ft) well1 -83.146725 30.236 94.4 76 47 29 well2 -83.1477289 30.232 94.5 72 38 34 well3 -83.1468553 30.234 91.01 67 47 20 well4 -83.1470064 30.233 91.1 69 44 25 well5 -83.1477467 30.235 95.52 73 41.5 31.5 well6 -83.1454042 30.236 95.53 75 49.5 25.5 well7 -83.1457669 30.235 95.57 74 43 31 well8 -83.1441231 30.236 93.37 71 50 21 well9 -83.1453489 30.235 95.99 73 45.5 27.5 well10 -83.1458839 30.234 95.59 74 44.5 29.5 well11 -83.1440442 30.232 91.79 70 48.5 21.5 well12 -83.1451922 30.233 95.16 73 51 22 well13 -83.1435717 30.239 97.66 75 54 21 well14 -83.1426497 30.237 96.51 68 43 25 well15 -83.1416831 30.236 97.89 70 45 25 well16 -83.1462153 30.237 96.51 75 54 21 well17 -83.1477625 30.237 101.64 76 39 37 well18 -83.1435569 30.234 92.54 64 42.5 21.5 well19 -83.1461597 30.236 93.05 70 55 15 well20 -83.145285 30.232 89.1 61 36 25
Poultry Ground Water Levels (04/17/01)
Figure 18. Well locations and groundwater flow direction at the poultry farm.

- 40 -
Rainfall data over the study period are shown graphically (Figure 19) and averaged by year (Table 12). Average rainfall for the area is 130 cm/year so rainfall at the poultry farm was generally near average during the study period. Groundwater nitrate concentrations at the poultry farm have been the lowest of the three farms being monitored with the average concentrations over the study period being in the range of 7 to 12 mg/L N03-N (Figure 20). BMP practices were implemented during November 2001. Nitrate concentrations in the monitoring wells have not yet reflected BMP implementation. This farm is underlain by a shallow, thick clay layer which may be slowing the movement of nitrate to the groundwater. Soils data, shown in the next section, shows measurable decreases in soil nitrate-N concentrations after BMP implementation.
Poultry Farm
0
5
10
15
20
25
30
35
40
Jan-00
May-00
Sep-00
Jan-01
May-01
Sep-01Jan
-02
May-02Sep-02
Jan-03
May-03Sep-03
Jan-04
May-04Sep-04
Jan-05
May-05Sep-05
Jan-06
May-06Sep-06
Jan-07
May-07
Date
Rai
nfal
l, cm
Figure 19. Monthly rainfall totals at the poultry farm.

- 41 -
Table 12. Monthly Rainfall at the Poultry Farm. 2000 2001 2002 2003 2004 2005 2006 2007
------------------------------------- cm ----------------------------------- January 9.19 3.16 13.19 0.92 2.19 3.03 8.13 7.13 February 3.53 2.33 1.59 15.68 14.86 9.03 16.31 3.08
March 6.65 13.32 12.49 23.67 2.14 16.48 1.18 1.64 April 0.84 1.53 0.41 3.13 6.46 17.28 3.33 4.77 May 5.23 0.74 2.20 5.09 5.22 3.50 6.08 1.02 June 11.81 23.22 13.25 19.83 14.36 22.02 11.50 11.48 July 13.74 29.96 19.42 20.43 16.24 14.46 7.89
August 10.06 2.78 15.82 14.11 15.89 11.00 14.07 September 37.92 10.32 3.79 4.05 34.96 4.48 8.23
October 4.47 0.60 6.94 15.98 3.88 8.10 3.14 November 3.02 1.75 8.83 5.30 3.55 8.18 1.97 December 2.69 3.66 16.13 16.27 0.00 15.67 9.84
Total 109.17 93.37 114.07 144.45 119.73 133.23 91.67 29.12 Poultry Farm
0
5
10
15
20
25
30
4/20/2
000
7/20/2
000
10/20
/2000
1/20/2
001
4/20/2
001
7/20/2
001
10/20
/2001
1/20/2
002
4/20/2
002
7/20/2
002
10/20
/2002
1/20/2
003
4/20/2
003
7/20/2
003
10/20
/2003
1/20/2
004
4/20/2
004
7/20/2
004
10/20
/2004
1/20/2
005
4/20/2
005
7/20/2
005
10/20
/2005
1/20/2
006
4/20/2
006
7/20/2
006
10/20
/2006
1/20/2
007
4/20/2
007
Sampling Date
NO
3-N
, mg/
L
N Pasture S Pasture E Pasture Near/In Woods Millet Buildings Average
Figure 20. Groundwater nitrate-N concentrations at the poultry farm.

- 42 -
Barnes Poultry
0
5
10
15
20
25
2000 2001 2002 2003 2004 2005 2006
Sampling Date
NO
3-N
, mg/
LBuilding East Pasture Millet Pasture North Pasture South Pasture Woods
B
D
CDCB
A
D
BDC
CB
A
D
A
E
B
D
C
B
C
A
B
A
C
B
C
B B
A
C
C
D
B
C
A
D
C
D
B
C
A
D
Barnes Poultry
0
5
10
15
20
25
2000 2001 2002 2003 2004 2005 2006
Sampling Date
NO
3-N
, mg/
LBuilding East Pasture Millet Pasture North Pasture South Pasture Woods
B
D
CDCB
A
D
BDC
CB
A
D
A
E
B
D
C
B
C
A
B
A
C
B
C
B B
A
C
C
D
B
C
A
D
C
D
B
C
A
D
Figure 21. Average annual groundwater nitrate nitrogen at the poultry farm. Table 13. Average annual nitrate concentrations in the groundwater monitoring wells at the poultry farm.
2000 2001 2002 2003 2004 2005 2006 Location
--------------------------------------- NO3-N, mg/L ---------------------------------------
Building 6.9Db 6.5Db 7.4Dc 9.0Cb 10.9Bb 13.0Ac 11.9ABc East Pasture 2.6Dd 2.8CDdc 3.8Bd 3.8Bc 4.0ABc 3.5BCd 4.6Ad Millet Pasture 2.7Ecd 4.1Ec 10.1Db 14.5Ba 11.9Cb 16.7Ab 16.1Ab North Pasture 5.0Acb 6.4Ab - 10.7Ab 10.7Ab 11.7Ac 12.7Ac South Pasture 16.0BCa 15.0Ca 17.8ABa 14.7Ca 18.7Aa 19.7Aa 19.2Aa Woods 1.6Bd 2.1Bd 1.6Be 4.8Ac 2.4Bc 2.1Bd 2.0Bd
Uppercase letters represent significant differences (p<0.05) among annual means for each location Lowercase letters represent significant differences (p<0.05) among means for each year Average annual nitrate-N concentrations for the individual farm components are shown in Figure 21 and Table 13. There were small increases in nitrate-N concentrations over time for all areas except the wooded area. Since these wells are relatively deep compared to wells at the other two farms and the clay layer is near the surface and thick, we feel these increases may still be reflecting pre-BMP nitrate loads in the soil. When the wells are averaged by the various field components of the farm, we see considerable differences in nitrate-N concentrations among the various fields. Highest concentrations were observed in the field adjacent to the poultry houses (south field). This is a field that receives poultry manure and is grazed by cattle. It is managed similarly to the “east” field which also receives poultry manure and is grazed by cattle. The “east” field has one of the lowest nitrate-N concentrations. One possible, but unproven, reason for this difference is that there is a dairy farm immediately across the highway from the “south”
For each year, numbers with the same letter are not significantly different at the 5% level (p < 0.05)
- 43 -
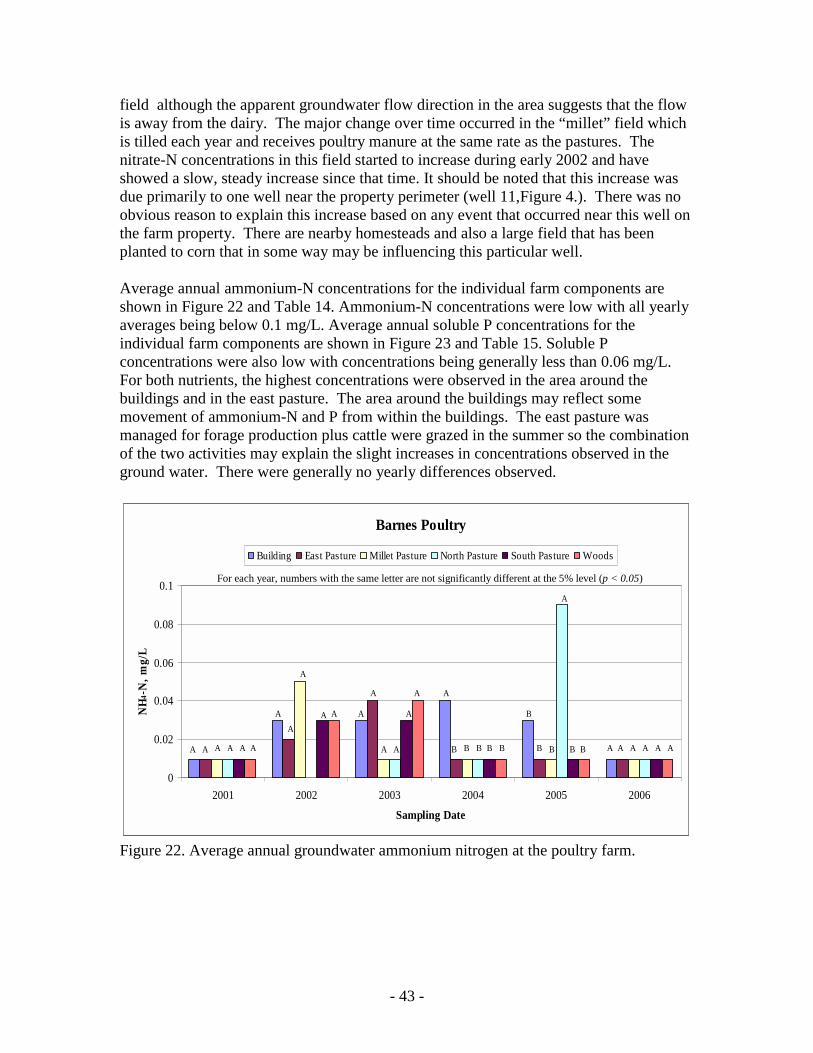
field although the apparent groundwater flow direction in the area suggests that the flow is away from the dairy. The major change over time occurred in the “millet” field which is tilled each year and receives poultry manure at the same rate as the pastures. The nitrate-N concentrations in this field started to increase during early 2002 and have showed a slow, steady increase since that time. It should be noted that this increase was due primarily to one well near the property perimeter (well 11,Figure 4.). There was no obvious reason to explain this increase based on any event that occurred near this well on the farm property. There are nearby homesteads and also a large field that has been planted to corn that in some way may be influencing this particular well. Average annual ammonium-N concentrations for the individual farm components are shown in Figure 22 and Table 14. Ammonium-N concentrations were low with all yearly averages being below 0.1 mg/L. Average annual soluble P concentrations for the individual farm components are shown in Figure 23 and Table 15. Soluble P concentrations were also low with concentrations being generally less than 0.06 mg/L. For both nutrients, the highest concentrations were observed in the area around the buildings and in the east pasture. The area around the buildings may reflect some movement of ammonium-N and P from within the buildings. The east pasture was managed for forage production plus cattle were grazed in the summer so the combination of the two activities may explain the slight increases in concentrations observed in the ground water. There were generally no yearly differences observed.
Barnes Poultry
0
0.02
0.04
0.06
0.08
0.1
2001 2002 2003 2004 2005 2006
Sampling Date
NH4
-N, m
g/L
Building East Pasture Millet Pasture North Pasture South Pasture Woods
A A A A A A
A
A
A
A A A
A
A A
A
A A
B B B B B
B
B B
A
B B A A A A A A
Barnes Poultry
0
0.02
0.04
0.06
0.08
0.1
2001 2002 2003 2004 2005 2006
Sampling Date
NH4
-N, m
g/L
Building East Pasture Millet Pasture North Pasture South Pasture Woods
A A A A A A
A
A
A
A A A
A
A A
A
A A
B B B B B
B
B B
A
B B A A A A A A
Figure 22. Average annual groundwater ammonium nitrogen at the poultry farm.
For each year, numbers with the same letter are not significantly different at the 5% level (p < 0.05)

- 44 -
Table.14. Average annual ammonium nitrogen concentrations in the groundwater monitoring wells at the poultry farm.
2001 2002 2003 2004 2005 2006 Location
----------------------------- NH4-N, mg/L ----------------------------- Building 0.01Aa 0.03Aa 0.03Aa 0.04Aa 0.03Ab 0.01Aa East Pasture 0.01Aa 0.02Aa 0.04Aa 0.01Ab 0.01Ab 0.01Aa Millet Pasture 0.01Ba 0.05Aa 0.01Ba 0.01Bb 0.01Bb 0.01Ba North Pasture 0.01Aa - 0.01Aa 0.01Ab 0.09Aa 0.01Aa South Pasture 0.01Aa 0.03Aa 0.03Aa 0.01Ab 0.01Ab 0.01Aa Woods 0.01Aa 0.03Aa 0.04Aa 0.01Ab 0.01Ab 0.01Aa
Uppercase letters represent significant differences (p<0.05) among annual means for each location Lowercase letters represent significant differences (p<0.05) among means for each year
Barnes Poultry
0
0.02
0.04
0.06
0.08
0.1
2000 2001 2002 2003 2004 2005 2006
Sampling Date
SRP,
µg/
mL
Building East Pasture Millet Pasture North Pasture South Pasture Woods
A
AB
B B B B
A
A
B B B B B B B B
A A A
B B B
AB
A
B B B B
B
A
B B B B
B B
B
B
B
B
A
Barnes Poultry
0
0.02
0.04
0.06
0.08
0.1
2000 2001 2002 2003 2004 2005 2006
Sampling Date
SRP,
µg/
mL
Building East Pasture Millet Pasture North Pasture South Pasture Woods
A
AB
B B B B
A
A
B B B B B B B B
A A A
B B B
AB
A
B B B B
B
A
B B B B
B B
B
B
B
B
A
Figure 23. Average annual groundwater soluble reactive P (SRP) at the poultry farm.
For each year, numbers with the same letter are not significantly different at the 5% level (p < 0.05)

- 45 -
Table 15. Average annual SRP concentrations in the groundwater monitoring wells at the poultry farm.
2000 2001 2002 2003 2004 2005 2006 Location
----------------------------- SRP, µg/ml ----------------------------- Building 0.09Aa 0.04ABa 0.04ABa 0.04ABa 0.05ABa 0.06ABa 0.02Bb East Pasture 0.06Aab 0.03Ba 0.01Cb 0.04Ba 0.01Cb 0.01Cb 0.01Cb Millet Pasture 0.02Ab 0.01Ab 0.01Ab 0.02Ab 0.01Ab 0.02Ab 0.02Ab North Pasture 0.02Ab 0.01Ab - 0.02Ab 0.01b 0.01Ab 0.01Ab South Pasture 0.02Ab 0.01Bb 0.01Bb 0.02Ab 0.01Bb 0.01Bb 0.02Ab Woods 0.02Bb 0.01Cb 0.01Cb 0.03Aab 0.02Bb 0.02Bb 0.03Aa
Uppercase letters represent significant differences (p<0.05) among annual means for each location Lowercase letters represent significant differences (p<0.05) among means for each year
Dairy Farm:
Table 16 summarizes the well characteristics at the Dairy Farm. Figure 24 shows the locations of the groundwater monitoring wells at the dairy, as well as the groundwater flow direction estimated from data gathered in Spring 2001. Groundwater generally flows from east to west across the dairy farm towards the Suwannee River. Tabel 16: Well Characteristics at the Dairy
Dairy Long. W Lat. N MPElevation
(ft) TotDep
(ft) CasDepth
(ft) Open Interval (ft)
well1 -83.0608311 30.04801083 40.43 29 14 15well2 -83.0608383 30.04607472 36.4 29 14 15well3 -83.0608408 30.04420528 44.6 36 21 15well4 -83.0608461 30.04157722 39.12 32 17 15well5 -83.0706658 30.04619139 40.77 32 12 20well6 -83.0558306 30.04581528 45.3 32 12 20well7 -83.0566528 30.04509722 42.42 32 12 20well8 -83.0576744 30.04413583 39.02 28 18 10well9 -83.0562092 30.04104222 41.93 25 10 15well10 -83.0567864 30.04183861 48.88 31 11 20well11 -83.0559539 30.04206111 46.65 42 17 25well12 -83.0544506 30.04175611 46.78 39 19 20well13 -83.0544506 30.04083361 45.4 37 17 20well14 -83.0549375 30.04271778 40.89 36 16 20well15 -83.0546261 30.04358861 43.09 38 13 25well16 -83.0546697 30.0445125 39.63 32 12 20well17 -83.0563225 30.04276417 46.76 39 19 20well18 -83.0556303 30.04342444 41.4 34 14 20well19 -83.0567083 30.04389833 40.31 32 12 20well20 -83.0572461 30.04360139 41.33 33 13 20well21 -83.0568414 30.04184472 48.44 40 15 25

- 46 -
Dairy Ground Water levels; (04/19/01)
Figure 24. Well locations and groundwater flow direction at the dairy farm.
Rainfall data over the study period are shown graphically (Figure 25) and averaged by year (Table 17). Average rainfall for the area is 130 cm/year so rainfall at the dairy farm was generally below average during the study period. Groundwater nitrate concentrations at the dairy farm were the highest of the land-uses monitored. Average nitrate-N concentrations for the dairy ranged from 30 to 50 mg/L (Figure 26). However, as with the wells at the poultry farm, there was considerable variation between individual wells. The highest concentrations (often over 100 mg/L nitrate-N) were observed in one of the wells near the lagoon (well number 20; Figure 3.) and in the denuded areas where cattle are feed and lounge before milking. Well 20 was closed in mid-2005 due to construction of a new lagoon in the area. The lowest concentrations were observed in the area that is going to become the sprayfield. These concentrations were generally 20 mg/L or below except when lagoon slurry was applied during the lagoon cleanout process. There were small, but consistent, increases in nitrate concentrations shortly after slurry application. This suggests that nutrient management plans will have to be followed very carefully on the sprayfield to minimize any effects of nutrients from the irrigated lagoon effluent. Also, groundwater nitrate concentrations may be slow to respond to implemented BMPs at the dairy farm due to the large residual of nitrogen that is present in these soils. Ammonium-N concentrations in the ground water are shown by sampling date in Figure 28 and by yearly averages in Figure 29 and Table 19. As with nitrate-N, the ammonium-N concentrations were the highest of the land-uses monitored. The area around the lagoon and the intensive site had the highest concentrations with values ranging form 15 to 40
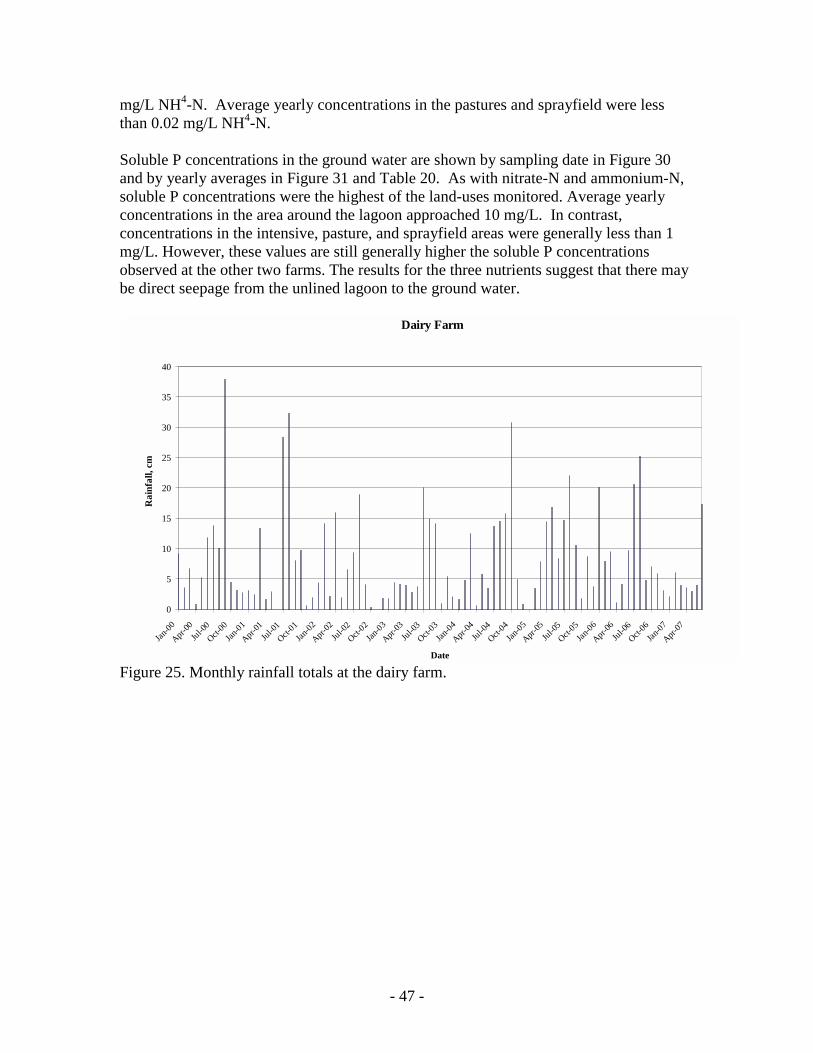
- 47 -
mg/L NH4-N. Average yearly concentrations in the pastures and sprayfield were less than 0.02 mg/L NH4-N. Soluble P concentrations in the ground water are shown by sampling date in Figure 30 and by yearly averages in Figure 31 and Table 20. As with nitrate-N and ammonium-N, soluble P concentrations were the highest of the land-uses monitored. Average yearly concentrations in the area around the lagoon approached 10 mg/L. In contrast, concentrations in the intensive, pasture, and sprayfield areas were generally less than 1 mg/L. However, these values are still generally higher the soluble P concentrations observed at the other two farms. The results for the three nutrients suggest that there may be direct seepage from the unlined lagoon to the ground water.
Dairy Farm
0
5
10
15
20
25
30
35
40
Jan-00
Apr-00
Jul-00Oct-
00Jan
-01
Apr-01
Jul-01
Oct-01
Jan-02
Apr-02
Jul-02Oct-
02Jan
-03
Apr-03
Jul-03Oct-
03Jan
-04
Apr-04
Jul-04Oct-
04Jan
-05
Apr-05
Jul-05
Oct-05
Jan-06
Apr-06
Jul-06Oct-
06Jan
-07
Apr-07
Date
Rai
nfal
l, cm
Figure 25. Monthly rainfall totals at the dairy farm.

- 48 -
Table 17. Monthly rainfall totals at the Dairy Farm 2000 2001 2002 2003 2004 2005 2006 2007
--------------------------------------------- cm -------------------------------------------- January 9.19 3.15 14.17 4.41 4.71 3.31 7.89 6.04 February 3.53 2.34 2.02 4.08 12.50 7.77 9.43 3.83
March 6.65 13.34 15.92 3.95 0.55 14.39 1.04 3.62 April 0.84 1.52 1.89 2.73 5.78 16.79 4.04 2.83 May 5.23 2.84 6.52 3.67 3.48 8.30 9.69 3.99 June 11.81 28.31 9.30 19.99 13.64 14.68 20.46 17.30 July 13.74 32.27 18.96 14.84 14.46 21.91 25.14
August 10.06 8.07 4.07 14.07 15.77 10.48 4.63 September 37.92 9.65 0.25 0.96 30.79 1.78 7.01
October 4.47 0.53 0.01 5.45 4.96 8.65 5.92 November 3.02 1.88 1.82 2.02 0.81 3.67 3.14 December 2.69 4.28 1.80 1.54 0.00 19.97 2.06
Total 109.17 108.19 76.73 77.69 107.43 131.71 100.45 37.59
Dairy Farm
0
50
100
150
200
250
300
4/20/2
000
8/20/2
000
12/20
/2000
4/20/2
001
8/20/2
001
12/20
/2001
4/20/2
002
8/20/2
002
12/20
/2002
4/20/2
003
8/20/2
003
12/20
/2003
4/20/2
004
8/20/2
004
12/20
/2004
4/20/2
005
8/20/2
005
12/20
/2005
4/20/2
006
8/20/2
006
12/20
/2006
4/20/2
007
Sampling Date
NO
3-N
, mg/
L
Average Sprayfield Pasture Intensive Lagoon 8 Lagoon 20
Figure 26. Nitrate concentrations in ground water monitoring wells at the dairy farm. Wells are averaged for each farm component. The sprayfield area represents an area where a new effluent sprayfield was established. Pasture represents cattle grazing areas. Intensive represents the area immediately around the milking barn where cattle are fed and watered. Lagoon 8 and lagoon 20 are wells adjacent to the waste storage lagoon (Figure 3). Well 20 was closed in mid-2005 due to construction of a new lagoon in the area.

- 49 -
These two wells are presented separately because of the great differences in nitrate concentration between the two wells.
Byrd Dairy
0
40
80
120
160
200
2000 2001 2002 2003 2004 2005 2006Sampling Date
NO 3
-N, m
g/L
Lagoon 20 Drainage Intensive Pasture Sprayfield Lagoon 8
A A
B
C
D D
A
B
C D
EE
A
B
C C
D
E
A
B B
CC
D
A
B
C
DD
E
A
B B
C C
D
A
B B
A
Byrd Dairy
0
40
80
120
160
200
2000 2001 2002 2003 2004 2005 2006Sampling Date
NO 3
-N, m
g/L
Lagoon 20 Drainage Intensive Pasture Sprayfield Lagoon 8
A A
B
C
D D
A
B
C D
EE
A
B
C C
D
E
A
B B
CC
D
A
B
C
DD
E
A
B B
C C
D
A
B B
A
Figure 27. Average annual groundwater nitrate nitrogen at the dairy farm. Table 18. Average annual nitrate-N concentrations in the groundwater monitoring wells at the dairy farm.
2000 2001 2002 2003 2004 2005 2006 Location ----------------------------- NO3-N, mg/L -----------------------------
Intensive 53.8BCb 46.0CDc 36.6Dc 57.6ABb 57.9ABc 66.3Ab 54.5BCa
Drainage 77.2DCa 102.6ABb 121.2Ab 65.0DEb 87.0BCb 52.2Eb 55.3Ea Lagoon 20 78.7Ea 129.8BCa 159.3Aa 152.9ABa 112.7CDa 104.8Da -
Lagoon 8 17.3Ad 8.7Be 2.3Ce 3.8Ce 3.0Ce 0.8Cd -
Pasture 32.9Bc 29.4Bd 40.0Ac 34.1ABc 30.0Bd 31.8Bc 32.3Bb
Sprayfield 14.3Dd 14.6De 16.1Dd 25.1Cd 22.7Cd 30.2Ac 27.8Bb
Uppercase letters represent significant differences (p<0.05) among annual means for each location Lowercase letters represent significant differences (p<0.05) among means for each year
For each year, numbers with the same letter are not significantly different at the 5% level (p < 0.05)

- 50 -
Byrd Dairy
0
20
40
60
80
100
120
11/1/
004/5
/01
7/11/0
1
10/17
/01
2/27/0
26/5
/02
9/11/0
2
12/18
/02
4/16/0
3
7/23/0
3
11/13
/03
3/3/20
04
06/08
/04
09/14
/04
01/05
/05
05/11
/05
11/15
/05
6/6/20
06
12/18
/2006
7/10/2
007
Sampling Date
NH
4-N
, mg/
LIntensive Lagoon 8 Lagoon 20 Drainage 19
Figure 28. Ammonium-N concentrations in ground water monitoring wells at the dairy farm. Wells are averaged for each farm component.
Byrd Dairy
0
15
30
45
60
75
90
2001 2002 2003 2004 2005 2006
Sampling Date
NH
4-N
, mg/
L
Intensive Drainage Lagoon 20 Lagoon 8 Pasture Sprayfield
B
C
A
B B
D D
C
AA
D D
CBC
B
A
D D
CC
B
A
D DD
CB
A
E E
A
B B B
Byrd Dairy
0
15
30
45
60
75
90
2001 2002 2003 2004 2005 2006
Sampling Date
NH
4-N
, mg/
L
Intensive Drainage Lagoon 20 Lagoon 8 Pasture Sprayfield
B
C
A
B B
D D
C
AA
D D
CBC
B
A
D D
CC
B
A
D DD
CB
A
E E
A
B B B
Figure 29. Average annual groundwater ammonium-nitrogen at the dairy farm.
For each year, numbers with the same letter are not significantly different at the 5% level (p < 0.05)

- 51 -
Table 19. Average annual ammonium-nitrogen concentrations in the groundwater monitoring wells at the dairy farm.
2001 2002 2003 2004 2005 2006 Location ----------------------------- NH4-N, mg/L -----------------------------
Intensive 19.63ABb 24.86Ab 9.15CDc 13.19BCc 3.86Dd 10.74CDa Drainage 7.92Ac 9.18Ac 11.71Abc 9.77Ac 7.78Ac 2.85Bb
Lagoon 20 49.99Aa 35.12Ba 15.29Cb 20.15Cb 14.39Cb -
Lagoon 8 24.36Bb 33.32Ba 30.43Ba 35.50Ba 81.44Aa -
Pasture 0.08BCd 0.22Ad 0.17ABd 0.15ABCd 0.05Ce 0.10BCb Sprayfield 0.01Ad 0.03Ad 0.02Ad 0.03Ad 0.01Ae 0.01Ab
Uppercase letters represent significant differences (p<0.05) among annual means for each location Lowercase letters represent significant differences (p<0.05) among means for each year
Byrd Dairy
0
5
10
15
20
25
5/9/00
10/4/
00
1/25/0
1
5/31/0
19/6
/01
1/16/0
2
4/25/0
2
7/31/0
2
11/6/
02
2/19/0
3
6/11/0
3
09/17
/03
01/21
/04
4/28/2
004
8/4/20
04
11/09
/04
03/02
/05
09/01
/05
03/15
/06
09/26
/06
4/24/2
007
Sampling Date
SRP,
µg/
mL
Average Sprayfield Pasture Intensive Lagoon 8 Lagoon 20 Drainage 19
Figure 30. Soluble P concentrations in ground water monitoring wells at the dairy farm. Wells are averaged for each farm component.

- 52 -
Byrd Dairy
0
2
4
6
8
10
12
14
16
2000 2001 2002 2003 2004 2005 2006
Sampling Date
SRP,
µg/
mL
Intensive Drainage Lagoon 20 Lagoon 8 Pasture Sprayfield
B
C
B
A
B
C CD
B
A
C
D D E
B
A
C
D DE
C
AA
B
D DD
B
A
C
D DC
BA
B
C CB
A
B
Byrd Dairy
0
2
4
6
8
10
12
14
16
2000 2001 2002 2003 2004 2005 2006
Sampling Date
SRP,
µg/
mL
Intensive Drainage Lagoon 20 Lagoon 8 Pasture Sprayfield
B
C
B
A
B
C CD
B
A
C
D D E
B
A
C
D DE
C
AA
B
D DD
B
A
C
D DC
BA
B
C CB
A
B
Figure 31. Average annual groundwater soluble reactive P at the dairy farm. Table 20. Average annual soluble reactive P concentrations in the groundwater monitoring wells at the dairy farm.
2000 2001 2002 2003 2004 2005 2006 Location ----------------------------- SRP, µg/ml -----------------------------
Intensive 1.49Ac 0.55BCd 0.22Ce 1.41Ac 0.57BCd 0.75Bc 0.35Cb Drainage 3.94Cb 3.78Cb 3.19Cb 7.79Ba 6.58Bb 7.06Bb 13.44Aa Lagoon 20 5.30Ba 5.28Ba 7.11ABa 7.09ABa 8.45Aa 8.07Aa -
Lagoon 8 3.29Bb 2.87BCDc 2.27CDc 3.77Bb 1.99Dc 6.84Ab -
Pasture 1.91Ac 0.66Bd 0.64Bd 0.50BCd 0.36CDd 0.24Dc 0.19Db Sprayfield 1.41Ac 0.43Bd 0.33Bde 0.08Cd 0.06Cd 0.04Cc 0.08Cb
Uppercase letters represent significant differences (p<0.05) among annual means for each location Lowercase letters represent significant differences (p<0.05) among means for each year
Row Crop Farm
Table 21 summarizes the well characteristics at the Row Crop Farm. Figure 32 shows the locations of the groundwater monitoring wells at the Row Crop Farm, and Figure 33 shows the regional groundwater flow direction estimated from data gathered in Spring 2001. Groundwater generally flows from NW to SE across the row crop farm toward the Suwannee River.
For each year, numbers with the same letter are not significantly different at the 5% level (p < 0.05)
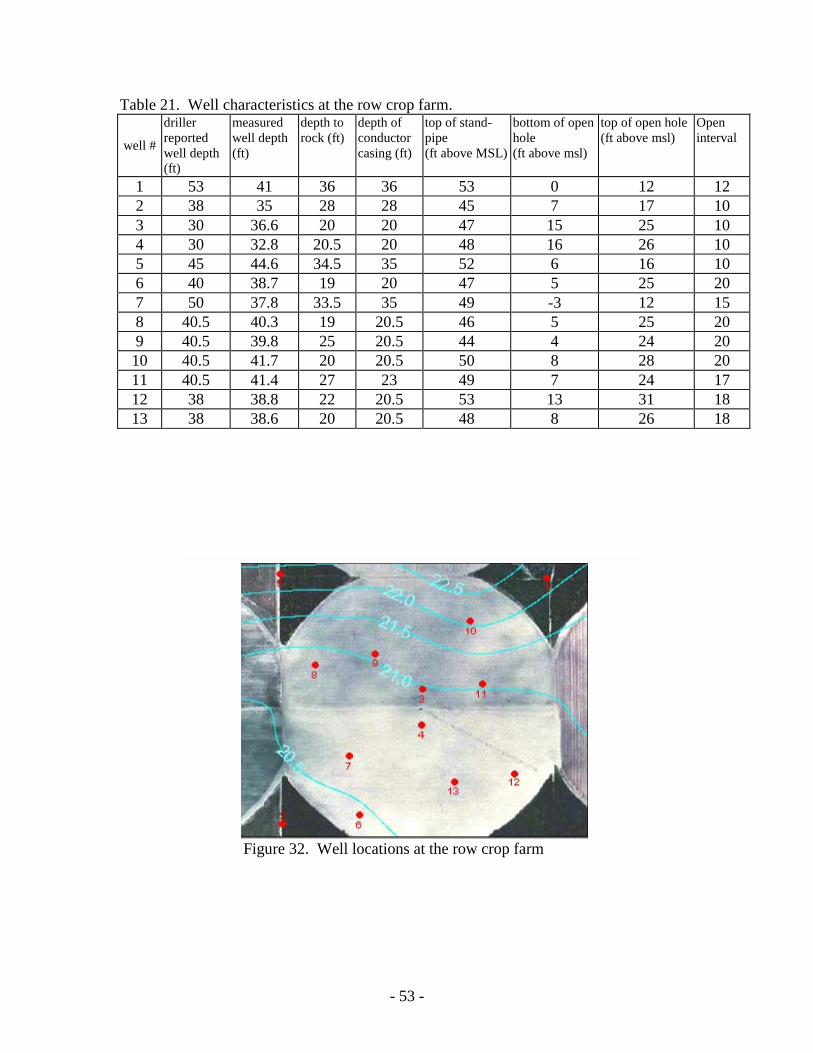
- 53 -
Table 21. Well characteristics at the row crop farm.
well #
driller reported well depth (ft)
measured well depth (ft)
depth to rock (ft)
depth of conductor casing (ft)
top of stand- pipe (ft above MSL)
bottom of open hole (ft above msl)
top of open hole (ft above msl)
Open interval
1 53 41 36 36 53 0 12 12 2 38 35 28 28 45 7 17 10 3 30 36.6 20 20 47 15 25 10 4 30 32.8 20.5 20 48 16 26 10 5 45 44.6 34.5 35 52 6 16 10 6 40 38.7 19 20 47 5 25 20 7 50 37.8 33.5 35 49 -3 12 15 8 40.5 40.3 19 20.5 46 5 25 20 9 40.5 39.8 25 20.5 44 4 24 20
10 40.5 41.7 20 20.5 50 8 28 20 11 40.5 41.4 27 23 49 7 24 17 12 38 38.8 22 20.5 53 13 31 18 13 38 38.6 20 20.5 48 8 26 18
Figure 32. Well locations at the row crop farm

- 54 -
1 km
2 km
N
1 km
2 km
N
Figure 33. Regional groundwater flow direction in the vicinity of the row crop farm. Rainfall data over the study period are shown graphically (Figure 34) and averaged by year (Table 22). Average rainfall for the area is 130 cm/year so rainfall at the row crop farm was generally near average during the study period except for 2006 when it was below average. Due to some uncertainties in previously reported rainfall data for the row crop farm, a new data set for the farm was obtained from the SRWMD. Ground water monitoring data for the row crop farm (Figure 35) are presented for the grower half of the pivot field (grower managed), the BMP half (project managed), and perimeter wells outside of the cropped area. Sweet corn (SWC), cotton (COT), Potatoes (POT), tropical corn (TC), peanuts (Pnuts) and carrots were the crops grown during this evaluation period. Emphasis for management was given to the two crops that are heavy users of fertilizer, i.e., sweet corn and potatoes. Fertilizer and irrigation management were emphasized in the BMP program for the project-managed half of the field. Fertilizer BMPs consisted of decreasing the amounts of fertilizer used and improving the application time relative to crop needs. Irrigation BMPs involved improved management of the amount and timing of irrigation applied. Fertilizer and irrigation BMP details are given in the appendices. The effects of the cropping activities are readily seen by comparing the nitrate concentrations in the perimeter wells to those in the cropped areas. In the perimeter wells, nitrate-N concentrations were generally near 5 mg/L until the middle of 2003 when the concentrations started to approach 10 mg/L. We were not able to ascertain the reason(s) for this increase although there were significant amounts of rainfall during the preceding months. It should also be noted that this field is surrounded
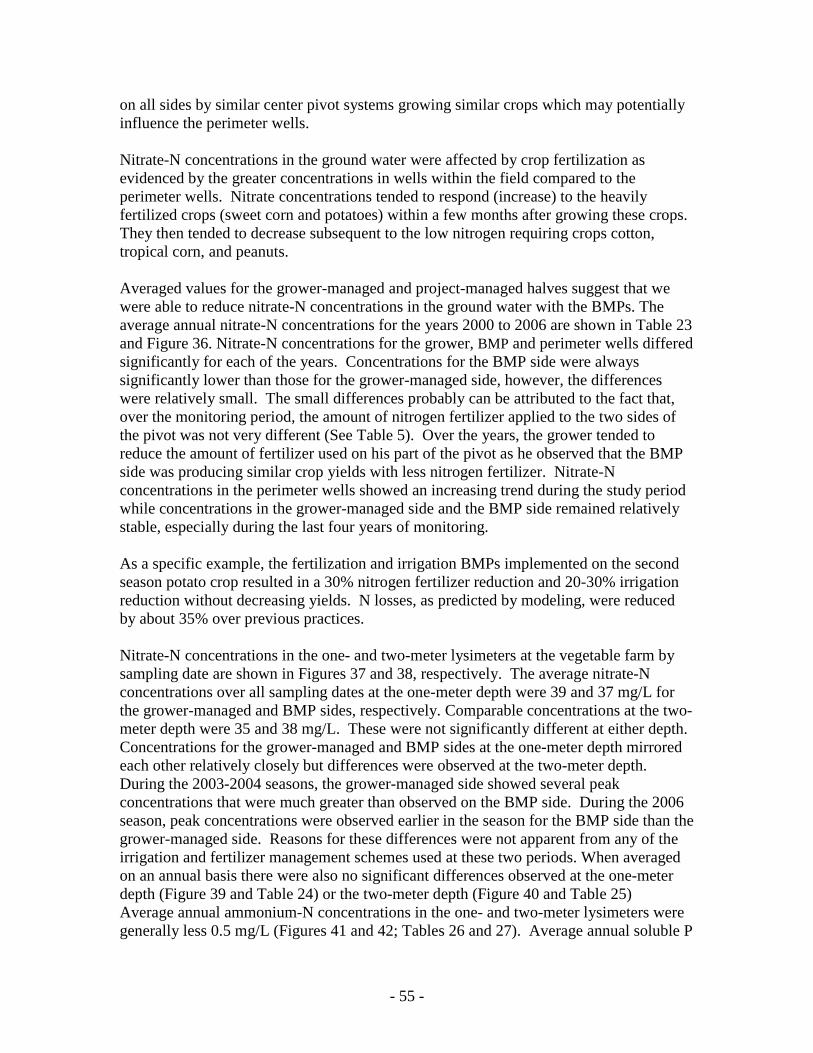
- 55 -
on all sides by similar center pivot systems growing similar crops which may potentially influence the perimeter wells. Nitrate-N concentrations in the ground water were affected by crop fertilization as evidenced by the greater concentrations in wells within the field compared to the perimeter wells. Nitrate concentrations tended to respond (increase) to the heavily fertilized crops (sweet corn and potatoes) within a few months after growing these crops. They then tended to decrease subsequent to the low nitrogen requiring crops cotton, tropical corn, and peanuts. Averaged values for the grower-managed and project-managed halves suggest that we were able to reduce nitrate-N concentrations in the ground water with the BMPs. The average annual nitrate-N concentrations for the years 2000 to 2006 are shown in Table 23 and Figure 36. Nitrate-N concentrations for the grower, BMP and perimeter wells differed significantly for each of the years. Concentrations for the BMP side were always significantly lower than those for the grower-managed side, however, the differences were relatively small. The small differences probably can be attributed to the fact that, over the monitoring period, the amount of nitrogen fertilizer applied to the two sides of the pivot was not very different (See Table 5). Over the years, the grower tended to reduce the amount of fertilizer used on his part of the pivot as he observed that the BMP side was producing similar crop yields with less nitrogen fertilizer. Nitrate-N concentrations in the perimeter wells showed an increasing trend during the study period while concentrations in the grower-managed side and the BMP side remained relatively stable, especially during the last four years of monitoring. As a specific example, the fertilization and irrigation BMPs implemented on the second season potato crop resulted in a 30% nitrogen fertilizer reduction and 20-30% irrigation reduction without decreasing yields. N losses, as predicted by modeling, were reduced by about 35% over previous practices. Nitrate-N concentrations in the one- and two-meter lysimeters at the vegetable farm by sampling date are shown in Figures 37 and 38, respectively. The average nitrate-N concentrations over all sampling dates at the one-meter depth were 39 and 37 mg/L for the grower-managed and BMP sides, respectively. Comparable concentrations at the two-meter depth were 35 and 38 mg/L. These were not significantly different at either depth. Concentrations for the grower-managed and BMP sides at the one-meter depth mirrored each other relatively closely but differences were observed at the two-meter depth. During the 2003-2004 seasons, the grower-managed side showed several peak concentrations that were much greater than observed on the BMP side. During the 2006 season, peak concentrations were observed earlier in the season for the BMP side than the grower-managed side. Reasons for these differences were not apparent from any of the irrigation and fertilizer management schemes used at these two periods. When averaged on an annual basis there were also no significant differences observed at the one-meter depth (Figure 39 and Table 24) or the two-meter depth (Figure 40 and Table 25) Average annual ammonium-N concentrations in the one- and two-meter lysimeters were generally less 0.5 mg/L (Figures 41 and 42; Tables 26 and 27). Average annual soluble P

- 56 -
concentrations in the one- and two-meter lysimeters were generally less than 0.06 mg/L, respectively (Figures 43 and 44; Tables 28 and 29). There were no meaningful effects between treatments or years for either nutrient.
Row Crop Farm (Pivot 12)
0.00
5.00
10.00
15.00
20.00
25.00
30.00
35.00
40.00
45.00
Aug-01
Nov-01Feb-02
May-02Aug-02
Nov-02Feb-03
May-03Aug-03
Nov-03Feb-04
May-04Aug-04
Nov-04Feb-05
May-05Aug-05
Nov-05Feb-06
May-06Aug-06
Nov-06Feb-07
May-07Aug-07
Date
Rai
nfal
l, cm
Figure 34. Monthly rainfall totals at the row crop farm. Table 22. Monthly rainfall totals at the row crop farm*.
2001 2002 2003 2004 2005 2006 2007 -------------------------------------------------- cm ------------------------------------------------- January 16.23 3.07 3.94 3.53 9.40 9.91 February 1.83 18.21 16.84 9.65 8.92 3.51 March 13.41 31.50 2.16 16.48 1.09 3.12 April 6.78 8.79 3.35 16.23 2.82 1.85 May 4.14 2.13 2.51 8.89 5.87 4.17 June 11.30 19.33 15.14 16.99 21.74 15.49 July 17.65 16.92 10.77 22.76 13.13 12.22 August 5.49 17.27 20.83 19.15 13.49 11.18 17.40 September 8.28 9.42 4.57 42.27 1.98 8.64 6.96 October 0.58 17.22 15.72 5.49 4.80 4.75 0.00 November 1.63 10.82 4.83 5.18 3.53 4.72 0.00 December 3.71 13.08 4.17 9.50 18.82 9.04 0.00 Total 19.69 139.17 150.06 136.30 137.16 101.30 74.63
* Data obtained from the Suwannee River Water Management District monitoring sites at the row crop farm.

- 57 -
Row Crop Farm (Pivot 12)
0.0
10.0
20.0
30.0
40.0
50.0
1/3/00
4/2/00
7/1/00
9/29/0
0
12/28
/00
3/28/0
1
6/26/0
1
9/24/0
1
12/23
/01
3/23/0
2
6/21/0
2
9/19/0
2
12/18
/02
3/18/0
3
6/16/0
3
9/14/0
3
12/13
/03
3/12/0
4
6/10/0
49/8
/04
12/7/
043/7
/056/5
/059/3
/05
12/2/
053/2
/06
5/31/0
6
8/29/0
6
11/27
/06
2/25/0
7
5/26/0
7
8/24/0
7
Sampling Date
NO
3-N
, mg/
L
Perimeter Grower BMP
SWCCOT P TC P Pnuts SC Carrots SC Pnuts CC SWC SCP O
Figure 35. Nitrate concentrations in ground water monitoring wells at the row crop farm. Perimeter represents the three wells outside of the cropped field. The grower and BMP halves of the field represent areas that were managed by the grower and by the project staff, respectively.
Row Crop Farm
0
10
20
30
40
2000 2001 2002 2003 2004 2005 2006
Sampling Date
NO
3-N
, mg/
L
Perimeter Grower BMP
C
AB
C
A
B
C
A
B
C
AB
C
A
B
C
A
B
A
AB
Row Crop Farm
0
10
20
30
40
2000 2001 2002 2003 2004 2005 2006
Sampling Date
NO
3-N
, mg/
L
Perimeter Grower BMP
C
AB
C
A
B
C
A
B
C
AB
C
A
B
C
A
B
A
AB
Figure 36. Average annual nitrate concentrations in ground water monitoring wells at the row crop farm.
For each year, numbers with the same letter are not significantly different at the 5% level (p < 0.05)

- 58 -
Table 23. Average annual nitrate concentrations in the groundwater monitoring wells at the row crop farm.
2000 2001 2002 2003 2004 2005 2006 Location ------------------------------------------- NO3-N, mg/L ----------------------------------------
Perimeter 5.3CDc 4.7CDc 4.2Dc 6.0BCc 7.2ABc 7.9Ac 8.4Ac Grower 24.8Ea 29.1BCa 30.7Ba 28.0CDa 32.7Aa 28.7CDa 27.2Da
BMP 23.2Ab 24.9Ab 25.3Ab 26.5Ab 25.8Ab 25.4Ab 23.2Ab
Percent Difference* 6.4 % 14.6 % 17.6 % 5.4 % 21.1 % 11.3 % 14.7 % Uppercase letters represent significant differences (p<0.05) among annual means for each location Lowercase letters represent significant differences (p<0.05) among means for each year * Percent Difference between the annual means of the grower and the BMP halves
Suwannee Farms Lysimeter Nitrate ConcentrationsOne Meter Depth
0
25
50
75
100
125
150
175
200
4/18/2
001
7/18/2
001
10/18
/2001
1/18/2
002
4/18/2
002
7/18/2
002
10/18
/2002
1/18/2
003
4/18/2
003
7/18/2
003
10/18
/2003
1/18/2
004
4/18/2
004
7/18/2
004
10/18
/2004
1/18/2
005
4/18/2
005
7/18/2
005
10/18
/2005
1/18/2
006
4/18/2
006
7/18/2
006
10/18
/2006
1/18/2
007
4/18/2
007
7/18/2
007
Sampling Date
Nitr
ate-
N, m
g/L
Grower BMP
Figure 37. Nitrate-N concentrations in the one-meter lysimeters samples (soil solution) for the “grower” and “BMP” sides of the pivot.
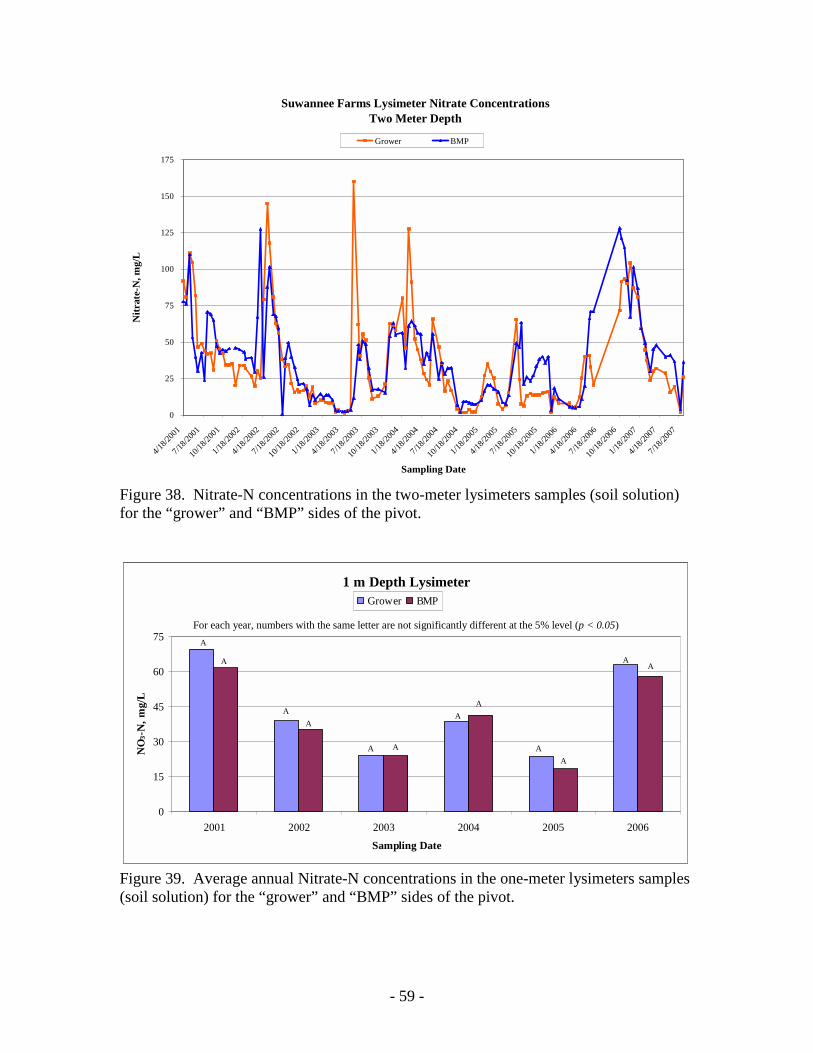
- 59 -
Suwannee Farms Lysimeter Nitrate ConcentrationsTwo Meter Depth
0
25
50
75
100
125
150
175
4/18/2
001
7/18/2
001
10/18
/2001
1/18/2
002
4/18/2
002
7/18/2
002
10/18
/2002
1/18/2
003
4/18/2
003
7/18/2
003
10/18
/2003
1/18/2
004
4/18/2
004
7/18/2
004
10/18
/2004
1/18/2
005
4/18/2
005
7/18/2
005
10/18
/2005
1/18/2
006
4/18/2
006
7/18/2
006
10/18
/2006
1/18/2
007
4/18/2
007
7/18/2
007
Sampling Date
Nitr
ate-
N, m
g/L
Grower BMP
Figure 38. Nitrate-N concentrations in the two-meter lysimeters samples (soil solution) for the “grower” and “BMP” sides of the pivot.
1 m Depth Lysimeter
0
15
30
45
60
75
2001 2002 2003 2004 2005 2006
Sampling Date
NO
3-N
, mg/
L
Grower BMP
A
A
AA
A A
AA
AA
AA
1 m Depth Lysimeter
0
15
30
45
60
75
2001 2002 2003 2004 2005 2006
Sampling Date
NO
3-N
, mg/
L
Grower BMP
A
A
AA
A A
AA
AA
AA
Figure 39. Average annual Nitrate-N concentrations in the one-meter lysimeters samples (soil solution) for the “grower” and “BMP” sides of the pivot.
For each year, numbers with the same letter are not significantly different at the 5% level (p < 0.05)

- 60 -
2 m Depth Lysimeter
0.0
15.0
30.0
45.0
60.0
75.0
2001 2002 2003 2004 2005 2006
Sampling Date
NO
3-N
, mg/
LGrower BMP
AA
A
A
AA
AA
B
A
A
A
2 m Depth Lysimeter
0.0
15.0
30.0
45.0
60.0
75.0
2001 2002 2003 2004 2005 2006
Sampling Date
NO
3-N
, mg/
LGrower BMP
AA
A
A
AA
AA
B
A
A
A
Figure. 40. Nitrate-N in the two-meter lysimeters samples (soil solution) for the “grower” and “BMP” sides of the pivot. Table 24. Average annual nitrate-N concentrations in the one-meter lysimeters at the row crop farm.
2001 2002 2003 2004 2005 2006 Location ------------------------------------ NO3-N, mg/L ----------------------------------
Grower 69.5Aa 39.1Ba 23.9Ca 38.7Ba 23.6Ca 63.1Aa
BMP 61.6Aa 35.2BCa 23.9CDa 41.3Ba 18.2Da 57.9Aa Uppercase letters represent significant differences (p<0.05) among annual means for each location Lowercase letters represent significant differences (p<0.05) among means for each year Table 25. Average annual nitrate-N concentrations in the two-meter lysimeters at the row crop farm.
2001 2002 2003 2004 2005 2006 Location ------------------------------------ NO3-N, mg/L ----------------------------------
Grower 60.5Aa 38.8Ba 28.5BCa 34.1Ba 16.6Cb 43.8Ba BMP 56.1Aa 42.1Ba 21.5Da 33.4BCa 26.0CDa 53.2Aa
Uppercase letters represent significant differences (p<0.05) among annual means for each location Lowercase letters represent significant differences (p<0.05) among means for each year
For each year, numbers with the same letter are not significantly different at the 5% level (p < 0.05)
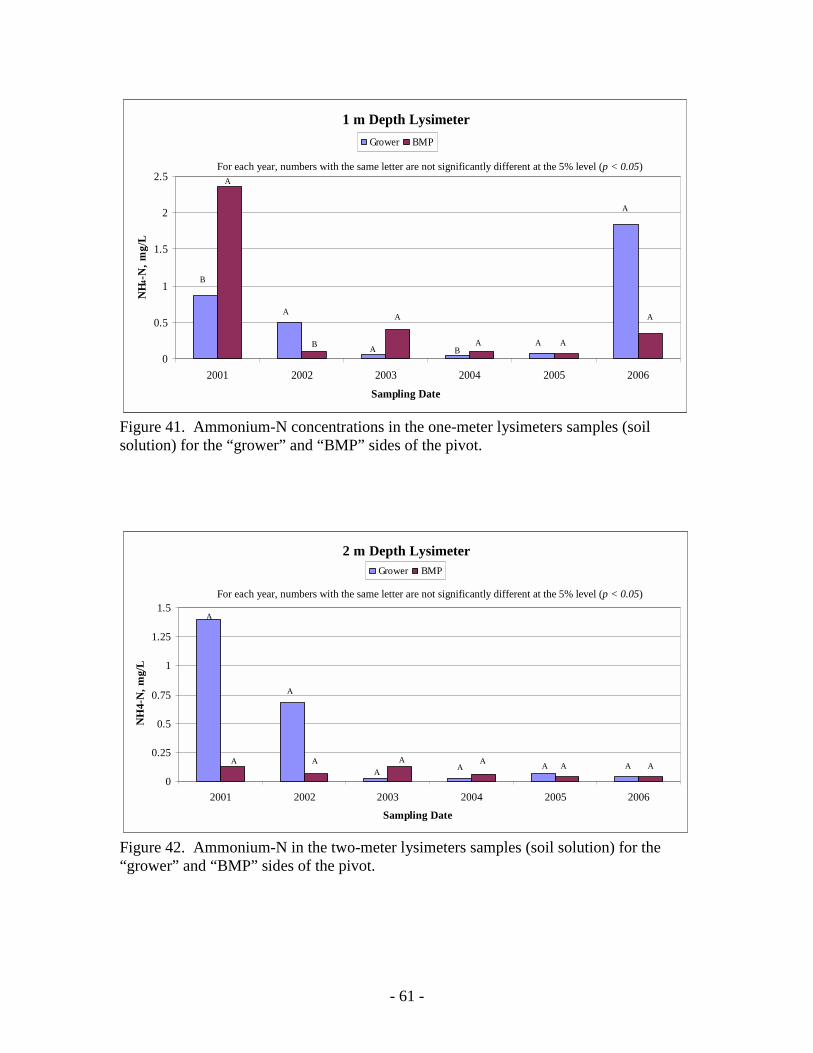
- 61 -
1 m Depth Lysimeter
0
0.5
1
1.5
2
2.5
2001 2002 2003 2004 2005 2006
Sampling Date
NH 4
-N, m
g/L
Grower BMP
B
A
A
B A
A
BA A A
A
A
1 m Depth Lysimeter
0
0.5
1
1.5
2
2.5
2001 2002 2003 2004 2005 2006
Sampling Date
NH 4
-N, m
g/L
Grower BMP
B
A
A
B A
A
BA A A
A
A
Figure 41. Ammonium-N concentrations in the one-meter lysimeters samples (soil solution) for the “grower” and “BMP” sides of the pivot.
2 m Depth Lysimeter
0
0.25
0.5
0.75
1
1.25
1.5
2001 2002 2003 2004 2005 2006
Sampling Date
NH
4-N
, mg/
L
Grower BMP
A
A
A
AA
AA
A A A A A
2 m Depth Lysimeter
0
0.25
0.5
0.75
1
1.25
1.5
2001 2002 2003 2004 2005 2006
Sampling Date
NH
4-N
, mg/
L
Grower BMP
A
A
A
AA
AA
A A A A A
Figure 42. Ammonium-N in the two-meter lysimeters samples (soil solution) for the “grower” and “BMP” sides of the pivot.
For each year, numbers with the same letter are not significantly different at the 5% level (p < 0.05)
For each year, numbers with the same letter are not significantly different at the 5% level (p < 0.05)

- 62 -
Table 26. Average annual ammonium-N concentrations in the one-meter lysimeters at the row crop farm.
2001 2002 2003 2004 2005 2006 Location ------------------------------------ NH4-N, mg/L ----------------------------------
Grower 0.86Bb 0.50Ba 0.05Ba 0.04Ba 0.08Ba 1.84Aa BMP 2.36Aa 0.10Bb 0.4Ba 0.10Bb 0.07Ba 0.34Ba
Uppercase letters represent significant differences (p<0.05) among annual means for each location Lowercase letters represent significant differences (p<0.05) among means for each year Table 27. Average annual ammonium-N concentrations in the two-meter lysimeters at the row crop farm.
2001 2002 2003 2004 2005 2006 Location ------------------------------------ NH4-N, mg/L ----------------------------------
Grower 1.40Aa 0.68ABa 0.03Ba 0.03Ba 0.07Ba 0.04Ba
BMP 0.13Aa 0.07Aa 0.13Aa 0.06Aa 0.04Aa 0.04Aa Uppercase letters represent significant differences (p<0.05) among annual means for each location Lowercase letters represent significant differences (p<0.05) among means for each year
1 m Depth Lysimeter
0
0.02
0.04
0.06
0.08
2001 2002 2003 2004 2005 2006
Sampling Date
SRP,
µg/
mL
Grower BMP
A
B
A
A
A
A
A
A
1 m Depth Lysimeter
0
0.02
0.04
0.06
0.08
2001 2002 2003 2004 2005 2006
Sampling Date
SRP,
µg/
mL
Grower BMP
A
B
A
A
A
A
A
A
Figure 43. Soluble Reactive P in the one-meter lysimeters samples (soil solution) for the “grower” and “BMP” sides of the pivot.
For each year, numbers with the same letter are not significantly different at the 5% level (p < 0.05)
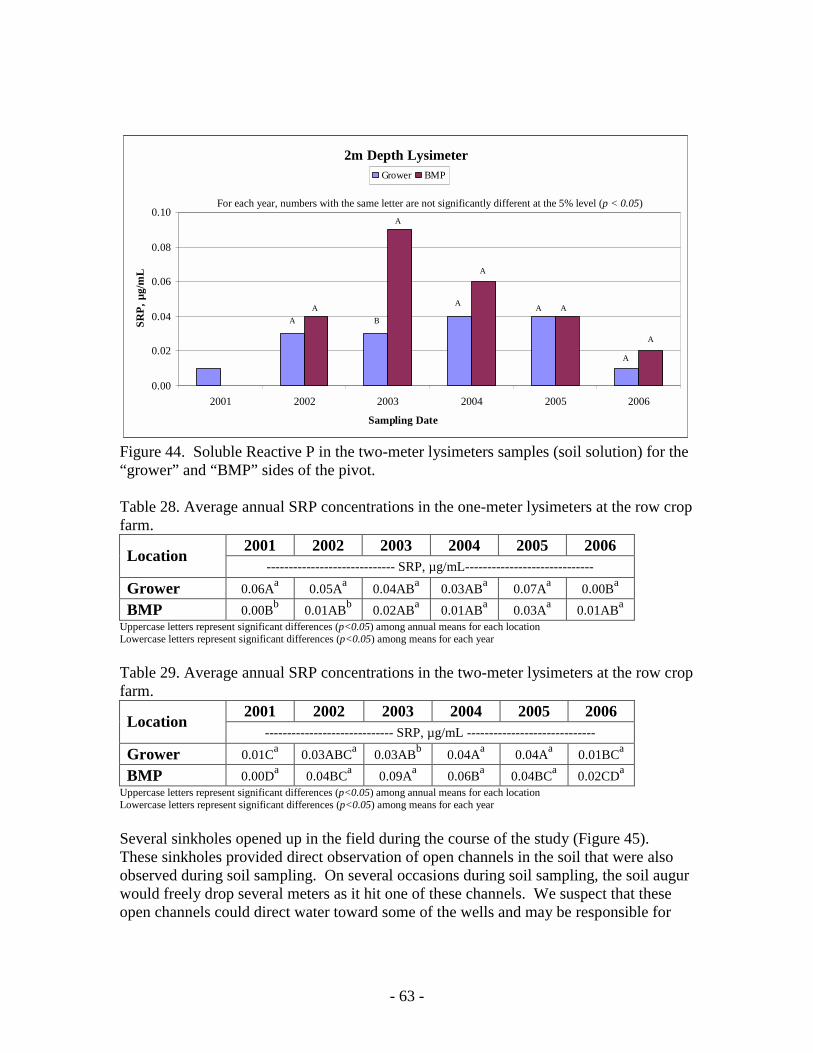
- 63 -
2m Depth Lysimeter
0.00
0.02
0.04
0.06
0.08
0.10
2001 2002 2003 2004 2005 2006
Sampling Date
SRP,
µg/
mL
Grower BMP
AA
B
A
A
A
A A
A
A
2m Depth Lysimeter
0.00
0.02
0.04
0.06
0.08
0.10
2001 2002 2003 2004 2005 2006
Sampling Date
SRP,
µg/
mL
Grower BMP
AA
B
A
A
A
A A
A
A
Figure 44. Soluble Reactive P in the two-meter lysimeters samples (soil solution) for the “grower” and “BMP” sides of the pivot. Table 28. Average annual SRP concentrations in the one-meter lysimeters at the row crop farm.
2001 2002 2003 2004 2005 2006 Location ----------------------------- SRP, µg/mL-----------------------------
Grower 0.06Aa 0.05Aa 0.04ABa 0.03ABa 0.07Aa 0.00Ba BMP 0.00Bb 0.01ABb 0.02ABa 0.01ABa 0.03Aa 0.01ABa
Uppercase letters represent significant differences (p<0.05) among annual means for each location Lowercase letters represent significant differences (p<0.05) among means for each year Table 29. Average annual SRP concentrations in the two-meter lysimeters at the row crop farm.
2001 2002 2003 2004 2005 2006 Location ----------------------------- SRP, µg/mL -----------------------------
Grower 0.01Ca 0.03ABCa 0.03ABb 0.04Aa 0.04Aa 0.01BCa BMP 0.00Da 0.04BCa 0.09Aa 0.06Ba 0.04BCa 0.02CDa
Uppercase letters represent significant differences (p<0.05) among annual means for each location Lowercase letters represent significant differences (p<0.05) among means for each year Several sinkholes opened up in the field during the course of the study (Figure 45). These sinkholes provided direct observation of open channels in the soil that were also observed during soil sampling. On several occasions during soil sampling, the soil augur would freely drop several meters as it hit one of these channels. We suspect that these open channels could direct water toward some of the wells and may be responsible for
For each year, numbers with the same letter are not significantly different at the 5% level (p < 0.05)

- 64 -
some of the variability that we observed in the nitrate-N concentrations in the wells, particularly on the BMP half of the pivot.
Figure 45. An example of a sinkhole that opened in the demonstration field during the course of the project. Also note the open channels that were exposed by the sinkhole. Since the 2003 potato crop was moved to a different field (without monitoring wells), we installed vacuum lysimeters in the field to monitor soil solution nitrate-N concentrations. Lysimeters were installed at 1 and 2 meter depths and at the surface of the clay layer which was generally in the vicinity of 5 meters deep. Ten locations were sampled within the pivot. The average NO3-N concentration in the lysimeter water samples for each depth is shown in Figure 46. Nitrate-N concentrations begin to increase at the one-meter depth during April with major increases noted during the May sampling dates. This nitrate began showing up at the two-meter depth during May. The deeper lysimeters at the clay layer did not reflect any increased nitrate concentrations during the study period. Lysimeter sampling was suspended on May 25th as the lysimeters had to be removed from the field prior to harvesting. The relatively high nitrate-N concentrations at the one meter depth, which is below the root zone of potatoes, are indicative of the difficulty of keeping nitrate in the root zone of crops such as potatoes.

- 65 -
POTATO LYSIMETER NITRATE-NSpring 2003
0
20
40
60
80
100
120
140
03/07/03 03/20/03 04/02/03 04/17/03 05/05/03 05/14/03 05/23/03
Sampling Date
Nitr
ate-
N, m
g/L
123
Planting Date (February 7 - 13)Preplant - 0 nitrogenAt plant - 45 lbs nitrogen (February 8)1st sidedress - 85 lbs nitrogen (March 12)2nd sidedress - 85 lbs nitrogen (March 24)Pivot application - 35 lbs nitrogen (April 18)Totaling = 250 lbs N
Figure 46. Nitrate-N concentrations in the soil solution extracted with vacuum lysimeters in the 2003 potato field. Lysimeters were installed at 1 and 2 meters depths plus at the upper surface of the clay layer within the soil profile. Soil Profile Monitoring Results The soil profile was sampled at 50 cm intervals to a depth of 2 meters and thereafter, 100 cm increments until the clay layer was reached at approximately 6-week intervals at the poultry, dairy and vegetable farms. At the beginning of the study, sample locations were selected at each site to provide a representative coverage of the various farm components, i.e., fields or pivot quadrants. On subsequent sampling dates (approximately 5-week intervals), sample locations were selected on a 5-meter radius around the initial sample location. Even with a 5-meter radius considerable variation was observed in depth of the clay layer. This makes it difficult to summarize the data strictly on soil profile depth. Therefore, data have been summarized for each site by calculating the average nitrate-N concentration in the soil profile for each sampling date. The average profile depth for each farm component is also presented to provide an indication of clay layer depth. Poultry Farm The clay layer at the poultry farm was generally 1-2 meter below the soil surface (Figure 47). This is shallower than the clay layers at the dairy and vegetable farms. It also appeared to be the most contiguous compared to the dairy and vegetable farms. During the soil sampling process, there few times that a definite clay layer was not found at the poultry farm.

- 66 -
The soil profile nitrate concentration for the poultry farm by sampling date is shown in Figure 48. The values have also been averaged on an annual basis (Table 30 and Figure 49). The NRCS conservation plan, which was implemented in late 2001, calls for more uniform manure application on the various fields. The plan also calls for improved timing of application to coincide better with crop uptake. Soil nitrate-N levels have decreased in all components of the poultry farm since the initiation of the BMP program. For example, the amount of nitrate-N in the soil profile (1-m depth), averaged over all farm components was 76 and 26 kg/ha for the years 2000 and 2006, respectively. The highest concentrations were observed in the north and south pastures which coincides with the highest nitrate concentrations in the monitoring wells. These are the two areas that appear to have historically received the largest amount of poultry manure. The north pasture is a small area (3-4 acres) immediately next to the poultry houses and appears to have received more manure than the other pastures, likely due to its proximity to the bird houses. The average soil profile ammonium-N concentration for the poultry farm is shown in Figure 50. The values have also been averaged on an annual basis (Table 31 and Figure 51). The amount of ammonium-N in the profile remained relatively uniform over the study period. i.e., the amount of ammonium-N in the soil profile (1-m depth), averaged over all farm components was 32.6 and 31.9 kg/ha for the years 2000 and 2006, respectively. The amount of ammonium-N in the soil reflects both the mineralization of organic N in the manure and the conversion of ammonium to nitrate by microbes in the soil. These processes likely mask the effect of manure loading resulting in similar amount of ammonium-N in the soil at any given time. However, the ammonium-N will be eventually reflected in the nitrate load in the soil. Water soluble P in the soil was also monitored through 2003 (Figures 52 and 53; Table 32). Concentrations in the wooded area were below detectable levels (data not shown) but concentrations in all the components of the farm receiving manure showed elevated levels of water soluble P. The importance of these levels cannot be ascertained without further evaluation of the soil’s ability to retain P.

- 67 -
Poultry Farm
0
50
100
150
200
250
300
1/18/2
001
4/18/2
001
7/17/2
001
10/15
/2001
1/13/2
002
4/13/2
002
7/12/2
002
10/10
/2002
1/8/20
03
4/8/20
03
7/7/20
03
10/5/
2003
1/3/20
04
4/2/20
04
7/1/20
04
9/29/2
004
12/28
/2004
3/28/2
005
6/26/2
005
9/24/2
005
12/23
/2005
3/23/2
006
Sampling Date
Ave
rage
Pro
file
Dep
th, c
mBird House Area East Pasture Millet Pasture North Pasture South Pasture
Figure 47. Average depth to the clay layer at the poultry farm.
Poultry Farm
0
100
200
300
400
500
7/1/00
11/1/
003/1
/017/1
/01
11/1/
013/1
/027/1
/02
11/1/
023/1
/037/1
/03
11/1/
033/1
/047/1
/04
11/1/
043/1
/057/1
/05
11/1/
053/1
/067/1
/06
11/1/
063/1
/07
Sampling Date
NO
3-N
, kg/
ha
Bird House Area North Pasture South Pasture East pasture Millet Pasture
Figure 48. Average nitrate-N concentrations in the soil profile by sampling date (1 m depth) at the poultry farm.

- 68 -
Barnes Poultry
0
40
80
120
160
200
2000 2001 2002 2003 2004 2005 2006
Sampling Date
NO
3 -N
, kg/
haBird House East Pasture Millet Pasture North Pasture South Pasture
B
AB
A A
AB
C
BC
A AB A
D
CDC
A
B
BB
BA
AB
CBC
ABA
AB
B
ABA A A
A
AB AB ABA
Barnes Poultry
0
40
80
120
160
200
2000 2001 2002 2003 2004 2005 2006
Sampling Date
NO
3 -N
, kg/
haBird House East Pasture Millet Pasture North Pasture South Pasture
B
AB
A A
AB
C
BC
A AB A
D
CDC
A
B
BB
BA
AB
CBC
ABA
AB
B
ABA A A
A
AB AB ABA
Figure 49. Average nitrate-N concentrations in the soil profile by year (1 m depth) at the poultry farm. Table 30. Nitrate-N in the soil profile (1 m depth) on a yearly basis at the poultry farm.
2000 2001 2002 2003 2004 2005 2006 Location ------------------------------------- NO3-N, kg/ha ----------------------------------------- Bird House 23.9Ab 20.7Ac 8.6Ad 25.3Ab 9.8Ac 10.3Ab 11.0Ab East Pasture 66.6Aab 43.5ABbc 39.7Bcd 20.7Bb 25.2Bbc 34.8Bab 26.9Bab
Millet Pasture 107.2Aa 105.5Aa 48.9Bc 33.5Bb 47.0Bab 39.0Ba 23.3Bab North Pasture 111.9ABa 88.7BCab 156.3Aa 53.5CDa 54.1CDa 39.7Da 27.5Dab South Pasture 72.0BCab 99.1ABa 104.1Ab 35.6Dab 36.7Dab 46.0CDa 41.6CDa
Uppercase letters represent significant differences (p<0.05) among annual means for each location Lowercase letters represent significant differences (p<0.05) among means for each year
For each year, numbers with the same letter are not significantly different at the 5% level (p < 0.05)

- 69 -
Barnes Poultry
0
30
60
90
120
150
180
Jul-00
Nov-00
Mar-01
Jul-01
Nov-01
Mar-02
Jul-02
Nov-02
Mar-03
Jul-03
Nov-03
Mar-04
Jul-04
Nov-04
Mar-05
Jul-05
Nov-05
Mar-06
Jul-06
Nov-06
Mar-07
Sampling Date
NH
4 -N
, kg/
haBird House Area North Pasture South Pasture East pasture Millet Pasture
Figure 50. Average ammonium-N concentrations in the soil profile (1 m depth) at the poultry farm.
Barnes Poultry
0
15
30
45
60
2000 2001 2002 2003 2004 2005 2006
Sampling Date
NH
4 -N
, kg/
ha
Bird House East Pasture Millet Pasture North Pasture South Pasture
A
A
A
A
A
AA
A
AA
CC C
A
B
A A A
AA
A A
A
AA
BB B
AB
A
BB B
B
A
Barnes Poultry
0
15
30
45
60
2000 2001 2002 2003 2004 2005 2006
Sampling Date
NH
4 -N
, kg/
ha
Bird House East Pasture Millet Pasture North Pasture South Pasture
A
A
A
A
A
AA
A
AA
CC C
A
B
A A A
AA
A A
A
AA
BB B
AB
A
BB B
B
A
Figure 51. Average ammonium-N concentrations in the soil profile (1 m depth) at the poultry farm.
For each year, numbers with the same letter are not significantly different at the 5% level (p < 0.05)
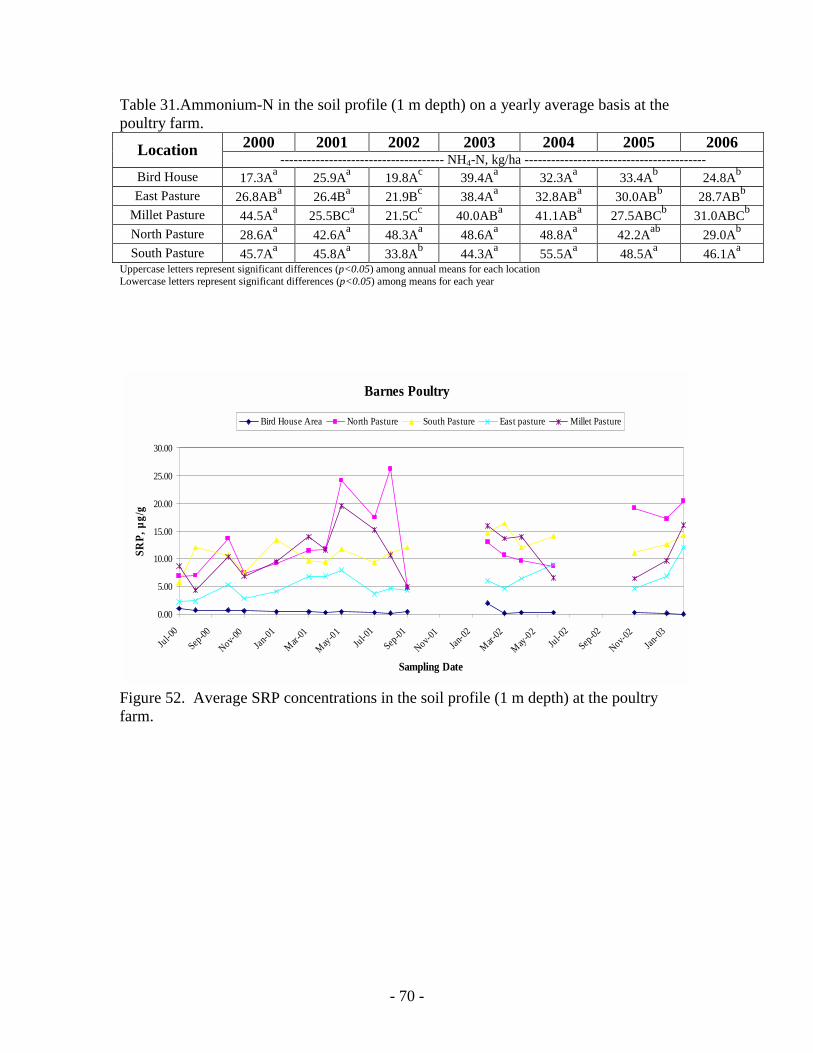
- 70 -
Table 31.Ammonium-N in the soil profile (1 m depth) on a yearly average basis at the poultry farm.
2000 2001 2002 2003 2004 2005 2006 Location ------------------------------------- NH4-N, kg/ha ----------------------------------------- Bird House 17.3Aa 25.9Aa 19.8Ac 39.4Aa 32.3Aa 33.4Ab 24.8Ab East Pasture 26.8ABa 26.4Ba 21.9Bc 38.4Aa 32.8ABa 30.0ABb 28.7ABb
Millet Pasture 44.5Aa 25.5BCa 21.5Cc 40.0ABa 41.1ABa 27.5ABCb 31.0ABCb North Pasture 28.6Aa 42.6Aa 48.3Aa 48.6Aa 48.8Aa 42.2Aab 29.0Ab South Pasture 45.7Aa 45.8Aa 33.8Ab 44.3Aa 55.5Aa 48.5Aa 46.1Aa
Uppercase letters represent significant differences (p<0.05) among annual means for each location Lowercase letters represent significant differences (p<0.05) among means for each year
Barnes Poultry
0.00
5.00
10.00
15.00
20.00
25.00
30.00
Jul-00
Sep-00
Nov-00
Jan-01
Mar-01
May-01Jul-0
1Sep
-01
Nov-01
Jan-02
Mar-02
May-02Jul-0
2Sep
-02
Nov-02
Jan-03
Sampling Date
SRP,
µg/
g
Bird House Area North Pasture South Pasture East pasture Millet Pasture
Figure 52. Average SRP concentrations in the soil profile (1 m depth) at the poultry farm.

- 71 -
Barnes Poultry
0
4
8
12
16
20
2000 2001 2002 2003
Sampling Date
SRP,
µg/
gBird House East Pasture Millet Pasture North Pasture South Pasture
B
B
AA
A
C
B
A
A
A
C
B
AA
A
C
B
AB
A
AB
Barnes Poultry
0
4
8
12
16
20
2000 2001 2002 2003
Sampling Date
SRP,
µg/
gBird House East Pasture Millet Pasture North Pasture South Pasture
B
B
AA
A
C
B
A
A
A
C
B
AA
A
C
B
AB
A
AB
Figure 53. Average SRP concentrations in the soil profile (1 m depth) at the poultry farm. Table 32. Average SRP concentrations in the soil profile (1 m depth) at the poultry farm.
2000 2001 2002 2003 Location --------------- SRP, µg/g --------------- Bird House 0.73Ab 0.36Ac 0.57Ac 0.12Ac East Pasture 3.15Bb 5.45Bb 6.10Bb 9.41Ab
Millet Pasture 7.50Ba 12.37ABa 11.32ABa 12.81Aab North Pasture 8.73Aa 15.0Aa 12.22Aa 18.72Aa South Pasture 8.99Aa 10.92Aa 13.59Aa 13.40Aab
Uppercase letters represent significant differences (p<0.05) among annual means for each location Lowercase letters represent significant differences (p<0.05) among means for each year Diary Farm At the dairy farm, the shallowest clay layer was found in the sprayfield (~ 1.5 meters) and the deepest in the pasture areas (~ 3 meters) (Figure 54). There was considerable more undulation in the clay layer at the dairy farm than at the poultry farm. This was particularly true for the holding area and the pastures. Selected BMPs were implemented during 2004 at the dairy. These consisted primarily of fencing the pastures areas into paddocks to allow for rotational grazing and to keep the cattle in pastures for more and in the intensive area less time. The sprayfield has received lagoon effluent periodically since 2004 as the lagoon was being cleaned in preparation of closing the existing lagoon and construction of the new lagoon. Nitrate-N levels (kg/ha to a 2-m depth) are shown by sampling date (Figure 55) and by annual averages (Figure 56 and Table 33). Nitrate-N concentrations in the holding area
For each year, numbers with the same letter are not significantly different at the 5% level (p < 0.05)

- 72 -
were considerably higher than the pastures and sprayfields, particularly during the earlier monitoring period (Figure 34). The high concentrations of nitrate-N in the holding area reflect the heavy manure loading from the cattle. Organic N deposited in the manure accumulates in this area and is subject to decomposition (mineralization) which produces ammonium and ultimately nitrate. Nitrate tends to accumulate in the soil during drier periods and then is flushed downward to rainy periods. Denitrification (conversion of nitrate to N2 gas) during periods when the soil is wet may also account for some of the decreases in nitrate-N concentrations with time. Because of the heavy manure loading in the holding area, it may take several years to see the effects of the implemented BMPs in both the groundwater and soil in this component of the dairy farm. Additionally, the transfer of cattle from the holding area to pasture areas has resulted in lower nitrate-N concentrations in the intensive area and higher concentrations in the pasture area. Ammonium-N levels (kg/ha to a 2-m depth) are shown by sampling date (Figure 57) and by annual averages (Figure 58 and Table 34). As noted above, the accumulated organic matter in the holding area produces ammonium during the decomposition process and this ammonium is ultimately converted to nitrate. Thus, there is a considerable amount of nitrogen, both organic (not measured) and ammonium, present in the soil profile to provide a continuous supply of nitrate over a period of several years. Removal of this highly-impacted soil should be considered as a means of reducing it’s impact on ground water. Spreading the soil on forage producing areas as a source of nitrogen would be an effective means of utilizing this impacted soil. Soluble P levels (kg/ha to a 2-m depth) are shown by sampling date (Figure 59) and by annual averages (Figure 60 and Table 35) for the first four years of the study.

- 73 -
Dairy Farm
0
100
200
300
400
500
600
700
800
07/06
/00
11/07
/00
03/27
/01
07/31
/01
12/04
/01
04/16
/02
08/20
/02
12/19
/02
05/06
/03
09/09
/03
01/27
/04
06/01
/04
10/05
/04
02/22
/05
07/14
/05
10/18
/05
03/21
/06
Sampling Date
Prof
ile D
epth
, cm
Holding Pasture Sprayfield
Figure 54. Average depth to the clay layer at the dairy farm. Dairy Farm
0
200
400
600
800
1000
9/26/2
000
1/24/2
001
5/24/2
001
9/21/2
001
1/19/2
002
5/19/2
002
9/16/2
002
1/14/2
003
5/14/2
003
9/11/2
003
1/9/20
04
5/8/20
04
9/5/20
04
1/3/20
05
5/3/20
05
8/31/2
005
12/29
/2005
4/28/2
006
8/26/2
006
12/24
/2006
4/23/2
007
Sampling Date
NO
3-N
, kg/
ha
Holding Area Pasture Sprayfield
ss
Figure 55. Average nitrate-N concentrations in the soil profile by sampling date (2 m depth) at the dairy farm.

- 74 -
Byrd Dairy
0
100
200
300
400
500
2000 2001 2002 2003 2004 2005 2006
Sampling Date
NO
3 -N
, kg/
ha
Holding Area Pasture Sprayfield
A
B
B
A
BB
A
B B
A
BB
A
B B
A
A
B
AB
A
B
Byrd Dairy
0
100
200
300
400
500
2000 2001 2002 2003 2004 2005 2006
Sampling Date
NO
3 -N
, kg/
ha
Holding Area Pasture Sprayfield
A
B
B
A
BB
A
B B
A
BB
A
B B
A
A
B
AB
A
B
Figure 56. Average annual nitrate-N concentrations in the soil profile (2 m depth) at the dairy farm.
Table 33. Nitrate-N in the soil profile (2 m depth) on a yearly average basis at the dairy farm.
2000 2001 2002 2003 2004 2005 2006 Location ------------------------------------- NO3-N, kg/ha ----------------------------------------- Holding Area 250.8Ba 274.4Ba 471.0Aa 228.5Ba 254.3Ba 291.4Ba 232.4Bab
Pasture 55.9Cb 57.9Cb 103.9BCb 103.5BCb 136.6Bb 220.0Aa 270.1Aa Sprayfield 103.0Ab 69.4Ab 106.9Ab 73.9Ab 142.5Ab 126.0Ab 117.4Ab
Uppercase letters represent significant differences (p<0.05) among annual means for each location Lowercase letters represent significant differences (p<0.05) among means for each year
For each year, numbers with the same letter are not significantly different at the 5% level (p < 0.05)

- 75 -
Dairy Farm
0
150
300
450
9/26/0
0
1/26/0
1
5/26/0
1
9/26/0
1
1/26/0
2
5/26/0
2
9/26/0
2
1/26/0
3
5/26/0
3
9/26/0
3
1/26/0
4
5/26/0
4
9/26/0
4
1/26/0
5
5/26/0
5
9/26/0
5
1/26/0
6
5/26/0
6
9/26/0
6
1/26/0
7
5/26/0
7
Sampling Date
NH
4-N
, kg/
haHolding Area Pasture Sprayfield
Figure 57. Average ammonium-N concentrations in the soil profile (2 m depth) at the dairy farm.
Byrd Dairy
0
50
100
150
200
250
2000 2001 2002 2003 2004 2005 2006
Sampling Date
NH
4 -N
, kg/
ha
Holding Area Pasture Sprayfield
A
BB
A
B
B
A
B B
A
B
B
AB
A
B
A
A
A
AA
A
Byrd Dairy
0
50
100
150
200
250
2000 2001 2002 2003 2004 2005 2006
Sampling Date
NH
4 -N
, kg/
ha
Holding Area Pasture Sprayfield
A
BB
A
B
B
A
B B
A
B
B
AB
A
B
A
A
A
AA
A
Figure 58. Average ammonium-N concentrations in the soil profile (2 m depth) at the dairy farm.
For each year, numbers with the same letter are not significantly different at the 5% level (p < 0.05)
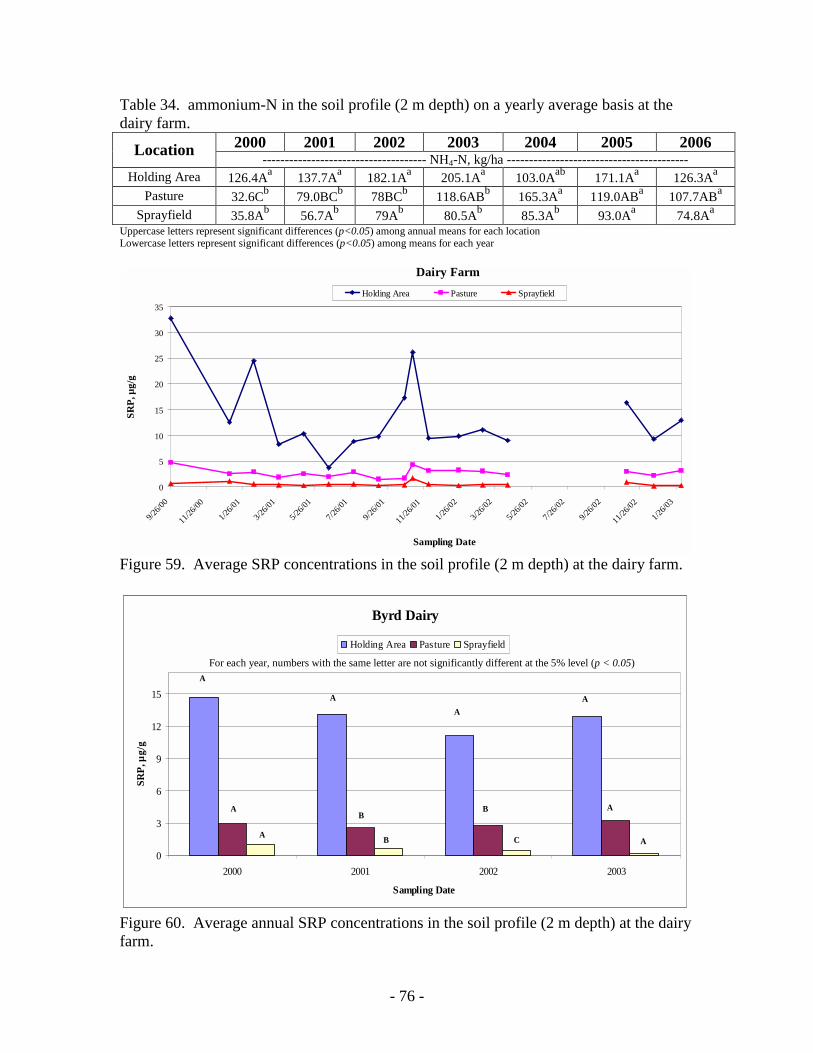
- 76 -
Table 34. ammonium-N in the soil profile (2 m depth) on a yearly average basis at the dairy farm.
2000 2001 2002 2003 2004 2005 2006 Location ------------------------------------- NH4-N, kg/ha ----------------------------------------- Holding Area 126.4Aa 137.7Aa 182.1Aa 205.1Aa 103.0Aab 171.1Aa 126.3Aa
Pasture 32.6Cb 79.0BCb 78BCb 118.6ABb 165.3Aa 119.0ABa 107.7ABa Sprayfield 35.8Ab 56.7Ab 79Ab 80.5Ab 85.3Ab 93.0Aa 74.8Aa
Uppercase letters represent significant differences (p<0.05) among annual means for each location Lowercase letters represent significant differences (p<0.05) among means for each year
Dairy Farm
0
5
10
15
20
25
30
35
9/26/0
0
11/26
/00
1/26/0
1
3/26/0
1
5/26/0
1
7/26/0
1
9/26/0
1
11/26
/01
1/26/0
2
3/26/0
2
5/26/0
2
7/26/0
2
9/26/0
2
11/26
/02
1/26/0
3
Sampling Date
SRP,
µg/
g
Holding Area Pasture Sprayfield
Figure 59. Average SRP concentrations in the soil profile (2 m depth) at the dairy farm.
Byrd Dairy
0
3
6
9
12
15
2000 2001 2002 2003
Sampling Date
SRP,
µg/
g
Holding Area Pasture Sprayfield
A
A
A
A
B
B
A
B
C
A
A
A
Byrd Dairy
0
3
6
9
12
15
2000 2001 2002 2003
Sampling Date
SRP,
µg/
g
Holding Area Pasture Sprayfield
A
A
A
A
B
B
A
B
C
A
A
A
Figure 60. Average annual SRP concentrations in the soil profile (2 m depth) at the dairy farm.
For each year, numbers with the same letter are not significantly different at the 5% level (p < 0.05)

- 77 -
Table 35. Soluble reactive P in the soil profile (2 m depth) on a yearly average basis at the dairy farm.
2000 2001 2002 2003 Location ----------------------- SRP, µg/g --------------------- Holding Area 14.68Aa 13.09Aa 11.12Aa 12.90A
Pasture 2.91Aa 2.53Ab 2.79Ab 3.20A Sprayfield 1.02Aa 0.64Ab 0.43Ac 0.24A
Uppercase letters represent significant differences (p<0.05) among annual means for each location Lowercase letters represent significant differences (p<0.05) among means for each year Vegetable Farm The deepest clay layers of the three farms were found at the vegetable farm (Figure 61). Clay depths ranged between 2.5 and 4.5 meters and showed considerable fluctuation. The clay layer at the vegetable farm also showed more discontinuities than at the poultry and dairy farms. Thus, there appears to be more opportunities for direct movement of water and nitrate into the groundwater at the vegetable farm. Average soil profile nitrate concentrations (2 m depth) at the vegetable farm reflected the cropping activities on the field (Figure 62). Highest concentrations were observed during the periods when potatoes and sweet corn were grown reflecting the high fertilize use with these crops. We have not been able to achieve differences in soil nitrate-N concentrations between the farmer-managed and project-managed sides of the pivot. This is also true when concentrations are averaged on an annual basis (Figure 63 and Table 36). The relatively small differences in amount of N applied between the two halves of the pivot have made it difficult to see differences in both soil and groundwater nitrate-N concentrations. However, we observed a continuing trend in decreasing soil nitrate-N concentrations for both the grower-managed and BMP sides of the field through 2005. This may be attributed to the farmer fine tuning his fertilization and irrigation practices each year so that both management programs have resulted in lower soil nitrate-N concentrations each year. The increase observed in 2006 can be attributed to higher amounts of N fertilizer applied to both sides of the pivot because the grower had difficulty keeping on top of the fertilizer management protocol develop for one of his crops. If the soil nitrate-N concentrations are a pre-indicator of what we will eventually see in the groundwater, we should soon see decreasing nitrate-N concentrations in the groundwater over the entire field. Ammonium-N levels (kg/ha to a 2-m depth) are shown by sampling date (Figure 64) and by annual averages (Figure 65 and Table 37). Overall years, the ammonium-N levels in the soil averaged 89 and 76 kg/ha for the grower-managed and BMP sides, respectively. Statistically, these were not significantly different. This ammonium likely comes from the N sources used in the fertilizer used for the various crops and will be a potential source of nitrate because ammonium is converted to nitrate by microbes in the soil. Soluble P levels (kg/ha to a 2-m depth) are shown by sampling date (Figure 66) and by annual averages (Figure 67 and Table 38) for the first four years of the study.
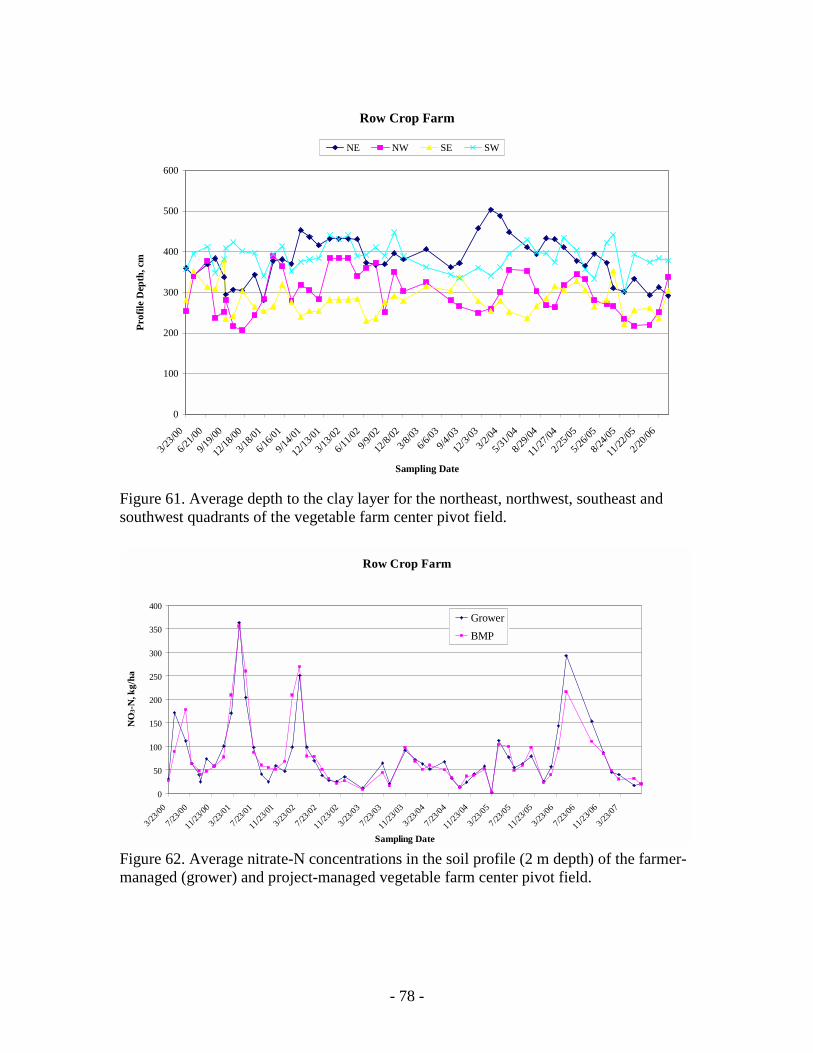
- 78 -
Row Crop Farm
0
100
200
300
400
500
600
3/23/0
0
6/21/0
0
9/19/0
0
12/18
/00
3/18/0
1
6/16/0
1
9/14/0
1
12/13
/01
3/13/0
2
6/11/0
29/9
/02
12/8/
023/8
/036/6
/039/4
/03
12/3/
033/2
/04
5/31/0
4
8/29/0
4
11/27
/04
2/25/0
5
5/26/0
5
8/24/0
5
11/22
/05
2/20/0
6
Sampling Date
Prof
ile D
epth
, cm
NE NW SE SW
Figure 61. Average depth to the clay layer for the northeast, northwest, southeast and southwest quadrants of the vegetable farm center pivot field.
Row Crop Farm
0
50
100
150
200
250
300
350
400
3/23/0
0
7/23/0
0
11/23
/00
3/23/0
1
7/23/01
11/23
/01
3/23/02
7/23/02
11/23/0
2
3/23/0
3
7/23/0
3
11/23
/03
3/23/0
4
7/23/04
11/23
/04
3/23/05
7/23/05
11/23/0
5
3/23/0
6
7/23/0
6
11/23/0
6
3/23/0
7
Sampling Date
NO
3-N
, kg/
ha
GrowerBMP
Figure 62. Average nitrate-N concentrations in the soil profile (2 m depth) of the farmer-managed (grower) and project-managed vegetable farm center pivot field.

- 79 -
Row Crop Farm
0
30
60
90
120
150
180
2000 2001 2002 2003 2004 2005 2006
Sampling Date
NO
3 -N
, kg/
haGrower BMP
AA
A
A
A
A
A A A A
A A
A
A
Row Crop Farm
0
30
60
90
120
150
180
2000 2001 2002 2003 2004 2005 2006
Sampling Date
NO
3 -N
, kg/
haGrower BMP
AA
A
A
A
A
A A A A
A A
A
A
Figure 63. Average nitrate-N concentrations in the soil profile (2 m depth) of the farmer-managed (grower) and project-managed vegetable farm center pivot field. Table 36. Nitrate-N in the soil profile (2 m depth) on a yearly average basis at the row crop farm.
2000 2001 2002 2003 2004 2005 2006 Location ------------------------------------- NO3-N, kg/ha ----------------------------------------- Grower 71.20Aa 132.57Aa 76.60Aa 47.05Aa 45.31Aa 63.70Aa 126.28Aa BMP 68.73ABa 144.01Aa 92.55ABa 41.17Ba 43.49Ba 66.36ABa 94.52ABa
Uppercase letters represent significant differences (p<0.05) among annual means for each location Lowercase letters represent significant differences (p<0.05) among means for each year
Row Crop Farm
0
50
100
150
200
250
300
3/23/00
7/23/0
0
11/23/0
0
3/23/0
1
7/23/01
11/23/0
1
3/23/0
2
7/23/02
11/23/0
2
3/23/03
7/23/0
3
11/23
/03
3/23/04
7/23/0
4
11/23
/04
3/23/0
5
7/23/05
11/23/0
5
3/23/06
7/23/06
11/23/0
6
3/23/07
Sampling Date
NH
4-N, k
g/ha
Grower
BMP
Figure 64. Average ammonium-N concentrations in the soil profile (2 m depth) of the farmer-managed (grower) and project-managed vegetable farm center pivot field.
For each year, numbers with the same letter are not significantly different at the 5% level (p < 0.05)
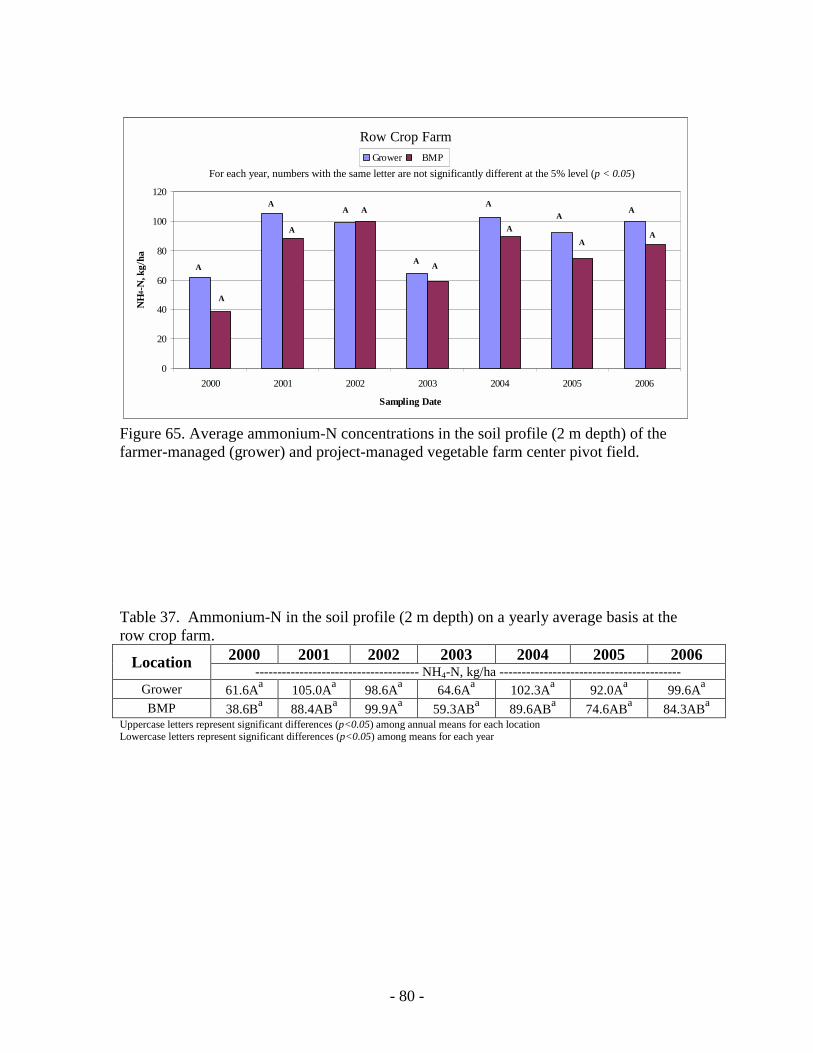
- 80 -
Row Crop Farm
0
20
40
60
80
100
120
2000 2001 2002 2003 2004 2005 2006
Sampling Date
NH
4 -N
, kg/
ha
Grower BMP
A
A
A
A
A A
A A
A
AA
A
A
A
Row Crop Farm
0
20
40
60
80
100
120
2000 2001 2002 2003 2004 2005 2006
Sampling Date
NH
4 -N
, kg/
ha
Grower BMP
A
A
A
A
A A
A A
A
AA
A
A
A
Figure 65. Average ammonium-N concentrations in the soil profile (2 m depth) of the farmer-managed (grower) and project-managed vegetable farm center pivot field. Table 37. Ammonium-N in the soil profile (2 m depth) on a yearly average basis at the row crop farm.
2000 2001 2002 2003 2004 2005 2006 Location ------------------------------------- NH4-N, kg/ha ----------------------------------------- Grower 61.6Aa 105.0Aa 98.6Aa 64.6Aa 102.3Aa 92.0Aa 99.6Aa BMP 38.6Ba 88.4ABa 99.9Aa 59.3ABa 89.6ABa 74.6ABa 84.3ABa
Uppercase letters represent significant differences (p<0.05) among annual means for each location Lowercase letters represent significant differences (p<0.05) among means for each year
For each year, numbers with the same letter are not significantly different at the 5% level (p < 0.05)

- 81 -
Row Crop Farm
0
1
1
2
2
3
3
4
3/23/20
00
6/23/20
00
9/23/2
000
12/23
/2000
3/23/20
01
6/23/2
001
9/23/2
001
12/23
/2001
3/23/20
02
6/23/2
002
9/23/2
002
12/23
/2002
3/23/200
3
Sampling Date
SRP,
µg/
g
GrowerBMP
Figure 66. Average SRP concentrations in the soil profile (2 m depth) of the farmer-managed (grower) and project-managed vegetable farm center pivot field
Row Crop Farm
0
0.5
1
1.5
2
2.5
2000 2001 2002 2003
Sampling Date
SRP
µg/g
Grower BMP
A A A
AA
A
B
A
Row Crop Farm
0
0.5
1
1.5
2
2.5
2000 2001 2002 2003
Sampling Date
SRP
µg/g
Grower BMP
A A A
AA
A
B
A
Figure 67. Average SRP concentrations in the soil profile (2 m depth) of the farmer-managed (grower) and project-managed vegetable farm center pivot field Table 38. Soluble reactive P in the soil profile (2 m depth) on a yearly average basis at the Row Crop.
2000 2001 2002 2003 Location ---------------SRP, µg/g ----------------- Grower 0.97Aa 0.90ABa 0.70ABa 0.24Bb BMP 0.99Aa 1.33Aa 1.32Aa 1.99Aa
Uppercase letters represent significant differences (p<0.05) among annual means for each location Lowercase letters represent significant differences (p<0.05) among means for each year
For each year, numbers with the same letter are not significantly different at the 5% level (p < 0.05)

- 82 -
6.0 Public Involvement and Cooperation 6.1/6.2 State and Federal Agencies Florida Department of Agriculture and Consumer Services
Sampling of monitoring wells at row crop farm and analysis of all well samples; on-site technical assistance.
Natural Resource Conservation Service Poultry and dairy farm conservation plans 6.3 Local Governments, Industry, Environmental, and Other Groups, Public at Large The SRBNMWG was formed to help better coordinate the many ongoing water quality management activities and research efforts within the basin and to better promote strong partnerships between government agencies and the agricultural community. The various cooperators in this effort were previously listed in the Introduction. As a result, public agencies and the agricultural community took the lead in implementing a watershed-based process for BMP development, demonstration, refinement, and implementation to reduce nutrient loadings to ground water and surface water, involving stakeholders throughout the basin. Each cooperating agency allocated certain resources toward development, implementation, tracking, and evaluation of BMPs under the agreement. 6.4. Other Sources of Funding
Agency Service Amount Florida Department of Agriculture and Consumer Services
Sampling ground water monitoring wells at row crop farm
$141,500
Florida Department of Agriculture and Consumer Services
Analysis of ground water monitoring well samples
$162,300
Florida Department of Agriculture and Consumer Services
On-site technical assistance at all farms
$280,000
Institute of Food and Agricultural Sciences, Suwannee Valley Research and Education Center
On-site technical assistance at row and dairy farm.
$21,000
Suwannee River RC & D Mobile Irrigation Lab
Irrigation evaluations and irrigation retrofits
$6,720
Natural Resource Conservation Service
Poultry and dairy farm conservation plans
$35,000
- 83 -
7.0 ASPECTS OF THE PROJECT THAT DID NOT WORK WELL The NRCS Conservation plans for the dairy and poultry farms were delayed somewhat due to the heavy workload of NRCS in the Suwannee River Basin and the lack of personnel. NRCS was designing conservation plans for most of the dairy and poultry farms in the basin during the initiation period of the project. In addition, NRCS decided to modify (improve) the dairy plan in mid-stream based on experiences with conservation plans on other dairies in the basin. BMP development at the row crop farm was always a work in progress. Because of the significant costs of producing a vegetable crop and the high value of the crop, the farmer was always “nervous” about making major changes in his crop management plan all at one time. It took time to establish a comfortable working relationship between the farmer and project personnel in terms of establishing fertilizer and irrigation BMPs. This working relationship strengthened each year but smaller steps had to be taken each year in terms of BMP implementation than would have been envisioned by project personnel. This farmer had approximately 40 center pivot irrigation systems in his operation so the one pivot that we were working on would not always get his undivided attention. Therefore, we had to use project personnel from the University of Florida and Florida Department of Agriculture and Consumer Services to provide much more detailed oversight of the daily fertilization and irrigation practices on some of the crops, especially potatoes, to ensure that the proposed BMPs were properly implemented. Even with this oversight, there were occasions where fertilization and irrigation recommendations were not followed exactly. Also, on two occasions, the center pivot systems “crashed” and had to be rebuilt which resulted in changes of irrigation and fertilizer application schedules. However, overall, given the complexity of the farm operations, we came fairly close to implementing our BMP recommendations.

- 84 -
8.0 FUTURE ACTIVITY RECOMMENDATIONS

- 85 -
SECTION 2
Forage Interim Measure for Nitrogen-based Fertilizers for the Suwannee River
Basin (SRB)
North Florida REC – Suwannee Valley
Background The Florida Department of Agricultural and Consumer Services (FDACS) has implemented an “interim measure” for the fertilization of forages in the SRB designed to minimize groundwater quality effects. The interim measure is based on practices consistent with the fertilizer recommendations of the Florida land grant colleges but can be modified to reflect the economic viability of the producers. The interim measure is in place until a science-based evaluation of the measure can be completed and appropriate modifications, if any, are made. Nitrogen fertilization practices of the forage interim measure in the SRB are as follows: Established stands – Bahiagrass and Bermudagrass
• For grazed stands - apply no more than 100 lbs/A nitrogen in Spring and Summer. No more than 200 lbs/A should be applied per calendar year.
• For hay - apply no more than 100 lbs/A nitrogen in the Spring, and no more than 100 lbs/A after each cutting, except for the last cutting of the year when no additional nitrogen is required. No more than 400 lbs/A should be applied per calendar year.
Bahiagrass for Seed production
• For grazed stands - apply no more than 100 lbs/A nitrogen in Spring and Summer for a maximum of 200 lbs/A per calendar year.
• For non-grazed stands - apply no more than 100 lbs/A nitrogen in late Spring/ early Summer for a maximum of 100 lbs/A per calendar year.
New plantings – Bahiagrass and Bermudagrass
• Commercial fertilizers – apply 30 lbs/A nitrogen as soon as plants have emerged followed by no more than 70 lbs/A nitrogen 30-50 days later.
• Manure or biosolids – apply no more than 100 lbs/A of plant-available nitrogen when plants are large enough to withstand the physical damage from the application. It is assumed that 50% of the total nitrogen content of organic sources is plant-available.

- 86 -
Other Considerations When using anhydrous ammonia as the nitrogen source, a maximum of 125 lbs/A nitrogen per application can be used because it is assumed that 20% of the nitrogen volatilizes to the atmosphere. When using organic nitrogen sources, not all of the nitrogen is available to the plant during the first growing season. For the forage interim measure, it is assumed that 50% of the total nitrogen in the material is plant-available N. When overseeding with a cool season annual grass (rye, ryegrass, oats), an additional 50 lbs/A of N can be applied after the grass has emerged. If grazed, an additional 50 lbs/A may be applied after the first grazing. A demonstration site at the North Florida REC - Suwannee Valley was established in 2001 on a 6.5 acre field (Figure 1) to evaluate the effect of the forage interim measure protocol for nitrogen fertilization of new plantings and, subsequently, established stands of Bermudagrass, on groundwater nitrate-N concentrations. This site had not been in production or fertilized for several years. Twenty monitoring wells were drilled into the surficial water table. These wells were sampled monthly and the samples were analyzed for for nitrate-N. In addition, a seepage spring in a wooded area downstream from the field was sampled at the same time. Soil was sampled to the water table depth at approximately 6-week intervals. Samples were analyzed for ammonium and nitrate. RESULTS Summaries of the rainfall data at LOREC during the monitoring period are shown in Table 1 and Figure 2. Fertilization and harvesting activities on the Interim Measures field are shown in Table 2. The N application rate, forage yield, and N recovery data for 2004, 2005, and 2006 are shown in Table 3. The IFAS protocol for bermudagrass forage production as described above was followed for the N fertilization program. The total amount of N fertilizer for each year ranged from 346 to 433 lb/ac. The higher amounts for 2005 and 2006 reflect extra N applied due to oats overseeding during the winter months. Yields ranged from 13,330 to 14,740 lb/ac/year. These yields are mid-way between optimum season and dry season estimated bermudagrass yields in Florida. The highest % recovery (N uptake/N applied) was 100% for 2003 but more typical recoveries of 66 and 53% were measured for 2005 and 2006, respectively. The recoveries for 2005 and 2006 compare favorably with typical recoveries estimated for bermudagrass production in Florida. Ground water nitrate-N concentrations for individual wells and the seepage spring since the start of the project are shown in the Table 4. The average nitrate-N concentrations for all wells plus the seepage spring by sampling date during the study period are shown in Figure 3. During the initial establishment phases of the Bermudagrass stand, groundwater and spring nitrate-N concentrations were less than 0.2 mg/L. As the regular fertilization program was established in 2003, groundwater nitrate-N concentrations

- 87 -
started to increase although considerable fluctuation was observed. The highest average nitrate-N concentration of ~ 4 mg/L for all wells combined was observed in 2005. The general trend of increasing nitrate-N concentrations in the groundwater was largely driven by wells in one part of the field, i.e., the eastern end of the field near the wooded area. To evaluate this in more detail, we divided the monitoring wells into transects across the field as show in Figure 4. The average groundwater nitrate concentrations of the transects are presented by sampling date (Figure 5) and by annual averages (Figure 6, Table 5). It was evident that nitrate-N concentrations for transect 5 wells were higher than concentrations for wells in transects 1-4. The higher concentrations in transect 5 may be related to excess application of fertilizer due to spreader turn-around issues in this area (personal communication – Joel Love) although this cannot be confirmed. This situation was eventually mitigated and nitrate-N concentrations in transect 5 showed a declining trend by the end of the study. Not considering the wells in transect 5, the average pre- and post-fertilization nitrate-N concentrations were 0.12 and 0.77 mg N/L. Thus, the IFAS-recommended fertilization program did increase slightly the nitrate-N concentrations in the groundwater. However, we believe that these increases are smaller than would be caused by most any other anthropogenic activity on the land, whether it be agricultural or residential. Soil ammonium- and nitrate-N levels are shown graphically in Figure 7 and averaged by year in Table 6. Considerable fluctuation can be seen which is likely related to fertilization events. When averaged on an annual basis, there were no significant differences between years for either ammonium-N or nitrate-N levels in the soil profile (Table 6). The relatively high soil ammonium-N levels are somewhat unexpected since nitrification, the conversion of ammonium to nitrate, should be converting most of the ammonium to nitrate.

- 88 -
Figure 1. Location of water monitoring sites at the interim measures field.
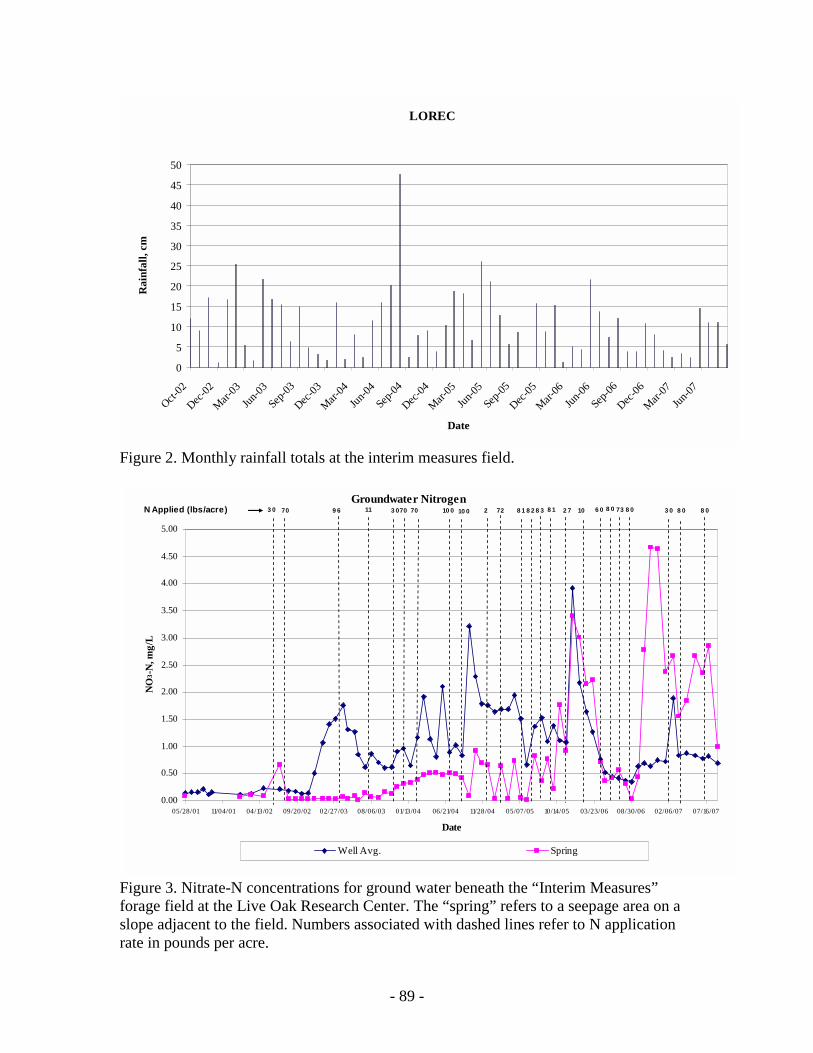
- 89 -
LOREC
0
5
10
15
20
25
30
35
40
45
50
Oct-02
Dec-02
Mar-03
Jun-03
Sep-0
3
Dec-03
Mar-04
Jun-04
Sep-0
4
Dec-04
Mar-05
Jun-05
Sep-0
5
Dec-05
Mar-06
Jun-06
Sep-0
6
Dec-06
Mar-07
Jun-07
Date
Rai
nfal
l, cm
Figure 2. Monthly rainfall totals at the interim measures field.
Groundwater Nitrogen
0.00
0.50
1.00
1.50
2.00
2.50
3.00
3.50
4.00
4.50
5.00
05/28/01 11/04/01 04/13/02 09/20/02 02/27/03 08/06/03 01/13/04 06/21/04 11/28/04 05/07/05 10/14/05 03/23/06 08/30/06 02/06/07 07/16/07
Date
NO
3 -N
, mg/
L
Well Avg. Spring
3 0 70 9 6 11 3 070 70 10 0 10 0N Applied (lbs/acre) 2 72 8 1 8 2 8 3 8 1 2 7 10 6 0 8 0 73 8 0 3 0 8 08 0
Figure 3. Nitrate-N concentrations for ground water beneath the “Interim Measures” forage field at the Live Oak Research Center. The “spring” refers to a seepage area on a slope adjacent to the field. Numbers associated with dashed lines refer to N application rate in pounds per acre.

- 90 -
1
3
2
4
5
6
7
8
9
10
11
12
13
14
15
16
17
18
19
20
Spring
Tobacco
Weather Station
Low Area
High “Ridge”
Lowest Area in field
North
Transect 1 Transect 2 Transect 3 Transect 4 Transect 5
Figure 4. Diagram of sampling site at the Interim Measures field

- 91 -
LOREC
0
2
4
6
8
10
12
5/28/2
001
8/28/20
01
11/28
/2001
2/28/20
02
5/28/2
002
8/28/20
02
11/28
/2002
2/28/2
003
5/28/2
003
8/28/20
03
11/28
/2003
2/28/2
004
5/28/2
004
8/28/20
04
11/28
/2004
2/28/20
05
5/28/2
005
8/28/2
005
11/28
/2005
2/28/20
06
5/28/20
06
8/28/20
06
11/28
/2006
2/28/20
07
5/28/2
007
8/28/2
007
Sampling Date
NO
3-N
, mg/
LTransect 1 Transect 2 Transect 3 Transect 4 Transect 5
Figure 5. Groundwater nitrate concentrations for wells in the N/S transects at the Interim Measures field.
Interim Measures Field
0
1
2
3
4
5
2001 2002 2003 2004 2005 2006
Sampling Date
NO
3-N
, mg/
L
Trans 1 Trans 2 Trans 3 Trans 4 Trans 5 Trans 6
B B B BA
BB B B B
AB
B
CD
BC B
A
D C
C C
B
A
C BB
BB
A
BBC
C
BC
B
AA
Interim Measures Field
0
1
2
3
4
5
2001 2002 2003 2004 2005 2006
Sampling Date
NO
3-N
, mg/
L
Trans 1 Trans 2 Trans 3 Trans 4 Trans 5 Trans 6
B B B BA
BB B B B
AB
B
CD
BC B
A
D C
C C
B
A
C BB
BB
A
BBC
C
BC
B
AA
Figure 6. Average annual groundwater nitrate-N concentration for the interim measures field. Transect 6 represents the seepage spring.
For each year, numbers with the same letter are not significantly different at the 5% level (p < 0.05)

- 92 -
LOREC
0
10
20
30
40
50
12/13/2
001
3/13/20
02
6/13/20
02
9/13/20
02
12/13/2
002
3/13/20
03
6/13/20
03
9/13/20
03
12/13/2
003
3/13/20
04
6/13/20
04
9/13/20
04
12/13/2
004
3/13/20
05
6/13/20
05
9/13/20
05
12/13
/2005
3/13/20
06
6/13/20
06
9/13/20
06
12/13/2
006
3/13/20
07
6/13/20
07
Sampling Date
Con
cent
ratio
n, k
g/ha
NH4-N NO3-N
Figure 7. Soil ammonium and nitrate concentrations at the Interim Measures field. Table 1. Monthly rainfall totals at the interim measures field.
2002 2003 2004 2005 2006 2007 ------------------------------------- cm -------------------------------------
January 1.12 1.75 3.89 8.74 8.05 February 16.69 15.98 10.29 15.19 4.17
March 25.32 1.98 18.85 1.24 2.44 April 5.26 8.10 18.24 5.03 3.43 May 1.68 2.31 6.55 4.47 2.36 June 21.77 11.48 26.14 21.64 14.48 July 16.71 16.10 21.21 13.74 11.05
August 15.37 20.02 12.70 7.34 10.95 September 3.40 6.38 47.50 5.61 12.09 5.56
October 12.07 15.01 2.51 8.69 3.86 November 9.04 4.88 7.75 0.03 3.89 December 17.17 3.23 8.94 15.80 10.87
Total 41.68 133.40 144.42 147.98 108.10 62.48

- 93 -
Table 2. Activities at the Interim Measures field through September 2007. DATE OPERATION
03/01/01 ~10 acre site selected at Suwannee Valley (Live Oak) IFAS REC 04/20/01 20 ground water monitoring wells installed 05/28/01 Ground water sampling initiated 12/13/01 Soil profile sampling initiated Bermudagrass planted 05/06/02 One irrigation per week through June 4th 05/09/02 Replanting of bermudagrass 06/03/02 USGS weather station installed 06/04/02 Plot mowed to suppress weed growth 06/06/02 Fertilization - 211 lb/A 14-0-18 with minors (30 lbs N/ac) 06/11/02 Plot mowed to suppress weed growth (4-6 inches high) 07/16/02 Fertilization - 70 lbs N, 40 lbs K, 40 lbs S (70 lbs N/ac) 09/10/02 Field cut and baled; 34 bales at 770lbs/bale=13.09 tons 11/08/02 Sprayed with 6 0z/acre of Plateau for weed control 02/26/03 Plot burned 04/03/03 Fertilized with 503 lbs.19-5-19-4S per 8 ac (96 lbs N/ac) 05/01/03 Plot mowed to known down weeds, no forage removed 07/08/03 Hay harvested, 22 rolls @ 820 lbs each (2 samples rec for analysis) 07/18/03 Fertilized with 560 lbs/ac (20-0-20; 114 lbs N/ac) 09/04/03 Lannate applied (1 pt/acre) 09/17/03 Hay harvested (44 rolls at 790 each) 11/23/03 Oats planted (Fertilized with 30 lbs N) 02/05/04 1390 lbs 30-0-0-07 fertilizer (N source AN at 69.5 lbs/acre) 04/12/04 Hay cut; 44 bales@500 lbs (yield = 1.83 tons/acre) 04/23/04 Fertilized with 19-5-19 + 4% sulfur @ 400 lbs/acre 07/07/04 Hay harvested; 75 bales @ 450 each 07/12/04 Fertilized with 22-0-17-4.25 @ 450 lbs/acre; 100, 76.5, 19 lbs/acre N, K20, S 07/20/04 Sprayed with Cimarron to control patches of bahiagrass 08/01/04 Hay harvested, 31 rolls @555 lbs per roll. Check actual date 08/19/04 Fertilized with 22-0-17-4.25 @ 450 lbs/acre; 100, 76.5, 19 lbs/acre N, K20, S 09/24/04 Hay harvested, 34 bales, 15,300 lbs total 12/02/04 Hay Harvested, 9.5 rolls, 4244 lbs total 12/10/04 Planted with 2 bushels per acre of Coker 227 01/07/05 Fertilized with 400 lbs per acre of 7-3-7 (28 lbs N per acre) 02/11/05 Fertilizer with 447 lbs 16-0-7 (72 lbs N per acre; oats 3-4 inches high) 04/15/05 Oats harvested; 59 bales@510 lbs; 2.15 tons/acre 05/09/05 Fertilized with 2990 lbs 19-5-19 with 4% S (81 lbs N/ac based on 7 acres)

- 94 -
Table 2. continued 06/01/05 Hay harvested, 18 bales, 0.52 tons/A 06/17/05 Fertilized with 431 lbs/A 19-5-19-4; 82/lbs N/A 07/18/05 Hay harvested, 58 bales, 1.54 tons/A 07/21/05 Fertilized with 436 lbs/A 19-5-19-4; 83 lbs N/A 08/19/05 Hay harvested, 43 bales, 1.45 tons/A 08/22/05 Fertilized with 425 lbs/A 19-5-19-4; 81 lbs N/A 09/16/05 Hay harvested, 42 rolls, 3054 lbs dry wt/A 11/04/05 Oats planted 12/12/05 Fertilized with 27 lbs N/A 01/28/06 Fertilized with 3430 lbs 19-5-19 based on 6.5 ac;100 lbs/A 02/02/06 Ag lime @ 2300 lbs/A 04/13/06 Hay harvested, 44 bales of oat hay, 384 lbs dry matter/bale Total = 16,896 lbs 05/01/06 Fertilized 60 lbs N/A to compensate for over fertilization Hay harvested, 20 bales, 9120 lbs total, 456 lbs/bale 06/20/06 Fertilized with 420 lbs/A 19-5-19-4; 80 lbs N/A 07/11/16 Hay harvested, 49 bales, 1025 lb/bale 07/14/06 Cimmaron Herbicide, 0.3 oz/A 07/14/06 Fertilized 366 lbs/A 20-5-4; 73 lbs N/A 08/19/06 Hay harvested, 33 bales, 530 lb/bale 08/21/06 Fertilized with 423 lbs/A 19-5-19-4; 80 lb N/A 09/03/06 Sevin XLR 1 pt/A (armyworms) Demilin 2 oz/A (armyworms) 09/28/06 Hay harvested, 35 bales, 600 lb/bale 12/13/06 Oats planted Horizon 474 02/07/07 Fertilized with 18-8-18-4; 30 lb N/A 03/06/07 Fertilized with 270 lbs/A 19-5-19-3.8; 50 lb N/A 05/21/07 Hay harvested, 2 rolls, 1500 lbs total 05/31/07 Fertilized with 400 lbs per acre of 19-5-19-4; 80 lb N/A (rained 3.6 in. 2 days later)07/10/07 Hay harvested, 40 rolls, 34,000 lbs total 85% DM 07/17/07 Fertilized w 420 lbs/A 19-5-19-4; 80 lb N/A 07/19/07 Lab Results - Moisture 10.5% CP 7.45% 08/15/07 Hay harvested, 20 rolls, 16,000 lbs total, Moisture 8.19% / CP 14.26% 08/23/07 Fertilized w 420 lbs per acre of 19-5-19-4; 80lb N/A 09/12/07 Dimilin 2oz/A (Armyworms)

- 95 -
Table 3. Nitrogen fertilizer application, forage yield, and N recovery at North Florida REC – Suwannee Valley Interim Forage Field.
Nitrogen Applied Yield N Rec Harvest
Date lb/ac lb/ac
%N lb/ac
%N Rec lb hay per lb N
2/5/2004 70 4/12/2004 3,385 2.21 75 107 48 4/23/2004 76 7/7/2004 5,190 1.80 93 123 68
7/12/2004 100 8/1/2004 2,650 3.07 81 81 27
8/19/2004 100 9/24/2004 2,353 3.48 82 12/2/2004 650 2.44 16
98 30
Total 346 14,228 2.60 347 100 41
1/7/2005 28 2/11/2005 72 4/15/2005 4,630 1.94 90 90 46 5/9/2005 87 6/1/2005 1,085 1.94 21 24 12
6/17/2005 82 7/18/2005 3,080 1.61 50 60 38 7/21/2005 83 8/19/2005 2,900 2.36 68 82 35 8/22/2005 81 9/16/2005 3,045 1.84 56 69 38
Total 433 14,740 1.94 285 66 34
12/12/2005 27 1/28/2006 100 4/13/2006 2,600 1.33 35 28 20 5/1/2006 60
6/10/2006 1,400 2.06 29 48 23 6/26/2006 80 7/11/2006 3,400 1.72 58 73 43 7/14/2006 73 8/19/2006 2,700 1.67 45 62 37 8/21/2006 80 9/28/2006 3,230 1.72 56 69 40
Total 420 13,330 1.70 223 53 32
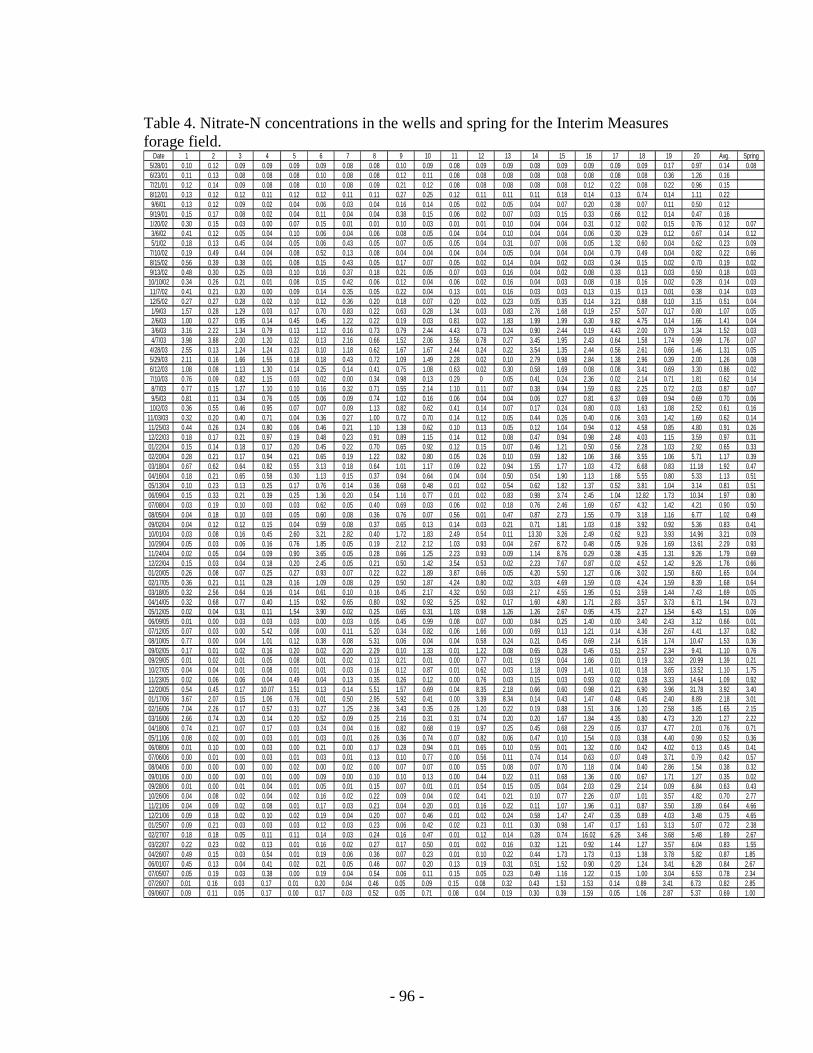
- 96 -
Table 4. Nitrate-N concentrations in the wells and spring for the Interim Measures forage field.
Date 1 2 3 4 5 6 7 8 9 10 11 12 13 14 15 16 17 18 19 20 Avg. Spring5/28/01 0.10 0.12 0.09 0.09 0.09 0.09 0.08 0.08 0.10 0.09 0.08 0.09 0.09 0.08 0.09 0.09 0.09 0.09 0.17 0.97 0.14 0.086/23/01 0.11 0.13 0.08 0.08 0.08 0.10 0.08 0.08 0.12 0.11 0.08 0.08 0.08 0.08 0.08 0.08 0.08 0.08 0.36 1.26 0.167/21/01 0.12 0.14 0.09 0.08 0.08 0.10 0.08 0.09 0.21 0.12 0.08 0.08 0.08 0.08 0.08 0.12 0.22 0.08 0.22 0.96 0.158/12/01 0.13 0.12 0.12 0.11 0.12 0.12 0.11 0.11 0.27 0.25 0.12 0.11 0.11 0.11 0.18 0.14 0.13 0.74 0.14 1.11 0.229/6/01 0.13 0.12 0.09 0.02 0.04 0.06 0.03 0.04 0.16 0.14 0.05 0.02 0.05 0.04 0.07 0.20 0.38 0.07 0.11 0.50 0.129/19/01 0.15 0.17 0.08 0.02 0.04 0.11 0.04 0.04 0.38 0.15 0.06 0.02 0.07 0.03 0.15 0.33 0.66 0.12 0.14 0.47 0.161/20/02 0.30 0.15 0.03 0.00 0.07 0.15 0.01 0.01 0.10 0.03 0.01 0.01 0.10 0.04 0.04 0.31 0.12 0.02 0.15 0.76 0.12 0.073/6/02 0.41 0.12 0.05 0.04 0.10 0.06 0.04 0.06 0.08 0.05 0.04 0.04 0.10 0.04 0.04 0.06 0.30 0.29 0.12 0.67 0.14 0.125/1/02 0.18 0.13 0.45 0.04 0.05 0.06 0.43 0.05 0.07 0.05 0.05 0.04 0.31 0.07 0.06 0.05 1.32 0.60 0.04 0.62 0.23 0.097/10/02 0.19 0.49 0.44 0.04 0.08 0.52 0.13 0.08 0.04 0.04 0.04 0.04 0.05 0.04 0.04 0.04 0.79 0.49 0.04 0.82 0.22 0.668/15/02 0.56 0.39 0.38 0.01 0.08 0.15 0.43 0.05 0.17 0.07 0.05 0.02 0.14 0.04 0.02 0.03 0.34 0.15 0.02 0.70 0.19 0.029/13/02 0.48 0.30 0.25 0.03 0.10 0.16 0.37 0.18 0.21 0.05 0.07 0.03 0.16 0.04 0.02 0.08 0.33 0.13 0.03 0.50 0.18 0.0310/10/02 0.34 0.26 0.21 0.01 0.08 0.15 0.42 0.06 0.12 0.04 0.06 0.02 0.16 0.04 0.03 0.08 0.18 0.16 0.02 0.28 0.14 0.0311/7/02 0.41 0.21 0.20 0.00 0.09 0.14 0.35 0.05 0.22 0.04 0.13 0.01 0.16 0.03 0.03 0.13 0.15 0.13 0.01 0.38 0.14 0.0312/5/02 0.27 0.27 0.28 0.02 0.10 0.12 0.36 0.20 0.18 0.07 0.20 0.02 0.23 0.05 0.35 0.14 3.21 0.88 0.10 3.15 0.51 0.041/9/03 1.57 0.28 1.29 0.03 0.17 0.70 0.83 0.22 0.63 0.28 1.34 0.03 0.83 2.76 1.68 0.19 2.57 5.07 0.17 0.80 1.07 0.052/6/03 1.00 0.27 0.95 0.14 0.45 0.45 1.22 0.22 0.19 0.03 0.81 0.02 1.83 1.99 1.99 0.30 9.82 4.75 0.14 1.66 1.41 0.043/6/03 3.16 2.22 1.34 0.79 0.13 1.12 0.16 0.73 0.79 2.44 4.43 0.73 0.24 0.90 2.44 0.19 4.43 2.00 0.79 1.34 1.52 0.034/7/03 3.98 3.88 2.00 1.20 0.32 0.13 2.16 0.66 1.52 2.06 3.56 0.78 0.27 3.45 1.95 2.43 0.64 1.58 1.74 0.99 1.76 0.074/28/03 2.55 0.13 1.24 1.24 0.23 0.10 1.18 0.62 1.67 1.67 2.44 0.24 0.22 3.54 1.35 2.44 0.56 2.61 0.66 1.46 1.31 0.055/29/03 2.11 0.16 1.66 1.55 0.18 0.18 0.43 0.72 1.09 1.49 2.28 0.02 0.10 2.79 0.98 2.84 1.38 2.96 0.39 2.00 1.26 0.086/12/03 1.08 0.08 1.13 1.30 0.14 0.25 0.14 0.41 0.75 1.08 0.63 0.02 0.30 0.58 1.69 0.08 0.08 3.41 0.69 3.30 0.86 0.027/10/03 0.76 0.09 0.82 1.15 0.03 0.02 0.00 0.34 0.98 0.13 0.29 0 0.05 0.41 0.24 2.36 0.02 2.14 0.71 1.81 0.62 0.148/7/03 0.77 0.15 1.27 1.10 0.10 0.16 0.32 0.71 0.55 2.14 1.10 0.11 0.07 0.38 0.94 1.59 0.83 2.25 0.72 2.03 0.87 0.079/5/03 0.81 0.11 0.34 0.76 0.05 0.06 0.09 0.74 1.02 0.16 0.06 0.04 0.04 0.06 0.27 0.81 6.37 0.69 0.94 0.69 0.70 0.0610/2/03 0.36 0.55 0.46 0.95 0.07 0.07 0.09 1.13 0.82 0.62 0.41 0.14 0.07 0.17 0.24 0.80 0.03 1.63 1.08 2.52 0.61 0.16
11/03/03 0.32 0.20 0.40 0.71 0.04 0.36 0.27 1.00 0.72 0.70 0.14 0.12 0.05 0.44 0.26 0.40 0.06 3.03 1.42 1.69 0.62 0.1411/25/03 0.44 0.26 0.24 0.80 0.06 0.46 0.21 1.10 1.38 0.62 0.10 0.13 0.05 0.12 1.04 0.94 0.12 4.58 0.85 4.80 0.91 0.2612/22/03 0.18 0.17 0.21 0.97 0.19 0.48 0.23 0.91 0.89 1.15 0.14 0.12 0.08 0.47 0.94 0.98 2.48 4.03 1.15 3.59 0.97 0.3101/22/04 0.15 0.14 0.18 0.17 0.20 0.45 0.22 0.70 0.65 0.92 0.12 0.15 0.07 0.46 1.21 0.50 0.56 2.28 1.03 2.92 0.65 0.3302/20/04 0.28 0.21 0.17 0.94 0.21 0.65 0.19 1.22 0.82 0.80 0.05 0.26 0.10 0.59 1.82 1.06 3.66 3.55 1.06 5.71 1.17 0.3903/18/04 0.67 0.62 0.64 0.82 0.55 3.13 0.18 0.64 1.01 1.17 0.09 0.22 0.94 1.55 1.77 1.03 4.72 6.68 0.83 11.18 1.92 0.4704/16/04 0.18 0.21 0.65 0.58 0.30 1.13 0.15 0.37 0.94 0.64 0.04 0.04 0.50 0.54 1.90 1.13 1.68 5.55 0.80 5.33 1.13 0.5105/13/04 0.10 0.23 0.13 0.25 0.17 0.76 0.14 0.36 0.68 0.48 0.01 0.02 0.54 0.62 1.82 1.37 0.52 3.81 1.04 3.14 0.81 0.5106/09/04 0.15 0.33 0.21 0.39 0.25 1.36 0.20 0.54 1.16 0.77 0.01 0.02 0.83 0.98 3.74 2.45 1.04 12.82 1.73 10.34 1.97 0.8007/08/04 0.03 0.19 0.10 0.03 0.03 0.62 0.05 0.40 0.69 0.03 0.06 0.02 0.18 0.76 2.46 1.69 0.67 4.32 1.42 4.21 0.90 0.5008/05/04 0.04 0.18 0.10 0.03 0.05 0.60 0.08 0.36 0.76 0.07 0.56 0.01 0.47 0.87 2.73 1.55 0.79 3.18 1.16 6.77 1.02 0.4909/02/04 0.04 0.12 0.12 0.15 0.04 0.59 0.08 0.37 0.65 0.13 0.14 0.03 0.21 0.71 1.81 1.03 0.18 3.92 0.92 5.36 0.83 0.4110/01/04 0.03 0.08 0.16 0.45 2.60 3.21 2.82 0.40 1.72 1.83 2.49 0.54 0.11 13.30 3.26 2.49 0.62 9.23 3.93 14.96 3.21 0.0910/29/04 0.05 0.03 0.06 0.16 0.76 1.85 0.05 0.19 2.12 2.12 1.03 0.93 0.04 2.67 8.72 0.48 0.05 9.26 1.69 13.61 2.29 0.9311/24/04 0.02 0.05 0.04 0.09 0.90 3.65 0.05 0.28 0.66 1.25 2.23 0.93 0.09 1.14 8.76 0.29 0.38 4.35 1.31 9.26 1.79 0.6912/22/04 0.15 0.03 0.04 0.18 0.20 2.45 0.05 0.21 0.50 1.42 3.54 0.53 0.02 2.23 7.67 0.87 0.02 4.52 1.42 9.26 1.76 0.6601/20/05 0.26 0.08 0.07 0.25 0.27 0.93 0.07 0.22 0.22 1.89 3.87 0.66 0.05 4.20 5.50 1.27 0.06 3.02 1.50 8.60 1.65 0.0402/17/05 0.36 0.21 0.11 0.28 0.16 1.09 0.08 0.29 0.50 1.87 4.24 0.80 0.02 3.03 4.69 1.59 0.03 4.24 1.59 8.39 1.68 0.6403/18/05 0.32 2.56 0.64 0.16 0.14 0.61 0.10 0.16 0.45 2.17 4.32 0.50 0.03 2.17 4.55 1.95 0.51 3.59 1.44 7.43 1.69 0.0504/14/05 0.32 0.68 0.77 0.40 1.15 0.92 0.65 0.80 0.92 0.92 5.25 0.92 0.17 1.60 4.80 1.71 2.83 3.57 3.73 6.71 1.94 0.7305/12/05 0.02 0.04 0.31 0.11 1.54 3.90 0.02 0.25 0.65 0.31 1.03 0.98 1.26 1.26 2.67 0.95 4.75 2.27 1.54 6.43 1.51 0.0606/09/05 0.01 0.00 0.03 0.03 0.03 0.00 0.03 0.05 0.45 0.99 0.08 0.07 0.00 0.84 0.25 1.40 0.00 3.40 2.43 3.12 0.66 0.0107/12/05 0.07 0.03 0.00 5.42 0.08 0.00 0.11 5.20 0.34 0.82 0.06 1.66 0.00 0.69 0.13 1.21 0.14 4.36 2.67 4.41 1.37 0.8208/10/05 0.77 0.00 0.04 1.01 0.12 0.38 0.08 5.31 0.06 0.04 0.04 0.58 0.24 0.21 0.45 0.69 2.14 6.16 1.74 10.47 1.53 0.3609/02/05 0.17 0.01 0.02 0.16 0.20 0.02 0.20 2.29 0.10 1.33 0.01 1.22 0.08 0.65 0.28 0.45 0.51 2.57 2.34 9.41 1.10 0.7609/29/05 0.01 0.02 0.01 0.05 0.08 0.01 0.02 0.13 0.21 0.01 0.00 0.77 0.01 0.19 0.04 1.66 0.01 0.19 3.32 20.99 1.39 0.2110/27/05 0.04 0.04 0.01 0.08 0.01 0.01 0.03 0.16 0.12 0.87 0.01 0.62 0.03 1.18 0.09 1.41 0.01 0.18 3.65 13.52 1.10 1.7511/23/05 0.02 0.06 0.06 0.04 0.49 0.04 0.13 0.35 0.26 0.12 0.00 0.76 0.03 0.15 0.03 0.93 0.02 0.28 3.33 14.64 1.09 0.9212/20/05 0.54 0.45 0.17 10.07 3.51 0.13 0.14 5.51 1.57 0.69 0.04 8.35 2.18 0.66 0.60 0.98 0.21 6.90 3.96 31.78 3.92 3.4001/17/06 3.67 2.07 0.15 1.06 0.76 0.01 0.50 2.95 5.92 0.41 0.00 3.39 8.34 0.14 0.43 1.47 0.48 0.45 2.40 8.89 2.18 3.0102/16/06 7.04 2.26 0.17 0.57 0.31 0.27 1.25 2.36 3.43 0.35 0.26 1.20 0.22 0.19 0.88 1.51 3.06 1.20 2.58 3.85 1.65 2.1503/16/06 2.66 0.74 0.20 0.14 0.20 0.52 0.09 0.25 2.16 0.31 0.31 0.74 0.20 0.20 1.67 1.84 4.35 0.80 4.73 3.20 1.27 2.2204/18/06 0.74 0.21 0.07 0.17 0.03 0.24 0.04 0.16 0.82 0.68 0.19 0.97 0.25 0.45 0.68 2.29 0.05 0.37 4.77 2.01 0.76 0.7105/11/06 0.08 0.02 0.00 0.03 0.01 0.03 0.01 0.26 0.36 0.74 0.07 0.82 0.06 0.47 0.10 1.54 0.03 0.38 4.40 0.99 0.52 0.3606/08/06 0.01 0.10 0.00 0.03 0.00 0.21 0.00 0.17 0.28 0.94 0.01 0.65 0.10 0.55 0.01 1.32 0.00 0.42 4.02 0.13 0.45 0.4107/06/06 0.00 0.01 0.00 0.03 0.01 0.03 0.01 0.13 0.10 0.77 0.00 0.56 0.11 0.74 0.14 0.63 0.07 0.49 3.71 0.79 0.42 0.5708/04/06 0.00 0.00 0.00 0.00 0.02 0.00 0.02 0.00 0.07 0.07 0.00 0.55 0.08 0.07 0.70 1.18 0.04 0.40 2.86 1.54 0.38 0.3209/01/06 0.00 0.00 0.00 0.01 0.00 0.09 0.00 0.10 0.10 0.13 0.00 0.44 0.22 0.11 0.68 1.36 0.00 0.67 1.71 1.27 0.35 0.0209/28/06 0.01 0.00 0.01 0.04 0.01 0.05 0.01 0.15 0.07 0.01 0.01 0.54 0.15 0.05 0.04 2.03 0.29 2.14 0.09 6.84 0.63 0.4310/26/06 0.04 0.08 0.02 0.04 0.02 0.16 0.02 0.22 0.09 0.04 0.02 0.41 0.21 0.10 0.77 2.26 0.07 1.01 3.57 4.82 0.70 2.7711/21/06 0.04 0.09 0.02 0.08 0.01 0.17 0.03 0.21 0.04 0.20 0.01 0.16 0.22 0.11 1.07 1.96 0.11 0.87 3.50 3.89 0.64 4.6612/21/06 0.09 0.18 0.02 0.10 0.02 0.19 0.04 0.20 0.07 0.46 0.01 0.02 0.24 0.58 1.47 2.47 0.35 0.89 4.03 3.48 0.75 4.6501/25/07 0.09 0.21 0.03 0.03 0.03 0.12 0.03 0.23 0.06 0.42 0.02 0.23 0.11 0.30 0.98 1.47 0.17 1.63 3.13 5.07 0.72 2.3802/27/07 0.18 0.18 0.05 0.11 0.11 0.14 0.03 0.24 0.16 0.47 0.01 0.12 0.14 0.28 0.74 16.02 6.26 3.46 3.68 5.48 1.89 2.6703/22/07 0.22 0.23 0.02 0.13 0.01 0.16 0.02 0.27 0.17 0.50 0.01 0.02 0.16 0.32 1.21 0.92 1.44 1.27 3.57 6.04 0.83 1.5504/26/07 0.49 0.15 0.03 0.54 0.01 0.19 0.06 0.36 0.07 0.23 0.01 0.10 0.22 0.44 1.73 1.73 0.13 1.38 3.78 5.82 0.87 1.8506/01/07 0.45 0.13 0.04 0.41 0.02 0.21 0.05 0.46 0.07 0.20 0.13 0.19 0.31 0.51 1.52 0.90 0.20 1.24 3.41 6.28 0.84 2.6707/05/07 0.05 0.19 0.03 0.38 0.00 0.19 0.04 0.54 0.06 0.11 0.15 0.05 0.23 0.49 1.16 1.22 0.15 1.00 3.04 6.53 0.78 2.3407/26/07 0.01 0.16 0.03 0.17 0.01 0.20 0.04 0.46 0.05 0.09 0.15 0.08 0.32 0.43 1.53 1.53 0.14 0.89 3.41 6.73 0.82 2.8509/06/07 0.09 0.11 0.05 0.17 0.00 0.17 0.03 0.52 0.05 0.71 0.08 0.04 0.19 0.30 0.39 1.59 0.05 1.06 2.87 5.37 0.69 1.00

- 97 -
Table 5. Average annual nitrate concentrations in the groundwater monitoring wells at the Interim Measures field.
2001 2002 2003 2004 2005 2006 Location ------------------- NO3-N, mg/L -----------------
Transect 1 0.10Cb 0.22BCb 0.96Ab 0.21BCc 0.53Bb 0.51BCbc Transect 2 0.08Cb 0.15BCb 0.42ABcd 0.71Ac 0.73Ab 0.27BCc
Transect 3 0.12Cb 0.07Cb 0.85ABbc 0.73ABc 1.05Ab 0.66Bbc Transect 4 0.10Cb 0.09Cb 0.98Bb 1.81Ab 1.18Bb 0.83Bb Transect 5 0.38Ca 0.50Ca 1.97Ba 4.01Aa 4.44Aa 1.95Ba
Spring 0.08Bb 0.12Bb 0.11Bd 0.50Bc 0.75ABb 1.71Aa Uppercase letters represent significant differences (p<0.05) among annual means for each location Lowercase letters represent significant differences (p<0.05) among means for each year
Table 6. Nitrate and ammonium-N in the soil profile (2 m depth) on a yearly average basis at the Interim Measures field.
2002 2003 2004 2005 2006 Parameter ------------------- kg N / ha ----------------- NO3-N 19.20A 22.22A 28.38A 28.18A 31.97A NH4-N 67.12A 82.22A 84.88A 87.09A 90.54A
Uppercase letters represent significant differences (p<0.05) among annual means for each parameter

- 98 -
SECTION 3
BMP Verification Monitoring Wells at Selected Poultry Farms The Florida Department of Environmental Protection (FDEP) and the Florida Department of Agricultural and Consumer Services (FDACS) determined that groundwater monitoring was needed for verification of poultry BMP efficacy in the Suwannee River Basin. This project was funded to sample the wells and provide nitrate-N analyses on a monthly basis. Evaluation and interpretation of the data is the responsibility of FDEP and is not included in this report. Five poultry farms that had approved nutrient management plans in place were selected jointly by FDEP and FDACS for groundwater monitoring. Monitoring wells were installed on each of the farms by the Suwannee River Management District. Site selection of the wells on the individual farms was based on locations that would represent groundwater incoming to the farms, locations representing certain activities on the farms (e.g., land application of manure), and locations represent groundwater leaving the farm (Figures 1-5). This selection was done by a team of FDEP and FDACS personnel. Sampling of the poultry farm wells was started in March 2005. Nitrate-N concentrations for wells on the individual farms are shown in Figures 6-10 and averages over the sampling period are shown in Table 1. Average NO3-N concentrations for individual wells ranged from < 1 to 13 mg/L. Visual examination of the plotted values suggests that a three of the wells showed possible decreasing trends (Durden well #4, Edwards well #2, Hass well # 4) and two showed possible increasing trends (Edwards well #3 and Primm well #1). Concentrations in the other wells were either stable or variable with no obvious trends. Ammonium N concentrations, provided for information purposes, are shown in Figures 11-15 and Table 2. Concentrations were always < 1 mg/L NH4-N and were generally < 0.2 mg/L NH4-N. Soluble reactive P (SRP) concentrations are shown in Figures 16-20 and Table 3. SRP concentrations were initially relatively high in all the wells. We believe this is likely due to the P content of the drilling muds used in the well installation process. We have observed similar effects in monitoring wells at other sites. This effect seems to linger for a period of time even though the wells had been purged after installation. Average SRP concentrations (Table 3) were based on data from 6/20/06 to 10/02/07. During this time period the overall average SRP concentration for all wells was 0.08 mg/L SRP and the average for individual wells did not exceed 0.5 mg/L SRP. Tabular data used to develop the graphs and summary tables are presented in Tables 4-8.
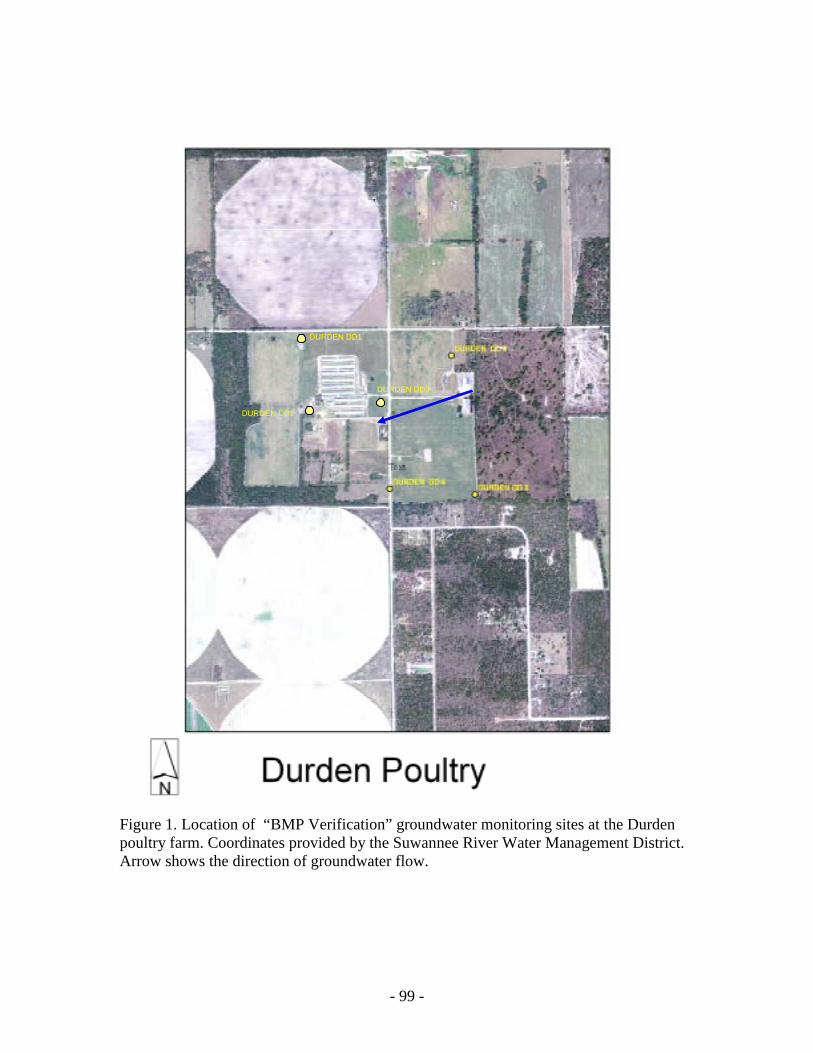
- 99 -
DURDEN DD1
DURDEN DD2
DURDEN DD3
DURDEN DD1
DURDEN DD2
DURDEN DD3
Figure 1. Location of “BMP Verification” groundwater monitoring sites at the Durden poultry farm. Coordinates provided by the Suwannee River Water Management District. Arrow shows the direction of groundwater flow.

- 100 -
Figure 2. Location of “BMP Verification” groundwater monitoring sites at the Edwards poultry farm. Coordinates provided by the Suwannee River Water Management District. Arrow shows the direction of groundwater flow.
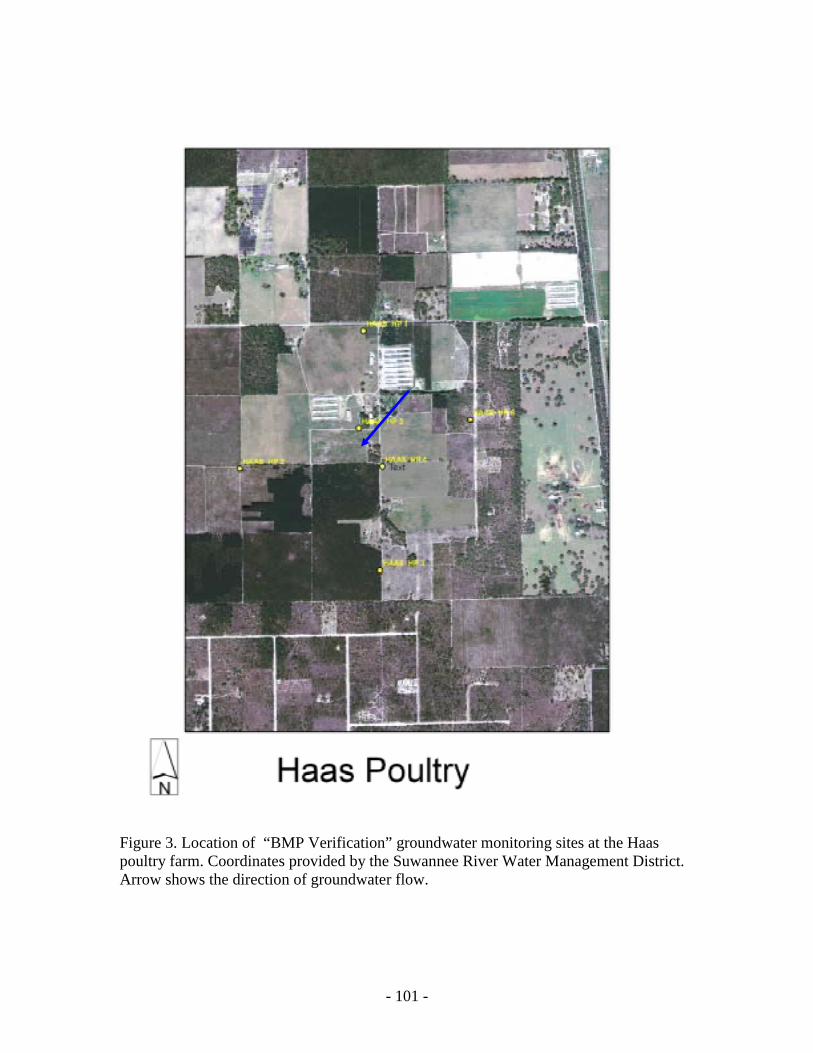
- 101 -
Figure 3. Location of “BMP Verification” groundwater monitoring sites at the Haas poultry farm. Coordinates provided by the Suwannee River Water Management District. Arrow shows the direction of groundwater flow.

- 102 -
Figure 4. Location of “BMP Verification” groundwater monitoring sites at the Primm poultry farm. Coordinates provided by the Suwannee River Water Management District. Arrow shows the direction of groundwater flow.
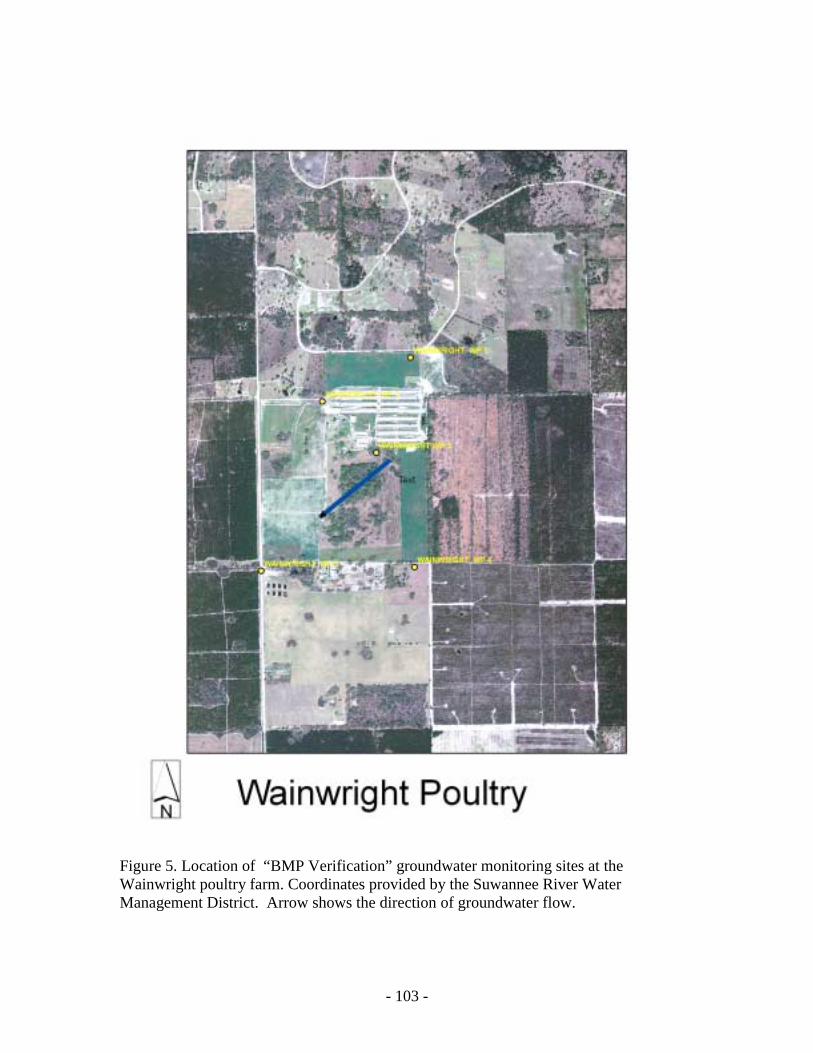
- 103 -
Figure 5. Location of “BMP Verification” groundwater monitoring sites at the Wainwright poultry farm. Coordinates provided by the Suwannee River Water Management District. Arrow shows the direction of groundwater flow.

- 104 -
Durden
0
5
10
15
20
3/31/20
05
5/31/20
05
7/31/20
05
9/30/20
05
11/30/2
005
1/31/20
06
3/31/20
06
5/31/20
06
7/31/20
06
9/30/20
06
11/30/2
006
1/31/20
07
3/31/20
07
5/31/20
07
7/31/20
07
Sampling Date
NO
3-N m
g/L
Well 1 Well 2 Well 3 Well 4 Well 5 Well 6
Figure 6. Groundwater nitrate-N concentrations at the Durden poultry farm.
Edwards
0
4
8
12
16
3/31/20
05
5/31/20
05
7/31/20
05
9/30/20
05
11/30/2
005
1/31/20
06
3/31/20
06
5/31/20
06
7/31/20
06
9/30/20
06
11/30/2
006
1/31/20
07
3/31/20
07
5/31/20
07
7/31/20
07
Sampling Date
NO
3-N m
g/L
Well 1 Well 2 Well 3 Well 4 Well 5
Figure 7. Groundwater nitrate-N concentrations at the Edwards poultry farm.

- 105 -
Haas
0
4
8
12
16
20
9/13/2
005
10/13
/2005
11/13/2
005
12/13
/2005
1/13/2
006
2/13/2
006
3/13/2
006
4/13/2
006
5/13/20
06
6/13/2
006
7/13/200
6
8/13/2
006
9/13/200
6
10/13/2
006
11/13/2
006
12/13/2
006
1/13/2
007
2/13/200
7
3/13/200
7
4/13/2
007
5/13/2
007
6/13/2
007
7/13/2
007
8/13/2
007
9/13/2
007
Sampling Date
NO
3-N
mg/
LWell 1 Well 2 Well 3 Well 4 Well 5 Well 6
Figure 8. Groundwater nitrate-N concentrations at the Haas poultry farm.
Primm
0
4
8
12
16
20
8/17/200
5
10/17/2
005
12/17
/2005
2/17/200
6
4/17/200
6
6/17/2
006
8/17/2
006
10/17
/2006
12/17/2
006
2/17/20
07
4/17/200
7
6/17/200
7
8/17/2
007
Sampling Date
NO
3-N
mg/
L
Well 1 Well 2 Well 3 Well 4 Well 5
Figure 9. Groundwater nitrate-N concentrations at the Primm poultry farm.
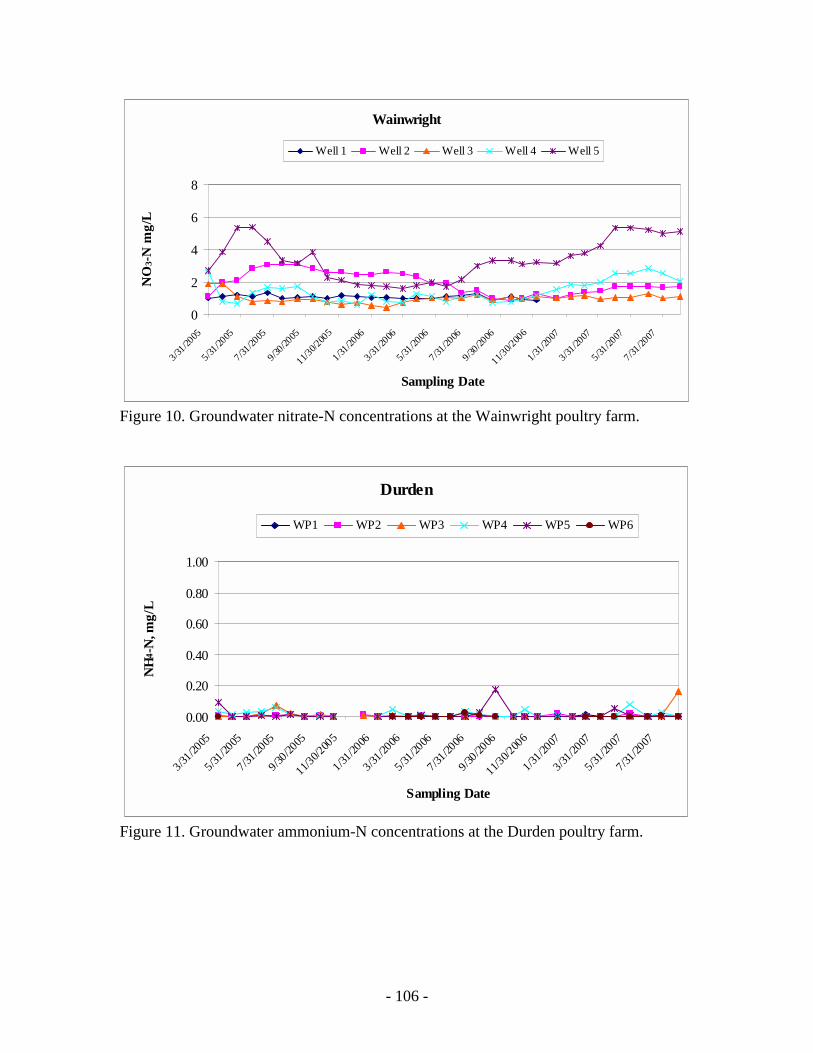
- 106 -
Wainwright
0
2
4
6
8
3/31/20
05
5/31/20
05
7/31/20
05
9/30/20
05
11/30/2
005
1/31/20
06
3/31/20
06
5/31/20
06
7/31/20
06
9/30/20
06
11/30/2
006
1/31/20
07
3/31/20
07
5/31/20
07
7/31/20
07
Sampling Date
NO
3-N m
g/L
Well 1 Well 2 Well 3 Well 4 Well 5
Figure 10. Groundwater nitrate-N concentrations at the Wainwright poultry farm.
Durden
0.00
0.20
0.40
0.60
0.80
1.00
3/31/20
05
5/31/20
05
7/31/20
05
9/30/20
05
11/30/2
005
1/31/20
06
3/31/20
06
5/31/20
06
7/31/20
06
9/30/20
06
11/30/2
006
1/31/20
07
3/31/20
07
5/31/20
07
7/31/20
07
Sampling Date
NH
4 -N
, mg/
L
WP1 WP2 WP3 WP4 WP5 WP6
Figure 11. Groundwater ammonium-N concentrations at the Durden poultry farm.

- 107 -
Edwards
0.00
0.20
0.40
0.60
0.80
1.00
3/31/20
05
5/31/20
05
7/31/20
05
9/30/20
05
11/30/2
005
1/31/20
06
3/31/20
06
5/31/20
06
7/31/20
06
9/30/20
06
11/30/2
006
1/31/20
07
3/31/20
07
5/31/20
07
7/31/20
07
Sampling Date
NH
4 -N
, mg/
LWP1 WP2 WP3 WP4 WP5
Figure 12. Groundwater ammonium-N concentrations at the Edwards poultry farm.
Haas
0.00
0.20
0.40
0.60
0.80
1.00
3/31/20
05
5/31/20
05
7/31/20
05
9/30/20
05
11/30/2
005
1/31/20
06
3/31/20
06
5/31/20
06
7/31/20
06
9/30/20
06
11/30/2
006
1/31/20
07
3/31/20
07
5/31/20
07
7/31/20
07
Sampling Date
NH
4 -N
, mg/
L
Well 1 Well 2 Well 3 Well 4 Well 5 Well 6
Figure 13. Groundwater ammonium-N concentrations at the Haas poultry farm.

- 108 -
Primm
0.00
0.20
0.40
0.60
0.80
1.00
3/31/20
05
5/31/20
05
7/31/20
05
9/30/20
05
11/30/2
005
1/31/20
06
3/31/20
06
5/31/20
06
7/31/20
06
9/30/20
06
11/30/2
006
1/31/20
07
3/31/20
07
5/31/20
07
7/31/20
07
Sampling Date
NH
4 -N
, mg/
LWell 1 Well 2 Well 3 Well 4 Well 5
Figure 14. Groundwater ammonium-N concentrations at the Primm poultry farm.
Wainwright
0.00
0.20
0.40
0.60
0.80
1.00
3/31/20
05
5/31/20
05
7/31/20
05
9/30/20
05
11/30/2
005
1/31/20
06
3/31/20
06
5/31/20
06
7/31/20
06
9/30/20
06
11/30/2
006
1/31/20
07
3/31/20
07
5/31/20
07
7/31/20
07
Sampling Date
NH
4 -N
, mg/
L
WP1 WP2 WP3 WP4 WP5
Figure 15. Groundwater ammonium-N concentrations at the Wainwright poultry farm.
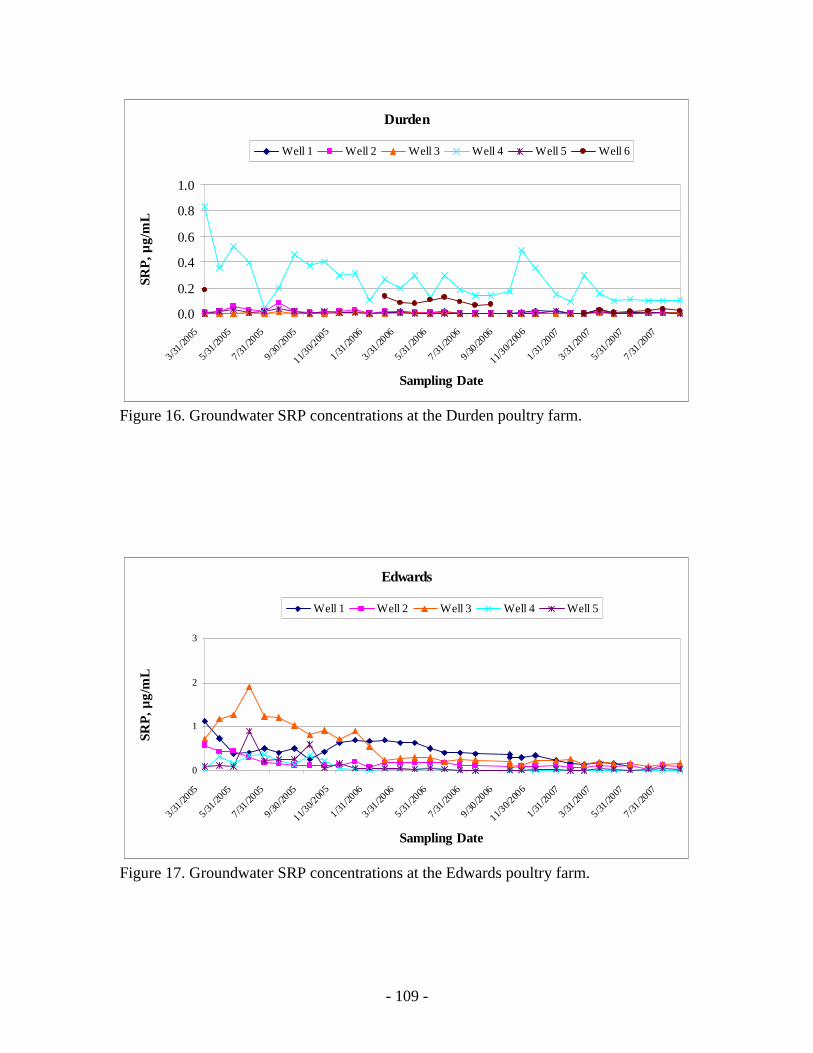
- 109 -
Durden
0.0
0.2
0.4
0.6
0.8
1.0
3/31/20
05
5/31/20
05
7/31/20
05
9/30/20
05
11/30/2
005
1/31/20
06
3/31/20
06
5/31/20
06
7/31/20
06
9/30/20
06
11/30/2
006
1/31/20
07
3/31/20
07
5/31/20
07
7/31/20
07
Sampling Date
SRP,
µg/
mL
Well 1 Well 2 Well 3 Well 4 Well 5 Well 6
Figure 16. Groundwater SRP concentrations at the Durden poultry farm.
Edwards
0
1
2
3
3/31/20
05
5/31/20
05
7/31/20
05
9/30/20
05
11/30/2
005
1/31/20
06
3/31/20
06
5/31/20
06
7/31/20
06
9/30/20
06
11/30/2
006
1/31/20
07
3/31/20
07
5/31/20
07
7/31/20
07
Sampling Date
SRP,
µg/
mL
Well 1 Well 2 Well 3 Well 4 Well 5
Figure 17. Groundwater SRP concentrations at the Edwards poultry farm.

- 110 -
Haas
0.0
0.5
1.0
1.5
2.0
3/31/20
05
5/31/20
05
7/31/20
05
9/30/20
05
11/30/2
005
1/31/20
06
3/31/20
06
5/31/20
06
7/31/20
06
9/30/20
06
11/30/2
006
1/31/20
07
3/31/20
07
5/31/20
07
7/31/20
07
Sampling Date
SRP,
µg/
mL
Well 1 Well 2 Well 3 Well 4 Well 5 Well 6
Figure 18. Groundwater SRP concentrations at the Haas poultry farm.
Primm
0.0
0.8
1.5
2.3
3.0
3/31/20
05
5/31/20
05
7/31/20
05
9/30/20
05
11/30/2
005
1/31/20
06
3/31/20
06
5/31/20
06
7/31/20
06
9/30/20
06
11/30/2
006
1/31/20
07
3/31/20
07
5/31/20
07
7/31/20
07
Sampling Date
SRP,
µg/
mL
Well 1 Well 2 Well 3 Well 4 Well 5
Figure 19. Groundwater SRP concentrations at the Primm poultry farm.

- 111 -
Wainwright
0.0
0.3
0.5
0.8
1.0
3/31/20
05
5/31/20
05
7/31/20
05
9/30/20
05
11/30/2
005
1/31/20
06
3/31/20
06
5/31/20
06
7/31/20
06
9/30/20
06
11/30/2
006
1/31/20
07
3/31/20
07
5/31/20
07
7/31/20
07
Sampling Date
SRP,
µg/
mL
Well 1 Well 2 Well 3 Well 4 Well 5
Figure 20. Groundwater SRP concentrations at the Wainwright poultry farm. Table 1. Average groundwater nitrate-N concentrations in BMP verification wells.
Well ID Number ------------------------------ NO3-N, mg/L -------------------------------- Farm
1 2 3 4 5 6 Durden 10.68 13.44 11.17 3.03 0.33 2.27
Edwards 1.49 5.75 1.92 1.16 9.49 Haas 2.52 11.36 1.91 7.90 9.25 1.92
Primm 3.62 1.04 11.61 0.82 0.74 Wainwright 1.07 1.93 0.99 1.42 3.40
Table 2. Average groundwater ammonium-N concentrations in BMP verification wells.
Well ID Number ------------------------------ NH4-N, mg/L -------------------------------- Farm
1 2 3 4 5 6 Durden 0.00 0.00 0.01 0.02 0.01 0.00
Edwards 0.01 0.02 0.02 0.01 0.03 Haas 0.02 0.04 0.00 0.02 0.04 0.03
Primm 0.01 0.02 0.00 0.02 0.01 Wainwright 0.01 0.01 0.04 0.01 0.01

- 112 -
Table 3. Average groundwater SRP* concentrations in BMP verification wells. Well ID Number
------------------------------ SRP, µg/mL -------------------------------- Farm 1 2 3 4 5 6
Durden 0.01 0.00 0.00 0.18 0.00 0.04 Edwards 0.27 0.11 0.18 0.01 0.03
Haas 0.33 0.03 0.17 0.35 0.07 0.10 Primm 0.43 0.03 0.02 0.06 0.25
Wainwright 0.03 0.29 0.07 0.02 0.02 *Averages calculated from data between 6/20/06 – 10/02/07 to minimize the effect of P contained in products used in well installation process.
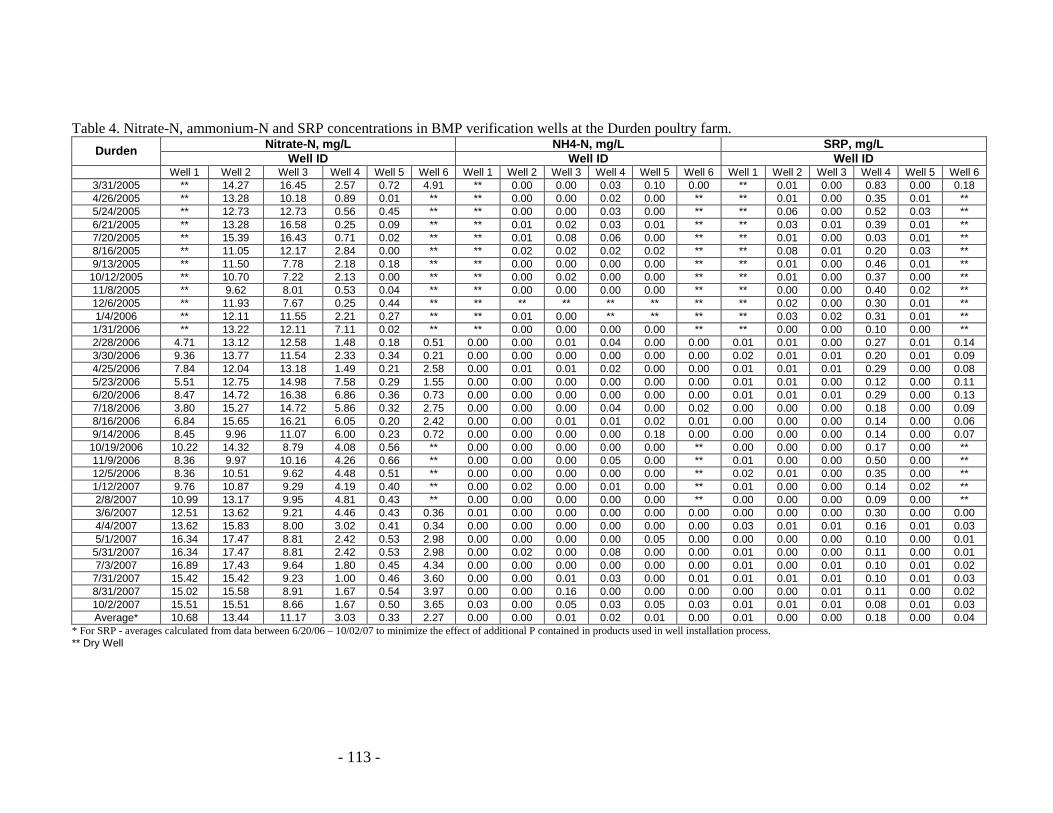
- 113 -
Table 4. Nitrate-N, ammonium-N and SRP concentrations in BMP verification wells at the Durden poultry farm. Nitrate-N, mg/L NH4-N, mg/L SRP, mg/L Durden Well ID Well ID Well ID
Well 1 Well 2 Well 3 Well 4 Well 5 Well 6 Well 1 Well 2 Well 3 Well 4 Well 5 Well 6 Well 1 Well 2 Well 3 Well 4 Well 5 Well 6 3/31/2005 ** 14.27 16.45 2.57 0.72 4.91 ** 0.00 0.00 0.03 0.10 0.00 ** 0.01 0.00 0.83 0.00 0.18 4/26/2005 ** 13.28 10.18 0.89 0.01 ** ** 0.00 0.00 0.02 0.00 ** ** 0.01 0.00 0.35 0.01 ** 5/24/2005 ** 12.73 12.73 0.56 0.45 ** ** 0.00 0.00 0.03 0.00 ** ** 0.06 0.00 0.52 0.03 ** 6/21/2005 ** 13.28 16.58 0.25 0.09 ** ** 0.01 0.02 0.03 0.01 ** ** 0.03 0.01 0.39 0.01 ** 7/20/2005 ** 15.39 16.43 0.71 0.02 ** ** 0.01 0.08 0.06 0.00 ** ** 0.01 0.00 0.03 0.01 ** 8/16/2005 ** 11.05 12.17 2.84 0.00 ** ** 0.02 0.02 0.02 0.02 ** ** 0.08 0.01 0.20 0.03 ** 9/13/2005 ** 11.50 7.78 2.18 0.18 ** ** 0.00 0.00 0.00 0.00 ** ** 0.01 0.00 0.46 0.01 **
10/12/2005 ** 10.70 7.22 2.13 0.00 ** ** 0.00 0.02 0.00 0.00 ** ** 0.01 0.00 0.37 0.00 ** 11/8/2005 ** 9.62 8.01 0.53 0.04 ** ** 0.00 0.00 0.00 0.00 ** ** 0.00 0.00 0.40 0.02 ** 12/6/2005 ** 11.93 7.67 0.25 0.44 ** ** ** ** ** ** ** ** 0.02 0.00 0.30 0.01 ** 1/4/2006 ** 12.11 11.55 2.21 0.27 ** ** 0.01 0.00 ** ** ** ** 0.03 0.02 0.31 0.01 ** 1/31/2006 ** 13.22 12.11 7.11 0.02 ** ** 0.00 0.00 0.00 0.00 ** ** 0.00 0.00 0.10 0.00 ** 2/28/2006 4.71 13.12 12.58 1.48 0.18 0.51 0.00 0.00 0.01 0.04 0.00 0.00 0.01 0.01 0.00 0.27 0.01 0.14 3/30/2006 9.36 13.77 11.54 2.33 0.34 0.21 0.00 0.00 0.00 0.00 0.00 0.00 0.02 0.01 0.01 0.20 0.01 0.09 4/25/2006 7.84 12.04 13.18 1.49 0.21 2.58 0.00 0.01 0.01 0.02 0.00 0.00 0.01 0.01 0.01 0.29 0.00 0.08 5/23/2006 5.51 12.75 14.98 7.58 0.29 1.55 0.00 0.00 0.00 0.00 0.00 0.00 0.01 0.01 0.00 0.12 0.00 0.11 6/20/2006 8.47 14.72 16.38 6.86 0.36 0.73 0.00 0.00 0.00 0.00 0.00 0.00 0.01 0.01 0.01 0.29 0.00 0.13 7/18/2006 3.80 15.27 14.72 5.86 0.32 2.75 0.00 0.00 0.00 0.04 0.00 0.02 0.00 0.00 0.00 0.18 0.00 0.09 8/16/2006 6.84 15.65 16.21 6.05 0.20 2.42 0.00 0.00 0.01 0.01 0.02 0.01 0.00 0.00 0.00 0.14 0.00 0.06 9/14/2006 8.45 9.96 11.07 6.00 0.23 0.72 0.00 0.00 0.00 0.00 0.18 0.00 0.00 0.00 0.00 0.14 0.00 0.07
10/19/2006 10.22 14.32 8.79 4.08 0.56 ** 0.00 0.00 0.00 0.00 0.00 ** 0.00 0.00 0.00 0.17 0.00 ** 11/9/2006 8.36 9.97 10.16 4.26 0.66 ** 0.00 0.00 0.00 0.05 0.00 ** 0.01 0.00 0.00 0.50 0.00 ** 12/5/2006 8.36 10.51 9.62 4.48 0.51 ** 0.00 0.00 0.00 0.00 0.00 ** 0.02 0.01 0.00 0.35 0.00 ** 1/12/2007 9.76 10.87 9.29 4.19 0.40 ** 0.00 0.02 0.00 0.01 0.00 ** 0.01 0.00 0.00 0.14 0.02 ** 2/8/2007 10.99 13.17 9.95 4.81 0.43 ** 0.00 0.00 0.00 0.00 0.00 ** 0.00 0.00 0.00 0.09 0.00 ** 3/6/2007 12.51 13.62 9.21 4.46 0.43 0.36 0.01 0.00 0.00 0.00 0.00 0.00 0.00 0.00 0.00 0.30 0.00 0.00 4/4/2007 13.62 15.83 8.00 3.02 0.41 0.34 0.00 0.00 0.00 0.00 0.00 0.00 0.03 0.01 0.01 0.16 0.01 0.03 5/1/2007 16.34 17.47 8.81 2.42 0.53 2.98 0.00 0.00 0.00 0.00 0.05 0.00 0.00 0.00 0.00 0.10 0.00 0.01 5/31/2007 16.34 17.47 8.81 2.42 0.53 2.98 0.00 0.02 0.00 0.08 0.00 0.00 0.01 0.00 0.00 0.11 0.00 0.01 7/3/2007 16.89 17.43 9.64 1.80 0.45 4.34 0.00 0.00 0.00 0.00 0.00 0.00 0.01 0.00 0.01 0.10 0.01 0.02 7/31/2007 15.42 15.42 9.23 1.00 0.46 3.60 0.00 0.00 0.01 0.03 0.00 0.01 0.01 0.01 0.01 0.10 0.01 0.03 8/31/2007 15.02 15.58 8.91 1.67 0.54 3.97 0.00 0.00 0.16 0.00 0.00 0.00 0.00 0.00 0.01 0.11 0.00 0.02 10/2/2007 15.51 15.51 8.66 1.67 0.50 3.65 0.03 0.00 0.05 0.03 0.05 0.03 0.01 0.01 0.01 0.08 0.01 0.03 Average* 10.68 13.44 11.17 3.03 0.33 2.27 0.00 0.00 0.01 0.02 0.01 0.00 0.01 0.00 0.00 0.18 0.00 0.04
* For SRP - averages calculated from data between 6/20/06 – 10/02/07 to minimize the effect of additional P contained in products used in well installation process. ** Dry Well

- 114 -
Table 5. Nitrate-N, ammonium-N and SRP concentrations in BMP verification wells at the Edwards poultry farm. Nitrate-N, mg/L NH4-N, mg/L SRP, mg/L Edwards Well ID Well ID Well ID
Well 1 Well 2 Well 3 Well 4 Well 5 Well 1 Well 2 Well 3 Well 4 Well 5 Well 1 Well 2 Well 3 Well 4 Well 5 3/31/2005 0.94 4.69 2.13 1.32 9.27 0.02 0.04 0.00 0.02 0.00 1.12 0.57 0.72 0.05 0.10 4/27/2005 1.76 5.51 2.64 1.27 7.38 0.00 0.01 0.00 0.00 0.00 0.74 0.43 1.17 0.34 0.11 5/24/2005 2.04 6.72 1.82 1.54 8.26 0.00 0.00 0.00 0.00 0.00 0.38 0.44 1.28 0.16 0.10 6/21/2005 2.20 9.03 2.04 1.65 9.36 0.00 0.00 0.00 0.00 0.00 0.42 0.30 1.92 0.34 0.90 7/20/2005 2.43 10.68 1.64 1.64 11.21 0.01 0.01 0.00 0.00 0.08 0.52 0.18 1.24 0.37 0.23 8/16/2005 2.00 9.42 1.66 1.61 9.25 0.02 0.02 0.02 0.01 0.24 0.42 0.17 1.21 0.25 0.28 9/13/2005 2.29 9.38 1.61 1.78 9.50 0.00 0.01 0.00 0.00 0.09 0.51 0.13 1.03 0.15 0.27 10/12/2005 2.91 8.96 1.34 1.57 10.41 0.00 0.00 0.00 0.00 0.24 0.28 0.12 0.83 0.34 0.59 11/8/2005 3.24 8.87 1.18 1.34 9.36 0.00 0.00 0.00 0.00 0.00 0.42 0.11 0.93 0.22 0.07 12/6/2005 2.31 8.59 1.35 1.35 9.54 0.00 0.00 0.00 0.00 0.00 0.64 0.13 0.72 0.05 0.17 1/4/2006 2.49 6.33 1.16 1.27 10.99 0.03 0.00 0.03 0.00 0.00 0.70 0.21 0.91 0.05 0.06
1/31/2006 1.77 8.11 1.32 1.27 10.44 0.01 0.00 0.00 0.00 0.00 0.68 0.09 0.55 0.02 0.07 2/28/2006 1.20 5.48 1.70 1.20 11.48 0.03 0.00 0.00 0.00 0.02 0.69 0.19 0.24 0.05 0.07 3/30/2006 1.66 6.62 1.54 1.15 10.42 0.00 0.00 0.00 0.00 0.00 0.64 0.19 0.28 0.03 0.06 4/25/2006 0.92 6.36 1.55 1.09 10.19 0.02 0.01 0.01 0.00 0.02 0.65 0.18 0.32 0.03 0.05 5/23/2006 0.97 5.46 1.55 1.11 9.96 0.00 0.00 0.00 0.00 0.00 0.51 0.19 0.32 0.08 0.05 6/20/2006 0.95 4.86 1.64 1.08 13.05 0.00 0.00 0.00 0.00 0.00 0.41 0.18 0.20 0.03 0.05 7/18/2006 1.19 4.97 2.03 1.03 9.52 0.01 0.02 0.00 0.00 0.00 0.41 0.11 0.27 0.00 0.03 8/16/2006 1.05 4.74 2.30 1.05 8.09 0.01 0.00 0.00 0.01 0.02 0.38 0.13 0.25 0.00 0.01 9/14/2006 1.11 5.56 2.05 1.11 9.96 0.05 0.00 0.01 0.00 0.05 0.36 0.10 0.20 0.01 0.02 10/19/2006 0.99 5.08 1.65 0.99 9.89 0.06 0.05 0.66 0.07 0.05 0.30 0.09 0.11 0.01 0.02 11/9/2006 0.96 5.01 1.37 0.90 8.44 0.00 0.00 0.00 0.00 0.00 0.30 0.10 0.13 0.01 0.03 12/5/2006 0.84 4.91 1.80 0.89 8.98 0.00 0.00 0.00 0.00 0.00 0.34 0.11 0.22 0.02 0.04 1/12/2007 0.83 3.86 1.97 0.90 9.73 0.00 0.00 0.00 0.00 0.00 0.25 0.12 0.22 0.01 0.03 2/8/2007 0.87 3.61 2.46 0.77 8.20 0.00 0.00 0.00 0.00 0.00 0.17 0.08 0.26 0.00 0.00 3/6/2007 0.70 3.35 2.36 0.92 8.00 0.00 0.00 0.01 0.00 0.00 0.13 0.07 0.13 0.00 0.00 4/4/2007 0.75 3.35 2.36 0.81 7.33 0.01 0.03 0.03 0.00 0.10 0.18 0.13 0.20 0.03 0.06 5/1/2007 0.96 3.65 2.53 1.07 8.92 0.00 0.00 0.00 0.00 0.00 0.15 0.10 0.15 0.02 0.04
5/31/2007 0.96 3.65 2.53 1.07 8.92 0.01 0.01 0.00 0.03 0.20 0.11 0.12 0.17 0.01 0.03 7/3/2007 ** 3.26 2.45 0.88 8.34 ** 0.43 0.00 0.00 0.00 ** 0.05 0.10 0.02 0.03
7/31/2007 ** 3.38 2.46 0.84 9.23 ** 0.06 0.00 0.00 0.00 ** 0.12 0.15 0.02 0.06 8/31/2007 ** 3.24 2.74 1.00 10.09 ** 0.00 0.00 0.00 0.00 ** 0.10 0.16 0.01 0.04 10/2/2007 ** 3.01 2.37 0.90 9.36 ** 0.03 0.05 0.02 0.03 ** 0.10 0.15 0.02 0.05 Average* 1.49 5.75 1.92 1.16 9.49 0.01 0.02 0.02 0.01 0.03 0.27 0.11 0.18 0.01 0.03
* For SRP - averages calculated from data between 6/20/06 – 10/02/07 to minimize the effect of additional P contained in products used in well installation process. ** Dry Well

- 115 -
Table 6. Nitrate-N, ammonium-N and SRP concentrations in BMP verification wells at the Haas poultry farm. Nitrate-N, mg/L NH4-N, mg/L SRP, mg/L Haas Well ID Well ID Well ID
Well 1 Well 2 Well 3 Well 4 Well 5 Well 6 Well 1 Well 2 Well 3 Well 4 Well 5 Well 6 Well 1 Well 2 Well 3 Well 4 Well 5 Well 6 3/30/2005 2.52 13.18 ** ** 9.92 0.68 0.16 0.08 ** ** 0.00 0.01 1.78 0.80 ** ** 0.71 0.72 4/26/2005 2.64 11.02 ** ** 9.37 0.79 0.00 0.00 ** ** 0.00 0.00 1.33 0.56 ** ** 0.57 0.74 5/24/2005 2.31 12.12 ** ** 8.04 0.77 0.00 0.02 ** ** 0.02 0.00 1.15 0.53 ** ** 1.32 0.84 6/21/2005 2.26 13.22 ** ** 8.48 0.77 0.01 0.01 ** ** 0.07 0.01 1.20 0.35 ** ** 0.46 0.29 7/20/2005 2.27 14.34 ** ** 9.69 1.02 0.01 0.02 ** ** 0.00 0.03 1.58 0.21 ** ** 0.41 0.08 8/16/2005 2.22 11.05 0.99 4.18 8.70 0.94 0.02 0.00 0.01 0.03 0.02 0.00 1.01 0.18 1.06 1.75 0.67 0.07 9/13/2005 2.52 14.93 1.61 13.79 9.32 0.86 0.00 0.00 0.00 0.01 0.00 0.00 0.70 0.04 1.67 1.09 0.67 0.03 10/12/2005 2.80 12.88 1.57 18.47 10.36 1.29 0.00 0.00 0.00 0.00 0.00 0.00 0.76 0.02 0.76 1.09 0.41 0.01 11/8/2005 2.48 10.70 1.40 13.95 9.69 1.61 ** 0.00 0.00 ** 0.00 0.00 0.96 0.80 0.66 0.73 0.38 0.03 12/6/2005 2.36 11.40 1.57 7.42 9.44 1.99 ** ** ** ** ** 0.00 0.80 0.06 0.53 1.34 0.22 0.02 1/4/2006 2.38 9.88 1.77 6.55 8.66 2.32 0.00 0.00 ** 0.00 0.00 0.00 0.53 0.07 0.39 0.40 0.33 0.02
1/31/2006 2.38 10.00 1.88 6.94 9.22 2.60 0.03 0.00 0.03 0.03 0.00 0.00 0.38 0.03 0.33 0.72 0.31 0.00 2/28/2006 2.19 9.58 1.75 7.56 8.93 2.79 0.04 0.02 0.00 0.04 0.01 0.00 0.47 0.05 0.31 0.64 0.23 0.02 3/30/2006 1.60 9.25 1.71 7.07 8.80 2.77 0.00 0.00 0.00 0.06 0.00 0.00 0.46 0.04 0.27 0.49 0.32 0.04 4/25/2006 1.83 9.22 1.55 10.25 7.96 2.81 0.01 0.01 0.01 0.03 0.01 0.02 0.45 0.05 0.23 0.24 0.17 0.02 5/23/2006 1.89 9.25 1.50 9.58 7.35 2.84 0.00 0.00 0.00 0.00 0.00 0.00 0.52 0.05 0.30 0.22 0.25 0.05 6/20/2006 2.36 9.52 1.80 8.85 7.97 2.86 0.00 0.00 0.00 0.00 0.00 0.00 0.48 0.04 0.25 0.23 0.22 0.06 7/18/2006 2.03 9.91 1.53 6.30 9.41 2.97 0.01 0.01 0.00 0.06 0.03 0.05 0.44 0.02 0.23 0.49 0.10 0.06 8/16/2006 2.30 11.68 2.59 7.63 10.02 2.98 0.02 0.00 0.00 0.02 0.04 0.00 0.43 0.01 0.12 0.20 0.07 0.05 9/14/2006 2.33 8.85 2.50 6.45 10.11 2.94 0.00 0.00 0.00 0.03 0.00 0.00 0.39 0.04 0.14 0.31 0.07 0.11 10/19/2006 2.32 11.00 1.27 3.31 9.17 2.21 0.00 0.04 0.00 0.05 0.35 0.00 0.29 0.03 0.17 0.38 0.06 0.08 11/9/2006 2.01 10.26 0.99 2.87 8.49 2.23 0.01 0.00 0.00 0.04 0.00 0.07 0.01 0.02 0.19 0.50 0.04 0.04 12/5/2006 2.12 10.48 6.22 1.05 8.76 1.53 0.00 0.00 0.00 ** 0.00 0.00 0.22 0.04 0.23 ** 0.07 0.13 1/12/2007 2.08 7.55 1.75 ** 8.73 1.64 0.05 0.00 0.01 ** 0.00 0.00 0.72 0.03 0.23 ** 0.07 0.12 2/8/2007 2.19 10.99 1.86 ** 8.97 1.70 0.00 0.00 0.00 ** 0.00 0.00 0.35 0.01 0.16 ** 0.03 0.09 3/6/2007 2.58 10.30 1.91 ** 8.66 1.58 0.00 0.00 0.00 ** 0.00 0.00 0.31 0.01 0.13 ** 0.03 0.12 4/4/2007 2.69 11.41 1.86 ** 9.10 2.03 0.00 0.00 ** 0.00 0.00 0.00 0.23 0.10 0.17 ** 0.08 0.10 5/1/2007 3.43 14.10 2.08 ** 10.27 2.20 0.00 0.00 0.00 ** 0.00 0.00 0.21 0.04 0.12 ** 0.05 0.18
5/31/2007 3.43 14.10 2.08 ** 10.27 2.20 0.00 0.00 0.00 ** 0.00 0.42 0.23 0.05 0.10 ** 0.06 0.09 7/3/2007 3.80 15.27 ** ** 12.02 2.07 0.00 0.94 ** ** 0.77 0.29 0.26 0.05 ** ** 0.06 0.12
7/31/2007 3.60 13.29 ** ** 10.00 1.87 0.00 0.00 ** ** 0.00 0.00 0.31 0.04 ** ** 0.06 0.13 8/31/2007 3.86 12.78 ** ** 10.37 1.84 0.00 0.00 ** ** 0.00 0.01 0.28 0.02 ** ** 0.05 0.10 10/2/2007 3.30 11.43 ** ** 9.13 1.67 0.22 0.00 ** ** 0.02 0.05 0.48 0.04 ** ** 0.05 0.13 Average* 2.52 11.36 1.91 7.90 9.25 1.92 0.02 0.04 0.00 0.02 0.04 0.03 0.33 0.03 0.17 0.35 0.07 0.10
* For SRP - averages calculated from data between 6/20/06 – 10/02/07 to minimize the effect of additional P contained in products used in well installation process. ** Dry Well

- 116 -
Table 7. Nitrate-N, ammonium-N and SRP concentrations in BMP verification wells at the Primm poultry farm. Nitrate-N, mg/L NH4-N, mg/L SRP, mg/L Primm Well ID Well ID Well ID
Well 1 Well 2 Well 3 Well 4 Well 5 Well 1 Well 2 Well 3 Well 4 Well 5 Well 1 Well 2 Well 3 Well 4 Well 5 4/4/2005 1.01 ** ** 0.79 0.80 0.03 ** ** 0.00 0.00 ** ** ** 0.16 0.27 4/28/2005 1.71 ** ** 0.48 0.68 0.00 ** ** 0.00 0.00 0.91 ** ** 0.14 0.12 5/25/2005 1.88 ** ** 0.82 0.65 0.01 ** ** 0.00 0.00 1.58 ** ** 0.10 0.10 6/23/2005 1.66 ** ** 0.92 0.69 0.01 ** ** 0.01 0.01 2.48 ** ** 0.10 0.10 7/19/2005 2.69 ** ** 1.23 0.91 0.00 ** ** 0.00 0.01 0.88 ** ** 0.08 0.12 8/17/2005 2.78 1.72 9.93 0.83 0.77 ** ** ** 0.01 0.00 0.67 2.78 0.13 0.09 0.10 9/14/2005 2.98 1.09 16.65 1.09 0.86 0.00 ** 0.00 0.00 0.00 0.77 2.47 0.02 0.07 0.11
10/12/2005 3.02 0.78 15.12 0.84 0.90 0.00 ** 0.00 0.00 0.00 0.73 0.60 0.03 0.07 0.07 11/8/2005 3.18 0.64 13.95 0.80 0.96 0.00 ** 0.00 0.00 ** 0.85 1.82 0.04 0.14 0.12 12/6/2005 2.58 0.82 14.06 0.82 0.98 0.00 0.00 0.00 0.00 0.00 1.01 0.18 0.04 0.08 0.14 1/4/2006 2.88 0.99 14.33 0.77 0.99 0.01 ** 0.00 0.00 0.00 0.80 0.42 0.04 0.07 0.18 1/31/2006 2.71 1.16 14.33 0.77 0.88 0.00 0.11 0.00 0.00 0.00 0.65 0.26 0.03 0.06 0.17 3/1/2006 2.79 1.42 15.31 0.71 0.87 0.01 0.01 0.01 0.01 0.02 0.67 0.37 0.03 0.07 0.12 3/30/2006 3.16 1.04 13.21 0.81 0.93 0.00 0.00 0.00 0.00 0.00 0.72 0.32 0.03 0.08 0.11 4/25/2006 3.15 0.92 12.04 0.84 0.91 0.02 0.00 0.00 0.00 0.00 1.12 0.17 0.04 0.06 0.13 5/23/2006 3.45 0.96 11.08 0.81 0.91 0.00 0.00 0.00 0.00 0.00 0.52 0.07 0.03 0.07 0.75 6/20/2006 4.25 0.96 13.05 0.82 0.92 0.00 0.00 0.00 0.00 0.00 0.84 0.03 0.03 0.07 0.18 7/18/2006 4.36 1.00 12.50 0.84 0.92 0.00 0.02 0.02 0.06 0.14 0.42 0.02 0.01 0.05 0.14 8/16/2006 5.02 ** 12.81 0.84 0.83 0.06 ** 0.02 0.00 0.00 0.36 ** 0.01 0.05 0.35 9/14/2006 4.78 ** 8.89 0.84 0.69 0.07 ** 0.00 0.00 0.00 0.33 ** 0.02 0.05 0.21
10/19/2006 4.42 ** 11.00 0.82 0.55 0.00 ** 0.00 0.00 0.00 0.41 0.02 0.03 0.13 ** 11/9/2006 4.10 ** 9.76 0.83 0.58 0.00 ** 0.01 0.03 0.01 0.43 ** 0.01 0.03 0.59 12/5/2006 3.88 ** 9.00 0.83 0.54 0.00 ** 0.00 0.00 0.00 0.46 ** ** 0.09 0.17 1/12/2007 4.52 ** 9.07 0.76 0.51 0.00 ** 0.00 0.00 0.03 0.43 ** 0.03 0.07 1.12 2/8/2007 5.80 ** 8.86 0.66 0.46 0.00 ** 0.00 0.00 0.00 0.13 ** 0.00 0.03 0.12 3/6/2007 5.34 ** 10.30 0.69 0.67 0.07 ** 0.01 0.19 0.02 0.59 ** 0.01 0.03 0.15 4/4/2007 5.01 ** 8.33 0.77 0.76 0.01 ** 0.00 0.00 0.00 0.30 ** 0.03 0.06 0.16 5/1/2007 5.22 ** 12.98 0.96 0.74 0.00 ** 0.00 0.00 0.00 0.46 ** 0.03 0.06 0.13 5/31/2007 5.22 ** 12.98 0.96 0.74 0.02 ** 0.00 0.01 0.02 0.40 ** 0.02 0.07 0.15 7/3/2007 3.80 ** 9.91 0.88 0.50 0.00 ** 0.00 0.17 0.00 0.46 ** 0.03 0.06 0.16 7/31/2007 3.49 ** 7.93 0.70 0.41 0.00 ** 0.00 0.01 0.00 0.45 ** 0.04 0.08 0.14 8/31/2007 4.20 ** 9.36 0.91 0.48 0.00 ** 0.00 0.00 0.00 0.42 ** 0.03 0.07 0.13 10/2/2007 4.35 ** 8.43 0.77 0.39 0.01 ** 0.00 0.02 0.02 0.33 ** 0.03 0.07 0.14 Average* 3.62 1.04 11.61 0.82 0.74 0.01 0.02 0.00 0.02 0.01 0.43 0.03 0.02 0.06 0.25
* For SRP - averages calculated from data between 6/20/06 – 10/02/07 to minimize the effect of additional P contained in products used in well installation process. ** Dry Well
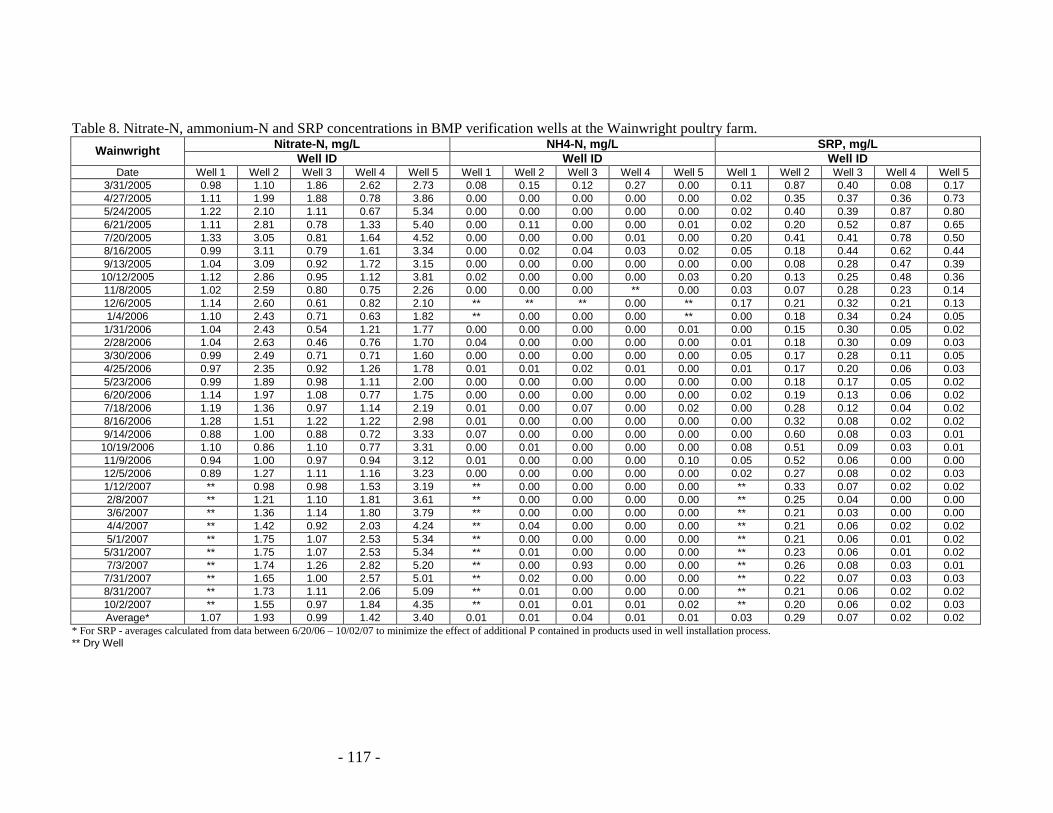
- 117 -
Table 8. Nitrate-N, ammonium-N and SRP concentrations in BMP verification wells at the Wainwright poultry farm. Nitrate-N, mg/L NH4-N, mg/L SRP, mg/L Wainwright Well ID Well ID Well ID
Date Well 1 Well 2 Well 3 Well 4 Well 5 Well 1 Well 2 Well 3 Well 4 Well 5 Well 1 Well 2 Well 3 Well 4 Well 5 3/31/2005 0.98 1.10 1.86 2.62 2.73 0.08 0.15 0.12 0.27 0.00 0.11 0.87 0.40 0.08 0.17 4/27/2005 1.11 1.99 1.88 0.78 3.86 0.00 0.00 0.00 0.00 0.00 0.02 0.35 0.37 0.36 0.73 5/24/2005 1.22 2.10 1.11 0.67 5.34 0.00 0.00 0.00 0.00 0.00 0.02 0.40 0.39 0.87 0.80 6/21/2005 1.11 2.81 0.78 1.33 5.40 0.00 0.11 0.00 0.00 0.01 0.02 0.20 0.52 0.87 0.65 7/20/2005 1.33 3.05 0.81 1.64 4.52 0.00 0.00 0.00 0.01 0.00 0.20 0.41 0.41 0.78 0.50 8/16/2005 0.99 3.11 0.79 1.61 3.34 0.00 0.02 0.04 0.03 0.02 0.05 0.18 0.44 0.62 0.44 9/13/2005 1.04 3.09 0.92 1.72 3.15 0.00 0.00 0.00 0.00 0.00 0.00 0.08 0.28 0.47 0.39
10/12/2005 1.12 2.86 0.95 1.12 3.81 0.02 0.00 0.00 0.00 0.03 0.20 0.13 0.25 0.48 0.36 11/8/2005 1.02 2.59 0.80 0.75 2.26 0.00 0.00 0.00 ** 0.00 0.03 0.07 0.28 0.23 0.14 12/6/2005 1.14 2.60 0.61 0.82 2.10 ** ** ** 0.00 ** 0.17 0.21 0.32 0.21 0.13 1/4/2006 1.10 2.43 0.71 0.63 1.82 ** 0.00 0.00 0.00 ** 0.00 0.18 0.34 0.24 0.05 1/31/2006 1.04 2.43 0.54 1.21 1.77 0.00 0.00 0.00 0.00 0.01 0.00 0.15 0.30 0.05 0.02 2/28/2006 1.04 2.63 0.46 0.76 1.70 0.04 0.00 0.00 0.00 0.00 0.01 0.18 0.30 0.09 0.03 3/30/2006 0.99 2.49 0.71 0.71 1.60 0.00 0.00 0.00 0.00 0.00 0.05 0.17 0.28 0.11 0.05 4/25/2006 0.97 2.35 0.92 1.26 1.78 0.01 0.01 0.02 0.01 0.00 0.01 0.17 0.20 0.06 0.03 5/23/2006 0.99 1.89 0.98 1.11 2.00 0.00 0.00 0.00 0.00 0.00 0.00 0.18 0.17 0.05 0.02 6/20/2006 1.14 1.97 1.08 0.77 1.75 0.00 0.00 0.00 0.00 0.00 0.02 0.19 0.13 0.06 0.02 7/18/2006 1.19 1.36 0.97 1.14 2.19 0.01 0.00 0.07 0.00 0.02 0.00 0.28 0.12 0.04 0.02 8/16/2006 1.28 1.51 1.22 1.22 2.98 0.01 0.00 0.00 0.00 0.00 0.00 0.32 0.08 0.02 0.02 9/14/2006 0.88 1.00 0.88 0.72 3.33 0.07 0.00 0.00 0.00 0.00 0.00 0.60 0.08 0.03 0.01
10/19/2006 1.10 0.86 1.10 0.77 3.31 0.00 0.01 0.00 0.00 0.00 0.08 0.51 0.09 0.03 0.01 11/9/2006 0.94 1.00 0.97 0.94 3.12 0.01 0.00 0.00 0.00 0.10 0.05 0.52 0.06 0.00 0.00 12/5/2006 0.89 1.27 1.11 1.16 3.23 0.00 0.00 0.00 0.00 0.00 0.02 0.27 0.08 0.02 0.03 1/12/2007 ** 0.98 0.98 1.53 3.19 ** 0.00 0.00 0.00 0.00 ** 0.33 0.07 0.02 0.02 2/8/2007 ** 1.21 1.10 1.81 3.61 ** 0.00 0.00 0.00 0.00 ** 0.25 0.04 0.00 0.00 3/6/2007 ** 1.36 1.14 1.80 3.79 ** 0.00 0.00 0.00 0.00 ** 0.21 0.03 0.00 0.00 4/4/2007 ** 1.42 0.92 2.03 4.24 ** 0.04 0.00 0.00 0.00 ** 0.21 0.06 0.02 0.02 5/1/2007 ** 1.75 1.07 2.53 5.34 ** 0.00 0.00 0.00 0.00 ** 0.21 0.06 0.01 0.02 5/31/2007 ** 1.75 1.07 2.53 5.34 ** 0.01 0.00 0.00 0.00 ** 0.23 0.06 0.01 0.02 7/3/2007 ** 1.74 1.26 2.82 5.20 ** 0.00 0.93 0.00 0.00 ** 0.26 0.08 0.03 0.01 7/31/2007 ** 1.65 1.00 2.57 5.01 ** 0.02 0.00 0.00 0.00 ** 0.22 0.07 0.03 0.03 8/31/2007 ** 1.73 1.11 2.06 5.09 ** 0.01 0.00 0.00 0.00 ** 0.21 0.06 0.02 0.02 10/2/2007 ** 1.55 0.97 1.84 4.35 ** 0.01 0.01 0.01 0.02 ** 0.20 0.06 0.02 0.03 Average* 1.07 1.93 0.99 1.42 3.40 0.01 0.01 0.04 0.01 0.01 0.03 0.29 0.07 0.02 0.02
* For SRP - averages calculated from data between 6/20/06 – 10/02/07 to minimize the effect of additional P contained in products used in well installation process. ** Dry Well