EUwood project presentation UNECE 2 6 Mantau · ¾examine or estimate the direct supply from forest...
26
E U w o o d Real potential for changes in growth and use of EU forests
Transcript of EUwood project presentation UNECE 2 6 Mantau · ¾examine or estimate the direct supply from forest...

E U w o o dReal potential for changes ingrowth and use of EU forests

4 UNECE/FAO - linkages
Source: UNECE wood availability task force
10 OctBioenergy Policies and ForestsUNECE/FAO Policy Forum
proposed2008 -2009
Incorporating wood supply and demand into sectoroutlook study
Study / ProcessVI
proposed2008 -2010
Empirical study on national level in severalEuropean countries to gather new and improveexisting data on energy use of wood and sourcesof wood
StudyV
done
ongoing
Nov 07-Mar 08Apr 08
Review of the data and information presented in the study (phase III) by national correspondentsWorkshop in spring (March/April) 2008
Review / workshopIV
done
Mar - Oct2007
Wood resources availability and demands:Overview based on existing data
Study
III
doneJanuary2007Mobilising wood resources (Workshop in Geneva)WorkshopII
done2005 -2007
The Joint Wood Energy Enquiry (JWEE):Improving data on wood energy:
EnquiryI
StatusDateDescription / TitleType of activityPhase
10 OctBioenergy Policies and ForestsUNECE/FAO Policy Forum
proposed2008 -2009
Study / ProcessVI
proposed2008 -2010
StudyV
doneNov 07-Mar 08Apr 08
Review of the data and information presented in the study (phase III) by national correspondentsWorkshop in spring (March/April) 2008
Review / workshopIV
done
Mar - Oct2007
Wood resources availability and demands:Overview based on existing data
Study
III
doneJanuary2007WorkshopII
done2005 -2007EnquiryI
StatusDateDescription / TitleType of activityPhase

1 Project idea and target
2 Partner
3 Workpacks
4 UNECE/FAO linkages
EUwood Content

EUwood – project idea / target
EU-targets:
Increase the use of renewable energy.
Climate change mitigation
Project target:
Analyse best available data to estimate real potentials
for changes (normally increases) in the use of forests and wood for:
energy (household, municipal, industrial, etc.),
wood processing (including bio-chemicals and bio-materials),
non-wood use (including biodiversity and recreation).
1

EUwood – project idea / target1
This analysis will include both qualitative and quantitative aspects
In a quantitative analysis the study will
based on available data, improve its reliability by combining andco-checking it within the structure of the wood resource balance.
examine or estimate the direct supply from forest and woodybiomass outside forest.
examine scenarios for an outlook until 2030.
EUwood – project idea / target1
This analysis will include both qualitative and quantitative aspects
In a qualitative analysis the study will
provide recommendations for balancing material and energy use,
increase woody biomass potentials, propose means toovercome barriers of mobilization and
outline proposals on how to integrate social and environmental constraints.
EUwood – project partner2
University of Hamburg, Center of Wood ScienceCo–ordinator
UNECE/FAO Timber committee
EFI – European Forest Institute
METLA - Finnish Forest Research Institute
probos, the Dutch Institute for Forestry and Forest Products

Euwood - workpacks3
3
Workpacks
WP1 State of the art of biomass demand and supply
WP2 Methodology and empirical data
WP3 Demand of woody biomass 2008-2030
WP4 Potential biomass supply from forests 2008-2030
WP5 Other woody biomass supply 2008 - 2030
WP6 Scenario description and gap projection
WP7 Recommendations

WP1 State of the art of biomass demand and supplywood resource balance 20073
source use[mio. m³] % % [mio. m³]
Industrial Roundwood - JFSQ 377 49% 26% 214 Sawmill industry
Industrial Roundwood - unrep. 26 3% 11% 89 Panel industry
Fuelwood - JFSQ 56 7% 19% 155 Pulp industry
Fuelwood - Maximum unrep. 29 4% 2% 14 Other physical utilization
Bark 12 2% 1% 6 Wood fuel industry
Used logging residues 17 2% 6% 49 Power and heat
Woody biomass outside forest 13 2% 7% 61 Industrial internal
Chips, particles & residues 122 16% 12% 96 Private households
Pulp production co-products 72 9% 17% 138 Undifferentiated energy use
Recovered wood 42 5%
Processed wood fuel 6 1%
∑ source total: 774.627 ▲ 46.661 821.288 ∑ use total
Source: Mantau / Steierer / Hetsch /Prins (2008) : Wood resources availability and demands 2005 – Part I UNECE/FAO Geneva, 2008
[2005]
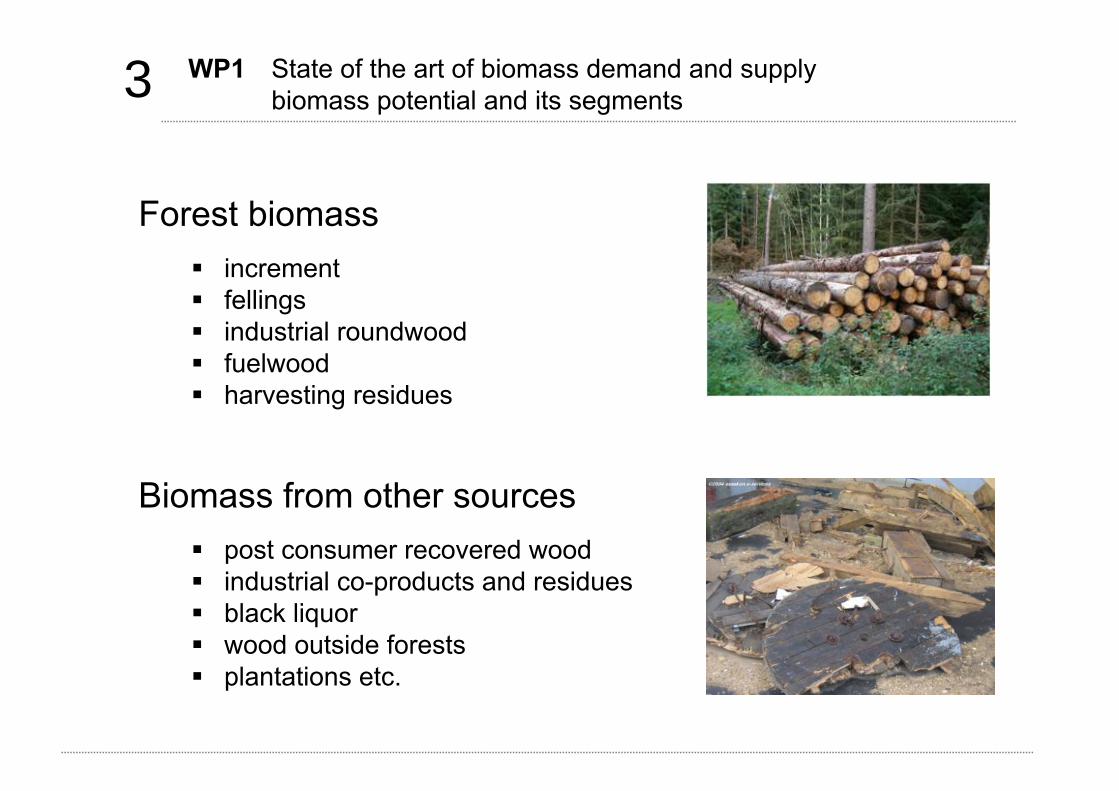
WP1 State of the art of biomass demand and supplybiomass potential and its segments3
Forest biomass incrementfellingsindustrial roundwoodfuelwoodharvesting residues
Biomass from other sourcespost consumer recovered woodindustrial co-products and residuesblack liquorwood outside forestsplantations etc.
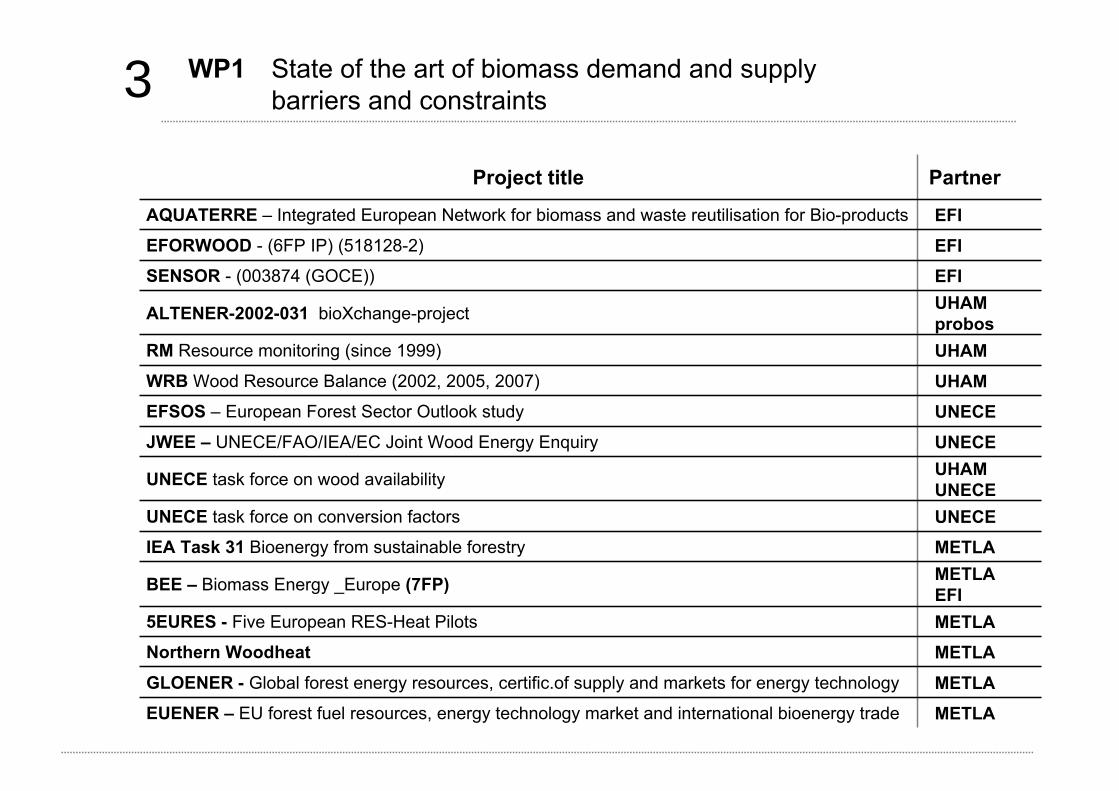
WP1 State of the art of biomass demand and supplybarriers and constraints3
Project title Partner
AQUATERRE – Integrated European Network for biomass and waste reutilisation for Bio-products EFIEFORWOOD - (6FP IP) (518128-2) EFISENSOR - (003874 (GOCE)) EFI
ALTENER-2002-031 bioXchange-project UHAMprobos
RM Resource monitoring (since 1999) UHAMWRB Wood Resource Balance (2002, 2005, 2007) UHAMEFSOS – European Forest Sector Outlook study UNECEJWEE – UNECE/FAO/IEA/EC Joint Wood Energy Enquiry UNECE
UNECE task force on wood availability UHAMUNECE
UNECE task force on conversion factors UNECEIEA Task 31 Bioenergy from sustainable forestry METLA
BEE – Biomass Energy _Europe (7FP) METLAEFI
5EURES - Five European RES-Heat Pilots METLANorthern Woodheat METLAGLOENER - Global forest energy resources, certific.of supply and markets for energy technology METLAEUENER – EU forest fuel resources, energy technology market and international bioenergy trade METLA
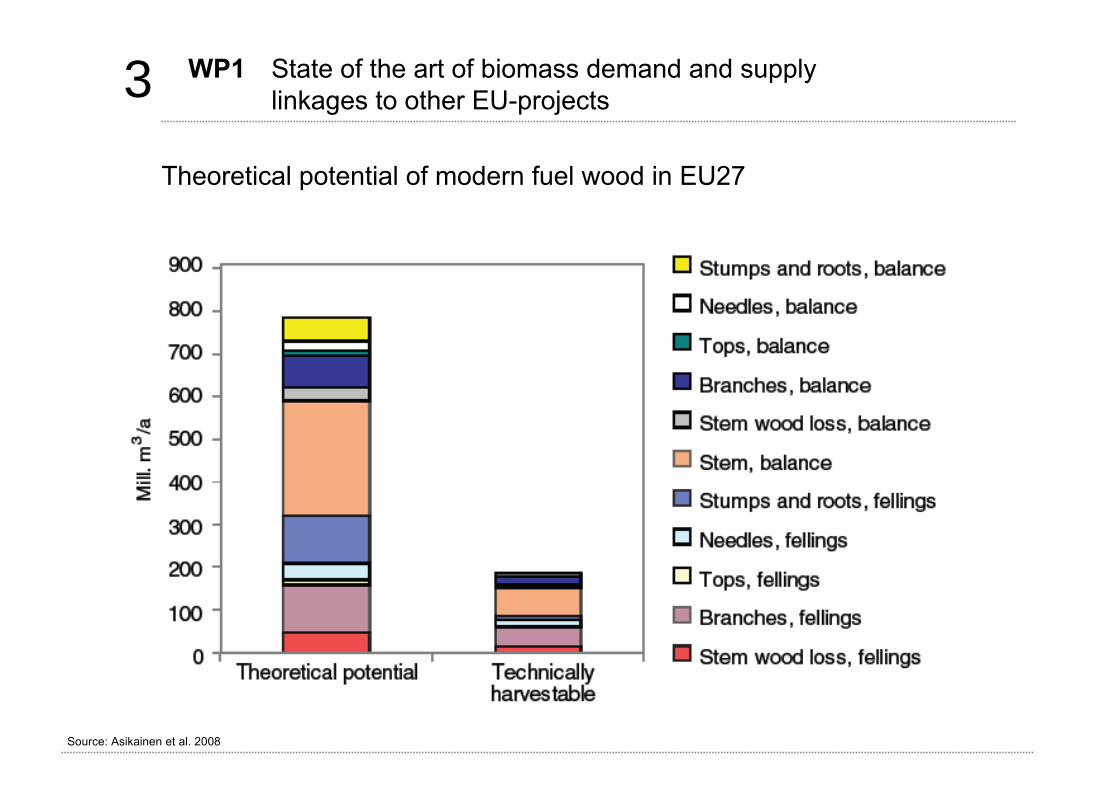
WP1 State of the art of biomass demand and supplylinkages to other EU-projects3
Theoretical potential of modern fuel wood in EU27
Source: Asikainen et al. 2008

3 WP1 State of the art of biomass demand and supplypolicy review
Climate change policies:
Climate change mitigation - CO2 sink or source?Storage in forest and forest productsSubstitute for CO2 intensive materialsAdaptation of forest to climate change
Renewable energy policies
20% Renewable Energy Consumption by 2020Biomass action plans of EU member statesFuture energy security Future development of energy prices
Industrial development and employment policies
Trade policies
e.g. Russian export tariffs on round wood exportsRecent developments in global economy

3 WP2 Description of methodologyWood resource balance
Energy plants > 1MW0.840 1.2%
Energy plants < 1MW3.463 4.9%
households14.214 20.3%
Officially registered cuttings (ORC)56.946 77.8%
Domestic yield (DY)73.204 100.0%
Cuttings not registered (CNR)16.258 22.2%
Change in stock (CiS)-0.036 0.0%
Import (Im)2.820 3.9%
Export (Ex)6.070 8.3%
Domestic availability (DA)69.990 100.0%
Pulp industry6.184 8.8%
Panel industry7.470 10.7%
Sawmill industry37.234 53.2%
Other material use *)0.585 0.8%
Other energy use0.000 0.0%
DY = DA – Im + Ex + ΔCiS CNR = DY - ORC
Source: Mantau / Development of methods to generate market information and linkages between biomass supply and demand. ALTERNA-Report 2005
Example: Total harvested volume in 2005

3 WP2 Description of methodologyForest Resources - EFISCEN
Source: EFI - Forest Information SCENario model EFISCEN
Age-class
Vol
ume-
clas
sWood demand
Management strategy
Forest area change

3 WP2 Description of methodologyOther biomass
Monitoring woody biomass sources and uses on a constant basis is costly
Therefore calculation based on empirical studies factors and coefficients
National used wood potentials could be calculated per capita, by business cycles or the proportion of sawmill by products based on information about size structure of national sawmill industries
= 80 kg per capitaused wood?
= 38,5 % sawnwoodby–products?
Consequently a calculation model on European level shall be achieved
Such a model will be helpful to fill gaps via technical coefficients in countries and sectors where empirical studies cannot be carried out
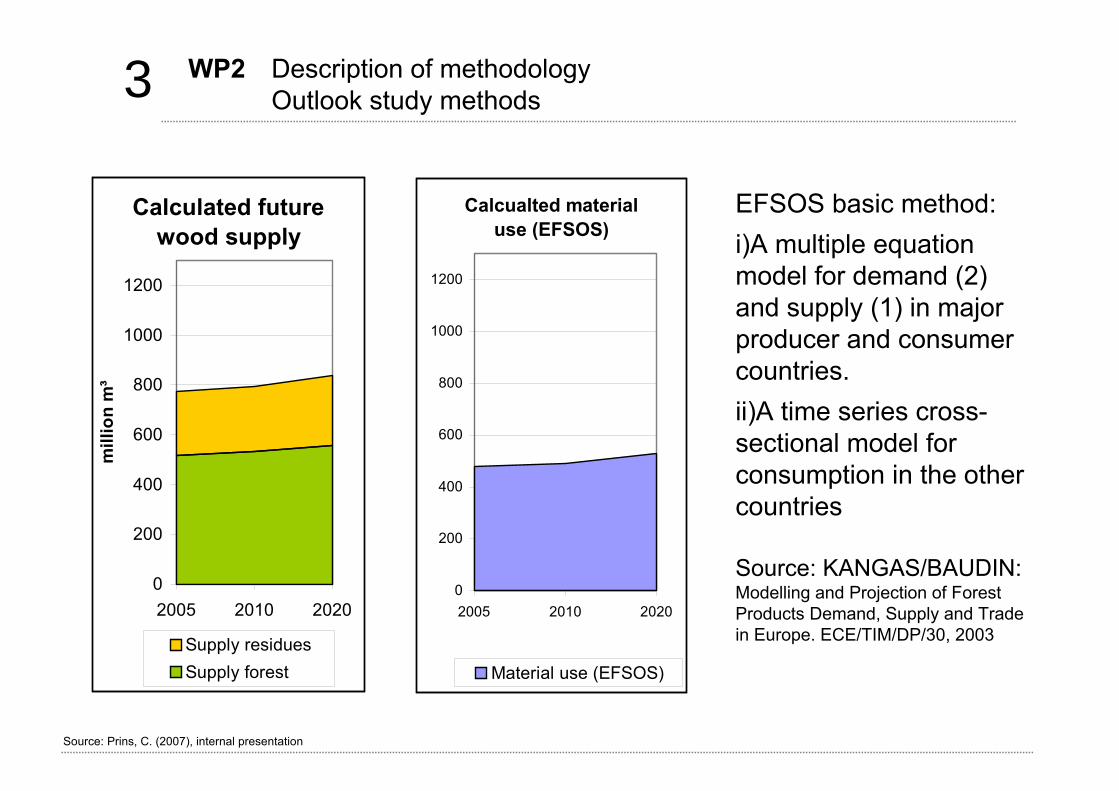
3 WP2 Description of methodologyOutlook study methods
Source: Prins, C. (2007), internal presentation
Calculated future wood supply
0
200
400
600
800
1000
1200
2005 2010 2020
mill
ion
m³
Supply residuesSupply forest
Calcualted material use (EFSOS)
0
200
400
600
800
1000
1200
2005 2010 2020
Material use (EFSOS)
EFSOS basic method:i)A multiple equationmodel for demand (2) and supply (1) in majorproducer and consumercountries.ii)A time series cross-sectional model forconsumption in the othercountries
Source: KANGAS/BAUDIN: Modelling and Projection of ForestProducts Demand, Supply and Trade in Europe. ECE/TIM/DP/30, 2003

3 WP2 Description of methodologyDatabases
1. Different databases
Ener
gy -
IEA
CO
ST -
E31
Woo
d En
ergy
Tim
ber /
UN
ECE
Fore
stry
FA
O
EurO
bser
ver
MC
PFE
CEP
I
EPF
Ges
bois
Minimum / Maximum / Best estimate per item
Different databases
Regional wood balance3
2
1
Source: Steierer in: Mantau / Steierer / Hetsch /Prins (2008):
Wood resources 2005 – Part I UNECE/FAO Geneva, 2008

3 WP3 Theoretical potential forest biomass supply 2008-2030
Energy demand as a result of energy policy
Development of wood consumption for energy use if EU targets (RES) are realized as planed
349 M m3
591 M m3 1)
768 M m3 2)
2005
2010
2020
EU-RES-targets:1) 2010: 12%2) 2020: 20%
Source: Hetsch / Steierer / Prins (2008) : Wood resources availability and demands 2005 – Part II UNECE/FAO Geneva, 2008

3 WP4 Theoretical potential from other woody biomasssupply 2008-2030
Other woody biomass will be presented for:
Industrial rest wood I (saw mill by products)
Industrial rest wood II (other industrial residues)
Industrial rest wood III (black liquor)
recovered wood
plantations
woody biomass outside the forest (segments)

3 WP6 Scenario description and gap projection - 2008-2030
40
50
60
70
80
90
100
110
120
130
2000 2001 2002 2003 2004 2005 2006 2007 2008 2009 2010 2011 2012
consum ption of fores t biom ass upper consum ption scenario lower consum ption scenario NAI in cutting volum e - increm ent usable volum e including res twood
Source: Szenarien des Holzaufkommens und der Holzverwendung 2008 bis 2012, Project report, Hamburg 2008, 79 p
Example:Germany
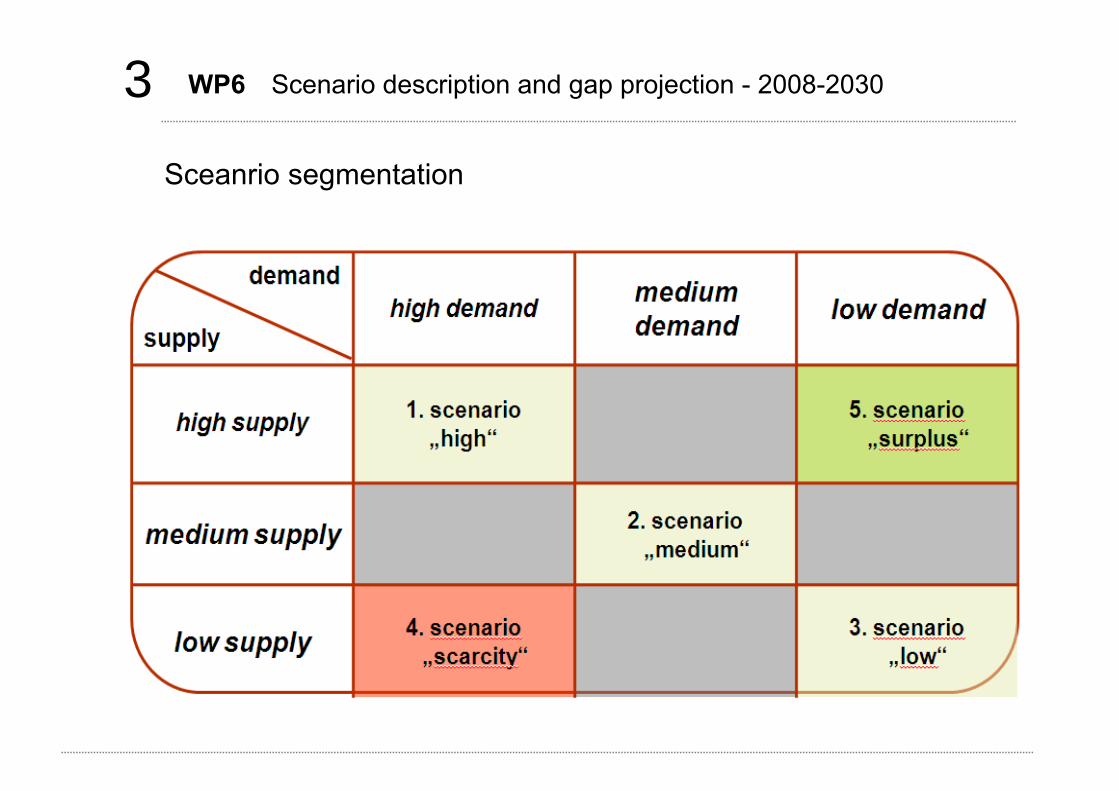
3 WP6 Scenario description and gap projection - 2008-2030
Sceanrio segmentation

3 WP6 Scenario description and gap projection - 2008-2030
Resource competition - Example Germany
in mio m³ - cummlative plot
0
20
40
60
80
100
120
140
1987 1989 1991 1993 1995 1997 1999 2001 2003 2005 2007 2009 2011
material uses energy uses
Source: Szenarien des Holzaufkommens und der Holzverwendung 2008 bis 2012, Project report, Hamburg 2008, 79 p
3 WP7 Strategies and recommendations
Recommendations may be given for
forest policies
forest industry policies
climate change policies
renewable energy policies
for trade policies
and others

4 UNECE/FAO - linkages
Source: UNECE wood availability task force
JFSQ Joint Forest Sector questionnaire
EFSOS European Forest Sector Outlook study
JWEE UNECE/FAO/IEA/EC Joint Wood Energy Enquiry
UNECE task force on wood availability
UNECE task force on conversion factors

E U w o o dReal potential for changes ingrowth and use of EU forests