Equity Technical Weekly Report
6
EQUITY TECHNICAL REPORT WEEKLY [15 FEB to 19 FEB 2016] ZOID RESEARCH TEAM
-
Upload
zoidresearch -
Category
Documents
-
view
220 -
download
0
description
Last Week Nifty opened with negative Nifty shuts below 7400 mark. Weak European markets coupled with heavy selling in the front line blue chip stocks in the last hour of trade.... For More Info, Subscribe at http://goo.gl/aDgeXH
Transcript of Equity Technical Weekly Report
EQUITY TECHNICAL REPORT WEEKLY [15 FEB to 19 FEB 2016]
ZOID RESEARCH TEAM
WEEKLY TECHNICAL REPORT
15 FEB TO 19 FEB 16
www.zoidresearch.com ZOID RESEARCH TEAM
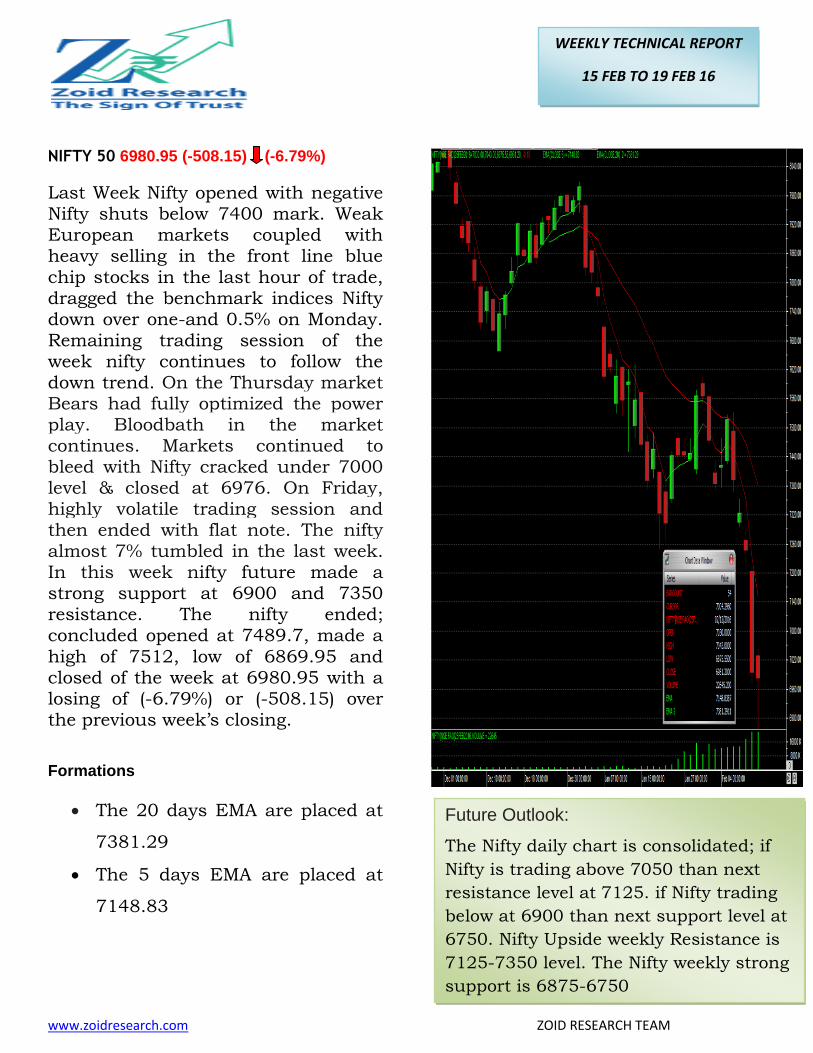
NIFTY 50 6980.95 (-508.15) (-6.79%)
Last Week Nifty opened with negative Nifty shuts below 7400 mark. Weak European markets coupled with heavy selling in the front line blue
chip stocks in the last hour of trade, dragged the benchmark indices Nifty down over one-and 0.5% on Monday. Remaining trading session of the week nifty continues to follow the down trend. On the Thursday market Bears had fully optimized the power play. Bloodbath in the market continues. Markets continued to bleed with Nifty cracked under 7000 level & closed at 6976. On Friday, highly volatile trading session and then ended with flat note. The nifty almost 7% tumbled in the last week. In this week nifty future made a strong support at 6900 and 7350 resistance. The nifty ended; concluded opened at 7489.7, made a
high of 7512, low of 6869.95 and closed of the week at 6980.95 with a losing of (-6.79%) or (-508.15) over the previous week’s closing.
Formations
The 20 days EMA are placed at
7381.29
The 5 days EMA are placed at
7148.83
Future Outlook:
The Nifty daily chart is consolidated; if
Nifty is trading above 7050 than next
resistance level at 7125. if Nifty trading
below at 6900 than next support level at
6750. Nifty Upside weekly Resistance is
7125-7350 level. The Nifty weekly strong
support is 6875-6750
WEEKLY TECHNICAL REPORT
15 FEB TO 19 FEB 16
www.zoidresearch.com ZOID RESEARCH TEAM
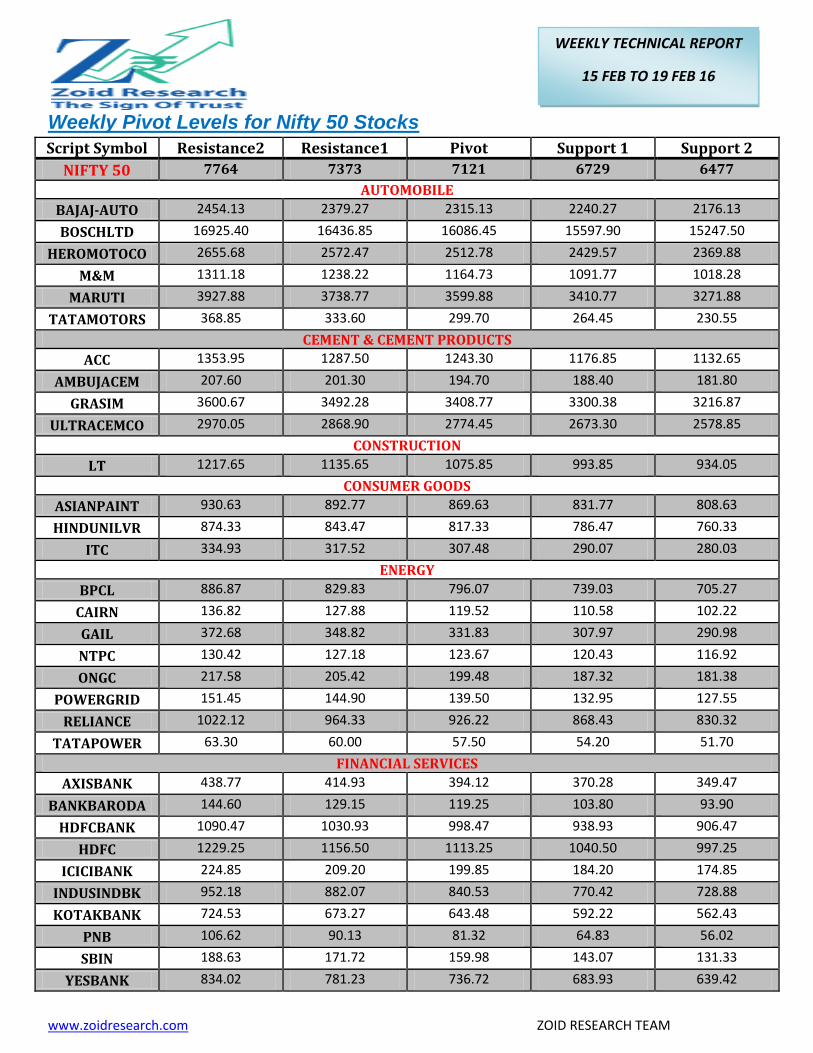
Weekly Pivot Levels for Nifty 50 Stocks
Script Symbol Resistance2 Resistance1 Pivot Support 1 Support 2
NIFTY 50 7764 7373 7121 6729 6477
AUTOMOBILE
BAJAJ-AUTO 2454.13 2379.27 2315.13 2240.27 2176.13
BOSCHLTD 16925.40 16436.85 16086.45 15597.90 15247.50
HEROMOTOCO 2655.68 2572.47 2512.78 2429.57 2369.88
M&M 1311.18 1238.22 1164.73 1091.77 1018.28
MARUTI 3927.88 3738.77 3599.88 3410.77 3271.88
TATAMOTORS 368.85 333.60 299.70 264.45 230.55
CEMENT & CEMENT PRODUCTS
ACC 1353.95 1287.50 1243.30 1176.85 1132.65
AMBUJACEM 207.60 201.30 194.70 188.40 181.80
GRASIM 3600.67 3492.28 3408.77 3300.38 3216.87
ULTRACEMCO 2970.05 2868.90 2774.45 2673.30 2578.85
CONSTRUCTION
LT 1217.65 1135.65 1075.85 993.85 934.05
CONSUMER GOODS
ASIANPAINT 930.63 892.77 869.63 831.77 808.63
HINDUNILVR 874.33 843.47 817.33 786.47 760.33
ITC 334.93 317.52 307.48 290.07 280.03
ENERGY
BPCL 886.87 829.83 796.07 739.03 705.27
CAIRN 136.82 127.88 119.52 110.58 102.22
GAIL 372.68 348.82 331.83 307.97 290.98
NTPC 130.42 127.18 123.67 120.43 116.92
ONGC 217.58 205.42 199.48 187.32 181.38
POWERGRID 151.45 144.90 139.50 132.95 127.55
RELIANCE 1022.12 964.33 926.22 868.43 830.32
TATAPOWER 63.30 60.00 57.50 54.20 51.70
FINANCIAL SERVICES
AXISBANK 438.77 414.93 394.12 370.28 349.47
BANKBARODA 144.60 129.15 119.25 103.80 93.90
HDFCBANK 1090.47 1030.93 998.47 938.93 906.47
HDFC 1229.25 1156.50 1113.25 1040.50 997.25
ICICIBANK 224.85 209.20 199.85 184.20 174.85
INDUSINDBK 952.18 882.07 840.53 770.42 728.88
KOTAKBANK 724.53 673.27 643.48 592.22 562.43
PNB 106.62 90.13 81.32 64.83 56.02
SBIN 188.63 171.72 159.98 143.07 131.33
YESBANK 834.02 781.23 736.72 683.93 639.42
WEEKLY TECHNICAL REPORT
15 FEB TO 19 FEB 16
www.zoidresearch.com ZOID RESEARCH TEAM
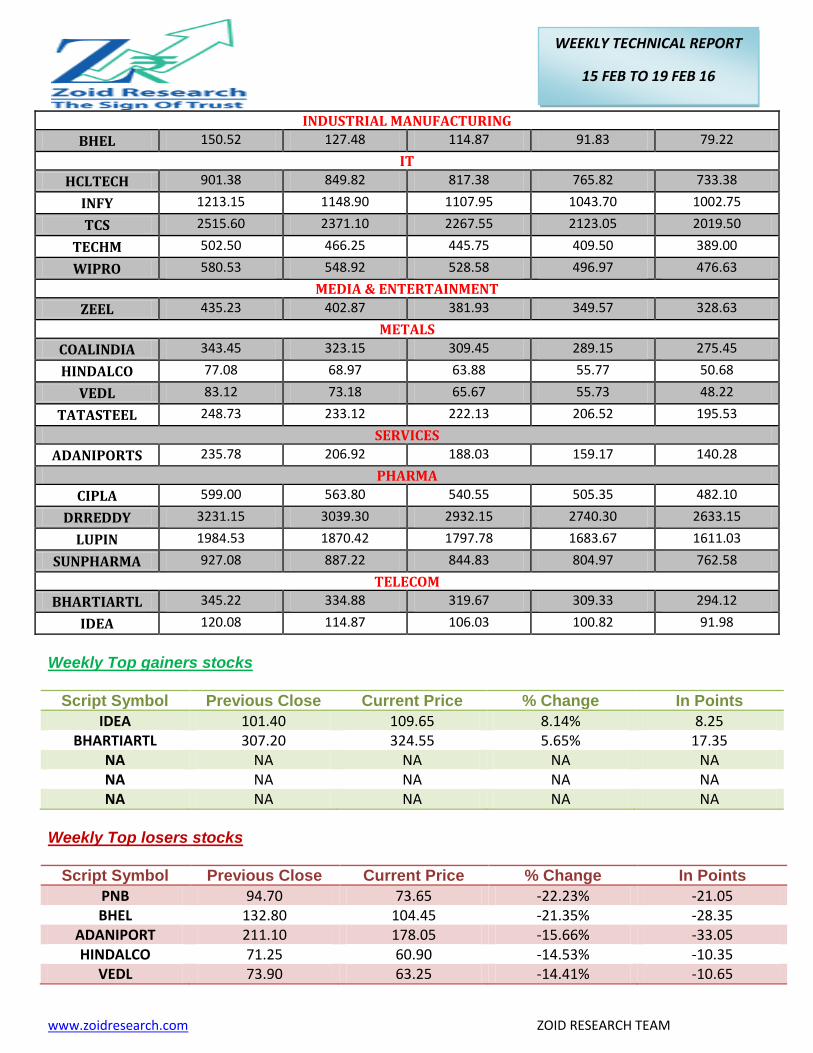
INDUSTRIAL MANUFACTURING
BHEL 150.52 127.48 114.87 91.83 79.22
IT
HCLTECH 901.38 849.82 817.38 765.82 733.38
INFY 1213.15 1148.90 1107.95 1043.70 1002.75
TCS 2515.60 2371.10 2267.55 2123.05 2019.50
TECHM 502.50 466.25 445.75 409.50 389.00
WIPRO 580.53 548.92 528.58 496.97 476.63
MEDIA & ENTERTAINMENT
ZEEL 435.23 402.87 381.93 349.57 328.63
METALS
COALINDIA 343.45 323.15 309.45 289.15 275.45
HINDALCO 77.08 68.97 63.88 55.77 50.68
VEDL 83.12 73.18 65.67 55.73 48.22
TATASTEEL 248.73 233.12 222.13 206.52 195.53
SERVICES
ADANIPORTS 235.78 206.92 188.03 159.17 140.28
PHARMA
CIPLA 599.00 563.80 540.55 505.35 482.10
DRREDDY 3231.15 3039.30 2932.15 2740.30 2633.15
LUPIN 1984.53 1870.42 1797.78 1683.67 1611.03
SUNPHARMA 927.08 887.22 844.83 804.97 762.58
TELECOM
BHARTIARTL 345.22 334.88 319.67 309.33 294.12
IDEA 120.08 114.87 106.03 100.82 91.98
Weekly Top gainers stocks
Script Symbol Previous Close Current Price % Change In Points
IDEA 101.40 109.65 8.14% 8.25 BHARTIARTL 307.20 324.55 5.65% 17.35
NA NA NA NA NA NA NA NA NA NA NA NA NA NA NA
Weekly Top losers stocks
Script Symbol Previous Close Current Price % Change In Points
PNB 94.70 73.65 -22.23% -21.05 BHEL 132.80 104.45 -21.35% -28.35
ADANIPORT 211.10 178.05 -15.66% -33.05 HINDALCO 71.25 60.90 -14.53% -10.35
VEDL 73.90 63.25 -14.41% -10.65
WEEKLY TECHNICAL REPORT
15 FEB TO 19 FEB 16
www.zoidresearch.com ZOID RESEARCH TEAM
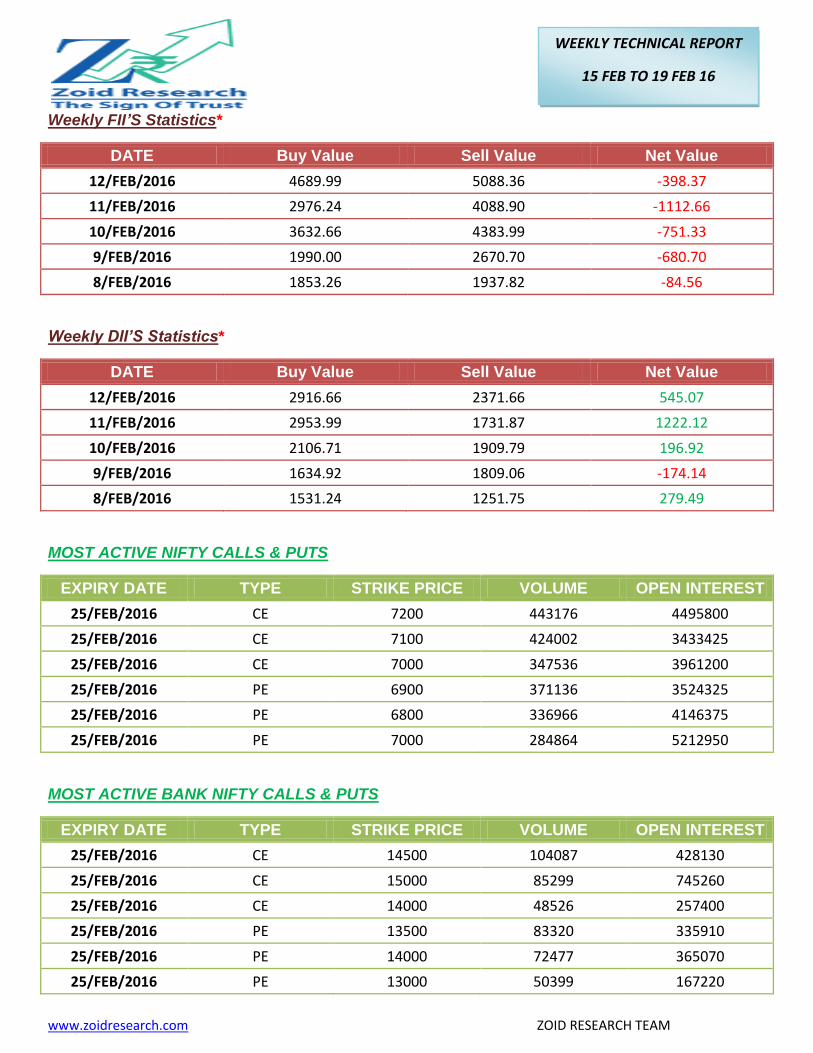
Weekly FII’S Statistics*
DATE Buy Value Sell Value Net Value
12/FEB/2016 4689.99 5088.36 -398.37
11/FEB/2016 2976.24 4088.90 -1112.66
10/FEB/2016 3632.66 4383.99 -751.33
9/FEB/2016 1990.00 2670.70 -680.70
8/FEB/2016 1853.26 1937.82 -84.56
Weekly DII’S Statistics*
DATE Buy Value Sell Value Net Value
12/FEB/2016 2916.66 2371.66 545.07
11/FEB/2016 2953.99 1731.87 1222.12
10/FEB/2016 2106.71 1909.79 196.92
9/FEB/2016 1634.92 1809.06 -174.14
8/FEB/2016 1531.24 1251.75 279.49
MOST ACTIVE NIFTY CALLS & PUTS
EXPIRY DATE TYPE STRIKE PRICE VOLUME OPEN INTEREST
25/FEB/2016 CE 7200 443176 4495800
25/FEB/2016 CE 7100 424002 3433425
25/FEB/2016 CE 7000 347536 3961200
25/FEB/2016 PE 6900 371136 3524325
25/FEB/2016 PE 6800 336966 4146375
25/FEB/2016 PE 7000 284864 5212950
MOST ACTIVE BANK NIFTY CALLS & PUTS
EXPIRY DATE TYPE STRIKE PRICE VOLUME OPEN INTEREST
25/FEB/2016 CE 14500 104087 428130
25/FEB/2016 CE 15000 85299 745260
25/FEB/2016 CE 14000 48526 257400
25/FEB/2016 PE 13500 83320 335910
25/FEB/2016 PE 14000 72477 365070
25/FEB/2016 PE 13000 50399 167220
WEEKLY TECHNICAL REPORT
15 FEB TO 19 FEB 16
www.zoidresearch.com ZOID RESEARCH TEAM
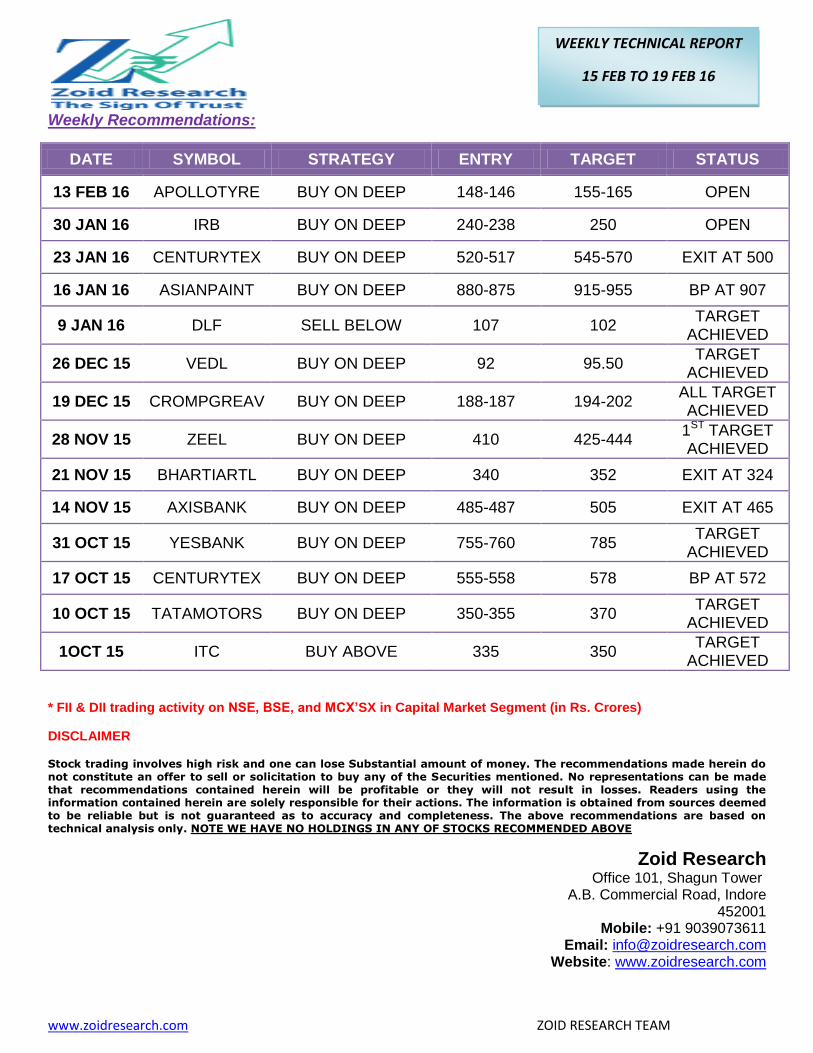
Weekly Recommendations:
DATE SYMBOL STRATEGY ENTRY TARGET STATUS
13 FEB 16 APOLLOTYRE BUY ON DEEP 148-146 155-165 OPEN
30 JAN 16 IRB BUY ON DEEP 240-238 250 OPEN
23 JAN 16 CENTURYTEX BUY ON DEEP 520-517 545-570 EXIT AT 500
16 JAN 16 ASIANPAINT BUY ON DEEP 880-875 915-955 BP AT 907
9 JAN 16 DLF SELL BELOW 107 102 TARGET
ACHIEVED
26 DEC 15 VEDL BUY ON DEEP 92 95.50 TARGET
ACHIEVED
19 DEC 15 CROMPGREAV BUY ON DEEP 188-187 194-202 ALL TARGET ACHIEVED
28 NOV 15 ZEEL BUY ON DEEP 410 425-444 1ST TARGET ACHIEVED
21 NOV 15 BHARTIARTL BUY ON DEEP 340 352 EXIT AT 324
14 NOV 15 AXISBANK BUY ON DEEP 485-487 505 EXIT AT 465
31 OCT 15 YESBANK BUY ON DEEP 755-760 785 TARGET
ACHIEVED
17 OCT 15 CENTURYTEX BUY ON DEEP 555-558 578 BP AT 572
10 OCT 15 TATAMOTORS BUY ON DEEP 350-355 370 TARGET
ACHIEVED
1OCT 15 ITC BUY ABOVE 335 350 TARGET
ACHIEVED
* FII & DII trading activity on NSE, BSE, and MCX’SX in Capital Market Segment (in Rs. Crores)
DISCLAIMER
Stock trading involves high risk and one can lose Substantial amount of money. The recommendations made herein do not constitute an offer to sell or solicitation to buy any of the Securities mentioned. No representations can be made that recommendations contained herein will be profitable or they will not result in losses. Readers using the information contained herein are solely responsible for their actions. The information is obtained from sources deemed to be reliable but is not guaranteed as to accuracy and completeness. The above recommendations are based on technical analysis only. NOTE WE HAVE NO HOLDINGS IN ANY OF STOCKS RECOMMENDED ABOVE
Zoid Research
Office 101, Shagun Tower A.B. Commercial Road, Indore
452001 Mobile: +91 9039073611
Email: [email protected] Website: www.zoidresearch.com