Weekly Equity Report
9
Weekly New 16/08/2011 ; wsletter-Equity www.capita alheight.com
-
Upload
money-capitalheight-research-pvt-ltd -
Category
Documents
-
view
228 -
download
0
description
Money CapitalHeight Research Pvt Ltd is a leading Stock Advisory Company, having a strong hold in providing most authentic and accurate Equity Tips as well as Commodity Tips. For 2 Days Free Trial, please visit our site at http://www.capitalheight.com or please call our 24/7 Customer Care Support us at +91 9993066624, 0731 - 4295 - 950 Or email us at: [email protected]
Transcript of Weekly Equity Report

Weekly Newsletter16/08/2011
;
Weekly Newsletter-Equity
www.capitalheight.com
apitalheight.com
www.capitalheight.com
Phone- (0731)4295950
Weekly Newsletter
Contents
Market Wrap
Market Performance
NSE Gainers
NSE Losers
NIFTY 5 Days Up
Indian Equity Market
Index Watch
World Indices
Technical Analysis
Nifty Spot
Bank Nifty Future
www.capitalheight.com
Phone- (0731)4295950
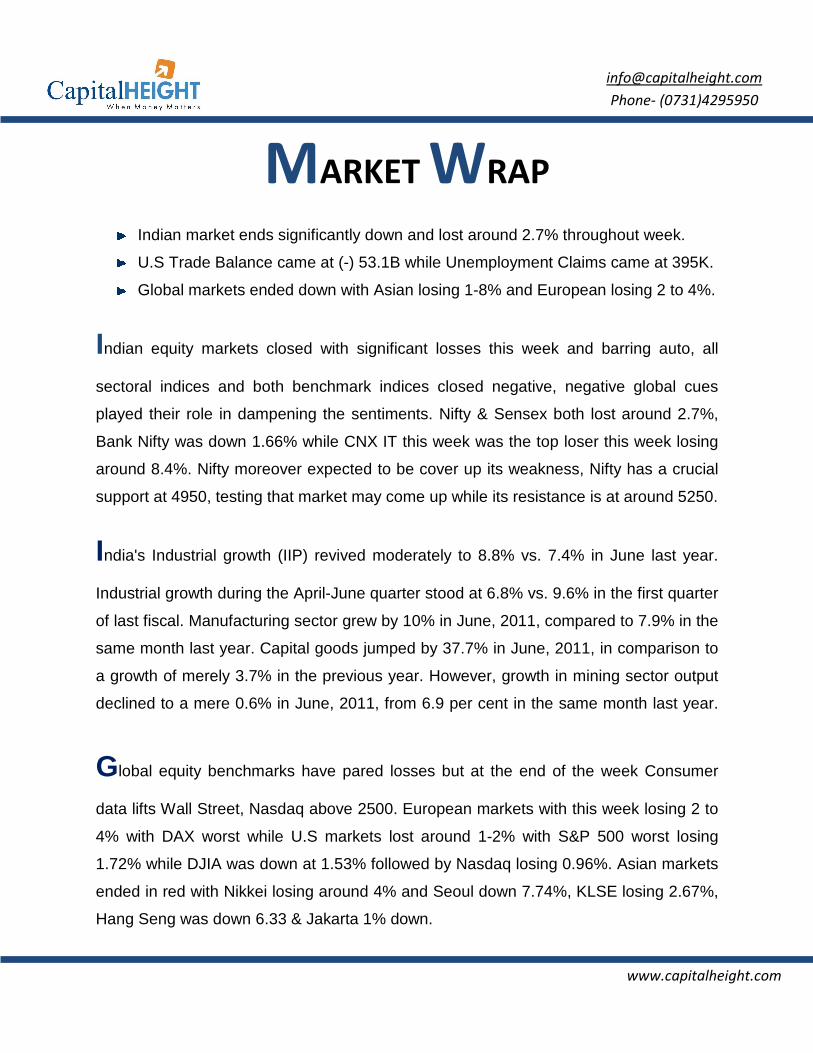
MARKET WRAP
Indian market ends significantly down and lost around 2.7% throughout week.
U.S Trade Balance came at (-) 53.1B while Unemployment Claims came at 395K.
Global markets ended down with Asian losing 1-8% and European losing 2 to 4%.
Indian equity markets closed with significant losses this week and barring auto, all
sectoral indices and both benchmark indices closed negative, negative global cues
played their role in dampening the sentiments. Nifty & Sensex both lost around 2.7%,
Bank Nifty was down 1.66% while CNX IT this week was the top loser this week losing
around 8.4%. Nifty moreover expected to be cover up its weakness, Nifty has a crucial
support at 4950, testing that market may come up while its resistance is at around 5250.
India's Industrial growth (IIP) revived moderately to 8.8% vs. 7.4% in June last year.
Industrial growth during the April-June quarter stood at 6.8% vs. 9.6% in the first quarter
of last fiscal. Manufacturing sector grew by 10% in June, 2011, compared to 7.9% in the
same month last year. Capital goods jumped by 37.7% in June, 2011, in comparison to
a growth of merely 3.7% in the previous year. However, growth in mining sector output
declined to a mere 0.6% in June, 2011, from 6.9 per cent in the same month last year.
Global equity benchmarks have pared losses but at the end of the week Consumer
data lifts Wall Street, Nasdaq above 2500. European markets with this week losing 2 to
4% with DAX worst while U.S markets lost around 1-2% with S&P 500 worst losing
1.72% while DJIA was down at 1.53% followed by Nasdaq losing 0.96%. Asian markets
ended in red with Nikkei losing around 4% and Seoul down 7.74%, KLSE losing 2.67%,
Hang Seng was down 6.33 & Jakarta 1% down.
www.capitalheight.com
Phone- (0731)4295950
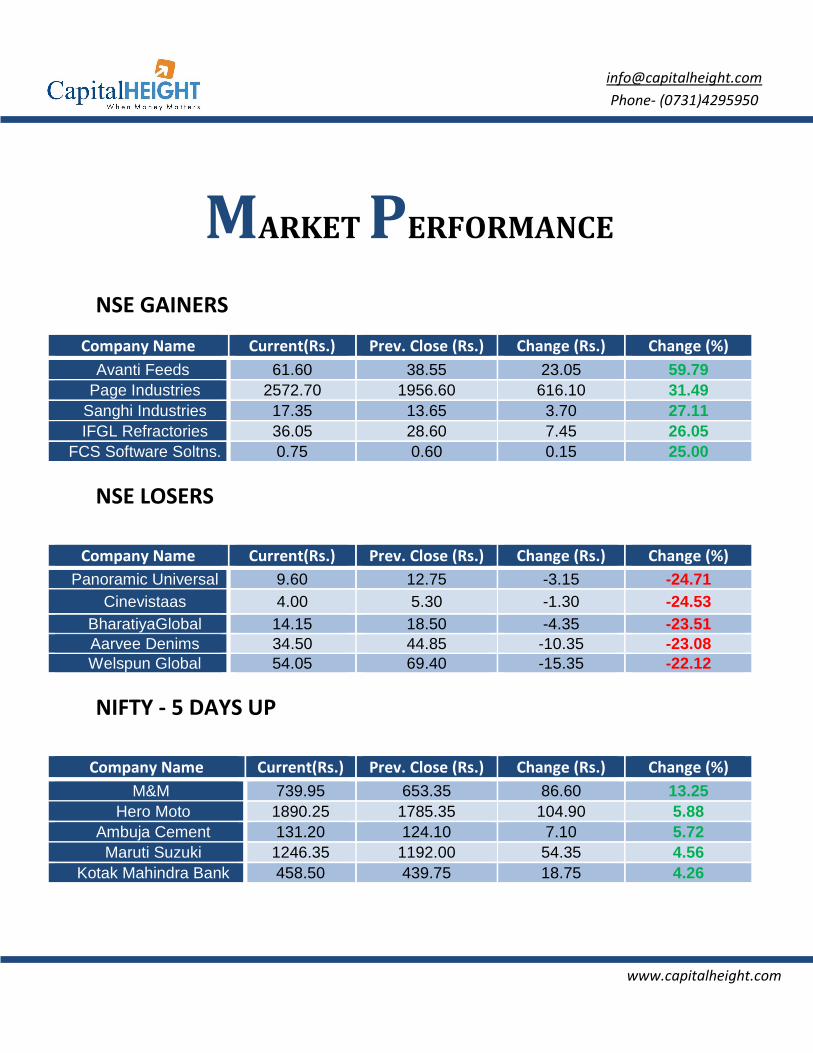
MARKET PERFORMANCE
NSE GAINERS
Company Name Current(Rs.) Prev. Close (Rs.) Change (Rs.) Change (%)
Avanti Feeds 61.60 38.55 23.05 59.79 Page Industries 2572.70 1956.60 616.10 31.49
Sanghi Industries 17.35 13.65 3.70 27.11 IFGL Refractories 36.05 28.60 7.45 26.05
FCS Software Soltns. 0.75 0.60 0.15 25.00
NSE LOSERS
Company Name Current(Rs.) Prev. Close (Rs.) Change (Rs.) Change (%)
Panoramic Universal 9.60 12.75 -3.15 -24.71 Cinevistaas 4.00 5.30 -1.30 -24.53
BharatiyaGlobal 14.15 18.50 -4.35 -23.51 Aarvee Denims 34.50 44.85 -10.35 -23.08 Welspun Global 54.05 69.40 -15.35 -22.12
NIFTY - 5 DAYS UP
Company Name Current(Rs.) Prev. Close (Rs.) Change (Rs.) Change (%)
M&M 739.95 653.35 86.60 13.25 Hero Moto 1890.25 1785.35 104.90 5.88
Ambuja Cement 131.20 124.10 7.10 5.72 Maruti Suzuki 1246.35 1192.00 54.35 4.56
Kotak Mahindra Bank 458.50 439.75 18.75 4.26
www.capitalheight.com
Phone- (0731)4295950
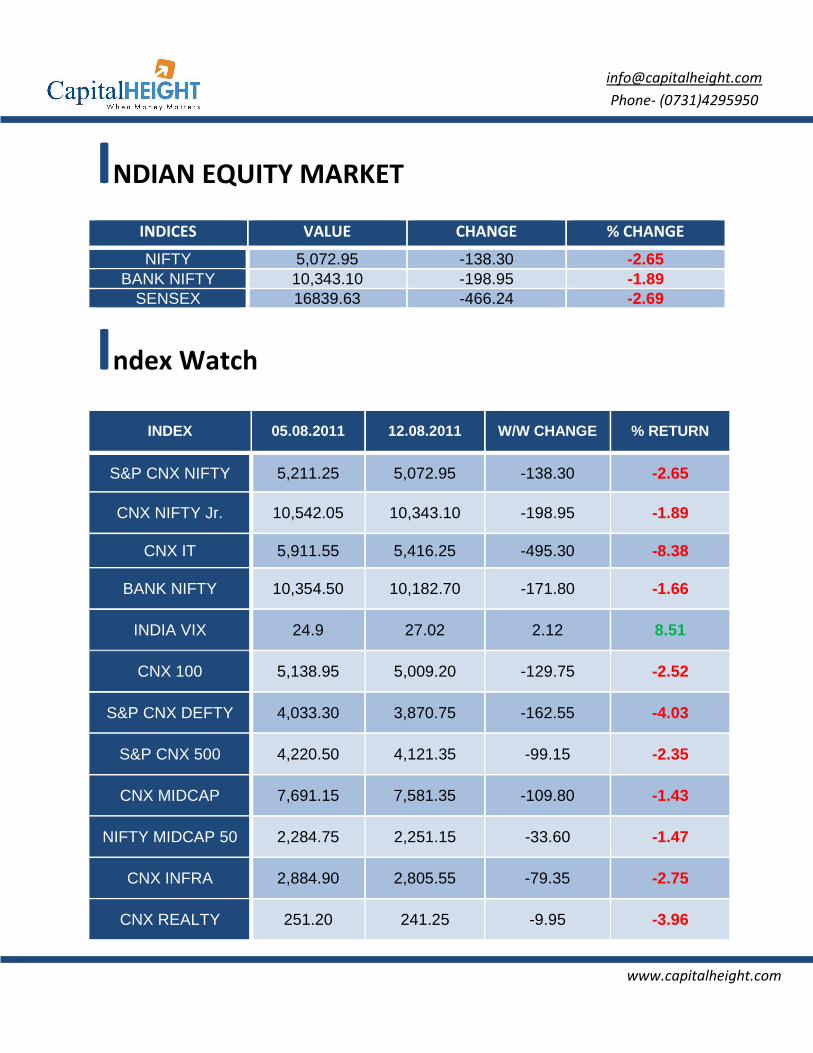
INDIAN EQUITY MARKET
INDICES VALUE CHANGE % CHANGE
NIFTY 5,072.95 -138.30 -2.65 BANK NIFTY 10,343.10 -198.95 -1.89
SENSEX 16839.63 -466.24 -2.69
Index Watch
INDEX 05.08.2011 12.08.2011 W/W CHANGE % RETURN
S&P CNX NIFTY 5,211.25 5,072.95 -138.30 -2.65
CNX NIFTY Jr. 10,542.05 10,343.10 -198.95 -1.89
CNX IT 5,911.55 5,416.25 -495.30 -8.38
BANK NIFTY 10,354.50 10,182.70 -171.80 -1.66
INDIA VIX 24.9 27.02 2.12 8.51
CNX 100 5,138.95 5,009.20 -129.75 -2.52
S&P CNX DEFTY 4,033.30 3,870.75 -162.55 -4.03
S&P CNX 500 4,220.50 4,121.35 -99.15 -2.35
CNX MIDCAP 7,691.15 7,581.35 -109.80 -1.43
NIFTY MIDCAP 50 2,284.75 2,251.15 -33.60 -1.47
CNX INFRA 2,884.90 2,805.55 -79.35 -2.75
CNX REALTY 251.20 241.25 -9.95 -3.96
www.capitalheight.com
Phone- (0731)4295950
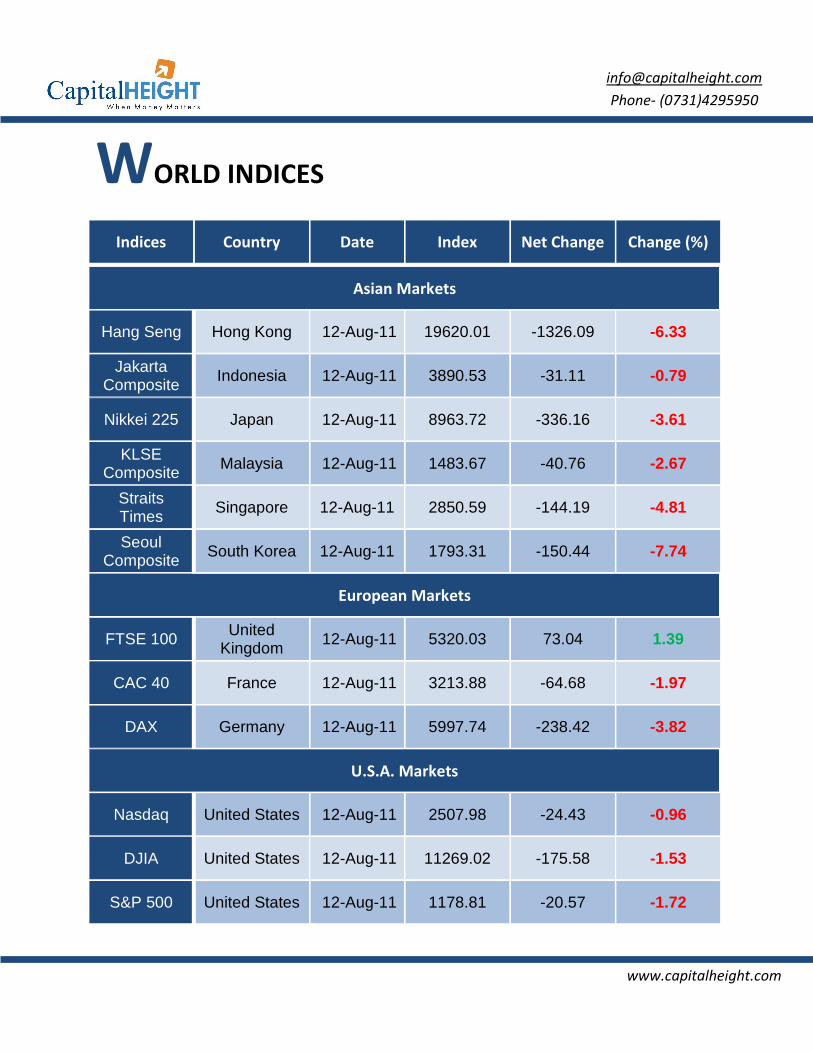
WORLD INDICES
Indices Country Date Index Net Change Change (%)
Asian Markets
Hang Seng Hong Kong 12-Aug-11 19620.01 -1326.09 -6.33
Jakarta Composite
Indonesia 12-Aug-11 3890.53 -31.11 -0.79
Nikkei 225 Japan 12-Aug-11 8963.72 -336.16 -3.61
KLSE Composite
Malaysia 12-Aug-11 1483.67 -40.76 -2.67
Straits Times
Singapore 12-Aug-11 2850.59 -144.19 -4.81
Seoul Composite
South Korea 12-Aug-11 1793.31 -150.44 -7.74
European Markets
FTSE 100 United Kingdom
12-Aug-11 5320.03 73.04 1.39
CAC 40 France 12-Aug-11 3213.88 -64.68 -1.97
DAX Germany 12-Aug-11 5997.74 -238.42 -3.82
U.S.A. Markets
Nasdaq United States 12-Aug-11 2507.98 -24.43 -0.96
DJIA United States 12-Aug-11 11269.02 -175.58 -1.53
S&P 500 United States 12-Aug-11 1178.81 -20.57 -1.72
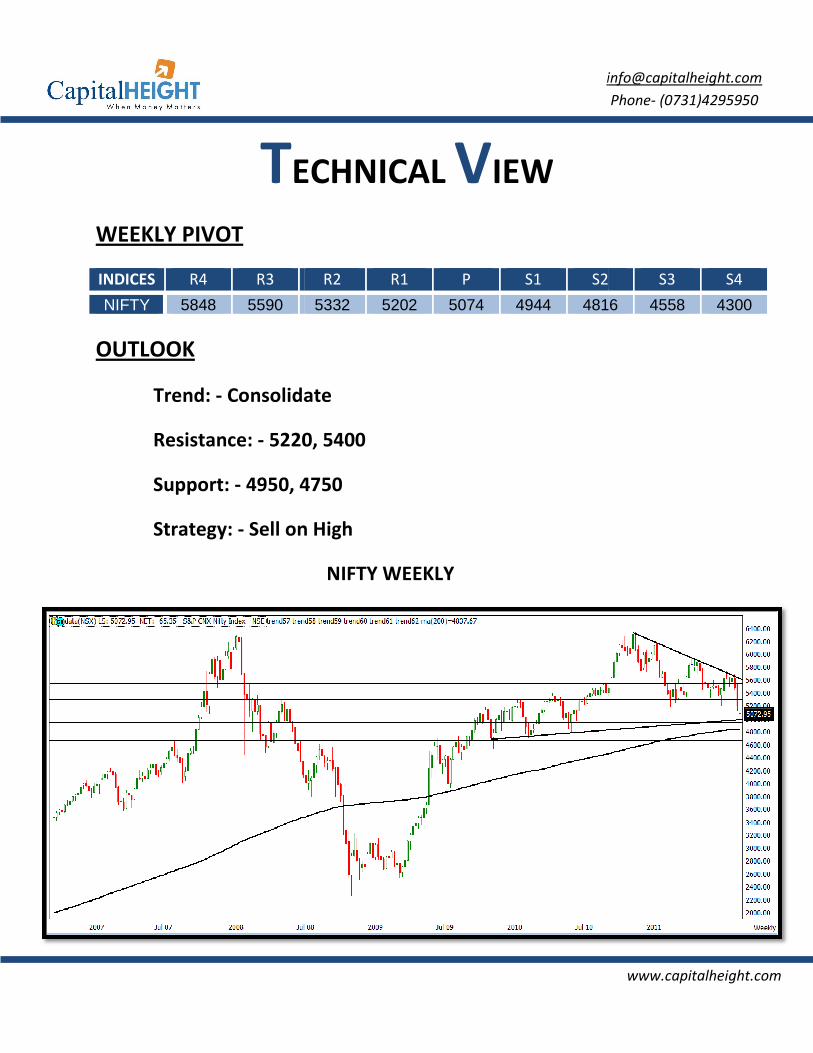
TECHNICAL
WEEKLY PIVOT
INDICES R4 R3
NIFTY 5848 5590
OUTLOOK
Trend: - Consolidate
Resistance: - 5220
Support: - 4950, 4
Strategy: - Sell on High
ECHNICAL VIEW
R2 R1 P S1 S2
5332 5202 5074 4944 4816
Consolidate
0, 5400
4750
Sell on High
NIFTY WEEKLY
www.capitalheight.com
Phone- (0731)4295950
S2 S3 S4
4816 4558 4300
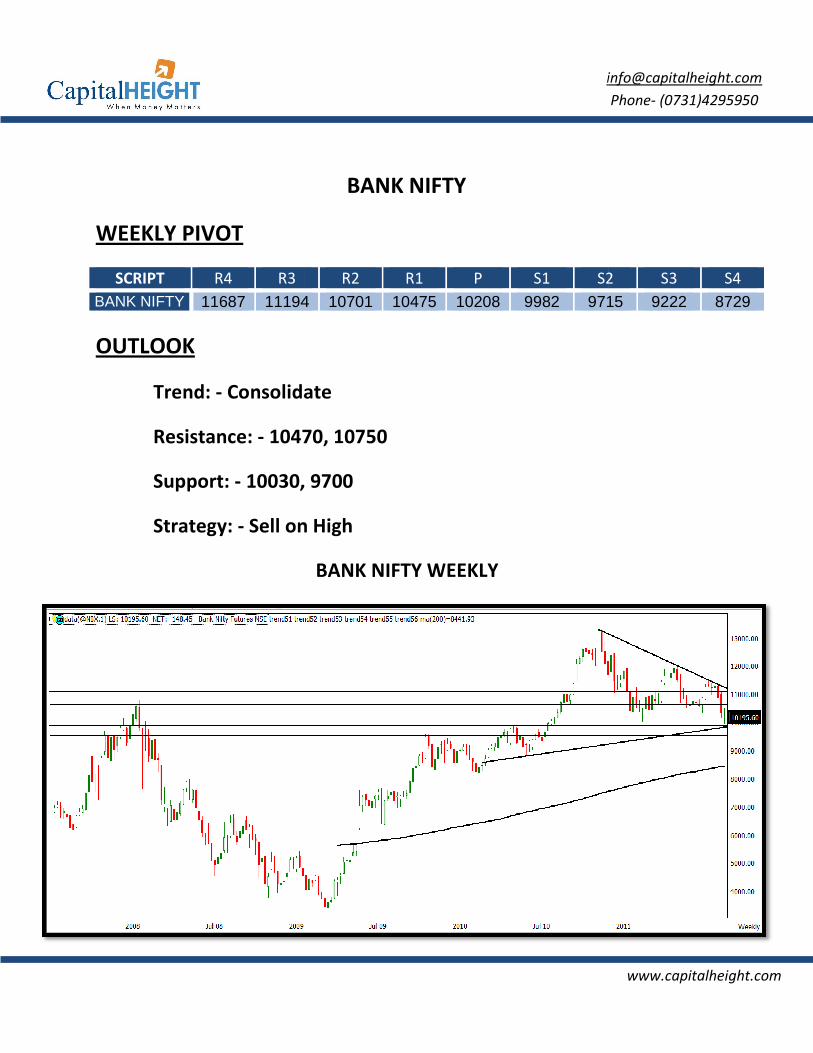
WEEKLY PIVOT
SCRIPT R4 R3
BANK NIFTY 11687 11194
OUTLOOK
Trend: - Consolidate
Resistance: - 1047
Support: - 10030,
Strategy: - Sell on
BANK NIFTY
R2 R1 P S1 S2
11194 10701 10475 10208 9982 9715
Consolidate
0470, 10750
, 9700
Sell on High
BANK NIFTY WEEKLY
www.capitalheight.com
Phone- (0731)4295950
S2 S3 S4
9715 9222 8729
www.capitalheight.com
Phone- (0731)4295950
Disclaimer
The information and views in this report, our website & all the service we provide are believed to be reliable, but we do not
accept any responsibility (or liability) for errors of fact or opinion. Users have the right to choose the product/s that suits
them the most.
Sincere efforts have been made to present the right investment perspective. The information contained herein is based on
analysis and up on sources that we consider reliable.
This material is for personal information and based upon it & takes no responsibility
The information given herein should be treated as only factor, while making investment decision. The report does not
provide individually tailor-made investment advice. Money Capitalheight Research Pvt. Ltd. recommends that investors
independently evaluate particular investments and strategies, and encourages investors to
seek the advice of a financial adviser. Money Capitalheight Research Pvt. Ltd. shall not be responsible for any transaction
conducted based on the information given in this report, which is in violation of rules and regulations of NSE and BSE.
The share price projections shown are not necessarily indicative of future price performance. The information herein,
together with all estimates and forecasts, can change without notice. Analyst or any person related to Money Capitalheight
Research Pvt. Ltd. might be holding positions in the stocks recommended. It is understood that anyone who is browsing
through the site has done so at his free will and does not read any views expressed as a recommendation for which either
the site or its owners or anyone can be held responsible for . Any surfing and reading of the information is the acceptance
of this disclaimer.
All Rights Reserved.
Investment in Commodity and equity market has its own risks.
We, however, do not vouch for the accuracy or the completeness thereof. we are not responsible for any loss incurred
whatsoever for any financial profits or loss which may arise from the recommendations above. Money Capitalheight
Research Pvt. Ltd. does not purport to be an invitation or an offer to buy or sell any financial instrument. Our Clients (Paid
Or Unpaid), Any third party or anyone else have no rights to forward or share our calls or SMS or Report or Any Information
Provided by us to/with anyone which is received directly or indirectly by them. If found so then Serious Legal Actions can be
taken.