Epidural versus non-epidural or no analgesia in labour ... · section, maternal satisfaction with...
73
Epidural versus non-epidural or no analgesia in labour (Review) Anim-Somuah M, Smyth R, Howell C This is a reprint of a Cochrane review, prepared and maintained by The Cochrane Collaboration and published in The Cochrane Library 2005, Issue 4 http://www.thecochranelibrary.com 1 Epidural versus non-epidural or no analgesia in labour (Review) Copyright ©2005 The Cochrane Collaboration. Published by John Wiley & Sons, Ltd
Transcript of Epidural versus non-epidural or no analgesia in labour ... · section, maternal satisfaction with...
Epidural versus non-epidural or no analgesia in labour
(Review)
Anim-Somuah M, Smyth R, Howell C
This is a reprint of a Cochrane review, prepared and maintained by The Cochrane Collaboration and published in The Cochrane Library2005, Issue 4
http://www.thecochranelibrary.com
1Epidural versus non-epidural or no analgesia in labour (Review)
Copyright ©2005 The Cochrane Collaboration. Published by John Wiley & Sons, Ltd

T A B L E O F C O N T E N T S
1ABSTRACT . . . . . . . . . . . . . . . . . . . . . . . . . . . . . . . . . . . . . .
2SYNOPSIS . . . . . . . . . . . . . . . . . . . . . . . . . . . . . . . . . . . . . .
2BACKGROUND . . . . . . . . . . . . . . . . . . . . . . . . . . . . . . . . . . . .
3OBJECTIVES . . . . . . . . . . . . . . . . . . . . . . . . . . . . . . . . . . . . .
3CRITERIA FOR CONSIDERING STUDIES FOR THIS REVIEW . . . . . . . . . . . . . . . . . .
4SEARCH STRATEGY FOR IDENTIFICATION OF STUDIES . . . . . . . . . . . . . . . . . . . .
4METHODS OF THE REVIEW . . . . . . . . . . . . . . . . . . . . . . . . . . . . . . .
6DESCRIPTION OF STUDIES . . . . . . . . . . . . . . . . . . . . . . . . . . . . . . .
6METHODOLOGICAL QUALITY . . . . . . . . . . . . . . . . . . . . . . . . . . . . . .
7RESULTS . . . . . . . . . . . . . . . . . . . . . . . . . . . . . . . . . . . . . . .
9DISCUSSION . . . . . . . . . . . . . . . . . . . . . . . . . . . . . . . . . . . . .
10AUTHORS’ CONCLUSIONS . . . . . . . . . . . . . . . . . . . . . . . . . . . . . . .
10POTENTIAL CONFLICT OF INTEREST . . . . . . . . . . . . . . . . . . . . . . . . . . .
10ACKNOWLEDGEMENTS . . . . . . . . . . . . . . . . . . . . . . . . . . . . . . . .
10SOURCES OF SUPPORT . . . . . . . . . . . . . . . . . . . . . . . . . . . . . . . . .
11REFERENCES . . . . . . . . . . . . . . . . . . . . . . . . . . . . . . . . . . . . .
15TABLES . . . . . . . . . . . . . . . . . . . . . . . . . . . . . . . . . . . . . . .
15Characteristics of included studies . . . . . . . . . . . . . . . . . . . . . . . . . . . . .
25Characteristics of excluded studies . . . . . . . . . . . . . . . . . . . . . . . . . . . . .
26GRAPHS . . . . . . . . . . . . . . . . . . . . . . . . . . . . . . . . . . . . . . .
26Comparison 01. Epidural versus non-epidural analgesia in labour . . . . . . . . . . . . . . . . . .
28Comparison 02. Epidural versus non-epidural analgesia for pain relief in labour (primary outcomes by year trial was
performed . . . . . . . . . . . . . . . . . . . . . . . . . . . . . . . . . . .
28Comparison 03. Analysis of primary outcomes excluding trials where more than 30% of women did not receive their
allocation . . . . . . . . . . . . . . . . . . . . . . . . . . . . . . . . . . .
28Comparison 04. Sensitivity analysis of primary outcomes based on trial quality . . . . . . . . . . . . .
28Comparison 05. Subgoup analysis based on epidural technique (epidural without spinal compared to CSE) . . . .
28INDEX TERMS . . . . . . . . . . . . . . . . . . . . . . . . . . . . . . . . . . . .
29COVER SHEET . . . . . . . . . . . . . . . . . . . . . . . . . . . . . . . . . . . .
30COMMENTS AND CRITICISMS . . . . . . . . . . . . . . . . . . . . . . . . . . . . . .
31GRAPHS AND OTHER TABLES . . . . . . . . . . . . . . . . . . . . . . . . . . . . . .
31Fig. 1. Comparison 01. Epidural versus non-epidural analgesia in labour. . . . . . . . . . . . . . . .
3101 Woman’s perception of pain relief in labour . . . . . . . . . . . . . . . . . . . . . . .
32Fig. 2. Comparison 01. Epidural versus non-epidural analgesia in labour. . . . . . . . . . . . . . . .
3202 Instrumental delivery . . . . . . . . . . . . . . . . . . . . . . . . . . . . . .
33Fig. 3. Comparison 01. Epidural versus non-epidural analgesia in labour. . . . . . . . . . . . . . . .
3303 Caesarean section . . . . . . . . . . . . . . . . . . . . . . . . . . . . . . . .
34Fig. 4. Comparison 01. Epidural versus non-epidural analgesia in labour. . . . . . . . . . . . . . . .
3404 Apgar score less than 7 at 5 minutes . . . . . . . . . . . . . . . . . . . . . . . . .
35Fig. 5. Comparison 01. Epidural versus non-epidural analgesia in labour. . . . . . . . . . . . . . . .
3505 Maternal satisfaction with pain relief in labour . . . . . . . . . . . . . . . . . . . . . .
35Fig. 6. Comparison 01. Epidural versus non-epidural analgesia in labour. . . . . . . . . . . . . . . .
3506 Long-term backache . . . . . . . . . . . . . . . . . . . . . . . . . . . . . . .
36Fig. 7. Comparison 01. Epidural versus non-epidural analgesia in labour. . . . . . . . . . . . . . . .
3607 Length of first stage of labour (minutes) . . . . . . . . . . . . . . . . . . . . . . . .
37Fig. 8. Comparison 01. Epidural versus non-epidural analgesia in labour. . . . . . . . . . . . . . . .
3708 Length of second stage of labour (minutes) . . . . . . . . . . . . . . . . . . . . . . .
38Fig. 9. Comparison 01. Epidural versus non-epidural analgesia in labour. . . . . . . . . . . . . . . .
3809 Oxytocin augmentation . . . . . . . . . . . . . . . . . . . . . . . . . . . . .
39Fig. 10. Comparison 01. Epidural versus non-epidural analgesia in labour. . . . . . . . . . . . . . . .
3910 Caesarean section for fetal distress . . . . . . . . . . . . . . . . . . . . . . . . . .
iEpidural versus non-epidural or no analgesia in labour (Review)
Copyright ©2005 The Cochrane Collaboration. Published by John Wiley & Sons, Ltd

40Fig. 11. Comparison 01. Epidural versus non-epidural analgesia in labour. . . . . . . . . . . . . . . .
4011 Caesarean section for dystocia . . . . . . . . . . . . . . . . . . . . . . . . . . .
40Fig. 12. Comparison 01. Epidural versus non-epidural analgesia in labour. . . . . . . . . . . . . . . .
4012 Time of administration of pain relief to time pain relief was satisfactory . . . . . . . . . . . . .
41Fig. 13. Comparison 01. Epidural versus non-epidural analgesia in labour. . . . . . . . . . . . . . . .
4113 Woman’s perception of pain relief during 1st stage of labour . . . . . . . . . . . . . . . . .
41Fig. 14. Comparison 01. Epidural versus non-epidural analgesia in labour. . . . . . . . . . . . . . . .
4114 Woman’s perception of pain relief during the 2nd stage of labour . . . . . . . . . . . . . . .
42Fig. 15. Comparison 01. Epidural versus non-epidural analgesia in labour. . . . . . . . . . . . . . . .
4215 Maternal satisfaction with childbirth experience . . . . . . . . . . . . . . . . . . . . .
42Fig. 16. Comparison 01. Epidural versus non-epidural analgesia in labour. . . . . . . . . . . . . . . .
4216 Perceived feeling of poor control in labour . . . . . . . . . . . . . . . . . . . . . . .
43Fig. 17. Comparison 01. Epidural versus non-epidural analgesia in labour. . . . . . . . . . . . . . . .
4317 Need for additional means of pain relief . . . . . . . . . . . . . . . . . . . . . . . .
44Fig. 18. Comparison 01. Epidural versus non-epidural analgesia in labour. . . . . . . . . . . . . . . .
4419 Maternal hypotension as defined by trial authors . . . . . . . . . . . . . . . . . . . . .
44Fig. 19. Comparison 01. Epidural versus non-epidural analgesia in labour. . . . . . . . . . . . . . . .
4420 Postnatal depression (authors definition, on medication, or self-reported) . . . . . . . . . . . .
45Fig. 20. Comparison 01. Epidural versus non-epidural analgesia in labour. . . . . . . . . . . . . . . .
4522 Motor blockade . . . . . . . . . . . . . . . . . . . . . . . . . . . . . . . .
45Fig. 21. Comparison 01. Epidural versus non-epidural analgesia in labour. . . . . . . . . . . . . . . .
4523 Respiratory depression requiring oxygen administration . . . . . . . . . . . . . . . . . .
46Fig. 22. Comparison 01. Epidural versus non-epidural analgesia in labour. . . . . . . . . . . . . . . .
4625 Headache . . . . . . . . . . . . . . . . . . . . . . . . . . . . . . . . . .
46Fig. 23. Comparison 01. Epidural versus non-epidural analgesia in labour. . . . . . . . . . . . . . . .
4628 Perineal trauma requiring suturing . . . . . . . . . . . . . . . . . . . . . . . . . .
47Fig. 24. Comparison 01. Epidural versus non-epidural analgesia in labour. . . . . . . . . . . . . . . .
4729 Nausea and vomiting . . . . . . . . . . . . . . . . . . . . . . . . . . . . . .
47Fig. 25. Comparison 01. Epidural versus non-epidural analgesia in labour. . . . . . . . . . . . . . . .
4730 Itch . . . . . . . . . . . . . . . . . . . . . . . . . . . . . . . . . . . .
48Fig. 26. Comparison 01. Epidural versus non-epidural analgesia in labour. . . . . . . . . . . . . . . .
4831 Fever > 38 degrees C . . . . . . . . . . . . . . . . . . . . . . . . . . . . . . .
48Fig. 27. Comparison 01. Epidural versus non-epidural analgesia in labour. . . . . . . . . . . . . . . .
4832 Shivering . . . . . . . . . . . . . . . . . . . . . . . . . . . . . . . . . . .
49Fig. 28. Comparison 01. Epidural versus non-epidural analgesia in labour. . . . . . . . . . . . . . . .
4933 Drowsiness . . . . . . . . . . . . . . . . . . . . . . . . . . . . . . . . . .
49Fig. 29. Comparison 01. Epidural versus non-epidural analgesia in labour. . . . . . . . . . . . . . . .
4934 Urinary retention . . . . . . . . . . . . . . . . . . . . . . . . . . . . . . . .
50Fig. 30. Comparison 01. Epidural versus non-epidural analgesia in labour. . . . . . . . . . . . . . . .
5035 Cathetherisation during labour . . . . . . . . . . . . . . . . . . . . . . . . . . .
50Fig. 31. Comparison 01. Epidural versus non-epidural analgesia in labour. . . . . . . . . . . . . . . .
5037 Malposition . . . . . . . . . . . . . . . . . . . . . . . . . . . . . . . . . .
51Fig. 32. Comparison 01. Epidural versus non-epidural analgesia in labour. . . . . . . . . . . . . . . .
5138 Surgical amniotomy . . . . . . . . . . . . . . . . . . . . . . . . . . . . . . .
51Fig. 33. Comparison 01. Epidural versus non-epidural analgesia in labour. . . . . . . . . . . . . . . .
5139 Neonatal intensive care unit admission . . . . . . . . . . . . . . . . . . . . . . . .
52Fig. 34. Comparison 01. Epidural versus non-epidural analgesia in labour. . . . . . . . . . . . . . . .
5240 Umbilical artery pH < 7.2 at delivery . . . . . . . . . . . . . . . . . . . . . . . . .
52Fig. 35. Comparison 01. Epidural versus non-epidural analgesia in labour. . . . . . . . . . . . . . . .
5241 Acidosis defined by cord arterial pH < 7.15 . . . . . . . . . . . . . . . . . . . . . . .
53Fig. 36. Comparison 01. Epidural versus non-epidural analgesia in labour. . . . . . . . . . . . . . . .
5342 Naloxone administration . . . . . . . . . . . . . . . . . . . . . . . . . . . . .
53Fig. 37. Comparison 01. Epidural versus non-epidural analgesia in labour. . . . . . . . . . . . . . . .
iiEpidural versus non-epidural or no analgesia in labour (Review)
Copyright ©2005 The Cochrane Collaboration. Published by John Wiley & Sons, Ltd

5346 Meconium staining of liquor . . . . . . . . . . . . . . . . . . . . . . . . . . . .
54Fig. 38. Comparison 02. Epidural versus non-epidural analgesia for pain relief in labour (primary outcomes by year trial
was performed. . . . . . . . . . . . . . . . . . . . . . . . . . . . . . . . . .
5401 Instrumental vaginal delivery . . . . . . . . . . . . . . . . . . . . . . . . . . . .
55Fig. 39. Comparison 02. Epidural versus non-epidural analgesia for pain relief in labour (primary outcomes by year trial
was performed. . . . . . . . . . . . . . . . . . . . . . . . . . . . . . . . . .
5502 Caesarean section . . . . . . . . . . . . . . . . . . . . . . . . . . . . . . . .
57Fig. 40. Comparison 02. Epidural versus non-epidural analgesia for pain relief in labour (primary outcomes by year trial
was performed. . . . . . . . . . . . . . . . . . . . . . . . . . . . . . . . . .
5703 Apgar score less than 7 at 5 minutes . . . . . . . . . . . . . . . . . . . . . . . . .
58Fig. 41. Comparison 03. Analysis of primary outcomes excluding trials where more than 30% of women did not receive
their allocation. . . . . . . . . . . . . . . . . . . . . . . . . . . . . . . . . .
5801 Instrumental delivery . . . . . . . . . . . . . . . . . . . . . . . . . . . . . .
59Fig. 42. Comparison 03. Analysis of primary outcomes excluding trials where more than 30% of women did not receive
their allocation. . . . . . . . . . . . . . . . . . . . . . . . . . . . . . . . . .
5902 Caesarean section . . . . . . . . . . . . . . . . . . . . . . . . . . . . . . . .
60Fig. 43. Comparison 03. Analysis of primary outcomes excluding trials where more than 30% of women did not receive
their allocation. . . . . . . . . . . . . . . . . . . . . . . . . . . . . . . . . .
6003 Apgar score less than 7 at 5 minutes . . . . . . . . . . . . . . . . . . . . . . . . .
61Fig. 44. Comparison 03. Analysis of primary outcomes excluding trials where more than 30% of women did not receive
their allocation. . . . . . . . . . . . . . . . . . . . . . . . . . . . . . . . . .
6104 Maternal satisfaction with pain relief in labour . . . . . . . . . . . . . . . . . . . . . .
61Fig. 45. Comparison 03. Analysis of primary outcomes excluding trials where more than 30% of women did not receive
their allocation. . . . . . . . . . . . . . . . . . . . . . . . . . . . . . . . . .
6105 Long-term backache . . . . . . . . . . . . . . . . . . . . . . . . . . . . . . .
62Fig. 46. Comparison 04. Sensitivity analysis of primary outcomes based on trial quality. . . . . . . . . . .
6201 Woman’s perception of pain relief in labour . . . . . . . . . . . . . . . . . . . . . . .
62Fig. 47. Comparison 04. Sensitivity analysis of primary outcomes based on trial quality. . . . . . . . . . .
6202 Instrumental delivery . . . . . . . . . . . . . . . . . . . . . . . . . . . . . .
63Fig. 48. Comparison 04. Sensitivity analysis of primary outcomes based on trial quality. . . . . . . . . . .
6303 Caesarean section . . . . . . . . . . . . . . . . . . . . . . . . . . . . . . . .
64Fig. 49. Comparison 04. Sensitivity analysis of primary outcomes based on trial quality. . . . . . . . . . .
6404 Apgar score less than 7 at 5 minutes . . . . . . . . . . . . . . . . . . . . . . . . .
64Fig. 50. Comparison 04. Sensitivity analysis of primary outcomes based on trial quality. . . . . . . . . . .
6405 Women satisfied with pain relief . . . . . . . . . . . . . . . . . . . . . . . . . . .
65Fig. 51. Comparison 05. Subgoup analysis based on epidural technique (epidural without spinal compared to CSE).
6501 Instrumental delivery . . . . . . . . . . . . . . . . . . . . . . . . . . . . . .
66Fig. 52. Comparison 05. Subgoup analysis based on epidural technique (epidural without spinal compared to CSE).
6602 Caesarean section . . . . . . . . . . . . . . . . . . . . . . . . . . . . . . . .
68Fig. 53. Comparison 05. Subgoup analysis based on epidural technique (epidural without spinal compared to CSE).
6803 Apgar score less than 7 at 5 minutes . . . . . . . . . . . . . . . . . . . . . . . . .
69Fig. 54. Comparison 05. Subgoup analysis based on epidural technique (epidural without spinal compared to CSE).
6904 Women satisfied with their pain relief . . . . . . . . . . . . . . . . . . . . . . . . .
iiiEpidural versus non-epidural or no analgesia in labour (Review)
Copyright ©2005 The Cochrane Collaboration. Published by John Wiley & Sons, Ltd
Epidural versus non-epidural or no analgesia in labour(Review)
Anim-Somuah M, Smyth R, Howell C
Status: Commented and Updated
This record should be cited as:
Anim-Somuah M, Smyth R, Howell C. Epidural versus non-epidural or no analgesia in labour. The Cochrane Database of SystematicReviews 2005, Issue 4. Art. No.: CD000331.pub2. DOI: 10.1002/14651858.CD000331.pub2.
This version first published online: 19 October 2005 in Issue 4, 2005.
Date of most recent substantive amendment: 16 August 2005
A B S T R A C T
Background
Epidural analgesia is a central nerve block technique achieved by injection of a local anaesthetic close to the nerves that transmit pain
and is widely used as a form of pain relief in labour. However, there are concerns regarding unintended adverse effects on the mother
and infant.
Objectives
To assess the effects of all modalities of epidural analgesia (including combined -spinal-epidural) on the mother and the baby, when
compared with non-epidural or no pain relief during labour.
Search strategy
We searched the Cochrane Pregnancy and Childbirth Group Trials Register (June 2005).
Selection criteria
Randomised controlled trials comparing all modalities of epidural with any form of pain relief not involving regional blockade, or no
pain relief in labour.
Data collection and analysis
Two of the review authors independently assessed trials for eligibility, methodological quality and extracted all data. Data were entered
into RevMan and double checked. Primary analysis was by intention-to-treat; sensitivity analyses excluded trials with > 30% of women
receiving un-allocated treatment.
Main results
Twenty-one studies involving 6664 women were included, all but one study compared epidural analgesia with opiates. For technical
reasons, data on women’s perception of pain relief in labour could only be included from one study which found epidural analgesia
to offer better pain relief than non-epidural analgesia (weighted mean difference (WMD) -2.60, 95% confidence interval (CI) -3.82
to -1.38, 1 trial, 105 women). However, epidural analgesia was associated with an increased risk of instrumental vaginal birth (relative
risk (RR) 1.38, 95% CI 1.24 to 1.53, 17 trials, 6162 women). There was no evidence of a significant difference in the risk of caesarean
delivery (RR 1.07, 95% CI 0.93 to 1.23, 20 trials, 6534 women), long-term backache (RR 1.00, 95% CI 0.89 to 1.12, 2 trials, 814
women), low neonatal Apgar scores at five minutes (RR 0.70, 95% CI 0.44 to 1.10, 14 trials, 5363 women), and maternal satisfaction
with pain relief (RR 1.18 95% CI 0.92 to 1.50, 5 trials, 1940 women). No studies reported on rare but potentially serious adverse
effects of epidural analgesia.
Authors’ conclusions
Epidural analgesia appears to be effective in reducing pain during labour. However, women who use this form of pain relief are at
increased risk of having an instrumental delivery. Epidural analgesia had no statistically significant impact on the risk of caesarean
1Epidural versus non-epidural or no analgesia in labour (Review)
Copyright ©2005 The Cochrane Collaboration. Published by John Wiley & Sons, Ltd

section, maternal satisfaction with pain relief and long-term backache and did not appear to have an immediate effect on neonatal
status as determined by Apgar scores. Further research may be helpful to evaluate rare but potentially severe adverse effects of epidural
analgesia on women in labour and long-term neonatal outcomes.
S Y N O P S I S
Epidurals for pain relief in labour
Epidurals are widely used for pain relief in labour. There are various types, but all involve an injection into the lower back. The review
of trials showed that epidurals relieve pain better than other types of pain medication, but they can lead to more use of instruments
to assist with the birth. There was no difference in caesarean delivery rates, long-term backache, or effects on the baby soon after
birth. However, women who used epidurals were more likely to have a longer second stage of labour, need their labour contractions
stimulated, experience very low blood pressure, be unable to move for a period of time after the birth, have problems passing urine,
and suffer fever. Further research on reducing the adverse outcomes with epidurals would be helpful.
B A C K G R O U N D
Pain relief is an important issue for women in labour. The level of
pain experienced and the effectiveness of pain relief may influence
a woman’s satisfaction with labour and delivery and may have im-
mediate and long-term emotional and psychological effects (Chris-
tiansen 2002). The type of pain relief used in labour may impact
on breastfeeding and mother-infant interaction (Walker 1997).
Women experience varying degrees of pain in labour and exhibit
an equally varying range of responses to it. An individual’s reaction
to the pain of labour may be influenced by the circumstances of
her labour, the environment, her cultural background, prepara-
tion towards her labour and the support available to her (Brown-
ridge 1991; McCrea 2000; Rowlands 1998). Need for pain relief
in labour is also influenced by the type of onset of labour (sponta-
neous or induced) and medical interventions such as instrumental
vaginal delivery and episiotomy. Several methods of relieving pain
in labour and various coping strategies have been advocated, rang-
ing from limited intervention such as breathing exercises to med-
ical techniques like epidural analgesia. Regardless of the intensity
of the pain experienced and response generated, it is important
that whatever method is used to ameliorate maternal discomfort,
it is both effective and safe for the mother and baby.
Relaxation therapies, distraction techniques and continuous sup-
port are believed to help women in labour to use their own re-
sources to cope with pain. Other non-pharmacological methods
used for relieving pain include acupressure, acupuncture, reflex-
ology, aromatherapy, transcutaneous electrical nerve stimulation
and intradermal injection of sterile water (Martensson 1999). Re-
ported effectiveness of these methods vary (Carroll 1997; Cyna
2004; Ranta 1994; Smith 2003). There are data to show that
women who have continuous intrapartum support are less likely
to have pain relief in labour (Hodnett 2003) and measures, such
as labouring in water, massage, acupuncture, and hypnosis may be
helpful therapies for pain management in labour (Chang 2002;
Cluett 2004). Efficacy of other methods such as audioanalgesia
and music therapy remains to be assessed (Cluett 2004). Phar-
macological methods like inhalation of nitrous oxide, parenteral
injection of opioids and regional analgesia in the form of epidural
and combined spinal epidural are also commonly used to relieve
pain in labour.
Epidural analgesia was first used in obstetric practice in 1946 and
its use in labour has steadily increased until the last decade (DOH
2005). Approximately 20% of women in the UK (DOH 2005;
Khor 2000) and 58% of women in the USA (Declercq 2002) use
this form of pain relief. However, there is considerable variation
in the availability and use of epidural analgesia between hospitals
in the same country (DOH 2005). Epidural analgesia is a cen-
tral nerve blockade technique, which involves the injection of a
local anaesthetic into the lower region of the spine close to the
nerves that transmit painful stimuli from the contracting uterus
and birth canal. The anaesthetic inhibits nerve conduction by
blocking sodium channels in nerve membranes, thereby prevent-
ing the propagation of nerve impulses along these fibres. Block-
ing of painful impulses from the nerves as they cross the epidural
space results in analgesia which should be apparent within 10 to 20
minutes of administration. The anaesthetic placed in the epidu-
ral space exerts a concentration specific effect, affecting all the
modalities of sensation of the blocked nerves to varying degrees,
such that administration of a lower-dose anaesthetic (eg 0.125%
bupivacaine) partially selectively blocks painful stimuli while pre-
serving motor function, whereas higher doses of anaesthetic afford
complete sensory and motor blockade limiting mobility in labour.
Blocking of sympathetic nerves occurs at varying concentrations
and manifests as vasodilatation and hypotension.
Epidural analgesia is considered to be effective for reducing pain
in labour (Brownridge 1991; Howell 2001). The choice of drugs
and dosage varies from institution to institution. Protocols re-
2Epidural versus non-epidural or no analgesia in labour (Review)
Copyright ©2005 The Cochrane Collaboration. Published by John Wiley & Sons, Ltd
garding the care of women using epidural analgesia also vary be-
tween hospitals. Epidural solutions are administered either by bo-
lus, continuous infusion or patient-controlled pump. A intermit-
tent technique involves injections of local anaesthetic through a
catheter positioned in the epidural space. Boluses of higher con-
centrations, as used in the earlier years, have been associated with a
dense motor block resulting in reduced mobility, decreased pelvic
tone and impairment of the bearing down effort in the second
stage of labour (Thornton 2001). More recently there has been a
trend to use a lower concentration of local anaesthetic in combi-
nation with a variety of opiates; these combinations provide anal-
gesic effect while allowing the woman to maintain some motor
function, such as the ability to move during her labour and retain
her ability to bear down (COMET 2001; Russell 2000). Com-
bined spinal-epidural (CSE) involves a single injection of local
anaesthetic and/or opiate into the cerebral spinal fluid as well as
insertion of the epidural catheter. CSE combines the advantages of
spinal analgesia (faster onset of pain relief, more reliable analgesia)
with the advantages of epidural analgesia such as continuing pain
relief, potentially maintained throughout the entire duration of
labour (Hughes 2003). Epidural analgesia allows the woman to re-
main alert during labour.. The regional administration of epidural
drugs may help avoid some systemic side-effects of analgesic med-
ication on the baby, such as opioid-induced neonatal respiratory
depression. A functioning epidural allows the option of regional
anaesthesia for interventions such as caesarean section or manual
removal of retained placenta, thereby avoiding the risks associated
with general anaesthesia (Hibbard 1996). However, spinal anaes-
thesia can also be used for this purpose.
Although epidural analgesia may provide effective pain relief in
labour, it may sometimes give inadequate analgesia which may be
due to non-uniform spread of local anaesthetic. Reported mater-
nal complications include hypotension - a reduction in maternal
blood pressure (BP). Severe sudden hypotension (more than 20%
decrease in baseline BP) may result in a clinically significant de-
crease in utero-placental blood flow, which could potentially affect
delivery of oxygen to the baby. This may especially compromise
a baby with inadequate reserves (Vincent 1998). For this reason
intravenous fluids may be given before administering the epidural
drugs (fluid preload) to attenuate the decrease in maternal blood
pressure. Side-effects such as itchiness, drowsiness, shivering and
fever have also been reported (Buggy 1995; Eberle 1996). Women
may develop urinary retention while using epidural analgesia. This
may necessitate the insertion of a catheter to drain the bladder.
Urinary retention in the postpartum period has been attributed to
long labours in women using epidural analgesia (Liang 2002). Less
common side-effects reported are accidental puncture of the dura,
which can sometimes cause severe headache - post-dural puncture
headache (1%) (Stride 1993). This resolves spontaneously in some
women; however, a blood patch may be needed when the headache
is persistent. This involves a sterile injection of 15 to 20 ml of
the woman’s fresh blood into the epidural space (Bromage 1999;
Vincent 1998). This resolves the headache for 60% of women.
Epidural analgesia may influence the course of labour. There have
been suggested associations with malpositions of the fetal head,
prolonged labour, increased use of oxytocin and of instrumental
deliveries (Eberle 1996); possible effects on the risk of caesarean
section continue to be debated (Lieberman 2002). Effects of epidu-
ral analgesia on the neonate may be mixed. Higher cord pH values
and less naloxone use at birth have been reported (Halpern 1998)
as has a greater need for neonatal resuscitation (COMET 2001).
It has been suggested that babies of women who use epidural anal-
gesia may be more prone to low blood sugar in the first hours after
birth (Swanstrom 1981b).
The aim of this review is to assess the effectiveness of analgesia
and benefits afforded by epidural, and the risk of potential adverse
effects when compared with non-epidural methods of relieving
pain in labour or no pain relief.
Readers may wish to refer to the following Cochrane systematic
reviews for further information about pain management during
labour: ’Caregiver support for women during labour ’ (Hodnett
2003), ’Complementary and alternative therapies for pain man-
agement in labour’ (Smith 2003), ’Types of intramuscular opioids
for maternal pain relief in labour’ (Elbourne 1998), ’Combined
spinal epidural versus epidural for pain relief in labour’ (Hughes
2003).
O B J E C T I V E S
To assess the effects of all modalities of epidural analgesia (includ-
ing combined-spinal epidural), during labour on the woman and
the baby, when compared with other forms of pain relief or no
pain relief.
C R I T E R I A F O R C O N S I D E R I N G
S T U D I E S F O R T H I S R E V I E W
Types of studies
Randomised controlled trials comparing epidural analgesia with
alternative forms of pain relief or no pain relief in labour. Abstracts
of unpublished manuscripts of randomised control trials were in-
cluded. Quasi-randomised trials were excluded.
Types of participants
Pregnant women requesting pain relief in labour, regardless of
parity and whether labour was spontaneous or induced.
Types of intervention
All forms of epidural administration, compared with any form of
pain relief not involving regional blockade, or no pain relief, were
considered. Trials comparing different techniques of epidural are
the subject of another review (Hughes 2003).
3Epidural versus non-epidural or no analgesia in labour (Review)
Copyright ©2005 The Cochrane Collaboration. Published by John Wiley & Sons, Ltd

Types of outcome measures
Primary outcomes
1. Woman’s perception of pain relief in labour;
2. instrumental delivery;
3. caesarean section;
4. low Apgar score less than seven at five minutes;
5. maternal satisfaction with pain relief in labour;
6. long-term backache (as defined by trial authors)
Secondary outcomes
Maternal7. length of first stage of labour;
8. length of second stage of labour;
9. oxytocin augmentation;
10. caesarean section for fetal distress;
11. caesarean section for dystocia;
12. time of administration of pain relief to the time the level of
pain relief was satisfactory;
13. woman’s perception of pain relief in first stage of labour;
14. woman’s perception of pain relief in second stage of labour;
15. maternal satisfaction with childbirth experience;
16. perceived feeling of poor control in labour;
17. need for other means of pain relief;
18. mother-baby bonding (as defined by trial authors);
19. maternal hypotension (as defined by authors);
20. post-natal depression (authors’ definition, treatment for de-
pression or self reported);
21. breastfeeding failure (as defined by trial authors);
22. motor blockade;
23. respiratory depression requiring oxygen administration;
24. uterine rupture
25. headache;
26. headache requiring blood patch;
27. venous thromboembolic events;
28. perineal trauma requiring suturing;
29. vomiting;
30. itching;
31. fever;
32. shivers;
33. drowsiness;
34. urinary retention;
35. catheterisation during labour;
36. other morbidity (eg impaired consciousness, meningitis, in-
tensive care unit admission, paralysis);
37. malposition (as defined by trial authors);
38. surgical amniotomy
Infant39. admission to neonatal intensive care unit or special care nurs-
ery;
40. acidosis as defined by cord blood arterial pH less than 7.2;
41. acidosis as defined by cord blood arterial pH less than 7.15;
42. naloxone administration;
43. neonatal hypoglycaemia (less than or equal to 1.67 mmol/l);
44. birth trauma;
45. long-term neonatal complication (eg seizures, disability in
childhood);
46. meconium staining of liquor;
Economic47. postpartum hospital readmission within six weeks of discharge;
48. duration of postpartum hospital stay;
49. cost of hospital stay;
50. hospital follow up for long-term morbidity (as defined by trial
authors)
S E A R C H S T R A T E G Y F O R
I D E N T I F I C A T I O N O F S T U D I E S
See: Pregnancy and Childbirth Group search strategy
We searched the Cochrane Pregnancy and Childbirth Group
Trials Register by contacting the Trials Search Co-ordinator (June
2005).
The Cochrane Pregnancy and Childbirth Group’s Trials Register
is maintained by the Trials Search Co-ordinator and contains
trials identified from:
1. quarterly searches of the Cochrane Central Register of
Controlled Trials (CENTRAL);
2. monthly searches of MEDLINE;
3. handsearches of 30 journals and the proceedings of major
conferences;
4. weekly current awareness search of a further 37 journals.
Details of the search strategies for CENTRAL and MEDLINE,
the list of handsearched journals and conference proceedings,
and the list of journals reviewed via the current awareness service
can be found in the ’Search strategies for identification of studies’
section within the editorial information about the Cochrane
Pregnancy and Childbirth Group.
Trials identified through the searching activities described above
are given a code (or codes) depending on the topic. The codes
are linked to review topics. The Trials Search Co-ordinator
searches the register for each review using these codes rather than
keywords.
We did not apply any language restrictions.
M E T H O D S O F T H E R E V I E W
Selection of studies
Two review authors independently assessed all potential studies,
which were identified as a result of the search strategy, for inclusion.
We resolved any disagreement together by joint re-review of the
data in the original article and discussion.
4Epidural versus non-epidural or no analgesia in labour (Review)
Copyright ©2005 The Cochrane Collaboration. Published by John Wiley & Sons, Ltd

Assessment of methodological quality of included studies
We independently assessed the validity of each study using the
criteria outlined in the Cochrane Handbook (Alderson 2004).
Each study was assessed for quality of allocation of concealment,
completeness to follow up and blinding in the assessment of
outcome.
(1) Selection bias (randomisation and allocation concealment)
We assigned a quality score for each trial, using the following
criteria:
(A) adequate concealment of allocation, such as telephone
randomisation, consecutively numbered sealed opaque envelopes;
(B) unclear whether adequate concealment of allocation; study
does not report any concealment approach, list or table used, sealed
envelopes;
(C) inadequate concealment of allocation, such as open list of
random number tables, use of case record numbers, dates of birth
or days of the week.
(2) Performance bias (blinding of participants, researchers and
outcome assessment)
We assessed blinding using the following criteria:
(1) blinding of participants and caregiver was not possible due
to the type of intervention being assessed. Blinding of outcome
assessment was possible and defined as either yes/no/unclear.
(3) Attrition bias
We assessed completeness to follow up using the following criteria:
(1) A - less than 5% participants excluded from analysis;
(2) B - 5% to 10% of participants excluded from analysis;
(3) C - more than 10% and less than 20% of participants excluded
from analysis;
(4) D - more than 20% of participants excluded from analysis.
We excluded quasi-randomised trials, trials where allocation
concealment was clearly inadequate (C-selection bias) and trials
where more than 20% of participants were excluded from the
analysis (D-attrition bias).
Data extraction and management
We designed a form to extract data. Two review authors extracted
the data independently using the agreed form. We resolved
differences by reviewing the data in the original article together
and discussion. We used the Review Manager software (RevMan
2003) to double-enter the data.
When information regarding any of the above was unclear, we
attempted to contact authors of the original reports to provide
further details where possible.
Measures of treatment effect
We carried out statistical analysis using the Review Manager
software (RevMan 2003). We used a fixed effect meta-analysis for
combining data when trials were sufficiently similar.
For dichotomous data: we present results as summary relative risk
with 95% confidence intervals.
For continuous data: the weighted mean difference was used when
outcomes were measured in the same way between trials. We
intended to use the standardised mean difference to combine trials
that measure the same outcome, but use different methods, and
report any evidence of skewness.
We analysed data on an intention-to-treat basis. Therefore all
participants with available data were included in the analysis in
the group to which they are allocated, regardless of whether or not
they received the allocated intervention.
Where in the original reports participants were not analysed in the
group to which they were randomised, and there was sufficient
information in the trial report, we restored them to the correct
group, where possible.
Unit of analysis issues
Cluster randomised trials
If we had identified cluster-randomised trials, we would have
incorporated them into the analysis using the methods described
by Donner et al (Donner 2001).
Assessment of heterogeneity
Tests of heterogeneity between trials were applied when
appropriate using the I² statistic. When we identified high levels
of heterogeneity among the trials (exceeding 50%), we explored
it by prespecified subgroup analysis and performed a sensitivity
analysis based on trial quality. A random-effects meta-analysis was
used as an overall summary when this was considered appropriate.
Sensitivity analysis
We prespecified that we would perform the following sensitivity
analysis:
• for primary outcomes excluding trials where more than 30% of
women did not receive their allocated treatment or received an
additional form of analgesia to that allocated;
• by trial quality, excluding trials with unclear allocation
concealment
Subgroup analyses
We planned to carry out the following subgroup analyses based
on:
• parity: primigravid women compared with parous women;
• number of babies: multiple pregnancy compared with singleton
pregnancy;
• fetal presentation: breech compared with cephalic;
• previous mode of delivery: caesarean section compared with
vaginal delivery and no previous delivery;
• different epidural regimes: local anaesthetic alone compared
with local anaesthetic/opiate combined regimes;
• epidural technique: epidural alone compared with combined-
spinal epidural;
5Epidural versus non-epidural or no analgesia in labour (Review)
Copyright ©2005 The Cochrane Collaboration. Published by John Wiley & Sons, Ltd

• year trial performed: before 1985 compared with trials
performed in 1985 and after. The rationale for this analysis was
based on the assumption that clinical practice is ever changing
and trials performed before 1985 would have used a higher
concentration of local anaesthetic agents causing more dense
motor blockade. We acknowledge this cut off is arbitrary.
D E S C R I P T I O N O F S T U D I E S
A total of twenty-one trials (48 publications) were included. Thir-
teen of those recruited only nulliparous women; four stated that
they recruited both parous and nulliparous women; one trial re-
cruited parous women only; and parity was not mentioned in the
remaining three. The majority of the studies included women at
more than 36 weeks’ gestation in spontaneous labour with no ob-
stetric or medical complications. Exceptions were Dickinson 2002
and Loughnan 2000, who included women in both spontaneous
and induced labours; Lucas 2001, who recruited only women with
pregnancy induced hypertension in both spontaneous and induced
labours; Head 2002 and Hogg 2000, who included only women
with pre-eclampsia at more than 24 weeks’ gestation in labour.
Twenty trials compared epidural analgesia with opioids: pethi-
dine (thirteen trials) (Clark 1998; Gambling 1998; Head 2002;
Hogg 2000; Howell 2001; Loughnan 2000; Lucas 2001; Muir
1996; Philipsen 1989; Sharma 1997; Sharma 2002; Thalme 1974;
Thorp 1993); butorphanol (one trial) (Bofill 1997); fentanyl (two
trials) (Muir 2000; Nikkola 1997); phenoperidine (one trial)
(Grandjean 1979); pethidine and tramadol (one trial) (Jain 2003);
pethidine and no analgesia (one trial) (Long 2003); combination
of methods: pethidine, Entonox®, transcutaneous electrical nerve
stimulation (TENS) and one-to-one midwifery support (one trial)
(Dickinson 2002). One trial compared epidural with no form
of analgesia (Morgan-Ortiz 1999). In the control groups, opi-
oids were administered as intravenous patient-controlled analge-
sia (PCA) (seven trials), intravenous injection (seven trials) and
intramuscular injection (five trials). The route of administration
was unclear in one trial.
Eight of the studies mentioned giving intravenous fluid preload.
Bupivacaine was used for the epidural analgesia in all of the studies
when reported, apart from two studies - Grandjean 1979 and Long
2003 used lignocaine and ropivacaine respectively. The agents used
in the epidural were not mentioned in two trials (Hogg 2000;
Morgan-Ortiz 1999). Bupivacaine was supplemented with fen-
tanyl in eight of the studies (Bofill 1997; Gambling 1998; Head
2002; Jain 2003; Long 2003; Lucas 2001; Sharma 1997; Sharma
2002) and with pethidine in one (Muir 1996). Continuous infu-
sion was used in seven studies (Bofill 1997; Gambling 1998; Head
2002; Jain 2003; Lucas 2001; Sharma 1997; Sharma 2002). In
these studies a bolus of 0.25% of bupivacaine was used followed
by infusion of 0.0125 % to maintain epidural analgesia. Two stud-
ies used a much higher concentration of bupivacaine (Philipsen
1989 used 0.375% bupivacaine and Nikkola 1997 used 0.5%). Pa-
tient-controlled epidural analgesia (PCEA) was used in four stud-
ies (Dickinson 2002; Long 2003; Muir 1996; Sharma 2002). The
level of block was mentioned in eight studies. Only three of the
studies (Dickinson 2002; Gambling 1998; Long 2003) used com-
bined spinal epidural (CSE); in Dickinson 2002 spinal block was
achieved using fentanyl 25 mg and bupivacaine 2 mg. Epidural
was started following the onset of spinal analgesia. In Gambling
1998 spinal block was achieved with sufentanil alone and epidu-
ral infusion was started immediately following the intrathecal ad-
ministration of the opoid, whereas the spinal block in Long 2003
was achieved with ropivacaine supplemented with fentanyl and
epidural analgesia was given only after dissipation of the spinal
analgesia. Epidural use was discontinued in the second stage of
labour in three studies (Loughnan 2000; Nikkola 1997; Philipsen
1989).
Outcomes reported by most studies were maternal satisfaction
with pain relief, caesarean section, instrumental delivery, duration
of first and second stages of labour and oxytocin augmentation .
Two studies reported on long-term backache and one study only
reported on the woman’s perception of poor control in labour
and the woman’s satisfaction with childbirth experience. Eleven
other studies (Bofill 1997; Dickinson 2002; Gambling 1998; Jain
2003; Loughnan 2000; Muir 1996; Nikkola 1997; Philipsen 1989;
Sharma 1997; Sharma 2002; Thorp 1993) reported on pain relief
but these data could not be pooled because of different statisti-
cal methods used to summarise the average and variations, and
measurements were sometimes undertaken at different time points
following the intervention. None of the economic outcomes and
possible rare side-effects of epidural analgesia were reported in the
included studies.
See the tables of ’Characteristics of included studies’ and ’Charac-
teristics of excluded studies’ for details of the individual studies.
M E T H O D O L O G I C A L Q U A L I T Y
The search strategy resulted in 79 references which were all assessed
for inclusion. Twenty studies (26 publications) were excluded. Two
of these (Revill 1979; Robinson 1980) were excluded because a
high proportion of women were excluded from the analysis; 28%
and 30% respectively. Five trials are awaiting assessment.
All included studies stated that women were randomly allocated to
epidural analgesia and control groups. Information regarding gen-
eration of the randomisation sequence was clearly described in 16
studies. Of these, eleven trials used computerised randomisation
(Bofill 1997; Clark 1998; Head 2002; Howell 2001; Gambling
1998; Loughnan 2000; Lucas 2001; Muir 2000; Sharma 1997;
Sharma 2002; Thorp 1993). Randomisation was achieved with
random number tables in two studies (Jain 2003; Philipsen 1989),
random selection of sealed envelopes in two studies (Dickinson
6Epidural versus non-epidural or no analgesia in labour (Review)
Copyright ©2005 The Cochrane Collaboration. Published by John Wiley & Sons, Ltd

2002; Thalme 1974) and drawing of lots in one study (Grandjean
1979).
Allocation concealment was adequate by description in eleven tri-
als (Bofill 1997; Clark 1998; Dickinson 2002; Head 2002, How-
ell 2001; Jain 2003; Loughnan 2000; Lucas 2001; Muir 2000;
Sharma 1997; Sharma 2002). Four other trials (Gambling 1998;
Philipsen 1989; Thalme 1974; Thorp 1993) used sealed envelopes
that were not described as opaque (classified as B - unclear). Due
to the nature of the intervention, it was not possible for the women
or carers to be blinded. In Howell 2001 the outcome assessor for
backache was blinded.
Intention-to-treat analysis was used in all included trials for out-
come data extracted. All trials had less than 10% loss of partici-
pants to follow up except for two (Loughnan 2000; Howell 2001)
(17% loss to follow up for the outcome of long-term backache
only, at six months and 26 months respectively).
All but five studies report that a proportion of women (ranging
from 1% to 62%) did not receive the randomised allocation or
received another form of pain relief in addition to the randomised
treatment (see ’Table of Characteristics of included studies’).
R E S U L T S
Twenty-one trials involving 6664 women were included in this
review. Data were available for all primary outcomes.
Primary outcomes
Maternal
Woman’s perception of pain relief in labourOne trial, which involved 105 women, reported this outcome.
Women in the epidural group reported better pain relief than the
control group (weighted mean difference (WMD) -2.60, 95%
confidence interval (CI) -3.82 to -1.38). Outcome was measured
using a visual analogue score of 0 to 10, where 0 represented no
pain and 10 the worst possible pain.
Instrumental vaginal deliverySeventeen trials, involving 6162 women, reported this outcome.
The risk of instrumental delivery was greater in the women ran-
domised to epidural analgesia (relative risk (RR) 1.38, 95% confi-
dence interval (CI) 1.24 to 1.53, risk difference (RD) 5%, number
needed to treat (NNT) 20) compared with women randomised
to non-epidural analgesia. The effect of epidural analgesia on in-
strumental delivery did not change significantly after excluding
four trials where more than 30% of the women did not receive
their allocated treatment or received another form of pain relief in
addition (RR 1.66, 95% CI 1.41 to 1.94). Excluding trials based
on trial quality did not significantly alter the results.
Caesarean section
Twenty trials, involving 6534 women, reported this outcome.
There was no evidence of a statistically significant difference in the
risk of caesarean section (RR 1.07, 95% CI 0.93 to 1.23). Sensi-
tivity analysis based on excluding trials where more than 30% of
the women did not receive their allocated treatment or received
another form of pain relief in addition, did not significantly alter
the results (RR 1.09, 95% CI 0.91 to 1.31). Excluding trials based
on trial quality did not significantly alter the results.
Maternal satisfaction with pain reliefFive trials, involving 1940 women, reported this outcome. There
was no evidence of significant difference between the two groups
(RR 1.18, 95% CI 0.92 to 1.50). This result did not alter sig-
nificantly after sensitivity analysis based on excluding trials where
more than 30% of the women did not receive their allocated treat-
ment or received another form of pain relief in addition (RR 1.23,
95% CI 0.97 to 1.55). Significant heterogeneity was found for this
outcome, which was not attributable to trial quality. No difference
was found between groups when using a random-effects model.
Excluding one trial based on trial quality did not significantly alter
the results.
Long-term backacheTwo trials, involving 814 women, reported this outcome. One
trial assessed backache at six months postpartum and the other
trial at twenty six months. There was no evidence of significance
difference in this outcome (RR 1.00, 95% CI 0.89 to 1.12) be-
tween the epidural and non-epidural groups. This result did not
alter significantly after excluding one trial where more than 30%
of the women did not receive their allocated treatment or received
another form of pain relief in addition (RR 1.05, 95% CI 0.92 to
1.20).
Neonatal
Apgar score of less than seven at five minutesFourteen trials, involving 5363 women, reported this outcome.
There was no evidence of significant difference between the two
comparison groups ( RR 0.70, 95% CI 0.44 to 1.10). After ex-
cluding four trials where more than 30% of the women did not
receive their allocated treatment or received another form of pain
relief in addition to their allocated treatment, the point estimate
showed a 44% reduction in the relative risk of neonates, whose
mothers received epidural, having this outcome. The confidence
interval was close to statistical significance (RR 0.56, 95% CI 0.33
to 1.01). Excluding trials based on trial quality did not signifi-
cantly alter the results.
Secondary outcomes
Maternal
Length of first stage of labourNine trials, involving 2328 women, reported this outcome. There
was no evidence of a significant difference in this outcome (WMD
23.81 minutes, 95% CI -18.88 to 66.51).
7Epidural versus non-epidural or no analgesia in labour (Review)
Copyright ©2005 The Cochrane Collaboration. Published by John Wiley & Sons, Ltd
Length of second stage of labourEleven trials involving 3580 women reported this outcome.
Women with epidural analgesia had a statistically significant longer
second stage of labour (WMD 15.55 minutes, 95% CI 7.46 to
23.63, 11 trials, 3580 women).
Use of oxytocinEleven trials, involving 4551 women, reported this outcome.
Women with epidural analgesia had an increased risk in the use of
oxytocin (RR 1.18, 95% CI 1.03 to 1.34) when compared with
women using non-epidural forms of analgesia.
Caesarean section for fetal distress:Ten trials, involving 4421 women, reported this outcome. The
point estimate showed a 42% increase in the relative risk of cae-
sarean section for fetal distress in the epidural group; the confi-
dence interval was close to statistical significance (RR 1.42, 95%
CI 0.99 to 2.03).
Caesarean section for dystociaEleven trials, involving 4606 women, reported this outcome.
There was no evidence of significant difference in this outcome
(RR 0.90, 95% CI 0.73 to 1.12).
Time of administration of pain relief to the time pain relief wassatisfactoryOne trial, involving 82 women, reported this outcome. Time
(minutes) to achieve pain relief was less in the epidural group com-
pared with the non-epidural group (RR -6.70, 95% CI -8.02 to
-5.38)
MalpositionThis outcome was reported in four studies, involving 673 women.
The point estimate showed a 40% increase in the relative risk of
malposition in women using epidural analgesia; the confidence
interval was close to statistical significance (RR 1.40 , 95% CI
0.98 to 1.99).
Woman’s perception of pain relief in the first and second stage of labourTwo trials, involving 164 women, reported these outcomes using
the Visual Analogue Score 0 to 10, where 0 represents no pain and
10 the worst pain. Women with epidural analgesia reported less
pain in both the first and second stages of labour (WMD -15.67,
95% CI -16.98 to -14.35) and (WMD -20.75, 95% CI -22.50 to
-19.01) compared with women in the control group.
Need for additional means of pain reliefFifteen trials, involving 6019 women, reported this outcome.
Women with an epidural had significantly less need for pain relief
in addition to their allocation (RR 0.05, 95% CI 0.02 to 0.17)
compared with women using non-epidural forms of analgesia. Sig-
nificant heterogeneity was detected in this outcome, which was
not attributable to trial quality, and has been analysed using a ran-
dom-effects model.
Maternal hypotension
Seven trials, involving 2759 women, reported this outcome.
Women with epidural analgesia had a significant increase in the
risk of hypotension (RR 20.09, 95% CI 4.83 to 83.64). Signifi-
cant heterogeneity was detected in this outcome, which was not
attributable to trial quality, and was analysed using a random-ef-
fects model.
Motor BlockadeTwo trials, involving 322 women, reported this outcome. Women
with epidural analgesia had increased risk of motor blockade (RR
31.71, 95% CI 4.16 to 241.99) compared with the non-epidural
group.
Urinary retention and catheterisation during labourThree trials, involving 283 women, reported on urinary retention.
Women with epidural analgesia had increased risk of this outcome
(RR 17.05, 95% CI 4.82 to 60.39). Two trials, involving 1103
women, reported catheterisation. No significant differences were
noted for women with epidural analgesia for this outcome (RR
1.81, 95% CI 0.44 to 7.46) compared with women with non-
epidural analgesia. Significant heterogeneity was detected in this
outcome, which was not attributable to trial quality, and has been
analysed using a random-effects model.
FeverThree trials, involving 1912 women, reported this outcome.
Women with epidural analgesia had increased risk of maternal
fever of at least 38 degree centigrade (RR 3.67, 95% CI 2.77 to
4.86 ) compared with women using non-epidural analgesia.
There was no evidence of significant difference in the following out-comesMaternal satisfaction with childbirth experience (one trial, 332
women, RR 0.95, 95% CI 0.87 to 1.03 ); feeling of poor control
in labour (one trial, 344 women, RR 1.17, 95% CI 0.62 to 2.21);
post-natal depression (one trial, 313 women, RR 0.63, 95% CI
0.38 to 1.05); nausea and vomiting (seven trials, 2355 women, RR
1.03, 95% CI 0.87 to 1.22); drowsiness (three trials, 414 women,
RR 1.00, 95% CI 0.12 to 7.99); surgical amniotomy (two trials,
211 women, RR 1.03, 95% CI 0.74 to 1.43); headache (one trial,
206 women, RR 0.96, 95% CI 0.67 to 1.40).
No trials reported on the following outcomes: mother-baby bond-
ing, breastfeeding failure, headache requiring blood patch, venous
thromboembolic events, respiratory failure, uterine rupture and
other potential severe adverse effects of epidural.
Neonatal
Umbilical cord pH less than 7.2Six trials, involving 2774 women, reported this outcome. Neonates
of mothers who had epidural analgesia had less risk of having an
umbilical cord pH less than 7.2 (RR 0.80, 95% CI 0.66 to 0.96)
compared with those whose mothers had non-epidural analgesia.
Naloxone administration
8Epidural versus non-epidural or no analgesia in labour (Review)
Copyright ©2005 The Cochrane Collaboration. Published by John Wiley & Sons, Ltd
Eight trials, involving 2373 women, reported this outcome.
Neonates whose mothers had epidural analgesia had less risk of
requiring naloxone (RR 0.13, 95% CI 0.08 to 0.21) when com-
pared with those who had non-epidural analgesia.
There was no evidence of significant difference in the following
outcomes: meconium staining of liquor (four trials, 1426 women,
RR 1.01, 95% CI 0.79 to 1.30); admission to neonatal intensive
care unit (seven trials, 3125 women, RR 1.19, 95% CI 0.94 to
1.50); and umbilical arterial pH less than 7.15 (two trials, 382
women, RR 0.94, 95% CI 0.46 to 1.91).
No trials reported on neonatal hypoglycaemia, birth trauma, long-
term neonatal morbidity.
Economic outcomes
No trials reported any of these outcomes.
Subgroup analysis
Two trials (Grandjean 1979; Thalme 1974) performed before
1985 were compared with the remaining trials for primary out-
comes. Data were available for instrumental delivery, caesarean
section and Apgar scores less than seven at five minutes. No sig-
nificant differences were found between trials performed before
1985, after 1985 and when all the trials were combined. Three
trials (Dickinson 2002; Gambling 1998; Long 2003) comparing
combined spinal-epidural with non-epidural or no pain relief were
compared with the remaining trials for primary outcomes. Data
were available for instrumental delivery, caesarean section, mater-
nal satisfaction with pain relief and Apgar score less than seven at
five minutes. No significant differences were found between tri-
als. Data were not available to perform the remaining prespecified
subgroup analysis.
D I S C U S S I O N
Over 6000 women were randomised into 21 trials comparing
epidural analgesia with alternative forms of pain relief or no pain
relief in labour. Evidence from this review demonstrates that epidu-
ral analgesia offers better pain relief in labour. However, women
who use this form of pain relief have an increased risk of instru-
mental delivery when compared with women who use non-epidu-
ral forms of analgesia or no analgesia at all. There was no statis-
tically significant evidence of difference in maternal satisfaction
with pain relief, the risk of caesarean section, long-term backache
(up to 26 months) or immediate adverse effects on the infant be-
tween the epidural and control groups. For the outcome caesarean
section the relative risk was 1.07, 95% confidence interval 0.93 to
1.23. Although this finding remains statistically non-significant, a
small increase in the risk of caesarean section cannot be excluded.
Some limitations of our analysis should be noted. Eleven studies
reported women’s perception of pain as an outcome but we could
not extract the data from these studies for meta-analysis, because
trials measured this outcome differently and reported the data in
a format not compatible with the software used. These studies
used various forms of visual analogue scores as a way of measur-
ing women’s perception of pain but it was not possible to extract
the data presented. In three of the studies (Bofill 1997; Sharma
1997; Sharma 2002), data were presented as graphical represen-
tation only. For two of the studies (Dickinson 2002; Muir 1996),
it was unclear as to whether the data presented were means or
medians. The trial by Philipsen 1989 used medians; Gambling
1998, Nikkola 1997 and Thorp 1993 measured this outcome at
different time intervals and therefore could not be combined. Two
studies (Jain 2003; Loughnan 2000) presented their data as the
number of women experiencing different levels of pain.
Trials varied in the characteristics of participants, labour manage-
ment protocols and epidural regimen. These factors may influence
the course of labour, pain relief requirements and outcomes such
as duration of labour, oxytocin augmentation and instrumental
delivery. Combining studies using a high concentration of a local
anaesthetic agent for epidural analgesia with low concentration
techniques, and studies maintaining a block in the second stage of
labour to those discontinuing may influenced some outcomes, in
particular the duration of labour and instrumental delivery rates.
We planned a subgroup analysis based on parity, whether single-
ton or multiple pregnancy, fetal presentation, previous mode of
delivery, different epidural regimens, epidural technique and year
trial performed in an attempt to explore if these variations had any
effect on the results. Analysis of different epidural regimens and
year trial was performed did not significantly alter the results.
Substantial heterogeneity was detected for maternal satisfaction
with pain relief, need for additional means of pain relief, mater-
nal hypotension, length of first and second stages of labour and
oxytocin augmentation. Heterogeneity was explored by trial qual-
ity and prespecified sensitivity analysis and subgroup analysis per-
formed where data were available. There was considerable varia-
tion in outcome measures in trials reporting women’s satisfaction
with pain relief as previously discussed. None of the trials report-
ing maternal hypotension gave their definitions for this outcome
therefore, there may be substantial differences here. Heterogeneity
for the outcomes regarding length of labour and use of oxytocin
augmentation may be explained by variations in clinical practice
as to when labour begins and when oxytocin is required.
Most women in the control group were randomised to opioids and,
therefore, the effect on some outcomes may be applicable to the
use of opioids in labour rather than all other non-epidural forms
of analgesia or no pain relief. Some women randomised to non-
epidural analgesia received epidural as well. To a lesser extent some
women in the epidural arm did not receive the intervention due to
rapid labour. We included only data based on an intention-to-treat
analysis. However, this approach may make the results difficult
to interpret. In an attempt to address this issue, we conducted a
9Epidural versus non-epidural or no analgesia in labour (Review)
Copyright ©2005 The Cochrane Collaboration. Published by John Wiley & Sons, Ltd

further analysis on the primary outcomes, based on excluding trials
where more than 30% of women did not receive their allocated
analgesic or received another form of pain relief in addition. This
30% cut off was chosen because it is similar to that found in large
randomised trials of epidural (Lieberman 2002). This analysis did
not alter the results significantly. For the outcome Apgar score of
less than seven at five minutes, the point estimate showed a 44%
reduction in the relative risk of this outcome in favour of epidural
analgesia with confidence intervals close to statistical significance
(RR 0.56, 95% CI 0.31 to 1.01). These data should be interpreted
with caution as an analysis based on excluding these trials is not
intention-to-treat and could potentially introduce bias.
The evidence presented in this review needs to be interpreted
taking these limitations into account.
A U T H O R S ’ C O N C L U S I O N S
Implications for practice
Epidural analgesia affords more effective pain relief than non-
epidural forms of analgesia. However, women randomised to
epidural had an increase in the length of the second stage of labour
and the need for oxytocin, with an increase in the risk of instru-
mental vaginal delivery. The length of the first stage of labour was
longer in the epidural group but did not reach statistical signifi-
cance. The relative increase in the length of labour did not appear
to affect the infants adversely for the outcomes measured in this
review. The finding that epidural analgesia appears to alter the
dynamics of labour necessitating the use of oxytocin needs to be
applied in practice. Whether an increase in the duration of second
stage of labour constitutes prolongation necessitating instrumen-
tal delivery should be a clinical decision. The evidence presented
in this review should be made available to women considering pain
relief in labour. The decision about whether to have an epidural
should then be made in consultation between the woman and her
carer.
Implications for research
Despite a large number of randomised trials including many
women, none of the included studies reported on rare but serious
adverse effects. Some of these data may be better obtained from
large case series. There was no evidence of immediate effects on
the baby; however, long-term consequences are still not known.
Further research is needed to minimise the adverse effects of epidu-
ral analgesia in women who choose epidural as their method of
pain relief.
P O T E N T I A L C O N F L I C T O F
I N T E R E S T
None known.
A C K N O W L E D G E M E N T S
We thank the Editorial Staff of the Cochrane Pregnancy and Child-
birth group, Prof JP Neilson, and Dr S Meher. We thank Gill Gyte
and Dell Horey and other members of the Cochrane Pregnancy
and Childbirth group Consumer panel for their valuable feedback.
We also thank Angela Gonzales and Alison Ledward for assistance
with translation.
As part of the pre-publication editorial process, this review has
been commented on by three peers (an editor and two referees
who are external to the editorial team), one or more members
of the Pregnancy and Childbirth Group’s international panel of
consumers and the Group’s Statistical Adviser.
S O U R C E S O F S U P P O R T
External sources of support
• NHS Programme for Research & Development UK
Internal sources of support
• No sources of support supplied
10Epidural versus non-epidural or no analgesia in labour (Review)
Copyright ©2005 The Cochrane Collaboration. Published by John Wiley & Sons, Ltd

R E F E R E N C E S
References to studies included in this review
Bofill 1997 {published data only}
Bofill JA, Vincent RD, Ross EL, Martin RW, Normal PF, Werhan
CF, Morrison JC. Nulliparous active labor, epidural anaglesia, and
cesarean delivery for dystocia. American Journal of Obstetrics and Gy-necology 1997;177:1465–70.
Clark 1998 {published data only}Clark A, Carr D, Loyd G, Cook V, Spinnato J. The influence of
epidural analgesia on cesarean delivery rates: a randomised, prospec-
tive clinical trial. American Journal of Obstetrics and Gynecology 1998;
179:1527–33.
Dickinson 2002 {published data only}∗ Dickinson JE, Paech MJ, McDonald SJ, Evans SF. The impact
of intrapartum analgesia on labour and delivery outcomes in nulli-
parous women. Australian and New Zealand Journal of Obstetrics &Gynaecology 2002;42:59–66.
Dickinson JE, Paech MJ, McDonald SJ, Evans SF. Maternal satisfac-
tion with childbirth and intrapartum analgesia in nulliparous labour.
Australian and New Zealand Journal of Obstetrics and Gynaecology2003;43:463–8.
Henderson JJ, Dickinson JE, Evans SF, McDonald SJ, Paech MJ.
Impact of intrapartum epidural analgesia on breast-feeding duration.
Australian and New Zealand Journal of Obstetrics and Gynaecology
2003;43:372–7.
Gambling 1998 {published data only}Gambling DR, Sharma SK, Ramin SM, Lucas MJ, Leveno KJ, Wiley
J, et al. A randomized study of combined spinal-epidural analgesia
versus intravenous meperidine during labor: impact on cesarean de-
livery rate. Anesthesiology 1998;89:1336–44.
Grandjean 1979 {published data only}
Grandjean H, de Mouzon J, Cabot JA, Desprats R, Pontonnier G.
Peridural analgesia and by phenoperidine in normal labor. Therapeu-
tic trial with a control series. Archives Francaises de Pediatrie 1979;36
(9 Suppl):LXXV-LXXXI.
Head 2002 {published data only}Head B, Owen J, Vincent R, Shih G, Chestnut D, Hauth J. A
randomized trial of intrapartum analgesia in women with severe
preeclampsia. Obstetrics & Gynecology 2002;99:452–7.
Hogg 2000 {published data only}
Hogg B, Owen J, Shih G, Vince R, Chestnut D, Hauth JC. A ran-
domised control trial of intrapartum analgesia in women with severe
preeclampsia (abstract). American Journal of Obstetrics and Gynecology2000;182:S148.
Kenyon AP, Shennan A. Cesarean delivery rate among women with
severe hypertensive disease: possible reduction with epidural anaes-
thesia? [letter]. American Journal of Obstetrics and Gynecology 2001;
184(3):514.
Shih GH, Vincent RD, Chestnut DH, Hogg MD. Intrapartum anal-
gesia for severe preeclampsia. Anesthesiology 2000;92 Suppl:A50.
Howell 2001 {published data only}Howell C, Kidd C, Roberts W, Johanson R, Upton P, Jones P, et
al. Pain relief study: a randomised controlled trial of epidural versus
pethidine analgesia in labour. British Journal of Obstetrics and Gynae-
cology 1998;105:Suppl 17:88.
Howell CJ, Dean T, Lucking L, Dziedzic K, Jones PW, Johanson RB.
Randomised study of long term outcome after epidural versus non-
epidural analgesia during labour. [Erratum appears in bmj 2002 sep
14;325(7364):580.]. BMJ 2002;325(7360):357.
Howell CJ, Dean T, Lucking L, Dziedzic K, Jones PW, Johanson RB.
Randomised study of long term outcome after epidural versus non-
epidural analgesia during labour [abstract]. Obstetrics & Gynecology
2003;101(1):195–6.
∗ Howell CJ, Kidd C, Roberts W, Upton P, Lucking L, Jones PW, et al.
A randomised control trial of epidural compared with non-epidural
analgesia in labour. BJOG: an international journal of obstetrics andgynaecology 2001;108(1):27–33.
Jain 2003 {published data only}
Jain S, Arya S, Gopalan S, Jain V. Analgesic efficacy of intramuscular
opioids versus epidural analgesia in labor. International Journal of
Gynecology & Obstetrics 2003;83:19–27.
Long 2003 {published data only}Long J, Yue Y. Patient controlled intravenous analgesia with tramadol
for pain relief. Chinese Medical Journal 2003;116(11):1752–5.
Loughnan 2000 {published data only}Loughnan B, Carli F, Romney M, Dore C, Gordon H. A large ran-
domised controlled trial comparing epidural bupivacaine with intra-
muscular pethidine for pain relief in labour in primiparous women.
Acta Obstetricia et Gynecologica Scandinavica 1997;76(167):44.
Loughnan B, Carli F, Romney M, Dore C, Gordon H. A large ran-
domised controlled trial comparing epidural bupivacaine with intra-
muscular pethidine for pain relief in labour in primiparous women.
British Journal of Anaesthesia 1998;80(5 Suppl):151–2.
Loughnan B, Carli F, Romney M, Dore C, Gordon H. Epidural anal-
gesia and backache: a randomized comparison with intramuscular
meperidine for analgesia during labour. British Journal of Anaesthesia2002;89(3):466–72.
Loughnan BA, Carli F, Romney M, Dore C, Gordon H. The influ-
ence of epidural analgesia on the development of new backache in
primiparous women: report of a randomized controlled trial. Inter-national Journal of Obstetric Anesthesia 1997;6:203–4.
∗ Loughnan BA, Carli F, Romney M, Dore CJ, Gordon H. Random-
ized controlled comparison of epidural bupivacaine versus pethidine
for analgesia in labour. British Journal of Anaesthesia 2000;84(6):715–
9.
Lucas 2001 {published data only}
Lucas M, Sharma S, Leveno K, Ramin S, Wiley J, Sidawi J. A ran-
domized trial of labor epidural analgesia in women with preeclamp-
sia. Anesthesiology 1998;88(4 Suppl):A25.
Lucas M, Sharma S, McIntire D, Sidawi E, Ramin S, Leveno K, et
al. A randomized trial of epidural analgesia on pregnancy-induced
11Epidural versus non-epidural or no analgesia in labour (Review)
Copyright ©2005 The Cochrane Collaboration. Published by John Wiley & Sons, Ltd

hypertension. American Journal of Obstetrics and Gynecology 1999;
180(1 Pt 2):S18.
∗ Lucas M, Sharma S, McIntire D, Wiley J, Sidawi J, Ramin S, et
al. A randomized trial of labor analgesia in women with pregnancy-
induced hypertension. American Journal of Obstetrics and Gynecology
2001;185:970–5.
Morgan-Ortiz 1999 {published data only}Morgan-Ortiz F, Quintero-Ledezma J, Perez-Sotelo JA, Trapero-
Morales M. Evolution and quality care of labour and delivery in
primiparous patients who underwent early obstetric analgesia. Gine-
cologia y Obstetricia de Mexico 1999;67:522–6.
Muir 1996 {published data only}Muir HA, Shukla R, Liston R, Writer D. Randomised trial of la-
bor analgesia: a pilot study to compare patient-controlled epidural
analgesia to determine if analgesic method affects delivery outcome.
Canadian Journal of Anaesthesia 1996;43(5):A60.
Muir 2000 {published data only}Halpern S, Breen T, Campbell DC, Blanchard W. Epidural PCA
fentanyl/bupivacaine vs IV PCA fentanyl: neonatal effects. Anesthe-siology 1999;90(4 Suppl):A19.
Halpern S, Muir H, Breen T, Campbell DC. Randomised controlled
trials in obstetrical anesthesia-what did the patients think?. Anesthe-
siology 1999;91(3A):A1068.
Muir HA, Breen T, Campbell DC, Halpern S, Blanchard W. Is intra-
venous PCA fentanyl an effective method for providing labor anal-
gesia?. Anesthesiology 1999;90(4 Suppl):A28.
∗ Muir HD, Breen T, Campbell D, Halpern S, Liston R, Blanchard
W. A multi centre study of the effects of analgesia on the progress of
labour (abstract). Anesthesiology 2000;92 Suppl:A23.
Nikkola 1997 {published data only}Nikkola EM, Ekblad UU, Kero PO, Alihanka JJM, Salonen MAO.
Intravenous fentanyl PCA during labour. Canadian Journal of Anaes-thesia 1997;44(12):1248–55.
Philipsen 1989 {published data only}
Philipsen T, Jensen NH. Epidural block or parenteral pethidine as
analgesic in labour; a randomized study concerning progress in labour
and instrumental deliveries. European Journal of Obstetrics & Gyne-cology and Reproductive Biology 1989;30:27–33.
Philipsen T, Jensen NH. Maternal opinion about analgesia in labour
and delivery. A comparison of epidural blockade and intramuscular
pethidine. European Journal of Obstetrics & Gynecology and Reproduc-tive Biology 1990;34:205–10.
Philipsen T, Jensen NH. A randomised study comparing epidural
block and pethidine as analgesic in labour. World Congress of Gy-
necology and Obstetrics; 1988 Oct 23-28; Brazil 1988: 378–9.
Sharma 1997 {published data only}Alexander JM, Sharma SK, McIntire DD, Wiley J, Leveno KJ. Inten-
sity of labor pain and cesarean delivery. Anesthesia & Analgesia 2001;
92(1):1524–8.
Alexander JM, Sharma SK, McIntire DD, Wiley J, Leveno KJ. The
effect of parity on labour pain. American Journal of Obstetrics and
Gynecology 2000;182:S134.
Philip J, Alexander J, Ramin S, Sharma S, McIntire D, Leveno K.
Epidural analgesia during labor may be an independent source of
maternal fever. American Journal of Obstetrics and Gynecology 1998;
178(1 Pt 2):S175.
Philip J, Alexander JM, Sharma SK, Leveno KJ, McIntire DD, Wiley
J. Epidural analgesia during labour and maternal fever. Anesthesiology
1999;90(5):1271–5.
Sharma SK, Sidawi JE, Ramin SM, Lucas MJ, Leveno KJ, Cunning-
ham FG. A randomised trial of epidural versus patient-controlled
meperidine analgesia during labour. Anesthesiology 1997;87(3):487–
94.
Sharma 2002 {published data only}Alexander JM, Sharma SK, McIntire DD, Leveno KJ. Epidural anal-
gesia lengthens the friedman active phase of labour. Obstetrics & Gy-naecology 2002;100(1):46–50.
Alexander JM, Sharma SK, McIntire DD, Leveno KJ. Epidural anal-
gesia lengthens the friedman active phase of labor [abstract]. Anes-thesiology 2002;96(Suppl 1):P40.
Hill J, Alexander J, Sharma S, McIntire D, Leveno K. The effects of
low-dose epidural technique for labor analgesia on fetal heart rate
(fhr) [abstract]. American Journal of Obstetrics and Gynecology 2001;
185(6 Suppl):S206.
Hill JB, Alexander JM, Sharma SK, McIntire DD. A comparison of
the effects of epidural and meperidine analgesia during labor on fetal
heart rate. Obstetrics & Gynecology 2003;102:333–7.
Sharma S, Leveno K, Messick G, Alexander J, Sidawi J, Wiley J. A
randomized trial of patient-controlled epidural versus patient-con-
trolled intravenous analgesia during labor [abstract]. Anesthesiology2000;92 Suppl:A22.
∗ Sharma SK, Alexander JM, Messick G, Bloom SL, McIntire DD,
Wiley J, et al. Cesarean delivery: a randomized trial of epidural anal-
gesia versus intravenous meperidine analgesia during labor in nulli-
parous women. Anesthesiology 2002;96(3):546–51.
Thalme 1974 {published data only}
Thalme B, Belfrage P, Raabe N. Lumbar epidural analgesia in labour:
I. Acid-base balance and clinical condition of mother, fetus and new-
born child. Acta Obstetricia et Gynecologica Scandinavica 1974;53:
27–35.
Thorp 1993 {published data only}
Thorp JA, Hu DH, Albin RM, McNitt J, Meyer BA, Cohen GR,
et al. The effect of intrapartum epidural analgesia on nulliparous
labor: a randomized, controlled, prospective trial. American Journalof Obstetrics and Gynecology 1993;169:851–8.
References to studies excluded from this reviewAbboud 1982
Abboud TK, Sarkis F, Goebelsmann U, Hung TT, Henriksen EH.
Effects of epidural anesthesia during labor on maternal plasma B-
endorphin levels. Anesthesiology 1982;57:A382.
Buchan 1973
Buchan PC, Milne MK, Browning MCK. The effect of continuous
epidural blockade on plasma 11-hydroxy-corticosteroid concentra-
tions in labour. Journal of Obstetrics and Gynaecology of the British
Commonwealth 1973;80:974–7.
12Epidural versus non-epidural or no analgesia in labour (Review)
Copyright ©2005 The Cochrane Collaboration. Published by John Wiley & Sons, Ltd

Ginosar 2002
Ginosar Y, Columb M, Cohen SE, Mirikatani E, Tingle MS, Ratner
EF, et al. Epidural fentanyl infusions in the presence of local anesthet-
ics exert segmental analgesia: an MLAC infusion study in nulliparous
labour [abstract]. Anesthesiology 2002;96(Suppl 1):P–62.
Hood 1993
Hood DD, Parker RL, Meis PJ. Epidural bupivacaine does not effect
fetal heart rate tracing. Anesthesiology 1993;79:3A.
Jouppila 1976
Joupila R, Hollmen A. The effect of segmental analgesia on mater-
nal and foetal acid-base balance, lactate, serum potassium and crea-
tinine phosphokinase. Acta Anaesthesiologica Scandinavica 1976;20:
259–68.
Jouppila R. The effect of segmental epidural analgesia on maternal
growth hormone, insulin, glucose and free fatty acids during labour.
Annales Chirurgiae et Gynaecologiae 1976;65:398–404.
Jouppila 1980
Jouppila R, Jouppila P, Moilanen K, Pakarinen A. The effect of seg-
mental epidural analgesia on maternal prolactin during labour. BritishJournal of Obstetrics and Gynaecology 1980;87:234–8.
Justins 1983
Justins DM, Knott C, Luthman J, Reynolds F. Epidural vs intramus-
cular fentanyl. Anaesthesia 1983;38:937–42.
Kurjak 1974
Kurjak A, Beazley JM. The effect of continuous lumbar epidural
analgesia on the fetus, newborn child and the acid-base status of
maternal blood. Acta Medica Iugoslavica 1974;28:15–26.
Lassner 1981
Lassner J, Barrier G, Talafre ML, Durupty D. Failure of extradural
morphine to provide adequate pain relief in labour. British Journal ofAnaesthesia 1981;53:112P.
Leong 2000
Leong EWK, Sivanesaratnam V, Oh LLL, Chan YK. Epidural anal-
gesia in primigravidae in spontaneous labour at term: a prospective
study. Journal of Obstetrics & Gynaecology Research 2000;26(4):271–
5.
MacKenzie 1996
MacKenzie P, James K, Bower S, McGrady E, Patrick A. Plasma fen-
tanyl levels during epidural and intravenous fentanyl infusion for
labour analgesia [abstract]. International Journal of Obstetric Anesthe-sia 1996;5:218–9.
McGrath 1992
McGrath J, Chestnut D, Debruyn C. The effect of epidural bupiva-
caine versus intravenous nalbuphine on fetal heart rate during labor.
Anesthesiology 1992;77(3A):A984.
Neri 1986
Neri A, Nitke S, Lachman E, Ovadia J. Lumbar epidural analgesia
in hypertensive patients during labour. European Journal of Obstetrics& Gynecology and Reproductive Biology 1986;22:1–6.
Noble 1971
Noble AD, Craft IL, Bootes JAH, Edwards PA, Thomas DJ, Mills
KLM. Continuous lumbar epidural analgesia using bupivacaine: a
study of the fetus and newborn child. Journal of Obstetrics and Gy-
naecology of the British Commonwealth 1971;78:559–63.
Revill 1979
Revill S. Pain relief in labour: what the patient requires. Proceedings of
the 1st European Congress of Obstetrical Anaesthesia and Analgesia;
1979; Birmingham, UK 1979: 1–16.
Robinson 1980
Robinson JO, Rosen M, Evans JM, Revill SI, David H, Rees GAD.
Maternal opinion about analgesia for labour. A controlled trial be-
tween epidural block and intramuscular pethidine combined with
inhalation. Anaesthesia 1980;35:1173–81.
Robinson 1997
Robinson PN, Romney M, Gordon H, Loughnan BA. Outcome of
labour using low dose extradural bupivacaine compared with intra-
muscular pethidine. British Journal of Anaesthesia 1997;79(5):675P.
Ryhanen 1984
Ryhanen P, Jouppila R, Lanning M, Jouppila P, Hollmen A, Kou-
valainen K. Effect of segmental epidural analgesia on changes in pe-
ripheral blood leucocyte counts, lymphocyte subpopulations, and in
vitro transformation in healthy parturients and their newborns. Gy-
necologic and Obstetric Investigation 1984;17:202–7.
Swanstrom 1981
Bratteby LE. Short- and long-term effects on the infant of obstetric
regional anesthesia. Acta Anaesthesiologica Scandinavica 1983;27:36.
Bratteby LE, Andersson L, Swanstrom S. Effect of obstetrical regional
analgesia on the change in respiratory frequency in the newborn.
British Journal of Anaesthesia 1979;51:41–5.
Swanstrom S, Bratteby LE. Metabolic effects of obstetric regional
analgesia and of asphyxia in the newborn infant during the first two
hours after birth. I. Arterial blood glucose concentrations. Acta Pae-
diatrica Scandinavica 1981;70:791–800.
Swanstrom S, Bratteby LE. Metabolic effects of obstetric regional
analgesia and of asphyxia in the newborn infant during the first two
hours after birth. II. Arterial plasma concentrations of glycerol, free
fatty acids and beta-hydroxybutyrate. Acta Paediatrica Scandinavica
1981;70:801–9.
Swanstrom S, Bratteby LE. Metabolic effects of obstetric regional
analgesia and of asphyxia in the newborn infant during the first two
hours after birth. III. Adjustment of arterial blood gases and acid-
base balance. Acta Paediatrica Scandinavica 1981;70:811–8.
Zakowski 1994
Zakowski MI, Ramanathan S, Sutin KM, Grant GJ, Turndorf H.
Pharmacokinetic profile of morphine in parturients following intra-
venous or epidural administration. Regional Anesthesia 1994;19:119–
25.
References to studies awaiting assessment
Evron 2004
Evron S, Koren R, Parameswaran R, Avinoah I, Ezri T, Sadan O, et al.
Immunohistochemical localization of activin subunit in human pla-
centa: correlation with elevated temperature and placental infection
in parturients laboring under epidural analgesia [abstract]. American
Journal of Obstetrics and Gynecology 2004;191(6 Suppl 1):S188.
Halpern 2004
Halpern SH, Muir H, Breen TW, Campbell DC, Barrett J, Liston
R, et al. A multicentre randomized controlled trial comparing pa-
13Epidural versus non-epidural or no analgesia in labour (Review)
Copyright ©2005 The Cochrane Collaboration. Published by John Wiley & Sons, Ltd

tient-controlled epidural with intravenous analgesia for pain relief in
labour. Anaesthesia & Analgesia 2004;99:1532–8.
Moreno 1997
Moreno I, Puertas A, Mino M, Lopez JC, Manzanares S, Carrillo
MP, et al. Influence of epidural analgesia on the labour induced by
premature rupture of membranes. Acta Ginecologica 1997;54:211–4.
Puertas A, Mino M, Moreno M, Rodriguez C, Miranda J, Herruzo A.
Influence of the epidural anaesthesia in the oxytocin labour induction
of premature rupture of membranes. Prenatal and Neonatal Medicine1996;1(Suppl 1):88.
Ramin 1995
Ramin S, Gambling DR, Lucas MJ, Sharma SK, Sidawi JE, Leveno
KJ. Randomised trial of epidural versus intravenous analgesia during
labour. Obstetrics & Gynecology 1995;86(5):783–9.
Wong 2005
Wong CA, Scavone BM, Peaceman AM, McCarthy RJ, Sullivan JT,
Diaz NT, et al. The risk of caesarean delivery with neuroaxial analgesia
given early versus late in labour. New England Journal of Medicine2005;352:655–65.
Additional referencesAlderson 2004
Alderson P, Green S, Higgins JPT, editors. Cochrane Reviewers’
Handbook 4.2.2 [updated March 2004]. In: The Cochrane Library,
Issue 1,2004. Chichester, UK: John Wiley & Sons, Ltd
Bromage 1999
Bromage PR. Neurologic complications of labour, delivery, and re-
gional anesthesia. In: Chestnut DH, editor(s). Obstetric anesthesia,principles and practice. 2nd Edition. Mosby, 1999:639–59.
Brownridge 1991
Brownridge P. Treatment options for the relief of pain during child-
birth. Drugs 1999;41(1):69–80.
Buggy 1995
Buggy D, Gardiner J. The space blanket and shivering during ex-
tradural analgesia in labour. Acta Anaesthesiologica Scandinavica 1995;
39(4):551–3.
Carroll 1997
Carroll D, Tramer M, Nye B, Moore A. Transcutaneous electrical
nerve stimulation in labour pain: a systematic review. British Journal
of Obstetrics and Gynaecology 1999;104:169–75.
Chang 2002
Chang MY, Wang SY, Chen CH. Effects of massage on pain and anx-
iety during labour: a randomized controlled trial in Taiwan. Journal
of Advanced Nursing 2002;38(1):68–73.
Christiansen 2002
Christiansen P, Klostergaard KM, Terp MR, Poulsen C, Agger AO,
Rasmussen KL. Long-memory of labour pain. Ugeskrift for Laeger
2002;164(42):4927–9.
Cluett 2004
Cluett ER, Nikodem VC, McCandlish RE, Burns EE. Immersion in
water in pregnancy, labour and birth. In: The Cochrane Database of
Systematic Reviews, 1, 2004.
COMET 2001
Comparative Obstetric Mobile Epidural Trial (COMET) Study
Group UK. Effect of low dose mobile versus traditional epidural
techniques on mode of delivery: a randomised control trial. Lancet
2001;358(9275):19–23.
Cyna 2004
Cyna AM, McAuliffe GL, Andrew MI. Hypnosis for pain relief in
labour and chidbirth: a systematic review. British Journal of Anaesthe-
sia 2004;93(4):505–11.
Declercq 2002
Declerq E, Sakala C, Corry M, Applebaum S, Risher P. Listening tomothers: report of the first national survey of women’s childbearing expe-
riences. New York: Maternity Center Association/Harris Interactive,
2002.
DOH 2005
Department of Health. Statistical Bulletin-NHS Maternity Statistics,England:2003-2004. London, UK: Department of Health, 2004.
Donner 2001
Donner A, Piaggio G, Villar J. Statistical methods for the meta-
analysis of cluster randomization trials. Statistical Methods in Medical
Research. Vol. 10, Arnold, 2001:425–38.
Eberle 1996
Eberle RL, Norris MC. Labour analgesia. A risk-benefit analysis.
Drug Safety 1996;14(4):239–51.
Elbourne 1998
Elbourne D, Wiseman RA. Types of intra-muscular opioids for ma-
ternal pain relief in labour. In: The Cochrane Database of SystematicReviews, 4, 1998.
Halpern 1998
Halpern SH, Leighton BL, Ohlsson A, Barrett JF, Rice A. Effect of
epidural analgesia on the progress of labour: a meta-analysis. JAMA
1998;280(24):2105–10.
Hibbard 1996
Hibbard BM, Anderson MM, Drife JO, Tighe JR, Gordon G,
Willatts S, et al. Deaths associated with anaesthesia. In: Rubery E,
Bourdillon P, editor(s). In:Report on confidential enquiries into ma-ternal deaths in the United Kingdom 1991-1993. Norwich: HMSO,
1996:87–102.
Hodnett 2003
Hodnett ED, Gates S, Hofmeyr G J, Sakala C. Continuous support
for women during childbirth. In: The Cochrane Database of SystematicReviews, 3, 2003.
Hughes 2003
Hughes D, Simmons SW, Brown J, Cyna AM. Combined spinal-
epidural versus epidural analgesia in labour. In: Cochrane Database ofSystematic Reviews, 4, 2003.
Khor 2000
Khor LJ, Jeskins G, Cooper GM, Paterson-Brown S. National ob-
stetric anaesthetic practice in the UK 1997/1998. Anaesthesia 2000;
55(12):1168–72.
Liang 2002
Liang CC, Wong SY, Tsay PT, Chang SD, Tseung LH, Wang MF, et
al. The effect of epidural analgesia on postpartum urinary retention
in women who deliver vaginally. International Journal of ObstetricAnesthesia 2002;11:164–9.
Lieberman 2002
Lieberman E, O’Donoghue C. Unintended effects of epidural anal-
gesia during labour. American Journal of Obstetrics and Gynecology
2002;186(5):S31–S64.
14Epidural versus non-epidural or no analgesia in labour (Review)
Copyright ©2005 The Cochrane Collaboration. Published by John Wiley & Sons, Ltd

Martensson 1999
Martensson L, Wallin G. Labour pain treated with cutaneous injec-
tion of sterile water: a randomised controlled trial. British Journal of
Obstetrics and Gynaecology 1999;106:633–67.
McCrea 2000
McCrea H, Wright ME, Stringer M. Psychosocial factors influencing
personal control in pain relief. International Journal of Nursing Studies2000;37:493–503.
Ranta 1994
Ranta P, Jouppila P, Spalding M, Kangas-Saarela T, Hollmen A,
Joupilla R. Parturients’ assessment of waterblocks, pethidine, nitrous
oxide, paracervical and epidural blocks in labour. International Jour-
nal of Obstetric Anesthesia 1994;3:193–8.
RevMan 2003
. Review Manager (RevMan). 4.2 for Windows Edition. Oxford,
England: The Cochrane Collaboration, 2003.
Rowlands 1998
Rowlands S, Permezel M. Physiology of pain in labour. Bailliere’sClinical Obstetrics and Gynaecology 1998;12(3):347–62.
Russell 2000
Russell R. The effects of regional analgesia on the progress of labour
and delivery. British Journal of Anaesthesia 2000;84(6):799–12.
Smith 2003
Smith CA, Collins CT, Cyna AM, Crowther CA. Complementary
and alternative therapies for pain management in labour. In: TheCochrane Database of Systematic Reviews, 2, 2003.
Stride 1993
Stride PC, Cooper GM. Dural tap revisited: a 20 year survey from
Birmingham Maternity Hospital. Anaesthesia 1993;48(3):247–55.
Swanstrom 1981b
Swanstrom S, Bratteby LE. Metabolic effects of obstetric regional
analgesia and of asphyxia in the newborn infant during the first two
hours after birth. I. Arterial blood glucose concentrations. Acta Pae-
diatrica Scandinavica 1981;70:791–800.
Thornton 2001
Thornton JG. Reducing likelihood of instrumental delivery with
epidural anaesthesia. Lancet 2001;358(9275):2.
Vincent 1998
Vincent RD, Chestnut DH. Epidural analgesia during labour. Amer-
ican Family Physician 1998; 58(8):1785–92.
Walker 1997
Walker M. Do labour medications affect breastfeeding. Journal of
Human Lactation 1997;13(2):131–7.
References to other published versions of this review
Howell 1999
Howell CJ. Epidural vs non-epidural analgesia in labour. [revised
06 May 1994] In: Enkin MW, Keirse MJNC, Renfrew MJ, Neilson
JP, Crowther C (eds.) Pregnancy and Childbirth Module. In: The
Cochrane Pregnancy and Childbirth Database [database on disk and
CDROM]. The Cochrane Collaboration; Issue 2, Oxford: Update
Software; 1995. Cochrane Database of Systematic Reviews 1999;
(3).
∗Indicates the major publication for the study
T A B L E S
Characteristics of included studies
Study Bofill 1997
Methods Computer-generated list of random numbers were prepared by an uninvolved third party. Randomisation
was accomplished by selection of the next in a series of opaque, sealed envelopes.
All women were accounted for.
Intention-to-treat analysis was used.
Participants 100 women recruited (epidural n = 49, narcotics n = 51).
Eligibility: nulliparous women at 36-42 weeks’ gestation, in spontaneous labour (at least 4 cm dilated).
Exclusion: women with insulin dependant diabetes, chronic hypertension, PIH or twin pregnancy.
Interventions Epidural: preload given 500-1000 ml sodium lactate 0.25% bupivacaine +/- 50-100 mg fentanyl until
T10 sensory analgesia achieved, then continuous infusion 0.125% bupivacaine with 1.5 mg/ml fentanyl.
Continued in 2nd stage.
Narcotic: 1-2 mg Butophanol (1-2 hourly) IV.
Outcomes Maternal: pain scores measured hourly, length of 1st and 2nd stage of labour, oxytocin in labour, malposition,
amniotomy, nausea and vomiting, operative vaginal delivery, caesarean section, caesarean section for dystocia
and fetal distress.
15Epidural versus non-epidural or no analgesia in labour (Review)
Copyright ©2005 The Cochrane Collaboration. Published by John Wiley & Sons, Ltd

Characteristics of included studies (Continued )
Neonatal: Apgar scores (mean), arterial cord pH, naloxone administration.
Notes University of Mississippi, USA.
Active management of labour protocol. 33 of 39 operative vaginal deliveries in epidural group and 17 of 28
operative vaginal deliveries in opoid group were performed for purposes of resident training.
12 (24%) women randomised narcotic received epidural as well due to inadequate pain relief. 2 women
randomised epidural delivered before receiving it.
Trial carried out 1995-1996.
Allocation concealment A
Study Clark 1998
Methods Computer-generated, random-number tables, group assignments were placed in sealed, opaque, sequentially
numbered envelopes.
All women accounted for.
Intention-to-treat analysis used.
Participants 318 women recruited (epidural n = 156, meperidine n = 162).
Eligibility: nulliparous women in spontaneous labour (at least 50% cervical effacement or ruptured mem-
branes, at least 2 contractions every 15 minutes) at 36 weeks’ gestation or more, vertex presentation.
Exclusion: maternal or fetal conditions precluding trial of labour, thrombocytopenia or coagulation disorder,
or multiple pregnancy.
Interventions Epidural: IV fluid bolus of 1 litre normal saline solution following by placement of the epidural catheter
through the L2-3 or L3-4 interspace.
A test dose of 3 ml 1% lignocaine with epinephrine was administered, followed by 9 ml 0.25% bupivacaine
with 50 ug fentanyl in 3 divided doses at 10-minute intervals, if vital signs remained stable during the
subsequent 15 minutes, a continuous infusion of 0.125% bupivacaine with 1 ug/ml fentanyl was initiated
at 12 ml/h and titrated to maintain anaesthesia to the T10 dermatome level.
IV meperidine: 50 to 75 mg meperidine every 90 minutes as needed. These participants did not receive pre-
analgesic hydration.
Outcomes Maternal: oxytocin use, length of 1st and 2nd stages of labour, second stage labour, mode of delivery, caesarean
for dystocia, caesarean for fetal distress.
Neonatal: Apgar score at 5 minutes, meconium, umbilical cord pH/BE (arterial and venous), umbilical artery
pH < 7.15.
Notes University of Louisville Hospital, Kentucky, USA.
84 (52%) women in opioid group did not receive intervention (no reason given in paper), but received an
epidural. 9 women in epidural group did not receive intervention (5 inability to site catheter, 4 delivered
before epidural inserted). Trial carried out 1995-1996.
Allocation concealment A
Study Dickinson 2002
Methods Randomly selected from block group of sealed, opaque envelopes. Primary analysis: intention-to-treat analysis.
Secondary analysis of compliant participants only, randomisation stratification into spontaneous and induced
labour. All women accounted for.
Participants 992 women recruited (epidural n = 493, continuous midwifery support group n = 499). Eligibility: nulliparous
women at term with singleton cephalic presentation in spontaneous labour (cervix < 5 cm dilated) and
induced labour.
Interventions CSE: needle- through-needle approach. Preload 500-1000 ml crystalloids. Spinal block achieved with fentanyl
-25 micrograms and bupivacaine -2 mg. Following onset of analgesia epidural catheter dosed with 0.125%
bupivacaine -6 ml then participant controlled epidural analgesia till delivery with 0.1% bupivacaine and 2
micrograms of pethidine. 136 women did not receive epidural.
16Epidural versus non-epidural or no analgesia in labour (Review)
Copyright ©2005 The Cochrane Collaboration. Published by John Wiley & Sons, Ltd

Characteristics of included studies (Continued )
Continuous midwifery support group was 1:1 midwife participant ratio, IM pethidine, nitrous oxide inhala-
tion, TENS, and/or non-pharmacological forms of pain relief.
Outcomes Maternal: pain scores, caesarean section, duration of 1st and 2nd stages of labour. operative vaginal delivery,
vomiting, catheterisation during labour, fever (>37.5 degrees) and satisfaction with childbirth (median VAS);
breastfeeding reported on compliant participants only.
Neonatal: Apgar scores, cord pH.
Notes Australia.
137 (27%) women randomised to epidural received continuous midwifery support.
306 (62%) women randomised continuous midwifery support received epidural.
Allocation concealment A
Study Gambling 1998
Methods Computer-generated, in groups of 100, allocation was secured in a numbered and sealed envelope. Intention-
to-treat analysis used. All women accounted for.
Participants 1223 women recruited (epidural n = 616, meperidine = 607). Eligibility: nulliparous and parous women in
spontaneous labour (regular contractions, at least 3 cms dilated), singleton, cephalic presentation, cervix < 5
cm dilated.
Exclusion: pregnancy complication (not specified), more than 5 cm dilated, multiple pregnancy, non-cephalic
presentation.
Interventions CSE: preload with 500 ml sodium lactate. Catheter L2-3 or L3-4 interspace. Spinal block with 10 microgram
sufentanil in 2 ml normal saline. Needle-through-needle approach. Following dissipation of spinal analgesia,
epidural analgesia achieved with 0.25% bupivacaine in 3-5 ml increments to achieve T10-T8 sensory level.
This was followed by epidural infusion 0.125% bupivacaine and 2 microgram per ml fentanyl at 8 ml/h.
Rate of infusion halved during second stage of labour.
Meperidine group: 50 mg meperidine + 25 mg promethazine hydrochloride intravenously. Further 50 mg IV
meperidine on request hourly to a maximum of 200 mg in 4 hours. All women had IV fluid administration.
Outcomes Maternal: intrapartum visual analogue pain score and postpartum overall satisfaction with labour analgesia,
oxytocin, mode of delivery, hypotension, meconium, surgical amniotomy, motor block, fever, itch, operative
vaginal delivery.
Neonatal: Apgar score, birthweight, cord arterial pH.
Notes University of Texas, USA. Amniotomy routinely performed in active labour when fetal head is well applied to
cervix. Intrauterine pressure catheter used to assess adequacy of contraction if progress < 1 cm/h and oxytocin
augmentation employed if uterine pressure < 200 montevideo units.
216 (35%) women randomised epidural did not receive it (82 received meperidine, 52 declined any analgesia,
43 rapid delivery, 39 non-study drug used). For 255 (42%) women randomised meperidine: 102 received
epidural as well, 57 received epidural only, 42 declined any analgesia, 30 rapid delivery, 24 non-study drug
used.
Trial carried out 1994-1995.
Allocation concealment B
Study Grandjean 1979
Methods Random allocation by drawing lots. All women accounted for.
Participants 90 women recruited (epidural n = 30, phenoperidine n = 30, no analgesia n = 30).
Eligibility: women at 38-42 weeks’ gestation, para 1 or para 2 in spontaneous labour, at 4 cm dilatation with
no obstetric complications.
Interventions Epidural: preload not mentioned. Epidural delivery of 12 mL of 1.5% lidocaine in 1:20000 adrenaline.
Followed by top-ups of 6 ml lignocaine as needed.
17Epidural versus non-epidural or no analgesia in labour (Review)
Copyright ©2005 The Cochrane Collaboration. Published by John Wiley & Sons, Ltd

Characteristics of included studies (Continued )
Phenoperidine: intravenous injection of 1 mg followed by infusion of 34 micrograms per minute, with 3l/min
humidified oxygen intranasally.
Outcomes Maternal: mode of delivery, blood gases and pH.
Fetal/neonatal: fetal heart rate, Apgar scores, fetal blood pH and gases, umbilical artery pH.
Notes Toulouse, France.
Paper does not state if any women did not receive their allocated treatment.
Year trial carried out not stated.
Allocation concealment B
Study Head 2002
Methods Computer-generated block randomisation, stratified according to gestational age, (less than 35 weeks versus
35 weeks or longer). Numbered, sealed, opaque envelopes. Intention-to-treat analysis used. All women
accounted for.
Participants 116 women recruited (meperidine n = 60, epidural n = 56).
Eligibility: women > 24 weeks’ gestation with severe pre-eclampsia having singleton vertex presentation and
at least 2 cm dilated to 6 cm cervical dilatation.
Interventions Epidural: preload 250-500 ml sodium lactate over 20 minutes. Epidural catheter placed in L3-L4 interspace.
Test dose of 0.25% bupivacaine 3 ml, then incremental bolus doses of 3-5 ml 0.25% bupivacaine to obtain
T-10 sensory level, maintained by continuous infusion of 0.125% bupivacaine with 2 microgram fentanyl
at rate of 10 ml /hr.
Meperidine: PCA intravenous meperidine dose of 10 mg and lockout interval of 10 minutes. Maximum dose
of 240 mg in 6 hours also had IV promethazine 25 mg 4 hourly. All women received intravenous crystalloid
100 ml/h and magnesium sulphate 4 g bolus followed by infusion of 2 g/h till 24 hours postpartum.
Outcomes Maternal: intrapartum visual analogue pain score, mode of delivery, woman’s satisfaction with pain relief,
hypotension, headache, eclampsia, acute renal dysfunction.
Neonatal: Apgar scores, seizure, naloxone administration, neonatal intensive care admission, fetal heart rate
abnormalities. umbilical cord pH, birthweight.
Notes Alabama, USA.
42 women in the epidural group and 41 women, in control group received opioid prior to randomisation.
25 women in epidural group and 19 women in control group received hydralazine.
7 women did not receive their allocated treatment (5 from opioid group). 1 woman randomised opioid had
epidural as well.
1 woman randomised opioid had epidural instead.
Year trial carried out not stated.
Allocation concealment A
Study Hogg 2000
Methods “Randomized clinical trial”.
No further detail in abstract.
Intention-to-treat analysis used. All women accounted for.
Participants 105 women recruited (epidural n = 53, meperidine n = 52).
Eligibility: labouring women with severe pre-eclampsia at > 24 weeks’ gestation.
Interventions Epidural analgesia versus intravenous PCA with meperidine. No further information in abstract.
Outcomes Maternal: caesarean section, pain score, satisfaction score, maternal ephedrine administration.
Neonatal: naloxone administration, birthweight, cord pH, NICU admission, deaths.
Notes Alabama. Birmingham, USA.
8 of the 105 women did not receive assigned treatment due to rapid labour. 2 in the meperidine group
received epidural as well.
18Epidural versus non-epidural or no analgesia in labour (Review)
Copyright ©2005 The Cochrane Collaboration. Published by John Wiley & Sons, Ltd

Characteristics of included studies (Continued )
Year trial carried out not stated.
Allocation concealment B
Study Howell 2001
Methods Computer-generated randomisation at the time of request for pain relief. Intention-to-treat analysis used.
Outcome assessor for backache blinded. All women accounted for with the exception of backache (17% loss
to follow up at 26 months).
Participants 369 women recruited (epidural n = 184, non-epidural n = 185). Eligibility: labouring nulliparous women
at term with singleton pregnancy and cephalic presentation, with no contraindication to either forms of
analgesia.
Interventions Preload not stated. 10 ml of 0.25% bupivacaine. Followed by top-ups of 0.25% 5-10 ml as required. Pethidine:
50-100 mg intramuscular pethidine, repeated according to standard midwifery practice. Women in both
groups allowed to use Entonox.
Outcomes Maternal: mode of delivery, length of labour, use of oxytocin, maternal satisfaction with pain relief, back-
ache, postnatal depression, not feeling in control, drowsiness, concerns regarding pain relief, catheterisation
postdelivery, postnatal haemoglobin, maternal blood loss at delivery.
Fetal/neonatal: Apgar scores, umbilical cord pH.
Notes North Staffordshire, UK.
52 (28%) women randomised non-epidural received epidural. 61 (33%) women randomised epidural did
not receive it. Trial carried out 1992-1997.
Allocation concealment A
Study Jain 2003
Methods Randomisation with Tippets random number table into 3 groups. Allocation was concealed using sealed,
opaque envelopes (information obtained directly from trial authors). All women accounted for.
Participants 126 women recruited (epidural n = 43, meperidine n = 39, tramadol n = 44).
Eligibility: nulliparous women in spontaneous labour at > 36 weeks’ gestation with singleton pregnancy and
cephalic presentation.
Exclusion: cervical dilatation more than 5 cms, evidence of cephalic disproportion, utero placental insuffi-
ciency, any medical/surgical complications.
Interventions Preload not mentioned.
Test dose 0.25% bupivacaine with adrenaline 1:200 000. Followed by 10 ml bolus of 0.15% bupivacaine
and 30 micrograms fentanyl. If further analgesia required after 2 hrs same bolus given. If within 2 hrs the
fentanyl reduced to 15 micrograms, if > than 2 top-ups requested in 1 hr, a continuous infusion of 0.1%
bupivacaine and 1 microgram fentanyl per ml is commenced at rate of 10 ml /h.
Meperidine: 50-100 mg IM depending on maternal weight, repeated 4 hourly.
If analgesia requested in less than 4 hrs, 1 of above dose is given. each injection of meperidine is given with
25 mg promethazine. No meperidine is given after cervical dilatation of 8 cm.
Tramadol: intramuscular injection of 1 mg/kg weight and not exceeding 200 mg in 24 hrs.
Outcomes Maternal: mode of delivery, pain score, maternal satisfaction with pain relief, duration of 1st and 2nd stages
of labour, hypotension, urinary retention, respiratory depression, desire to use same pain relief in future.
Neonatal: Apgar score, cord pH, naloxone administration.
Notes Chandigarh, India.
All women received assigned allocation.
Year trial carried out not stated.
Allocation concealment A
19Epidural versus non-epidural or no analgesia in labour (Review)
Copyright ©2005 The Cochrane Collaboration. Published by John Wiley & Sons, Ltd
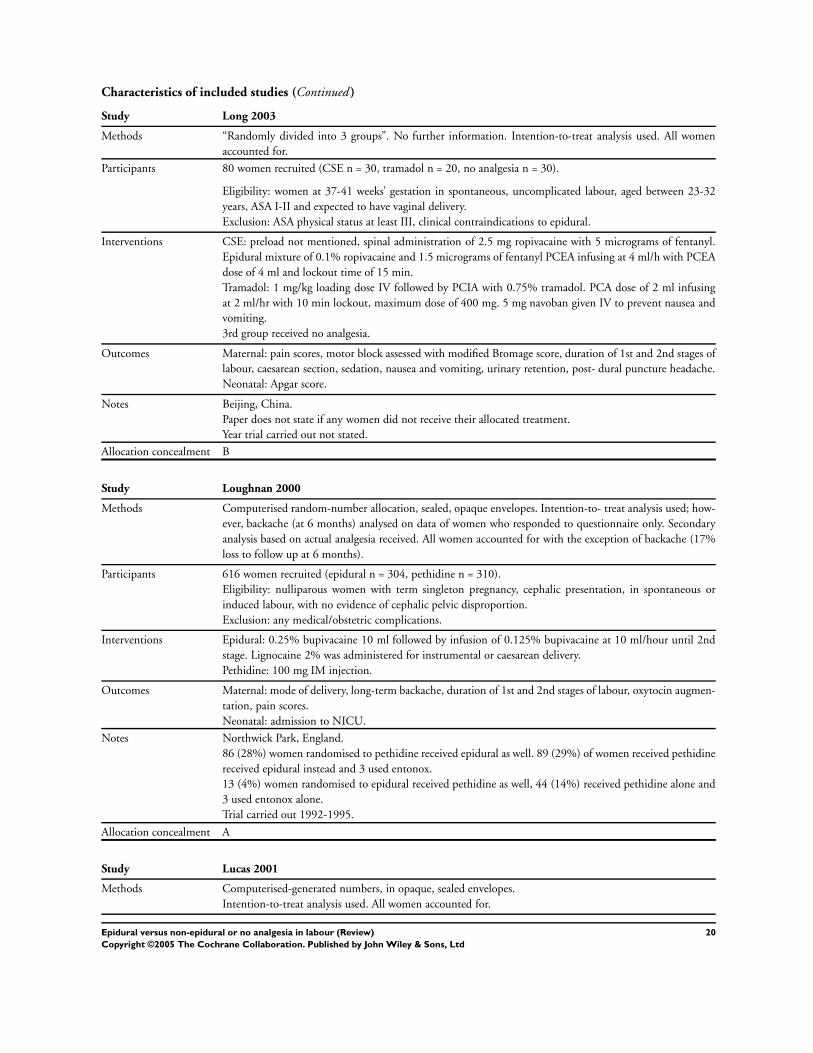
Characteristics of included studies (Continued )
Study Long 2003
Methods “Randomly divided into 3 groups”. No further information. Intention-to-treat analysis used. All women
accounted for.
Participants 80 women recruited (CSE n = 30, tramadol n = 20, no analgesia n = 30).
Eligibility: women at 37-41 weeks’ gestation in spontaneous, uncomplicated labour, aged between 23-32
years, ASA I-II and expected to have vaginal delivery.
Exclusion: ASA physical status at least III, clinical contraindications to epidural.
Interventions CSE: preload not mentioned, spinal administration of 2.5 mg ropivacaine with 5 micrograms of fentanyl.
Epidural mixture of 0.1% ropivacaine and 1.5 micrograms of fentanyl PCEA infusing at 4 ml/h with PCEA
dose of 4 ml and lockout time of 15 min.
Tramadol: 1 mg/kg loading dose IV followed by PCIA with 0.75% tramadol. PCA dose of 2 ml infusing
at 2 ml/hr with 10 min lockout, maximum dose of 400 mg. 5 mg navoban given IV to prevent nausea and
vomiting.
3rd group received no analgesia.
Outcomes Maternal: pain scores, motor block assessed with modified Bromage score, duration of 1st and 2nd stages of
labour, caesarean section, sedation, nausea and vomiting, urinary retention, post- dural puncture headache.
Neonatal: Apgar score.
Notes Beijing, China.
Paper does not state if any women did not receive their allocated treatment.
Year trial carried out not stated.
Allocation concealment B
Study Loughnan 2000
Methods Computerised random-number allocation, sealed, opaque envelopes. Intention-to- treat analysis used; how-
ever, backache (at 6 months) analysed on data of women who responded to questionnaire only. Secondary
analysis based on actual analgesia received. All women accounted for with the exception of backache (17%
loss to follow up at 6 months).
Participants 616 women recruited (epidural n = 304, pethidine n = 310).
Eligibility: nulliparous women with term singleton pregnancy, cephalic presentation, in spontaneous or
induced labour, with no evidence of cephalic pelvic disproportion.
Exclusion: any medical/obstetric complications.
Interventions Epidural: 0.25% bupivacaine 10 ml followed by infusion of 0.125% bupivacaine at 10 ml/hour until 2nd
stage. Lignocaine 2% was administered for instrumental or caesarean delivery.
Pethidine: 100 mg IM injection.
Outcomes Maternal: mode of delivery, long-term backache, duration of 1st and 2nd stages of labour, oxytocin augmen-
tation, pain scores.
Neonatal: admission to NICU.
Notes Northwick Park, England.
86 (28%) women randomised to pethidine received epidural as well. 89 (29%) of women received pethidine
received epidural instead and 3 used entonox.
13 (4%) women randomised to epidural received pethidine as well, 44 (14%) received pethidine alone and
3 used entonox alone.
Trial carried out 1992-1995.
Allocation concealment A
Study Lucas 2001
Methods Computerised-generated numbers, in opaque, sealed envelopes.
Intention-to-treat analysis used. All women accounted for.
20Epidural versus non-epidural or no analgesia in labour (Review)
Copyright ©2005 The Cochrane Collaboration. Published by John Wiley & Sons, Ltd

Characteristics of included studies (Continued )
Participants 738 women randomised (epidural n = 372, meperidine PCIA n = 366).
Eligibility: parous and nulliparous women with pregnancy induced hypertension (diastolic at least 90 mmHg)
in spontaneous or induced labour. 20 women in the epidural group and 18 in the control group had gestation
< 36 weeks.
Exclusion: chronic hypertension, or received any analgesia/sedation prior.
Interventions Epidural: preload with 500 ml sodium lactate. Epidural analgesia achieved with boluses of 0.25% bupivacaine
to T10 level of sensory analgesia, followed by continuous infusion of 0.125% bupivacaine with 2 mg/ml of
fentanyl titrated to maintain analgesia.
Meperidine: IV bolus of 50 mg meperidine with 25 mg promethazine followed by PCA infusion up to 15
mg every 10 minutes.
All women received a loading dose of intramuscular magnesium sulphate 10 g and maintenance dose of 5 g
every 4 hr to prevent eclampsia.
Outcomes Maternal: duration of 1st and 2nd stages of labour, hypotension, fever, oxytocin augmentation, mode of
delivery, ephedrine use, pulmonary oedema, postpartum oliguria, postpartum weight loss.
Neonatal: Apgar scores, umbilical artery pH, naloxone administration, birthweight, NICU, ventilation/24
hrs.
Notes Texas, USA.
3 women in each group required additional analgesia.
Trial carried out 1996-1998.
Allocation concealment A
Study Morgan-Ortiz 1999
Methods “Randomised into 2 groups”, no further information given. Intention-to-treat analysis used.
Participants 129 women recruited (epidural n = 69, no analgesia n = 63).
Eligibility: primiparous women in ’beginning of active phase of labour’.
Interventions Epidural bupivacaine versus no analgesia. No further information in abstract.
Outcomes Maternal: duration of 1st and 2nd stages of labour, pain scores.
Neonatal: Apgar scores, Silverman score.
Notes Sinaloa, Mexico.
Paper does not state if any women did not receive their allocated treatment.
Trial carried out 1997-1998.
Allocation concealment B
Study Muir 1996
Methods Women “prospectively randomised”, no further information given.
Participants 50 women recruited (epidural n = 28, meperidine n = 22).
Eligibility: uncomplicated primiparous women in spontaneous labour.
Interventions Epidural method: preload not stated.
Bupivacaine 0.125% with adrenaline, 10-15 ml, plus pethidine 25 mg, followed by PCA (bupivacaine
0.125% with adrenaline plus pethidine 0.5 mg/ml, 4 ml boluses, lockout 15 minutes).
Second stage: epidural use not stated.
Control method: intravenous pethidine by PCA pump (up to 1 mg/Kg loading dose, followed by 10 mg
boluses, lockout 10 minutes.
Outcomes Maternal: pain scores, motor and sensory block, duration of labour, cervical dilation, use of oxytocin, mode
of delivery, maternal satisfaction, temperature.
Neonatal: Apgar score, cord pH < 7.15 (epidural 1/28, control 2/22) and NACS score at 2 and 24 hrs.
Notes Canada.
11 (50%) women randomised to meperidine received epidural.
21Epidural versus non-epidural or no analgesia in labour (Review)
Copyright ©2005 The Cochrane Collaboration. Published by John Wiley & Sons, Ltd

Characteristics of included studies (Continued )
An additional 3 women were enrolled into the trial, all were excluded for technical or equipment failures
(group not stated).
Year trial carried out not stated.
Allocation concealment B
Study Muir 2000
Methods Participants randomly assigned to receive PCEA or PCIA. Computer-generated random number system
concealed in consecutively numbered sealed, opaque envelopes (further information was obtained directly
from trial authors).
Intention-to-treat analysis was used. All women accounted.
Participants 185 women recruited (epidural = 97, IV fentanyl = 88).
Eligibility: healthy, nulliparous, spontaneous labour, requesting analgesia.
Exclusions: any condition known to increase incidence of operative delivery.
Interventions Epidural: 0.08% bupivacaine + 1.67 mcg/ml fentanyl - loading dose of 10-15 ml followed by 5 ml every 10
minutes prn.
IV fentanyl - loading dose of 1-2 ug followed by 50 ug every 10 minutes PRN.
Outcomes Maternal: pain scores, satisfaction with analgesia, need for further analgesia, duration of analgesia, caesarean
section rate.
Infant: Apgar scores, NICU admission, cord pH, neuro adaptive scores, cord fentanyl levels,
Notes Canada. Multicentre trial. 18 (20%) women in the IV fentanyl group received an epidural also.
Year trial carried out not stated.
Allocation concealment A
Study Nikkola 1997
Methods “Randomised” method not specified.
Intention-to-treat analysis used. All women were accounted for.
Participants 20 women recruited (epidural n = 10, fentanyl n = 10).
Healthy primigravidas, aged 20-35 years.
Exclusion: complications of pregnancy, regular use of drugs and chronic disease.
Interventions Epidural: preload unknown.
6 ml 0.5% bupivacaine initially. Intermittent top-ups with 4 ml (only 1st stage).
IV narcotic: fentanyl 50 mg initially. PCA delivered. 20 mg boluses (only 1st stage).
Outcomes Maternal: visual analogue pain score, side-effects, length of labour after analgesia, mode of delivery, heart
rate, oxygen saturation.
Fetal/neonatal: CTG variability, Apgar score, cord pH arterial and venous, Amiel-Tison’s neurological score,
birthweight.
Notes Finland.
4 (40%) women randomised to fentanyl received epidural as well.
Allocation concealment B
Study Philipsen 1989
Methods “Randomly assigned by random numbers, contained in sealed, consecutively opened envelopes”.
One woman in non-epidural group lost to follow up. Intention-to-treat analysis used.
Participants 112 women recruited (epidural n = 57, pethidine n = 55).
Eligibility: 37-42 weeks’ gestation, no medical/obstetric abnormality, in early spontaneous labour, no scars
on uterus, 104/112 primiparous.
22Epidural versus non-epidural or no analgesia in labour (Review)
Copyright ©2005 The Cochrane Collaboration. Published by John Wiley & Sons, Ltd

Characteristics of included studies (Continued )
Interventions Epidural method: preload given. Bupivacaine 0.375% (1 ml per 10 kg) by intermittent top-up. T10-L1
block.
Second stage: epidural use discontinued.
Control method: pethidine 75 mg IM (x 1-2), nitrous oxide/oxygen inhalation, or pudendal block (20 ml
mepivacaine) in second stage.
Outcomes Maternal: pain, hypotension, nausea and vomiting, urinary retention, sleepiness, motor blockade, length of
first stage of labour, duration of second stage of labour, position of fetal head at delivery, mode of delivery,
maternal memory of labour.
Fetal/ neonatal: fetal heart rate abnormality, Apgar score (median (range), at 1 min: epidural 10 (4-10)
n = 57; control 9 (4-10) n = 54; at 5 min: epidural 10 (8-10) n = 57; control 10 (7-10) n = 54), cord
venous pH (median (range): epidural 7.23 (7.0-7.4) n = 57; control 7.23 (7.0-7.4) n = 54), neurobehavioral
abnormalities.
Notes Denmark.
9 (16%) women randomised epidural and 29 (53%) women randomised pethidine had entonox also. Year
trial carried out not stated.
Allocation concealment B
Study Sharma 1997
Methods Randomised sequence was computer derived in blocks of 20, with numbered, opaque sealed envelopes.
Intention-to-treat analysis used. All women accounted for.
Participants 715 women recruited (epidural n = 358, IV meperidine analgesia n = 357).
Eligibility: mixed parity women in spontaneous labour at term.
Interventions Epidural: preload given.
Continuous infusion with 0.125% bupivacaine with 2 ug/ml fentanyl. 68% complied with protocol.
IV narcotic: PCA with meperidine. Additional doses given on request.
Outcomes Maternal: visual analogue pain scores, length of labour, oxytocin augmentation, fever > 38 degrees centigrade,
mode of delivery.
Fetal/ neonatal: meconium in labour, non reassuring CTG, Apgar scores, cord pH, naloxone, NICU.
Notes Texas, USA.
8 (2%) women randomised epidural received meperidine instead.
5 (1%) women randomised meperidine received epidural as well.
Trial carried out 1995-1996.
Allocation concealment A
Study Sharma 2002
Methods Computer-generated randomisation numbers in opaque, sealed envelopes.
Intention-to-treat analysis used. All women accounted for.
Participants 459 women recruited (epidural n = 226, meperidine n = 233).
Eligibility: nulliparous, singleton, at term, spontaneous labour, cephalic presentation.
Interventions Epidural: preload given 500 ml sodium lactate. Test dose of 3 ml of 1% lidocaine with epinephrine, then
0.25% bupivacaine in 3 ml increments till T-10 sensory level analgesia. Then infusion of 0.0625% bupiva-
caine with 2 microgram/ml fentanyl at 6 ml/h with 5 ml boluses every 15 min prn using PCA pump.
Meperidine: 50 mg IV with 25 mg promethazine followed by PCA pump delivering 15 mg meperidine every
15 min until delivery. Additional 25 mg are given on request, maximum of 100 mg in 2 hr.
Outcomes Maternal: fever, hypotension, oxytocin augmentation, instrumental delivery
Infant: Apgar scores, umbilical artery pH, fetal heart abnormalities, birthweight.
Notes Texas, USA.
23Epidural versus non-epidural or no analgesia in labour (Review)
Copyright ©2005 The Cochrane Collaboration. Published by John Wiley & Sons, Ltd
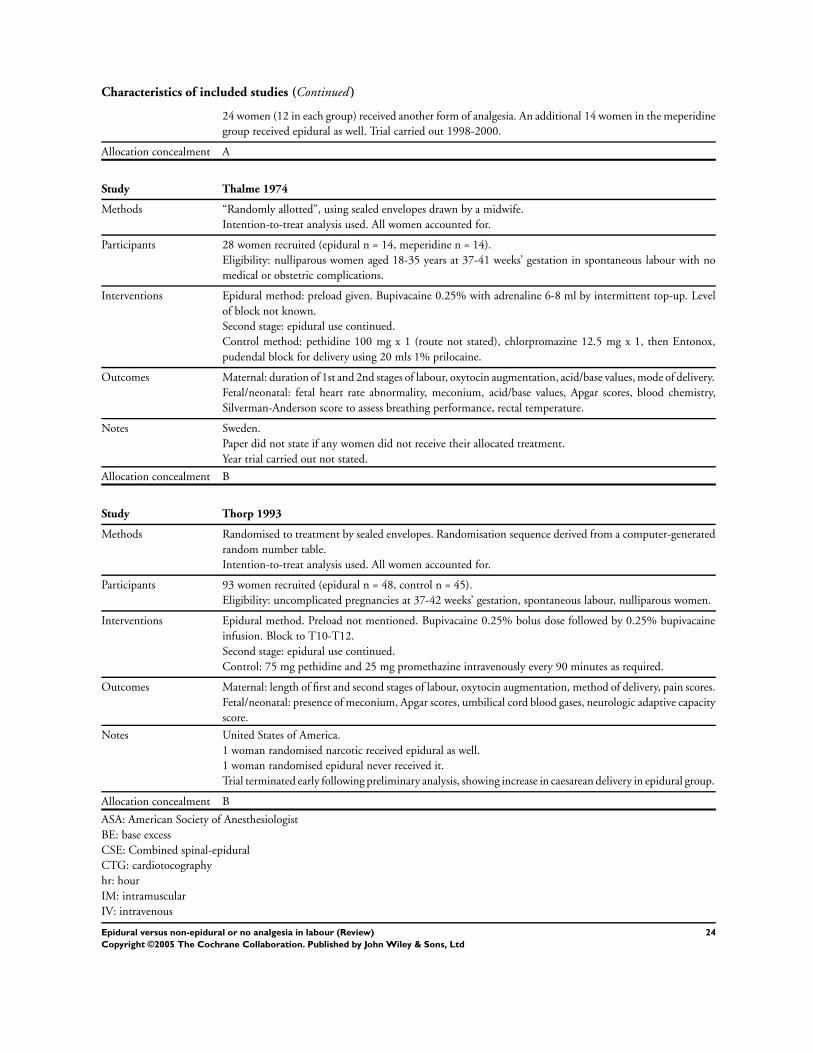
Characteristics of included studies (Continued )
24 women (12 in each group) received another form of analgesia. An additional 14 women in the meperidine
group received epidural as well. Trial carried out 1998-2000.
Allocation concealment A
Study Thalme 1974
Methods “Randomly allotted”, using sealed envelopes drawn by a midwife.
Intention-to-treat analysis used. All women accounted for.
Participants 28 women recruited (epidural n = 14, meperidine n = 14).
Eligibility: nulliparous women aged 18-35 years at 37-41 weeks’ gestation in spontaneous labour with no
medical or obstetric complications.
Interventions Epidural method: preload given. Bupivacaine 0.25% with adrenaline 6-8 ml by intermittent top-up. Level
of block not known.
Second stage: epidural use continued.
Control method: pethidine 100 mg x 1 (route not stated), chlorpromazine 12.5 mg x 1, then Entonox,
pudendal block for delivery using 20 mls 1% prilocaine.
Outcomes Maternal: duration of 1st and 2nd stages of labour, oxytocin augmentation, acid/base values, mode of delivery.
Fetal/neonatal: fetal heart rate abnormality, meconium, acid/base values, Apgar scores, blood chemistry,
Silverman-Anderson score to assess breathing performance, rectal temperature.
Notes Sweden.
Paper did not state if any women did not receive their allocated treatment.
Year trial carried out not stated.
Allocation concealment B
Study Thorp 1993
Methods Randomised to treatment by sealed envelopes. Randomisation sequence derived from a computer-generated
random number table.
Intention-to-treat analysis used. All women accounted for.
Participants 93 women recruited (epidural n = 48, control n = 45).
Eligibility: uncomplicated pregnancies at 37-42 weeks’ gestation, spontaneous labour, nulliparous women.
Interventions Epidural method. Preload not mentioned. Bupivacaine 0.25% bolus dose followed by 0.25% bupivacaine
infusion. Block to T10-T12.
Second stage: epidural use continued.
Control: 75 mg pethidine and 25 mg promethazine intravenously every 90 minutes as required.
Outcomes Maternal: length of first and second stages of labour, oxytocin augmentation, method of delivery, pain scores.
Fetal/neonatal: presence of meconium, Apgar scores, umbilical cord blood gases, neurologic adaptive capacity
score.
Notes United States of America.
1 woman randomised narcotic received epidural as well.
1 woman randomised epidural never received it.
Trial terminated early following preliminary analysis, showing increase in caesarean delivery in epidural group.
Allocation concealment B
ASA: American Society of Anesthesiologist
BE: base excess
CSE: Combined spinal-epidural
CTG: cardiotocography
hr: hour
IM: intramuscular
IV: intravenous
24Epidural versus non-epidural or no analgesia in labour (Review)
Copyright ©2005 The Cochrane Collaboration. Published by John Wiley & Sons, Ltd

Characteristics of included studies (Continued )
NACS: Neurological Adaptive Capacity Score
NICU: neonatal intensive care unit
PCA: participant-controlled analgesia
PCEA: participant-controlled epidural analgesia
PCIA: participant-controlled intravenous analgesia
PIH: pregnancy-induced hypertension
PRN: when required
TENS: transcutaneous electrical nerve stimulation
VAS: visual analogue scores
Characteristics of excluded studies
Abboud 1982 This study was designed to assess the effect on beta-endorphin levels, of momentarily withholding local anaesthetic
after insertion of the catheter into the epidural space.
Buchan 1973 Excluded because the method of randomisation was not adequate (alternate allocation). Epidural bupivacaine (n =
10) compared with intramuscular pethidine (n = 10). Outcomes include corticosteroid levels and mode of delivery.
Ginosar 2002 Excluded because all women received epidural bupivacaine till pain free (n = 48) then to randomised to IV fentanyl
or epidural fentanyl.
Hood 1993 Excluded because both experiment and control group had regional procedure although saline was control. This
study compared epidural bupivacaine (n = 14) with epidural saline (9 = 14) for 60 minutes after insertion of the
epidural catheter. The outcome of interest was fetal heart rate changes.
Jouppila 1976 Excluded because the method of randomisation was not adequate (alternate allocation). Epidural bupivacaine (n
= 14) compared with intramuscular pethidine (n = 14). Outcomes include duration of labour, growth hormone,
insulin, fetal/infant outcomes and mode of delivery.
Jouppila 1980 Excluded because the method of randomisation was not adequate (alternate allocation). Epidural bupivacaine (n =
8) compared with intramuscular pethidine (n = 10). Outcomes include duration of labour, prolactin, fetal/infant
outcomes and mode of delivery.
Justins 1983 Excluded because all participants were given epidural test dose followed by either intramuscular fentanyl or epidural
fentanyl. Outcomes included duration of analgesia, hypotension, itching, bladder dysfunction and neonatal Apgar
scores in correlation with plasma fentanyl concentration.
Kurjak 1974 Quasi-randomised.
Epidural bupivacaine n = 224, control group n = 224 (conventional analgesia). Most participants in the control
group had pethidine 150 mg /4 h. The rest had nitrous oxide or no analgesia. Outcomes include maternal and
umbilical arterial blood acid-base status, fetal heart rate changes, fetal blood pH, Apgar scores
Lassner 1981 Excluded because study compared epidural morphine (n = 13) with epidural saline (n = 12), with both groups
receiving epidural bupivacaine at some stage in labour.
Leong 2000 Not RCT. All participants were offered epidural analgesia in labour and those who accepted formed the epidural
group (n = 55), those who declined epidural analgesia were controls (n= 68). Outcomes included duration of labour,
oxytocin augmentation and mode of delivery.
MacKenzie 1996 All participants had epidural bupivacaine in labour prior to randomisation to continuous infusion of epidural
bupivacaine and fentanyl (n = 7) or intravenous fentanyl (n = 6). Outcomes included fentanyl concentration in
maternal and cord blood.
McGrath 1992 The study randomised participants to epidural analgesia or nalbuphine intravenously with the intention of providing
all women with epidural analgesia later in labour. The outcome of interest was fetal heart rate changes in the first
hour after randomisation.
Neri 1986 Quasi-randomised (information from authors) n = 104.
25Epidural versus non-epidural or no analgesia in labour (Review)
Copyright ©2005 The Cochrane Collaboration. Published by John Wiley & Sons, Ltd

Characteristics of excluded studies (Continued )
This study compared epidural analgesia ( n = 52) with apresoline and magnesium sulphate ( (n = 52) in the
management of women with pre-eclampsia. Outcomes include change in blood pressure, mode of delivery, Apgar
scores, neonatal jaundice and respiratory depression at birth.
Noble 1971 Excluded because the method of randomisation was not adequate (allocation by case record number). Epidural
bupivacaine (n = 125) compared with intramuscular pethidine (n = 120). Outcomes include duration of labour,
maternal hypotension, fetal/infant outcomes and mode of delivery.
Revill 1979 Excluded because more than 28% of women excluded from analysis. Out of 386 randomised only 132 completed
interviews in their allocated groups. Outcomes include pain scores, satisfaction with analgesia, and concerns of
analgesic effects on the baby.
Robinson 1980 Excluded because more than 30% of women excluded from analysis. Out of approximately 300 women initially
randomised at antenatal visit into the 2 groups, only 93 completed the interviews having used only the analgesic
allocated to them. The large proportion excluded compromises the reliability of the results.
Epidural bupivacaine (n = 45) was compared with intramuscular pethidine (n = 48). Outcomes include duration
of labour, mode of delivery and maternal pain/discomfort, nausea, sleepiness, backache, satisfaction and worry over
baby.
Robinson 1997 Intention-to-treat analysis not used. 153 participants randomly allocated to low extra-dural analgesia with 0.125%
bupivacaine with 50 ug fentanyl followed by 0.1% bupivacaine with 2 ug/ml fentanyl top-ups (n = 89), and IM
pethidine 100 mg (n = 64).
Outcomes were pain relief scores, mode of delivery, duration of 1st and 2nd stages of labour.
Ryhanen 1984 Excluded because the method of randomisation was not adequate (alternate allocation). Epidural bupivacaine (n =
5) compared with intramuscular pethidine (n = 5). Outcomes include duration of labour, plasma leukocyte counts,
fetal/infant outcomes.
Swanstrom 1981 Quasi-randomised (running order). 80 women. Epidural n = 37, paracervical n = 16,control group n = 27( further
data from authors). Outcomes include duration of 1st and 2nd stages of labour, oxytocin augmentation, Apgar
scores, neonatal jaundice, neurological outcomes at 6/18 months.
Zakowski 1994 Excluded because compared epidural morphine to IV morphine postoperative analgesia in women who had elective
caesarean delivery. All participants had received epidural lidocaine preoperatively, epidural morphine (n = 8) IV
morphine (n = 8). Outcomes were plasma and urinary morphine concentration.
h: hours
IM: intramuscular
IV: intravenous
RCT: randomised controlled trial
G R A P H S
Comparison 01. Epidural versus non-epidural analgesia in labour
Outcome titleNo. of
studies
No. of
participants Statistical method Effect size
01 Woman’s perception of pain
relief in labour
1 105 Weighted Mean Difference (Fixed) 95% CI -2.60 [-3.82, -1.38]
02 Instrumental delivery 17 6162 Relative Risk (Fixed) 95% CI 1.38 [1.24, 1.53]
03 Caesarean section 20 6534 Relative Risk (Fixed) 95% CI 1.07 [0.93, 1.23]
04 Apgar score less than 7 at 5
minutes
14 5363 Relative Risk (Fixed) 95% CI 0.70 [0.44, 1.10]
05 Maternal satisfaction with pain
relief in labour
5 1940 Relative Risk (Random) 95% CI 1.18 [0.92, 1.50]
06 Long-term backache 2 814 Relative Risk (Fixed) 95% CI 1.00 [0.89, 1.12]
07 Length of first stage of labour
(minutes)
9 2328 Weighted Mean Difference (Random) 95% CI 23.81 [-18.89,
66.51]
26Epidural versus non-epidural or no analgesia in labour (Review)
Copyright ©2005 The Cochrane Collaboration. Published by John Wiley & Sons, Ltd
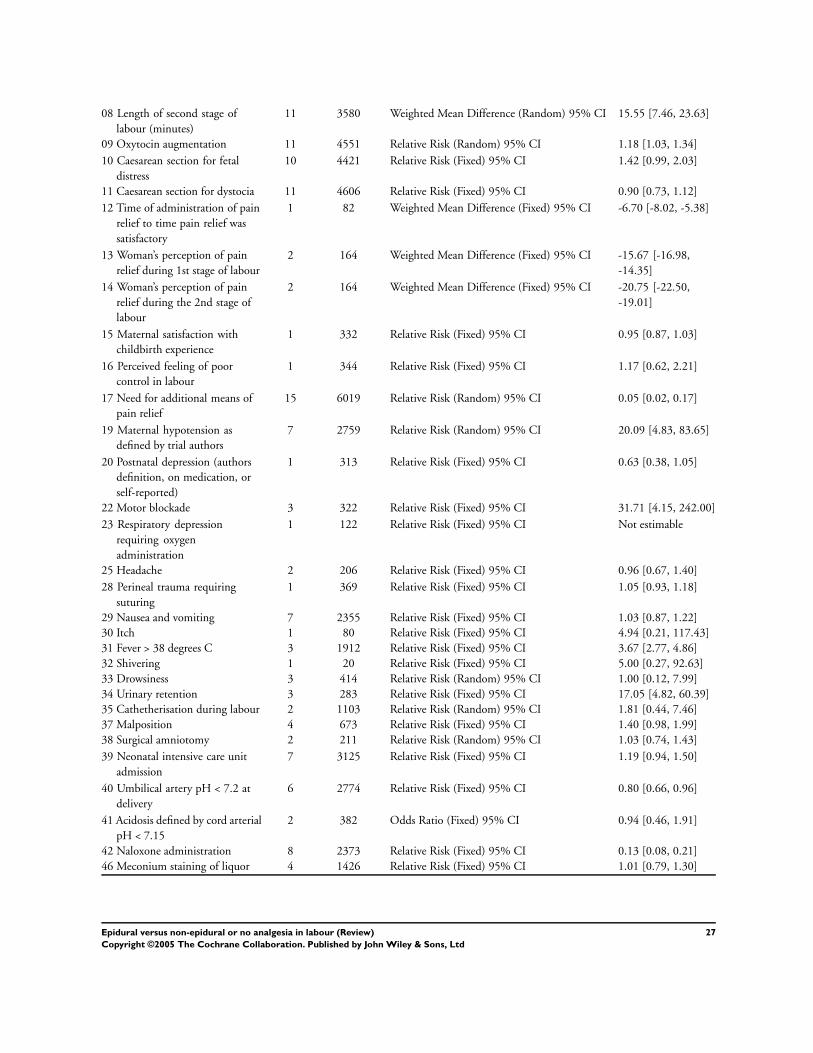
08 Length of second stage of
labour (minutes)
11 3580 Weighted Mean Difference (Random) 95% CI 15.55 [7.46, 23.63]
09 Oxytocin augmentation 11 4551 Relative Risk (Random) 95% CI 1.18 [1.03, 1.34]
10 Caesarean section for fetal
distress
10 4421 Relative Risk (Fixed) 95% CI 1.42 [0.99, 2.03]
11 Caesarean section for dystocia 11 4606 Relative Risk (Fixed) 95% CI 0.90 [0.73, 1.12]
12 Time of administration of pain
relief to time pain relief was
satisfactory
1 82 Weighted Mean Difference (Fixed) 95% CI -6.70 [-8.02, -5.38]
13 Woman’s perception of pain
relief during 1st stage of labour
2 164 Weighted Mean Difference (Fixed) 95% CI -15.67 [-16.98,
-14.35]
14 Woman’s perception of pain
relief during the 2nd stage of
labour
2 164 Weighted Mean Difference (Fixed) 95% CI -20.75 [-22.50,
-19.01]
15 Maternal satisfaction with
childbirth experience
1 332 Relative Risk (Fixed) 95% CI 0.95 [0.87, 1.03]
16 Perceived feeling of poor
control in labour
1 344 Relative Risk (Fixed) 95% CI 1.17 [0.62, 2.21]
17 Need for additional means of
pain relief
15 6019 Relative Risk (Random) 95% CI 0.05 [0.02, 0.17]
19 Maternal hypotension as
defined by trial authors
7 2759 Relative Risk (Random) 95% CI 20.09 [4.83, 83.65]
20 Postnatal depression (authors
definition, on medication, or
self-reported)
1 313 Relative Risk (Fixed) 95% CI 0.63 [0.38, 1.05]
22 Motor blockade 3 322 Relative Risk (Fixed) 95% CI 31.71 [4.15, 242.00]
23 Respiratory depression
requiring oxygen
administration
1 122 Relative Risk (Fixed) 95% CI Not estimable
25 Headache 2 206 Relative Risk (Fixed) 95% CI 0.96 [0.67, 1.40]
28 Perineal trauma requiring
suturing
1 369 Relative Risk (Fixed) 95% CI 1.05 [0.93, 1.18]
29 Nausea and vomiting 7 2355 Relative Risk (Fixed) 95% CI 1.03 [0.87, 1.22]
30 Itch 1 80 Relative Risk (Fixed) 95% CI 4.94 [0.21, 117.43]
31 Fever > 38 degrees C 3 1912 Relative Risk (Fixed) 95% CI 3.67 [2.77, 4.86]
32 Shivering 1 20 Relative Risk (Fixed) 95% CI 5.00 [0.27, 92.63]
33 Drowsiness 3 414 Relative Risk (Random) 95% CI 1.00 [0.12, 7.99]
34 Urinary retention 3 283 Relative Risk (Fixed) 95% CI 17.05 [4.82, 60.39]
35 Cathetherisation during labour 2 1103 Relative Risk (Random) 95% CI 1.81 [0.44, 7.46]
37 Malposition 4 673 Relative Risk (Fixed) 95% CI 1.40 [0.98, 1.99]
38 Surgical amniotomy 2 211 Relative Risk (Random) 95% CI 1.03 [0.74, 1.43]
39 Neonatal intensive care unit
admission
7 3125 Relative Risk (Fixed) 95% CI 1.19 [0.94, 1.50]
40 Umbilical artery pH < 7.2 at
delivery
6 2774 Relative Risk (Fixed) 95% CI 0.80 [0.66, 0.96]
41 Acidosis defined by cord arterial
pH < 7.15
2 382 Odds Ratio (Fixed) 95% CI 0.94 [0.46, 1.91]
42 Naloxone administration 8 2373 Relative Risk (Fixed) 95% CI 0.13 [0.08, 0.21]
46 Meconium staining of liquor 4 1426 Relative Risk (Fixed) 95% CI 1.01 [0.79, 1.30]
27Epidural versus non-epidural or no analgesia in labour (Review)
Copyright ©2005 The Cochrane Collaboration. Published by John Wiley & Sons, Ltd

Comparison 02. Epidural versus non-epidural analgesia for pain relief in labour (primary outcomes by year trial
was performed
Outcome titleNo. of
studies
No. of
participants Statistical method Effect size
01 Instrumental vaginal delivery 17 6162 Relative Risk (Fixed) 95% CI 1.38 [1.24, 1.53]
02 Caesarean section 20 6534 Relative Risk (Fixed) 95% CI 1.07 [0.93, 1.23]
03 Apgar score less than 7 at 5
minutes
14 5363 Odds Ratio (Fixed) 95% CI 0.69 [0.43, 1.11]
Comparison 03. Analysis of primary outcomes excluding trials where more than 30% of women did not receive
their allocation
Outcome titleNo. of
studies
No. of
participants Statistical method Effect size
01 Instrumental delivery 12 4168 Relative Risk (Fixed) 95% CI 1.66 [1.41, 1.94]
02 Caesarean section 14 4355 Relative Risk (Fixed) 95% CI 1.09 [0.91, 1.31]
03 Apgar score less than 7 at 5
minutes
10 3983 Relative Risk (Fixed) 95% CI 0.56 [0.31, 1.01]
04 Maternal satisfaction with pain
relief in labour
3 923 Relative Risk (Random) 95% CI 1.23 [0.97, 1.55]
05 Long-term backache 1 306 Relative Risk (Fixed) 95% CI 1.05 [0.92, 1.20]
Comparison 04. Sensitivity analysis of primary outcomes based on trial quality
Outcome titleNo. of
studies
No. of
participants Statistical method Effect size
01 Woman’s perception of pain
relief in labour
0 0 Weighted Mean Difference (Fixed) 95% CI Not estimable
02 Instrumental delivery 10 4547 Relative Risk (Random) 95% CI 1.47 [1.21, 1.78]
03 Caesarean section 11 4734 Relative Risk (Fixed) 95% CI 1.02 [0.88, 1.19]
04 Apgar score less than 7 at 5
minutes
8 3807 Relative Risk (Fixed) 95% CI 0.72 [0.45, 1.18]
05 Women satisfied with pain
relief
4 1920 Relative Risk (Random) 95% CI 1.17 [0.89, 1.52]
Comparison 05. Subgoup analysis based on epidural technique (epidural without spinal compared to CSE)
Outcome titleNo. of
studies
No. of
participants Statistical method Effect size
01 Instrumental delivery 17 6162 Relative Risk (Fixed) 95% CI 1.38 [1.24, 1.53]
02 Caesarean section 19 6165 Relative Risk (Fixed) 95% CI 1.09 [0.94, 1.25]
03 Apgar score less than 7 at 5
minutes
14 5363 Relative Risk (Fixed) 95% CI 0.70 [0.44, 1.10]
04 Women satisfied with their
pain relief
5 1940 Relative Risk (Random) 95% CI 1.18 [0.92, 1.50]
I N D E X T E R M S
Medical Subject Headings (MeSH)
Analgesia, Epidural; Analgesia, Obstetrical; Delivery, Obstetric; Labor, Obstetric; Pain; Risk
28Epidural versus non-epidural or no analgesia in labour (Review)
Copyright ©2005 The Cochrane Collaboration. Published by John Wiley & Sons, Ltd

Medical MeSH check words
Female; Humans; Pregnancy
C O V E R S H E E T
Title Epidural versus non-epidural or no analgesia in labour
Authors Anim-Somuah M, Smyth R, Howell C
Contribution of author(s) C Howell (CH) prepared the first version of the review. M Anim-Somuah (MA) is respon-
sible for this current update. MA and R Smyth (RS) updated the Background and Methods
sections, assessed new studies for inclusion and extracted all the data independently. MA
entered the data into RevMan and RS double checked them. MA and RS interpreted the
results individually and together wrote the Results, Discussion and Conclusions. CH com-
mented on the revised version.
Issue protocol first published 1996/2
Review first published 1998/1
Date of most recent amendment 24 August 2005
Date of most recent
SUBSTANTIVE amendment
16 August 2005
What’s New August 2005
Title changed to ’Epidural versus non-epidural or no analgesia in labour’ in order to reflect
the changes in clinical practice.
New search conducted in June 2005, as a result of which this update includes 12 new studies
(Dickinson 2002; Hogg 2000; Gambling 1998; Grandjean 1979; Head 2002; Howell
2001; Jain 2003; Long 2003; Lucas 2001; Morgan-Ortiz 1999; Muir 2000; Sharma 2002).
Swanstrom 1981 which was included in the previous version has now been excluded and
Ramin 1995 included in the previous version is awaiting further assessment.
Trials comparing all modalities of epidural (including combined-spinal-epidural) to non-
regional analgesia or no pain relief were included.
New outcomes added to this update include maternal satisfaction with pain relief, maternal
satisfaction with childbirth, breastfeeding, mother-baby bonding, some rare but serious po-
tential adverse effects of epidural analgesia, long-term neonatal complications and economic
outcomes. We performed sensitivity analysis based on excluding trials with more than 30%
of women not receiving allocated analgesia or received another form of analgesia in addition
(primary outcomes only). We performed additional subgroup analyses.
Date new studies sought but
none found
Information not supplied by author
Date new studies found but not
yet included/excluded
Information not supplied by author
Date new studies found and
included/excluded
30 June 2005
Date authors’ conclusions
section amended
Information not supplied by author
Contact address Dr Millicent Anim-Somuah
Honorary Research Fellow
Division of Perinatal and Reproductive Medicine
Liverpool Women’s Hospital NHS Trust
29Epidural versus non-epidural or no analgesia in labour (Review)
Copyright ©2005 The Cochrane Collaboration. Published by John Wiley & Sons, Ltd

Crown Street
Liverpool
L8 7SS
UK
E-mail: [email protected]
Tel: +44 151 7024109
DOI 10.1002/14651858.CD000331.pub2
Cochrane Library number CD000331
Editorial group Cochrane Pregnancy and Childbirth Group
Editorial group code HM-PREG
C O M M E N T S A N D C R I T I C I S M S
Olsen, April 1998
Summary
Abstract:
The section main results should use consistent terminology. The effect on pain relief was only reported in one small trial, and this
should be referred to in the same way as for the adverse effects.
The conclusion is also inconsistent. A suggestion for the first sentence: ’Epidural analgesia is an effective method of pain relief during
labour, but is associated with longer first and second stages of labour, increased oxytocin use, malrotation, instrumental delivery and
Caesarean section; women should be counseled about these risks before labor.’ The more rare maternal side effects could also be
mentioned.
Background:
The statements about epidural as effective form of pain relief are not justified or referenced. It is unclear whether more evidence to
support this effect is necessary.
Author’s reply
Pain relief has now been reported in four studies, all of which showed epidural to be better than non-epidural analgesia. The review
has been amended to take account of this, and the other comments.
[Summary of response from Charlotte Howell, May 1999]
Contributors
Summary of comments received from Ole Olsen, April 1998.
Vickers, August 1999
Summary
Results and discussion:
The interpretation of the summary statistic for Caesarean section is misleading. The lower limit of the 95% confidence interval is just
below one (relative risk 1.27, 95% confidence interval 0.93-1.74), and so does not achieve statistical significance. The authors conclude
’there is no significant increase in the Caesarean section rate’, but this under rates the clinical importance of these data. It is not usual to
demand statistically significant differences between groups before considering it worth mentioning a possible adverse event to a patient.
The most likely effect is an increase of 25%, but this may be as much as 75% and a small, 10%, decrease in the risk of Caesarean
section is also possible.
Women considering their choice of pain relief should be warned that epidural analgesia probably increases their risk of having a
Caesarean section.
Author’s reply
30Epidural versus non-epidural or no analgesia in labour (Review)
Copyright ©2005 The Cochrane Collaboration. Published by John Wiley & Sons, Ltd

This broader interpretation of the confidence intervals has been incorporated.
(Summary of response from M Anim-Somuah, April 2005.)
Contributors
Summary of comments received from Andrew Vickers, August 1999.
Vickers, April 2001
Summary
Update on previous comment
The reviewer stated in February 2000 that “This broader interpretation of the confidence intervals will be incorporated into the next
update of the review.” In April 2001 this has yet to be done. The review continues to be misleading in stating that epidurals do not
increase rates of caesarean section.
Author’s reply
The review has now been updated. With addition of new trials, the overall relative risk of caesarean section for women allocated epidural
rather than other forms of analgesia was 1.07, 95% CI 0.93 to 1.23. The implications are discussed in the review.
(Summary of response from M. Anim-Somuah, April 2005.)
Contributors
Summary of comments from Andrew Vickers, April 2001.
G R A P H S A N D O T H E R T A B L E S
Fig. 1. Comparison 01. Epidural versus non-epidural analgesia in labour
01.01 Woman’s perception of pain relief in labour
Review: Epidural versus non-epidural or no analgesia in labour
Comparison: 01 Epidural versus non-epidural analgesia in labour
Outcome: 01 Woman’s perception of pain relief in labour
Study Epidural analgesia Control Weighted Mean Difference (Fixed) Weight Weighted Mean Difference (Fixed)
N Mean(SD) N Mean(SD) 95% CI (%) 95% CI
Hogg 2000 53 4.20 (3.60) 52 6.80 (2.70) 100.0 -2.60 [ -3.82, -1.38 ]
Total (95% CI) 53 52 100.0 -2.60 [ -3.82, -1.38 ]
Test for heterogeneity: not applicable
Test for overall effect z=4.19 p=0.00003
-10.0 -5.0 0 5.0 10.0
Favours epidural Favours control
31Epidural versus non-epidural or no analgesia in labour (Review)
Copyright ©2005 The Cochrane Collaboration. Published by John Wiley & Sons, Ltd
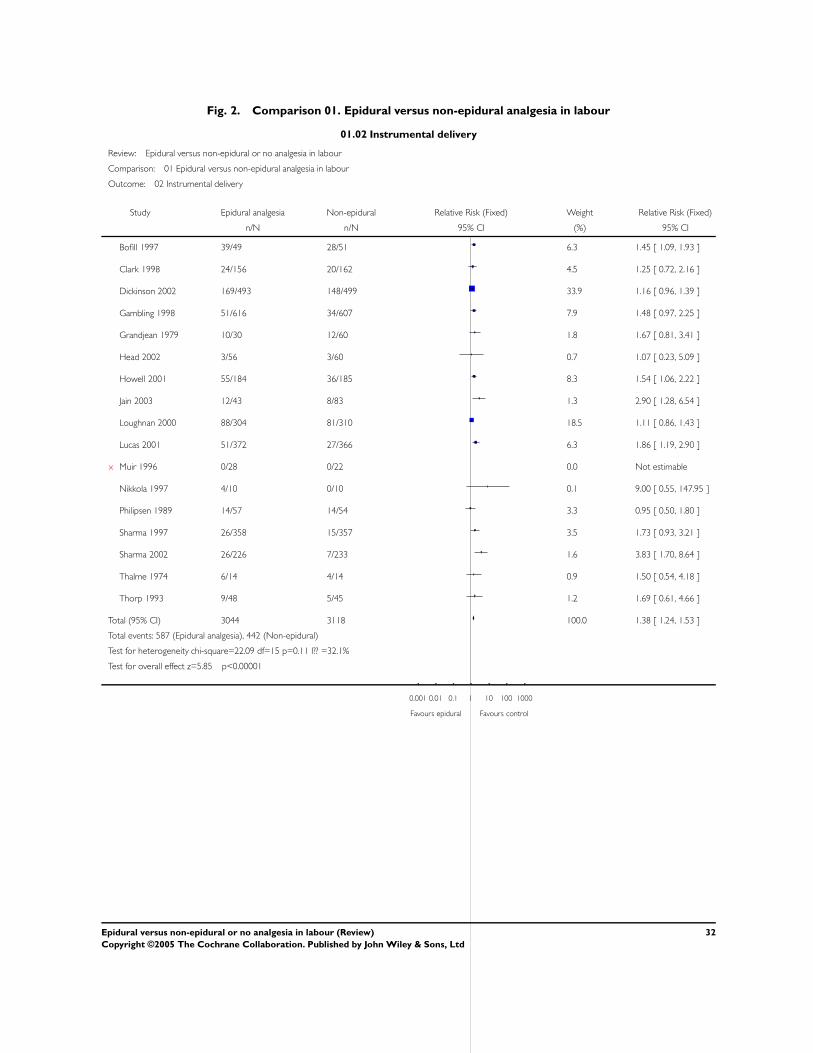
Fig. 2. Comparison 01. Epidural versus non-epidural analgesia in labour
01.02 Instrumental delivery
Review: Epidural versus non-epidural or no analgesia in labour
Comparison: 01 Epidural versus non-epidural analgesia in labour
Outcome: 02 Instrumental delivery
Study Epidural analgesia Non-epidural Relative Risk (Fixed) Weight Relative Risk (Fixed)
n/N n/N 95% CI (%) 95% CI
Bofill 1997 39/49 28/51 6.3 1.45 [ 1.09, 1.93 ]
Clark 1998 24/156 20/162 4.5 1.25 [ 0.72, 2.16 ]
Dickinson 2002 169/493 148/499 33.9 1.16 [ 0.96, 1.39 ]
Gambling 1998 51/616 34/607 7.9 1.48 [ 0.97, 2.25 ]
Grandjean 1979 10/30 12/60 1.8 1.67 [ 0.81, 3.41 ]
Head 2002 3/56 3/60 0.7 1.07 [ 0.23, 5.09 ]
Howell 2001 55/184 36/185 8.3 1.54 [ 1.06, 2.22 ]
Jain 2003 12/43 8/83 1.3 2.90 [ 1.28, 6.54 ]
Loughnan 2000 88/304 81/310 18.5 1.11 [ 0.86, 1.43 ]
Lucas 2001 51/372 27/366 6.3 1.86 [ 1.19, 2.90 ]
x Muir 1996 0/28 0/22 0.0 Not estimable
Nikkola 1997 4/10 0/10 0.1 9.00 [ 0.55, 147.95 ]
Philipsen 1989 14/57 14/54 3.3 0.95 [ 0.50, 1.80 ]
Sharma 1997 26/358 15/357 3.5 1.73 [ 0.93, 3.21 ]
Sharma 2002 26/226 7/233 1.6 3.83 [ 1.70, 8.64 ]
Thalme 1974 6/14 4/14 0.9 1.50 [ 0.54, 4.18 ]
Thorp 1993 9/48 5/45 1.2 1.69 [ 0.61, 4.66 ]
Total (95% CI) 3044 3118 100.0 1.38 [ 1.24, 1.53 ]
Total events: 587 (Epidural analgesia), 442 (Non-epidural)
Test for heterogeneity chi-square=22.09 df=15 p=0.11 I?? =32.1%
Test for overall effect z=5.85 p<0.00001
0.001 0.01 0.1 1 10 100 1000
Favours epidural Favours control
32Epidural versus non-epidural or no analgesia in labour (Review)
Copyright ©2005 The Cochrane Collaboration. Published by John Wiley & Sons, Ltd

Fig. 3. Comparison 01. Epidural versus non-epidural analgesia in labour
01.03 Caesarean section
Review: Epidural versus non-epidural or no analgesia in labour
Comparison: 01 Epidural versus non-epidural analgesia in labour
Outcome: 03 Caesarean section
Study Epidural anagesia Control Relative Risk (Fixed) Weight Relative Risk (Fixed)
n/N n/N 95% CI (%) 95% CI
Bofill 1997 5/49 3/51 0.9 1.73 [ 0.44, 6.87 ]
Clark 1998 15/156 22/162 6.5 0.71 [ 0.38, 1.31 ]
Dickinson 2002 85/493 71/499 21.2 1.21 [ 0.91, 1.62 ]
Gambling 1998 39/616 34/607 10.3 1.13 [ 0.72, 1.77 ]
Grandjean 1979 0/30 1/60 0.3 0.66 [ 0.03, 15.64 ]
Head 2002 10/56 7/60 2.0 1.53 [ 0.63, 3.74 ]
Hogg 2000 7/53 6/52 1.8 1.14 [ 0.41, 3.18 ]
Howell 2001 13/184 16/185 4.8 0.82 [ 0.40, 1.65 ]
Jain 2003 9/45 12/83 2.5 1.38 [ 0.63, 3.03 ]
Long 2003 1/30 6/50 1.4 0.28 [ 0.04, 2.20 ]
Loughnan 2000 36/304 40/310 11.9 0.92 [ 0.60, 1.40 ]
Lucas 2001 63/372 62/366 18.8 1.00 [ 0.73, 1.38 ]
Muir 1996 3/28 2/22 0.7 1.18 [ 0.22, 6.45 ]
Muir 2000 11/97 9/88 2.8 1.11 [ 0.48, 2.55 ]
x Nikkola 1997 0/10 0/10 0.0 Not estimable
Philipsen 1989 10/57 6/54 1.9 1.58 [ 0.62, 4.05 ]
Sharma 1997 13/358 16/357 4.8 0.81 [ 0.40, 1.66 ]
Sharma 2002 16/226 20/233 5.9 0.82 [ 0.44, 1.55 ]
Thalme 1974 6/14 4/14 1.2 1.50 [ 0.54, 4.18 ]
Thorp 1993 12/48 1/45 0.3 11.25 [ 1.52, 83.05 ]
Total (95% CI) 3226 3308 100.0 1.07 [ 0.93, 1.23 ]
Total events: 354 (Epidural anagesia), 338 (Control)
Test for heterogeneity chi-square=14.62 df=18 p=0.69 I?? =0.0%
Test for overall effect z=0.99 p=0.3
0.001 0.01 0.1 1 10 100 1000
Epidural analgesia Favours control
33Epidural versus non-epidural or no analgesia in labour (Review)
Copyright ©2005 The Cochrane Collaboration. Published by John Wiley & Sons, Ltd

Fig. 4. Comparison 01. Epidural versus non-epidural analgesia in labour
01.04 Apgar score less than 7 at 5 minutes
Review: Epidural versus non-epidural or no analgesia in labour
Comparison: 01 Epidural versus non-epidural analgesia in labour
Outcome: 04 Apgar score less than 7 at 5 minutes
Study Epidural analgesia Control Relative Risk (Fixed) Weight Relative Risk (Fixed)
n/N n/N 95% CI (%) 95% CI
x Bofill 1997 0/49 0/51 0.0 Not estimable
Clark 1998 4/156 8/162 18.3 0.52 [ 0.16, 1.69 ]
Dickinson 2002 8/493 4/499 9.3 2.02 [ 0.61, 6.68 ]
Gambling 1998 0/616 1/607 3.5 0.33 [ 0.01, 8.05 ]
x Grandjean 1979 0/30 0/60 0.0 Not estimable
Head 2002 5/56 6/60 13.5 0.89 [ 0.29, 2.76 ]
Howell 2001 1/184 1/185 2.3 1.01 [ 0.06, 15.95 ]
x Long 2003 0/30 0/50 0.0 Not estimable
Lucas 2001 7/372 13/366 30.5 0.53 [ 0.21, 1.31 ]
Muir 1996 2/28 2/22 5.2 0.79 [ 0.12, 5.14 ]
x Nikkola 1997 0/10 0/10 0.0 Not estimable
Sharma 1997 1/358 2/357 4.7 0.50 [ 0.05, 5.47 ]
Sharma 2002 1/226 4/233 9.2 0.26 [ 0.03, 2.29 ]
Thorp 1993 0/48 1/45 3.6 0.31 [ 0.01, 7.49 ]
Total (95% CI) 2656 2707 100.0 0.70 [ 0.44, 1.10 ]
Total events: 29 (Epidural analgesia), 42 (Control)
Test for heterogeneity chi-square=5.25 df=9 p=0.81 I?? =0.0%
Test for overall effect z=1.54 p=0.1
0.01 0.1 1 10 100
Favours epidural Favours control
34Epidural versus non-epidural or no analgesia in labour (Review)
Copyright ©2005 The Cochrane Collaboration. Published by John Wiley & Sons, Ltd

Fig. 5. Comparison 01. Epidural versus non-epidural analgesia in labour
01.05 Maternal satisfaction with pain relief in labour
Review: Epidural versus non-epidural or no analgesia in labour
Comparison: 01 Epidural versus non-epidural analgesia in labour
Outcome: 05 Maternal satisfaction with pain relief in labour
Study Epidural analgesia Control Relative Risk (Random) Weight Relative Risk (Random)
n/N n/N 95% CI (%) 95% CI
Dickinson 2002 493/498 494/499 21.7 1.00 [ 0.99, 1.01 ]
Howell 2001 159/170 152/168 21.4 1.03 [ 0.97, 1.10 ]
Jain 2003 39/43 57/83 19.6 1.32 [ 1.11, 1.57 ]
Nikkola 1997 10/10 8/10 16.1 1.25 [ 0.92, 1.70 ]
Sharma 2002 214/226 161/233 21.1 1.37 [ 1.25, 1.50 ]
Total (95% CI) 947 993 100.0 1.18 [ 0.92, 1.50 ]
Total events: 915 (Epidural analgesia), 872 (Control)
Test for heterogeneity chi-square=222.54 df=4 p=<0.0001 I?? =98.2%
Test for overall effect z=1.31 p=0.2
0.1 0.2 0.5 1 2 5 10
Favours control Favours epidural
Fig. 6. Comparison 01. Epidural versus non-epidural analgesia in labour
01.06 Long-term backache
Review: Epidural versus non-epidural or no analgesia in labour
Comparison: 01 Epidural versus non-epidural analgesia in labour
Outcome: 06 Long-term backache
Study Epidural Control Relative Risk (Fixed) Weight Relative Risk (Fixed)
n/N n/N 95% CI (%) 95% CI
Howell 2001 115/151 112/155 46.4 1.05 [ 0.92, 1.20 ]
Loughnan 2000 119/249 130/259 53.6 0.95 [ 0.80, 1.14 ]
Total (95% CI) 400 414 100.0 1.00 [ 0.89, 1.12 ]
Total events: 234 (Epidural), 242 (Control)
Test for heterogeneity chi-square=0.91 df=1 p=0.34 I?? =0.0%
Test for overall effect z=0.01 p=1
0.1 0.2 0.5 1 2 5 10
Favours epidural Favours control
35Epidural versus non-epidural or no analgesia in labour (Review)
Copyright ©2005 The Cochrane Collaboration. Published by John Wiley & Sons, Ltd

Fig. 7. Comparison 01. Epidural versus non-epidural analgesia in labour
01.07 Length of first stage of labour (minutes)
Review: Epidural versus non-epidural or no analgesia in labour
Comparison: 01 Epidural versus non-epidural analgesia in labour
Outcome: 07 Length of first stage of labour (minutes)
Study Epidural analgesia Control Weighted Mean Difference (Random) Weight Weighted Mean Difference (Random)
N Mean(SD) N Mean(SD) 95% CI (%) 95% CI
Bofill 1997 49 375.00 (143.00) 51 357.00 (153.00) 11.0 18.00 [ -40.02, 76.02 ]
Clark 1998 156 311.00 (162.00) 162 274.00 (141.00) 12.8 37.00 [ 3.57, 70.43 ]
Howell 2001 182 388.40 (89.80) 184 349.50 (206.00) 12.8 38.90 [ 6.40, 71.40 ]
Jain 2003 43 498.00 (192.00) 39 396.00 (180.00) 9.3 102.00 [ 21.47, 182.53 ]
Long 2003 30 467.00 (144.00) 20 433.00 (102.00) 10.2 34.00 [ -34.22, 102.22 ]
Lucas 2001 372 271.00 (183.00) 366 266.00 (193.00) 13.1 5.00 [ -22.14, 32.14 ]
Morgan-Ortiz 1999 66 177.00 (89.00) 63 296.00 (114.50) 12.7 -119.00 [ -154.50, -83.50 ]
Sharma 2002 226 302.00 (189.00) 233 261.00 (188.00) 12.7 41.00 [ 6.51, 75.49 ]
Thorp 1993 41 676.00 (394.00) 45 519.00 (279.00) 5.3 157.00 [ 11.43, 302.57 ]
Total (95% CI) 1165 1163 100.0 23.81 [ -18.88, 66.51 ]
Test for heterogeneity chi-square=68.97 df=8 p=<0.0001 I?? =88.4%
Test for overall effect z=1.09 p=0.3
-1000.0 -500.0 0 500.0 1000.0
Favours epidural Favours control
36Epidural versus non-epidural or no analgesia in labour (Review)
Copyright ©2005 The Cochrane Collaboration. Published by John Wiley & Sons, Ltd

Fig. 8. Comparison 01. Epidural versus non-epidural analgesia in labour
01.08 Length of second stage of labour (minutes)
Review: Epidural versus non-epidural or no analgesia in labour
Comparison: 01 Epidural versus non-epidural analgesia in labour
Outcome: 08 Length of second stage of labour (minutes)
Study Epidural analgesia Control Weighted Mean Difference (Random) Weight Weighted Mean Difference (Random)
N Mean(SD) N Mean(SD) 95% CI (%) 95% CI
Bofill 1997 49 63.00 (53.00) 51 57.00 (49.00) 7.3 6.00 [ -14.03, 26.03 ]
Clark 1998 156 66.00 (46.00) 162 59.00 (53.00) 10.6 7.00 [ -3.90, 17.90 ]
Gambling 1998 616 48.00 (50.00) 607 31.00 (34.00) 12.5 17.00 [ 12.21, 21.79 ]
Howell 2001 183 80.70 (60.40) 184 62.00 (58.90) 10.1 18.70 [ 6.49, 30.91 ]
Jain 2003 43 71.30 (57.90) 39 29.50 (23.00) 7.7 41.80 [ 23.05, 60.55 ]
Long 2003 30 67.00 (51.00) 20 41.00 (20.00) 7.2 26.00 [ 5.75, 46.25 ]
Lucas 2001 372 53.00 (50.00) 366 40.00 (42.00) 12.1 13.00 [ 6.34, 19.66 ]
Morgan-Ortiz 1999 66 36.54 (21.70) 63 42.57 (16.15) 12.1 -6.03 [ -12.61, 0.55 ]
Sharma 2002 226 56.00 (42.00) 233 45.00 (42.00) 11.7 11.00 [ 3.31, 18.69 ]
Thalme 1974 14 48.00 (50.00) 14 60.00 (60.00) 3.0 -12.00 [ -52.91, 28.91 ]
Thorp 1993 41 115.00 (71.00) 45 54.00 (45.00) 5.7 61.00 [ 35.60, 86.40 ]
Total (95% CI) 1796 1784 100.0 15.55 [ 7.46, 23.63 ]
Test for heterogeneity chi-square=62.63 df=10 p=<0.0001 I?? =84.0%
Test for overall effect z=3.77 p=0.0002
-100.0 -50.0 0 50.0 100.0
Favours epidural Favours control
37Epidural versus non-epidural or no analgesia in labour (Review)
Copyright ©2005 The Cochrane Collaboration. Published by John Wiley & Sons, Ltd

Fig. 9. Comparison 01. Epidural versus non-epidural analgesia in labour
01.09 Oxytocin augmentation
Review: Epidural versus non-epidural or no analgesia in labour
Comparison: 01 Epidural versus non-epidural analgesia in labour
Outcome: 09 Oxytocin augmentation
Study Epidural analgesia Control Relative Risk (Random) Weight Relative Risk (Random)
n/N n/N 95% CI (%) 95% CI
Bofill 1997 34/49 42/51 10.2 0.84 [ 0.67, 1.06 ]
Clark 1998 117/156 117/162 12.8 1.04 [ 0.91, 1.18 ]
Gambling 1998 159/616 141/607 11.0 1.11 [ 0.91, 1.35 ]
Howell 2001 114/184 101/185 11.7 1.13 [ 0.95, 1.35 ]
Loughnan 2000 186/304 175/308 12.8 1.08 [ 0.94, 1.23 ]
Lucas 2001 152/372 129/366 11.4 1.16 [ 0.96, 1.39 ]
Philipsen 1989 33/57 32/54 8.0 0.98 [ 0.71, 1.34 ]
Sharma 1997 80/243 40/259 7.4 2.13 [ 1.52, 2.99 ]
Sharma 2002 102/226 78/233 10.1 1.35 [ 1.07, 1.70 ]
Thalme 1974 6/14 1/12 0.4 5.14 [ 0.72, 36.94 ]
Thorp 1993 28/48 12/45 4.2 2.19 [ 1.27, 3.75 ]
Total (95% CI) 2269 2282 100.0 1.18 [ 1.03, 1.34 ]
Total events: 1011 (Epidural analgesia), 868 (Control)
Test for heterogeneity chi-square=35.77 df=10 p=<0.0001 I?? =72.0%
Test for overall effect z=2.47 p=0.01
0.01 0.1 1 10 100
Favours epidural Favours control
38Epidural versus non-epidural or no analgesia in labour (Review)
Copyright ©2005 The Cochrane Collaboration. Published by John Wiley & Sons, Ltd

Fig. 10. Comparison 01. Epidural versus non-epidural analgesia in labour
01.10 Caesarean section for fetal distress
Review: Epidural versus non-epidural or no analgesia in labour
Comparison: 01 Epidural versus non-epidural analgesia in labour
Outcome: 10 Caesarean section for fetal distress
Study Epidural analgesia Control Relative Risk (Fixed) Weight Relative Risk (Fixed)
n/N n/N 95% CI (%) 95% CI
Bofill 1997 1/49 0/51 1.0 3.12 [ 0.13, 74.80 ]
Clark 1998 6/156 5/162 9.9 1.25 [ 0.39, 4.00 ]
Gambling 1998 16/616 9/607 18.3 1.75 [ 0.78, 3.93 ]
Loughnan 2000 16/304 17/310 34.0 0.96 [ 0.49, 1.86 ]
Lucas 2001 15/372 7/366 14.3 2.11 [ 0.87, 5.11 ]
Muir 1996 1/28 1/22 2.3 0.79 [ 0.05, 11.87 ]
Philipsen 1989 3/57 0/54 1.0 6.64 [ 0.35, 125.58 ]
Sharma 1997 4/358 6/357 12.1 0.66 [ 0.19, 2.34 ]
Sharma 2002 3/226 3/233 6.0 1.03 [ 0.21, 5.05 ]
Thorp 1993 4/48 0/45 1.0 8.45 [ 0.47, 152.62 ]
Total (95% CI) 2214 2207 100.0 1.42 [ 0.99, 2.03 ]
Total events: 69 (Epidural analgesia), 48 (Control)
Test for heterogeneity chi-square=6.90 df=9 p=0.65 I?? =0.0%
Test for overall effect z=1.92 p=0.06
0.001 0.01 0.1 1 10 100 1000
Favours epidural Favours control
39Epidural versus non-epidural or no analgesia in labour (Review)
Copyright ©2005 The Cochrane Collaboration. Published by John Wiley & Sons, Ltd

Fig. 11. Comparison 01. Epidural versus non-epidural analgesia in labour
01.11 Caesarean section for dystocia
Review: Epidural versus non-epidural or no analgesia in labour
Comparison: 01 Epidural versus non-epidural analgesia in labour
Outcome: 11 Caesarean section for dystocia
Study Epidural analgesia Control Relative Risk (Fixed) Weight Relative Risk (Fixed)
n/N n/N 95% CI (%) 95% CI
Bofill 1997 4/49 3/51 1.8 1.39 [ 0.33, 5.88 ]
Clark 1998 9/156 17/162 10.4 0.55 [ 0.25, 1.20 ]
Gambling 1998 23/616 25/607 15.7 0.91 [ 0.52, 1.58 ]
Loughnan 2000 19/304 24/310 14.8 0.81 [ 0.45, 1.44 ]
Lucas 2001 46/372 54/366 34.0 0.84 [ 0.58, 1.21 ]
Muir 1996 2/28 1/22 0.7 1.57 [ 0.15, 16.23 ]
Muir 2000 3/97 5/88 3.3 0.54 [ 0.13, 2.21 ]
Philipsen 1989 9/57 3/54 1.9 2.84 [ 0.81, 9.94 ]
Sharma 1997 9/358 10/357 6.2 0.90 [ 0.37, 2.18 ]
Sharma 2002 13/226 17/233 10.4 0.79 [ 0.39, 1.59 ]
Thorp 1993 8/48 1/45 0.6 7.50 [ 0.98, 57.60 ]
Total (95% CI) 2311 2295 100.0 0.90 [ 0.73, 1.12 ]
Total events: 145 (Epidural analgesia), 160 (Control)
Test for heterogeneity chi-square=10.41 df=10 p=0.41 I?? =4.0%
Test for overall effect z=0.96 p=0.3
0.01 0.1 1 10 100
Favours epidural Favours control
Fig. 12. Comparison 01. Epidural versus non-epidural analgesia in labour
01.12 Time of administration of pain relief to time pain relief was satisfactory
Review: Epidural versus non-epidural or no analgesia in labour
Comparison: 01 Epidural versus non-epidural analgesia in labour
Outcome: 12 Time of administration of pain relief to time pain relief was satisfactory
Study epidural Control Weighted Mean Difference (Fixed) Weight Weighted Mean Difference (Fixed)
N Mean(SD) N Mean(SD) 95% CI (%) 95% CI
Jain 2003 43 9.20 (3.10) 39 15.90 (3.00) 100.0 -6.70 [ -8.02, -5.38 ]
Total (95% CI) 43 39 100.0 -6.70 [ -8.02, -5.38 ]
Test for heterogeneity: not applicable
Test for overall effect z=9.94 p<0.00001
-10.0 -5.0 0 5.0 10.0
Favours epidural Favours control
40Epidural versus non-epidural or no analgesia in labour (Review)
Copyright ©2005 The Cochrane Collaboration. Published by John Wiley & Sons, Ltd
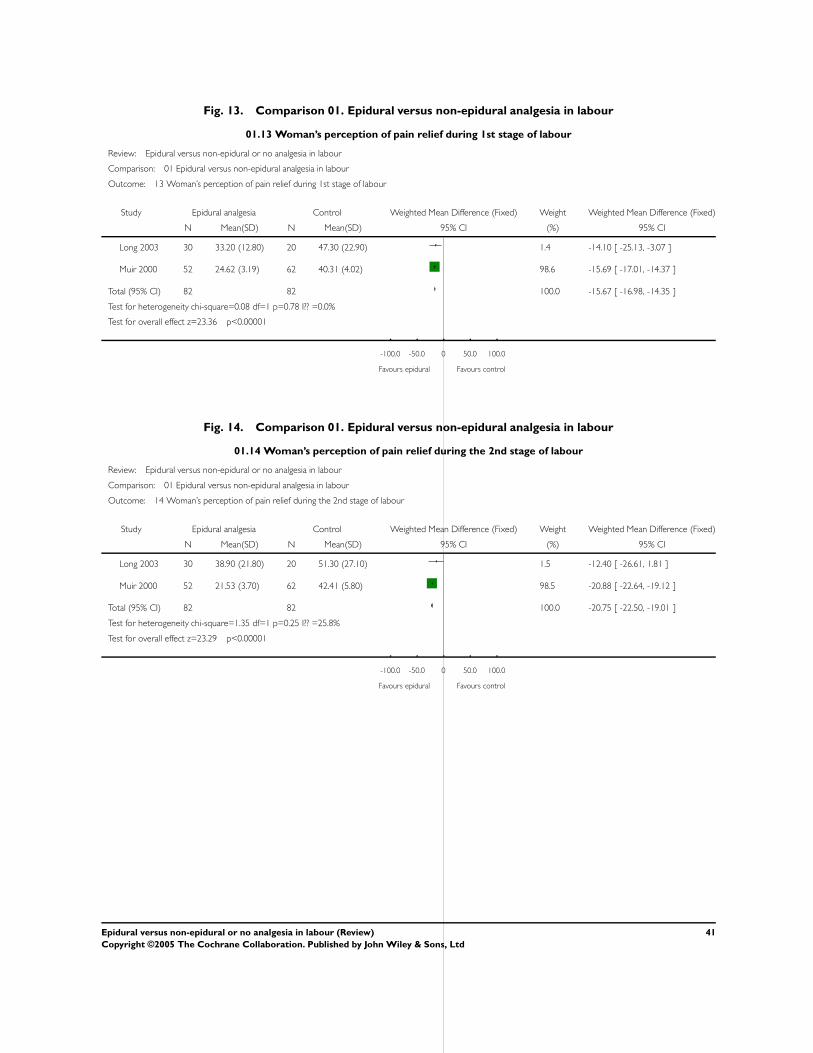
Fig. 13. Comparison 01. Epidural versus non-epidural analgesia in labour
01.13 Woman’s perception of pain relief during 1st stage of labour
Review: Epidural versus non-epidural or no analgesia in labour
Comparison: 01 Epidural versus non-epidural analgesia in labour
Outcome: 13 Woman’s perception of pain relief during 1st stage of labour
Study Epidural analgesia Control Weighted Mean Difference (Fixed) Weight Weighted Mean Difference (Fixed)
N Mean(SD) N Mean(SD) 95% CI (%) 95% CI
Long 2003 30 33.20 (12.80) 20 47.30 (22.90) 1.4 -14.10 [ -25.13, -3.07 ]
Muir 2000 52 24.62 (3.19) 62 40.31 (4.02) 98.6 -15.69 [ -17.01, -14.37 ]
Total (95% CI) 82 82 100.0 -15.67 [ -16.98, -14.35 ]
Test for heterogeneity chi-square=0.08 df=1 p=0.78 I?? =0.0%
Test for overall effect z=23.36 p<0.00001
-100.0 -50.0 0 50.0 100.0
Favours epidural Favours control
Fig. 14. Comparison 01. Epidural versus non-epidural analgesia in labour
01.14 Woman’s perception of pain relief during the 2nd stage of labour
Review: Epidural versus non-epidural or no analgesia in labour
Comparison: 01 Epidural versus non-epidural analgesia in labour
Outcome: 14 Woman’s perception of pain relief during the 2nd stage of labour
Study Epidural analgesia Control Weighted Mean Difference (Fixed) Weight Weighted Mean Difference (Fixed)
N Mean(SD) N Mean(SD) 95% CI (%) 95% CI
Long 2003 30 38.90 (21.80) 20 51.30 (27.10) 1.5 -12.40 [ -26.61, 1.81 ]
Muir 2000 52 21.53 (3.70) 62 42.41 (5.80) 98.5 -20.88 [ -22.64, -19.12 ]
Total (95% CI) 82 82 100.0 -20.75 [ -22.50, -19.01 ]
Test for heterogeneity chi-square=1.35 df=1 p=0.25 I?? =25.8%
Test for overall effect z=23.29 p<0.00001
-100.0 -50.0 0 50.0 100.0
Favours epidural Favours control
41Epidural versus non-epidural or no analgesia in labour (Review)
Copyright ©2005 The Cochrane Collaboration. Published by John Wiley & Sons, Ltd

Fig. 15. Comparison 01. Epidural versus non-epidural analgesia in labour
01.15 Maternal satisfaction with childbirth experience
Review: Epidural versus non-epidural or no analgesia in labour
Comparison: 01 Epidural versus non-epidural analgesia in labour
Outcome: 15 Maternal satisfaction with childbirth experience
Study Epidural analgesia Control Relative Risk (Fixed) Weight Relative Risk (Fixed)
n/N n/N 95% CI (%) 95% CI
Howell 2001 141/166 149/166 100.0 0.95 [ 0.87, 1.03 ]
Total (95% CI) 166 166 100.0 0.95 [ 0.87, 1.03 ]
Total events: 141 (Epidural analgesia), 149 (Control)
Test for heterogeneity: not applicable
Test for overall effect z=1.32 p=0.2
0.1 0.2 0.5 1 2 5 10
Favours epidural Favours control
Fig. 16. Comparison 01. Epidural versus non-epidural analgesia in labour
01.16 Perceived feeling of poor control in labour
Review: Epidural versus non-epidural or no analgesia in labour
Comparison: 01 Epidural versus non-epidural analgesia in labour
Outcome: 16 Perceived feeling of poor control in labour
Study Epidural analgesia Control Relative Risk (Fixed) Weight Relative Risk (Fixed)
n/N n/N 95% CI (%) 95% CI
Howell 2001 19/173 16/171 100.0 1.17 [ 0.62, 2.21 ]
Total (95% CI) 173 171 100.0 1.17 [ 0.62, 2.21 ]
Total events: 19 (Epidural analgesia), 16 (Control)
Test for heterogeneity: not applicable
Test for overall effect z=0.50 p=0.6
0.1 0.2 0.5 1 2 5 10
Favours epidural Favours control
42Epidural versus non-epidural or no analgesia in labour (Review)
Copyright ©2005 The Cochrane Collaboration. Published by John Wiley & Sons, Ltd
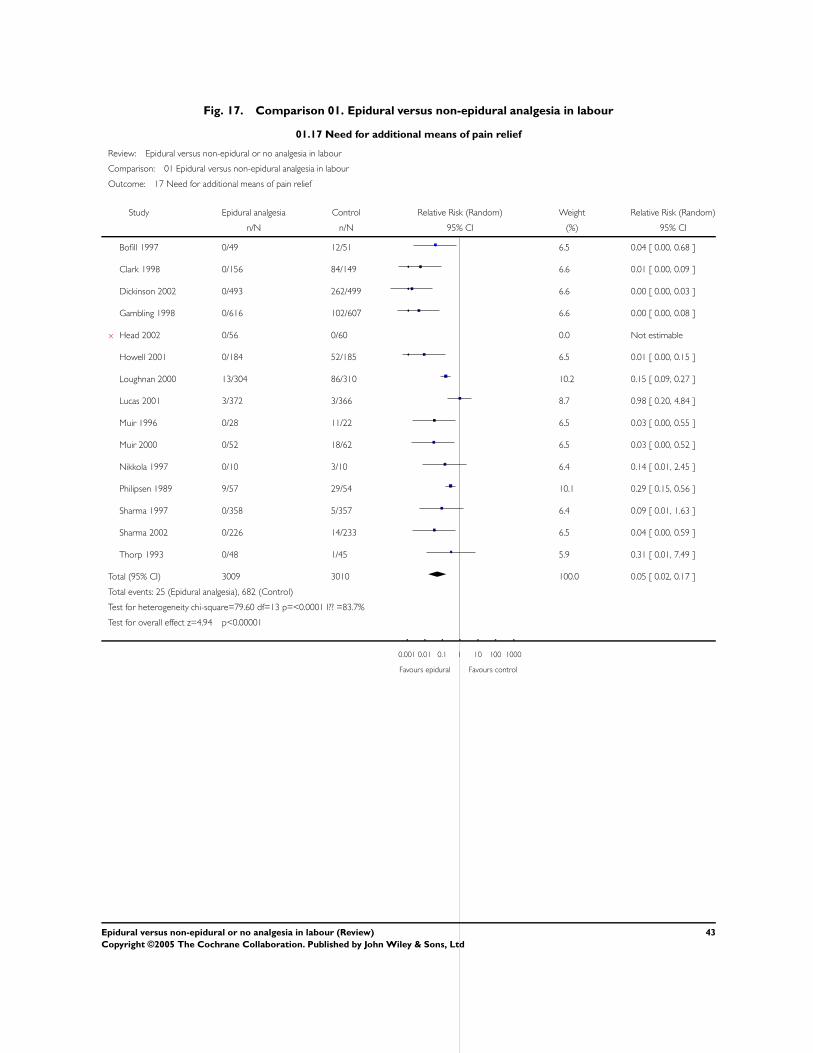
Fig. 17. Comparison 01. Epidural versus non-epidural analgesia in labour
01.17 Need for additional means of pain relief
Review: Epidural versus non-epidural or no analgesia in labour
Comparison: 01 Epidural versus non-epidural analgesia in labour
Outcome: 17 Need for additional means of pain relief
Study Epidural analgesia Control Relative Risk (Random) Weight Relative Risk (Random)
n/N n/N 95% CI (%) 95% CI
Bofill 1997 0/49 12/51 6.5 0.04 [ 0.00, 0.68 ]
Clark 1998 0/156 84/149 6.6 0.01 [ 0.00, 0.09 ]
Dickinson 2002 0/493 262/499 6.6 0.00 [ 0.00, 0.03 ]
Gambling 1998 0/616 102/607 6.6 0.00 [ 0.00, 0.08 ]
x Head 2002 0/56 0/60 0.0 Not estimable
Howell 2001 0/184 52/185 6.5 0.01 [ 0.00, 0.15 ]
Loughnan 2000 13/304 86/310 10.2 0.15 [ 0.09, 0.27 ]
Lucas 2001 3/372 3/366 8.7 0.98 [ 0.20, 4.84 ]
Muir 1996 0/28 11/22 6.5 0.03 [ 0.00, 0.55 ]
Muir 2000 0/52 18/62 6.5 0.03 [ 0.00, 0.52 ]
Nikkola 1997 0/10 3/10 6.4 0.14 [ 0.01, 2.45 ]
Philipsen 1989 9/57 29/54 10.1 0.29 [ 0.15, 0.56 ]
Sharma 1997 0/358 5/357 6.4 0.09 [ 0.01, 1.63 ]
Sharma 2002 0/226 14/233 6.5 0.04 [ 0.00, 0.59 ]
Thorp 1993 0/48 1/45 5.9 0.31 [ 0.01, 7.49 ]
Total (95% CI) 3009 3010 100.0 0.05 [ 0.02, 0.17 ]
Total events: 25 (Epidural analgesia), 682 (Control)
Test for heterogeneity chi-square=79.60 df=13 p=<0.0001 I?? =83.7%
Test for overall effect z=4.94 p<0.00001
0.001 0.01 0.1 1 10 100 1000
Favours epidural Favours control
43Epidural versus non-epidural or no analgesia in labour (Review)
Copyright ©2005 The Cochrane Collaboration. Published by John Wiley & Sons, Ltd
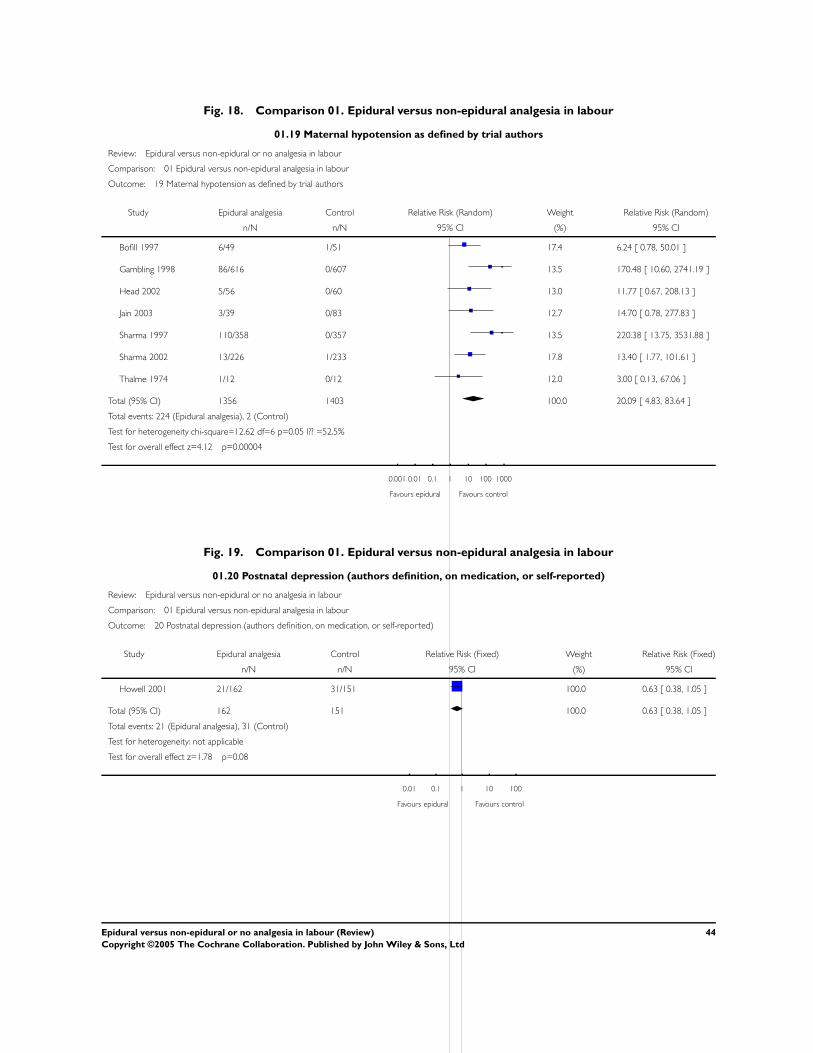
Fig. 18. Comparison 01. Epidural versus non-epidural analgesia in labour
01.19 Maternal hypotension as defined by trial authors
Review: Epidural versus non-epidural or no analgesia in labour
Comparison: 01 Epidural versus non-epidural analgesia in labour
Outcome: 19 Maternal hypotension as defined by trial authors
Study Epidural analgesia Control Relative Risk (Random) Weight Relative Risk (Random)
n/N n/N 95% CI (%) 95% CI
Bofill 1997 6/49 1/51 17.4 6.24 [ 0.78, 50.01 ]
Gambling 1998 86/616 0/607 13.5 170.48 [ 10.60, 2741.19 ]
Head 2002 5/56 0/60 13.0 11.77 [ 0.67, 208.13 ]
Jain 2003 3/39 0/83 12.7 14.70 [ 0.78, 277.83 ]
Sharma 1997 110/358 0/357 13.5 220.38 [ 13.75, 3531.88 ]
Sharma 2002 13/226 1/233 17.8 13.40 [ 1.77, 101.61 ]
Thalme 1974 1/12 0/12 12.0 3.00 [ 0.13, 67.06 ]
Total (95% CI) 1356 1403 100.0 20.09 [ 4.83, 83.64 ]
Total events: 224 (Epidural analgesia), 2 (Control)
Test for heterogeneity chi-square=12.62 df=6 p=0.05 I?? =52.5%
Test for overall effect z=4.12 p=0.00004
0.001 0.01 0.1 1 10 100 1000
Favours epidural Favours control
Fig. 19. Comparison 01. Epidural versus non-epidural analgesia in labour
01.20 Postnatal depression (authors definition, on medication, or self-reported)
Review: Epidural versus non-epidural or no analgesia in labour
Comparison: 01 Epidural versus non-epidural analgesia in labour
Outcome: 20 Postnatal depression (authors definition, on medication, or self-reported)
Study Epidural analgesia Control Relative Risk (Fixed) Weight Relative Risk (Fixed)
n/N n/N 95% CI (%) 95% CI
Howell 2001 21/162 31/151 100.0 0.63 [ 0.38, 1.05 ]
Total (95% CI) 162 151 100.0 0.63 [ 0.38, 1.05 ]
Total events: 21 (Epidural analgesia), 31 (Control)
Test for heterogeneity: not applicable
Test for overall effect z=1.78 p=0.08
0.01 0.1 1 10 100
Favours epidural Favours control
44Epidural versus non-epidural or no analgesia in labour (Review)
Copyright ©2005 The Cochrane Collaboration. Published by John Wiley & Sons, Ltd

Fig. 20. Comparison 01. Epidural versus non-epidural analgesia in labour
01.22 Motor blockade
Review: Epidural versus non-epidural or no analgesia in labour
Comparison: 01 Epidural versus non-epidural analgesia in labour
Outcome: 22 Motor blockade
Study Epidural analgesia Control Relative Risk (Fixed) Weight Relative Risk (Fixed)
n/N n/N 95% CI (%) 95% CI
Jain 2003 7/39 0/83 38.8 31.50 [ 1.84, 537.98 ]
x Long 2003 0/30 0/60 0.0 Not estimable
Philipsen 1989 16/56 0/54 61.2 31.84 [ 1.96, 517.90 ]
Total (95% CI) 125 197 100.0 31.71 [ 4.16, 241.99 ]
Total events: 23 (Epidural analgesia), 0 (Control)
Test for heterogeneity chi-square=0.00 df=1 p=1.00 I?? =0.0%
Test for overall effect z=3.33 p=0.0009
0.001 0.01 0.1 1 10 100 1000
Epidural analgesia Favours control
Fig. 21. Comparison 01. Epidural versus non-epidural analgesia in labour
01.23 Respiratory depression requiring oxygen administration
Review: Epidural versus non-epidural or no analgesia in labour
Comparison: 01 Epidural versus non-epidural analgesia in labour
Outcome: 23 Respiratory depression requiring oxygen administration
Study Epidural analgesia Control Relative Risk (Fixed) Weight Relative Risk (Fixed)
n/N n/N 95% CI (%) 95% CI
x Jain 2003 0/39 0/83 0.0 Not estimable
Total (95% CI) 39 83 0.0 Not estimable
Total events: 0 (Epidural analgesia), 0 (Control)
Test for heterogeneity: not applicable
Test for overall effect: not applicable
0.01 0.1 1 10 100
Favours epidural Favours control
45Epidural versus non-epidural or no analgesia in labour (Review)
Copyright ©2005 The Cochrane Collaboration. Published by John Wiley & Sons, Ltd

Fig. 22. Comparison 01. Epidural versus non-epidural analgesia in labour
01.25 Headache
Review: Epidural versus non-epidural or no analgesia in labour
Comparison: 01 Epidural versus non-epidural analgesia in labour
Outcome: 25 Headache
Study Epidural analgesia Control Relative Risk (Fixed) Weight Relative Risk (Fixed)
n/N n/N 95% CI (%) 95% CI
Head 2002 27/56 30/60 100.0 0.96 [ 0.67, 1.40 ]
x Long 2003 0/30 0/60 0.0 Not estimable
Total (95% CI) 86 120 100.0 0.96 [ 0.67, 1.40 ]
Total events: 27 (Epidural analgesia), 30 (Control)
Test for heterogeneity: not applicable
Test for overall effect z=0.19 p=0.8
0.1 0.2 0.5 1 2 5 10
Favours epidural Favours control
Fig. 23. Comparison 01. Epidural versus non-epidural analgesia in labour
01.28 Perineal trauma requiring suturing
Review: Epidural versus non-epidural or no analgesia in labour
Comparison: 01 Epidural versus non-epidural analgesia in labour
Outcome: 28 Perineal trauma requiring suturing
Study Epidural analgesia Control Relative Risk (Fixed) Weight Relative Risk (Fixed)
n/N n/N 95% CI (%) 95% CI
Howell 2001 141/184 135/185 100.0 1.05 [ 0.93, 1.18 ]
Total (95% CI) 184 185 100.0 1.05 [ 0.93, 1.18 ]
Total events: 141 (Epidural analgesia), 135 (Control)
Test for heterogeneity: not applicable
Test for overall effect z=0.81 p=0.4
0.1 0.2 0.5 1 2 5 10
Favours epidural Favours control
46Epidural versus non-epidural or no analgesia in labour (Review)
Copyright ©2005 The Cochrane Collaboration. Published by John Wiley & Sons, Ltd

Fig. 24. Comparison 01. Epidural versus non-epidural analgesia in labour
01.29 Nausea and vomiting
Review: Epidural versus non-epidural or no analgesia in labour
Comparison: 01 Epidural versus non-epidural analgesia in labour
Outcome: 29 Nausea and vomiting
Study Epidural analgesia Control Relative Risk (Fixed) Weight Relative Risk (Fixed)
n/N n/N 95% CI (%) 95% CI
Bofill 1997 12/49 10/49 5.3 1.20 [ 0.57, 2.51 ]
Dickinson 2002 63/493 57/499 30.0 1.12 [ 0.80, 1.57 ]
Howell 2001 81/184 88/185 46.5 0.93 [ 0.74, 1.16 ]
Long 2003 2/30 5/20 3.2 0.27 [ 0.06, 1.24 ]
Nikkola 1997 1/10 5/10 2.6 0.20 [ 0.03, 1.42 ]
Philipsen 1989 11/57 9/54 4.9 1.16 [ 0.52, 2.57 ]
Sharma 1997 25/358 14/357 7.4 1.78 [ 0.94, 3.37 ]
Total (95% CI) 1181 1174 100.0 1.03 [ 0.87, 1.22 ]
Total events: 195 (Epidural analgesia), 188 (Control)
Test for heterogeneity chi-square=9.86 df=6 p=0.13 I?? =39.2%
Test for overall effect z=0.37 p=0.7
0.01 0.1 1 10 100
Favours epidural Favours control
Fig. 25. Comparison 01. Epidural versus non-epidural analgesia in labour
01.30 Itch
Review: Epidural versus non-epidural or no analgesia in labour
Comparison: 01 Epidural versus non-epidural analgesia in labour
Outcome: 30 Itch
Study Epidural analgesia Control Relative Risk (Fixed) Weight Relative Risk (Fixed)
n/N n/N 95% CI (%) 95% CI
Long 2003 1/30 0/50 100.0 4.94 [ 0.21, 117.42 ]
Total (95% CI) 30 50 100.0 4.94 [ 0.21, 117.42 ]
Total events: 1 (Epidural analgesia), 0 (Control)
Test for heterogeneity: not applicable
Test for overall effect z=0.99 p=0.3
0.001 0.01 0.1 1 10 100 1000
Favours epidural Favours control
47Epidural versus non-epidural or no analgesia in labour (Review)
Copyright ©2005 The Cochrane Collaboration. Published by John Wiley & Sons, Ltd
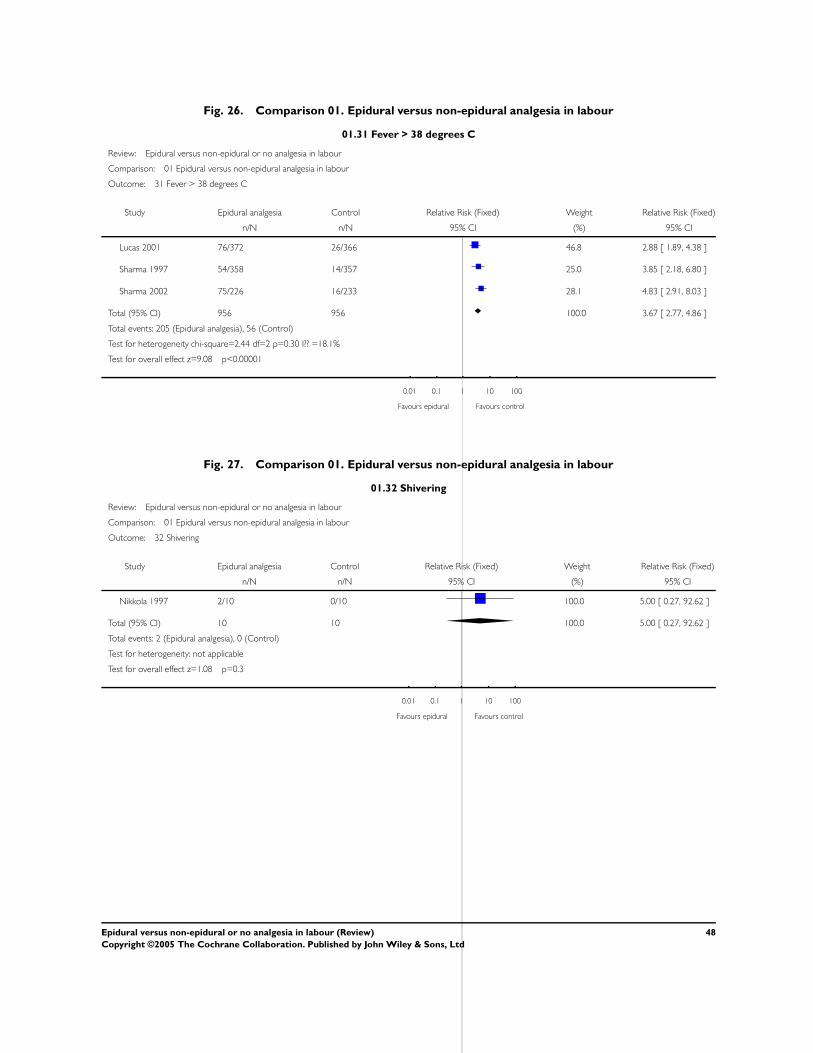
Fig. 26. Comparison 01. Epidural versus non-epidural analgesia in labour
01.31 Fever > 38 degrees C
Review: Epidural versus non-epidural or no analgesia in labour
Comparison: 01 Epidural versus non-epidural analgesia in labour
Outcome: 31 Fever > 38 degrees C
Study Epidural analgesia Control Relative Risk (Fixed) Weight Relative Risk (Fixed)
n/N n/N 95% CI (%) 95% CI
Lucas 2001 76/372 26/366 46.8 2.88 [ 1.89, 4.38 ]
Sharma 1997 54/358 14/357 25.0 3.85 [ 2.18, 6.80 ]
Sharma 2002 75/226 16/233 28.1 4.83 [ 2.91, 8.03 ]
Total (95% CI) 956 956 100.0 3.67 [ 2.77, 4.86 ]
Total events: 205 (Epidural analgesia), 56 (Control)
Test for heterogeneity chi-square=2.44 df=2 p=0.30 I?? =18.1%
Test for overall effect z=9.08 p<0.00001
0.01 0.1 1 10 100
Favours epidural Favours control
Fig. 27. Comparison 01. Epidural versus non-epidural analgesia in labour
01.32 Shivering
Review: Epidural versus non-epidural or no analgesia in labour
Comparison: 01 Epidural versus non-epidural analgesia in labour
Outcome: 32 Shivering
Study Epidural analgesia Control Relative Risk (Fixed) Weight Relative Risk (Fixed)
n/N n/N 95% CI (%) 95% CI
Nikkola 1997 2/10 0/10 100.0 5.00 [ 0.27, 92.62 ]
Total (95% CI) 10 10 100.0 5.00 [ 0.27, 92.62 ]
Total events: 2 (Epidural analgesia), 0 (Control)
Test for heterogeneity: not applicable
Test for overall effect z=1.08 p=0.3
0.01 0.1 1 10 100
Favours epidural Favours control
48Epidural versus non-epidural or no analgesia in labour (Review)
Copyright ©2005 The Cochrane Collaboration. Published by John Wiley & Sons, Ltd

Fig. 28. Comparison 01. Epidural versus non-epidural analgesia in labour
01.33 Drowsiness
Review: Epidural versus non-epidural or no analgesia in labour
Comparison: 01 Epidural versus non-epidural analgesia in labour
Outcome: 33 Drowsiness
Study Epidural analgesia Control Relative Risk (Random) Weight Relative Risk (Random)
n/N n/N 95% CI (%) 95% CI
Howell 2001 150/173 155/171 48.5 0.96 [ 0.89, 1.03 ]
Long 2003 0/30 4/20 25.2 0.08 [ 0.00, 1.33 ]
Nikkola 1997 6/10 0/10 26.2 13.00 [ 0.83, 203.83 ]
Total (95% CI) 213 201 100.0 1.00 [ 0.12, 7.99 ]
Total events: 156 (Epidural analgesia), 159 (Control)
Test for heterogeneity chi-square=6.51 df=2 p=0.04 I?? =69.3%
Test for overall effect z=0.00 p=1
0.001 0.01 0.1 1 10 100 1000
Favours epidural Favours control
Fig. 29. Comparison 01. Epidural versus non-epidural analgesia in labour
01.34 Urinary retention
Review: Epidural versus non-epidural or no analgesia in labour
Comparison: 01 Epidural versus non-epidural analgesia in labour
Outcome: 34 Urinary retention
Study Epidural analgesia Control Relative Risk (Fixed) Weight Relative Risk (Fixed)
n/N n/N 95% CI (%) 95% CI
Jain 2003 17/39 0/83 16.6 73.50 [ 4.53, 1191.64 ]
Long 2003 4/30 0/20 30.6 6.10 [ 0.35, 107.39 ]
Philipsen 1989 6/57 1/54 52.8 5.68 [ 0.71, 45.68 ]
Total (95% CI) 126 157 100.0 17.05 [ 4.82, 60.39 ]
Total events: 27 (Epidural analgesia), 1 (Control)
Test for heterogeneity chi-square=2.62 df=2 p=0.27 I?? =23.6%
Test for overall effect z=4.40 p=0.00001
0.001 0.01 0.1 1 10 100 1000
Favours epidural Favours control
49Epidural versus non-epidural or no analgesia in labour (Review)
Copyright ©2005 The Cochrane Collaboration. Published by John Wiley & Sons, Ltd
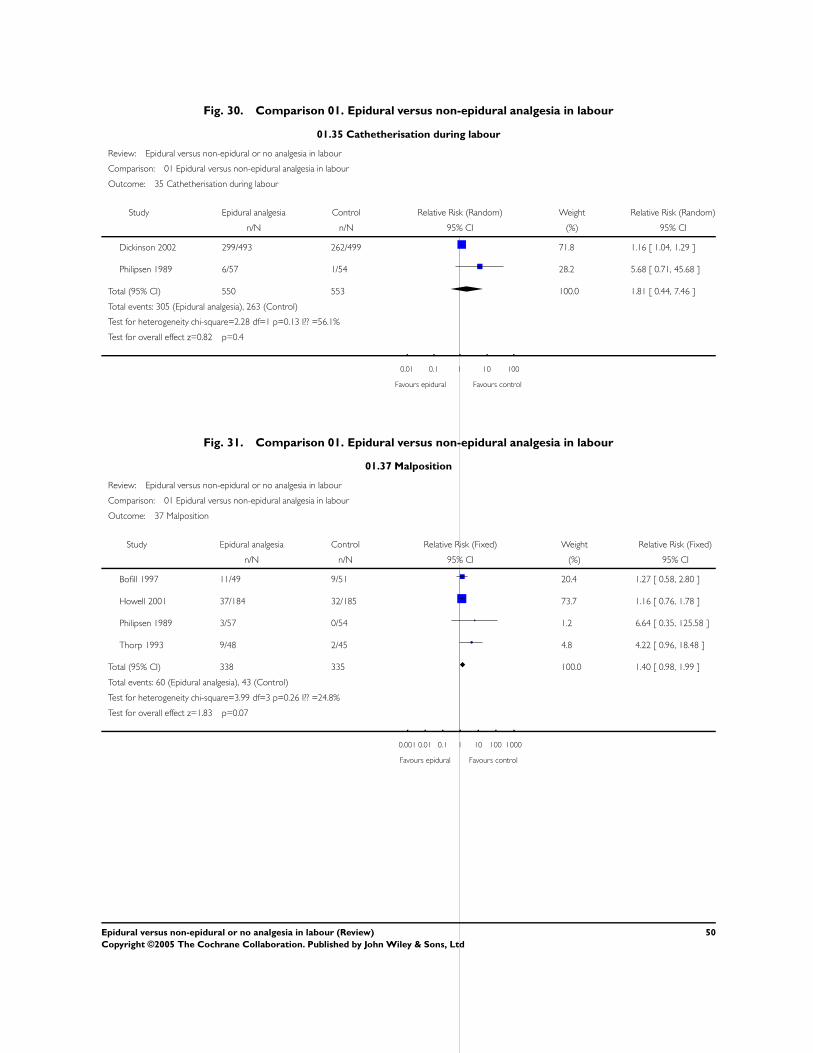
Fig. 30. Comparison 01. Epidural versus non-epidural analgesia in labour
01.35 Cathetherisation during labour
Review: Epidural versus non-epidural or no analgesia in labour
Comparison: 01 Epidural versus non-epidural analgesia in labour
Outcome: 35 Cathetherisation during labour
Study Epidural analgesia Control Relative Risk (Random) Weight Relative Risk (Random)
n/N n/N 95% CI (%) 95% CI
Dickinson 2002 299/493 262/499 71.8 1.16 [ 1.04, 1.29 ]
Philipsen 1989 6/57 1/54 28.2 5.68 [ 0.71, 45.68 ]
Total (95% CI) 550 553 100.0 1.81 [ 0.44, 7.46 ]
Total events: 305 (Epidural analgesia), 263 (Control)
Test for heterogeneity chi-square=2.28 df=1 p=0.13 I?? =56.1%
Test for overall effect z=0.82 p=0.4
0.01 0.1 1 10 100
Favours epidural Favours control
Fig. 31. Comparison 01. Epidural versus non-epidural analgesia in labour
01.37 Malposition
Review: Epidural versus non-epidural or no analgesia in labour
Comparison: 01 Epidural versus non-epidural analgesia in labour
Outcome: 37 Malposition
Study Epidural analgesia Control Relative Risk (Fixed) Weight Relative Risk (Fixed)
n/N n/N 95% CI (%) 95% CI
Bofill 1997 11/49 9/51 20.4 1.27 [ 0.58, 2.80 ]
Howell 2001 37/184 32/185 73.7 1.16 [ 0.76, 1.78 ]
Philipsen 1989 3/57 0/54 1.2 6.64 [ 0.35, 125.58 ]
Thorp 1993 9/48 2/45 4.8 4.22 [ 0.96, 18.48 ]
Total (95% CI) 338 335 100.0 1.40 [ 0.98, 1.99 ]
Total events: 60 (Epidural analgesia), 43 (Control)
Test for heterogeneity chi-square=3.99 df=3 p=0.26 I?? =24.8%
Test for overall effect z=1.83 p=0.07
0.001 0.01 0.1 1 10 100 1000
Favours epidural Favours control
50Epidural versus non-epidural or no analgesia in labour (Review)
Copyright ©2005 The Cochrane Collaboration. Published by John Wiley & Sons, Ltd

Fig. 32. Comparison 01. Epidural versus non-epidural analgesia in labour
01.38 Surgical amniotomy
Review: Epidural versus non-epidural or no analgesia in labour
Comparison: 01 Epidural versus non-epidural analgesia in labour
Outcome: 38 Surgical amniotomy
Study Epidural analgesia Control Relative Risk (Random) Weight Relative Risk (Random)
n/N n/N 95% CI (%) 95% CI
Bofill 1997 39/49 46/51 53.2 0.88 [ 0.75, 1.04 ]
Philipsen 1989 45/57 35/54 46.8 1.22 [ 0.96, 1.55 ]
Total (95% CI) 106 105 100.0 1.03 [ 0.74, 1.43 ]
Total events: 84 (Epidural analgesia), 81 (Control)
Test for heterogeneity chi-square=5.18 df=1 p=0.02 I?? =80.7%
Test for overall effect z=0.15 p=0.9
0.01 0.1 1 10 100
Favours epidural Favours control
Fig. 33. Comparison 01. Epidural versus non-epidural analgesia in labour
01.39 Neonatal intensive care unit admission
Review: Epidural versus non-epidural or no analgesia in labour
Comparison: 01 Epidural versus non-epidural analgesia in labour
Outcome: 39 Neonatal intensive care unit admission
Study Epidural analgesia Control Relative Risk (Fixed) Weight Relative Risk (Fixed)
n/N n/N 95% CI (%) 95% CI
Head 2002 45/56 44/60 61.5 1.10 [ 0.90, 1.34 ]
Howell 2001 4/184 6/185 8.7 0.67 [ 0.19, 2.34 ]
Loughnan 2000 12/304 10/310 14.3 1.22 [ 0.54, 2.79 ]
Lucas 2001 11/372 4/366 5.8 2.71 [ 0.87, 8.42 ]
Muir 2000 4/52 3/62 4.0 1.59 [ 0.37, 6.78 ]
Sharma 1997 2/358 3/357 4.3 0.66 [ 0.11, 3.95 ]
Sharma 2002 2/226 1/233 1.4 2.06 [ 0.19, 22.58 ]
Total (95% CI) 1552 1573 100.0 1.19 [ 0.94, 1.50 ]
Total events: 80 (Epidural analgesia), 71 (Control)
Test for heterogeneity chi-square=4.20 df=6 p=0.65 I?? =0.0%
Test for overall effect z=1.43 p=0.2
0.01 0.1 1 10 100
Favours epidural Favours control
51Epidural versus non-epidural or no analgesia in labour (Review)
Copyright ©2005 The Cochrane Collaboration. Published by John Wiley & Sons, Ltd

Fig. 34. Comparison 01. Epidural versus non-epidural analgesia in labour
01.40 Umbilical artery pH < 7.2 at delivery
Review: Epidural versus non-epidural or no analgesia in labour
Comparison: 01 Epidural versus non-epidural analgesia in labour
Outcome: 40 Umbilical artery pH < 7.2 at delivery
Study Epidural analgesia Control Relative Risk (Fixed) Weight Relative Risk (Fixed)
n/N n/N 95% CI (%) 95% CI
Gambling 1998 77/616 82/607 40.6 0.93 [ 0.69, 1.24 ]
Lucas 2001 21/372 41/366 20.3 0.50 [ 0.30, 0.84 ]
Muir 1996 1/28 2/22 1.1 0.39 [ 0.04, 4.06 ]
Nikkola 1997 4/10 4/10 2.0 1.00 [ 0.34, 2.93 ]
Sharma 1997 59/358 71/357 35.0 0.83 [ 0.61, 1.13 ]
Thalme 1974 1/14 2/14 1.0 0.50 [ 0.05, 4.90 ]
Total (95% CI) 1398 1376 100.0 0.80 [ 0.66, 0.96 ]
Total events: 163 (Epidural analgesia), 202 (Control)
Test for heterogeneity chi-square=4.92 df=5 p=0.43 I?? =0.0%
Test for overall effect z=2.33 p=0.02
0.01 0.1 1 10 100
Favours epidural Favours control
Fig. 35. Comparison 01. Epidural versus non-epidural analgesia in labour
01.41 Acidosis defined by cord arterial pH < 7.15
Review: Epidural versus non-epidural or no analgesia in labour
Comparison: 01 Epidural versus non-epidural analgesia in labour
Outcome: 41 Acidosis defined by cord arterial pH < 7.15
Study Epidural analgesia Control Odds Ratio (Fixed) Weight Odds Ratio (Fixed)
n/N n/N 95% CI (%) 95% CI
Clark 1998 15/151 15/144 87.2 0.95 [ 0.45, 2.02 ]
Thorp 1993 2/46 2/41 12.8 0.89 [ 0.12, 6.59 ]
Total (95% CI) 197 185 100.0 0.94 [ 0.46, 1.91 ]
Total events: 17 (Epidural analgesia), 17 (Control)
Test for heterogeneity chi-square=0.00 df=1 p=0.95 I?? =0.0%
Test for overall effect z=0.17 p=0.9
0.1 0.2 0.5 1 2 5 10
Favours epidural Favours control
52Epidural versus non-epidural or no analgesia in labour (Review)
Copyright ©2005 The Cochrane Collaboration. Published by John Wiley & Sons, Ltd

Fig. 36. Comparison 01. Epidural versus non-epidural analgesia in labour
01.42 Naloxone administration
Review: Epidural versus non-epidural or no analgesia in labour
Comparison: 01 Epidural versus non-epidural analgesia in labour
Outcome: 42 Naloxone administration
Study Epidural analgesia Control Relative Risk (Fixed) Weight Relative Risk (Fixed)
n/N n/N 95% CI (%) 95% CI
Bofill 1997 0/49 1/51 1.1 0.35 [ 0.01, 8.31 ]
Head 2002 5/56 31/60 23.0 0.17 [ 0.07, 0.41 ]
Hogg 2000 5/53 28/50 22.1 0.17 [ 0.07, 0.40 ]
Jain 2003 0/39 5/83 2.7 0.19 [ 0.01, 3.37 ]
Lucas 2001 2/372 40/366 30.9 0.05 [ 0.01, 0.20 ]
x Nikkola 1997 0/10 0/10 0.0 Not estimable
Sharma 1997 3/358 13/357 10.0 0.23 [ 0.07, 0.80 ]
Sharma 2002 0/226 13/233 10.2 0.04 [ 0.00, 0.64 ]
Total (95% CI) 1163 1210 100.0 0.13 [ 0.08, 0.21 ]
Total events: 15 (Epidural analgesia), 131 (Control)
Test for heterogeneity chi-square=4.61 df=6 p=0.60 I?? =0.0%
Test for overall effect z=8.21 p<0.00001
0.001 0.01 0.1 1 10 100 1000
Favours epidural Favours control
Fig. 37. Comparison 01. Epidural versus non-epidural analgesia in labour
01.46 Meconium staining of liquor
Review: Epidural versus non-epidural or no analgesia in labour
Comparison: 01 Epidural versus non-epidural analgesia in labour
Outcome: 46 Meconium staining of liquor
Study Epidural analgesia Control Relative Risk (Fixed) Weight Relative Risk (Fixed)
n/N n/N 95% CI (%) 95% CI
Clark 1998 31/156 29/162 28.0 1.11 [ 0.70, 1.75 ]
Howell 2001 7/184 5/185 4.9 1.41 [ 0.46, 4.35 ]
Sharma 1997 63/358 66/357 65.1 0.95 [ 0.70, 1.30 ]
Thalme 1974 1/12 2/12 2.0 0.50 [ 0.05, 4.81 ]
Total (95% CI) 710 716 100.0 1.01 [ 0.79, 1.30 ]
Total events: 102 (Epidural analgesia), 102 (Control)
Test for heterogeneity chi-square=1.01 df=3 p=0.80 I?? =0.0%
Test for overall effect z=0.08 p=0.9
0.01 0.1 1 10 100
Favours epidural Favours control
53Epidural versus non-epidural or no analgesia in labour (Review)
Copyright ©2005 The Cochrane Collaboration. Published by John Wiley & Sons, Ltd

Fig. 38. Comparison 02. Epidural versus non-epidural analgesia for pain relief in labour (primary outcomes by
year trial was performed
02.01 Instrumental vaginal delivery
Review: Epidural versus non-epidural or no analgesia in labour
Comparison: 02 Epidural versus non-epidural analgesia for pain relief in labour (primary outcomes by year trial was performed
Outcome: 01 Instrumental vaginal delivery
Study Epidural Control Relative Risk (Fixed) Weight Relative Risk (Fixed)
n/N n/N 95% CI (%) 95% CI
01 Trials performed before 1985
Grandjean 1979 10/30 12/60 1.8 1.67 [ 0.81, 3.41 ]
Thalme 1974 6/14 4/14 0.9 1.50 [ 0.54, 4.18 ]
Subtotal (95% CI) 44 74 2.8 1.61 [ 0.90, 2.90 ]
Total events: 16 (Epidural), 16 (Control)
Test for heterogeneity chi-square=0.03 df=1 p=0.87 I?? =0.0%
Test for overall effect z=1.59 p=0.1
02 Trials performed after 1985
Bofill 1997 39/49 28/51 6.3 1.45 [ 1.09, 1.93 ]
Clark 1998 24/156 20/162 4.5 1.25 [ 0.72, 2.16 ]
Dickinson 2002 169/493 148/499 33.9 1.16 [ 0.96, 1.39 ]
Gambling 1998 51/616 34/607 7.9 1.48 [ 0.97, 2.25 ]
Head 2002 3/56 3/60 0.7 1.07 [ 0.23, 5.09 ]
Howell 2001 55/184 36/185 8.3 1.54 [ 1.06, 2.22 ]
Jain 2003 12/43 8/83 1.3 2.90 [ 1.28, 6.54 ]
Loughnan 2000 88/304 81/310 18.5 1.11 [ 0.86, 1.43 ]
Lucas 2001 51/372 27/366 6.3 1.86 [ 1.19, 2.90 ]
x Muir 1996 0/28 0/22 0.0 Not estimable
Nikkola 1997 4/10 0/10 0.1 9.00 [ 0.55, 147.95 ]
Philipsen 1989 14/57 14/54 3.3 0.95 [ 0.50, 1.80 ]
Sharma 1997 26/358 15/357 3.5 1.73 [ 0.93, 3.21 ]
Sharma 2002 26/226 7/233 1.6 3.83 [ 1.70, 8.64 ]
Thorp 1993 9/48 5/45 1.2 1.69 [ 0.61, 4.66 ]
Subtotal (95% CI) 3000 3044 97.2 1.37 [ 1.23, 1.53 ]
Total events: 571 (Epidural), 426 (Control)
Test for heterogeneity chi-square=21.69 df=13 p=0.06 I?? =40.1%
Test for overall effect z=5.66 p<0.00001
Total (95% CI) 3044 3118 100.0 1.38 [ 1.24, 1.53 ]
0.001 0.01 0.1 1 10 100 1000
Favours epidural Favours control (Continued . . . )
54Epidural versus non-epidural or no analgesia in labour (Review)
Copyright ©2005 The Cochrane Collaboration. Published by John Wiley & Sons, Ltd
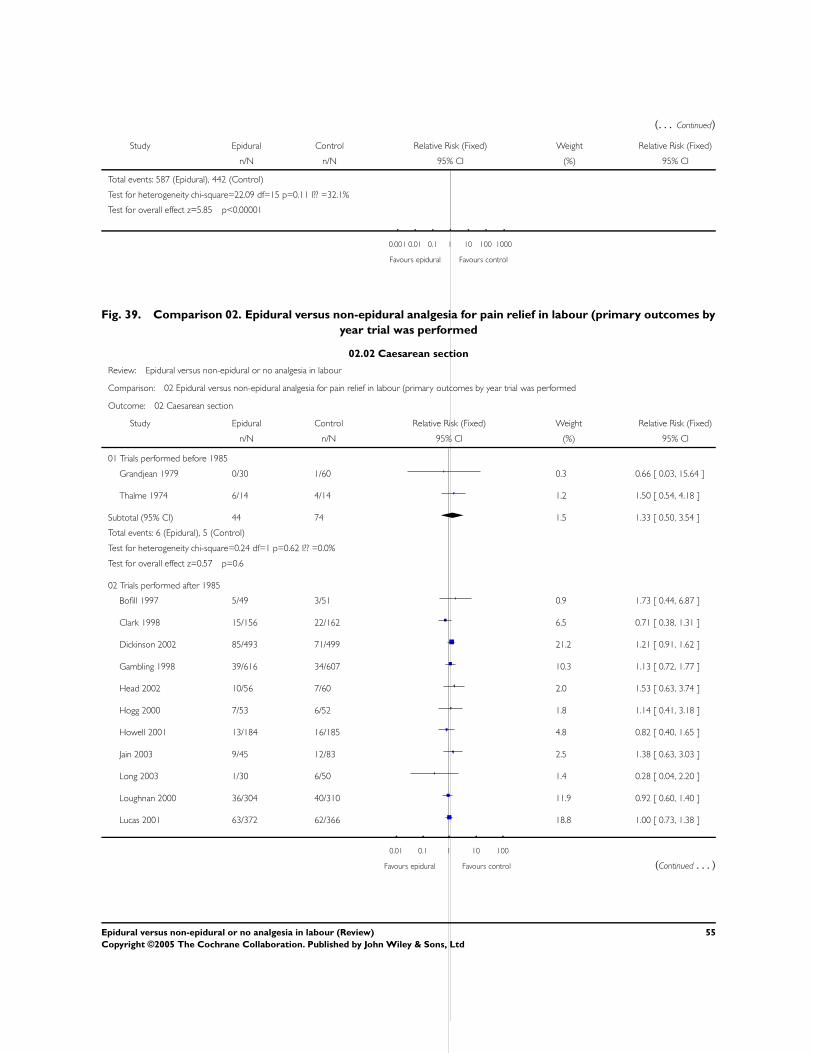
(. . . Continued)
Study Epidural Control Relative Risk (Fixed) Weight Relative Risk (Fixed)
n/N n/N 95% CI (%) 95% CI
Total events: 587 (Epidural), 442 (Control)
Test for heterogeneity chi-square=22.09 df=15 p=0.11 I?? =32.1%
Test for overall effect z=5.85 p<0.00001
0.001 0.01 0.1 1 10 100 1000
Favours epidural Favours control
Fig. 39. Comparison 02. Epidural versus non-epidural analgesia for pain relief in labour (primary outcomes by
year trial was performed
02.02 Caesarean section
Review: Epidural versus non-epidural or no analgesia in labour
Comparison: 02 Epidural versus non-epidural analgesia for pain relief in labour (primary outcomes by year trial was performed
Outcome: 02 Caesarean section
Study Epidural Control Relative Risk (Fixed) Weight Relative Risk (Fixed)
n/N n/N 95% CI (%) 95% CI
01 Trials performed before 1985
Grandjean 1979 0/30 1/60 0.3 0.66 [ 0.03, 15.64 ]
Thalme 1974 6/14 4/14 1.2 1.50 [ 0.54, 4.18 ]
Subtotal (95% CI) 44 74 1.5 1.33 [ 0.50, 3.54 ]
Total events: 6 (Epidural), 5 (Control)
Test for heterogeneity chi-square=0.24 df=1 p=0.62 I?? =0.0%
Test for overall effect z=0.57 p=0.6
02 Trials performed after 1985
Bofill 1997 5/49 3/51 0.9 1.73 [ 0.44, 6.87 ]
Clark 1998 15/156 22/162 6.5 0.71 [ 0.38, 1.31 ]
Dickinson 2002 85/493 71/499 21.2 1.21 [ 0.91, 1.62 ]
Gambling 1998 39/616 34/607 10.3 1.13 [ 0.72, 1.77 ]
Head 2002 10/56 7/60 2.0 1.53 [ 0.63, 3.74 ]
Hogg 2000 7/53 6/52 1.8 1.14 [ 0.41, 3.18 ]
Howell 2001 13/184 16/185 4.8 0.82 [ 0.40, 1.65 ]
Jain 2003 9/45 12/83 2.5 1.38 [ 0.63, 3.03 ]
Long 2003 1/30 6/50 1.4 0.28 [ 0.04, 2.20 ]
Loughnan 2000 36/304 40/310 11.9 0.92 [ 0.60, 1.40 ]
Lucas 2001 63/372 62/366 18.8 1.00 [ 0.73, 1.38 ]
0.01 0.1 1 10 100
Favours epidural Favours control (Continued . . . )
55Epidural versus non-epidural or no analgesia in labour (Review)
Copyright ©2005 The Cochrane Collaboration. Published by John Wiley & Sons, Ltd

(. . . Continued)
Study Epidural Control Relative Risk (Fixed) Weight Relative Risk (Fixed)
n/N n/N 95% CI (%) 95% CI
Muir 1996 3/28 2/22 0.7 1.18 [ 0.22, 6.45 ]
Muir 2000 11/97 9/88 2.8 1.11 [ 0.48, 2.55 ]
x Nikkola 1997 0/10 0/10 0.0 Not estimable
Philipsen 1989 10/57 6/54 1.9 1.58 [ 0.62, 4.05 ]
Sharma 1997 13/358 16/357 4.8 0.81 [ 0.40, 1.66 ]
Sharma 2002 16/226 20/233 5.9 0.82 [ 0.44, 1.55 ]
Thorp 1993 12/48 1/45 0.3 11.25 [ 1.52, 83.05 ]
Subtotal (95% CI) 3182 3234 98.5 1.07 [ 0.93, 1.23 ]
Total events: 348 (Epidural), 333 (Control)
Test for heterogeneity chi-square=14.10 df=16 p=0.59 I?? =0.0%
Test for overall effect z=0.93 p=0.4
Total (95% CI) 3226 3308 100.0 1.07 [ 0.93, 1.23 ]
Total events: 354 (Epidural), 338 (Control)
Test for heterogeneity chi-square=14.62 df=18 p=0.69 I?? =0.0%
Test for overall effect z=0.99 p=0.3
0.01 0.1 1 10 100
Favours epidural Favours control
56Epidural versus non-epidural or no analgesia in labour (Review)
Copyright ©2005 The Cochrane Collaboration. Published by John Wiley & Sons, Ltd

Fig. 40. Comparison 02. Epidural versus non-epidural analgesia for pain relief in labour (primary outcomes by
year trial was performed
02.03 Apgar score less than 7 at 5 minutes
Review: Epidural versus non-epidural or no analgesia in labour
Comparison: 02 Epidural versus non-epidural analgesia for pain relief in labour (primary outcomes by year trial was performed
Outcome: 03 Apgar score less than 7 at 5 minutes
Study Epidural Control Odds Ratio (Fixed) Weight Odds Ratio (Fixed)
n/N n/N 95% CI (%) 95% CI
01 Trials performed before 1985
x Grandjean 1979 0/30 0/60 0.0 Not estimable
Subtotal (95% CI) 30 60 0.0 Not estimable
Total events: 0 (Epidural), 0 (Control)
Test for heterogeneity: not applicable
Test for overall effect: not applicable
02 Trials performed in 1985 and after
x Bofill 1997 0/49 0/51 0.0 Not estimable
Clark 1998 4/156 8/162 18.3 0.51 [ 0.15, 1.72 ]
Dickinson 2002 8/493 4/499 9.4 2.04 [ 0.61, 6.82 ]
Gambling 1998 0/616 1/607 3.6 0.33 [ 0.01, 8.07 ]
Head 2002 5/56 6/60 12.6 0.88 [ 0.25, 3.07 ]
Howell 2001 1/184 1/185 2.4 1.01 [ 0.06, 16.20 ]
x Long 2003 0/30 0/50 0.0 Not estimable
Lucas 2001 7/372 13/366 30.8 0.52 [ 0.21, 1.32 ]
Muir 1996 2/28 2/22 5.0 0.77 [ 0.10, 5.94 ]
x Nikkola 1997 0/10 0/10 0.0 Not estimable
Sharma 1997 1/358 2/357 4.8 0.50 [ 0.04, 5.51 ]
Sharma 2002 1/226 4/233 9.4 0.25 [ 0.03, 2.29 ]
Thorp 1993 0/48 1/45 3.7 0.31 [ 0.01, 7.70 ]
Subtotal (95% CI) 2626 2647 100.0 0.69 [ 0.43, 1.11 ]
Total events: 29 (Epidural), 42 (Control)
Test for heterogeneity chi-square=5.25 df=9 p=0.81 I?? =0.0%
Test for overall effect z=1.54 p=0.1
Total (95% CI) 2656 2707 100.0 0.69 [ 0.43, 1.11 ]
Total events: 29 (Epidural), 42 (Control)
Test for heterogeneity chi-square=5.25 df=9 p=0.81 I?? =0.0%
Test for overall effect z=1.54 p=0.1
0.1 0.2 0.5 1 2 5 10
Favours treatment Favours control
57Epidural versus non-epidural or no analgesia in labour (Review)
Copyright ©2005 The Cochrane Collaboration. Published by John Wiley & Sons, Ltd
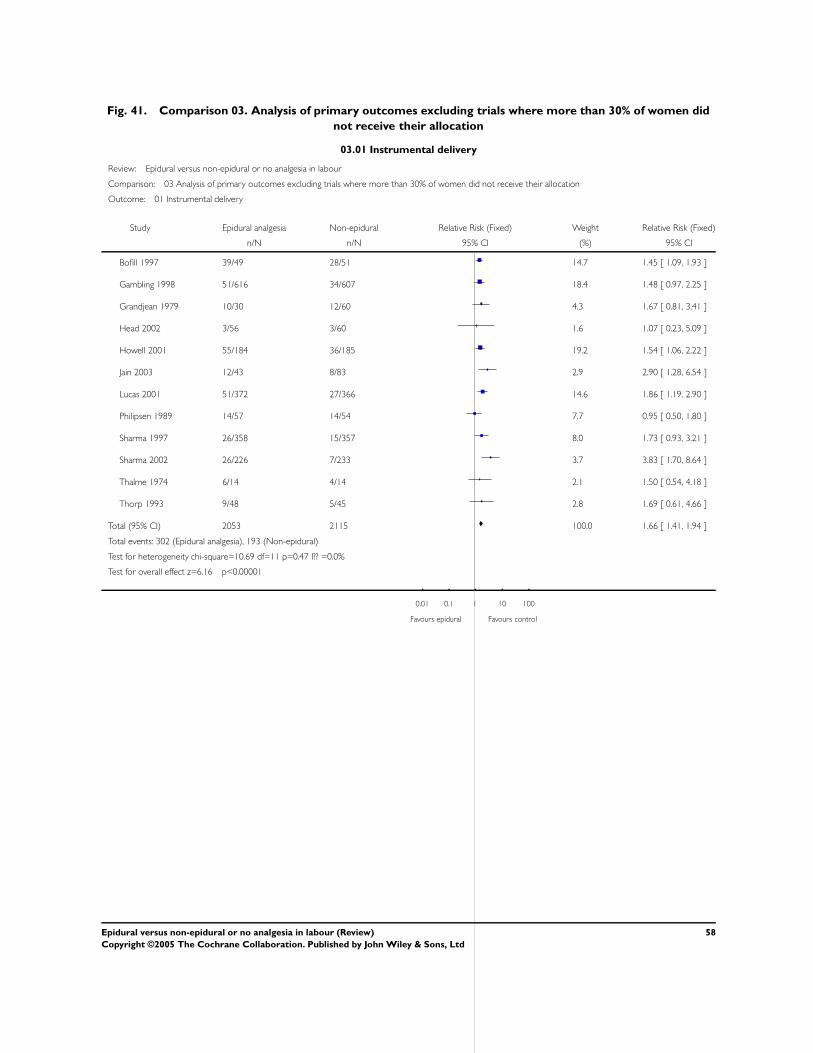
Fig. 41. Comparison 03. Analysis of primary outcomes excluding trials where more than 30% of women did
not receive their allocation
03.01 Instrumental delivery
Review: Epidural versus non-epidural or no analgesia in labour
Comparison: 03 Analysis of primary outcomes excluding trials where more than 30% of women did not receive their allocation
Outcome: 01 Instrumental delivery
Study Epidural analgesia Non-epidural Relative Risk (Fixed) Weight Relative Risk (Fixed)
n/N n/N 95% CI (%) 95% CI
Bofill 1997 39/49 28/51 14.7 1.45 [ 1.09, 1.93 ]
Gambling 1998 51/616 34/607 18.4 1.48 [ 0.97, 2.25 ]
Grandjean 1979 10/30 12/60 4.3 1.67 [ 0.81, 3.41 ]
Head 2002 3/56 3/60 1.6 1.07 [ 0.23, 5.09 ]
Howell 2001 55/184 36/185 19.2 1.54 [ 1.06, 2.22 ]
Jain 2003 12/43 8/83 2.9 2.90 [ 1.28, 6.54 ]
Lucas 2001 51/372 27/366 14.6 1.86 [ 1.19, 2.90 ]
Philipsen 1989 14/57 14/54 7.7 0.95 [ 0.50, 1.80 ]
Sharma 1997 26/358 15/357 8.0 1.73 [ 0.93, 3.21 ]
Sharma 2002 26/226 7/233 3.7 3.83 [ 1.70, 8.64 ]
Thalme 1974 6/14 4/14 2.1 1.50 [ 0.54, 4.18 ]
Thorp 1993 9/48 5/45 2.8 1.69 [ 0.61, 4.66 ]
Total (95% CI) 2053 2115 100.0 1.66 [ 1.41, 1.94 ]
Total events: 302 (Epidural analgesia), 193 (Non-epidural)
Test for heterogeneity chi-square=10.69 df=11 p=0.47 I?? =0.0%
Test for overall effect z=6.16 p<0.00001
0.01 0.1 1 10 100
Favours epidural Favours control
58Epidural versus non-epidural or no analgesia in labour (Review)
Copyright ©2005 The Cochrane Collaboration. Published by John Wiley & Sons, Ltd
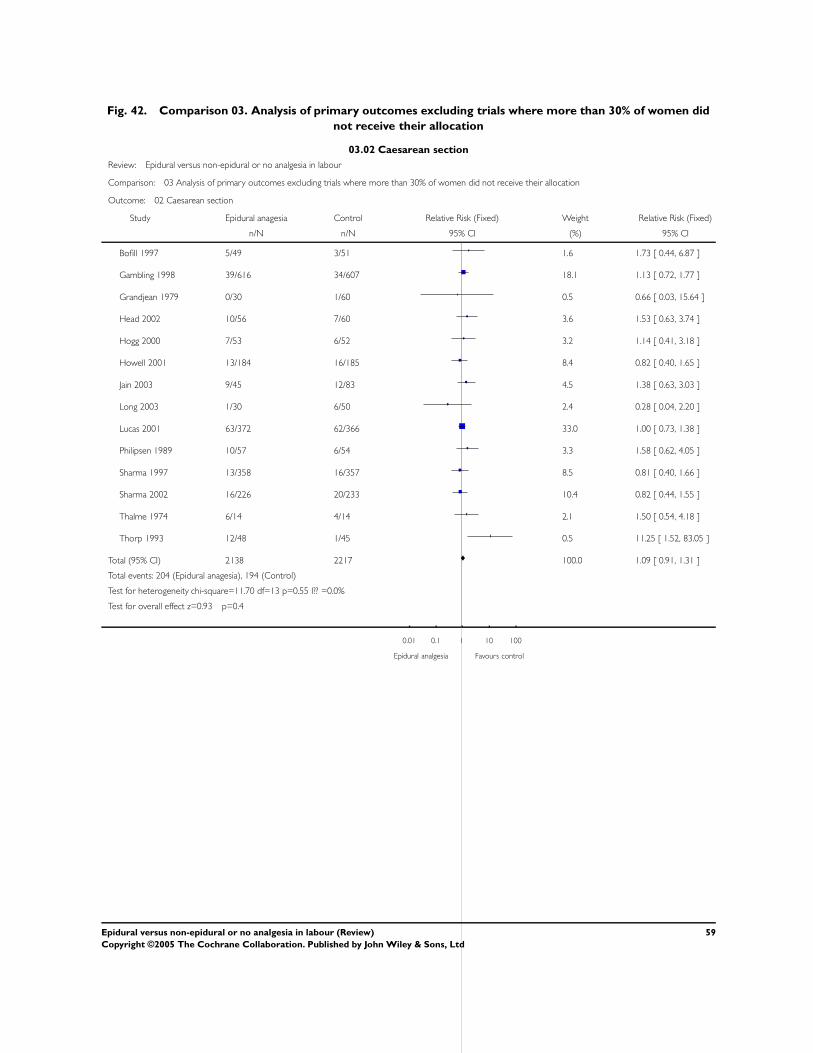
Fig. 42. Comparison 03. Analysis of primary outcomes excluding trials where more than 30% of women did
not receive their allocation
03.02 Caesarean section
Review: Epidural versus non-epidural or no analgesia in labour
Comparison: 03 Analysis of primary outcomes excluding trials where more than 30% of women did not receive their allocation
Outcome: 02 Caesarean section
Study Epidural anagesia Control Relative Risk (Fixed) Weight Relative Risk (Fixed)
n/N n/N 95% CI (%) 95% CI
Bofill 1997 5/49 3/51 1.6 1.73 [ 0.44, 6.87 ]
Gambling 1998 39/616 34/607 18.1 1.13 [ 0.72, 1.77 ]
Grandjean 1979 0/30 1/60 0.5 0.66 [ 0.03, 15.64 ]
Head 2002 10/56 7/60 3.6 1.53 [ 0.63, 3.74 ]
Hogg 2000 7/53 6/52 3.2 1.14 [ 0.41, 3.18 ]
Howell 2001 13/184 16/185 8.4 0.82 [ 0.40, 1.65 ]
Jain 2003 9/45 12/83 4.5 1.38 [ 0.63, 3.03 ]
Long 2003 1/30 6/50 2.4 0.28 [ 0.04, 2.20 ]
Lucas 2001 63/372 62/366 33.0 1.00 [ 0.73, 1.38 ]
Philipsen 1989 10/57 6/54 3.3 1.58 [ 0.62, 4.05 ]
Sharma 1997 13/358 16/357 8.5 0.81 [ 0.40, 1.66 ]
Sharma 2002 16/226 20/233 10.4 0.82 [ 0.44, 1.55 ]
Thalme 1974 6/14 4/14 2.1 1.50 [ 0.54, 4.18 ]
Thorp 1993 12/48 1/45 0.5 11.25 [ 1.52, 83.05 ]
Total (95% CI) 2138 2217 100.0 1.09 [ 0.91, 1.31 ]
Total events: 204 (Epidural anagesia), 194 (Control)
Test for heterogeneity chi-square=11.70 df=13 p=0.55 I?? =0.0%
Test for overall effect z=0.93 p=0.4
0.01 0.1 1 10 100
Epidural analgesia Favours control
59Epidural versus non-epidural or no analgesia in labour (Review)
Copyright ©2005 The Cochrane Collaboration. Published by John Wiley & Sons, Ltd

Fig. 43. Comparison 03. Analysis of primary outcomes excluding trials where more than 30% of women did
not receive their allocation
03.03 Apgar score less than 7 at 5 minutes
Review: Epidural versus non-epidural or no analgesia in labour
Comparison: 03 Analysis of primary outcomes excluding trials where more than 30% of women did not receive their allocation
Outcome: 03 Apgar score less than 7 at 5 minutes
Study Epidural analgesia Control Relative Risk (Fixed) Weight Relative Risk (Fixed)
n/N n/N 95% CI (%) 95% CI
x Bofill 1997 0/49 0/51 0.0 Not estimable
Gambling 1998 0/616 1/607 5.2 0.33 [ 0.01, 8.05 ]
x Grandjean 1979 0/30 0/60 0.0 Not estimable
Head 2002 5/56 6/60 20.0 0.89 [ 0.29, 2.76 ]
Howell 2001 1/184 1/185 3.5 1.01 [ 0.06, 15.95 ]
x Long 2003 0/30 0/50 0.0 Not estimable
Lucas 2001 7/372 13/366 45.4 0.53 [ 0.21, 1.31 ]
Sharma 1997 1/358 2/357 6.9 0.50 [ 0.05, 5.47 ]
Sharma 2002 1/226 4/233 13.6 0.26 [ 0.03, 2.29 ]
Thorp 1993 0/48 1/45 5.4 0.31 [ 0.01, 7.49 ]
Total (95% CI) 1969 2014 100.0 0.56 [ 0.31, 1.01 ]
Total events: 15 (Epidural analgesia), 28 (Control)
Test for heterogeneity chi-square=1.57 df=6 p=0.95 I?? =0.0%
Test for overall effect z=1.91 p=0.06
0.01 0.1 1 10 100
Favours epidural Favours control
60Epidural versus non-epidural or no analgesia in labour (Review)
Copyright ©2005 The Cochrane Collaboration. Published by John Wiley & Sons, Ltd

Fig. 44. Comparison 03. Analysis of primary outcomes excluding trials where more than 30% of women did
not receive their allocation
03.04 Maternal satisfaction with pain relief in labour
Review: Epidural versus non-epidural or no analgesia in labour
Comparison: 03 Analysis of primary outcomes excluding trials where more than 30% of women did not receive their allocation
Outcome: 04 Maternal satisfaction with pain relief in labour
Study Epidural analgesia Control Relative Risk (Random) Weight Relative Risk (Random)
n/N n/N 95% CI (%) 95% CI
Howell 2001 159/170 152/168 35.4 1.03 [ 0.97, 1.10 ]
Jain 2003 39/43 57/83 30.2 1.32 [ 1.11, 1.57 ]
Sharma 2002 214/226 161/233 34.4 1.37 [ 1.25, 1.50 ]
Total (95% CI) 439 484 100.0 1.23 [ 0.97, 1.55 ]
Total events: 412 (Epidural analgesia), 370 (Control)
Test for heterogeneity chi-square=33.26 df=2 p=<0.0001 I?? =94.0%
Test for overall effect z=1.72 p=0.09
0.1 0.2 0.5 1 2 5 10
Favours control Favours epidural
Fig. 45. Comparison 03. Analysis of primary outcomes excluding trials where more than 30% of women did
not receive their allocation
03.05 Long-term backache
Review: Epidural versus non-epidural or no analgesia in labour
Comparison: 03 Analysis of primary outcomes excluding trials where more than 30% of women did not receive their allocation
Outcome: 05 Long-term backache
Study Epidural Control Relative Risk (Fixed) Weight Relative Risk (Fixed)
n/N n/N 95% CI (%) 95% CI
Howell 2001 115/151 112/155 100.0 1.05 [ 0.92, 1.20 ]
Total (95% CI) 151 155 100.0 1.05 [ 0.92, 1.20 ]
Total events: 115 (Epidural), 112 (Control)
Test for heterogeneity: not applicable
Test for overall effect z=0.78 p=0.4
0.1 0.2 0.5 1 2 5 10
Favours epidural Favours control
61Epidural versus non-epidural or no analgesia in labour (Review)
Copyright ©2005 The Cochrane Collaboration. Published by John Wiley & Sons, Ltd

Fig. 46. Comparison 04. Sensitivity analysis of primary outcomes based on trial quality
04.01 Woman’s perception of pain relief in labour
Review: Epidural versus non-epidural or no analgesia in labour
Comparison: 04 Sensitivity analysis of primary outcomes based on trial quality
Outcome: 01 Woman’s perception of pain relief in labour
Study Epidural analgesia Control Weighted Mean Difference (Fixed) Weight Weighted Mean Difference (Fixed)
N
Mean(SD) N
Mean(SD) 95% CI (%) 95% CI
Total (95% CI) 0 0 0.0 Not estimable
Test for heterogeneity: not applicable
Test for overall effect: not applicable
-10.0 -5.0 0 5.0 10.0
Favours epidural Favours control
Fig. 47. Comparison 04. Sensitivity analysis of primary outcomes based on trial quality
04.02 Instrumental delivery
Review: Epidural versus non-epidural or no analgesia in labour
Comparison: 04 Sensitivity analysis of primary outcomes based on trial quality
Outcome: 02 Instrumental delivery
Study Epidural analgesia Non-epidural Relative Risk (Random) Weight Relative Risk (Random)
n/N n/N 95% CI (%) 95% CI
Bofill 1997 39/49 28/51 15.5 1.45 [ 1.09, 1.93 ]
Clark 1998 24/156 20/162 8.0 1.25 [ 0.72, 2.16 ]
Dickinson 2002 169/493 148/499 19.7 1.16 [ 0.96, 1.39 ]
Head 2002 3/56 3/60 1.4 1.07 [ 0.23, 5.09 ]
Howell 2001 55/184 36/185 12.7 1.54 [ 1.06, 2.22 ]
Jain 2003 12/43 8/83 4.4 2.90 [ 1.28, 6.54 ]
Loughnan 2000 88/304 81/310 16.7 1.11 [ 0.86, 1.43 ]
Lucas 2001 51/372 27/366 10.4 1.86 [ 1.19, 2.90 ]
Sharma 1997 26/358 15/357 6.8 1.73 [ 0.93, 3.21 ]
Sharma 2002 26/226 7/233 4.4 3.83 [ 1.70, 8.64 ]
Total (95% CI) 2241 2306 100.0 1.47 [ 1.21, 1.78 ]
Total events: 493 (Epidural analgesia), 373 (Non-epidural)
Test for heterogeneity chi-square=18.30 df=9 p=0.03 I?? =50.8%
Test for overall effect z=3.96 p=0.00007
0.001 0.01 0.1 1 10 100 1000
Favours epidural Favours control
62Epidural versus non-epidural or no analgesia in labour (Review)
Copyright ©2005 The Cochrane Collaboration. Published by John Wiley & Sons, Ltd

Fig. 48. Comparison 04. Sensitivity analysis of primary outcomes based on trial quality
04.03 Caesarean section
Review: Epidural versus non-epidural or no analgesia in labour
Comparison: 04 Sensitivity analysis of primary outcomes based on trial quality
Outcome: 03 Caesarean section
Study Epidural anagesia Control Relative Risk (Fixed) Weight Relative Risk (Fixed)
n/N n/N 95% CI (%) 95% CI
Bofill 1997 5/49 3/51 1.1 1.73 [ 0.44, 6.87 ]
Clark 1998 15/156 22/162 7.9 0.71 [ 0.38, 1.31 ]
Dickinson 2002 85/493 71/499 25.8 1.21 [ 0.91, 1.62 ]
Head 2002 10/56 7/60 2.5 1.53 [ 0.63, 3.74 ]
Howell 2001 13/184 16/185 5.8 0.82 [ 0.40, 1.65 ]
Jain 2003 9/45 12/83 3.1 1.38 [ 0.63, 3.03 ]
Loughnan 2000 36/304 40/310 14.5 0.92 [ 0.60, 1.40 ]
Lucas 2001 63/372 62/366 22.9 1.00 [ 0.73, 1.38 ]
Muir 2000 11/97 9/88 3.5 1.11 [ 0.48, 2.55 ]
Sharma 1997 13/358 16/357 5.9 0.81 [ 0.40, 1.66 ]
Sharma 2002 16/226 20/233 7.2 0.82 [ 0.44, 1.55 ]
Total (95% CI) 2340 2394 100.0 1.02 [ 0.88, 1.19 ]
Total events: 276 (Epidural anagesia), 278 (Control)
Test for heterogeneity chi-square=6.15 df=10 p=0.80 I?? =0.0%
Test for overall effect z=0.27 p=0.8
0.001 0.01 0.1 1 10 100 1000
Epidural analgesia Favours control
63Epidural versus non-epidural or no analgesia in labour (Review)
Copyright ©2005 The Cochrane Collaboration. Published by John Wiley & Sons, Ltd
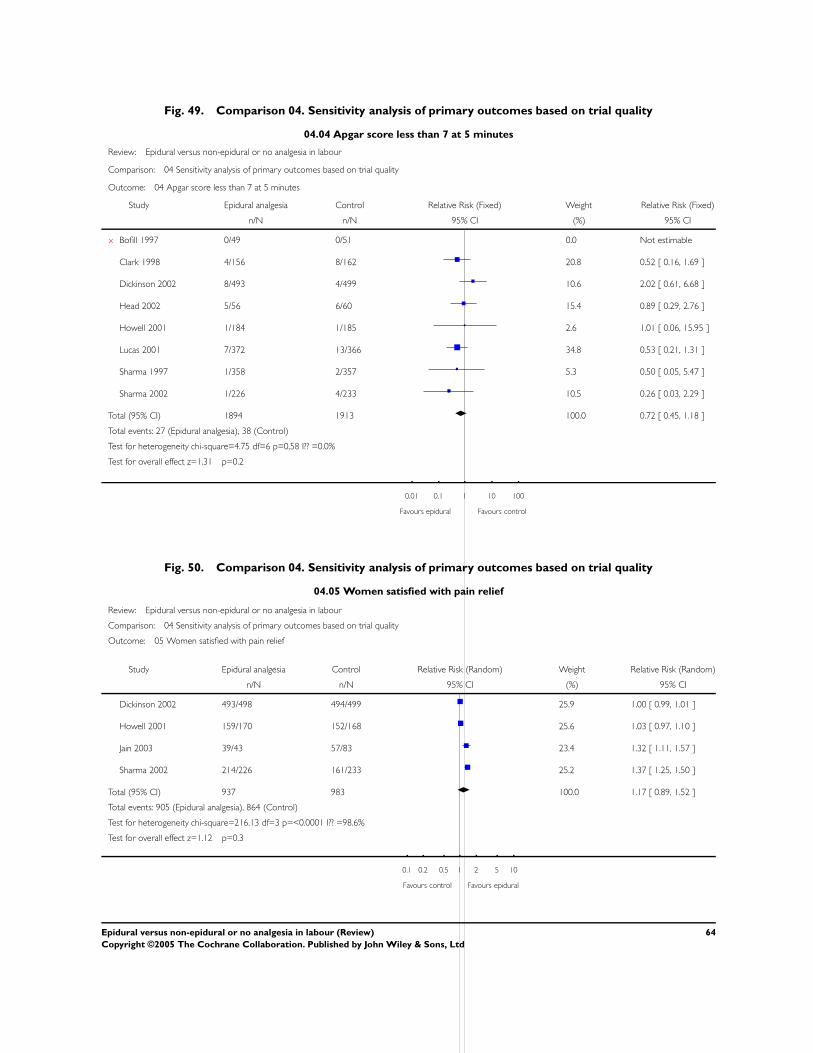
Fig. 49. Comparison 04. Sensitivity analysis of primary outcomes based on trial quality
04.04 Apgar score less than 7 at 5 minutes
Review: Epidural versus non-epidural or no analgesia in labour
Comparison: 04 Sensitivity analysis of primary outcomes based on trial quality
Outcome: 04 Apgar score less than 7 at 5 minutes
Study Epidural analgesia Control Relative Risk (Fixed) Weight Relative Risk (Fixed)
n/N n/N 95% CI (%) 95% CI
x Bofill 1997 0/49 0/51 0.0 Not estimable
Clark 1998 4/156 8/162 20.8 0.52 [ 0.16, 1.69 ]
Dickinson 2002 8/493 4/499 10.6 2.02 [ 0.61, 6.68 ]
Head 2002 5/56 6/60 15.4 0.89 [ 0.29, 2.76 ]
Howell 2001 1/184 1/185 2.6 1.01 [ 0.06, 15.95 ]
Lucas 2001 7/372 13/366 34.8 0.53 [ 0.21, 1.31 ]
Sharma 1997 1/358 2/357 5.3 0.50 [ 0.05, 5.47 ]
Sharma 2002 1/226 4/233 10.5 0.26 [ 0.03, 2.29 ]
Total (95% CI) 1894 1913 100.0 0.72 [ 0.45, 1.18 ]
Total events: 27 (Epidural analgesia), 38 (Control)
Test for heterogeneity chi-square=4.75 df=6 p=0.58 I?? =0.0%
Test for overall effect z=1.31 p=0.2
0.01 0.1 1 10 100
Favours epidural Favours control
Fig. 50. Comparison 04. Sensitivity analysis of primary outcomes based on trial quality
04.05 Women satisfied with pain relief
Review: Epidural versus non-epidural or no analgesia in labour
Comparison: 04 Sensitivity analysis of primary outcomes based on trial quality
Outcome: 05 Women satisfied with pain relief
Study Epidural analgesia Control Relative Risk (Random) Weight Relative Risk (Random)
n/N n/N 95% CI (%) 95% CI
Dickinson 2002 493/498 494/499 25.9 1.00 [ 0.99, 1.01 ]
Howell 2001 159/170 152/168 25.6 1.03 [ 0.97, 1.10 ]
Jain 2003 39/43 57/83 23.4 1.32 [ 1.11, 1.57 ]
Sharma 2002 214/226 161/233 25.2 1.37 [ 1.25, 1.50 ]
Total (95% CI) 937 983 100.0 1.17 [ 0.89, 1.52 ]
Total events: 905 (Epidural analgesia), 864 (Control)
Test for heterogeneity chi-square=216.13 df=3 p=<0.0001 I?? =98.6%
Test for overall effect z=1.12 p=0.3
0.1 0.2 0.5 1 2 5 10
Favours control Favours epidural
64Epidural versus non-epidural or no analgesia in labour (Review)
Copyright ©2005 The Cochrane Collaboration. Published by John Wiley & Sons, Ltd
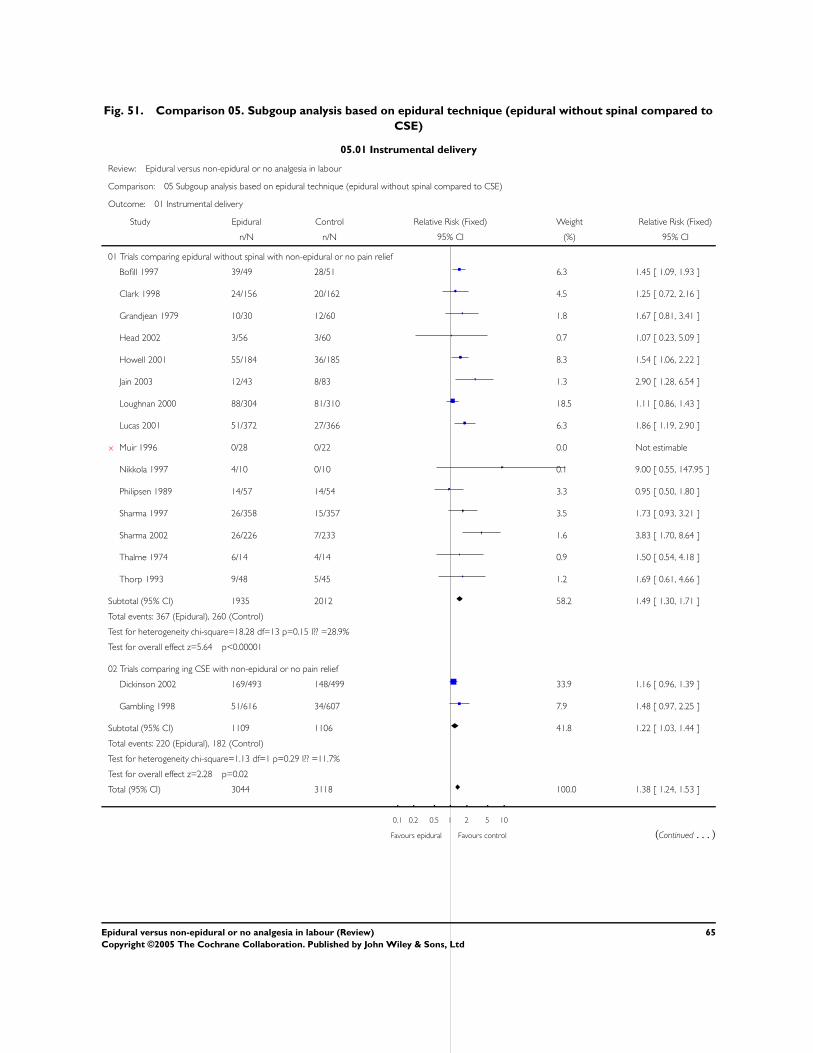
Fig. 51. Comparison 05. Subgoup analysis based on epidural technique (epidural without spinal compared to
CSE)
05.01 Instrumental delivery
Review: Epidural versus non-epidural or no analgesia in labour
Comparison: 05 Subgoup analysis based on epidural technique (epidural without spinal compared to CSE)
Outcome: 01 Instrumental delivery
Study Epidural Control Relative Risk (Fixed) Weight Relative Risk (Fixed)
n/N n/N 95% CI (%) 95% CI
01 Trials comparing epidural without spinal with non-epidural or no pain relief
Bofill 1997 39/49 28/51 6.3 1.45 [ 1.09, 1.93 ]
Clark 1998 24/156 20/162 4.5 1.25 [ 0.72, 2.16 ]
Grandjean 1979 10/30 12/60 1.8 1.67 [ 0.81, 3.41 ]
Head 2002 3/56 3/60 0.7 1.07 [ 0.23, 5.09 ]
Howell 2001 55/184 36/185 8.3 1.54 [ 1.06, 2.22 ]
Jain 2003 12/43 8/83 1.3 2.90 [ 1.28, 6.54 ]
Loughnan 2000 88/304 81/310 18.5 1.11 [ 0.86, 1.43 ]
Lucas 2001 51/372 27/366 6.3 1.86 [ 1.19, 2.90 ]
x Muir 1996 0/28 0/22 0.0 Not estimable
Nikkola 1997 4/10 0/10 0.1 9.00 [ 0.55, 147.95 ]
Philipsen 1989 14/57 14/54 3.3 0.95 [ 0.50, 1.80 ]
Sharma 1997 26/358 15/357 3.5 1.73 [ 0.93, 3.21 ]
Sharma 2002 26/226 7/233 1.6 3.83 [ 1.70, 8.64 ]
Thalme 1974 6/14 4/14 0.9 1.50 [ 0.54, 4.18 ]
Thorp 1993 9/48 5/45 1.2 1.69 [ 0.61, 4.66 ]
Subtotal (95% CI) 1935 2012 58.2 1.49 [ 1.30, 1.71 ]
Total events: 367 (Epidural), 260 (Control)
Test for heterogeneity chi-square=18.28 df=13 p=0.15 I?? =28.9%
Test for overall effect z=5.64 p<0.00001
02 Trials comparing ing CSE with non-epidural or no pain relief
Dickinson 2002 169/493 148/499 33.9 1.16 [ 0.96, 1.39 ]
Gambling 1998 51/616 34/607 7.9 1.48 [ 0.97, 2.25 ]
Subtotal (95% CI) 1109 1106 41.8 1.22 [ 1.03, 1.44 ]
Total events: 220 (Epidural), 182 (Control)
Test for heterogeneity chi-square=1.13 df=1 p=0.29 I?? =11.7%
Test for overall effect z=2.28 p=0.02
Total (95% CI) 3044 3118 100.0 1.38 [ 1.24, 1.53 ]
0.1 0.2 0.5 1 2 5 10
Favours epidural Favours control (Continued . . . )
65Epidural versus non-epidural or no analgesia in labour (Review)
Copyright ©2005 The Cochrane Collaboration. Published by John Wiley & Sons, Ltd
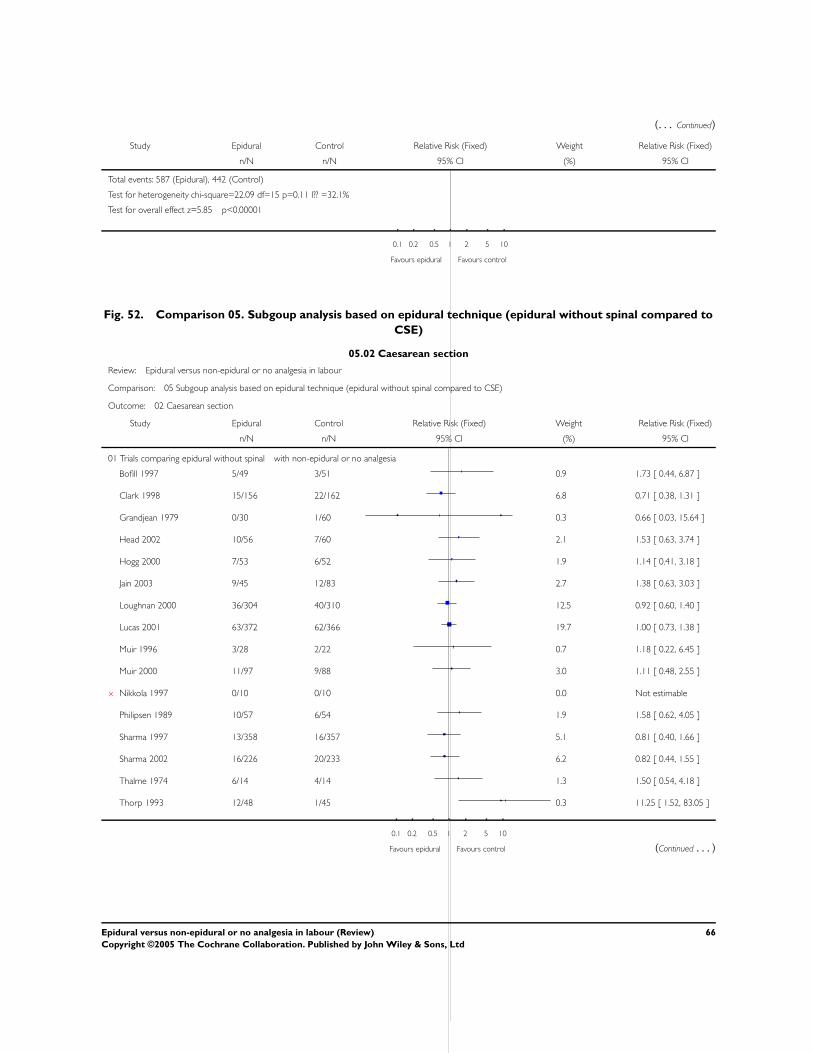
(. . . Continued)
Study Epidural Control Relative Risk (Fixed) Weight Relative Risk (Fixed)
n/N n/N 95% CI (%) 95% CI
Total events: 587 (Epidural), 442 (Control)
Test for heterogeneity chi-square=22.09 df=15 p=0.11 I?? =32.1%
Test for overall effect z=5.85 p<0.00001
0.1 0.2 0.5 1 2 5 10
Favours epidural Favours control
Fig. 52. Comparison 05. Subgoup analysis based on epidural technique (epidural without spinal compared to
CSE)
05.02 Caesarean section
Review: Epidural versus non-epidural or no analgesia in labour
Comparison: 05 Subgoup analysis based on epidural technique (epidural without spinal compared to CSE)
Outcome: 02 Caesarean section
Study Epidural Control Relative Risk (Fixed) Weight Relative Risk (Fixed)
n/N n/N 95% CI (%) 95% CI
01 Trials comparing epidural without spinal with non-epidural or no analgesia
Bofill 1997 5/49 3/51 0.9 1.73 [ 0.44, 6.87 ]
Clark 1998 15/156 22/162 6.8 0.71 [ 0.38, 1.31 ]
Grandjean 1979 0/30 1/60 0.3 0.66 [ 0.03, 15.64 ]
Head 2002 10/56 7/60 2.1 1.53 [ 0.63, 3.74 ]
Hogg 2000 7/53 6/52 1.9 1.14 [ 0.41, 3.18 ]
Jain 2003 9/45 12/83 2.7 1.38 [ 0.63, 3.03 ]
Loughnan 2000 36/304 40/310 12.5 0.92 [ 0.60, 1.40 ]
Lucas 2001 63/372 62/366 19.7 1.00 [ 0.73, 1.38 ]
Muir 1996 3/28 2/22 0.7 1.18 [ 0.22, 6.45 ]
Muir 2000 11/97 9/88 3.0 1.11 [ 0.48, 2.55 ]
x Nikkola 1997 0/10 0/10 0.0 Not estimable
Philipsen 1989 10/57 6/54 1.9 1.58 [ 0.62, 4.05 ]
Sharma 1997 13/358 16/357 5.1 0.81 [ 0.40, 1.66 ]
Sharma 2002 16/226 20/233 6.2 0.82 [ 0.44, 1.55 ]
Thalme 1974 6/14 4/14 1.3 1.50 [ 0.54, 4.18 ]
Thorp 1993 12/48 1/45 0.3 11.25 [ 1.52, 83.05 ]
0.1 0.2 0.5 1 2 5 10
Favours epidural Favours control (Continued . . . )
66Epidural versus non-epidural or no analgesia in labour (Review)
Copyright ©2005 The Cochrane Collaboration. Published by John Wiley & Sons, Ltd

(. . . Continued)
Study Epidural Control Relative Risk (Fixed) Weight Relative Risk (Fixed)
n/N n/N 95% CI (%) 95% CI
Subtotal (95% CI) 1903 1967 65.5 1.05 [ 0.88, 1.26 ]
Total events: 216 (Epidural), 211 (Control)
Test for heterogeneity chi-square=11.53 df=14 p=0.64 I?? =0.0%
Test for overall effect z=0.57 p=0.6
02 Trials comparing CSE with non-epidural or no analgesia
Dickinson 2002 85/493 71/499 22.3 1.21 [ 0.91, 1.62 ]
Gambling 1998 39/616 34/607 10.8 1.13 [ 0.72, 1.77 ]
Long 2003 1/30 6/50 1.4 0.28 [ 0.04, 2.20 ]
Subtotal (95% CI) 1139 1156 34.5 1.15 [ 0.90, 1.46 ]
Total events: 125 (Epidural), 111 (Control)
Test for heterogeneity chi-square=1.95 df=2 p=0.38 I?? =0.0%
Test for overall effect z=1.12 p=0.3
Total (95% CI) 3042 3123 100.0 1.09 [ 0.94, 1.25 ]
Total events: 341 (Epidural), 322 (Control)
Test for heterogeneity chi-square=14.07 df=17 p=0.66 I?? =0.0%
Test for overall effect z=1.13 p=0.3
0.1 0.2 0.5 1 2 5 10
Favours epidural Favours control
67Epidural versus non-epidural or no analgesia in labour (Review)
Copyright ©2005 The Cochrane Collaboration. Published by John Wiley & Sons, Ltd

Fig. 53. Comparison 05. Subgoup analysis based on epidural technique (epidural without spinal compared to
CSE)
05.03 Apgar score less than 7 at 5 minutes
Review: Epidural versus non-epidural or no analgesia in labour
Comparison: 05 Subgoup analysis based on epidural technique (epidural without spinal compared to CSE)
Outcome: 03 Apgar score less than 7 at 5 minutes
Study Epidural Control Relative Risk (Fixed) Weight Relative Risk (Fixed)
n/N n/N 95% CI (%) 95% CI
01 Trial comparing epidural without spinal to non-epidural or no analgesia
x Bofill 1997 0/49 0/51 0.0 Not estimable
Clark 1998 4/156 8/162 18.3 0.52 [ 0.16, 1.69 ]
x Grandjean 1979 0/30 0/60 0.0 Not estimable
Head 2002 5/56 6/60 13.5 0.89 [ 0.29, 2.76 ]
Howell 2001 1/184 1/185 2.3 1.01 [ 0.06, 15.95 ]
Lucas 2001 7/372 13/366 30.5 0.53 [ 0.21, 1.31 ]
Muir 1996 2/28 2/22 5.2 0.79 [ 0.12, 5.14 ]
x Nikkola 1997 0/10 0/10 0.0 Not estimable
Sharma 1997 1/358 2/357 4.7 0.50 [ 0.05, 5.47 ]
Sharma 2002 1/226 4/233 9.2 0.26 [ 0.03, 2.29 ]
Thorp 1993 0/48 1/45 3.6 0.31 [ 0.01, 7.49 ]
Subtotal (95% CI) 1517 1551 87.2 0.57 [ 0.34, 0.96 ]
Total events: 21 (Epidural), 37 (Control)
Test for heterogeneity chi-square=1.58 df=7 p=0.98 I?? =0.0%
Test for overall effect z=2.10 p=0.04
02 Trials comparing CSE to non-epidural or no pain relief
Dickinson 2002 8/493 4/499 9.3 2.02 [ 0.61, 6.68 ]
Gambling 1998 0/616 1/607 3.5 0.33 [ 0.01, 8.05 ]
x Long 2003 0/30 0/50 0.0 Not estimable
Subtotal (95% CI) 1139 1156 12.8 1.56 [ 0.54, 4.52 ]
Total events: 8 (Epidural), 5 (Control)
Test for heterogeneity chi-square=1.09 df=1 p=0.30 I?? =8.7%
Test for overall effect z=0.81 p=0.4
Total (95% CI) 2656 2707 100.0 0.70 [ 0.44, 1.10 ]
Total events: 29 (Epidural), 42 (Control)
Test for heterogeneity chi-square=5.25 df=9 p=0.81 I?? =0.0%
Test for overall effect z=1.54 p=0.1
0.1 0.2 0.5 1 2 5 10
Favours epidural Favours control
68Epidural versus non-epidural or no analgesia in labour (Review)
Copyright ©2005 The Cochrane Collaboration. Published by John Wiley & Sons, Ltd
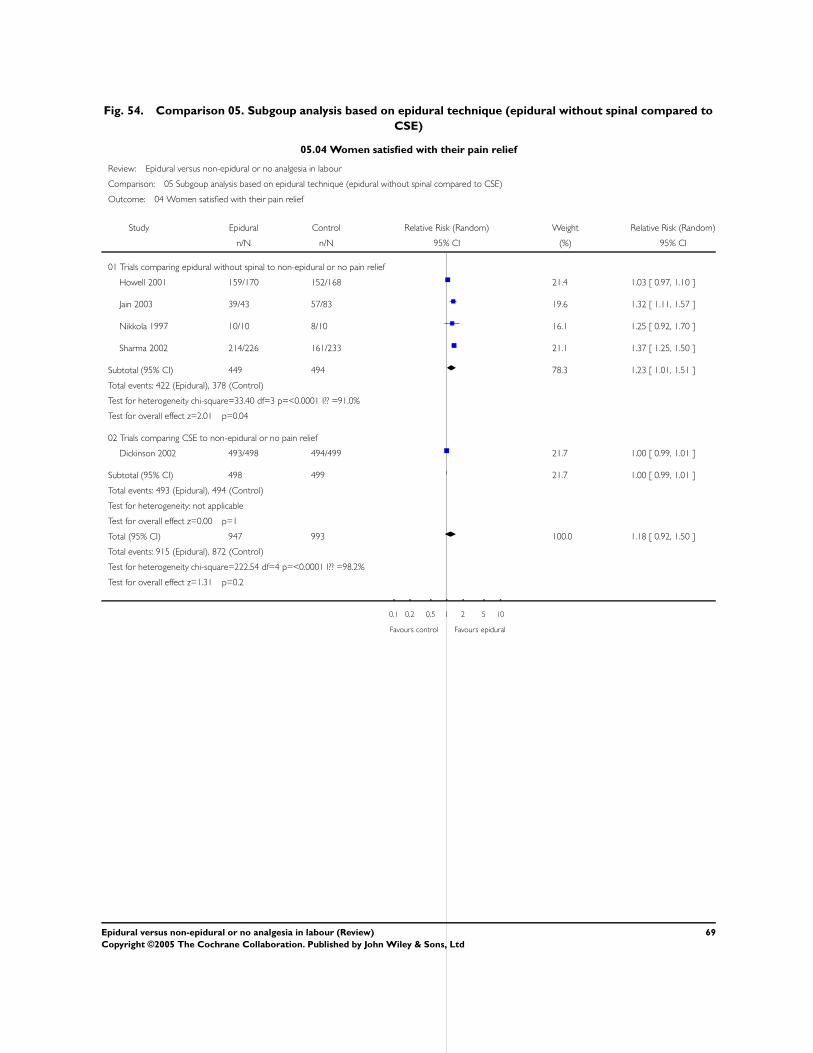
Fig. 54. Comparison 05. Subgoup analysis based on epidural technique (epidural without spinal compared to
CSE)
05.04 Women satisfied with their pain relief
Review: Epidural versus non-epidural or no analgesia in labour
Comparison: 05 Subgoup analysis based on epidural technique (epidural without spinal compared to CSE)
Outcome: 04 Women satisfied with their pain relief
Study Epidural Control Relative Risk (Random) Weight Relative Risk (Random)
n/N n/N 95% CI (%) 95% CI
01 Trials comparing epidural without spinal to non-epidural or no pain relief
Howell 2001 159/170 152/168 21.4 1.03 [ 0.97, 1.10 ]
Jain 2003 39/43 57/83 19.6 1.32 [ 1.11, 1.57 ]
Nikkola 1997 10/10 8/10 16.1 1.25 [ 0.92, 1.70 ]
Sharma 2002 214/226 161/233 21.1 1.37 [ 1.25, 1.50 ]
Subtotal (95% CI) 449 494 78.3 1.23 [ 1.01, 1.51 ]
Total events: 422 (Epidural), 378 (Control)
Test for heterogeneity chi-square=33.40 df=3 p=<0.0001 I?? =91.0%
Test for overall effect z=2.01 p=0.04
02 Trials comparing CSE to non-epidural or no pain relief
Dickinson 2002 493/498 494/499 21.7 1.00 [ 0.99, 1.01 ]
Subtotal (95% CI) 498 499 21.7 1.00 [ 0.99, 1.01 ]
Total events: 493 (Epidural), 494 (Control)
Test for heterogeneity: not applicable
Test for overall effect z=0.00 p=1
Total (95% CI) 947 993 100.0 1.18 [ 0.92, 1.50 ]
Total events: 915 (Epidural), 872 (Control)
Test for heterogeneity chi-square=222.54 df=4 p=<0.0001 I?? =98.2%
Test for overall effect z=1.31 p=0.2
0.1 0.2 0.5 1 2 5 10
Favours control Favours epidural
69Epidural versus non-epidural or no analgesia in labour (Review)
Copyright ©2005 The Cochrane Collaboration. Published by John Wiley & Sons, Ltd