The ABCs of PDCs (Planning & Development Councils) and GIS in West Virginia

EPID 611
Presentation on Using GIS in Public
Health - West Virginia University
DR. NICOLAS A. VALCIK, DIRECTOR OF INSTITUTIONAL RESEARCH
HEALTH SCIENCES CENTER, APRIL 19, 2016 – 9:00 A.M. TO 11:00 A.M.
1
All rights reserved. No part of this publication may be reproduced, stored in a retrieval system, or transmitted, in any form, or by any means, electronic, mechanical, photocopying, recording, or otherwise, without the consent of the author. Copyright 2016©.

Introduction
What is Geospatial Information Systems?
Why should anyone use GIS?
Academic Areas that Use GIS
Applied Areas that Use GIS
Difficulty of Using GIS
GPS – Satellite, Aerial Photos, Laser
Points
CAD vs. GIS
2
GIS image taken from USGS, 2008

History of Mapping - Epidemiology
John Snow – Apprentice Surgeon
Mapped down Cholera outbreaks in relation to water supply –
London 1854.
Linked Cholera to the Water Pumps at particular sites.
Qualitative Collection of Data through interviews
Mapped down locations given to him in interviews
Died before his findings were verified.
3
Image taken from Atif, 2013
(Atif, 2013)

Understanding your Data
Research Design
Data collection methodology
Linking or joining data sets
Limitations on inputting information into GIS
Coordinate System – Which one to use (e.g. NAD83)?
Shapefiles = Layer
Underlying Tables utilizes Foxpro database
ArcMap, ArcSDE, ArcIMS
Using SAS with ArcMAP
4
GIS image taken from Starcher, 2008

5West Virginia University - Student / Faculty / Staff Proximity Analysis
Locate students and employees that live around West Virginia University
Shows patterns for infrastructure concern (i.e. utilities and streets)
Real Estate utilizing GIS Maps for Marketing university housing
Locks student and employee addresses to map in relation to public transportation
and traffic count
Analyzing data on where students live and compares their class locations for campuses
Allows for a retention study on students by class level.
Allows for analysis of distribution of where students and employees live in Morgantown
Can be superimposed on Central Appraisal District Information

6West Virginia University – Employee Chloropleth Map
GIS image taken from Valcik and Servian, 2015

West Virginia University - Student / Faculty / Staff Proximity Analysis
Layers can incorporate:
Hospitals
Crime Statistics
Emergency Calls
Health Issues
Hazardous Material locations
Traffic Patterns
Emergency Evacuation Routes

GIS Used for Disease Outbreak - Region
Tracking the Spread and Zeroing on the Root Cause
Ebola
8
GIS Ebola Outbreak Map from ABC News, 2015
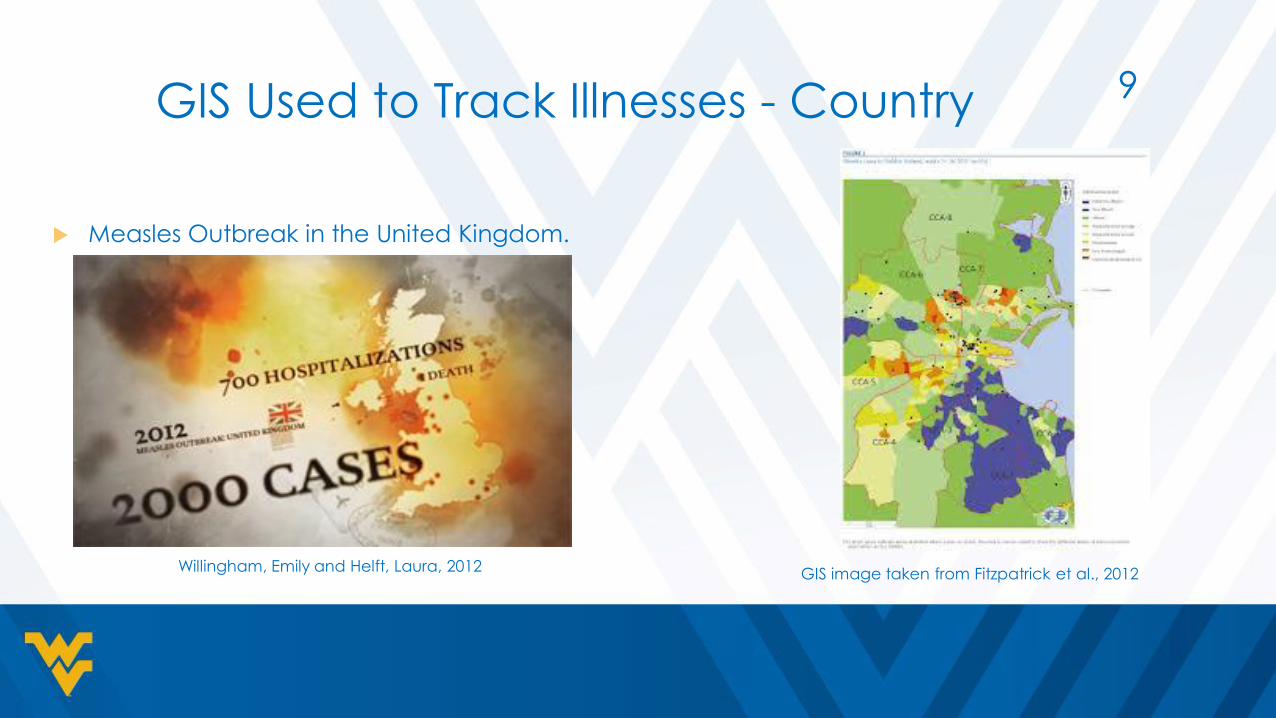
GIS Used to Track Illnesses - Country
Measles Outbreak in the United Kingdom.
9
Willingham, Emily and Helft, Laura, 2012GIS image taken from Fitzpatrick et al., 2012

GIS Mapping Radiation Fallout Effects
Mapping thyroid cancer post-Chernobyl 1986 to 1995 in
Belarus (Krivoruchko, 2015).
10
GIS image taken from Krivoruchko, 2015.GIS image taken from Krivoruchko, 2015.

GIS Mapping Accidental Radioactive Plumes
Potential Radioactive Fallout from Accidental Nuclear
Power Plant Failure in the United States (Ayres, 2012).
11
GIS image taken from Ayres, 2012.

GIS Mapping Nuclear Accident – Ground
Contamination
Ground radioactive iodine released from Fukushima
Daiichi (Fukushima Update, 2013).
12
GIS images taken from Fukushima Update, 2013.

GIS Mapping of Shark Attacks
Shark attacks mapped globally in 2014 (Tracking Sharks,
2014).
13
GIS image taken from Tracking Sharks, 2014.

GIS Mapping of Public Health Departments
Resources for West Virginia Public Health – State and
local (West Virginia GIS Technical Center, 2015).
14
GIS image taken from West Virginia
GIS Technical Center, 2015.

GIS Mapping of Crocodile Attacks
Northern Territory of Australia – Location of Crocodile
Attacks 1971 – 2013 (Everything Dinosaur, 2013).
15
GIS image taken from Everything Dinosaur, 2013.

GIS Capability of Tracking Industrial
Contamination to Health Issues
Love Canal industrial waste exposure to residents -
1978.
16
Image taken from New York
Department of Health
Environmental Investigations, 2015.Chemical and Engineering News, 2008

GIS Usage to Track Animal Diseases in Relation
to Population Centers
Rabies Virus Reservoirs in the United States(Ayres,
Blanton et. Al. ,2006)
17
GIS map produced by United States Department of
Agriculture ,2014.

Examples of Where Spatial Mapping can be
Critical for Public Health (Continued)
Mozambique Onchocerciasis Exposure Risk (a.k.a. River
Blindness induced by a parasitic worm.)
18
CDC GIS Map from Center for
Disease Control (CDC) Website, 2015

GIS Mapping Chronic Health Problems
Heart Disease and Strokes (CDC)
19
CDC GIS Map from Center for Disease Control (CDC)
Website, 2015

GIS Tracking Chronic Illnesses through via Web
Pennsylvania Cancer Atlas(CDC)
Rates for Colorectal Cancer by Incidence by County
1994 - 2002 (CDC)
ArcIMS
20
CDC GIS Map from Center for
Disease Control (CDC) Website, 2015

GIS Tracking Health Issues with Industrial Activity
Childhood Lead Poisoning Risk Analysis, Philadelphia,
Pennsylvania (CDC)
21
CDC GIS Map from Center
for Disease Control (CDC)
Website, 2015

GIS Mapping Insect Borne Viruses - Global
Malaria outbreaks
22
GIS image on NIH Malaria Global Distribution 1900 – 2002 from Hay et.
al., 2011

Spatial Analysis vs. Data Analysis
Sick Person #1 – Broad Street
Sick Person #2 – Poland Street
Sick Person #3 – Berwick Street
Sick Person #4 – Little Windmill Street
Sick Person #5 – Dufours Place
23
John Snow’s 1854 MapExample of John Snow’s 1854 Data File
VS.
GIS image taken from Atif, 2013

Spatial Layering 1854 Data Reveals pump on Broadway Street
where the individuals are Clustered
Data file alone cannot show cluster of
infections
Layers can be added to show water
pumps within walking distance of sick
or deceased individuals
24
John Snow’s 1854 Map
VS.
Water
Pump
GIS image taken from Atif, 2013

Spatial Layering 1854 Data
A radius has been superimposed on
possible cholera outbreak area
around water pumps
Radius shows individuals within walking
distance of water pump from their
residences
Other water pumps outside of radius
do not have infected individuals with
cholera
25
John Snow’s 1854 Map
VS.
Water
Pump
GIS image taken from Atif, 2013

GIS Map in Relation to Shootings at
Schools – Summary Data Example26
GIS image taken from Valcik and Benavides, 2011

GIS Map in Relation HAZMAT Incidents
at Research Universities or Centers27
GIS image taken from Valcik, 2013 GIS image taken from Valcik, 2013

UTILIZING GIS IN HIGHER EDUCATION SCHOLARSHIP FUNDING
WEST VIRGINIA UNIVERSITY
DEPARTMENT OF INSTITUTIONAL RESEARCH

MEGAN CURRAN
Environmental and Energy Resources Management Major at West Virginia University
Intern and Student Worker at the West Virginia University Department of Institutional Research
(540)424-3477
All rights reserved. No part of this publication may be reproduced, stored in a retrieval system, or transmitted, in any form, or by any means, electronic, mechanical, photocopying, recording, or otherwise, without the consent of the author. Copyright 2016 ©

OBJECTIVES
• Describe the benefits of GIS in Institutional Research
• Understand how West Virginia’s economy and higher education costs impact potential college students
• Compile data layers into an interactive map that can depict patterns of West Virginia Higher Education Scholarship recipients

GIS IN INSTITUTIONAL RESEARCH

“Everything is related to everything else,
but near things are more related than
distant things”
-Tobler’s First Law of Geography

Which Dataset is More Comprehensive?
(Data from: WV Higher Education Policy Commission)

The Economy and Higher
Education Costs
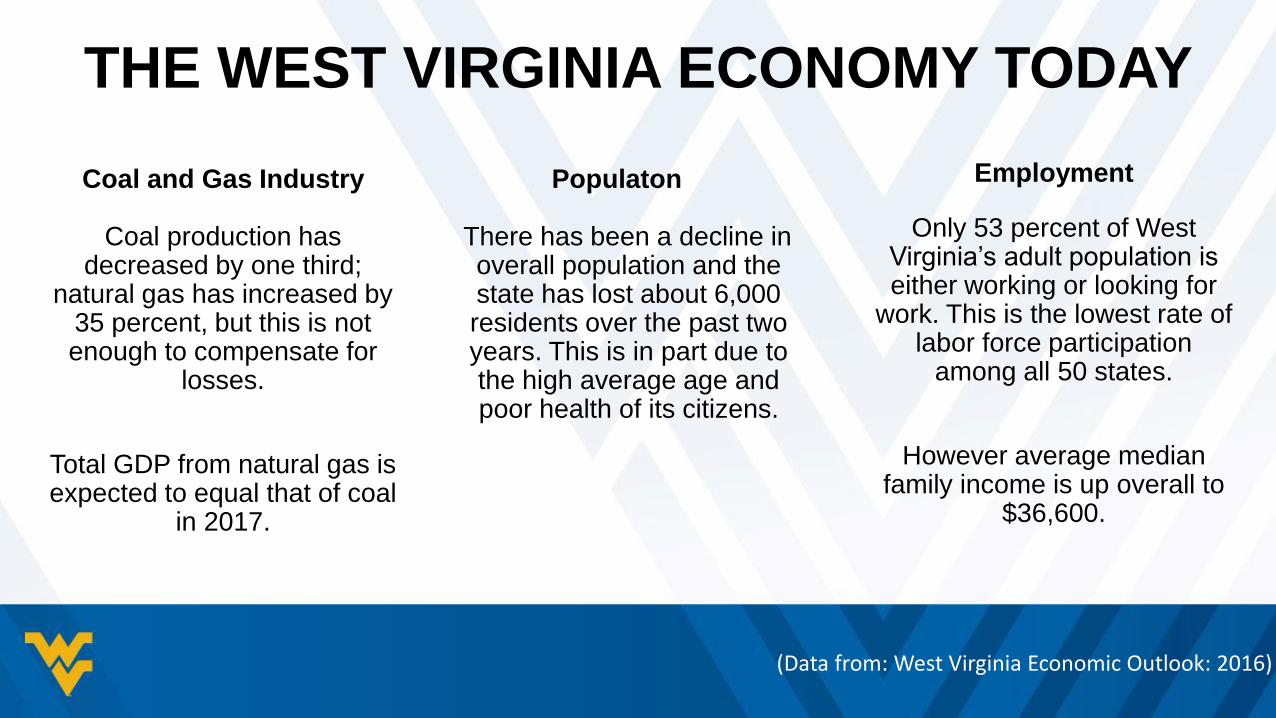
THE WEST VIRGINIA ECONOMY TODAY
Coal and Gas Industry
Coal production has decreased by one third;
natural gas has increased by 35 percent, but this is not enough to compensate for
losses.
Total GDP from natural gas is expected to equal that of coal
in 2017.
Populaton
There has been a decline in overall population and the state has lost about 6,000 residents over the past two years. This is in part due to the high average age and poor health of its citizens.
Employment
Only 53 percent of West Virginia’s adult population is either working or looking for
work. This is the lowest rate of labor force participation
among all 50 states.
However average median family income is up overall to
$36,600.
(Data from: West Virginia Economic Outlook: 2016)

COST OF COLLEGE
According to Where is the Land of Opportunity, “moving up a single percentile on the family-income distribution makes enrolling in college about 0.7 percentage points more likely, up and down the distribution (Chetty, Hendren, Kline and Saez).”

SCHOLARSHIPSPROMISE
• Merit Based
• Covers up to $4,750 in tuition and fees
• Can be used at in-state public and private non-profit regionally accredited colleges
• Covers 8 semesters as long as the student maintains a 3.0 in college and completes 30 credit hours in a 12 month period
• 10,224 recipients in 2013-14
Higher Education Policy Grant
• Need Based
• Amount determined by need according to the FAFSA
• Can be used at participating WV or PA institutions
• The grant may be renewed until the student's course of study is completed, but may not exceed an additional three academic years beyond the initial award
• 19,260 recipients in 2013-14
(Data from: WV Higher Education Policy Commission)

METHODS

ORGANIZING INFORMATION IN GIS
Capturing Data
QueriesAnalysis
& Overlay

CAPTURING DATA
• Data may require processing before entry
• HEPC and U.S. CENSUS information
• Pre-existing Online DataLayers
• ArcCatalog

QUERIES
• A question meant to extract specific data from a database in a visual format
Base Map Simple Query Complex Query
(Data from: WV Higher Education Policy Commission)

CONCLUSION
• At-risk counties have more limited industry and a more volatile economy
• Need based Scholarships are more likely to appear in at-risk counties
• Higher Education Scholarship patterns can be found much more effectively and efficiently when using GIS
• Graduating High School Senior data can be used for future analysis

GIS Map for the Kentucky Campus
Compact 2014 Assessment45
GIS image taken from Valcik, 2015GIS image taken from Valcik, 2015

GIS Map for the Kentucky Campus
Compact 2014 Assessment46
GIS image taken from Valcik, 2015

Conclusion
A picture is worth a thousand words, an accurate picture is worth it’s weight in gold.
GIS adds an extra dimension to a research project that can potentially provide an answer or
key insight on a particular research issue.
One should consider using GIS when working through their methodology on a given research
project.
GIS can be used in a variety of different ways and tie in vast amounts of data to a
geographical location.
47

Points to Ponder
WOULD A VISUAL COMPONENT ASSIST YOU IN YOUR PROJECT?
HOW CAN GIS ENHANCE YOUR RESEARCH?
HAVE YOU DOCUMENTED YOUR GIS MAPS APPROPRIATELY?
ARE YOUR CITATIONS CORRECT FOR YOUR GIS MAP?
48

QUESTIONS ???
49

References 50 Ayres, Amy Sinatra, 2012Blanton, Jesse D., Manangan, Arie, Manangan, Jamie, Hanlon, Cathleen A., Slate, Dennis and Rupprecht, Charles E., 2006. “Development of a GIS-based, real-time Internet mapping tool for rabies surveillance”, International
Journal of Health Geographics. Volume 5:47. Retrieved on February 10, 2015. http://www.ij-healthgeographics.com/content/5/1/47
CDC, 2015. “Geographic Information Systems (GIS) at CDC”, Centers for Disease Control and Prevention. Retrieved on February 10, 2015. http://www.cdc.gov/gis/
Chemical and Engineering News, 2008. “Happy Birthday Love Canal”, American Chemical Society. Retrieved on February 10, 2015. https://pubs.acs.org/cen/government/86/8646gov2.html
Everything Dinosaur, 2013. “Body Recovered after Saltwater Crocodile Attack”, Everything Dinosaur. Retrieved on February 10, 2015. http://blog.everythingdinosaur.co.uk/blog/_archives/2013/08/27/body-recovered-after-saltwater-crocodile-attack.html
Fitzpatrick, G., Ward, M., Ennis, O., Johnson, H., Cotter, S., Carr, M.J., O’Riordan, B., Waters, A., Hassan, J., Connell, J., Hall, W., Clarke, A., Murphy, H., and Fitzgerald, M., 2012. “Use of a Geographic Information System to Map Cases of Measles in Real-Time During the Outbreak in Dublin, Ireland, 2011”, Eurosurvelillance, Volume 17, Issue 49, December 6, 2012.
Fukushima Update, 2013. “New Map of Radioactive Iodine Released from Fukushima Daiichi”, Fukushima Update. Retrieved on February 10, 2015. http://fukushimaupdate.com/new-map-of-radioactive-iodine-released-from-fukushima-daiichi/
Hay, Simon I., Guerra, Carlos A., Tatem, Andrew J., Noor, Abdisalan M. and Snow, Robert W., 2011. “The Global Distribution and Population at Risk of Malaria: Past, Present and Future”, United States Library of Medicine. National Institutes of Health. Retrieved on February 9, 2005. http://www.ncbi.nlm.nih.gov/pmc/articles/PMC3145123/
Krivoruchoko, Konstantin, 2015. “GIS and Geostatistics: Spatial Analysis of Chernobyl’s Consequences in Belarus”, Environmental Systems Research Institute. Retrieved on February 10, 2015. http://www.ncgia.ucsb.edu/conf/sa_workshop/papers/krivoruchko_old.html
Kukaswadia, Atif, 2013. “John Snow – The First Epidemiologist”, Public Health Perspectives. Retrieved on February 9, 2013. http://blogs.plos.org/publichealth/2013/03/11/john-snow-the-first-epidemiologist/
New York Department of Health, Environmental Investigations, 2015. “Love Canal EDA”. Retrieved on February 10, 2015. https://www.health.ny.gov/environmental/investigations/love_canal/docs/lc_eda_map.pdf
Starcher, Jennings, 2008. “West Virginia Hospital Service Areas Analysis Using GIS”, West Virginia Health Care Authority. Retrieved on February 19, 2015. http://www.google.com/url?sa=t&rct=j&q=&esrc=s&source=web&cd=1&ved=0CB4QFjAA&url=http%3A%2F%2Fmapwv.gov%2Fwvagp%2Fconference%2Fpresentations%2FStarcher.ppt&ei=Fc3lVO3KJIioyQSI1ILQBA&usg=AFQjCNE7zMcFfZR_0cPLUCaIDS9aCRrlKQ&bvm=bv.85970519,d.aWw
Tracking Sharks, 2014. “2014 Shark bites/attacks 2014”, Tracking Sharks. Retrieved on February 12, 2014. http://www.trackingsharks.com/wp-content/uploads/2014/01/shark_bite_2014_map.jpg
United States Geological Survey, 1999. “West Virginia”, United States Geological Survey. Retrieved on February 19, 2015. http://pubs.usgs.gov/fs/fs-050-99/
Valcik, Nicolas A., and Servian, D., 2015. “Uses for Geospatial Information Systems (GIS) for Public Higher Education Institutions”.
Valcik, N., 2013. Hazardous Materials Compliance for Public Research Organizations: A Case Study. ISBN: 978-1-4665-0946-7, CRC Press/Taylor and Francis, New York, New York.
Valcik, N. and T. Benavides, 2011. Practical Human Resources Management for Public Managers: A Case Study Approach. ISBN: 9-78143-984-143-3, American Society for Public Administration Series, Taylor and Francis – CRC Press, New York, New York.
West Virginia GIS Technical Center, 2015. “Public Health Departments (State and Local) (HSIP)”, West Virginia GIS Technical Center. Retrieved on February 12, 2015. http://wvgis.wvu.edu/data/dataset.php?ID=407
Willingham, Emily and Helft, Laura, 2012. “Tracking Disease Outbreaks”, PBS Nova. Retrieved on February 10, 2015. http://www.pbs.org/wgbh/nova/body/disease-outbreaks.html
. “Mapping Nuclear Fallout After Fukushima”, National Geographic. Retrieved on February 12, 2015. http://energyblog.nationalgeographic.com/2012/03/08/mapping-nuclear-fallout-after-fukushima/

REFERENCES
Berelson, Wendy L. "Introduction to GIS Technologies an Institutional Research Perspective." Seminar Presentation. 2012. Power Point .
Bureau, United States Census. West Virginia: 2010 Population and Housing Unit Counts . 2010 Census . Washington D.C.: United States
Census Bureau, 2012. PDF.
Eric Bowen, Christiadi, PhD, John Deskins, PhD, Patrick Manzi,. Bureau of Business & Economic Research. October 2014. Research
Document. 16 March 2016.
Gonzalez, Katerina. "Arc GIS in Institutional Research: A Primer." Presentation. 2014. Prezi.
HEPC, West Virginia Higher Education Policy Commission. HEPG Scholars 2009-2010. Report. Charleston: West Virginia Higher Education
Policy Commission, 2010. .pdf document.
Lego, Brian. West Virginia Economic Outlook 2016. Morgantown, WV, 1 March 2016. .PDF.
McIntyre, Nancy. West Virginia Economic Outlook 2016. Morgantown, WV, 9 March 2016. .PDF.
"Northern Panhandle of West Virginia." Wikipedia 11 August 2013: 1. Webpage.
Raj Chetty, Nathaniel Hendren, Patrick Kline and Emmanuel Saez. "Where is the Land of Opportunity? The Geography of Intergenerational
Mobility in the United States." June 2014. New York Times. .pdf document. 4 April 2016.
Rosenberg, Lisa. "Geographic Information Systems in Institutional Research." Strategic Enrollment Management (2004): 1. Webpage.
Rothwell, Jonathan. What colleges do for local economies: A direct measure based on consumption. 17 November 2015. Article. 8 March 2016.
Sullivan, Maureen. Where Do Students Go When They Head Out Of State For College. 22 October 2015. Article. 10 March 2016.
United States. Executive Office of the President. Increasing College Opportunity for Low-Income Student. Tues. 16 March 2016Weissman, Jordan. Smart Poor Kids Are Less Likely to Graduate From College Than Middling Rich Kids. 2 JUNE 2015. Article . 29 March 2016.
West Virginia Financial Aid Comprehensive Report 2015. 2015. Report . 16 March 2016.
West Virginia Explorer . West Virginia: Sibray Limited Liability Company, 2014. Webpage.
WestVirginia.com. West Virginia Regions. Citynet LLC, 2007. Webpage.

ACKNOWLEDGEMENTS
Dr. Neal Holly
Vice Chancellor for Policy and Planning, West Virginia Higher Education Policy Commission
Dr. Nicolas A. Valcik
Director of Institutional Research, West Virginia University
Dan Servian
GIS Analyst/Information Systems Specialist, West Virginia University