Environmental Site Assessment and Hydrogeologic Impacts to ...
72
University of Montana ScholarWorks at University of Montana Graduate Student eses, Dissertations, & Professional Papers Graduate School 2019 Environmental Site Assessment and Hydrogeologic Impacts to Groundwater at St. Ignatius, Montana and Hanford, Washington Ryan M. Carter Let us know how access to this document benefits you. Follow this and additional works at: hps://scholarworks.umt.edu/etd Part of the Environmental Indicators and Impact Assessment Commons , Environmental Monitoring Commons , Other Environmental Sciences Commons , and the Water Resource Management Commons is Professional Paper is brought to you for free and open access by the Graduate School at ScholarWorks at University of Montana. It has been accepted for inclusion in Graduate Student eses, Dissertations, & Professional Papers by an authorized administrator of ScholarWorks at University of Montana. For more information, please contact [email protected]. Recommended Citation Carter, Ryan M., "Environmental Site Assessment and Hydrogeologic Impacts to Groundwater at St. Ignatius, Montana and Hanford, Washington" (2019). Graduate Student eses, Dissertations, & Professional Papers. 11381. hps://scholarworks.umt.edu/etd/11381
Transcript of Environmental Site Assessment and Hydrogeologic Impacts to ...

University of MontanaScholarWorks at University of MontanaGraduate Student Theses, Dissertations, &Professional Papers Graduate School
2019
Environmental Site Assessment and HydrogeologicImpacts to Groundwater at St. Ignatius, Montanaand Hanford, WashingtonRyan M. Carter
Let us know how access to this document benefits you.Follow this and additional works at: https://scholarworks.umt.edu/etd
Part of the Environmental Indicators and Impact Assessment Commons, EnvironmentalMonitoring Commons, Other Environmental Sciences Commons, and the Water ResourceManagement Commons
This Professional Paper is brought to you for free and open access by the Graduate School at ScholarWorks at University of Montana. It has beenaccepted for inclusion in Graduate Student Theses, Dissertations, & Professional Papers by an authorized administrator of ScholarWorks at Universityof Montana. For more information, please contact [email protected].
Recommended CitationCarter, Ryan M., "Environmental Site Assessment and Hydrogeologic Impacts to Groundwater at St. Ignatius, Montana and Hanford,Washington" (2019). Graduate Student Theses, Dissertations, & Professional Papers. 11381.https://scholarworks.umt.edu/etd/11381

ENVIRONMENTAL SITE ASSESSMENT AND HYDROGEOLOGIC IMPACTS TO GROUNDWATER AT ST. IGNATIUS, MONTANA AND HANFORD, WASHINGTON
By
RYAN MCKEE CARTER
Bachelor of Science, Eastern Washington University, Cheney, Washington, 2009
Professional Portfolio
presented in partial fulfillment of the requirements
for the degree of
Master of Science in Environmental Studies
The University of Montana
Missoula, MT
May 2019
Approved by:
Scott Whittenburg, Dean of the Graduate School
Dr. Vicki Watson, Chair Environmental Studies
John P. McDonald, Committee Member Professor Affiliate, Intera, Inc.

ii
© COPYRIGHT
By
Ryan Mckee Carter
2019
All Rights Reserved
iii
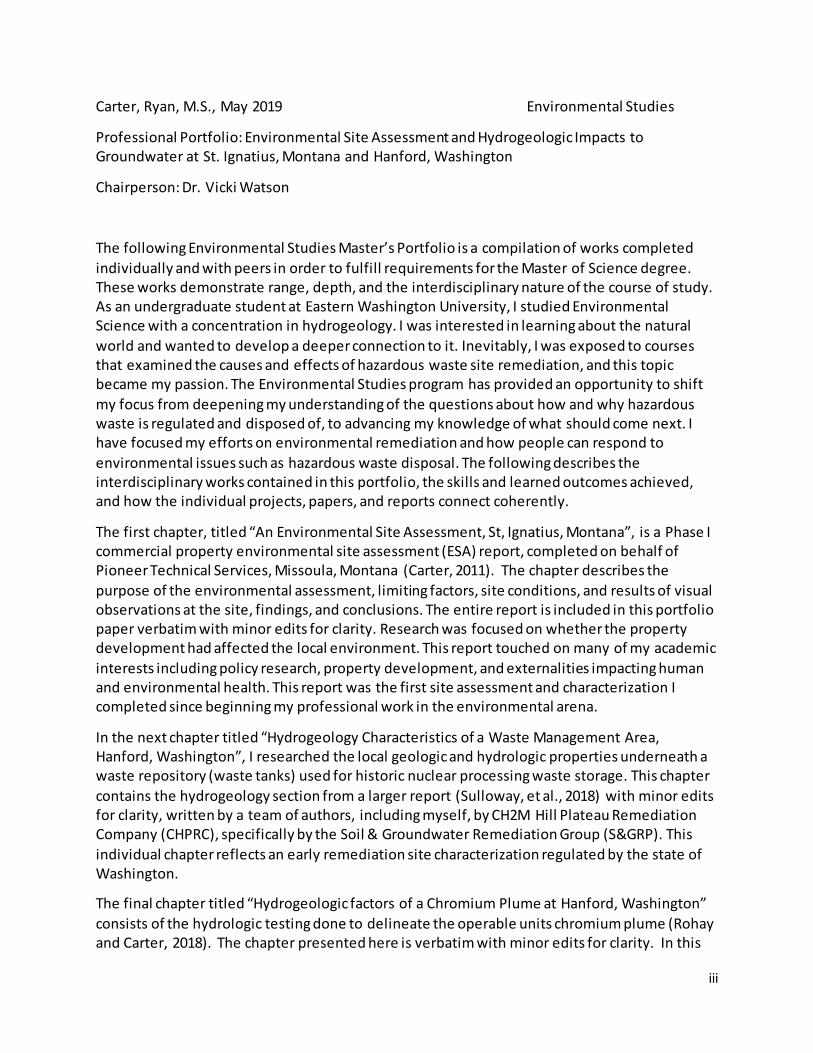
Carter, Ryan, M.S., May 2019 Environmental Studies
Professional Portfolio: Environmental Site Assessment and Hydrogeologic Impacts to Groundwater at St. Ignatius, Montana and Hanford, Washington
Chairperson: Dr. Vicki Watson
The following Environmental Studies Master’s Portfolio is a compilation of works completed individually and with peers in order to fulfill requirements for the Master of Science degree. These works demonstrate range, depth, and the interdisciplinary nature of the course of study. As an undergraduate student at Eastern Washington University, I studied Environmental Science with a concentration in hydrogeology. I was interested in learning about the natural world and wanted to develop a deeper connection to it. Inevitably, I was exposed to courses that examined the causes and effects of hazardous waste site remediation, and this topic became my passion. The Environmental Studies program has provided an opportunity to shift my focus from deepening my understanding of the questions about how and why hazardous waste is regulated and disposed of, to advancing my knowledge of what should come next. I have focused my efforts on environmental remediation and how people can respond to environmental issues such as hazardous waste disposal. The following describes the interdisciplinary works contained in this portfolio, the skills and learned outcomes achieved, and how the individual projects, papers, and reports connect coherently.
The first chapter, titled “An Environmental Site Assessment, St, Ignatius, Montana”, is a Phase I commercial property environmental site assessment (ESA) report, completed on behalf of Pioneer Technical Services, Missoula, Montana (Carter, 2011). The chapter describes the purpose of the environmental assessment, limiting factors, site conditions, and results of visual observations at the site, findings, and conclusions. The entire report is included in this portfolio paper verbatim with minor edits for clarity. Research was focused on whether the property development had affected the local environment. This report touched on many of my academic interests including policy research, property development, and externalities impacting human and environmental health. This report was the first site assessment and characterization I completed since beginning my professional work in the environmental arena.
In the next chapter titled “Hydrogeology Characteristics of a Waste Management Area, Hanford, Washington”, I researched the local geologic and hydrologic properties underneath a waste repository (waste tanks) used for historic nuclear processing waste storage. This chapter contains the hydrogeology section from a larger report (Sulloway, et al., 2018) with minor edits for clarity, written by a team of authors, including myself, by CH2M Hill Plateau Remediation Company (CHPRC), specifically by the Soil & Groundwater Remediation Group (S&GRP). This individual chapter reflects an early remediation site characterization regulated by the state of Washington.
The final chapter titled “Hydrogeologic factors of a Chromium Plume at Hanford, Washington” consists of the hydrologic testing done to delineate the operable units chromium plume (Rohay and Carter, 2018). The chapter presented here is verbatim with minor edits for clarity. In this

iv
paper I researched, examined and quantified the hydrogeology of a chromium plume based on the results of drilling, sampling, and characterizing the plume. During 2016 and 2017, 11 wells were drilled and sampled to characterize the nature and extent of the southeast chromium plume. Based on groundwater sample results from these new wells, the southeast chromium plume extends further than the extent based on data available in 2015. This individual chapter shows an example of a recent site characterization used for a future remediation project to clean the contaminants within the aquifer and is part of a larger report.
This portfolio highlights some of the products that resulted from the diverse work and practical experience gained throughout my career. I have departed my formal training at this university with a solid understanding of complex earth systems and environmental issues—and the tools and expertise necessary to work to mitigate and adapt to their effects.

v
Acknowledgements The completion of this project is due to the efforts of many people that gave their time to help advance the work of these site assessments. I want to thank: To my advising professor, Dr. Vicki Watson, thank you for your constant support when it was needed. You showed trust in me to complete this project and degree. Thank you for all the work you’ve dedicate to your students. To the Chair of the Environmental Studies Program, Dr. Phil Condon, thank you for providing your feedback and support as I made my way through each step of this professional portfolio process. To John McDonald and the other mentors over the years, Chuck Miller and Todd Lorenzen, thank you for including me in the work you do and supporting my needs in these projects and the many others. To Travis Hammond, Bill Faught, Jessica Ni, Heather Sulloway, and Virginia Rohay, and all the other contributors to the full reports in chapters 2 and 3. Thank you to Margo Aye for the graphics and figures throughout chapters 2 and 3. To my wonderful family: Leslie, Caden, Lincoln, Averie, Aaron, and Aile, you have all offered me so much support and love throughout our time together. Thank you to my parents and siblings, Dan, Janean, Carleen, Janae, Raelene, Kendra, Kerianne, Karissa, and Brent. All my love and appreciation.
vi
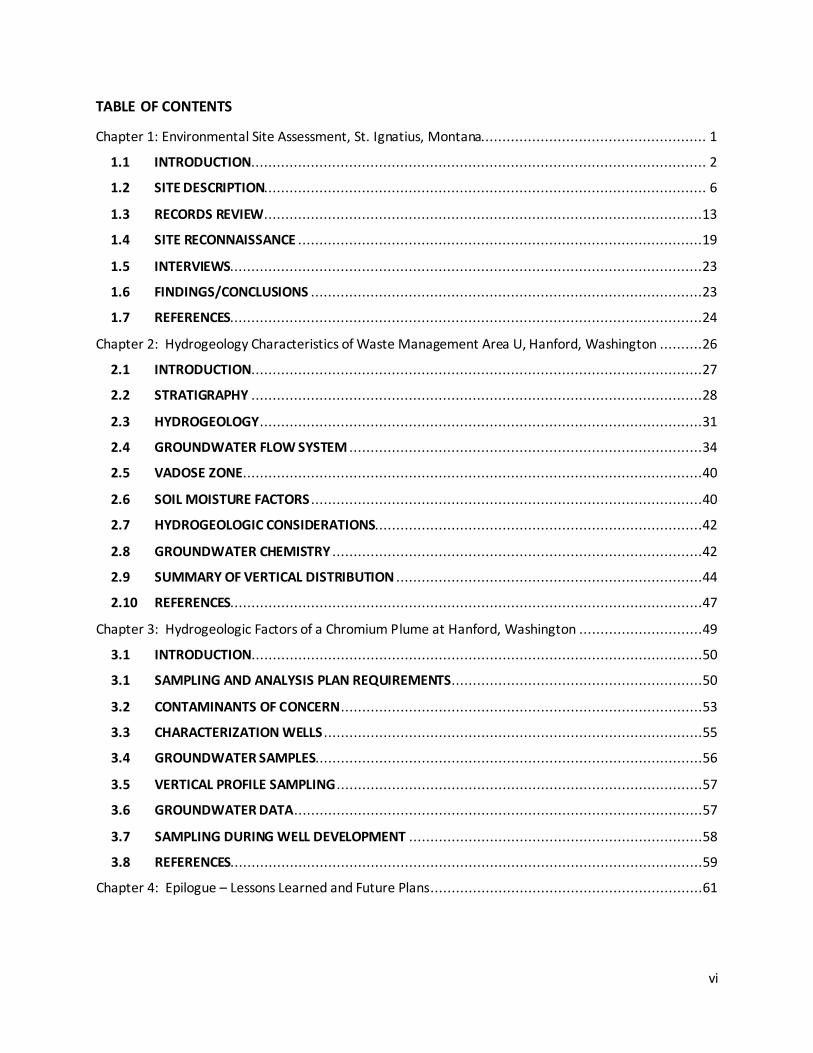
TABLE OF CONTENTS
Chapter 1: Environmental Site Assessment, St. Ignatius, Montana..................................................... 1
1.1 INTRODUCTION ........................................................................................................... 2
1.2 SITE DESCRIPTION........................................................................................................ 6
1.3 RECORDS REVIEW .......................................................................................................13
1.4 SITE RECONNAISSANCE ...............................................................................................19
1.5 INTERVIEWS...............................................................................................................23
1.6 FINDINGS/CONCLUSIONS ............................................................................................23
1.7 REFERENCES...............................................................................................................24
Chapter 2: Hydrogeology Characteristics of Waste Management Area U, Hanford, Washington ..........26
2.1 INTRODUCTION ..........................................................................................................27
2.2 STRATIGRAPHY ..........................................................................................................28
2.3 HYDROGEOLOGY ........................................................................................................31
2.4 GROUNDWATER FLOW SYSTEM ...................................................................................34
2.5 VADOSE ZONE ............................................................................................................40
2.6 SOIL MOISTURE FACTORS ............................................................................................40
2.7 HYDROGEOLOGIC CONSIDERATIONS.............................................................................42
2.8 GROUNDWATER CHEMISTRY .......................................................................................42
2.9 SUMMARY OF VERTICAL DISTRIBUTION ........................................................................44
2.10 REFERENCES...............................................................................................................47
Chapter 3: Hydrogeologic Factors of a Chromium Plume at Hanford, Washington .............................49
3.1 INTRODUCTION ..........................................................................................................50
3.1 SAMPLING AND ANALYSIS PLAN REQUIREMENTS ...........................................................50
3.2 CONTAMINANTS OF CONCERN .....................................................................................53
3.3 CHARACTERIZATION WELLS .........................................................................................55
3.4 GROUNDWATER SAMPLES...........................................................................................56
3.5 VERTICAL PROFILE SAMPLING ......................................................................................57
3.6 GROUNDWATER DATA ................................................................................................57
3.7 SAMPLING DURING WELL DEVELOPMENT .....................................................................58
3.8 REFERENCES...............................................................................................................59
Chapter 4: Epilogue – Lessons Learned and Future Plans................................................................61
vii
Figures and Table
Figure 1. Location Map of the St. Ignatius ESA Area 4 Figure 2. View Looking Northeast to the Main Buildings Fronting Highway 93 7 Figure 3. Topographic Map of the St. Ignatius Region 8 Figure 4. Views of the Paved Asphalt Parking Lot and Concrete Pad with Staining 12 Figure 5. Property Remediation Sites Within 0.5 and 1.0 Miles of Subject Property 15 Figure 6. View to the North of the Power-line Transformers 17 Figure 7. Location of Wells Within 0.5 and 1.0 Miles from Subject Property 20 Figure 8. Location Map for the Waste Management Area U 27 Figure 9. General Stratigraphy at the Hanford Site 30 Figure 10. East to West Cross-Section for Waste Management Area U 32 Figure 11. Waste Site Locations Near Waste Management Area U 34 Figure 12. 2015 Water Table Map for the Waste Management Area U 35 Figure 13. Water Elevation Contours in June 2012 Prior to Startup of the 200 West P&T 36 Figure 14. Vertical Contamination Distribution in Well 299-W18-260 43 Figure 15. Locations of the Eleven Southeast Chromium Plume Remedial Design Investigation Wells 52 Table 1. 200-UP-1 Operable Unit Southeast Chromium Plume Depth Discrete Samples 49

viii
Abbreviations
AMSL above mean sea level
ASL above sea level ASTM American Society for Testing and Materials
CCU Cold Creek Unit
CERCLA Comprehensive Environmental Response, Compensation and Liability Act
CERCLIS Comprehensive Environmental Response
CFR Code of Federal Regulations CHPRC CH2M Hill Plateau Remediation Company
COC Contaminant of Concern
DEQ Department of Environmental Quality
DQO data quality objective
EPA Environmental Protection Agency ERNS Emergency Response Notification System
ESA Environmental Site Assessment
GWIC Ground-Water Information Center
LUST Leaking Underground Storage Tank
MBMG Montana Bureau of Mines and Geology MWCB DEQ Mine Waste Cleanup Bureau
NPL National Priorities List
P & T Pump and treat
PCB polychlorinated biphenyl
PNNL Pacific Northwest National Laboratory PTRCF Petroleum Tank Release Cleanup Fund
RCRA Resource Conservation and Recovery Act
SAP Sample and Analysis Plan
S&GRP Soil and Groundwater Remediation Group
SST Single-shell tank USGS U.S. Geological Survey
UST Underground Storage Tank
WMA Waste Management Area

1
Chapter 1: Environmental Site Assessment, St. Ignatius, Montana
2
1.1 INTRODUCTION
Pioneer Technical Services, Inc. (Pioneer) has conducted a Phase I ESA of the subject property,
Estate of Douglas Lloyd Allard Commercial Property, located at 77529, 77547, 77565, and 77579
U.S. Highway 93, St. Ignatius, Montana, 59865 (Carter, 2011). The following Phase I ESA report
has been prepared on behalf of Farmers State Bank to document the environmental status of
the subject property, which was for sale.
In defining a standard of good commercial and customary practice for conducting an
environmental assessment of a parcel of property, the goal of the processes established by this
practice is to identify recognized environmental conditions (CERCLA 42 U.S.C. §9601(35) (B)).
The term recognized environmental conditions means “the presence or likely presence of any
hazardous substances or petroleum products on a property under conditions that indicate an
existing release, a past release, or a material threat of a release of any hazardous substances or
petroleum products into structures on the property or into the ground, groundwater, or surface
water of the property.” This Phase I Environmental Site Assessment (ESA) was conducted to
determine if, and/or to what extent, hazardous substances or petroleum products were
released on the subject property.
The subject property is located in the southwest one-quarter, northeast one-quarter (SW¼
NE¼) of Section 14, Township 18 North (T18N), Range 20 West (R20W) in Lake County,
Montana. The subject property is comprised of three real property parcels; two of the parcels
are located outside the city limits of St. Ignatius, and one parcel is within the city limits. The
cumulative 4.15-acre property includes a gas station, motel, convenience/general store,
museum, trading post/gift shop, office building, and restaurant.
Based on site reconnaissance, review of aerial photographs, and review of state and federal
environmental databases, it is the opinion of Pioneer that no visibly apparent potential
environmental concerns exist at the subject property.

3
SCOPE OF SERVICES
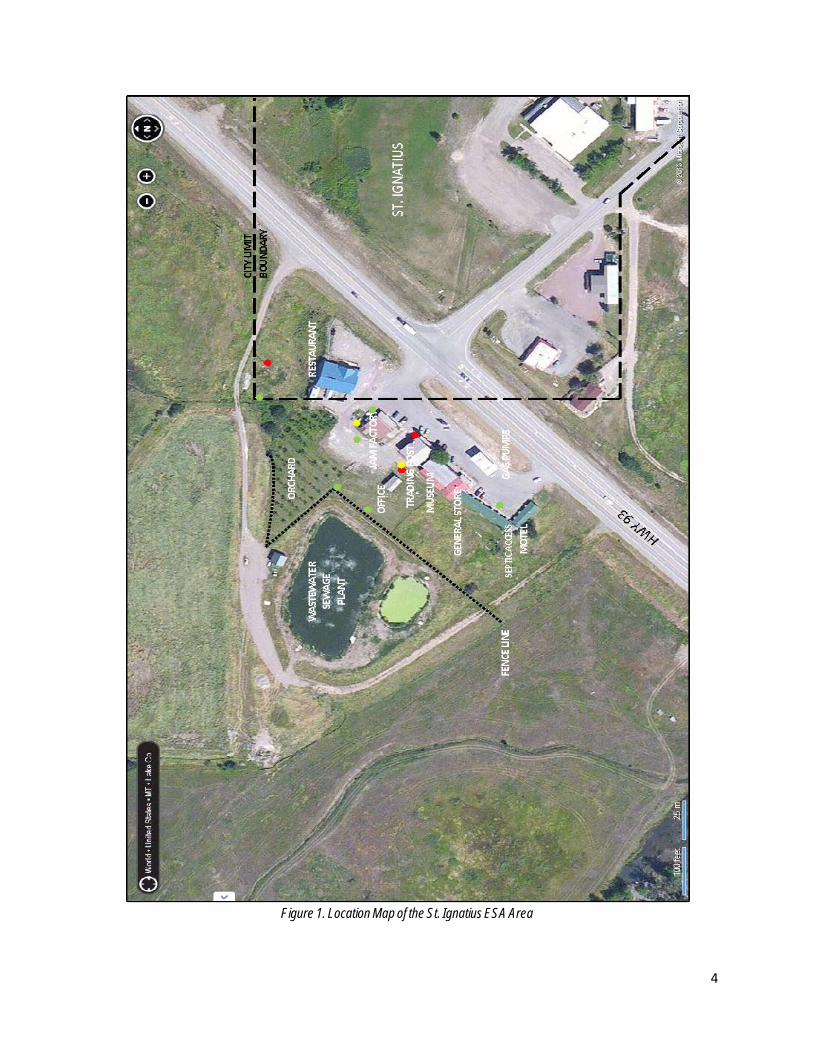
Pioneer mobilized the necessary equipment and personnel to the subject property located in St.
Ignatius, Montana, for the purpose of conducting a Phase I ESA (Figure 1). The site assessment
included the following scope of work:
● Interviews with present and past owners/occupants (if available);
● Thorough visual inspection of the property;
● Review of aerial photographs;
● Review of applicable regulatory lists and state and federal environmental databases;
● No samples collected due to the limitations of Phase I ESA requirements (samples are taken
for Phase II ESA’s)
● Photo documentation of the property; and
● Review of adjoining properties and their uses.
4
Figure 1. Location Map of the St. Ignatius ESA Area

5
SIGNIFICANT ASSUMPTIONS
The following information and assumptions are based upon ASTM Standard E 1527-05,
Standard Practice for Environmental Site Assessments: Phase I Environmental Site Assessment
Process (ASTM, 2005). As indicated in ASTM Standard E 1527-05, no environmental assessment
can wholly eliminate uncertainty regarding the potential for problematic environmental
conditions in connection with a property. This practice is intended to reduce, but not eliminate,
uncertainty regarding the potential for recognized environmental conditions in connection with
a property and recognizes reasonable limits of time and cost. Additionally, it should be noted
that portions of this report are based on unverified information supplied to Pioneer by third-
party sources. While efforts have been made to substantiate third-party information, Pioneer
cannot guarantee its completeness or accuracy.
Pioneer has performed all activities, appropriate and necessary, to evaluate the environmental
status of the property under Phase I ESA guidelines.
LIMITATIONS AND EXCEPTIONS
This Phase I ESA was conducted in accordance with current industry standards and practices.
Pioneer conducted this Phase I ESA specifically for the use of H&E Equipment Services. Any
reliance on this report by another party other than those listed on the cover page of this report
shall be at such party’s sole risk. Some of the work completed by Pioneer included review of
information provided by others; therefore, Pioneer assumes no responsibility for conditions not
revealed or observed during the Phase I ESA or for conditions not generally recognized as
environmentally unacceptable at the time this report was prepared. The information,
conclusions, and recommendations provided herein apply only to the property, as it existed
during Pioneer’s investigation. Should site use or conditions change, the information,
conclusions, and recommendations contained herein may no longer apply.
This Phase I ESA did not include a title search for the property.

6
RELIANCE
This report shall be for the sole benefit of Farmers State Bank and may not be relied upon by
any other person or entity without the written authorization of Farmers State Bank.
Parties who seek to rely upon Phase I ESA reports dated more than 180 days prior to the date of
reliance do so at their own risk. This limitation in reliance is based on the potential for physical
changes at the site, changes in circumstances, technological and professional advances, and
guidance related to the continued viability of Environmental Assessment reports, user’s
responsibilities, and requirements for updating of components of the inquiry as stated in the
ASTM Standard E 1527-05.
1.2 SITE DESCRIPTION
The subject property consists of five buildings over three neighboring parcels (Figure 2). The
museum/trading post was built in 1974, the general store in 1976, the motel in 1981, the office
building in 1985, the Huckleberry Jam Factory in 1990, and the White Buffalo Restaurant in
2002 (Montana Cadastral System). The buildings and a paved parking lot are accessed from a
driveway turnoff from Montana’s Highway 93. The buildings are oriented with the fronts facing
southeast, with the restaurant facing southwest. The northwest border of the property is
fenced with a post and wire fence. The property is connected to community water and sanitary
sewer service.
LOCATION AND LEGAL DESCRIPTION
The subject property is located in the SW¼ NE¼ of Section 14, T18N, R20W at an elevation of
approximately 2,905 feet above mean sea level (amsl). Information about the property was
obtained from the Montana Cadastral Mapping system (gis.mt.gov) and is listed on the
Property Record Card in Appendix B. The property area is 180,774 square feet (4.15 acres), of
which 18,178 square feet is paved with asphalt, 1,825 square feet is paved with concrete, and
27,442 square feet is orchard. The buildings have a listed first-floor combined area of 15,016
square feet. The street addresses of the subject properties are 77529, 77547, 77565, and 77579
U.S. Highway 93, St. Ignatius, Montana.

7
Figure 2. View Looking Northeast to the Main Buildings Fronting Highway 93
SITE AND VICINITY CHARACTERISTICS
The subject property is located off Highway 93, adjacent to the town of St. Ignatius, Montana
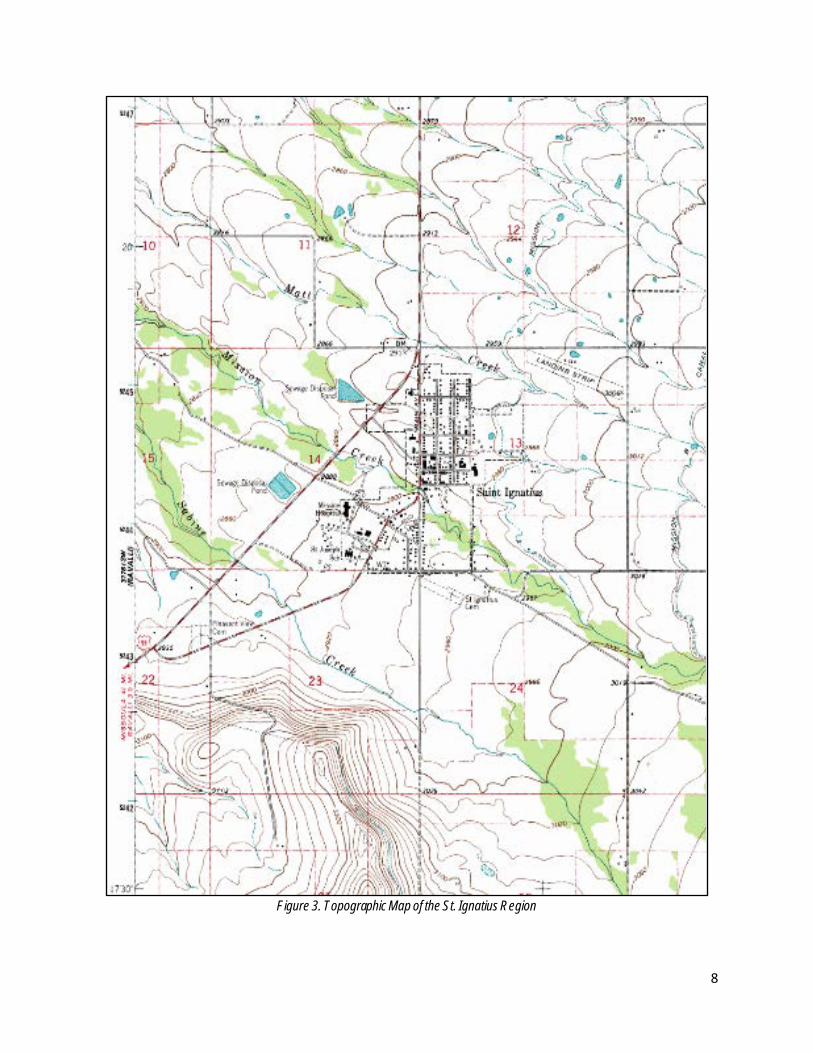
(Figure 1). Natural topography of the area is generally flat to gently sloping downhill to the
northwest, as shown on the topographic map in Figure 3. The subject property has been
graded to a level surface and is paved with asphalt, concrete or graveled throughout. The main
parking area is located on the southeast side of the five buildings fronting Highway 93 (Figure
1).
8
Figure 3. Topographic Map of the St. Ignatius Region

9
Fixtures within the three parcels include:
● two gas pumps with a two post gas station canopy,
● two large capacity refrigeration units - one attached and one detached,
● two concrete vault covers for septic tank access,
● three plastic capped well monitoring access (6” diameter),
● two iron capped well access (6” diameter),
● three hand-pump water spouts,
● one abandoned above-ground sprinkler head,
● six electrical power posts, of which, three have transformers,
● three above-ground propane storage tanks,
● one gas station price sign,
● one gasoline refill port,
● two capped well vents (4” diameter),
● two gated culverts – north and southeast storm water drainage areas,
● two ungated/open culverts – north and southeast storm water drainage areas,
● and a temporary fireworks stand, removed as of July 24, 2013.
The northern portion of the subject property consists of a mature fruit orchard (Figure 1),
approximately half an acre. The subject property is bound on the west by a wastewater
treatment pond; and a grass field to the north, approximately ten acres, owned by the city of
St. Ignatius (Figure 1). The southwest is bound by a dirt access road to the treatment facility,
and by Highway 93 to the east.
The subject property is no longer using the in-place septic system but is connected to municipal
sewer. According to the Montana Cadastral, and confirmed with Ms. Linda Chard of the Lake
County Environmental Health office, there is no septic permit currently on record for the
subject property. Two concrete access covers are in-place over the septic vault. Two domestic
water wells were drilled in 1974 and 1978, to depths of 80 and 90 feet, respectively. The
subject property is currently connected to municipal water.

10
There are two refrigeration units, one detached and adjacent to the northwest corner of the
restaurant, and one attached at the back of the Huckleberry Jam Factory. At the back of the
general store there is a one-quarter inch pvc pipe extended approximately 6 inches from the
addition attached to the main building. This pvc pipe is dripping, approximately one drop every
30 seconds, presumed to be water, from a refrigeration unit condenser in the rear of the store.
It is assumed that all three of the refrigeration units are still running, due to the vibration and
low hum coming from each of the units.
The parking lot appears to be in good condition, without any major cracks or potholes.
Approximately 3,000 sq ft is asphalt, 250 sq ft is concrete, and 2,500 sq ft is gravel parking and
drive-through. The restaurant parcel’s parking area is completely graveled. According to
satellite photos elevation records on Google Earth, the elevation on the north end is 2,907 feet
asl (above sea level). There is a gentle downslope to the south parking area at the motel, which
is at 2,903 feet asl.
There are two open storage areas, accessible from the backside of the museum, and between
the museum and trading post. The material stored appears to be interior fixtures, signage and
storage bins. There are multiple wire racks/display cases behind the trading post. There is a
fenced yard maintenance area behind the general store with no visible fertilizers or pesticides.
The three storage areas noted above appears to be an addition to, and run the length of, the
back of the general store and museum. The portion behind the general store has metal siding.
The portion behind the museum has wood siding.
Equipment on the property includes a pvc frame of a car parking cover, a garbage dumpster,
three garbage barrels (partially full with common garbage), one FedEx drop box, various storage
racks, empty food service storage buckets, two tractor tires (used as drive-way boundary
markers), ladder, and patio furniture. There is an unused, torn bag of wall and ceiling texture
left on the concrete step, behind the trading post.
The gas station has two registered 10,000 gallon underground storage tanks (UST’s) for
unleaded gasoline. These two tanks replaced two previous underground storage tanks, in 2005.

11
All four tanks are documented in the online Underground Storage Tank Summary Report
(Montana DEQ UST Site).
According to property title searches and the ASTM Questionnaire, completed by Ms. Jeanine
Allard, Mr. Doug Allard owned and operated the subject properties for 40 years, the earliest
structure built in 1974. The property operations ceased in 2011.
SITE HISTORY
The ASTM Standard requires identification of all obvious uses of the property from the present
back to the property’s first developed use, or back to 1940, whichever is earlier. No evidence
was found that the subject property was ever developed for residential or industrial use prior to
1990, as viewed from aerial photos or from the property record search since 1974, from when
the earliest structures were built. No evidence of mining activity was found on the site during
the site reconnaissance. No evidence of trash dumping or waste burial was noted on the site.
The seven buildings on the subject property parcels were constructed in multiple stages.
According to the Property Record Cards, the Flathead Indian Museum and Doug Allard’s Trading
Post were built in 1974; the General Store was built in 1979; the Lodgepole Motel was built in
1981; the detached office building was built in 1985; the Huckleberry Jam Factory was built in
1990; and the White Buffalo Restaurant was built in 2002 (Figure 2). Pioneer personnel
researched the history of the site using the Lake County Tax Records, written reports in the
Missoulian newspaper (Sept. 2009), and the written questionnaire completed by Ms. Jeannie
Allard. The buildings and property have been vacant since 2011.
CURRENT USE OF THE PROPERTY
The subject property buildings are no longer used as intended. There are no disposed batteries,
barrels or buckets visible on the property. There is minor staining at various locations on the
asphalt parking lot indicating spills of oil or other products in isolated areas (Figure 4). The
stains appear to be typical for the type of activity on the property and does not appear to pose
a threat to the environment.
12
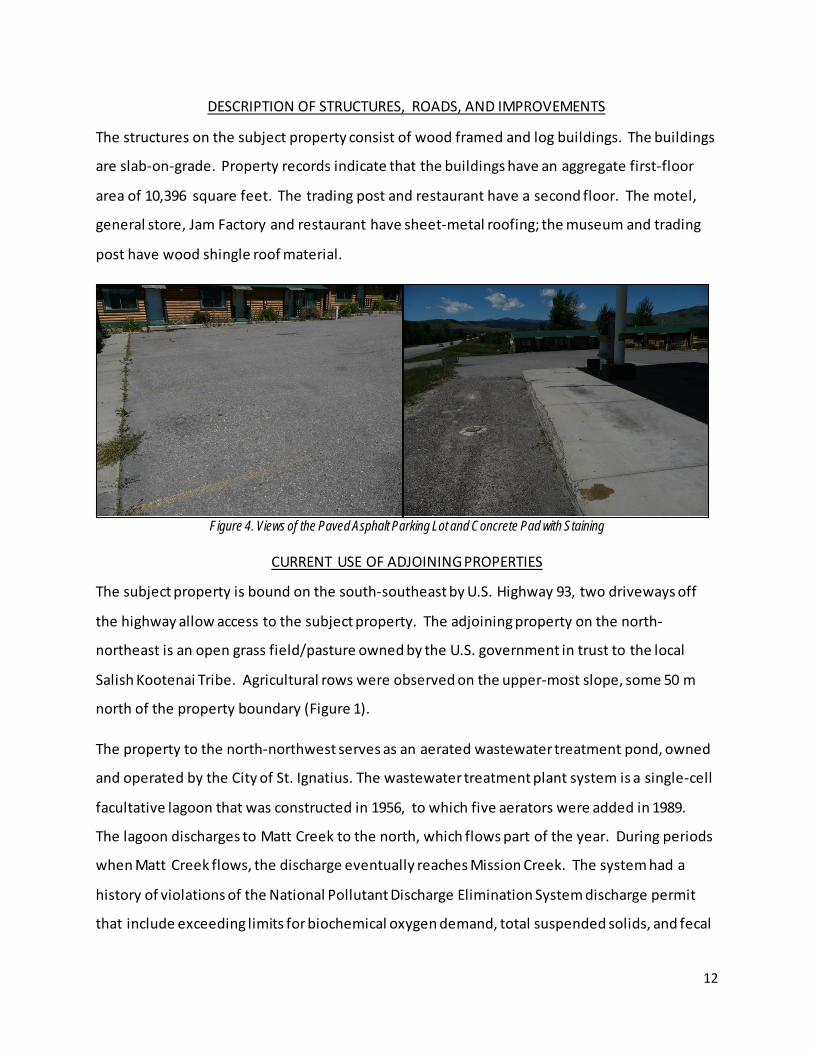
DESCRIPTION OF STRUCTURES, ROADS, AND IMPROVEMENTS
The structures on the subject property consist of wood framed and log buildings. The buildings
are slab-on-grade. Property records indicate that the buildings have an aggregate first-floor
area of 10,396 square feet. The trading post and restaurant have a second floor. The motel,
general store, Jam Factory and restaurant have sheet-metal roofing; the museum and trading
post have wood shingle roof material.
Figure 4. Views of the Paved Asphalt Parking Lot and Concrete Pad with Staining
CURRENT USE OF ADJOINING PROPERTIES
The subject property is bound on the south-southeast by U.S. Highway 93, two driveways off
the highway allow access to the subject property. The adjoining property on the north-
northeast is an open grass field/pasture owned by the U.S. government in trust to the local
Salish Kootenai Tribe. Agricultural rows were observed on the upper-most slope, some 50 m
north of the property boundary (Figure 1).
The property to the north-northwest serves as an aerated wastewater treatment pond, owned
and operated by the City of St. Ignatius. The wastewater treatment plant system is a single-cell
facultative lagoon that was constructed in 1956, to which five aerators were added in 1989.
The lagoon discharges to Matt Creek to the north, which flows part of the year. During periods
when Matt Creek flows, the discharge eventually reaches Mission Creek. The system had a
history of violations of the National Pollutant Discharge Elimination System discharge permit
that include exceeding limits for biochemical oxygen demand, total suspended solids, and fecal

13
coliform. The discharge has also failed in the past to meet the Confederated Salish and
Kootenai Tribes’ in-stream water quality standard for ammonia. Because of these past
deficiencies, the Salish-Kootenai Housing was granted funding and built a double lagoon
wastewater treatment facility south of Mission Creek. This facility services the population
south of Mission Creek and the St. Ignatius wastewater treatment plant services the population
north of Mission Creek.
The south-southwest boundary is a dirt access road to the wastewater treatment plant.
Beyond the road is open grassland, owned, in trust, to the Salish-Kootenai Tribe.
1.3 RECORDS REVIEW
STANDARD ENVIRONMENTAL RECORD SOURCES
Pioneer reviewed current information from the Federal Superfund Site System (U.S.
Environmental Protection Agency [EPA] Superfund System), Comprehensive Environmental
Response (CERCLIS) (EPA CERCLIS Search), National Priorities List (NPL) (EPA National Priorities
List), Resource Conservation and Recovery Act (RCRA) (EPA RCRA Site), Emergency Response
Notification System (ERNS) list (EPA National Response Site), State Equivalent NPL (Montana
Department of Environmental Quality [DEQ] NPL), State Equivalent CERCLIS (DEQ CERCLIS),
State landfill (DEQ Solid Waste), State and tribal Brownfields Sites (DEQ Brownfields),
Underground Storage Tank (UST) site lists (DEQ UST Site), Leaking Underground Storage Tank
(LUST) site lists (DEQ LUST Site), and the DEQ Mine Waste Cleanup Bureau (MWCB) (DEQ Mine
Waste Cleanup Site).
Pioneer used DEQ and EPA lists to determine if there are any current federal, state, and local
government environmental investigations near the site. Pioneer researched DEQ and EPA
databases to verify the locations of any current federal, state, and local government
environmental investigations that were being conducted within a 0.5 and 1.0 mile radius
around the property. Sites found in the various databases, located within 0.5 to 1.0 miles
around the property, are shown in Figure 5.
14
The NPL is a Federal list created by the EPA, which ranks those sites requiring cleanup of
hazardous substances as defined under the CERCLA, also known as Superfund. These sites are
ranked according to the criteria established by the EPA and are listed in the Code of Federal
Regulations (CFR). The EPA updates the NPL periodically. Potential new NPL sites are listed by
the EPA in the Federal Register. The NPL was reviewed for sites of concern in the St. Ignatius
vicinity by using the Montana NPL listings obtained from the DEQ and EPA databases.
The CERCLIS lists those sites which: 1) have received, generated, transported, or disposed of
hazardous wastes prior to November 1980; or 2) have hazardous wastes that have been
released to the environment. Inclusion on this list is not itself a judgment about the activities of
a site’s owners or operators. It does identify sites that may require further investigation
because they could pose environmental or public health risks. The CERCLIS is used to track
potentially uncontrolled hazardous materials/waste sites. The EPA database shows no CERCLIS
sites in Lake County. There are no NPL superfund sites in Lake County.

15
Figure 5. Property Remediation Sites Within 0.5 and 1.0 Miles of Subject Property

16
The Montana non-NPL site list was reviewed for sites in Lake County. These non-NPL sites are
uncontrolled hazardous substances sites that did not rank high enough to be placed on the NPL
list; therefore, they were placed on the Montana DEQ Comprehensive Environmental Cleanup
and Responsibility Act (CECRA) Priority Site List. There are four sites listed for Lake County,
each listed as inactive landfills (Montana DEQ CECRA Priority List). The CECRA site closest to the
subject property is Midway Store Dump site in Ravalli approximately 6 miles southwest, which
is located in Section 16, R20W, T17N. The groundwater flow below this dump site is
downgradient of the subject property (LaFave et al., 2004).
Pioneer also reviewed the RCRA status of the property with regards to the generation of
hazardous wastes on or in the proximity to the property (Appendix D). The subject property is
not the site of a registered generator. This indicates that no known disposal activities, spills
and/or remediation activities have taken place on the subject property. Review of the database
shows that there are 37 registered RCRA handlers in Lake County.
Pioneer reviewed the ERNS list, which is EPA’s list of reported CERCLA hazardous substance
releases or spills in quantities greater than the reportable quantity, as maintained by the
National Response Center. Pioneer’s review of the list found no environmental recognized
conditions at the subject property or within a 0.5-mile radius of the subject property.
Pioneer reviewed the UST status of the property using a UST registration list, active as of
September 2011, provided by the DEQ. The database shows 37 active UST sites, one of which is
located within 0.5 miles of the subject property at 240 Mountain View Drive. Review of the UST
registration list indicates there has been USTs and/or piping registered at the subject property.
The UST Summary Report from September 26, 2011 shows two tanks installed in 1983 and
replaced in 2005, which currently have an ‘in use’ status.
Pioneer reviewed the DEQ LUST site list. There are 37 active LUST sites listed in Lake County.
Two of the LUST sites are located within the 1.0-mile radius of the subject property (Figure 5).
The closest is an active LUST site at 240 Mountain View Drive at Stuart’s Service Center that was
resolved in 1995 by removing the contaminated soil to a regulated landfill site outside of the
county.

17
Pioneer reviewed a list of state and tribal Brownfields sites in Montana. Neither the subject
property nor any adjoining properties are listed on the targeted Brownfields Assessment Sites
list.
Pioneer reviewed MWCB Priority Site List and the Prioritized List of Abandoned Mine Lands
(AML) Sites as listed on the DEQ’s Online Query system. The DEQ Abandoned Mine Quarry
System lists four abandoned hardrock mine sites in Lake County. None of the sites lie within
the 1.0-mile radius of the subject property.
LOCAL CONTACTS
The Phase I ESA process can include telephone contacts to local officials. With the availability
of environmental records online, this step in the process has become less critical. Since the
subject property has always been used for the original purpose since the time it was built, this
ESA relies on government records of contamination sites.
The electrical power to the site is supplied by a power pole located north of the White Buffalo
Restaurant. There are six power poles on the subject property, three of which have
transformers (Figure 6), and were observed to be modern transformers that Pioneer personnel
did not suspect of containing PCBs (post-1977 construction of power lines). Pioneer did not
contact Northwestern Energy to verify that the transformers do not contain PCBs.

18
Figure 6. View to the North of the Power-line Transformers
EVALUATION OF GROUNDWATER CONDITIONS
Groundwater flow beneath the city of St. Ignatius is to the northwest (LaFave et al., 2004),
however, no site-specific groundwater work was conducted at the subject project. Information
about local groundwater conditions was taken from well logs for local groundwater wells that
are registered in the State of Montana. The well information was obtained from the Montana
Bureau of Mines and Geology (MBMG) Ground-Water Information Center (GWIC) website.
Wells within the GWIC system that are within 0.5 to 1.0 mile of the subject property are shown
on Figure 7. The two on-site wells closest to the subject property have been used to provide
more specific information on depth-to-groundwater and aquifer characteristics near the subject
property. The GWIC well location data are provided on a section, quarter-quarter system;
therefore, well location data obtained from GWIC should be regarded as approximate.
Wells within the GWIC system that are located on the subject property and in the SW¼ of the
NE¼ of S14, T18N R20W are shown in Figure 7. There are two wells located on the subject
property, completed in 1974 and 1978. The logs for the wells within the subject property
indicate that the subsurface generally consists of clay and gravel to a depth of approximately 90

19
feet below ground surface (bgs). Static water levels in the nearby wells are 30 to 33 feet below
ground surface. The subject property is located above the shallow Post Creek Aquifer (LaFave
et al., 2004).
PHYSICAL SETTING INFORMATION
Information used in determination of the physical setting includes the following:
● On-site reconnaissance by Mr. Ryan Carter of Pioneer on June 26, 2013.
● Aerial photographs (USGS, Microsoft Corp., Bing). A satellite photograph of the area with
the property boundary outline is included as Figure 1.
● Montana Cadastral Mapping database, www.gis.mt.gov.
HISTORICAL USE INFORMATION
Historical information on the subject property was obtained verbally from the realtor, Mr. Bill
McQuirk, representing the Allard Estate and written from the questionnaire from Ms. Jeanine
Allard (owner’s daughter). Doug Allard has owned and operated the businesses within the
subject property since each of the structures were built.
1.4 SITE RECONNAISSANCE Pioneer conducted the initial Phase I ESA site tour on June 26, 2013. The subject property was
vacant except for a temporary fireworks stand on-site. A second site visit on July 24, 2013 to
complete a review of the site; the temporary fireworks stand had been removed. During the
initial site reconnaissance, Pioneer completed the user portion of the ASTM (E-1528-06)
questionnaire (ASTM, 2006). Ms. Jeanine Allard completed the occupant portion of the ASTM
(E-1528-06) questionnaire on June 28, 2013.
PROPERTY OBSERVATIONS
The subject property consists of a gas station, motel, general store, museum, office building,
and restaurant. The property observations are limited to the outdoor space and items within
the building that could potentially impact the environment. A counter-clockwise inspection of
the property was made on foot.

20
Figure 7. Location of Wells Within 0.5 and 1.0 Miles from Subject Property

21
The restaurant is a freestanding, two-story log structure with a concrete foundation basement.
There is a precast-concrete covered front porch entrance and an attached poured concrete
patio on the east of the building. The surrounding parking area is gravel. There were no visible
pumps or wells in the immediate vicinity of the building. The detached refrigeration unit, on
the northwest corner of the building did not appear to have any leaks or structural damage.
The unit is on a concrete slab. A visual inspection of the interior was made from the front door
windows. Counters, display cases, chairs, and tables were present, common for restaurant
furniture and fixtures.
The Huckleberry Jam Factory is freestanding, single-story, wood-framed, slab on-grade building
with a covered front porch area. At the east corner of the building is a capped well access, and
two registered above ground storage tanks to the northeast of the building. At the back of the
building is a capped iron well, with a ‘Campbell’ imprint and buried to the top of the cap,
partially covered with gravel. The asphalt parking area, in the front of the building has very few
oil-based stains, commonly associated with the type of activity for a parking lot. The northeast
and northwest, backside area of the building is a graveled drive-through/parking area. There
were no visible stains in this area. The refrigeration unit attached at the back of the building
appears to be in working condition and had no associated leaks. There are no visible irrigation
or sprinkler systems for the associated orchard to the northwest of the Huckleberry Jam
Factory. There was no visual inspection of the interior due to no windows or access to the
inside of the building.
The Trading Post is an attached, two-story, wood-framed building with a covered front porch
entrance. There is a hand pump, water well spigot at the east corner of the building. The
asphalt parking area, in the front of the building has very few oil-based stains, commonly
associated with the type of activity for a parking lot. The northeast and northwest, backside of
the building is a graveled drive-through and parking area. There are no visible signs of any
stains in this area. A limited inspection of the interior was made through the windows at the
front of the building. Common fixtures, such as counters, display cases and racks, and an
upper-balcony area was visible. There is a registered above ground propane tank and a second
hand pump, water well spigot at the backside of the building.
22
The office building is a detached, single-story, concrete foundation with crawl space, log framed
building. The office building is behind the trading post and is surrounded by landscaped grass.
The small building is empty in the interior and has no visible environmental concerns.
The Flathead Indian Museum is an attached, single-story, wood-framed building with exterior
restroom access. The front asphalt parking area has very few oil-based stains, commonly
associated with the type of activity for a parking lot. The backside of the museum has an
attached storage area with no visible containers that would pose an environmental concern.
The General Store is an attached, single-story, wood-framed building with a covered, wood-
floor front porch entrance. The front asphalt parking area has very few oil-based stains,
commonly associated with the type of activity for a parking lot. The backside of the general
store has an attached storage area with a yard maintenance area with no visible containers of
pesticides or toxic substances that would pose an environmental concern.
The gas station, associated with the General Store, has two pumps stations with a two-post
metal canopy. The refill ports are on the northwest and southeast sides of the pumps.
According to the Montana Department of Environmental Quality’s (MDEQ) Petroleum Tank
Release Cleanup Fund (PTRCF) Claims & Reimbursement Report, and verified with MDEQ’s Ms.
Janet Adolf of the Compensation Board, there was petroleum contaminated soil documented
when the two registered 10,000 gallon underground storage tanks were being removed, and
replaced with two similar 10,000 gallon tanks. Because of the petroleum release, the owner
applied to the PTRCF for financial assistance, for reimbursement for the corrective action costs
to the operator and/or their environmental consultants and subcontractors. The clean-up was
accepted by the MDEQ and the case closed, ratified as of April 21, 2007 and resolved as of July
9, 2008. The registered underground tanks are not currently on the active LUST list.
The Lodgepole Motel is an attached, single-story, wood and log-framed building with seven
units. The motel consists of two similar-type buildings, forming an “L” at the south end of the
subject property. The front asphalt parking area has very few oil-based stains, commonly
associated with the type of activity for a parking lot. The backsides of both motel buildings are
grass with what appears to be a storage shed between the two buildings. It is unknown what is

23
stored inside the shed; there was no inspection of the interior – an internal inspection is
recommended. The abandoned septic vault is on the west corner of the two motel buildings.
The exposed vault has two covers, one slightly offset, but was not opened during the site visit.
Several units have the window shades drawn and the interiors are visible. Common motel
fixtures are visible: chairs, nightstands, beds, and storage cabinets. There were no visible
environmental concerns.
PHYSICAL SETTING ANALYSIS
The subject property is a commercial property and is located in a rural-commercial
development area. The site is level, and much of it has been paved with asphalt. The site is
situated over the shallow Post Creek Aquifer, making protection of groundwater in this area
critical. No evidence was observed at the site indicating that petroleum products or other
contaminants had been disposed or spilled in a way that would threaten groundwater quality.
The site is equipped with a storm drain system to the north and southeast of the property,
along Highway 93. The site is served by city water and sanitary sewer.
1.5 INTERVIEWS
Interviews were conducted in accordance with ASTM standards as described in ASTM
Designation E1528-06 (Standard Practice for Limited Environmental Due Diligence: Transaction
Screen Process) (ASTM, 2006). The current representative of the owner interview was
conducted by Mr. Carter via telephone.
1.6 FINDINGS/CONCLUSIONS
Pioneer has performed a Phase I ESA, in conformance with the scope and limitations of ASTM
Practice E 1527-05, of the subject property at 77529, 77547, 77565, and 77579 U.S. Highway
93, St. Ignatius, Montana. Any exceptions to or deletions from this practice are described in
Sections 1.2 and 1.3 of this report. Based on the findings of this Phase I ESA, it is the opinion of
Pioneer that no visibly apparent potential environmental concerns exist at the subject property.
This report is based on Pioneer’s review of available historical and environmental records;
visual inspections of the subject property and adjoining properties; and interviews with

24
available persons having knowledge of the property. Section 1.5 of this report,
Findings/Conclusions is considered an Executive Summary and should be reviewed in
conjunction with the entire report.
Pioneer declares that, to the best of our professional knowledge and belief, we meet the
definition of Environmental Professional as defined in 312.10 of 40 CFR 312 and have the
specific qualifications based on education, training, and experience to assess a property of the
nature, history, and setting of the subject property. Pioneer has developed and performed the
all appropriate inquiries in conformance with the standards and practices set forth in 40 CFR
Part 312.
1.7 REFERENCES
ASTM, 2005. Designation E 1527-05; Standard Practice for Environmental Site Assessments: Phase I Environmental Site Assessment Process
ASTM, 2006. Designation E 1528-06; Standard Practice for Limited Environmental Due Diligence: Transaction Screen Process
Carter, R., 2011. Environmental Site Assessment, St. Ignatius, Montana. Report completed for Pioneer Technical Services, Missoula, Montana, 55 pp. Not published
Emergency Response Notification System, n.d., retrieved from https://cfpub.epa.gov/si/si_public_record_report.cfm?Lab=&dirEntryId=2874
Federal Comprehensive Environmental Response Search, n.d., retrieved from https://www.epa.gov/enviro/sems-search
Federal Resource Conservation and Recovery Act, n.d., retrieved from https://www3.epa.gov/enviro/facts/rcrainfo/search.htmlFederal Superfund Site System, n.d., retrieved from https://www.epa.gov/superfund
LaFave et al., 2004. Montana Bureau of Mines and Geology; Montana Ground-Water Assessment Atlas 2; Ground-Water Resources of the Flathead Lake Area: Flathead, Lake, Missoula, and Saunders Counties, Montana
Montana Department of Environmental Quality Comprehensive Environmental Cleanup and Responsibility Act Priority, n.d., retrieved from http://deq.mt.gov/Land/statesuperfund/cecra
Montana Department of Environmental Quality Mine Waste Cleanup Bureau, n.d., retrieved from http://deq.mt.gov/Land/fedsuperfund

25
Montana Leaking Underground Storage Tank, n.d., retrieved from http://deq.mt.gov/Land/lust/lustsites
Montana State and tribal Brownfields Sites, n.d., retrieved from http://deq.mt.gov/Land/brownfields/brownfieldssites
Montana State Equivalent Comprehensive Environmental Response Search, n.d., retrieved from http://environment.netronline.com/state/MT/cerclis/
Montana State Equivalent National Priorities List, n.d., retrieved from http://environment.netronline.com/state/MT/npl/
Montana State Landfill, n.d., retrieved from http://deq.mt.gov/Land/solidwaste
Montana State Library Cadastral System, n.d., retrieved from http://svc.mt.gov/msl/mtcadastral/
Montana State Property Records Search Portal, n.d., retrieved from http://svc.mt.gov/msl/mtcadastral/
Montana Underground Storage Tank, n.d., retrieved from http://deq.mt.gov/Land/ust/ustdownloads
National Priorities List, n.d., retrieved from https://www.epa.gov/superfund/superfund-national-priorities-list-npl

26
Chapter 2: Hydrogeology Characteristics of Waste Management Area U, Hanford, Washington
27
2.1 INTRODUCTION
This chapter is an excerpt from the Engineering Evaluation Report for Single-Shell Tank Waste
Management Area U Groundwater Monitoring (Sulloway, et al., 2018). This chapter briefly
describes the local geology and hydrogeology beneath the Waste Management Area U (WMA
U) area (Figure 8). This information is summarized from the Groundwater Quality Assessment
Plan for the Single-Shell Tank Waste Management Area U (PNNL-13612 and DOE/RL-2009-74,
Rev. 1) and is intended to provide a brief overview of the current understanding of the site.
WMA U, which includes the single-shell tanks (SSTs) and ancillary equipment of the U Tank
Farm, is located in the south-central portion of the 200 West Area, near U Plant (Figure 8). SSTs
in WMA U were used for interim storage of highly radioactive waste (called “metal” waste)
generated by nuclear fuel reprocessing using the bismuth phosphate process at B and T Plants.
WMA U contains 16 underground SSTs constructed between 1943 and 1944. The WMA also
contains ancillary equipment used to manage tank waste during operations, including six
diversion boxes, the 271-UR control house, the 244-UR process vault, the 244-U double-
contained receiver tank, waste transfer lines, pits, and junction boxes.
The tanks in WMA U began operations in 1946 and were in continual use until 1980, at which
time they were removed from service. Most of the metal waste was subsequently removed
from the tanks and recycled through U Plant to remove uranium. WMA U subsequently
received fuel reprocessing waste from the Reduction Oxidation (REDOX) Plant and from other
waste operations such as Plutonium Uranium Extraction Facility (PUREX). The tank farm was
later interim stabilized (by removing pumpable liquids from the tanks) and isolation activities
were performed (DOE/RL-91-52; PNNL-13282, Groundwater Quality Assessment for Waste
Management Area U: First Determination).

28
2.2 STRATIGRAPHY
The local stratigraphy beneath WMA U consists of unconsolidated to semiconsolidated
sediments overlying basalt bedrock of the Columbia River Basalt Group. The sedimentary units
present (in descending sequence) are as follows:
● Sand and gravel backfill
● Sand and gravel of the Hanford formation
● Fine-grained Cold Creek unit
● Sand and gravel of the Ringold Unit E
● Fine-grained Ringold lower mud unit
● Sand and gravel of Ringold Unit A (which overlies the basalt)

29
Figure 8. Location Map for the Waste Management Area U
30
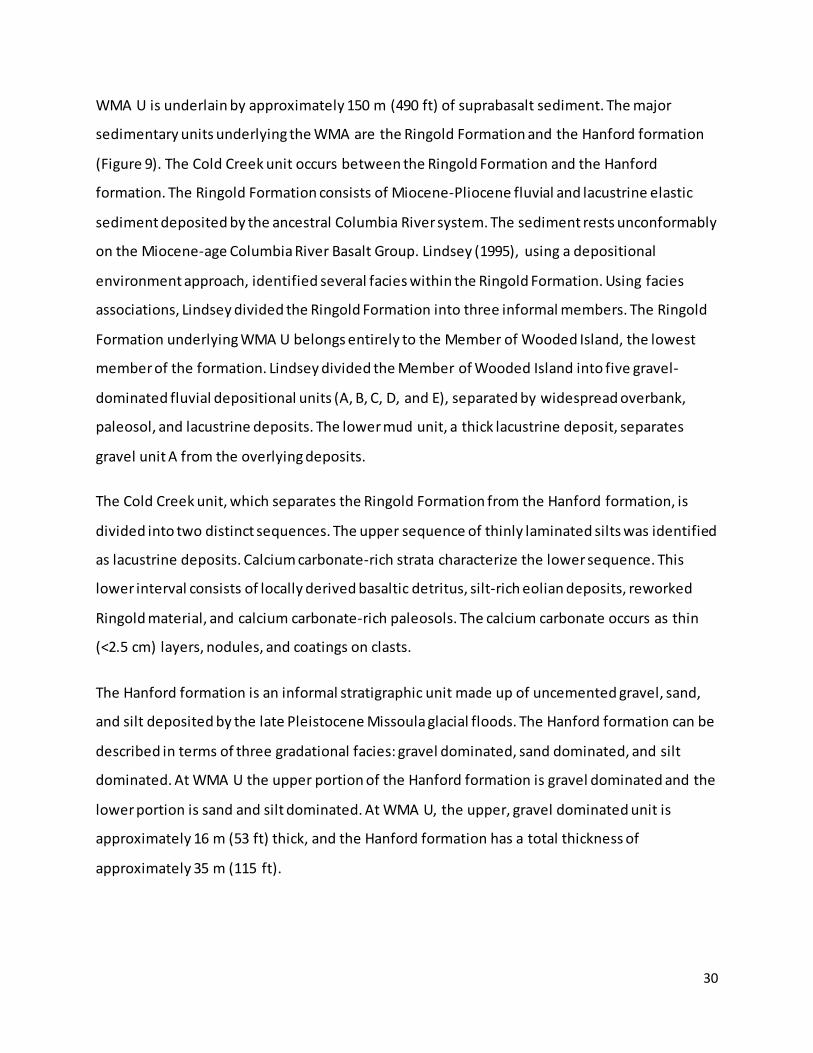
WMA U is underlain by approximately 150 m (490 ft) of suprabasalt sediment. The major
sedimentary units underlying the WMA are the Ringold Formation and the Hanford formation
(Figure 9). The Cold Creek unit occurs between the Ringold Formation and the Hanford
formation. The Ringold Formation consists of Miocene-Pliocene fluvial and lacustrine elastic
sediment deposited by the ancestral Columbia River system. The sediment rests unconformably
on the Miocene-age Columbia River Basalt Group. Lindsey (1995), using a depositional
environment approach, identified several facies within the Ringold Formation. Using facies
associations, Lindsey divided the Ringold Formation into three informal members. The Ringold
Formation underlying WMA U belongs entirely to the Member of Wooded Island, the lowest
member of the formation. Lindsey divided the Member of Wooded Island into five gravel-
dominated fluvial depositional units (A, B, C, D, and E), separated by widespread overbank,
paleosol, and lacustrine deposits. The lower mud unit, a thick lacustrine deposit, separates
gravel unit A from the overlying deposits.
The Cold Creek unit, which separates the Ringold Formation from the Hanford formation, is
divided into two distinct sequences. The upper sequence of thinly laminated silts was identified
as lacustrine deposits. Calcium carbonate-rich strata characterize the lower sequence. This
lower interval consists of locally derived basaltic detritus, silt-rich eolian deposits, reworked
Ringold material, and calcium carbonate-rich paleosols. The calcium carbonate occurs as thin
(<2.5 cm) layers, nodules, and coatings on clasts.
The Hanford formation is an informal stratigraphic unit made up of uncemented gravel, sand,
and silt deposited by the late Pleistocene Missoula glacial floods. The Hanford formation can be
described in terms of three gradational facies: gravel dominated, sand dominated, and silt
dominated. At WMA U the upper portion of the Hanford formation is gravel dominated and the
lower portion is sand and silt dominated. At WMA U, the upper, gravel dominated unit is
approximately 16 m (53 ft) thick, and the Hanford formation has a total thickness of
approximately 35 m (115 ft).

31
2.3 HYDROGEOLOGY
Groundwater beneath WMA U occurs as an unconfined aquifer and deeper confined aquifers.
The water table occurs in the Ringold Formation Member of Wooded Island (Figure 10). Depth
to water range from 70.6 m (231 ft) to 74.9 m (246 ft). The uppermost confined aquifer occurs
in Ringold unit A and is confined above by the lower mud unit and below by basalt. Deeper
confined aquifers occur between the basalt flows.
The base of the unconfined aquifer is the fine-grained Ringold lower mud unit. The lower mud
unit is at least partly confining and is continuous beneath WMA U (Development of the Hanford
South Geologic Framework Model Hanford Site, ECF-Hanford-13-0029, Rev. 4) isolating the
confined aquifers from potential releases from WMA U. The unconfined aquifer is
approximately 70 m (230 ft) thick.

32
Figure 9. General Stratigraphy at the Hanford Site

33
A more detailed description of the geology of WMA U is provided in Subsurface Conditions
Description of the U Waste Management Area (RPP-15808) and Groundwater Quality
Assessment Plan for Single-Shell Tank Waste Management Area U (PNNL-13612). Revised
Hydrogeology for the Suprabasalt Aquifer System, 200 West Area and Vicinity, Hanford Site,
Washington (PNNL-13858) describes the hydrogeology of the entire 200 West Area and vicinity.
Water beneath the WMA U is found in the unsaturated vadose zone above the water table and
in the saturated zone below the water table. Properties of groundwater in both regions are
important in understanding how the WMA may impact groundwater quality.
The unsaturated sediments above the water table affect how waste solutions move through the
soil, how much is retained in the sediment column, and how much waste eventually reaches
the water table. The source of contamination for the WMA is liquid waste released to near
surface or subsurface sediments. These liquids move through the sediment under unsaturated
conditions and as a result, tend to spread laterally at changes in stratigraphy. Small volume
leaks would tend to be retained in the vadose zone near the leak point. Larger leaks would be
expected to move deeper in the soil, spreading laterally as the wetting front moves downward.
A major stratigraphic change is the top of the Cold Creek unit. This unit, located about 30 m
(98.4 ft) below ground surface would slow the downward movement of water and divert it to
the southwest, the direction the top of the unit is dipping beneath the WMA. Water from a
waste release may reach the water table at a time, location, and concentration depending on
its volume, depth of release, and diversion from downward movement at a stratigraphic
change. Over time, wastewater released to the sediment column near ground surface will
evaporate or be driven downward to the water table by new inputs of water to the sediment
column from above. It is this downward movement of water in the vadose zone that carries
waste contaminants to the water table. Water movement in the unsaturated zone is relatively
slow compared to groundwater flow below the water table, delaying the observed impact of a
near surface waste release on groundwater quality.

34
2.4 GROUNDWATER FLOW SYSTEM
Elements of the groundwater flow system beneath WMA U are described in the following
subsections. These elements include the effects of historical anthropogenic discharges to
ground in the 200 West Area, resulting changes in groundwater elevation and flow direction
and velocity, and more recently, implementation of groundwater remediation using P&T
systems that remove, treat, and replace water into the aquifer.

35
Figure 10. East to West Cross-Section for Waste Management Area U

36
Hydrologic Conditions Prior to 200 West Pump and Treat Operations
Groundwater flow conditions at WMA U have varied greatly over the past several decades due
to changing wastewater disposal in areas surrounding the WMA. Between 1950 and 1970, the
groundwater flow direction beneath the WMA varied between southeast, east, and northeast,
depending on effluent disposal volumes to the former 216-T-4 Pond to the north of the WMA
and the former 216-U-10 Pond to the southwest (PNNL-16069, Development of Historical Water
Table Maps of the 200 West Area of the Hanford Site [1950-1970]). During the 1980s, the flow
direction changed from northeast to east in response to the decommissioning of the 216-U-10
Pond in 1985. In the late 1980s and early 1990s, nearby effluent discharges were occurring at
the 216-Z-20 Crib to the west of the WMA and the 216-U-14 Ditch to the east (see Figure 11 for
waste site locations). The effluent volume discharged to the 216-Z-20 Crib declined in 1992, and
the flow direction beneath the WMA reversed to westerly because discharges to the 216-U-14
Ditch became dominant. Discharges to both sites had ceased by 1996, and the flow direction
has been toward the east-northeast since that time.
Hydrologic Conditions Due to Operation of the Pump and Treat Remedy
Water levels in the monitoring wells declined an average of 0.37 m/yr (1.21 ft/yr) from 2014
to 2016 (DOE/RL-2016-67, Hanford Site Groundwater Monitoring Report for 2016). The decline
is due to the substantial reduction of wastewater discharges to the soil column in the mid-
1990s and operation of the 200 West pump and treat (P&T).
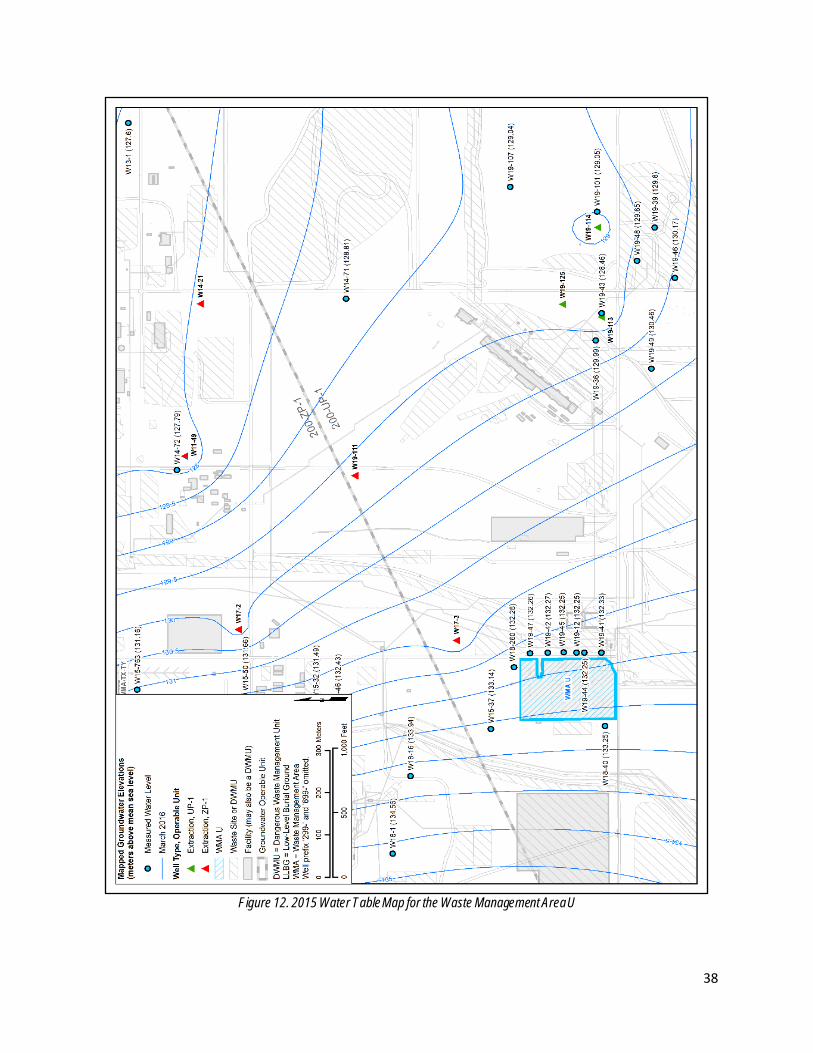
The 2016 Hanford Site water table map shows groundwater flow direction to the east-
northeast beneath the WMA (Figure 12). Groundwater flow is affected by the 200 West P&T
remedy, which began operating in 2012. The system extracts and treats contaminated
groundwater. One extraction well (299-W17-3) is located near the WMA approximately 150 m
(490 ft) north-northeast. Drawdown around this well accounts for the increased gradient at
WMA U. The extraction well is shown on the 2016 water table map (Figure 12). The hydraulic
gradient beneath the WMA is estimated to be 5.0 × 10⁻³ m/m based on a trend surface analyses
performed on four sets of water level measurements at WMA U during 2016. The average

37
groundwater 2016 flow rate of 0.18 m/d (0.58 ft/d) was consistent with the 2015 average rate
of 0.19 m/d (0.62 ft/d) (DOE/RL-2016-67).
Baseline groundwater levels were evaluated in two dimensions by interpolating water-level
data obtained during June 2012, at which time no groundwater remedy was operating. Figure
13 shows the 2012 water table map prior to the start of the P&T remedy. During this time,
groundwater flow direction was to the east-northeast. The hydraulic gradient is estimated to be
2.1 × 10⁻³ m/m in 2012 with an average linear velocity of 0.018 to 0.20 m/day (0.05 to 0.7
ft/day) (SGW-55438, Hanford Site Groundwater Monitoring for 2012: Supporting Information).
Figure 11. Waste Site Locations Near Waste Management Area U
38
Figure 12. 2015 Water Table Map for the Waste Management Area U

39
Figure 13. Water Elevation Contours in June 2012 Prior to Startup of the 200 West P&T
40
2.5 VADOSE ZONE
The vadose zone at WMA U is approximately 70.6 m (236 ft) to 74.9 m (246 ft) thick and
consists of (from top to bottom) the Hanford formation, the Cold Creek Unit, and the Ringold
Formation. The lower hydraulic conductivity of the Cold Creek Unit is likely to slow downward
movement of moisture and contaminants because of the finer textured sediment and
associated calcium carbonate cementation that results in a low hydraulic conductivity of the
Cold Creek Unit. Although the Cold Creek Unit is clearly a restriction to vertical migration of
water (and associated dissolved contaminants) beneath WMA U, it is not impermeable and
contaminated water can eventually reach the underlying groundwater. This is indicated by the
apparent presence of contaminants from WMA U in groundwater at the site.
The unsaturated sediments above the water table affect how waste solutions move through the
soil, how much is retained in the sediment column, and how much contamination eventually
reaches the water table. The source of contamination for the WMA is liquid waste released to
near-surface or subsurface sediments. These liquids would be expected to move through the
sediment under both saturated and unsaturated conditions, depending on the volume of liquid
released. In addition to expected lateral distribution in relatively homogeneous portions of the
formation, lateral spreading may occur at changes in soil texture and hydraulic conductivity.
Small volume leaks would tend to be retained in the vadose zone near the leak point. Larger
releases would be expected to move deeper in the soil, spreading laterally as the wetting front
moves downward.
2.6 SOIL MOISTURE FACTORS
Tank leak/release events typically began with rapid discharge of some waste fluid volume into
the subsurface from a point of release likely having a small spatial extent (on the order of
inches to rarely feet). This discharge temporarily increases the moisture content of the
unsaturated soil, particularly at the point of release. Typical release points may include poorly
sealed openings in the tank structure, ruptured areas of steel tank liners nearby underlying
concrete shell fractures and breaks in waste transfer lines. Free liquids in soil move downward
generally by gravity and move laterally typically by the forces of soil capillarity. The initial rate
41
of liquid movement and the volume of soil that is eventually wetted by any particular release is
a function of the volume of the leak, its duration, and the initial moisture content of the
surrounding soil. The hydraulic conductivity of damp and/or wet soil is substantially higher than
dry soil. Subsurface soil characterization at WMA U (PNNL-17163, Characterization of Direct
Push Vadose Zone Sediments from the 241-U Single-Shell Tank Farm) indicated that much of the
subsurface soil was relatively wet (i.e., wetter than the natural moisture content of soil in an
arid environment).
Migration process at SST sites are anticipated to occur, for the most part, in partially saturated
soils because leak/release volumes were not sufficient to fill the soil pore spaces for an
appreciable length of time or very far from the point of entry. This condition is referred to as
“unsaturated flow.” In addition to vertical flow, lateral flow may occur under both saturated
and unsaturated conditions due to the effects of capillary action and due to the effects of
wetting front encountering zones of varying hydraulic conductivity. In formations such as those
encountered in the Hanford Site, soil layers with different hydraulic properties tend to be
layered horizontally by sediment deposition processes. Consequently, flow in the lateral
direction could occur at numerous depth intervals within the vadose zone.
External sources of water or other liquid may drive the contamination further downward.
Infiltration of water from precipitation and unintentional, manmade releases such as leaking
water lines may move residual waste remaining in the soil downward to the groundwater.
Another potential source of water was discharges to nearby wastewater disposal sites: the 216-
Z-20 Crib and Z Ditches to the west, and the 216-U-14 Ditch to the east (RPP-23405, Tank Farm
Vadose Zone Contamination Volume Estimates). These historical discharges likely created
substantial areas of perched water atop the Cold Creek Unit; these perched units may have
migrated laterally beneath WMA U, providing additional driving force for historical releases
from the WMA. Historical observations of perched water during drilling wells in the vicinity of
these waste sites, and others, indicates the possibility of historical perched water migration.
42
2.7 HYDROGEOLOGIC CONSIDERATIONS
Prior to startup of the 200 West P&T system in 2012, the groundwater flow direction under
WMA U was east at a calculated rate (using the Darcy relationship) of 0.08 m/d (0.26 ft/d)
(DOE/RL-2011-118, Hanford Site Groundwater Monitoring for 2011). In 2015, the groundwater
flow direction beneath the WMA was generally east to northeast as a result of groundwater
extraction and injection for the 200 West P&T with a calculated groundwater velocity of 0.04 to
0.50 m/d (0.15 to 1.6 ft/d) (DOE/RL-2016-09, Hanford Site Groundwater Monitoring Report for
2015).
Pump and treat operations are expected to continue in this region until 2037. After completion
of active groundwater remediation and the 200 West P&T system is shut down, groundwater
flow is anticipated to return to pre 200 West P&T startup conditions. The changing
groundwater flow directions and gradients will be considered when evaluating the groundwater
monitoring network.
2.8 GROUNDWATER CHEMISTRY
Under the current groundwater flow regime, contaminants reaching the groundwater from a
release at WMA U would migrate as dissolved contamination plume(s) toward the east-
northeast with the groundwater flow. The average groundwater flow rate for 2016 has been
estimated at 0.18 m/d (0.59 ft/d). Section 6.4 in RPP-35485 (Field Investigation Report for
Waste Management Area U) discusses the conceptual models of tank leak/release pathways to
the groundwater at WMA U in more detail.
● The following contaminants are present in the aquifer at WMA U:
o Chromium
o Carbon tetrachloride
o Nitrate
o Technetium-99
WMA U is the apparent source of groundwater contamination limited to the downgradient
(east) side of the tank farm (Chapter 6.0 in PNNL-13282, Groundwater Quality Assessment for
Waste Management Area U First Determination). During 2016, chromium was detected in

43
several downgradient wells at concentrations from 4.49 to 34.2 µg/L. The concentration in
upgradient well 299-W18-40 was 6 µg/L. Conditions related to corrosion of stainless steel well
components can also result in detectable chromium in groundwater samples. Corrosion-related
chromium, however, is typically accompanied by iron, nickel, manganese, and occasionally
other metals at definable concentrations relative to the proportion of the metals in the steel
alloy. This condition has not been confirmed at WMA U.
While dissolved chromium (generally present as the chromate hexavalent chromium ion) is
highly mobile in the aquifer, it can migrate more slowly than the movement of moisture in the
vadose zone beneath the tank farms, at least initially following release from a tank. This has
been attributed to a reduction process where tank fluids dissolve divalent iron minerals in the
sediment. The iron then reacts with the soluble hexavalent chromium, reducing it to trivalent
chromium, which precipitates as an insoluble iron chromium hydroxide (Zachara et al., 2007).
This reaction may explain the current low concentrations of chromium in the groundwater. In
the aquifer, dissolved chromium migrates to the east-northeast at the calculated groundwater
flow rate of 0.18 m/d (0.59 ft/d).
Concentrations of the nondangerous constituent nitrate are above 45 mg/L in all network wells,
including the upgradient well. The upgradient nitrate source is treated water injected into wells
formerly used for the 200-ZP-1 interim action P&T system. This injected water was treated for
VOCs but still contained nitrate (DOE/RL-2011-118, Hanford Site Groundwater Monitoring
Report for 2011). The concentration in upgradient well 299-W18-40 was 79.7 mg/L, and the
trend has been increasing since this well was drilled in 2001. Because nitrate in some
downgradient wells are higher than the upgradient well, it is likely that WMA U is also a source
of nitrate to the groundwater.
WMA U is a source of technetium-99 groundwater contamination (PNNL-13282). Although
technetium-99 is not regulated under RCRA, it is mentioned in this discussion because the
pattern of concentration changes of technetium-99 in wells downgradient of WMA U strongly
parallels the behavior of nitrate in those wells. Concentrations in many downgradient wells are
stable or slowly increasing, with the exception of well 299-W19-45 in which concentrations

44
have increased substantially since 2011. During 2016, concentrations in this well increased to
8,730 pCi/L from the 2015 maximum of 6,950 pCi/L. During 2016, technetium-99 also exceeded
the 900 pCi/L cleanup level for the 200-UP-1 OU in wells 299-W19-12, 299-W19-42, 299-W19-
47, and 299-W18-260, with a maximum of 1,720 pCi/L in well 299-W18-260. The groundwater
contamination at WMA U is believed to result from multiple sources in the WMA (Table 4-2 in
HNF-EP-0182, Rev. 353, 2017, Waste Tank Summary Report for Month Ending May 31, 2017).
The contamination is within the 200 West P&T capture zone.
2.9 SUMMARY OF VERTICAL DISTRIBUTION
Dangerous waste constituents specific to release from WMA U are not present in groundwater
at depth based on historical monitoring. Evaluation of vertical distribution data is limited to the
location of WMA U within the context of regional plumes present in 200-UP-1 OU including
contaminant plumes originating from WMA U. Available vertical distribution data are limited to
one well (299-W18-260) completed northeast of WMA U and samples collected during drilling.
See Figure 12 for well location in relation to WMA U. This well was installed in September and
October, 2014. The lack of observations and measurements introduces substantial uncertainty
in interpreting correlation between individual well data and the WMA U operations.
Evaluated constituents were limited to available nonradiological vertical data associated with
surrounding wells. Vertical profile samples were analyzed for carbon tetrachloride and nitrate,
representing wide spread contaminants in 200-UP-1 OU, and present near WMA U.
During drilling of well 299-W18-260, groundwater samples were collected from the borehole at
selected depths and analyzed by field and/or laboratory methods. Laboratory data were
selected where both field and laboratory data were available for the vertical contaminant
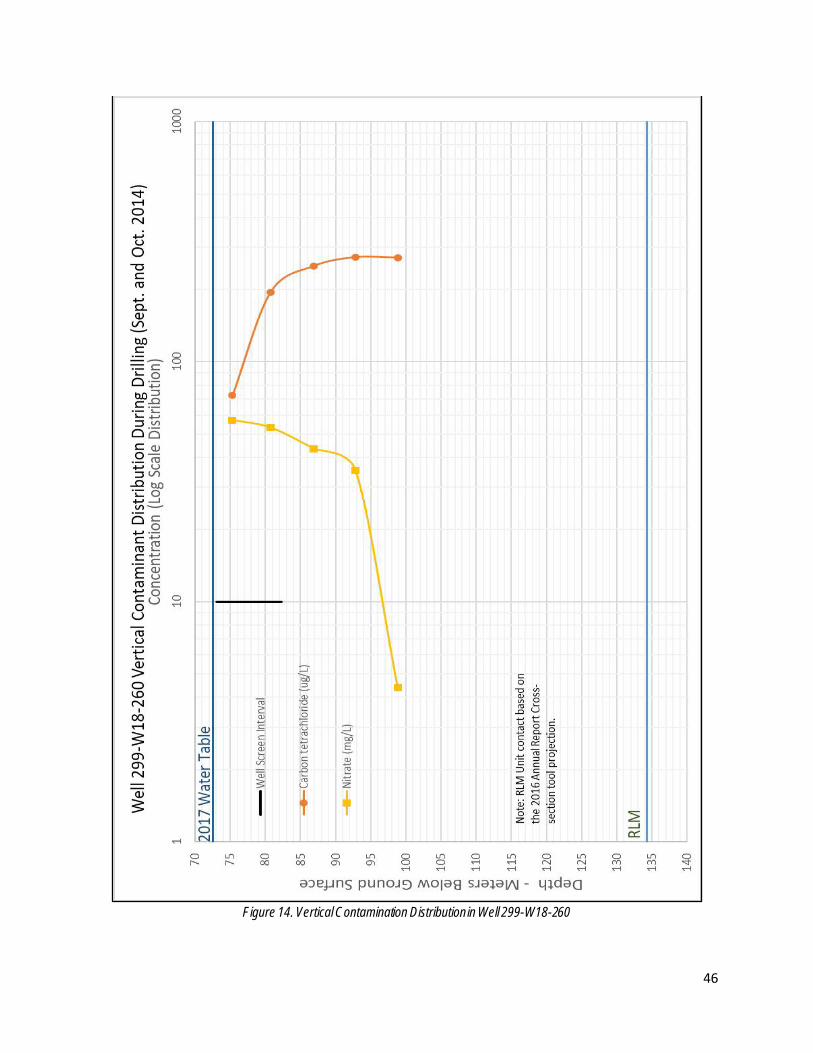
distribution plot. See Figure 14 for the observed vertical distribution of identified contaminants.
Well 299-W18-260 exhibits few measurements of vertical characterization data, consisting of
carbon tetrachloride and nitrate at five sample depths collected at elevations between 2.7 m
(8.9 ft) and 26.3 m (86.3 ft) below the 2017 water table. Based on vertical characterization data,
contaminants are present within the upper sections of the unconfined aquifer; consistent with
the presence of multiple sources and extents of regional plumes. Well 299-W18-260 exhibits an
45
increase in carbon tetrachloride and nitrate concentrations beginning about 2 m (6.6 ft) and 8
m (26.2 ft), extending to 20 m (65.6 ft) and 25 m (82.0 ft), respectively, below the 2017 water
table.
In summary, the WMA U is located within the regional 200 West Area plumes and within the
local-scale plumes. It is additionally impacted by the current, local 200-UP-1 P&T and 200 West
P&T well network operations. Based on the limited data available, the vertical distribution of
plume concentrations do not appear to penetrate the entire depth of the aquifer. Available
data for the well are not sufficiently representative to evaluate vertical plume migration from a
release from WMA U.
46
Figure 14. Vertical Contamination Distribution in Well 299-W18-260
47
2.10 REFERENCES
Brown, C. F., et al., 2007. Characterization of Direct Push Vadose Zone Sediments from the 241-U Single-Shell Tank Farm (PNNL-17163). Report prepared by Pacific Northwest National Laboratory for the Department of Energy, Richland Office: https://pdw.hanford.gov/arpir/index.cfm/viewDoc?accession=0911240534
Department of Energy, Richland Office, 1992. Groundwater Quality Assessment for Waste Management Area U (DOE/RL-91-52). Report prepared by CH2M Hill Plateau Remediation Company for the Department of Energy, Richland Office: https://pdw.hanford.gov/arpir/index.cfm/viewDoc?accession=D196110688
Department of Energy, Richland Office, 2008. Tank Farm Vadose Zone Contamination Volume Estimates (RPP-23405, Rev. 3). Report prepared by CH2M Hill Plateau Remediation Company for the Department of Energy, Richland Office: https://pdw.hanford.gov/arpir/index.cfm/viewDoc?accession=0075590H
Department of Energy, Richland Office, 2009. Interim Status Groundwater Quality Assessment Plan for the Single Shell Tank Waste Management Area U (DOE/RL-2009-74, Rev. 1). Report prepared by CH2M Hill Plateau Remediation Company for the Department of Energy, Richland Office: https://pdw.hanford.gov/arpir/index.cfm/viewDoc?accession=0091457
Department of Energy, Richland Office, 2009. Subsurface Conditions Description of the U Waste Management Area (RPP-15808). Report prepared by CH2M Hill Plateau Remediation Company for the Department of Energy, Richland Office: https://pdw.hanford.gov/arpir/index.cfm/viewDoc?accession=0911240299
Department of Energy, Richland Office, 2012. Hanford Site Groundwater Monitoring Report for 2011 (DOE/RL-2011-118). Report prepared by CH2M Hill Plateau Remediation Company for the Department of Energy, Richland Office: https://pdw.hanford.gov/arpir/index.cfm/viewDoc?accession=0091795
Department of Energy, Richland Office, 2013. Hanford Site Groundwater Monitoring for 2012: Supporting Information (SGW-55438). Report prepared by CH2M Hill Plateau Remediation Company for the Department of Energy, Richland Office: https://pdw.hanford.gov/arpir/index.cfm/viewDoc?accession=0087999
Department of Energy, Richland Office, 2016. Hanford Site Groundwater Monitoring Report for 2015 (DOE/RL-2016-09). Report prepared by CH2M Hill Plateau Remediation Company for the Department of Energy, Richland Office: https://pdw.hanford.gov/arpir/index.cfm/viewDoc?accession=0075314H
Department of Energy, Richland Office, 2017. Hanford Site Groundwater Monitoring Report for 2016 (DOE/RL-2016-67). Report prepared by CH2M Hill Plateau Remediation Company for the

48
Department of Energy, Richland Office: https://pdw.hanford.gov/arpir/index.cfm/viewDoc?accession=0068229H
Department of Energy, Richland Office, 2017. Waste Tank Summary Report for Month Ending May 31, 2017 (HNF-EP-0182, Rev. 353). Report prepared by Washington River Protection Solutions for the Department of Energy, Richland Office: https://pdw.hanford.gov/arpir/index.cfm/viewDoc?accession=0069268H
Hammond, T.B., 2016. Development of the Hanford South Geologic Framework Model Hanford Site (ECF-Hanford-13-0029, Rev. 4). Report prepared by Intera Inc. for the Department of Energy, Richland Office: https://pdw.hanford.gov/arpir/index.cfm/viewDoc?accession=0072357H
Hodges, F.N. and Chou, C.J., 2003. Groundwater Quality Assessment for Waste Management Area U: First Determination (PNNL-13282). Report prepared by Pacific Northwest National Laboratory for the Department of Energy, Richland Office: https://pdw.hanford.gov/arpir/index.cfm/viewDoc?accession=D2760779
Kinney, T. M., and McDonald, J. P., 2006. Development of Historical Water Table Maps of the 200 West Area of the Hanford Site (1950-1970) (PNNL-16069). Report prepared by Pacific Northwest National Laboratory for the Department of Energy, Richland Office: https://www.pnnl.gov/main/publications/external/technical_reports/PNNL-16069.pdf
Lindsey, K.A., 1995. Miocene- to Pliocene-Aged Suprabasalt Sediments of the Hanford Site, South-Central Washington. BHI-00184, Bechtel Hanford, Inc., Richland, Washington
Smith, R.M., et al., 2001. Groundwater Quality Assessment Plan for Single-Shell Tank Waste Management Area U (PNNL-13612). Report prepared by Pacific Northwest National Laboratory for the Department of Energy, Richland Office: https://pdw.hanford.gov/arpir/index.cfm/viewDoc?accession=D2760703
Sulloway, H., Carter, R. M., and Ni, J. 2018. Engineering Evaluation Report for Single-Shell Tank Waste Management Area U Groundwater Monitoring. Report prepared by CH2MHill Plateau Remediation Company for the Department of Energy, Richland Office, 219 pp. https://pdw.hanford.gov/arpir/index.cfm/viewDoc?accession=0064667H
Williams, B.A., et al., 2002. Revised Hydrogeology for the Suprabasalt Aquifer System, 200 West Area and Vicinity, Hanford Site, Washington (PNNL-13858). Report prepared by Pacific Northwest National Laboratory for the Department of Energy, Richland Office: https://www.pnnl.gov/main/publications/external/technical_reports/PNNL-13858.pdf
Zachara, J. M., Serne, J., Freshley, M., Mann, F., Anderson, F., Wood, M., Jones, T, and Myers, D. 2007. Geochemical Processes Controlling Migration of Tank Wastes in Hanford's Vadose Zone. Vadose Zone J. 6:985-1003. doi:10.2136/vzj2006.0180

49
Chapter 3: Hydrogeologic Factors of a Chromium Plume at Hanford, Washington

50
3.1 INTRODUCTION
This chapter consists of a section of a larger report written by CHPRC, specifically by the S&GRP
(Rohay and Carter, 2018). The chapter presented here is verbatim with minor edits for clarity
and reviews the approach of the southeast chromium plume remedial design investigation and
the sampling and analysis plan (SAP) requirements. Historically, the extent of the southeast
chromium plume was not sufficiently defined to support remedy implementation, particularly
on the south side of the plume. Characterization activities to refine the vertical and horizontal
extent of the plume to focus and optimize the remedial design were required by the 200-UP-1
OU Remedial Design/ Remedial Action Work Plan (RD/RAWP) (DOE/RL-2013-07). In accordance
with the RD/RAWP, the data quality objective process was used to define the final number,
location, and type of wells, as well as the measurement frequency. Consideration was given to
sampling groundwater over the entire thickness of the aquifer to understand the vertical
distribution of concentrations and to select the appropriate screen interval(s). The flexibility of
completing the wells for dual-use (i.e., monitoring wells and extraction or injection wells) was
also considered. The results of the DQO process were documented in the 200-UP-1 OU SAP
(DOE/RL-2014-27, Rev. 2, Sampling and Analysis Plan for Remediation Wells in the 200-UP-1
Operable Unit).
3.1 SAMPLING AND ANALYSIS PLAN REQUIREMENTS
The SAP for drilling of the southeast chromium plume wells defined sampling and analytical
requirements for the remedial design investigation (DOE/RL-2014-27, Rev. 2). Characterization
data needed for the investigation included the vertical profile and lateral extent of chromium
contamination in groundwater, aquifer particle size distribution over the well screen interval,
and information to evaluate the fate and transport of contaminants. The number and location
of samples, sampling procedures, and analyses were specified in the field sampling plan
(DOE/RL-2014-27, Rev. 2).
Initially, six characterization wells were planned to further define the nature and extent of the
southeast chromium plume to support remedial design. These six wells were located based on
the extent of the 2015 plume, shown on Figure 15, which was the latest interpretation at the

51
start of the drilling program. Chromium concentrations at the two northern wells (699-31-68
and 699-32-64) were consistent with the 2015 plume, but the relatively high concentrations in
the three southern wells (699-29-66, 699-30-63, and 699-30-57) indicated that the plume above
the 48 µg/L cleanup level extended farther south. The U. S. Department of Energy, Richland,
Washington Operations Office (DOE-RL) and the U.S. EPA representatives met on January 19,
2017 to review the findings from the first six wells and agreed to install and sample four
additional characterization wells in 2017. These four wells were located to investigate the
eastern (699-31-50), southeastern (699-29-55), southwestern (699-27-68) and western (699-30-
70) extent of the plume. DOE-RL and EPA also agreed to collect four quarters of groundwater
samples from each of the initial six wells to evaluate the groundwater monitoring data for
temporary reducing conditions affecting chromium concentrations. Results of the four quarters
of monitoring were submitted to DOE-RL in April 2018.
In well 699-30-70, chromium concentrations during drilling were relatively high (average of 91
µg/L), indicating that the plume extended farther to the west. DOE-RL and EPA met on July 20,
2017 and agreed to drill an eleventh well (699-30-73) to define the western extent of the plume
closest to the 216-S-10 complex source. Concurrence was reached that 11 wells would be
sufficient to define the nature and extent of the southeast chromium plume for remedial
implementation, support completion of the Draft A remedial design investigation report, and
satisfy the remedial design investigation requirement of Tri-Party Agreement (TPA) milestone
M-16-193 for the southeast chromium plume.
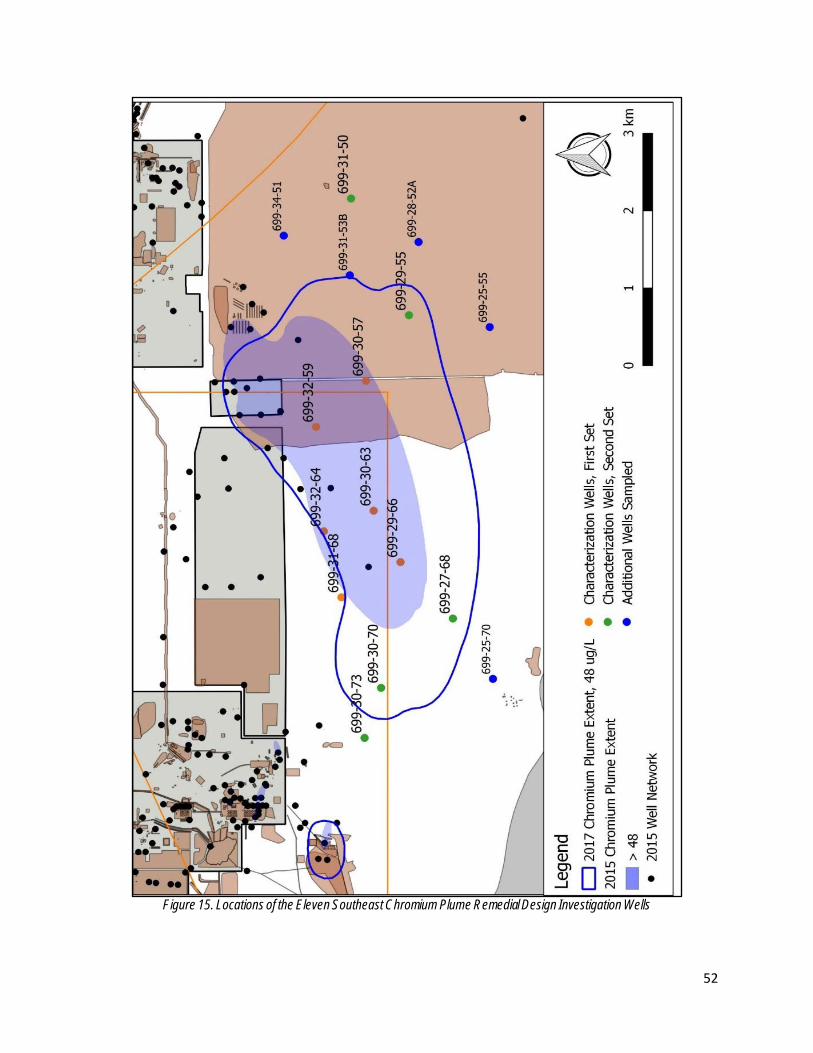
52
Figure 15. Locations of the Eleven Southeast Chromium Plume Remedial Design Investigation Wells

53
Table 1 summarizes the samples collected during drilling of the 11 southeast chromium
characterization wells and compares the planned depths (from Table 3-1 in the SAP; DOE/RL-
2014-27, Rev. 2) to the actual depths.
3.2 CONTAMINANTS OF CONCERN
Chromium, measured as total chromium and hexavalent chromium, was the target
contaminant of concern (COCs) for this remedial design investigation. Groundwater samples
were also analyzed for tritium to determine whether the southeast chromium plume was
commingled with the nearby tritium plume. Samples were analyzed for manganese, dissolved
oxygen, and oxidation reduction potential as indicators of reducing conditions. Analytes for
sampling are identified in Table 3-1 of DOE/RL-2014-27, Rev. 2.
Table 1. 200-UP-1 Operable Unit Southeast Chromium Plume Depth Discrete Samples
Well Name (ID)/Type
Sample Matrix
Planned Sample Depth Actual Sample Depth
Below Water Table (ft)
Borehole Depth (ft)
Below Water Table (ft)
Borehole Depth (ft)
699-27-68 (C9632)/ Monitoring
Water (depth discrete)
10 231 18.3 235.2 30 251 37.6 254.6 50 271 57.2 274.1 70 291 79 296 90 311 98.1 315
110 331 118.1 335 Saturated Soil (split spoon)
10 231 17.9-20.2 234.9-237.2 50 271 58.0-58.5 275.0-275.5
90 311 98.5-99.0 315.5-316.5
699-29-55 (C9634)/ Monitoring
Water (depth discrete)
10 299 14.5 300.9 30 319 34.5 320.9 50 339 64.4 350.8 70 359 84.5 370.9 90 379 104.5 390.9 ― 124.5a 410.9
Saturated Soil (split spoon)
10 299 9.5-10.0 295.5-296.0 50 339 54.8-57.3 340.8-343.3
90 379 104.9-106.9 390.9-392.9
699-29-66 (C9413)/ Monitoring
Water (depth discrete)
20 264 23.7 274 90 334 83.2 334.2
160 404 152 403 ― 240.9a 491.1
Saturated Soil
20 264 24.6-27.1 274.1-276.6 90 334 84.4-86.4 333.9-335.9

54
(split spoon) 160 404 245.8-247.8 495.3-497.3
699-30-57 (C9417)/ Monitoring
Water (depth discrete)
20 307 31.9 317.2 85 372 84.7 370.1
150b 437 ― Saturated Soil (split spoon)
20 307 17.6-20.1 306.5-309.0 85 372 83.5-86.0 372.4-374.9
150b 437 ―
699-30-63 (C9602)/ Dual-Use
Water (depth discrete)
20 287 23.3 295.5 40 307 43.6 315.9 65 332 63.3 335.6 90 357 83.4 355.7
110 377 103.2 375.5 ― 123.1a 395.4
Saturated Soil (split spoon)
20 287 17.6-20.1 293.1-295.6 65 332 60.6-62.9 336.1-338.4
110 377 98.8-101.8 374.3-377.3
699-30-70 (C9635)/ Monitoring
Water (depth discrete)
10 226 15.1 235.5 30 246 35 255.4 50 266 55.1 275.4 70 286 75.1 295.4 90 306 94.9 315.2
110 326 114.9 335.2 130 346 134.1 354.4 150 366 154.1 374.4
Saturated Soil (split spoon)
10 226 16.1-18.5 236.1-238.1 70 286 75.7-78.1 395.7-298.1
130 346 134.1-135.5 354.1-355.5
699-30-73 (C9636)/ Monitoring
Water (depth discrete)
10 230 10.7 240.3 30 250 30.6 260.3 50 270 50.3 280 70 290 70.6 300.3 90 310 90.3 320
110 330 110.6 340.2 130 350 130.4 360 150 370 150.5 380.2 170b 390 ―
Saturated Soil (split spoon)
10 230 10.9-11.4 240.9-241.4 70 290 71.3-71.8 301.3-301.8
130 350 130.2-130.7 360.2-360.7
699-31-50 (C9737)/ Monitoring
Water (depth discrete)
10 317 16.7 325 30 337 35.2 345.1 50 357 56.4 366.2 70 377 75.2 384.8 90 397 96.2 406
110 417 115.7 425.5 ― 135.2a 444.9
Saturated Soil (split spoon)
10 317 16.0-17.5 325.0-326.5 50 357 54.7-57.2 363.7-366.2 90 397 95.0-97.0 404.0-406.0 ― 115.0-116.5a 424.0-425.5

55
699-31-68 (C9416)/ Monitoring
Water (depth discrete)
20 283 40.3 304.5 80 242 80.2 344.3
140 403 150.4 414.5 Saturated Soil (split spoon)
20 283 37.8-39.8 304.5-306.5 80 242 77.6-79.6 344.3-346.3
140 403 147.8-149.8 414.5-416.5
699-32-59 (C9603)/ Dual-Use
Water (depth discrete)
20 326 31 336.5 35 341 50.3 355.8 55 361 71.2 376.8 75 381 80.9 386.5 90b 396 ―
Saturated Soil (split spoon)
20 326 26.6-29.1 335.5-338.0 55 361 49.7-51.7 358.6-360.6
90 396 79.2-81.7 385.2-387.7
699-32-64 (C9601)/ Dual-Use
Water (depth discrete)
20 296 33.9 316 40 316 43.9 326 60 336 62.7 344.7 80 356 83.9 366
100 376 104.1 386.1 Saturated Soil (split spoon)
20 296 22.8-25.7 307.7-310.6 60 336 60.9-63.7 345.8-348.6
100 376 99.5-101.7 384.4-386.6
a. Drill depth to the Ringold Lower Mud greater than estimated, additional sample required.
b. Drill depth to the Ringold Lower Mud less than estimated, final estimated sample depth not reached.
bgs = below ground surface
ID = identification
3.3 CHARACTERIZATION WELLS
The 11 southeast chromium plume wells were drilled between March 2016 and October 2017.
The wells were drilled using air rotary technology to maintain oxygenated conditions, thus
alleviating the reducing effects in the subsurface in accordance with the descriptions of work
for drilling:
● SGW-59416, Description of Work for the Installation of Three Monitoring Wells in the
200-UP-1 Groundwater Operable Unit, FY16
● SGW-60084, Description of Work for the Installation of Three Multipurpose Wells in the
200-UP-1 Groundwater Operable Unit, FY2017
● SGW-60568, Description of Work for the Installation of Four Monitoring Wells Near the
Southeastern Portion of the 200-UP-1 Operable Unit, FY 2017
56
Three of the original 6 wells were planned and constructed as dual-use wells (699-32-59, 699-
30-63, and 699-32-64) and will initially be used for groundwater monitoring but could later be
used for groundwater extraction or injection. The other 8 wells were planned and constructed
as groundwater monitoring wells. Depth-discrete samples of saturated sediment and
groundwater were collected in accordance with the SAP.
3.4 GROUNDWATER SAMPLES
Depth-discrete groundwater samples were collected during drilling of the 11 characterization
wells to determine the vertical profile of chromium contamination. Groundwater samples were
also collected following well development and during subsequent quarterly monitoring. Nearby
existing groundwater wells were sampled to supplement the data from the new wells.
Groundwater samples were analyzed for total chromium and hexavalent chromium. Filtered
total chromium concentrations are considered equivalent to hexavalent chromium
concentrations, although there can be differences caused by normal analytical variability or
sample turbidity. Filtered total and hexavalent chromium concentrations can be affected by
temporary reducing conditions caused by the drilling process. Temporary chemically-reducing
conditions have been documented when drilling at Hanford. The conditions are generally
caused by the drilling activity breaking pieces of basalt, or other iron-bearing rock species, and
exposing reduced iron in the fractured surfaces. The exposed reduced iron in rock surfaces can
be readily oxidized by dissolved oxygen in the groundwater; this can temporarily reduce, or
deplete, the oxygen content in the water, resulting in a temporary reducing condition. These
reducing conditions can temporarily affect the oxidation state of other elements, including
chromium and manganese. The reducing conditions can cause hexavalent chromium to reduce
to trivalent chromium, which is less soluble and can cause concentrations observed during
drilling to be artificially low. It can take up to a year after a well is drilled before the aquifer fully
recovers and representative samples can be collected (DOE/RL-2011-118, Hanford Site
Groundwater Monitoring Report for 2011), depending on the drilling method and the nature of
the geological material encountered. Samples for manganese were collected because
manganese is sensitive to reduction-oxidation conditions and was used as an indicator that

57
samples are representative of the oxidizing conditions normal to the Hanford aquifer (Section
E.5.2, Appendix E of DOE/RL-2011-118).
3.5 VERTICAL PROFILE SAMPLING
Depth-discrete groundwater samples were generally collected from the upper, middle, and
lower part of the aquifer for the first 3 wells drilled (699-29-66, 699-30-57, and 699-31-68), and
every 6.1 m (20 ft) below the water table for the remaining 8 wells, to determine the vertical
profile of chromium contamination in the unconfined aquifer. The first sample was typically
collected 1.5 to 3.1 m (5 to 10 ft) below the targeted depth for the first water sample (Table 1)
so that the well would produce enough water for sampling. All depth-discrete sample results
are discussed in another section of the original report (DOE/RL-2017-60, Remedial Design
Investigation Report for the 200-UP-1 Operable Unit Southeast Chromium Plume).
The samples were collected using a 3/4-horsepower temporary submersible pump. When
possible, the boreholes were purged until dissolved oxygen stabilized at or above 7,000 μg/L
and oxidation-reduction potential was at least 200 mV (DOE/RL-2014-27, Rev. 2).
The sample depths for each well are listed in Table 1. An additional water sample was collected
at wells 699-29-55, 699-29-66, 699-30-63, and 699-31-50 because the depth to the Ringold
lower mud was greater than estimated. One less water sample was collected at wells 699-30-
57, 699-30-73, and 699-32-59 because the depth of the Ringold lower mud was less than
estimated.
3.6 GROUNDWATER DATA
Routine quarterly sampling of the first 6 new wells were used to evaluate temporal variability of
filtered total chromium and hexavalent chromium. Quarterly samples are being collected from
the last 5 new wells, but a year has not elapsed since drilling to allow the aquifer to recover
from potential reducing effects of drilling. Groundwater results are discussed in another section
of the original report (DOE/RL-2017-60).

58
Groundwater Data from Existing Wells
Routine annual sampling of existing groundwater monitoring wells for total chromium and
hexavalent chromium was conducted in 2017 based on the higher than anticipated chromium
sample results in four of the initial six wells.
In addition, a Tri-Party Agreement Change Notice, TPA-CN-0802, identified five older wells near
the south and east perimeter of the southeast chromium plume for inclusion in the monitoring
well network.
3.7 SAMPLING DURING WELL DEVELOPMENT
Final well development for each of the eleven new southeast chromium plume wells was
conducted at the completion of well development activities. Details regarding well
development are available in the three borehole summary reports (Table 2-2 in SGW-60463,
Borehole Summary Report for the Installation of Three Monitoring Wells in the 200-UP-1
Groundwater Operable Unit, Fiscal Year 2016; Table 2 in SGW-60727, Borehole Summary Report
for Installation of Three Multipurpose Wells in the 200-UP-1 Groundwater Operable Unit, FY
2017). Well development was performed at one or more intervals. Each interval was pumped
until water was less than five nephelometric turbidity units (NTU) and additional water quality
parameters (conductivity, dissolved oxygen, pH, and temperature) had stabilized. Groundwater
samples were collected following completion of well development. Results from the
groundwater monitoring are discussed in another section of the original report (DOE/RL-2017-
60).
No pumping tests or pumping test sampling were conducted during the installation of the
eleven southeast chromium plume wells.
Soil Samples
Saturated soil and groundwater samples were collected and sent to Pacific Northwest National
Laboratory (PNNL) for research to support the Deep Vadose Zone Applied Field Research
Initiative scientific investigations of controlling processes for contaminant behavior (DOE/RL-
2014-27, Rev. 2). Three split-spoon soil samples were collected within the unconfined aquifer at
59
10 of the new wells and two samples were collected at well 699-30-57. Three to eight depth-
discrete groundwater samples were collected at 10 of the new wells, no samples were collected
from well 699-30-73 (Table 1).
The saturated soil samples were collected for PNNL using split-spoon samplers at the borehole
to characterize the geochemistry of the sediment and associated pore water. Split-spoon
samples were collected at the upper, middle, and lower portions of the unconfined aquifer,
starting between 3 to 6.1 m (10 to 20 ft) below the water table. The 10.2-cm (4-in.) diameter
sampler contained four 15.2-cm (6-in.) long liners. These liners were wrapped in plastic to
preserve water content and transported to PNNL.
Chromium transport may be impacted by interaction with calcite or reductive processes. A
single split-spoon sample from one well, 699-30-63, downgradient of the chromium source was
selected for assessment of the presence and extent of these processes. The sample was
analyzed using analytical methods (e.g., water, acid, and sequential extractions). Additional
analyses were not performed because the initial laboratory results indicated that natural
attenuation processes other than dispersion were not occurring (i.e., chromium was not found
to be present in multiple phases at concentrations high enough to enable effective
measurement of leaching characteristics) (DOE/RL-2014-27, Rev. 2). The results of the
assessment are summarized in another section of the original report (DOE/RL-2017-60).
3.8 REFERENCES
Department of Energy, Richland Office, 2012. Hanford Site Groundwater Monitoring Report for 2011 (DOE/RL-2011-118). Report prepared by CH2M Hill Plateau Remediation Company for the Department of Energy, Richland Office: https://pdw.hanford.gov/arpir/index.cfm/viewDoc?accession=0091795
Department of Energy, Richland Office, 2013. 200-UP-1 Operable Unit Remedial Design/Remedial Action Work Plan (DOE/RL-2013-07). Report prepared by CH2M Hill Plateau Remediation Company for the Department of Energy, Richland Office: https://pdw.hanford.gov/arpir/index.cfm/viewDoc?accession=0087671

60
Department of Energy, Richland Office, 2017. Borehole Summary Report for the Installation of Three Monitoring Wells in the 200-UP-1 Groundwater Operable Unit, Fiscal Year 2016 (SGW-60463). Report prepared by CH2M Hill Plateau Remediation Company for the Department of Energy, Richland Office: https://pdw.hanford.gov/arpir/index.cfm/viewDoc?accession=0065665H
Department of Energy, Richland Office, 2017. Borehole Summary Report for Installation of Three Multipurpose Wells in the 200-UP-1 Groundwater Operable Unit, FY 2017 (SGW-60727). Report prepared by CH2M Hill Plateau Remediation Company for the Department of Energy, Richland Office: https://pdw.hanford.gov/arpir/index.cfm/viewDoc?accession=0065663H
Department of Energy, Richland Office, 2017. Sampling and Analysis Plan for Remediation Wells in the 200-UP-1 Operable Unit (DOE/RL-2014-27, Rev. 2). Report prepared by CH2M Hill Plateau Remediation Company for the Department of Energy, Richland Office: https://pdw.hanford.gov/arpir/index.cfm/viewDoc?accession=0071352H
Department of Energy, Richland Office, 2018. Remedial Design Investigation Report for the 200-UP-1 Operable Unit Southeast Chromium Plume (DOE/RL-2017-60). Report prepared by CH2M Hill Plateau Remediation Company for the Department of Energy, Richland Office: https://pdw.hanford.gov/arpir/index.cfm/viewDoc?accession=0064659H
Rohay, V. and Carter, R. M. 2018. Remedial Design Investigation Report for the 200-UP-1 Operable Unit Southeast Chromium Plume, Draft A. Report prepared by CH2M Hill Plateau Remediation Company for the Department of Energy, Richland Office. 157 pp. https://pdw.hanford.gov/arpir/index.cfm/viewDoc?accession=0064659H

61
Chapter 4: Epilogue – Lessons Learned and Future Plans

62
This portfolio paper showcases my efforts on environmental remediation and how people can
respond to environmental issues such as hazardous waste disposal. This paper also shows the
development of an environmental scientist/hydrogeologist and can also be used as a template
for any environmental professional dealing with most community remediation sites. The
portfolio includes research of the study areas, site reconnaissance, historical data research,
interviews with owners and professionals, analytical analysis, quality assurance and quality
control, and groundwater data interpretation.
The collection and interpretation of the data will hopefully provide a baseline to assist
communities with concerns about potential impacts to the quality of their groundwater.
Environmental site assessments and waste site remediation are continual concerns for the U.S.
Environmental Protection Agency. As ongoing research further clarifies connections between a
healthy environment and chronic health conditions, local site assessments and waste clean-up
will become even more critical. The site assessment at St. Ignatius was a springboard for me as
it peaked my interest and involvement of environmental concerns in waste disposal and site
remediation. This project was my first experience utilizing regulatory framework to assess the
impact or potential impact to the environment. Throughout this journey, I learned many
lessons from mentors I worked with, as well as gained deeper insight into what environmental
assessments means and how to facilitate its process.
Hanford groundwater contamination is a continual concern for the Tri-Cities, Washington
region. As the next contract to clean up the Hanford site is coming due, continued research for
clean drinking water is necessary. My plans are to continue to learn and grow within the scope
of this clean-up effort. I plan on being a part of groundwater remediation projects and ongoing
research for the foreseeable future and the rest of my career. Using my education as a
backdrop, the position I currently fill has allowed me to advance my understanding of
hydrogeology, geology, chemistry, scientific writing, and regulatory requirements.
Looking back at the site reconnaissance and data research for the St. Ignatius project, time
management and thoroughness of the regulatory guidelines were the two most obvious
obstacles. The work at Hanford is ongoing and will continue to be a source of learning. Knowing
63
and better understanding the chemical processes which are used during plutonium production
is important since it helps determine the chemical constituents that have made their way to
groundwater. This will take some time and a concerted effort on my part, as such, working with
mentors and continually being immersed with site projects will give a framework for continual
education. Learning the federal and state regulations is an important criteria for success, which
will be a continual process. Waste site remediation is a critical step in returning the
environment to its natural state and to provide clean drinking water for future generations.