Entropy Production Analysis for Hump Characteristics of a ...
10
CHINESE JOURNAL OF MECHANICAL ENGINEERING Vol. 29,aNo. 4,a2016 ·803· DOI: 10.3901/CJME.2016.0414.052, available online at www.springerlink.com; www.cjmenet.com Entropy Production Analysis for Hump Characteristics of a Pump Turbine Model LI Deyou 1 , GONG Ruzhi 1 , WANG Hongjie 1, * , XIANG Gaoming 1 , WEI Xianzhu 1, 2 , and QIN Daqing 1, 2 1 School of Energy Science and Engineering, Harbin Institute of Technology, Harbin 150001, China 2 State Key Laboratory of Hydro-Power Equipment, Harbin Institute of Large Electrical Machinery, Harbin 150040, China Received December 17, 2015; revised March 10, 2016; accepted April 14, 2016 Abstract: The hump characteristic is one of the main problems for the stable operation of pump turbines in pump mode. However, traditional methods cannot reflect directly the energy dissipation in the hump region. In this paper, 3D simulations are carried out using the SST k-ω turbulence model in pump mode under different guide vane openings. The numerical results agree with the experimental data. The entropy production theory is introduced to determine the flow losses in the whole passage, based on the numerical simulation. The variation of entropy production under different guide vane openings is presented. The results show that entropy production appears to be a wave, with peaks under different guide vane openings, which correspond to wave troughs in the external characteristic curves. Entropy production mainly happens in the runner, guide vanes and stay vanes for a pump turbine in pump mode. Finally, entropy production rate distribution in the runner, guide vanes and stay vanes is analyzed for four points under the 18 mm guide vane opening in the hump region. The analysis indicates that the losses of the runner and guide vanes lead to hump characteristics. In addition, the losses mainly occur in the runner inlet near the band and on the suction surface of the blades. In the guide vanes and stay vanes, the losses come from pressure surface of the guide vanes and the wake effects of the vanes. A new insight-entropy production analysis is carried out in this paper in order to find the causes of hump characteristics in a pump turbine, and it could provide some basic theoretical guidance for the loss analysis of hydraulic machinery. Keywords: fluid machinery, pump turbine, entropy production, hump characteristics, loss 1 Introduction Hydropower is a form of renewable clean energy, and is an important component part of China's energy structure. In this regard, hydropower policies and renewable energy investments recently gain impetus, especially for Pumped Storage Power Plants [1–2] . A pump turbine is the key part of a Pumped Storage Power Plant. Investigation into the stability of pump turbines is to ensure the effective and stable operation of the whole unit. Hump characteristics are a main feature of unstable behavior in pump turbines, which happen in pump mode under small discharge operation conditions [3] . They could cause large pressure fluctuations and generate strong noise. Hence, the studies on hump characteristics have become more and more important for the operation of pump turbines. With respect to the investigation of hump characteristics, a great mount of research has been carried out. LIU, et al [4] , predicted a better hump characteristic curve based on an improved cavitation model. YANG, et al [5] , conducted * Corresponding author. E-mail: [email protected] Supported by National Key Technology R&G Program (Grant No. 2012BAF03B01-X), and Innovative Research Groups of National Natural Science Foundation of China (Grant No. 51121004) © Chinese Mechanical Engineering Society and Springer-Verlag Berlin Heidelberg 2016 experimental characterization of the hump instability region in a two stages reversible pump turbine. LI, et al [6] , tried to correlate hump characteristics with vortex motion in tandem cascade. BRAUN, et al [7] , analyzed flow phenomenon related to unstable energy-discharge characteristic of a pump turbine in pump mode using a numerical method. YIN, et al [8] , investigated possible different flow patterns existing in pump turbine under off-design conditions in pump mode, using the SST k-ω turbulence model. He concluded that the special head flow profile can be ascribed to the special hydraulic loss characteristics of the stay vanes and guide vanes. RAN, et al [9] , carried out an experimental study of the pressure fluctuations in positive slope region. The pressure fluctuation characteristics in large partial flow conditions were presented. All of the above focused on the predicting the hump characteristic curve and analyzing flow characteristics. However, deep mechanisms such as loss generation and loss distribution have been not clear. Energy dissipation always happens in the internal flow of a pump turbine, which is irreversible and will lead to entropy. Traditional methods could not reflect the position where the energy dissipation occurs, and how it is distributed. From a thermodynamics view, energy dissipation converts the available energy to unavailable
Transcript of Entropy Production Analysis for Hump Characteristics of a ...

CHINESE JOURNAL OF MECHANICAL ENGINEERING Vol. 29,aNo. 4,a2016
·803·
DOI: 10.3901/CJME.2016.0414.052, available online at www.springerlink.com; www.cjmenet.com
Entropy Production Analysis for Hump Characteristics of a Pump Turbine Model
LI Deyou1, GONG Ruzhi1, WANG Hongjie1, *, XIANG Gaoming1, WEI Xianzhu1, 2, and QIN Daqing1, 2
1 School of Energy Science and Engineering, Harbin Institute of Technology, Harbin 150001, China 2 State Key Laboratory of Hydro-Power Equipment, Harbin Institute of Large Electrical Machinery,
Harbin 150040, China
Received December 17, 2015; revised March 10, 2016; accepted April 14, 2016
Abstract: The hump characteristic is one of the main problems for the stable operation of pump turbines in pump mode. However,
traditional methods cannot reflect directly the energy dissipation in the hump region. In this paper, 3D simulations are carried out using
the SST k-ω turbulence model in pump mode under different guide vane openings. The numerical results agree with the experimental
data. The entropy production theory is introduced to determine the flow losses in the whole passage, based on the numerical simulation.
The variation of entropy production under different guide vane openings is presented. The results show that entropy production appears
to be a wave, with peaks under different guide vane openings, which correspond to wave troughs in the external characteristic curves.
Entropy production mainly happens in the runner, guide vanes and stay vanes for a pump turbine in pump mode. Finally, entropy
production rate distribution in the runner, guide vanes and stay vanes is analyzed for four points under the 18 mm guide vane opening in
the hump region. The analysis indicates that the losses of the runner and guide vanes lead to hump characteristics. In addition, the losses
mainly occur in the runner inlet near the band and on the suction surface of the blades. In the guide vanes and stay vanes, the losses
come from pressure surface of the guide vanes and the wake effects of the vanes. A new insight-entropy production analysis is carried
out in this paper in order to find the causes of hump characteristics in a pump turbine, and it could provide some basic theoretical
guidance for the loss analysis of hydraulic machinery.
Keywords: fluid machinery, pump turbine, entropy production, hump characteristics, loss
1 Introduction
Hydropower is a form of renewable clean energy, and is an important component part of China's energy structure. In this regard, hydropower policies and renewable energy investments recently gain impetus, especially for Pumped Storage Power Plants[1–2]. A pump turbine is the key part of a Pumped Storage Power Plant. Investigation into the stability of pump turbines is to ensure the effective and stable operation of the whole unit. Hump characteristics are a main feature of unstable behavior in pump turbines, which happen in pump mode under small discharge operation conditions[3]. They could cause large pressure fluctuations and generate strong noise. Hence, the studies on hump characteristics have become more and more important for the operation of pump turbines.
With respect to the investigation of hump characteristics, a great mount of research has been carried out. LIU, et al[4], predicted a better hump characteristic curve based on an improved cavitation model. YANG, et al[5], conducted
* Corresponding author. E-mail: [email protected] Supported by National Key Technology R&G Program (Grant No.
2012BAF03B01-X), and Innovative Research Groups of National Natural Science Foundation of China (Grant No. 51121004) © Chinese Mechanical Engineering Society and Springer-Verlag Berlin Heidelberg 2016
experimental characterization of the hump instability region in a two stages reversible pump turbine. LI, et al[6], tried to correlate hump characteristics with vortex motion in tandem cascade. BRAUN, et al[7], analyzed flow phenomenon related to unstable energy-discharge characteristic of a pump turbine in pump mode using a numerical method. YIN, et al[8], investigated possible different flow patterns existing in pump turbine under off-design conditions in pump mode, using the SST k-ω turbulence model. He concluded that the special head flow profile can be ascribed to the special hydraulic loss characteristics of the stay vanes and guide vanes. RAN, et al[9], carried out an experimental study of the pressure fluctuations in positive slope region. The pressure fluctuation characteristics in large partial flow conditions were presented. All of the above focused on the predicting the hump characteristic curve and analyzing flow characteristics. However, deep mechanisms such as loss generation and loss distribution have been not clear.
Energy dissipation always happens in the internal flow of a pump turbine, which is irreversible and will lead to entropy. Traditional methods could not reflect the position where the energy dissipation occurs, and how it is distributed. From a thermodynamics view, energy dissipation converts the available energy to unavailable

Y LI Deyou, et al: Entropy Production Analysis for Hump Characteristics of a Pump Turbine Model
·804·
energy along with entropy production. A great deal of research has been carried out about entropy production. HERWIG, et al[10], pointed out that the local dissipation rate in the flow can be determined with entropy production, which was validated with experimental data for laminar and turbulent flows. ZHANG, et al[11], conducted entropy production is a direct measure of the flow losses. For many areas, entropy serves as a key parameter in achieving the upper limits of operation performance[12]. The flow entropy rate could be obtained based on the computational parameters gotten from commercial CFD software. The pressure drop can be expressed with entropy and temperature, so we could get the detailed flow losses for every position.
Recently, many researchers have applied this theory to calculate energy dissipations of flow. For example, GHASEMI, et al[13], predicted the integral entropy production rate and the skin friction coefficient in the transition region. Recent literature on the topic of entropy production in wall-bounded flow have been reviewed by NATERER, et al[12] and others (MCELIGOT, et al[14–16]). GLOSS, et al[17] concluded that an increased dissipation rate in the vicinity of the roughness elements is a physical mechanism that leads to an increased total head loss when the walls are no longer smooth in laminar flows. However, relatively few researchers have applied the entropy theory in hydro-power machines. GONG, et al[18], have successfully applied entropy to analyzing hydraulic loss. They concluded that the method of entropy production analysis had advantages in determining the energy dissipation and its exact location. The further studies should be continued based on above achievements.
In this paper, entropy production was used to analyze the causes of hump characteristics in pump turbine in pump mode, the external characteristic curves under 18 mm, 22 mm and 32 mm guide vane openings are simulated through numerical simulations based on the experimental validation. Numerical results show a good agreement with the experimental data. The variation of entropy production for different components at different operating conditions under different guide vane openings was obtained. Finally, four operation condition points in the hump region, under the 18mm guide vane opening, are chosen to analyze the loss distribution and find the causes of hump characteristics based on the entropy theory.
2 Entropy Production Theory
With respect to the fluid machinery flows, mechanical
energy is converted into internal energy mainly for the following two reasons, the viscous stress within the boundary layer and the turbulent fluctuation stress in high Reynolds-number regions, without regard to the heat transfer. Therefore, the entropy production can be used to evaluate the dissipation of mechanical energy from the view of thermodynamic point.
The specific entropy production rate can be defined as[19]
,DQ
ST
¢¢¢= (1)
where Q represents the energy transfer rate.
For turbulent flows with a RANS approach, DS ¢¢¢ is a time-averaged term with two parts: one caused by time-averaged movement, and another is a result of velocity fluctuations corresponding to the turbulent dissipation terms. Then, DS ¢¢¢ can be expressed as [20]:
,D DDS S S
¢¢¢¢ ¢¢¢ ¢¢¢= + (2)
where
DS ¢¢¢ and DS ¢¢¢ indicate the specific entropy
production rate due to the time-averaged movement and the one caused by velocity fluctuations, which can be calculated as follows:
22 2
eff 31 2
1 2 3
2 22
eff 3 32 1 1 2
1 2 1 3 3 2
2
,
D
uu uS
T x x x
u uu u u u
T x x x x x x
ùé æ öæ ö æ ö ¶¶ ¶ úê ÷÷ ÷ çç 碢¢ ÷÷ ÷= + + +çç ç úê ÷÷ ÷ çç ç ÷÷ ÷ç ç ç¶ ¶ ¶è ø è ø è ø úêë û
é ùæ ö æ öæ ö ¶ ¶¶ ¶ ¶ ¶ê ú÷ ÷÷ ç çç ÷ ÷÷+ + + + +ç ççê ú÷ ÷÷ ç çç ÷ ÷÷ç ç ç¶ ¶ ¶ ¶ ¶ ¶è ø è ø è øê úë û (3)
22 2
31 2
1 2 3
2 22
3 32 1 1 2
1 2 1 3 3 2
2
,
effD
eff
uu uS
T x x x
u uu u u u
T x x x x x x
¢
ùé æ öæ ö æ ö ¢¢ ¢ ¶¶ ¶ úê ÷÷ ÷ çç 碢¢ ÷÷ ÷= + + +çç ç úê ÷÷ ÷ çç ç ÷÷ ÷ç ç ç¶ ¶ ¶è ø è ø è ø úêë ûé ùæ ö æ öæ ö ¢ ¢¢ ¢ ¢ ¢¶ ¶¶ ¶ ¶ ¶ê ú÷ ÷÷ ç çç ÷ ÷÷+ + + + +ç ççê ú÷ ÷÷ ç çç ÷ ÷÷ç ç ç¶ ¶ ¶ ¶ ¶ ¶è ø è ø è øê úë û
(4)
where 1,u 2 ,u and 3u stand for time-averaged velocity components, 1,u¢ 2u ¢ and 3u ¢ represent velocity fluctuation components, μ is the molecular viscosity, μt is the turbulent viscosity; μeff is the effective viscosity, which can be calculated by Eq. (5):
.eff t = + (5)
However, DS ¢¢¢¢ is not obtainable because the fluctuation
velocity component is unavailable when the results of simulations are obtained through the Reynolds-averaged Navier-Stokes methodology. According to KOCK[20] and MATHIEU, et al[21], the quantity ε or introduced in most turbulence models corresponds to DS ¢¢¢¢ as the asymptotic limit Re→∞. For finite Reynolds numbers in SST k-ω turbulence model, DS ¢¢¢¢ can be approximately replaced by:
.D
kS
T
¢¢¢¢ = (6)
With β=0.09. Here, ω is the characteristic frequency
and k the kinetic energy of the turbulent fluctuations in the SST k-ω turbulence model. From Eq. (7) the overall entropy production rate follows by integration over the

CHINESE JOURNAL OF MECHANICAL ENGINEERING
·805·
flow field volume V:
d ,D D
V
S S V ¢¢¢= ò (7)
d ,D D
V
S S V ¢ ¢¢¢¢= ò (8)
= d ,D DDDV
S S S S V ¢
¢¢¢= + ò (9)
where
DS ,
DS ¢ and DS represent the overall entropy
production rate due to the time-averaged movement, velocity fluctuations and turbulent flows respectively. Therefore, every point could be obtained through calculations based on the 3D steady turbulent flow simulations of the whole flow passage using the CFD method. Entropy production analysis has the advantages of determining the energy dissipation distribution and its exact location.
3 Numerical Modeling and Computational
Details
3.1 Model test rig The pump turbine model investigated in the present work
is installed in HEC (Harbin Institute of Electrical Machinery), Harbin, China. The test rig and a scaled down (1:9.27) model are shown in Fig. 1. Experimental measurements were carried out using a closed loop water circuit. The closed loop test rig design allows for both turbine and pump performance assessment to within an accuracy of 0.2%. Its main characteristics are summarized in Table 1. The measurement system is programmed by LabVIEW software.
Fig. 1. Pump turbine model test rig installed
at HEC, China
Table 1. Test rig parameters
Parameter Value
Maximum head H/m 80 Maximum discharge Qmax/(m3 • s–1) 0.8 Runner diameter range DR/mm 300–500 Generating power PG/kW 750 Test rig accuracy /% 0.20
3.2 Computational domain The simulation model includes a draft tube (inlet), runner,
guide vanes, stay vanes and a spiral casing (outlet) as shown in Fig. 2. Geometry configuration was established using the UG commercial software. The parameters of the reduced scale pump turbine are listed in Table 2. 18 mm, 22 mm and 32 mm guide vane openings’ operation conditions were chosen for simulating.
Fig. 2. Computational domain
Table 2. Parameters of the pump turbine (pump mode)
Parameter Value
Runner inlet diameter D1/mm 274 Runner outlet diameter D2/mm 524 Number of runner blades Zb 9 Number of stay vanes Zs 20 Number of guide vanes Zg 20 Height of guide vane Hg/mm 45.77
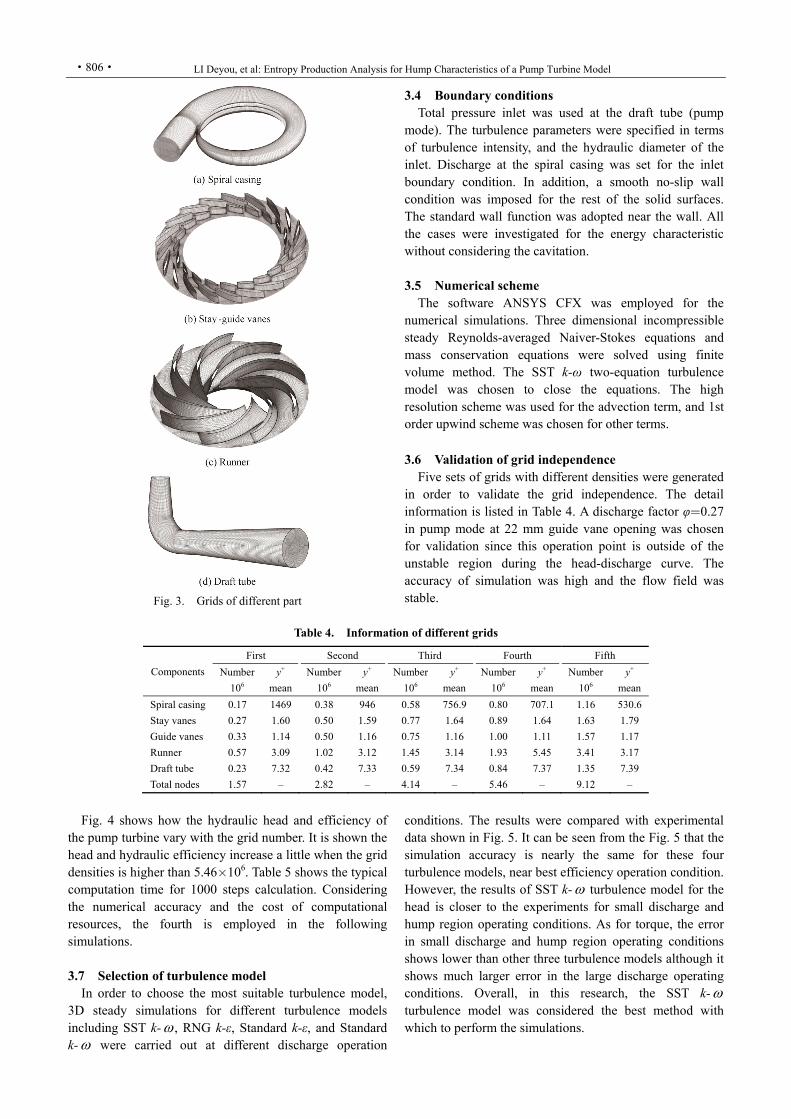
3.3 Grid production Structured hexahedral grids were generated for each
part employed ANSYS ICEM. In order to capture the flow separation of guide vanes, stay vanes, and the runner using the SST k-ω turbulence model, the mesh layers are more than 10, and y+ at the wall layer is less than 11. The detail information of the grid quality is given in Table 3. The quality of the structure grid is an aggregative indicator of the mesh orthogonal angle, expansion factor, aspect ratio and so on. The value of the grid quality ranges from 0 to 1. Higher values mean higher grid quality. The grids for different parts are shown in Fig. 3.
Table 3. Quality of grid
Components Quality
Spiral casing 0.37 Guide vane 0.59 Stay guide vane 0.49 Runner 0.56 Draft tube 0.61
Y LI Deyou, et al: Entropy Production Analysis for Hump Characteristics of a Pump Turbine Model
·806·
Fig. 3. Grids of different part
3.4 Boundary conditions Total pressure inlet was used at the draft tube (pump
mode). The turbulence parameters were specified in terms of turbulence intensity, and the hydraulic diameter of the inlet. Discharge at the spiral casing was set for the inlet boundary condition. In addition, a smooth no-slip wall condition was imposed for the rest of the solid surfaces. The standard wall function was adopted near the wall. All the cases were investigated for the energy characteristic without considering the cavitation.
3.5 Numerical scheme
The software ANSYS CFX was employed for the numerical simulations. Three dimensional incompressible steady Reynolds-averaged Naiver-Stokes equations and mass conservation equations were solved using finite volume method. The SST k-ω two-equation turbulence model was chosen to close the equations. The high resolution scheme was used for the advection term, and 1st order upwind scheme was chosen for other terms. 3.6 Validation of grid independence
Five sets of grids with different densities were generated in order to validate the grid independence. The detail information is listed in Table 4. A discharge factor φ=0.27 in pump mode at 22 mm guide vane opening was chosen for validation since this operation point is outside of the unstable region during the head-discharge curve. The accuracy of simulation was high and the flow field was stable.
Table 4. Information of different grids
Components
First Second Third Fourth Fifth
Number
106
y+
mean
Number
106
y+
mean
Number
106
y+
mean
Number
106
y+
mean
Number
106
y+
mean
Spiral casing 0.17 1469 0.38 946 0.58 756.9 0.80 707.1 1.16 530.6
Stay vanes 0.27 1.60 0.50 1.59 0.77 1.64 0.89 1.64 1.63 1.79
Guide vanes 0.33 1.14 0.50 1.16 0.75 1.16 1.00 1.11 1.57 1.17
Runner 0.57 3.09 1.02 3.12 1.45 3.14 1.93 5.45 3.41 3.17
Draft tube 0.23 7.32 0.42 7.33 0.59 7.34 0.84 7.37 1.35 7.39
Total nodes 1.57 – 2.82 – 4.14 – 5.46 – 9.12 –
Fig. 4 shows how the hydraulic head and efficiency of
the pump turbine vary with the grid number. It is shown the head and hydraulic efficiency increase a little when the grid densities is higher than 5.46´106. Table 5 shows the typical computation time for 1000 steps calculation. Considering the numerical accuracy and the cost of computational resources, the fourth is employed in the following simulations.
3.7 Selection of turbulence model
In order to choose the most suitable turbulence model, 3D steady simulations for different turbulence models including SST k-ω, RNG k-ε, Standard k-ε, and Standard k-ω were carried out at different discharge operation
conditions. The results were compared with experimental data shown in Fig. 5. It can be seen from the Fig. 5 that the simulation accuracy is nearly the same for these four turbulence models, near best efficiency operation condition. However, the results of SST k-ω turbulence model for the head is closer to the experiments for small discharge and hump region operating conditions. As for torque, the error in small discharge and hump region operating conditions shows lower than other three turbulence models although it shows much larger error in the large discharge operating conditions. Overall, in this research, the SST k-ω turbulence model was considered the best method with which to perform the simulations.

CHINESE JOURNAL OF MECHANICAL ENGINEERING
·807·
Fig. 4. Validation of head and efficiency
Table 5. Validation of time cost
No. Nodes number n/mil. Time 1000 steps/h
First 1.57 0.8 Second 2.82 9.2 Third 4.14 26 Fourth 5.46 34 Fifth 9.12 48.9
Fig. 5. Comparison of different turbulence models
4 Entropy Production Analysis for Hump Characteristics
4.1 Experimental validation The simulation results were compared with experimental
data in pump mode at the 18 mm, 22 mm and 32 mm guide vane opening, respectively. The results are shown in Figs. 6–8. Discharge factor φ, head factor ψ, and torque factor λ are defined as follows:
21
,π
Q
R
= (10)
2 21
2,
gH
R
= (11)
5 21
= ,π
M
R
(12)
where Q is discharge, kg/s; g is acceleration of gravity, m/s2; H is head, m; ω is rotational speed of the runner,
rad/s; R1 is runner outlet radius in pump mode, mm.
Fig. 6. External characteristic curve of 18 mm
Fig. 7. External characteristic curve of 22 mm
Fig. 8. External characteristic curve of 32 mm
Fig. 6 shows the head factor error under the 18 guide vane opening, between the experiments and simulations is less than 3% for most operating conditions, although it is nearly 5% for large discharge operating conditions. Moreover, there are two hump regions, which show that the internal flow for this operation condition is rather unstable. As for torque factor and efficiency error, they are less than 3% and 5%, respectively.
As shown in Figs. 7 and 8, the head factor error still features 3% for most operation conditions under the 22 mm guide vane opening as well as 32 mm guide vane opening, while others show a larger error nearly 5% for large discharge operating points. Both torque and efficiency errors for most of operating conditions under 22 mm and 32 mm guide vane openings are less than 2%, the maximum error (around 3%) appears in the hump region and large

Y LI Deyou, et al: Entropy Production Analysis for Hump Characteristics of a Pump Turbine Model
·808·
discharge region. Above all, numerical results show a good agreement with the experimental data. Further analysis could be carried out based on the numerical simulations.
4.2 Variation of overall entropy production
Overall entropy production for turbulent flows including spiral casing, stay vanes, guide vanes, runner and draft tube, under different guide vane openings, are plotted in Fig. 9. Entropy production increases with the decrease of the discharge. This indicates the losses increase with the reduction of the discharge. Moreover, there appear wave peaks under 18 mm (φ=0.183, 0.205), 22 mm (φ=0.178) and 32 mm (φ=0.198) guide vane openings which correspond to a wave trough in the external characteristic curves. It shows hump characteristics come from entropy production (losses). The losses for different guide vane openings mainly happen in the small discharge and hump regions. There is no big difference for the value of entropy production at different guide vane opening operation conditions in the large discharge region. In addition, the entropy production value under the 18 mm guide vane opening is lower than that under the 22 mm and 32 mm guide vane openings. The reasons might be that small discharge operating conditions could be more suitable to small guide vane opening. The losses coming from flow attacking are small. Hence, the losses under the 18mm guide vane opening are smaller than those under other two guide vane openings.
Fig. 9. Overall entropy production
at different guide vane openings
The detail information of entropy production for
different components is shown in Fig. 10. It can be concluded that the entropy production in the guide vanes accounts for most in a pump turbine in pump mode from Figs. 10(a), 10(b) and 10(c). The second and third could be runner and stay vanes. The entropy production of the spiral casing and draft tube changes little with the increasing of the guide vane opening. In the hump region under different guide vane openings, the entropy production of the runner, guide vane and stay vane features hump characteristics. The losses of a pump turbine in pump mode mainly happen in the runner, guide vanes and stay vanes. As for the three guide vane openings, the variation of entropy production in
the draft tube and spiral casing is almost the same. Hence, hump characteristics mainly come from the losses in the runner, guide vanes and stay vanes.
Fig. 10. Overall entropy production rate for different
component at different guide vane opening
4.3 Analysis of entropy production rate distribution Further study was carried out for four operating
conditions at the 18 mm guide vane opening, since the hump characteristics found in the 18 mm guide vanes opening is most obvious. Complex flow inside passages can be observed in this region. In order to reveal the internal flow losses during the hump region, four operating points corresponding to four different discharge factor: φ=0.183 (A), 0.192 (B), 0.199 (C), 0.205 (D) shown in Fig.

CHINESE JOURNAL OF MECHANICAL ENGINEERING
·809·
11 are analyzed based on the entropy theory. Since the losses of a pump turbine in pump mode mainly happen in the runner, guide vanes and stay vanes, these three parts are selected for the following analysis.
Fig. 11. Chosen points for analysis As for the runner, a 2D plane graph could be obtained by
expanding blade to blade surface along the spanwise direction. The height of the blade to blade surface was set 0 to 1 from the band to the crown, and then three spanwise planes, span 0.1, span 0.5, and span 0.9 (see Fig. 12), were used for the following analysis. Span 0.1 is related to the surface near the band, span 0.9 was related to the surface near the crown and span 0.5 is the medium surface of the
runner in the height direction. High entropy production rate (EPR) near the blade surface is mainly caused by the effect of the boundary layer, in which viscosity action leads to loss of energy. From Figs. 13–15, EPR distribution from the band to the crown shows a similar profile. EPR is relatively higher from the runner inlet to the blade passages, along streamline direction, near the band, while the value is relatively smaller on the medium flow surface, which mainly focuses on the suction surface of the blades. The area featuring the smallest EPR, is located at a position close to the crown, and concentrates on a small region near the blade suction surface close to the runner passage outlet. EPR distribution indicates that there is backflow in the runner inlet near the band, and flow separation in the suction surface of the blades
Fig. 12. Sketch map in spanwise plane of the runner
Fig. 13. EPR distribution in the runner passage at span 0.1 plane (kW • m–3 • K–1)
Fig. 14. EPR distribution in the runner passage at span 0.5 plane (kW • m–3 • K–1)
Fig. 15. EPR distribution in the runner passage at span 0.9 plane (kW • m–3 • K–1)

Y LI Deyou, et al: Entropy Production Analysis for Hump Characteristics of a Pump Turbine Model
·810·
In the regions close to the band from the spanwise direction, there shows high EPR, and the value on the suction surface is higher than that on the pressure surface. Moreover, EPR near the blade suction surface decreases from runner passages center to the passage outlet along the streamline. It increases from the pressure surface to the suction surface. From Fig. 15, the total value is low near the runner crown, but is high near the blade suction surface at the one third of the blade length close to the outlet along streamline direction. It indicates these positions have relatively high energy losses, which come from flow separation. In the region of the blade wake, EPR is also high from the band to the crown. It means that the losses are generated by wake effect.
As for the hump region under 18 mm guide vane opening, EPR increases on the center passage along the streamline near the band with increasing of the discharge. EPR distribution changes greatly on the medium surface. However the entropy production rate is relatively high near the suction surface related to the wave trough of hump region, compared to the two peak points of the hump characteristic curve. At the same time, EPR is also higher near the suction surface along the streamline to blade passage outlet at the wave trough operating points A and D
than the one at the two peak condition points B and C of the external characteristic curve.
Guide vanes and stay vanes work as the most important components for guiding the flow received from the runner. According to the analysis above, the losses in the guide vanes and stay vanes account for the most of the losses in pump turbines in pump mode. As the 18 mm guide vane opening is a relatively small opening, the leading edge of the guide vanes is close to the trailing edge of the adjacent guide vane. It can also be seen from Figs. 16–18 that EPR is high near the band. It deceases from the band to crown along the blade height direction. From the figures, it also can be found that EPR is mainly distributed in the guide vane passages. It indicates that there are some vortexes in the guide vane passages on the span 0.1 flow surface. As for span 0.5 flow surface, EPR mainly distributes on the area of the guide vane outlet and stay vane inlet. The losses mostly come from the flow attacking. Near the crown, EPR of the span 0.9 flow surface is very low on the guide vanes, and mainly distributes guide vane outlet and stay vane outlet passage, which comes from the wake effect of the guide vanes and stay vanes. Overall for all the flow surfaces, EPR distributes uniformly in the circumferential direction in regardless of the special stay vane.
Fig. 16. EPR distribution in the tandem cascade at span 0.1 plane (kW • m–3 • K–1)
Fig. 17. EPR distribution in the tandem cascade at span 0.5 plane (kW • m–3 • K–1)
Fig. 18. EPR distribution in the tandem cascade at span 0.9 plane (kW • m–3 • K–1)

CHINESE JOURNAL OF MECHANICAL ENGINEERING
·811·
5 Conclusions
In this paper, 3D incompressive steady simulations are carried out for the 18 mm, 22 mm and 32 mm guide vane openings. The results show strong agreement with the experimental data. Detailed analysis was conducted based on the entropy production theory. Some conclusions are summarized as follows.
(1) Losses could be analyzed through the entropy production from the view of the thermodynamics.
(2) The variation of entropy production at different operation conditions, under different guide vane openings was presented. Entropy production appears to be a wave, with peaks under different guide vane openings, which correspond to the wave trough in the external characteristic curves. Hump characteristics can be explained using entropy production.
(3) The entropy production (losses) for a pump turbine in pump mode mainly happens in the runner, guide vanes and stay vanes. Hump characteristics result from the losses of the runner, guide vanes and stay vanes.
(4) From EPR distribution, the results show the losses decrease from the band to the crown for the runner, guide vanes and stay vanes. The first part of the losses mainly come from backflow near the band and flow separation in the suction surface of the blades in the runner. The second part comes from the vortexes in the vane passages and wake effect of the vanes.
References
[1] Int. Energy Agency (IEA). Renewable Energy Essentials: Hydropower [R]. Paris, France: IEA, 2010.
[2] Int. Energy Agency (IEA). Technology Roadmap: Hydropower[R], Paris, France: IEA, 2013.
[3] GENTNER CH, SALLABERGER M, WIDMER CH. Numerical and experimental analysis of instability phenomena in pump turbines[C/CD]//26th IAHR Symposium on Hydraulic Machinery and Systems - Session 1: Hydraulic Turbines and Pumps, Beijing, China, August 19-23, 2012. IOP Conference Series: Earth and Environmental Science, v15, n PART 3.
[4] LIU Jintao, LIU Shuhong, WU Yulin, et al. Numerical investigation of the hump characteristic of a pump-turbine based on an improved cavitation model[J]. Computer & Fluids, 2012, 68: 105–111.
[5] YANG J, PRAVESI G, YUAN S, et al. Experimental characterization of a pump-turbine in pump mode at hump instability region[J]. Journal of Fluids Engineering, 2015, 137 (051109): 1–11.
[6] LI Deyou, WANG Hongjie, XIANG Gaoming, et al. Unsteady simulation and analysis for hump characteristics of a pump turbine model[J]. Renewable Energy, 2015, 77: 32–42.
[7] BRAUN O, KUENY J L, AVELLAN F. Numerical analysis of flow phenomena related to the unstable energy-discharge characteristic of a pump-turbine in pump mode[C]//2005 ASME Fluid Engineering Division Summer Meeting and Exhibition, Houston, TX, USA, June 19-23, 2005. New York: ASME, v2005: 944–949.
[8] YIN Junlian, LIU Jintao, WANG Leqin, et al. Performance prediction and flow analysis in the vaned distributor of a pump-turbine under low flow rate in pump mode [J]. Science China Technological Sciences, 2010, 53(12): 3302–3309.
[9] RAN Hongjuan, LUO Xianwu, ZHU Lei, et al. Experimental study
of the pressure fluctuations in a pump turbine at large partial flow conditions[J]. Chinese Journal of Mechanical Engineering, 2012, 25(6): 1205–1209.
[10] HERWIG H, GLOSS D, WENTERODT W. A new approach to understanding the influence of wall roughness on friction[J]. Journal of Fluid Mechanical, 2008, 613: 35–53.
[11] ZHANG H C, SCHMANDT B. HERWIG H. Determination of loss coefficients for micro-flow devices: a method based on the second law analysis (SLA)[C]//ASME 2009 2nd Micro/Nanoscale Heat & Mass Transfer International Conference, Shanghai, China, December 18–21, 2009. Proceedings of the ASME Micro/Nanoscale Heat and Mass Transfer International Conference 2009: MNHMT2009, 2010, v2: 545–552.
[12] NATERER G F, CAMBEROS J A. Entropy-based design and analysis of fluids engineering systems[M]. CRC Press, Boca Raton, 2008.
[13] GHASEMI E, MCELIGOT D M, NOLAN K P. Entropy generation in a transitional boundary layer region under the influence of free stream turbulence using transitional RANS models and DNS[J]. International Communications in Heat and Mass Transfer, 2013, 41: 10–16.
[14] MCELIGOT D M, WALSH E J, LAURIEN E, et al. Entropy generation in the viscous part of turbulent boundary layers[J]. Journal of Fluids Engineering, 2008, 106 (6): 061205-1–12.
[15] MCELIGOT D M, NOLAN K P, WALSH E J, LAURIEN E. Effects of pressure gradients on entropy generation in the viscous layers of turbulent wall flows[J]. International Journal of Heat and Mass Transfer, 2008, 51: 1104–1114.
[16] MCELIGOT D M, BRODKEY R S, ECKELMANN H. Laterally converging duct flows: part 4.Temporal behavior in the viscous layer[J]. Journal of Fluid Mechanics, 2009, 634: 433–461.
[17] GLOSS D, HERWIG H. Wall roughness effects in laminar flows: an often ignored though significant issue[J]. Experiments in Fluids, 2010, 49: 461–470.
[18] GONG Ruzhi, WANG Hongjie, CHEN Lixia, et al. Application of entropy production theory to hydro-turbine hydraulic analysis[J]. Sci. China Tech. Sci., 2013, 56(7): 1636–1643.
[19] BEJAN A. Entropy production through heat and fluid flow[M]. New York: John Wiley & Sons, 1994.
[20] BEJAN A. Entropy production minimization: the method of thermodynamic optimization of finite-time systems and finite-time processes[M]. Boca Raton, FL: CRC Press, 1996.
[21] SCHMANDT B, HERWIG H. Internal flow losses: a fresh look at old concepts[J]. Journal of Fluids Engineering, 2001, 133(5): 1–10.
[22] KOCK F, HERWIG H. Local entropy production in turbulent shear flows: a high Reynolds number model with wall functions[J]. International Journal of Heat and Mass Transfer, 2004, 47: 2205–2215.
[23] MATHIEU J, SCOTT J. An introduction to turbulent flow[M]. Cambridge: Cambridge University Press, 2000.
Biographical notes LI Deyou, born in 1986, is currently a PhD candidate at School of Energy Science and Engineering, Harbin Institute of Technology, China. He received his bachelor and master degree from Harbin Institute of Technology, China, in 2010 and 2012, respectively. His research interests include numerical simulation and experimental investigation of hydraulic machinery, such as pump turbine, turbine and pump; modeling and simulation of hydraulic system control, and testing technology of hydraulic machinery. Tel: +86-15244604600; E-mail: [email protected] GONG Ruzhi, born in 1977, is currently a lecturer at School of Energy Science and Engineering, Harbin Institute of Technology, China. He received his PhD degree on engineering thermal physics from Harbin Institute of Technology, China, in 2013.

Y LI Deyou, et al: Entropy Production Analysis for Hump Characteristics of a Pump Turbine Model
·812·
E-mail: [email protected] WANG Hongjie, born in 1962, is currently the Vice President and a professor at School of Energy Science and Engineering, Harbin Institute of Technology, China. E-mail: [email protected] XIANG Gaoming, born in 1992, is currently a master candidate at School of Energy Science and Engineering, Harbin Institute of Technology, China. E-mail: [email protected] WEI Xianzhu, born in 1966, is currently the Vice Chief Designer
and the Director of Hydraulic Turbine Research Department at Harbin Institute of Large Electrical Machinery, Harbin, China. And also, he is a part time professor at School of Energy Science and Engineering, Harbin Institute of Technology, China. E-mail: [email protected] QIN Daqing, born in 1965, is currently the Vice Chief Engineer and the Vice president at Harbin Institute of Large Electrical Machinery, China. And also, he is a part time professor at School of Energy Science and Engineering, Harbin Institute of Technology, China. E-mail: [email protected]