Entergy Services, Inc. 639 Loyola Avenue...
248
Entergy Services, Inc. 639 Loyola Avenue (70113) P.O. Box 61000 New Orleans, LA 70161-1000 Tel 504 576 4170 Fax 504 576 5579 Karen H. Freese Associate General Counsel Legal Services - Regulatory June 18, 2012 Via UPS Overnight Delivery Ms. Terri Lemoine Bordelon Records and Recording Division Louisiana Public Service Commission Galvez Building, 12 th Floor 602 North 5 th Street Baton Rouge, Louisiana 70802 Re: In re: Development and Implementation of Rules for Integrated Resource Planning for Electric Utilities - LPSC Docket No. R-30021 Dear Ms. Bordelon: On behalf of Entergy Louisiana, LLC and Entergy Gulf States Louisiana, L.L.C. (the “Companies”), I have enclosed three CD’s containing the Companies’ Initial IRP Report as required by Section 10 of the Louisiana Public Service Commission’s General Order (Corrected) issued April 20, 2012, in Docket No. R-30021, Development and Implementation of Rule for Integrated Resource Planning for Electric Utilities. The Initial IRP Report consists of four documents: 1. Entergy System Strategic Resource Plan; 2. 2009 Strategic Resource Plan Refresh; 3. Entergy Louisiana, LLC Integrated Resource Plan; and 4. Entergy Gulf States Louisiana, L.L.C. Integrated Resource Plan. I have also enclosed three copies of this letter and ask that you please retain the original and two copies and return a date-stamped copy to me in the enclosed, self-addressed envelope. If you have any questions, please feel free to call me. Thank you for your courtesy and assistance with this matter. Sincerely, Karen H. Freese KHF/kll Enclosures cc: Official Service List (w/enclosures by E-mail and/or U.S. Mail)
Transcript of Entergy Services, Inc. 639 Loyola Avenue...

Entergy Services, Inc. 639 Loyola Avenue (70113) P.O. Box 61000 New Orleans, LA 70161-1000 Tel 504 576 4170 Fax 504 576 5579
Karen H. Freese Associate General Counsel Legal Services - Regulatory
June 18, 2012 Via UPS Overnight Delivery Ms. Terri Lemoine Bordelon Records and Recording Division Louisiana Public Service Commission Galvez Building, 12th Floor 602 North 5th Street Baton Rouge, Louisiana 70802
Re: In re: Development and Implementation of Rules for Integrated Resource Planning for Electric Utilities - LPSC Docket No. R-30021
Dear Ms. Bordelon:
On behalf of Entergy Louisiana, LLC and Entergy Gulf States Louisiana, L.L.C. (the “Companies”), I have enclosed three CD’s containing the Companies’ Initial IRP Report as required by Section 10 of the Louisiana Public Service Commission’s General Order (Corrected) issued April 20, 2012, in Docket No. R-30021, Development and Implementation of Rule for Integrated Resource Planning for Electric Utilities.
The Initial IRP Report consists of four documents: 1. Entergy System Strategic Resource Plan; 2. 2009 Strategic Resource Plan Refresh; 3. Entergy Louisiana, LLC Integrated Resource Plan; and 4. Entergy Gulf States Louisiana, L.L.C. Integrated Resource Plan. I have also enclosed three copies of this letter and ask that you please retain the original
and two copies and return a date-stamped copy to me in the enclosed, self-addressed envelope. If you have any questions, please feel free to call me. Thank you for your courtesy and assistance with this matter. Sincerely,
Karen H. Freese KHF/kll Enclosures cc: Official Service List (w/enclosures by E-mail and/or U.S. Mail)
kleboeu
Ltrhead Grey
kleboeu
KHF/KLL
Strategic Resource Plan
An Integrated Resource Plan for the Entergy Utility System and the Entergy Operating Companies 2009 – 2028
Prepared by System Planning & Operations
August 21, 2009
Attachment 1 Docket R-30021 Page 1 of 150
1-1
. . . . . . .. . . Chapter 1
Executive Summary A Time of Transition
Scope and Structure
The Entergy Electric System includes six regulated public utilities committed to reliably meeting customer needs by balancing reliability, cost and risk mitigation to achieve the lowest reasonable cost.
This Strategic Resource Plan (“SRP”) describes the long-term integrated resource plan (“IRP”) for the period 2009 – 2028 for the Entergy System and its Operating Companies (Entergy Arkansas, Inc. (“EAI”), Entergy Gulf States Louisiana, L.L.C. (“EGSL”), Entergy Louisiana, LLC (“ELL”), Entergy Mississippi, Inc. (“EMI”), Entergy New Orleans, Inc, (“ENOI”) and Entergy Texas, Inc. (“ETI”)). This SRP reflects that in the coming years the Entergy System will undergo change. Two of the Entergy System’s six Operating Companies, EAI and EMI, have provided notice that they intend to withdraw from the System Agreement. The withdrawal of EAI and EMI from the System Agreement will affect the long-term resource needs of those two companies as well as the four Operating Companies that remain parties to the System Agreement.
Accordingly, this SRP Update results in a plan that positions EAI and EMI for reliable and economic operations once they withdraw from the System Agreement and also prepares the remaining Operating Companies for operation as a System after the exit of EAI and EMI. The SRP results in capacity expansion scenarios that provide guidance regarding future resource needs and additions given the best information now available. These capacity expansion scenarios include long-term plans for the Six-company system for its duration, then for a Four-company System, with EAI and EMI each standing alone. The capacity expansion scenarios for EAI and EMI position those companies to operate on a stand-alone basis following their announced dates of exit from the System Agreement. However, EAI and EMI may determine to enter into other arrangements including possible coordination agreements or reserve sharing arrangements following their exit from the System Agreement. It is not possible at this time to predict the outcome of those uncertainties. However, the result of any such alternative arrangement would tend to reduce overall resource needs for EAI and EMI as compared to
Attachment 1 Docket R-30021 Page 2 of 150
1-2
standalone operations. As a result, this plan results in adequate resources to meet EAI’s needs and EMI’s needs under alternative assumptions.
This SRP assumes that following the exit of EAI and EMI from the System Agreement, the remaining Entergy Operating Companies will be planned and operated as a single integrated electric system pursuant to the terms and conditions of the System Agreement. Planning scenarios provide adequate capacity to meet the long-term needs of the System.
Overview of Document This planning document addresses matters pertinent to the Entergy System, now and following the exit of EAI and EMI, and all Operating Companies including EAI and EMI following exit from the System. This document:
• Describes the overall planning framework;
• Discusses the assumptions and analysis that are generally applicable at each level of the plan; and
• Reports the roll-up of the capacity expansion scenarios for all Operating Companies.
Additional supplemental materials address matters pertaining specifically to other reporting levels including:
• Long-term requirements for the Four-Company System after the exit of EAI and EMI;
• The supply portfolios of the four Operating Companies, ELL, EGSL, ENOI, and ETI;
• Describes capacity expansion scenarios for the Four-company System;
• EAI’s and EMI’s supply portfolio and long-term supply needs; and
• Describes capacity expansion scenarios for EAI and EMI in stand alone operation.
Background of Strategic Resource Plan
In 2003, the Entergy Operating Companies adopted a framework for long-range planning. Initially termed the Strategic Supply Resource Plan, that framework is now referred to as the Strategic Resource Plan (“SRP”) in order to more accurately reflect the full scope of the planning effort. The SRP
Attachment 1 Docket R-30021 Page 3 of 150

1-3
framework includes a set of principles and objectives that guide long-term portfolio design. The SRP planning process results in planning scenarios regarding potential future portfolio resource decisions including resource timing, location and technology. These planning scenarios provide guidance regarding long-term resource additions, but are not intended as static plans or pre-determined schedules for resource additions. Actual portfolio decisions are made at the time of execution.
By deferring technology and site selection to the time of project execution, the System is able to recalibrate the resource plan over time to ensure a better portfolio mix as externalities over which the system has no control develop and change, as new information becomes available and as uncertainties are resolved. In this sense, the SRP is a dynamic process for long-range planning that provides for a flexible approach to resource selection.
Portfolio Transformation Consistent with the SRP, the System is pursuing a long-term supply strategy, sometimes referred to as the “Portfolio Transformation Strategy,” that seeks to upgrade the generation supply and power supply resources of the Entergy Operating Companies to develop a more diverse, modern, and efficient portfolio of energy supply resources to meet customer needs. The resulting portfolio is intended to achieve the planning objectives in a balanced manner by providing reliable, cost effective, and more stable-priced power, while providing flexible capability needed to respond to operating constraints, supply contingencies, and uncertainties caused by such factors as load changes including intra-hour load changes, Open Access Transmission Tariff (“OATT”) Generator Imbalance provisions, merchant generator outages, and puts from Qualifying Facilities (“QFs”).
Current Environment for Integrated Resource Planning
In recent years, a number of factors have changed the planning landscape and resulted in a heightened focus on integrated resource planning.
• General increases in supply cost have altered the relative economics of technology choices.
• Technological advances make a wider array of alternatives potentially available to meet customer needs including renewable generation alternatives and DSM resources.
• Increasing concerns over the environmental effects of power generation, especially the emission of greenhouse gases, have increased the interest in non-conventional sources of power.
Attachment 1 Docket R-30021 Page 4 of 150

1-4
The potential for some form of carbon legislation alters the analysis of the relative economics of resource alternatives.
• The implementation of Federal Energy Regulatory Commission (“FERC”) Order 717, which restores some of the ability to perform integrated transmission and generation planning. The required separation of transmission and generation planning, which was required as a result of FERC Orders 888 and 889, has proven to be an impediment to the development of integrated resource plans. The implementation of Order 717 offers opportunities to improve the long-term integrated planning processes.
In general, the current planning environment is characterized by rising supply cost, heightened uncertainties, technological changes, and shifting relative economics. Emerging federal and state regulations concerning renewable generation and greenhouse gas emissions add to the uncertainties and increase the complexities involved in planning for long-term resource needs.
Figure 1 – 1: Current Environment for Integrated Resource Planning
UncertaintyUncertainty
Technological Landscape / Alternatives
Technological Landscape / Alternatives
IRPIRP
Environmental Concerns
Environmental Concerns
Fuel Supply and Security
Fuel Supply and Security
Escalating Construction Cost
and Capital Constraints
Escalating Construction Cost
and Capital Constraints
Increasing Generation Supply Cost
Increasing Generation Supply Cost
Attachment 1 Docket R-30021 Page 5 of 150
1-5
Key Uncertainties The current environment for resource planning is a dynamic one in which a number of uncertainties may alter supply needs and the long-term economics of resource alternatives. Key uncertainties include, but are not limited to:
• Price and Availability of Natural Gas – In recent years, natural gas prices experienced substantial increases, followed more recently by a sharp decline. The volatility of natural gas prices has become more pronounced. Prices during 2008 reached a peak in the summer of about $13.32/mmBtu, but then fell to $5.71/mmBtu by the end of the year. To some extent, part of this decrease in natural gas prices can be attributed to the demand destruction resulting from the economic downturn in the U.S., but a more important influence on long-term price forecasts has been the emergence of non-conventional gas at economic prices and in unanticipated levels. While projections for long-term gas prices are now lower than a year ago, long-term price levels remain uncertain. Developments in 2008 serve to highlight this uncertainty.
• Power Plant Construction Cost – In recent years, the cost of constructing new power plants has risen rapidly. Although effects differ by technology and location, in general, the costs associated with constructing a power plant more than doubled since 2000. The increases in power plant construction cost have affected all technologies. However, capital-intensive technologies such as coal and nuclear are most affected.
• Market Conditions – Since 1999, the Entergy region has experienced a build-out of merchant generating capacity. More recently, market conditions have begun to tighten and this tightening trend is expected to continue. At this point, a limited number of currently-existing wholesale merchant facilities within the Entergy region are available to provide long-term incremental capacity.
• Environmental Concerns – The issue of potential climate change associated with atmospheric greenhouse gases has received growing attention in the scientific community with governmental policy makers and the media. Emissions from power plants are a major source of CO2, which is a greenhouse gas. It is not possible to predict with any degree of certainty whether CO2 legislation will eventually be enacted, and if so,
Attachment 1 Docket R-30021 Page 6 of 150
1-6
when it would become effective, or what form it would take. However, any form of CO2 legislation would likely result in higher cost for electric generation. Because alternative technologies emit different levels of CO2 per MWh of generation, CO2 legislation would likely change the relative economics of supply alternatives.
• Renewable Portfolio Standards (“RPS”) – There is growing discussion regarding the potential implementation of a renewable portfolio standard (also sometimes known as a “Renewable Energy Standard”) at the federal level. Several bills have been proposed in the U.S. Congress that would establish various targets for renewable generation and differing levels of compliance cost.
Jurisdictional Developments in Integrated Resource Planning A discussion of current integrated resource planning activities within each of Entergy’s retail jurisdictions follows.
Arkansas The Arkansas Public Service Commission (“APSC”) adopted an Integrated Resource Planning (“IRP”) rule requiring EAI to file an IRP (such as this SRP) every three years. In 2006, EAI complied with the APSC’s rules by filing the SSRP that was in place at that time. EAI is currently required to file a new IRP in the 4th quarter of 2009; the 2009 IRP filing must comply with the APSC’s new requirements, which include a stakeholder input process and more comprehensive considerations of demand-side management and load control options.
Louisiana The Louisiana Public Service Commission (“LPSC”) has opened a docket investigating the potential for implementing an IRP process. The docket is in a comment phase.
Mississippi In 2008, the Mississippi Public Service Commission (“MPSC”) initiated a docket to review statewide energy plans, and as part of that investigation, EMI filed with the MPSC the then-current SSRP. The MPSC is currently evaluating the need for more comprehensive IRP rules.
New Orleans The City Council of New Orleans adopted an IRP process in 2008. ENOI has filed its initial plan pursuant to that process, and the Council is expected to
Attachment 1 Docket R-30021 Page 7 of 150
1-7
initiate a formal review of that plan, and of increased energy efficiency programs, in the near future.
Texas At present, Texas does not have an IRP requirement.
Key Changes in the 2009 Update
This update reflects a number of key changes as compared to prior plans:
• The long-range plan has been renamed from the “Strategic Supply Resource Plan” to the “Strategic Resource Plan” to reflect more accurately the full scope of the planning efforts. The prior name suggested inaccurately that the scope of the planning efforts was limited to supply-side alternatives. The new name more accurately recognizes the fact that the SRP considers the full range of alternatives available to meet customer needs including demand-side alternatives.
• This SRP provides greater detail regarding plans to address the implications of EAI’s and EMI’s notices to withdraw from the System Agreement. EAI provided notice on December 19, 2005 pursuant to Section 1.01 of the System Agreement that it will withdraw from the System Agreement on December 18, 2013. EMI provided similar notice to the Operating Companies on November 8, 2007 that it plans to withdraw on November 7, 2015. While prior resource plans have recognized these facts, this SRP includes capacity expansion scenarios for the Four-company System, EAI standalone, and EMI standalone. For the period before EAI and EMI exit, capacity expansion scenarios reflect System needs.
• Greater detail is provided about key assumptions including fuel prices, load levels, and CO2 cost. Determining what information should be disclosed in an IRP document requires striking a balance between preserving the confidentiality of commercially sensitive information and providing stakeholders with sufficient information to understand the plan. Disclosure of commercially sensitive information would affect customers adversely. On the other hand, at least some understanding of key assumptions is necessary for stakeholders to understand the process and to enable robust comment. This SRP provides stakeholders with additional information about key assumptions, albeit in some cases in summary form, while still
Attachment 1 Docket R-30021 Page 8 of 150

1-8
protecting customers by maintaining the confidentiality of commercially sensitive information.
• The planning horizon has been extended from ten to twenty years. Although prior plans relied on analysis of full life cycle economics to assess resource alternatives – thirty to forty years for most resources – capacity expansion scenarios were developed for a period of ten-years. A ten-year planning horizon was appropriate given circumstances then existing – the availability of adequate wholesale power to meet long-term supply needs, the relative homogeneity of the wholesale supply (that is, CCGT resources), and the economic attractiveness of CCGT alternatives across a wide range of foreseeable outcomes. However, recent developments in the planning environment suggest that a longer-term portfolio planning approach now is preferable. Those developments include the increasing need to consider resource alternatives that require much longer lead times (e.g., new nuclear); the decline in the amount of available long-term wholesale power within the region for incremental supply; and the increasing level of uncertainties affecting the relative economics of long lasting high-capital technologies.
• This update incorporates expanded modeling of renewable generation alternatives. The update recognizes that the relative economics of renewable generation alternatives are improving due to technological advances. In addition, potential implication of RPS and/or carbon legislation changes the relative economics of generation alternatives.
• This update utilizes enhanced probability modeling to assess the risks relating to alternative portfolio strategies in light of the uncertainties described above. The planning process has included a portfolio assessment that analyzes alternative long-term portfolio strategies to identify the strategies that best balance planning objectives in today’s environment of uncertainty.
• Most of the analysis supporting this update was prepared before the FERC issued Order 717. That analysis did not ignore the implications of supply planning on the transmission system, and vice versa, but the significant restrictions imposed by previous FERC standards, orders and guidelines limited the ability of the System to evaluate both transmission and supply alternatives in a fully integrated manner. In the future, with the
Attachment 1 Docket R-30021 Page 9 of 150
1-9
implementation of Order 717, the System anticipates that long-run resource plans will reflect more integrated long-term planning.
Summary of Key Findings and Conclusions
The SRP process results in planning scenarios that provide guidance regarding the timing, amount, technology and regional location of potential future resource additions. The Reference Planning Scenario, described in detail in Chapter 12, charts a course for meeting customer needs that balances the planning objectives of reliability, reasonable cost, and risk mitigation. In doing so, the Reference Planning Scenario considers uncertainty and describes a portfolio of resources that is reasonably robust in accomplishing those objectives across a range of outcomes.
However, actual resource decisions will be made as the plan is implemented over time. The actual amount, timing and technologies of deployed resources will depend on a range of factors which may differ from assumptions included in the Reference Planning Scenario. Such long-term uncertainties include, but are not limited to:
• Load growth, which will determine actual resource needs;
• The relative economics of alternative technologies, which may change over time;
• Regulatory requirements (for example, the possible implementation of a federal Renewable Portfolio Standard); and
• Practical considerations that may constrain the ability to deploy resource alternatives such as the availability of adequate sources of capital at reasonable cost.
In addition to the Reference Planning Scenario, the SRP also includes Alternative Planning Scenarios that describe how the Reference Planning Scenario would be adjusted in the future to respond to specific contingencies.
The following are key highlights resulting from the planning study including the technology and portfolio assessments described later in the document.
• The imposition of carbon and RPS legislation will add to the cost of meeting customer needs. Portfolio choices can mitigate this effect but not eliminate it. Depending on the terms of legislation, these requirements could add 25% to total supply cost over the planning horizon on an NPV basis.
Attachment 1 Docket R-30021 Page 10 of 150
1-10
• CCGT technology remains economically attractive across a wide range of operating roles and uncertainty outcomes. CCGT technology is operationally and economically suited for load-following roles and remains the technology of choice for that purpose. Further, CCGT technology is economic for baseload operation at current expectations for natural gas and carbon prices. Given its economic and risk profile, CCGT technology is the basic portfolio building block in the Reference Planning Scenario.
• Renewable Generation has a place within the portfolio. Inclusion of modest levels of the most economically priced renewable generation alternatives can reduce cost and minimize total supply cost risk especially in light of the potential RPS and carbon legislation. However, the amount of renewable generation that can be cost effectively added is limited.
• With the exception of power uprates at existing nuclear facilities, the Reference Planning Scenario does not assume any incremental additions of new solid fuel (coal) or nuclear resources. This includes the Little Gypsy Repowering project which is assumed to be deferred indefinitely. The analysis indicates that, at currently anticipated fuel and carbon prices, the construction of new solid fuel or new nuclear technologies are not economically attractive. However, these economics bear watching given that key uncertainties – including the cost of the technologies themselves – can alter the relative economics. Also, an important consideration in the future of these technologies is the effect on carbon emissions. The deployment of new nuclear and solid fuel technology, assuming carbon capture and sequestration technology for the latter, can result in reductions of CO2 emissions relative to the Reference Planning Scenario.
Specific assumptions incorporated into the twenty-year Reference Planning Scenario include the following:
• 6.9 GWs of existing gas-fired steam capacity is deactivated. As described further in Chapter 8, on-going planning processes assess existing units to determine their ability to economically remain in the portfolio relative to other alternatives. These planning processes consider the potential for economic investment in existing facilities according to original equipment manufacturer / vendor recommendations and consistent with utility practice to maintain
Attachment 1 Docket R-30021 Page 11 of 150
1-11
safety and performance. The results of these efforts may alter long-term deactivation assumptions.
• 8.6 GWs of gas-fired CCGT resources are added.
• 2.0 GWs of renewable generation from 2014 to 2028, representing a level of economically attractive renewable generation that appears to be realistically achievable given current cost estimates. The Entergy System recently conducted a Request for Information relating to renewables and anticipates conducting a Request for Proposals for renewable generation in the future. The results of those initiatives will inform future planning efforts and will result in appropriate adjustments to the levels of renewable generation included in future SRP Updates.
• All existing coal-fired capacity remains in operation throughout the planning horizon.
• All existing nuclear facilities remain in operation throughout the planning horizon.
• 0.3 GWs of nuclear capacity is added in the form of nuclear “uprates” (which are plant modifications that result in increased output) at existing facilities. As of late June, the Operating Companies have not entered into any binding commitments to execute any of these uprates. The Operating Companies are evaluating the technical and economic feasibility of nuclear uprate projects, and have taken steps to maintain the viability of the option of potential uprate projects. If the projects prove to be uneconomic or technically unfeasible, these MWs would be replaced with additional CCGT resources.
• No new solid fuel or new nuclear capacity is added over the twenty years.
• The Little Gypsy Repowering Project is suspended indefinitely.
Alternative Planning Scenarios, described in Chapter 12, include:
• A New Nuclear Planning Scenario that describes how planned resource additions would be adjusted if results of on-going monitoring activities indicate that new nuclear technology proves to be a viable, economically attractive alternative to meet baseload needs in the future.
Attachment 1 Docket R-30021 Page 12 of 150
1-12
• A High Growth Planning Scenario that describes how planned resource additions would be adjusted if actual load growth tends toward the upper end of outcomes described in Chapter 3.
• A Low Growth Planning Scenario that describes how planned resource additions would be adjusted if actual load growth tends toward the lower end of the outcomes described in Chapter 3.
• A High Load Factor Planning Scenario that describes how planned resource additions would be adjusted if load patterns change such that energy sales continue to grow, as assumed in the Reference Planning Scenario, but peak load does not grow.
Action Plan
The 2009 SRP Update has identified the following actions to be undertaken over the next one to five years to support implementation of the Portfolio Transformation Strategy and the Reference Planning Scenario.
• New Nuclear Development – During 2008, the System made a decision to defer developing new nuclear based on current cost estimates. The System will continue to monitor new nuclear technologies and will maintain readiness to execute new nuclear projects when and if they appear viable through spending levels consistent with results of the on-going assessment.
• Other Baseload Opportunities – The System does not foresee new development activities for new solid fuel resources in the near term. However, the System continues to monitor market conditions and will evaluate potential opportunities to participate in solid fuel projects if, and when, presented. In addition, the System will monitor development of advanced coal technologies such as Integrated Gasification Combined Cycle (“IGCC”), Carbon Capture and Sequestration (“CCS”) and other advanced solid fuel technologies for economic and commercial viability.
• Jurisdictional IRP Initiatives – The System continues to monitor evolving jurisdictional Integrated Resource Plan (“IRP”) requirements and will adapt its planning processes and methods, as appropriate, to respond to jurisdictional IRP requirements.
Attachment 1 Docket R-30021 Page 13 of 150

1-13
• Renewable Resource Strategy – The System anticipates conducting a Request for Proposals (RFP) for new renewable generation in the 2009 – 2010 timeframe.
• Opportunities for Existing Resources – The current generating portfolio will continue to age and require increased budget to maintain. However, these resources also represent potential alternatives for economically meeting customers’ needs through continued operations, repowering, refurbishment and/or upgrades. Over the coming years, the System plans to assess such opportunities. Chapter 8 describes these efforts in further detail.
• Western Region RFP – The System is in the process of conducting a Request for Proposals (RFP) for long-term supply resources to meet the power needs in the western most part of the System. The System is market testing a self-supply project within the RFP.
• The System plans to conduct one or more additional RFPs over the next 18 months to seek long-term resources to meet customer needs. The System anticipates market testing a self-supply project to meet power needs within the Amite South planning region.
Attachment 1 Docket R-30021 Page 14 of 150
2-1
. . . . . . .. . . Chapter 2
Planning Framework Consistency in a Time of Change
Overview
This chapter describes the planning framework used to prepare this SRP Update. The Entergy Operating Companies continue to improve planning assumptions and methods so that long-term resource plans reflect the best information and techniques reasonably available. While the name has changed to the SRP in order to more accurately reflect the full scope of the planning effort, this update rests, by and large, on the same planning framework that the Entergy Operating Companies adopted in 2003 in the form of the SSRP. The planning landscape has changed over that time. But despite these changes, the planning framework including the principles and objectives continue to be valid. Changing facts and circumstances may affect conclusions about long-term resource needs and the best way to meet those needs. Hence there is a need to periodically update SRP planning scenarios. However, the framework for the developing planning scenarios is the same.
One of the key changes facing the Entergy Operating Companies in the coming years is termination of EAI’s and EMI’s participation in the Entergy System Agreement. EAI’s and EMI’s withdrawal from the System Agreement will affect the long-term resource needs of those two companies as well as the four Operating Companies that for planning purposes are assumed to remain in the System. Although the implications of the EAI and EMI withdrawal affect planning scenarios, SRP planning objectives and principles provide a basis for considering these implications. The fundamental planning objectives and principles are appropriate for both Operating Company and System resource planning. A basic premise applicable to both is that over time each Operating Company will move toward a portfolio of resources matched to its customer load shape needs. Consequently, the planning methods needed to consider the withdrawal of EAI and EMI were largely in place prior to this update.
Planning Levels
The Entergy Operating Companies are planned and operated as a single, integrated electric system, pursuant to the Entergy System Agreement. The six
Attachment 1 Docket R-30021 Page 15 of 150
2-2
Entergy Operating Companies are Entergy Arkansas, Inc. (“EAI”), Entergy Gulf States Louisiana, L.L.C. (“EGSL”), Entergy Louisiana, LLC (“ELL”), Entergy Mississippi, Inc. (“EMI”), Entergy New Orleans, Inc. (“ENOI”), and Entergy Texas, Inc (“ETI”). The electric generation and bulk transmission facilities of these Operating Companies are currently planned and operated on an integrated, coordinated basis as a single electric system pursuant to the terms and conditions of the Entergy System Agreement and are referred to collectively as the “Entergy System” or the “System”.
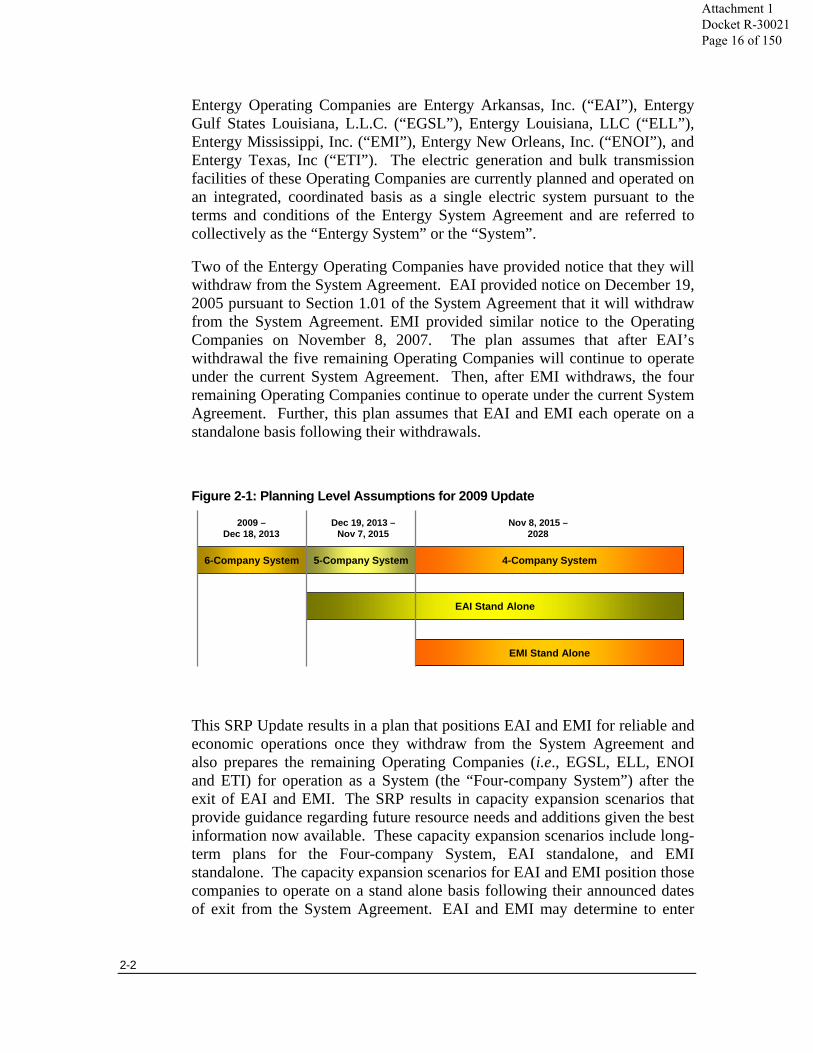
Two of the Entergy Operating Companies have provided notice that they will withdraw from the System Agreement. EAI provided notice on December 19, 2005 pursuant to Section 1.01 of the System Agreement that it will withdraw from the System Agreement. EMI provided similar notice to the Operating Companies on November 8, 2007. The plan assumes that after EAI’s withdrawal the five remaining Operating Companies will continue to operate under the current System Agreement. Then, after EMI withdraws, the four remaining Operating Companies continue to operate under the current System Agreement. Further, this plan assumes that EAI and EMI each operate on a standalone basis following their withdrawals.
Figure 2-1: Planning Level Assumptions for 2009 Update
This SRP Update results in a plan that positions EAI and EMI for reliable and economic operations once they withdraw from the System Agreement and also prepares the remaining Operating Companies (i.e., EGSL, ELL, ENOI and ETI) for operation as a System (the “Four-company System”) after the exit of EAI and EMI. The SRP results in capacity expansion scenarios that provide guidance regarding future resource needs and additions given the best information now available. These capacity expansion scenarios include long-term plans for the Four-company System, EAI standalone, and EMI standalone. The capacity expansion scenarios for EAI and EMI position those companies to operate on a stand alone basis following their announced dates of exit from the System Agreement. EAI and EMI may determine to enter
EAI Stand Alone
6-Company System 5-Company System
EMI Stand Alone
4-Company System
Nov 8, 2015 –2028
2009 –Dec 18, 2013
Dec 19, 2013 –Nov 7, 2015
Attachment 1 Docket R-30021 Page 16 of 150
2-3
into other arrangements including possible coordination agreements or reserve sharing arrangements following their exit from the System Agreement. It is not possible at this time to predict the outcome of those uncertainties. However, the result of any such alternative arrangement would tend to reduce overall resource needs for EAI and EMI as compared to standalone operations. As a result, this plan results in adequate resources to meet EAI and EMI under alternative assumptions.
This SRP assumes that until EAI and EMI exit from the System Agreement, the Entergy Operating Companies will continue to be planned and operated as a single integrated electric system pursuant to the terms and conditions of the System Agreement. Consequently, for the period before EAI and EMI exit, capacity expansion scenarios reflect the aggregate needs of the current System configuration.
Applicability of Planning Principles and Objectives The planning framework discussed in the sections that follow, including the principles and objectives, apply to each of the relevant planning levels. Thus, for example, when considering the needs of EAI on a standalone basis the same principles and objectives apply as apply to the System or EMI on a standalone basis.
Long-Term Focus The SRP is a long-term (twenty-year) view of the power supply needs of the Entergy System and the Entergy Operating Companies. Assessing needs over a long-term horizon is challenging. A wide number of factors – some impossible to foresee at this time – will affect the long-term power needs and the alternatives to meet those needs. It is impossible to predict what changes will occur, over a twenty year period.
The SRP recognizes this uncertainty in several ways:
• Analytical methods assess how uncertainties affect the cost of resource and portfolio strategy alternatives.
• Portfolio design processes seek to develop a long-term portfolio mix that balances cost and risk.
• The Reference Planning Scenario charts a course that meets planning objectives while providing the flexibility to respond to changing conditions.
Attachment 1 Docket R-30021 Page 17 of 150
2-4
Overall Process
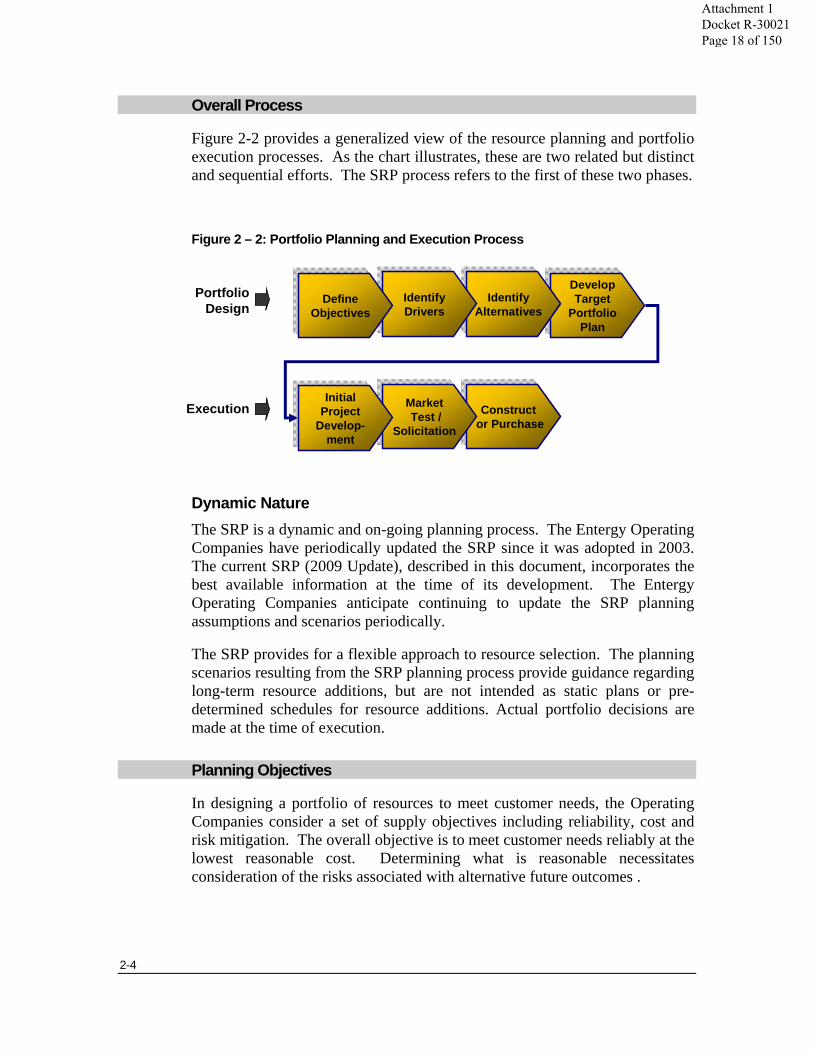
Figure 2-2 provides a generalized view of the resource planning and portfolio execution processes. As the chart illustrates, these are two related but distinct and sequential efforts. The SRP process refers to the first of these two phases.
Figure 2 – 2: Portfolio Planning and Execution Process
Dynamic Nature The SRP is a dynamic and on-going planning process. The Entergy Operating Companies have periodically updated the SRP since it was adopted in 2003. The current SRP (2009 Update), described in this document, incorporates the best available information at the time of its development. The Entergy Operating Companies anticipate continuing to update the SRP planning assumptions and scenarios periodically.
The SRP provides for a flexible approach to resource selection. The planning scenarios resulting from the SRP planning process provide guidance regarding long-term resource additions, but are not intended as static plans or pre-determined schedules for resource additions. Actual portfolio decisions are made at the time of execution.
Planning Objectives
In designing a portfolio of resources to meet customer needs, the Operating Companies consider a set of supply objectives including reliability, cost and risk mitigation. The overall objective is to meet customer needs reliably at the lowest reasonable cost. Determining what is reasonable necessitates consideration of the risks associated with alternative future outcomes .
Execution
Develop Target
Portfolio Plan
Develop Target
Portfolio Plan
Constructor Purchase
Constructor Purchase
MarketTest /
Solicitation
MarketTest /
Solicitation
IdentifyAlternatives
IdentifyAlternatives
Identify DriversIdentify Drivers
Initial Project
Develop-ment
Initial Project
Develop-ment
Define Objectives
Define Objectives
Portfolio Design
Attachment 1 Docket R-30021 Page 18 of 150
2-5
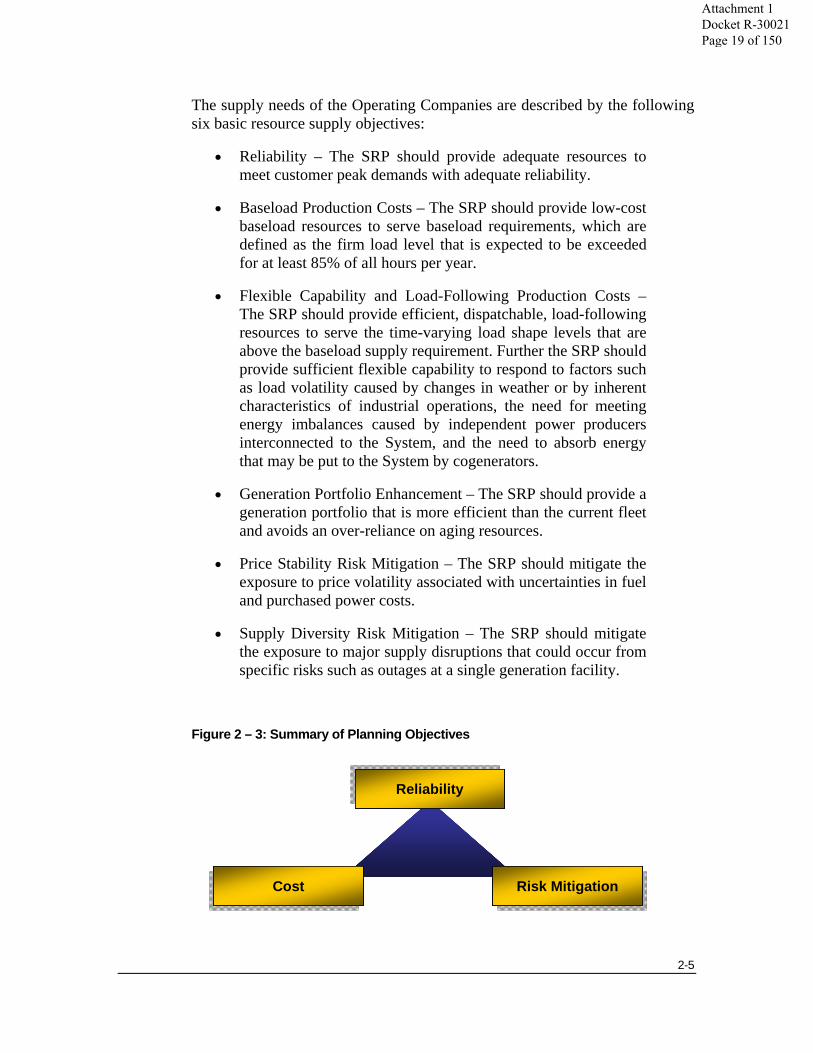
The supply needs of the Operating Companies are described by the following six basic resource supply objectives:
• Reliability – The SRP should provide adequate resources to meet customer peak demands with adequate reliability.
• Baseload Production Costs – The SRP should provide low-cost baseload resources to serve baseload requirements, which are defined as the firm load level that is expected to be exceeded for at least 85% of all hours per year.
• Flexible Capability and Load-Following Production Costs – The SRP should provide efficient, dispatchable, load-following resources to serve the time-varying load shape levels that are above the baseload supply requirement. Further the SRP should provide sufficient flexible capability to respond to factors such as load volatility caused by changes in weather or by inherent characteristics of industrial operations, the need for meeting energy imbalances caused by independent power producers interconnected to the System, and the need to absorb energy that may be put to the System by cogenerators.
• Generation Portfolio Enhancement – The SRP should provide a generation portfolio that is more efficient than the current fleet and avoids an over-reliance on aging resources.
• Price Stability Risk Mitigation – The SRP should mitigate the exposure to price volatility associated with uncertainties in fuel and purchased power costs.
• Supply Diversity Risk Mitigation – The SRP should mitigate the exposure to major supply disruptions that could occur from specific risks such as outages at a single generation facility.
Figure 2 – 3: Summary of Planning Objectives
Risk MitigationRisk Mitigation
ReliabilityReliability
CostCost Risk MitigationRisk Mitigation
ReliabilityReliability
CostCost
Attachment 1 Docket R-30021 Page 19 of 150
2-6
Environmental Considerations The planning process seeks to accomplish the planning objectives while considering utilization of natural resources and effects on the environment. The 2009 SRP Update considers the effects on the environment of resource alternatives, including renewable generation alternatives, and of resource portfolios in several ways, including:
• The process recognizes that environmental factors, for example legislation that imposes restrictions or costs on CO2 emissions, may have a direct effect on customer costs. The overall objective is to design a portfolio of resources that meet customers’ needs at the lowest reasonable cost. Determining what is reasonable requires considering risk and effects on the environment.
• The planning process considers the risk to reliability and cost associated with environmental concerns. For example, the process considers sensitivities associated with potential CO2 costs.
• The process assesses the implications of proposed portfolios on the use of natural resources and the effect on the environment by measuring key parameters such as:
• CO2 emissions,
• Natural gas use, and
• Coal consumption.
Such metrics provide information that may be useful in potential policy discussions with regulators. Further, in designing and implementing a portfolio of resources, preference is given to portfolios that provide greater benefit in terms of environmental effect and natural resource use to the extent consistent with the planning objectives.
Reliance on Long-term Resources The SRP envisions that each relevant planning level (System or standalone Operating Company) will maintain sufficient generating capacity to meet its reliability requirement, expressed as peak load plus an adequate provision for planning reserves. The SRP presumes that reliability requirements are met largely from long-term resources, whether owned assets or long-term power
Attachment 1 Docket R-30021 Page 20 of 150
2-7
purchase agreements. The emphasis on long-term resources mitigates exposure to price volatility and ensures the availability of resources sufficient to meet long-term reliability needs. Over-reliance on limited-term purchased power (i.e., power purchased for a one to five year term) exposes customers to risk associated with market price volatility and power availability. The SRP attempts to manage this risk by seeking to limit the amounts of limited-term purchased power used to meet reliability requirements.
The term “long-term resources” refers to owned resources or long-term (over ten years) power purchase contracts. In general, no distinction is made between owned resources and long-term contracted resources for planning purposes. In recent years, the Entergy System has met a portion of its reliability planning margin through the use of limited-term power purchase agreements. The 2009 SRP assumes a reasonable but limited reliance on limited-term capacity.
Multiple Planning Dimensions
Long-range planning for the Entergy Operating Companies involves multiple dimensions:
• System level
• Operating Company level, and
• Area level.
System Level The Entergy System is planned and operated as a single integrated electric system pursuant to the terms and conditions of the Entergy System Agreement.
Operating Company Level Portfolio Planning The SRP envisions that over time each Operating Company that operates as part of the Entergy System will move toward a portfolio of resources that matches the load-shape needs of its own customers. This principle remains valid for System planning purposes and, in the case of EAI and EMI, for planning for possible standalone operations. Consequently, SRP planning objectives and principles are appropriate for both Operating Company and System level resource planning.
Factors for Participation in Additional Resources The Entergy Operating Companies have adopted a set of factors to guide decisions regarding the allocation of long-term resource additions for the
Attachment 1 Docket R-30021 Page 21 of 150

2-8
Entergy System.1 The factors rest on the guiding principle that each Operating Company should, over time and consistent with the multi-year planning and procurement processes of the System, support a sufficient amount of generation available for coordinated economic dispatch for each supply role used to serve its load shape. Over time, application of that principle will result in a portfolio of resources that meets planning objectives and customers’ needs at the lowest reasonable cost. The factors are:
• Relative Total Production Cost – Operating Company participation in new resources should seek to maintain, over time, production cost trends consistent with rough production cost equalization of Operating Company total production costs relative to the System average total production costs.
• Peak Load +10% Reserve Capacity Deficit – Operating Company participation in new resources should consider each Operating Company’s longer-term portfolio with regard to providing a proportionate share of the resources that are expected to be used for overall System reliability and coordinated dispatch. The standard seeks to determine participation in new resources by considering those companies who have a “Peak +10% Reserve Capacity Deficit” based upon the Operating Company’s aggregate existing resources (excluding MSS-1 allocations) that are less than its peak load plus a minimum reserve level of 10%. The 10% reserve margin represents a guideline used solely for the purposes of Operating Company Portfolio Planning within the context of operation with the System. This guideline does not represent the reserve margin requirements for the System and standalone Operating Companies which are described in more detail in Chapter 7.
• Baseload Capacity Deficit – Operating Company participation in new baseload resources should consider each Operating
1 The factors that address matching the composition of each Operating Companies’ resource portfolio to the resource requirements suggested by that Companies’ load shape are applicable regardless of the number of Operating Companies that comprise the System. The Responsibility Ratio is a component of the System Agreement, and that short-term allocation factor would be applicable only to those Operating Companies that are participants in the System Agreement at the time that the allocation decision is to be in effect. The Relative Total Production Cost factor is also derived from the System Agreement, and will not be relevant to Operating Companies that leave the System Agreement following the separation of those Companies from the Agreement. Although the effects of long-term allocation decisions on the relative production costs for those Operating Companies that have announced that they will exit the System Agreement are a consideration in long-term allocation decisions, those effects are not determinative.
Attachment 1 Docket R-30021 Page 22 of 150
2-9
Company’s resource position with regard to having sufficient baseload generation resources to serve its baseload requirements. This “Baseload Capacity Deficit” is defined as the shortfall in baseload generation required to serve the firm load level that is expected for greater than 85% of annual hours.
• Load-following Resource Capacity Deficit – Operating Company participation in new load-following resources should consider each Operating Company’s resource position with regard to having sufficient load-following resources to serve its load requirements. The “Load-following Capacity Deficit” is defined as the shortfall in dispatchable load-following resources (typically provided by gas-fired generation, including combined cycle gas turbine (“CCGT) or combustion turbine (“CT”) generating units) that would be expected to be included in the System’s coordinated commitment and dispatch to serve the System’s load-following requirements.
• Responsibility Ratio – Operating Company participation in short-term resources acquired for System reliability and/or System economy purposes will typically be allocated on a Responsibility Ratio basis. Responsibility Ratio is a measure, defined in the System Agreement, of each Operating Company’s relative contribution to the System’s peak load.
• Supply Risks – Operating Company resource participation decisions should also consider supply resource diversity, seeking to reduce the reliability risks and price risks resulting from an Operating Company’s exposure to single contingency generation outages or from its exposure to generation supplied by a single resource, fuel type, or fuel supply source.
The relative importance of each factor may be influenced by specific facts and circumstances associated with each resource addition.
Area Planning Although the Entergy System performs resource planning on a System-wide basis, with the goal of meeting the planning objectives at the overall lowest reasonable cost, physical and operational practicalities dictate that regional reliability issues must be considered when planning for the reliable operation of the Entergy System. Thus, one aspect of the planning process is the development of planning studies to identify supply needs within specific geographic areas of some Operating Companies, evaluate supply options to meet those needs, and establish targeted regional supply portfolios.
Attachment 1 Docket R-30021 Page 23 of 150
2-10
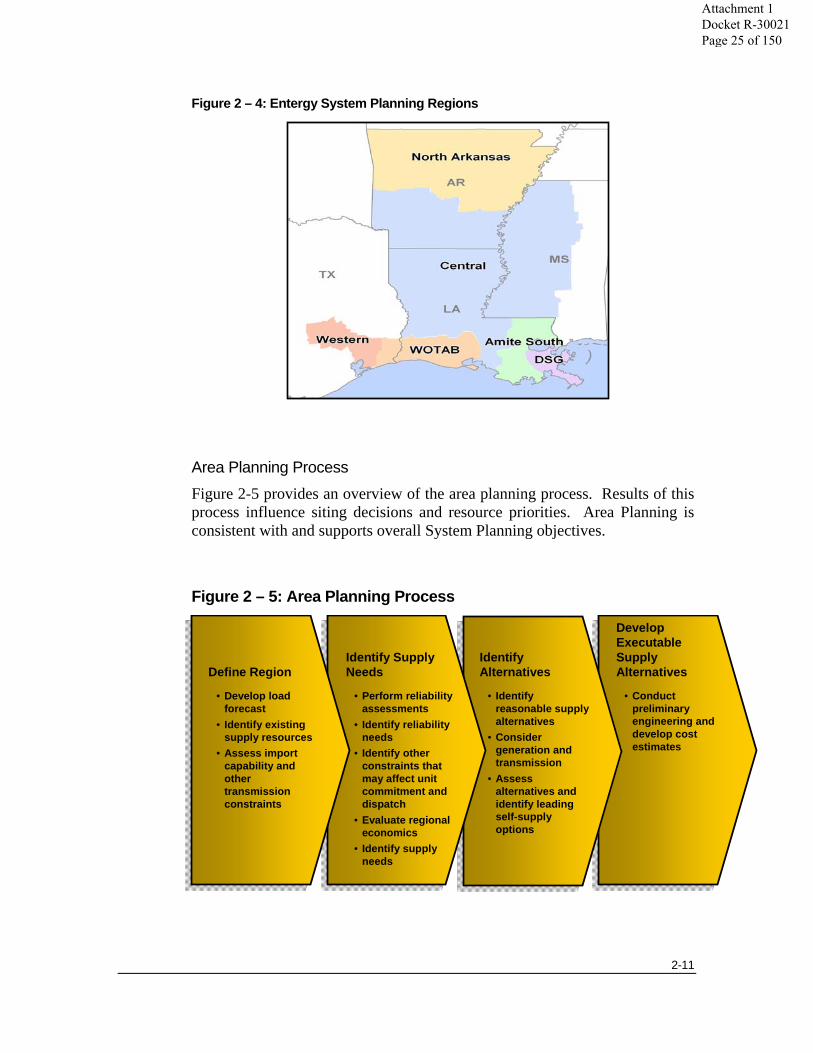
Planning Areas For planning purposes, the region served by the Entergy Operating Companies is divided into four major planning areas and two sub-areas which are determined based on characteristics of the Entergy System including the ability to transfer power between areas as defined by the available transfer capability, the location and amount of load, and the location and amount of generation.
The four major planning areas and two sub-areas are described generally as follows:
• North Arkansas – the northern portion of Arkansas generally north of Sheridan, Arkansas.
• WOTAB – west of the Atchafalaya Basin, the area generally west of the Baton Rouge, Louisiana metropolitan area, to the westernmost portion of Entergy’s service territory in Texas. The westernmost portion of WOTAB is the Western area (a sub-area), which encompasses the westernmost part of ETI’s service territory, generally west of the Trinity River.
• Amite South – the area generally from east of the Baton Rouge, Louisiana metropolitan area to the Mississippi state line and south to the Gulf of Mexico. The Southeast portion of the Amite South area is known as the Downstream of Gypsy (“DSG”) area (a sub-area) and generally encompasses down river of the Little Gypsy plant including metropolitan New Orleans east to the Mississippi state line and south to the Gulf of Mexico.
• Central – the area generally south of the North Arkansas area and north of the WOTAB and Amite South areas, but includes the Baton Rouge, Louisiana metropolitan area.
Attachment 1 Docket R-30021 Page 24 of 150
2-11
Figure 2 – 4: Entergy System Planning Regions
Area Planning Process Figure 2-5 provides an overview of the area planning process. Results of this process influence siting decisions and resource priorities. Area Planning is consistent with and supports overall System Planning objectives.
Figure 2 – 5: Area Planning Process
• Conduct preliminary engineering and develop cost estimates
• Identify reasonable supply alternatives
• Consider generation and transmission
• Assess alternatives and identify leading self-supply options
• Perform reliability assessments
• Identify reliability needs
• Identify other constraints that may affect unit commitment and dispatch
• Evaluate regional economics
• Identify supply needs
• Develop load forecast
• Identify existing supply resources
• Assess import capability and other transmission constraints
Develop ExecutableSupply Alternatives
Identify Alternatives
Identify Supply NeedsDefine Region
Attachment 1 Docket R-30021 Page 25 of 150
2-12
FERC Order 717
In 2008, FERC issued Order No. 717 which changed the standards of conduct governing interaction between Entergy Transmission (the entity within ESI that is functionally responsible for transmission) and the SPO. FERC Order No. 717 allows greater levels of communication between Entergy Transmission and SPO regarding integrated resource planning matters. One effect of this Order is to enable integrated long-term planning efforts between Entergy Transmission and SPO.
Prior to Order 717, the FERC required a separation between transmission and “marketing” functions. In that regime, planning, acquiring, or building new supply-side resources for the Entergy System were considered to be marketing functions. Integration between long-term supply planning and long-term transmission planning was limited as a result of the prior standards of conduct, other than the limited amount of information that was available via OASIS postings. The separation between Entergy Transmission and the SPO resulted in significant restrictions that limited the ability to plan the Entergy System on an integrated basis.
In accordance with Order 717, SPO and Entergy Transmission have initiated an effort to develop integrated planning processes. The goal of the effort is to produce more comprehensive integrated plans for the Entergy System that include consistent with Order 717, consideration of all aspects of various transmission and supply alternatives.
FERC’s Order No. 717 presents an opportunity for a more integrated approach that properly considers transmission and generation resources and better assesses the tradeoffs and synergies that might be realized.
Analytical Methods
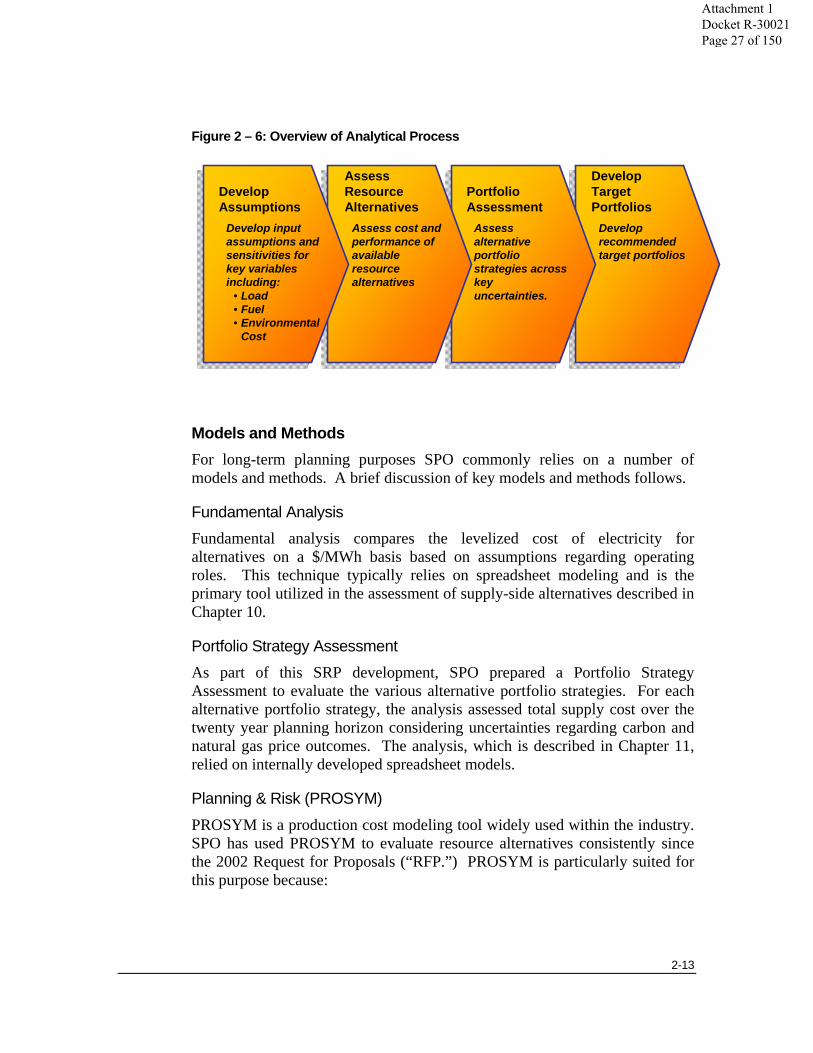
The SRP Update incorporated a range of analytical techniques to identify portfolio requirements, compare resource alternatives, assess alternative portfolio strategies, and develop planning scenarios. Analysis included both qualitative and quantitative techniques. The latter included both deterministic approaches, for example sensitivity analysis, and probability tools. Figure 2-6 provides and overview of the analytical process.
Attachment 1 Docket R-30021 Page 26 of 150
2-13
Figure 2 – 6: Overview of Analytical Process
Models and Methods For long-term planning purposes SPO commonly relies on a number of models and methods. A brief discussion of key models and methods follows.
Fundamental Analysis Fundamental analysis compares the levelized cost of electricity for alternatives on a $/MWh basis based on assumptions regarding operating roles. This technique typically relies on spreadsheet modeling and is the primary tool utilized in the assessment of supply-side alternatives described in Chapter 10.
Portfolio Strategy Assessment As part of this SRP development, SPO prepared a Portfolio Strategy Assessment to evaluate the various alternative portfolio strategies. For each alternative portfolio strategy, the analysis assessed total supply cost over the twenty year planning horizon considering uncertainties regarding carbon and natural gas price outcomes. The analysis, which is described in Chapter 11, relied on internally developed spreadsheet models.
Planning & Risk (PROSYM) PROSYM is a production cost modeling tool widely used within the industry. SPO has used PROSYM to evaluate resource alternatives consistently since the 2002 Request for Proposals (“RFP.”) PROSYM is particularly suited for this purpose because:
Develop recommended target portfolios
Assess alternative portfolio strategies across key uncertainties.
Assess cost and performance of available resource alternatives
Develop input assumptions and sensitivities for key variables including:
• Load• Fuel• Environmental
Cost
Develop Target Portfolios
Portfolio Assessment
Assess Resource Alternatives
Develop Assumptions
Attachment 1 Docket R-30021 Page 27 of 150

2-14
• It has a reasonable processing time that enables long-term analysis;
• It requires a level of detail that is appropriate for longer-term resource planning; and
• It has a proven track record.
SPO anticipates continuing to use the PROSYM model for long-term planning and resource selection.
Attachment 1 Docket R-30021 Page 28 of 150

3-1
. . . . . . .. . . Chapter 3
Load Forecast Process and Projections
Overview
This chapter discusses the long-term load forecast used for the 2009 SRP Update and describes the following:
• The forecasting methodology;
• Historic load growth trends;
• The Reference Case Load Forecast; and
• Other load forecast sensitivities prepared for the 2009 SRP Update.
Forecasting Methodology
The load forecasting process results in a 20-year, hour-by-hour load forecast for each of the Entergy Operating Companies. The Operating Company load forecasts can then be combined to determine the Entergy System load forecast.
The preparation of the long-term load forecast involves two distinct and sequential processes: electric sales forecasting and then load forecasting. The first process, sales forecasting, involves the preparation of the Retail Energy Forecast and the Wholesale Energy Forecast. Entergy’s Sales & Marketing Department prepares a Retail Energy Forecast for each Operating Company using econometric forecasting techniques. Although the percentage fluctuates, retail energy sales make up about 95% of total energy sales. Simultaneously, the Wholesale Marketing Department prepares a Wholesale Energy Forecast for each wholesale customer. In the second process, load forecasting, System Planning & Operations (“SPO”) converts the two sales forecasts into a 20-year, hour-by-hour load forecast.
Sales Forecasting The Retail Energy Forecast is developed using an econometric model developed by Itron, Inc., a metering and consulting services company that
Attachment 1 Docket R-30021 Page 29 of 150
3-2
produces the MetrixND® and MetrixLT™ software. MetrixND® incorporates a regression analysis that uses various national, state, and local variables as drivers. Retail energy sales are forecast for each month at the revenue class level for residential, commercial, industrial and governmental customers. Sales forecasts for each revenue class, at each Operating Company, are derived from separate usage per customer (“UPC”) estimates and separate customer count models, the outputs of which are multiplied together to produce total gigawatt-hour sales. The key drivers for the UPC models are generally gross area economic output (similar to national gross domestic product) or real income, while the customer count models are typically based on drivers such as population or household growth. Key macroeconomic inputs are supplied by Moody’s economy.com.
Electric energy sales for the Operating Companies’ largest industrial customers (approximately 150 customers) are forecasted individually based on the account-specific information. Some industrial customers receive electric service under interruptible service (“IS”) rates that allow the Operating Companies to curtail load at certain times. Customers with IS contracts are identified and their hourly load shape is aggregated to the Operating Company level. Thus, the hourly load forecast is generated both at the total load level and at the firm load level.
The Wholesale Energy Forecast is prepared for individual wholesale customers. Each wholesale customer is assigned an appropriate load shape or in some cases, multiple load shapes, depending on the contractual agreement and the customer class composition of the wholesale load.
Load Forecasting SPO uses computer software from Itron to develop a 20-year, hour-by-hour load forecast. The MetrixLT™ and MetrixND® software programs are used widely in the utility industry, to the point where they may be considered an industry standard for energy forecasting, weather normalization, and hourly load and peak load forecasting.
To develop the load forecast, SPO allocates the Retail Energy Forecast (by month) and the Wholesale Energy Forecast (by month) to each hour of a 20-year period based on historical load shapes developed by Entergy Services, Inc.’s (“ESI”) Load Research Department. Ten-year “typical weather” is used to convert historic load shapes into “typical load shapes”. For example, if the actual sales for an Operating Company’s residential customers occurred during very hot weather conditions, the typical load shape would flatten the historic load shape. If the actual weather was mild, the typical load shape would raise the historic load shape. Each customer class in each Operating Company responds differently to weather, so each has its own weather response function. MetrixND® is used to adjust the historical load shapes by
Attachment 1 Docket R-30021 Page 30 of 150

3-3
typical weather and MetrixLT™ is used to create the 20-year, hourly load forecast.
Load Trends: Historic and Forecasted
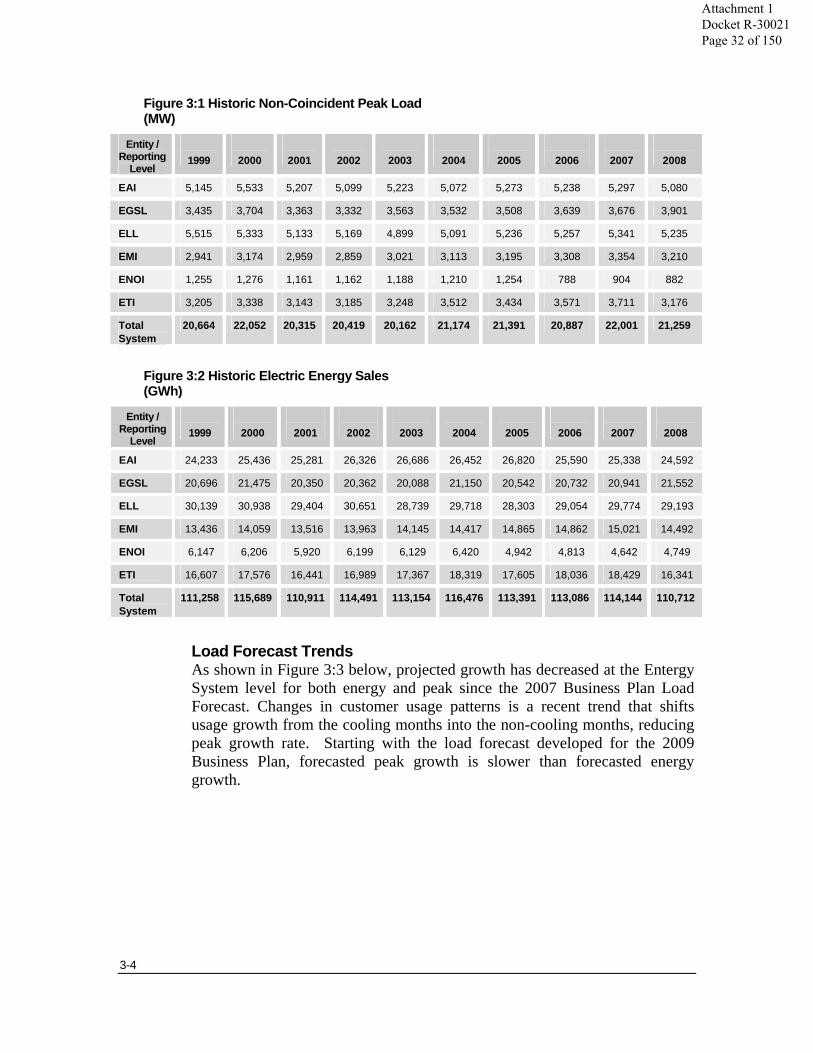
Historic Peak Load Figure 3:1 below contains ten years of actual, non-coincident peak load for each Operating Company, as well as for the Entergy System. Figure 3:2 below contains ten years of actual electric energy sales. The all-time peak load for the Entergy Electric System occurred in August 2000 with 22,052 MW. Since 2000, relatively mild weather in several years, changes in the customer base, and changes in customer usage patterns have held peak loads below this level.
• The nature of some Operating Company’s industrial base creates opportunities for cogeneration projects. Since 2000, about 4 GW of cogeneration has been installed; however lost load for Operating Companies is only a portion of this amount.
• Changing global economic conditions have led to the permanent closing of some industrial plants. In particular, several ammonia manufacturers that formerly were customers of one or more of the Operating Companies have shut down permanently.
• Changes in regulations have led to increased alternatives for wholesale customers. Several wholesale agreements were not renewed at the end of their contract period.
• The deployment of more efficient air conditioners and other customer actions to increase energy efficiency have suppressed residential and commercial customer usage in peak times even as customer use of electricity in non-peak hours has continued to increase slowly. Energy efficiency is expected to continue to affect load growth.
• Hurricanes Katrina and Rita hit the region in 2005 and three years later, Hurricanes Gustav and Ike struck. Each hurricane resulted in an immediate reduction in electric usage. Hurricane Katrina is expected to have the most significant long-term impact, with sustained load loss in the greater New Orleans area.
Attachment 1 Docket R-30021 Page 31 of 150
3-4
Figure 3:1 Historic Non-Coincident Peak Load (MW)
Entity / Reporting
Level
1999
2000
2001
2002
2003
2004
2005
2006
2007
2008
EAI 5,145 5,533 5,207 5,099 5,223 5,072 5,273 5,238 5,297 5,080
EGSL 3,435 3,704 3,363 3,332 3,563 3,532 3,508 3,639 3,676 3,901
ELL 5,515 5,333 5,133 5,169 4,899 5,091 5,236 5,257 5,341 5,235
EMI 2,941 3,174 2,959 2,859 3,021 3,113 3,195 3,308 3,354 3,210
ENOI 1,255 1,276 1,161 1,162 1,188 1,210 1,254 788 904 882
ETI 3,205 3,338 3,143 3,185 3,248 3,512 3,434 3,571 3,711 3,176
Total System
20,664 22,052 20,315 20,419 20,162 21,174 21,391 20,887 22,001 21,259
Figure 3:2 Historic Electric Energy Sales (GWh)
Entity / Reporting
Level
1999
2000
2001
2002
2003
2004
2005
2006
2007
2008
EAI 24,233 25,436 25,281 26,326 26,686 26,452 26,820 25,590 25,338 24,592
EGSL 20,696 21,475 20,350 20,362 20,088 21,150 20,542 20,732 20,941 21,552
ELL 30,139 30,938 29,404 30,651 28,739 29,718 28,303 29,054 29,774 29,193
EMI 13,436 14,059 13,516 13,963 14,145 14,417 14,865 14,862 15,021 14,492
ENOI 6,147 6,206 5,920 6,199 6,129 6,420 4,942 4,813 4,642 4,749
ETI 16,607 17,576 16,441 16,989 17,367 18,319 17,605 18,036 18,429 16,341
Total System
111,258 115,689 110,911 114,491 113,154 116,476 113,391 113,086 114,144 110,712
Load Forecast Trends As shown in Figure 3:3 below, projected growth has decreased at the Entergy System level for both energy and peak since the 2007 Business Plan Load Forecast. Changes in customer usage patterns is a recent trend that shifts usage growth from the cooling months into the non-cooling months, reducing peak growth rate. Starting with the load forecast developed for the 2009 Business Plan, forecasted peak growth is slower than forecasted energy growth.
Attachment 1 Docket R-30021 Page 32 of 150

3-5
Figure 3:3 Forecast 10-Year Compound Annual Growth Rates (Entergy System)
Peak
Energy
2009 SRP Update 1.2% 1.4%
2009 Business Plan 1.2% 1.4%
2008 Business Plan 1.6% 1.6%
2007 Business Plan 1.8% 1.7%
Load Forecast
To support planning across a variety of scenarios, SPO develops load forecasts both higher and lower than the Reference Case. In this document, the Reference Case Load Forecast is discussed below and alternative cases are discussed in the next section describing sensitivities and uncertainties.
Reference Case The Reference Case Load Forecast assumes an economic recession affecting all customer classes in the short term, followed by moderate residential and commercial load growth. The industrial customer class is more negatively affected by the economic recession in the short-term and is slower to recover.
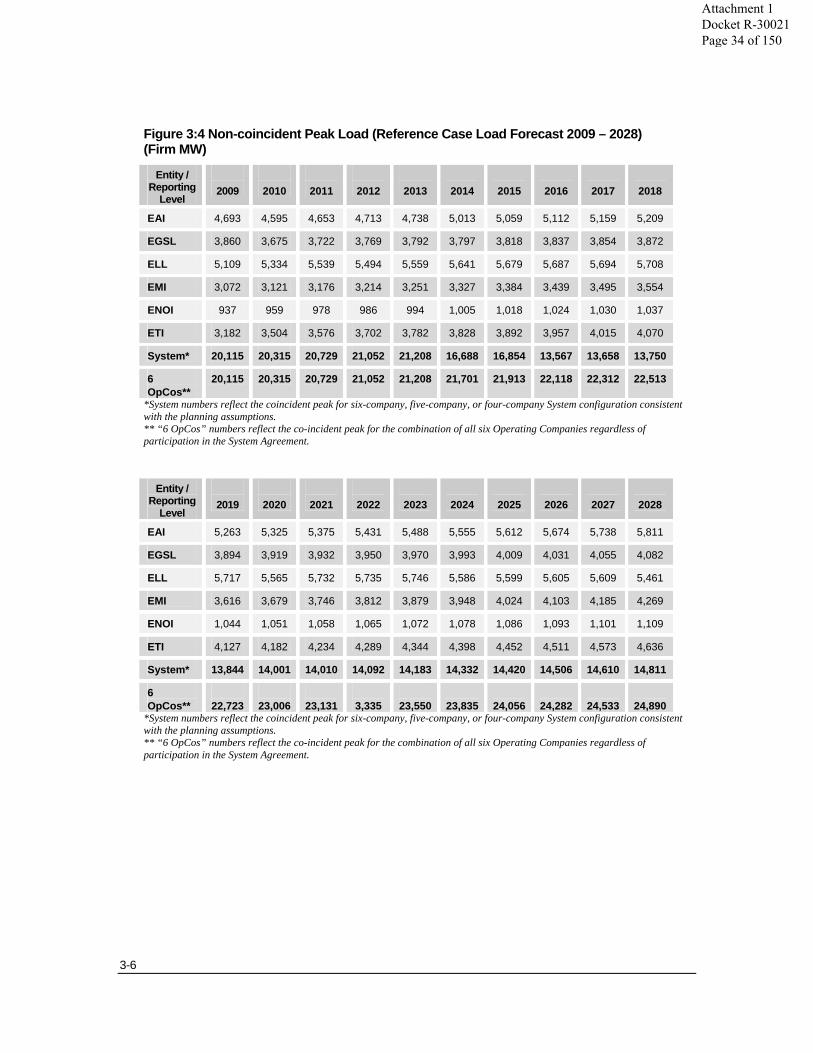
• The coincident peak load for the six Operating Companies is projected to grow to 22,513 MW by 2018. The 2009 SRP Update forecasts a compound annual peak growth rate of 1.2% per year over this 10-year timeframe and a compound annual peak growth rate of 1.1% over a 20-year planning horizon. Projected non-coincident peak loads by Operating Company, and the co-incident peaks for the Entergy System and the combination of the six Operating Companies are presented in Figure 3:4.
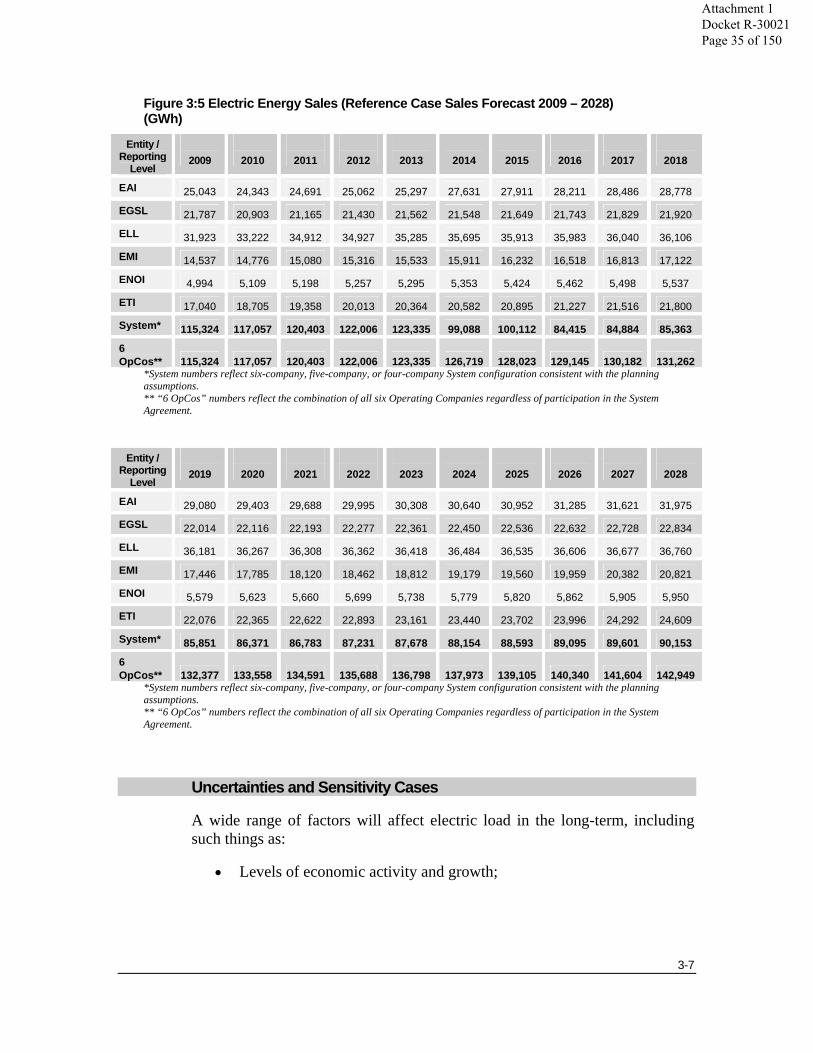
• Energy growth for the Entergy Operating Companies is expected to be 1.4% per year from 2009 to 2018 with about a 66% load factor. Over a 20-year period, electric sales growth is about 1.0 to 1.2% per year. Projected electric energy sales by Operating Company, for the Electric System, and for the combination of the six Operating Companies are found in Figure 3:5.
Attachment 1 Docket R-30021 Page 33 of 150
3-6
Figure 3:4 Non-coincident Peak Load (Reference Case Load Forecast 2009 – 2028) (Firm MW)
Entity / Reporting
Level
2009
2010
2011
2012
2013
2014
2015
2016
2017
2018
EAI 4,693 4,595 4,653 4,713 4,738 5,013 5,059 5,112 5,159 5,209
EGSL 3,860 3,675 3,722 3,769 3,792 3,797 3,818 3,837 3,854 3,872
ELL 5,109 5,334 5,539 5,494 5,559 5,641 5,679 5,687 5,694 5,708
EMI 3,072 3,121 3,176 3,214 3,251 3,327 3,384 3,439 3,495 3,554
ENOI 937 959 978 986 994 1,005 1,018 1,024 1,030 1,037
ETI 3,182 3,504 3,576 3,702 3,782 3,828 3,892 3,957 4,015 4,070
System* 20,115 20,315 20,729 21,052 21,208 16,688 16,854 13,567 13,658 13,750
6 OpCos**
20,115 20,315 20,729 21,052 21,208 21,701 21,913 22,118 22,312 22,513
*System numbers reflect the coincident peak for six-company, five-company, or four-company System configuration consistent with the planning assumptions. ** “6 OpCos” numbers reflect the co-incident peak for the combination of all six Operating Companies regardless of participation in the System Agreement.
Entity / Reporting
Level
2019
2020
2021
2022
2023
2024
2025
2026
2027
2028
EAI 5,263 5,325 5,375 5,431 5,488 5,555 5,612 5,674 5,738 5,811
EGSL 3,894 3,919 3,932 3,950 3,970 3,993 4,009 4,031 4,055 4,082
ELL 5,717 5,565 5,732 5,735 5,746 5,586 5,599 5,605 5,609 5,461
EMI 3,616 3,679 3,746 3,812 3,879 3,948 4,024 4,103 4,185 4,269
ENOI 1,044 1,051 1,058 1,065 1,072 1,078 1,086 1,093 1,101 1,109
ETI 4,127 4,182 4,234 4,289 4,344 4,398 4,452 4,511 4,573 4,636
System* 13,844 14,001 14,010 14,092 14,183 14,332 14,420 14,506 14,610 14,811
6 OpCos**
22,723
23,006
23,131
3,335
23,550
23,835
24,056
24,282
24,533
24,890
*System numbers reflect the coincident peak for six-company, five-company, or four-company System configuration consistent with the planning assumptions. ** “6 OpCos” numbers reflect the co-incident peak for the combination of all six Operating Companies regardless of participation in the System Agreement.
Attachment 1 Docket R-30021 Page 34 of 150
3-7
Figure 3:5 Electric Energy Sales (Reference Case Sales Forecast 2009 – 2028) (GWh)
Entity / Reporting
Level
2009
2010
2011
2012
2013
2014
2015
2016
2017
2018
EAI 25,043 24,343 24,691 25,062 25,297 27,631 27,911 28,211 28,486 28,778
EGSL 21,787 20,903 21,165 21,430 21,562 21,548 21,649 21,743 21,829 21,920
ELL 31,923 33,222 34,912 34,927 35,285 35,695 35,913 35,983 36,040 36,106
EMI 14,537 14,776 15,080 15,316 15,533 15,911 16,232 16,518 16,813 17,122
ENOI 4,994 5,109 5,198 5,257 5,295 5,353 5,424 5,462 5,498 5,537
ETI 17,040 18,705 19,358 20,013 20,364 20,582 20,895 21,227 21,516 21,800
System* 115,324 117,057 120,403 122,006 123,335 99,088 100,112 84,415 84,884 85,363
6 OpCos** 115,324 117,057 120,403 122,006 123,335 126,719 128,023 129,145 130,182 131,262
*System numbers reflect six-company, five-company, or four-company System configuration consistent with the planning assumptions. ** “6 OpCos” numbers reflect the combination of all six Operating Companies regardless of participation in the System Agreement.
Entity / Reporting
Level
2019
2020
2021
2022
2023
2024
2025
2026
2027
2028
EAI 29,080 29,403 29,688 29,995 30,308 30,640 30,952 31,285 31,621 31,975
EGSL 22,014 22,116 22,193 22,277 22,361 22,450 22,536 22,632 22,728 22,834
ELL 36,181 36,267 36,308 36,362 36,418 36,484 36,535 36,606 36,677 36,760
EMI 17,446 17,785 18,120 18,462 18,812 19,179 19,560 19,959 20,382 20,821
ENOI 5,579 5,623 5,660 5,699 5,738 5,779 5,820 5,862 5,905 5,950
ETI 22,076 22,365 22,622 22,893 23,161 23,440 23,702 23,996 24,292 24,609
System* 85,851 86,371 86,783 87,231 87,678 88,154 88,593 89,095 89,601 90,153
6 OpCos** 132,377 133,558 134,591 135,688 136,798 137,973 139,105 140,340 141,604 142,949
*System numbers reflect six-company, five-company, or four-company System configuration consistent with the planning assumptions. ** “6 OpCos” numbers reflect the combination of all six Operating Companies regardless of participation in the System Agreement.
Uncertainties and Sensitivity Cases
A wide range of factors will affect electric load in the long-term, including such things as:
• Levels of economic activity and growth;
Attachment 1 Docket R-30021 Page 35 of 150
3-8
• The potential for technological change to affect the efficiency of electric consumption;
• Potential changes in the purposes for which customers use electricity (for example, the adoption of electric vehicles);
• The potential adoption of end-use (behind-the-meter) self-generation technologies (for example, roof top solar panels); and
• The level of energy efficiency and conservation measures adopted by customers.
Such factors may affect both the level and shape of load in the future. Peak loads may be higher or lower than projected levels. Similarly, load factors may be higher or lower than currently projected. Uncertainties in load will affect both the amount and type of resources required to meet customer needs in the future.
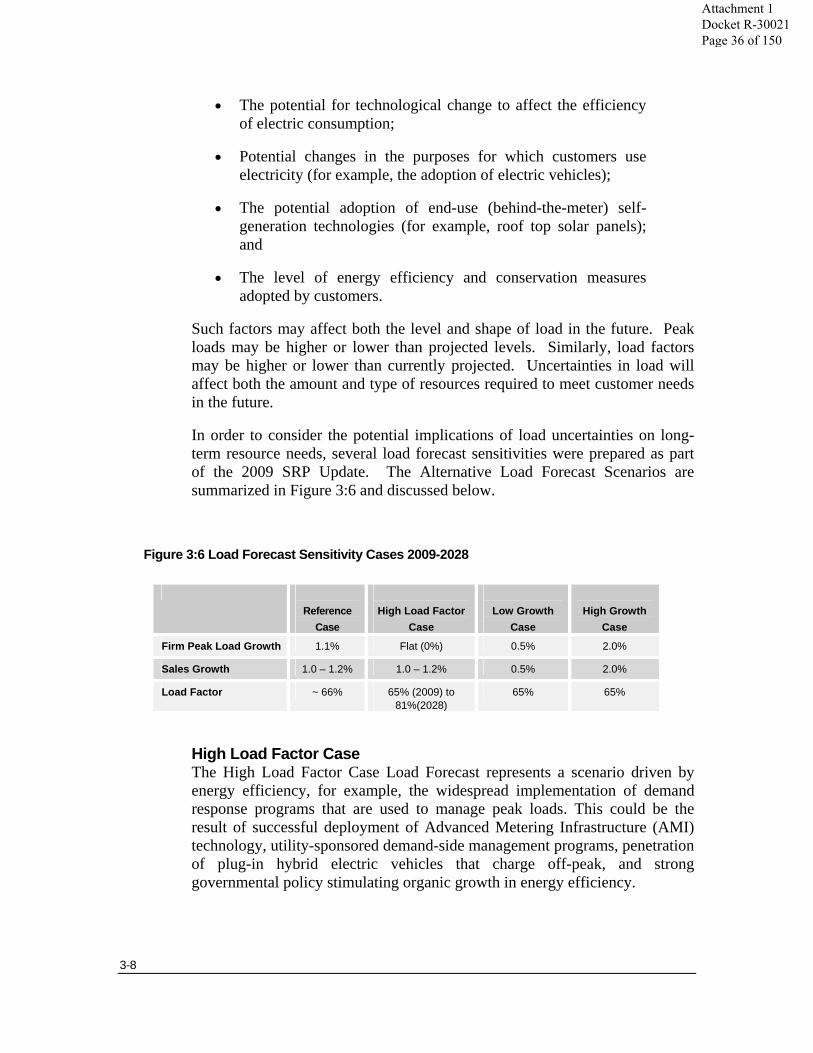
In order to consider the potential implications of load uncertainties on long-term resource needs, several load forecast sensitivities were prepared as part of the 2009 SRP Update. The Alternative Load Forecast Scenarios are summarized in Figure 3:6 and discussed below.
Figure 3:6 Load Forecast Sensitivity Cases 2009-2028
Reference
Case
High Load Factor
Case
Low Growth
Case
High Growth
Case
Firm Peak Load Growth 1.1% Flat (0%) 0.5% 2.0%
Sales Growth 1.0 – 1.2% 1.0 – 1.2% 0.5% 2.0%
Load Factor ~ 66% 65% (2009) to 81%(2028)
65% 65%
High Load Factor Case The High Load Factor Case Load Forecast represents a scenario driven by energy efficiency, for example, the widespread implementation of demand response programs that are used to manage peak loads. This could be the result of successful deployment of Advanced Metering Infrastructure (AMI) technology, utility-sponsored demand-side management programs, penetration of plug-in hybrid electric vehicles that charge off-peak, and strong governmental policy stimulating organic growth in energy efficiency.
Attachment 1 Docket R-30021 Page 36 of 150
3-9
The High Load Factor Load Forecast projects no peak load growth over the 20-year planning horizon. The total energy is projected to grow at the same rate as in the Reference Case, about 1.1%, resulting in a load factor of 65% in 2009 increasing to 81% in 2028.
Low Growth Case The Low Growth Case Load Forecast is based on assumptions of long-term economic slowdown and moderate implementation of energy efficiency. Large reductions in wholesale contracts as well as reductions in sales to the Top 150 industrial accounts also contribute to a reduction in overall sales growth.
The Low Growth Load Forecast projects firm peak load growth to average 0.5% per year. Total energy growth is also projected to average about 0.5% per year. The load factor is unchanged from the Reference Case at about 65%.
High Growth Case The High Growth Case Load Forecast represents a scenario of sustained growth for the residential, commercial and industrial customer classes. This growth could be attributed to a generally strong economy and/or to a new electric-dependent technology, such as plug-in hybrid electric vehicles.
The High Growth Load Forecast projects firm peak load growth to average 2.0% per year. Energy growth is also projected to average 2.0% per year with a load factor of 65%.
Attachment 1 Docket R-30021 Page 37 of 150
4-1
. . . . . . .. . . Chapter 4
Natural Gas Outlook A Non-conventional Future
Overview
The forecast of long-term natural gas prices is a major input into the SRP process. While the 2009 SRP Update requires forecasts for all fuel types, long-term natural gas prices are a particularly important driver for long-term planning for the following reasons:
• Most of the Entergy Operating Companies depend heavily on natural gas as a fuel. Chapter 8 provides an overview of the current resource portfolio including the fuel mix. Reliance on natural gas means that overall supply cost depends on natural gas price levels.
• The marginal cost of energy in the wholesale power market is largely set by natural gas-fired facilities. Therefore, wholesale power prices are determined in large part by the price of natural gas. The link between wholesale power and gas prices is a particularly important consideration for the Entergy System, because as described in Chapter 6, the Entergy Operating Companies rely on purchased power for over a third of their energy needs.
• Long-term natural gas prices are a determinant of the relative economics of incremental resource alternatives and therefore affect technology choices and portfolio design considerations. Given current cost and performance assumptions, modern combined cycle gas turbine (“CCGT”) technology represents the basic portfolio building block.
• Recent events in the North American natural gas market have resulted in changes in the long-term outlook for natural gas prices. In particular, the emergence of “non-conventional” gas as a source of economically attractive natural gas has altered the long-term perspective regarding natural gas prices.
Attachment 1 Docket R-30021 Page 38 of 150
4-2
This chapter discusses:
• The process for preparing the long-term gas forecast used in the 2009 SRP Update;
• Current conditions and drivers in the natural gas market and expectations for the future;
• The forecasted long-term natural gas price levels used in the 2009 SRP Update; and
• Uncertainties that may affect long-term gas price levels.
Forecasting Methodology
Overview System Planning and Operations (“SPO”) prepares the natural gas price forecast used in the 2009 SRP Update. This forecast is updated at least annually, but may be updated more often if circumstances require. A more detailed discussion of the forecasting process is provided in the section that follows. The forecasting process includes the following elements:
• Information regarding actual traded markets, for example NYMEX (formerly known as the New York Mercantile Exchange) futures contracts;
• Third party forecasts, including those of leading energy consulting firms; and
• Multiple forecast sensitivities to recognize the uncertainties in long-term pricing.
Forecasting Methodology A good indication of future natural gas prices, at least in the near term, is provided by NYMEX futures contracts. NYMEX futures contracts, at least in the near term, are a liquid market for a standardized product delivered to the Henry Hub (which is a market trading center located near Erath, Louisiana). Such traded markets can be seen as highly indicative of the expectations of actual market participants regarding future prices. Therefore, in the short-term (generally 60 months), the natural gas forecast is based on NYMEX forward Henry Hub gas prices.
The NYMEX futures market becomes increasingly less liquid in months further away from the current month. That means that far fewer contracts are traded for natural gas to be delivered six years from now than for gas to be
Attachment 1 Docket R-30021 Page 39 of 150

4-3
delivered next month. Without substantial trade volumes, the ability of NYMEX futures prices to provide a reliable view of future gas prices is limited. In recognition of this, the long-term natural gas price forecast is based on a point-of-view (“POV”) prepared by SPO. To prepare the long-term POV, SPO considers reports and research prepared by a number of independent experts in energy, as well as additional information that may be available concerning market fundamentals.
North American Natural Gas Market
The United States is a large consumer of natural gas. In 2008, the United States used about 23.5 trillion cubic feet (“TCF”) of natural gas, making it one of the worldwide leaders in natural gas consumption. According to the Energy Information Administration's (“EIA”) International Energy Outlook, the United States typically accounts for 20 to 25 percent of total worldwide consumption of natural gas.
In order to meet the demand for natural gas, the United States relies on domestic production, imports of dry gas, and imports of liquefied natural gas (“LNG”). Most of the natural gas consumed in the United States is produced domestically, with the balance of dry natural gas imported mainly from Canada and Mexico. Imports of LNG also serve to meet the growing demand for natural gas in the United States. In addition to domestic production and imports, natural gas in storage ensures that demand for natural gas in the United States is satisfied throughout the year.
Recent Developments in North American Natural Gas For the decade prior to 2000, natural gas prices averaged below $3.00/mmBtu (2006$). From 2000 through May 2007, prices increased to an average of about $6.00/mmBtu (2006$). This rise in prices reflected increasing natural gas demand, primarily in the power sector, and increasing tight supplies. The upward trend in natural gas prices continued into the summer of 2008 when Henry Hub prices reached a high of $13.32/mmBtu (nominal$). Since that time, natural gas prices have declined sharply, with recent Henry Hub prices at $3.54/mmBtu (NYMEX settlement for June 2009; nominal$). The decline in natural gas prices since the summer of 2008 reflects, in part, a reduction in demand resulting from the downturn in the U.S. economy; however, the decline also reflects other factors that affect long-term gas prices.
The most significant of these factors relates to the increasing importance of non-conventional gas production. Non-conventional gas production involves the extraction of gas from sources that previously were non-economic or difficult to reach. During 2008, a seismic shift in the North American gas market occurred as non-conventional sources emerged as significant sources
Attachment 1 Docket R-30021 Page 40 of 150

4-4
of supply for the domestic market. While the existence of non-conventional natural gas deposits within North America was well established prior to this time, the ability to extract supplies economically in large volumes was not.
Figure 4:1 Historical Natural Gas Prices and Volatility (Real 2006$/MMBtu)
0.00
2.00
4.00
6.00
8.00
10.00
12.00
14.00
16.00
Jan-
89Ja
n-90
Jan-
91Ja
n-92
Jan-
93Ja
n-94
Jan-
95Ja
n-96
Jan-
97Ja
n-98
Jan-
99Ja
n-00
Jan-
01Ja
n-02
Jan-
03Ja
n-04
Jan-
05Ja
n-06
Jan-
07Ja
n-08
Jan-
09
Rea
l 200
6$/M
MB
tu
1989-1995Mean = $2.39
1996-1999Mean = $2.92
June 2007- Feb 2009 Mean = $7.42
2000- May 2007Mean = $5.98
Natural gas is found in underground reservoirs and is commonly located with oil deposits. Historically, tapping into these conventional natural gas deposits has been the most practical, and easiest, source of natural gas. More recently, due to advances in technology and geological knowledge, non-conventional natural gas deposits are beginning to make up an increasing share of the supply picture. The Natural Gas Supply Association describes major categories of non-conventional gas as follows:
• Deep Natural Gas is natural gas that exists in deposits very far underground, beyond conventional drilling depths. This gas is typically 15,000 feet or more underground, quite a bit deeper than conventional gas deposits, which are traditionally only a few thousand feet deep, at most.
• Tight Natural Gas is trapped in very tight underground formations, including hard rock or sandstone or limestone that is unusually impermeable and non-porous.
• Shale Gas is formed in the mud of shallow seas that existed about 350 million years ago. Shale is a very fine-grained sedimentary rock, which is easily broken into thin, parallel layers.
Attachment 1 Docket R-30021 Page 41 of 150

4-5
• Coalbed Methane is trapped underground along coal seams. Historically, coalbed methane was considered a nuisance in the coal mining industry and was intentionally vented into the atmosphere.
Technology, such as hydraulic fracturing and horizontal drilling, has made non-conventional gas an increasingly important component of domestic gas production. The recent success of non-conventional gas exploration techniques has altered the supply-side fundamentals such that there now is an expectation of increased supplies of economically priced natural gas in the long-run. For example, from 2001 to 2008, shale gas production in the lower 48 states increased from 1.1 billion cubic feet per day (BCF/D) to 6.1 BCF/D, an increase of more than 450%.
Major active shale gas development in the Greater Midcontinent area include the Barnett Shale in the Forth Worth Basin in north central Texas, Fayetteville Shale in Arkansas, Woodford Shale in Oklahoma, and the emerging Haynesville Shale development centered in northern Louisiana. Outside the Midcontinent, shale gas is developing in Appalachia (Utica, Huron and the Marcellus Shale), the Northern Rockies, and British Columbia (Muskwa Shale in Horn River Basin).
Natural Gas Forecast
The long-term natural gas forecast used in this 2009 SRP Update includes sensitivities for high, low, and expected natural gas prices. Figures 4-2 and 4-3 summarize the natural gas forecast in nominal and real dollars.
• SPO’s low case forecast predicts gas prices will be at five dollars (2008$) for five years, and then will grow at a rate slightly above one percent per year.
• SPO’s high case predicts gas prices will be two dollars (real) above the price of residual fuel oil. This case represents a persistent gas supply shortage that pushes gas prices above a substitute fuel.
• SPO’s expected case is based on a weighted average of the reference, high, and low cases. The expected case is used for probability-based analysis.
Attachment 1 Docket R-30021 Page 42 of 150

4-6
Figure 4:2 Natural Gas Price Forecast (Nominal $/MMBtu)
Weighting
2009
2010
2015
2020
2025
2030
Reference 60% $6.04 $7.13 $8.89 $10.06 $11.39 $12.89
High 10% $7.59 $9.76 $14.61 $18.39 $22.12 $26.65
Low 30% $5.49 $5.19 $5.73 $6.88 $8.25 $9.89
Expected $6.04 $6.81 $8.51 $9.94 $11.52 $13.37
Source: SPO forecast 02/03/09
Figure 4:3 Natural Gas Price Forecast (Real 2008$ $/MMBtu)
Weighting
2009
2010
2015
2020
2025
2030
Reference 60% 5.94 6.86 7.75 7.95 8.15 8.35
High 10% 7.46 9.40 12.74 14.52 15.83 17.27
Low 30% 5.39 5.00 5.00 5.43 5.90 6.41
Expected 5.93 6.56 7.42 7.85 8.24 8.66
Source: SPO forecast 02/03/09
Natural Gas Price Uncertainty
The emergence of non-conventional gas increases the prospects for sustained lower gas price levels in the long-run. Nevertheless, long-term natural gas price levels remain uncertain. A wide range of factors may affect natural gas price levels and volatility in the future. The factors tend to be interrelated, further complicating long-term forecasting.
Uncertainties Relating To Non-conventional Gas The supply of non-conventional natural gas appears to be more prolific than imagined a few years ago. At the same time, advances in technology have improved the economics of extraction. Several uncertainties pertain to the cost and volatility of non-conventional gas in the long-term.
• The degree to which the technological successes achieved in developmental opportunities such as the Barnett will prove to be transferable to emerging shale developments such as the Marcellus is uncertain. Some of the emerging projects may involve additional challenges including difficulties relating to land access and water availability.
Attachment 1 Docket R-30021 Page 43 of 150
4-7
• The decline rates (i.e., the rate at which reserves are depleted) for non-conventional gas tend to differ from that of traditional gas plays. Traditional resources tend to have high initial deliverability but then cease production after a few years. In contrast, the production profile for non-conventional resources, in general, initially exhibits high decline rates (i.e., for two or three years) and then stabilizes for sustained periods.
Other Key Uncertainties Some of the major drivers that could alter natural gas supply and demand balance in the future, and thus move prices in the long-term (up or down), are described below.
Power Demand As described in Chapter 3, long-term demand for electric power is uncertain. Because power generation represents a significant use of natural gas, changes in load will affect the demand for natural gas.
Carbon Regulation At this time it is not possible to predict with any degree of certainty whether CO2 legislation will eventually be enacted, and if it is enacted, when it would become effective, or what form it would take. The prospect for CO2 regulation in the future continues to increase. Chapter 5 discusses the implications of CO2 regulation in more detail. All else equal, the implementation of CO2 regulation would be expected to change the relative economics of generation technologies. Modern CCGT technology enjoys a relative advantage in terms of CO2 emissions compared with solid fuel technologies, so CO2 regulation can be expected to result in increased use of natural gas for power generation, placing upward pressure on long-term natural gas price levels.
New Nuclear Uncertainty The Department of Energy recently announced the award of $18 billion in federal loan guarantees for four new nuclear projects. Nevertheless, no new nuclear plants have been built in the U.S. in more than 20 years. The extent of new nuclear deployment remains highly uncertain, particularly in light of high capital costs. A nuclear renaissance could relieve some long-term gas demand resulting in downward pressure on natural gas prices. A number of utilities and Independent Power Producers have announced plans to construct new nuclear generation, and SPO will continue to monitor the development of these projects.
Attachment 1 Docket R-30021 Page 44 of 150
4-8
Renewable Generation There is growing interest in expanding the use of renewable generation technologies, including the possibility of a federal Renewable Portfolio Standard (“RPS”). A large scale deployment of renewable generation can be expected to affect natural gas consumption for power generation both positively and negatively.
• The production of energy from renewable generation sources will reduce energy requirements from all other generation sources, including natural gas fired-resources. This potentially could result in reduced demand for natural gas and downward pressure on natural gas prices.
• Some renewable generation alternatives (i.e., wind and solar) are intermittent in nature, meaning that their output levels vary depending on local conditions. Increased deployment of intermittent generation resources amplifies the need for load-following resources to respond to the changing output of the intermittent sources. Because natural gas-fired technologies remain the choice for load-following purposes, the deployment of intermittent renewable generation favors increased use of natural gas for power generation.
Natural Gas as Transportation Fuel Recently, there has been renewed discussion of natural gas as a transportation fuel. Interest in expanding the fleet of natural gas fuel vehicles was very high in the early 1980s and mid-1990s. In mid-2008 gasoline prices reached $4.00 per gallon spurring discussion of natural gas as a transportation fuel. The increased use of natural gas as a transportation fuel could put upward pressure on long-term natural gas prices.
Export of Natural Gas The United States is currently a net importer of natural gas, mainly through pipeline interconnections with Canada and Mexico. A small amount of LNG is exported to Japan and Russia from Kenai, Alaska. LNG exports from the U.S. lower 48 are unlikely in the near term, but remain a technical possibility over the long term if domestic demand does not absorb available supply. Increased participation in the global LNG market could put upward pressure on natural gas prices.
Attachment 1 Docket R-30021 Page 45 of 150
5-1
. . . . . . .. . . Chapter 5
Carbon Outlook Planning for a Carbon Constrained Future
Overview
The issue of potential climate change associated with atmospheric greenhouse gases has received growing attention among the scientific community, in the media, and with governmental policy makers. A number of bills regulating carbon emissions have been proposed in the United States Congress. It is not possible to predict whether CO2 legislation will eventually be enacted, and if so, when it would become effective or what form it would take. However, any form of CO2 legislation would likely result in higher cost of electric generation because emissions from power plants are a major source of carbon, primarily in the form of CO2. Moreover, because alternative technologies emit different levels of CO2 per MWh of generation, CO2 legislation would likely affect the relative economics of supply alternatives. Consequently, assumptions regarding potential CO2 cost represent a key input in the 2009 SRP Update.
This chapter discusses:
• Entergy’s environmental commitment;
• The general approach used to consider environmental matters within the SRP;
• The scope and nature of proposed carbon legislation;
• The assumptions used in the 2009 SRP Update to assess carbon uncertainties; and
• The implications of carbon uncertainty for portfolio design.
Entergy Environmental Leadership
Carbon Position A healthy, protected environment is not free but rather requires positive action by individuals, industry, and government. When no limits are placed on the
Attachment 1 Docket R-30021 Page 46 of 150

5-2
amount of greenhouse gases pumped into the atmosphere, costs accrue for the most innocent, including future generations. Risk of inaction or an inadequate global response to climate change poses potential long-term risks to the economic viability of Entergy’s franchise territory and to its asset base, both of which are located in an area uniquely vulnerable to flooding and increased hurricane potential, two suggested consequences of global warming.
Entergy Corporation supports the implementation of a national mandatory program that will make decisive cuts in greenhouse gas emissions in the coming decades. Mandatory greenhouse gas regulations at the federal level will trigger technology innovation throughout the industry and change the way we manage our resources. The most important objectives of any climate policy should be to achieve meaningful reductions in greenhouse gas emissions. To do so requires creating some level of certainty regarding a long-term CO2 price signal that will be sufficient to attract investments in clean technologies. All of this needs to be done in a way that is economically efficient and distributes costs fairly throughout the economy.
Entergy Corporation has a strong record of environmental leadership. Figure 5-1 presents Entergy’s Environmental Vision.
Voluntary CO2 Stabilization In 2001, Entergy Corporation was the first domestic utility to voluntarily stabilize its CO2 emissions. In 2006, as part of a larger environmental strategy, Entergy made a second stabilization commitment of 20% below the 2000 CO2 emission level through 2010. The second commitment also includes emissions associated with purchases where the generation source and emissions can be tracked (controllable purchases).
Dow Jones Sustainability Index In 2008, the Dow Jones Sustainability Indexes (DJSI) named Entergy Corporation to its exclusive Dow Jones Sustainability World Index and Dow Jones Sustainability North American Index for a seventh time. Entergy was the only U.S. utility selected to the world index for the third consecutive year.
Launched in 1999, the DJSI tracks the financial, environmental and social performance of leading sustainability-driven companies worldwide and selects companies whose overall performance scores are in the top 10 percent for their industry sector. The DJSI World covers the top 10 percent of the world’s 2,500 biggest companies in 58 different sectors. The DJSI North America selects the top 20 percent in each industry sector from a pool of the country’s 500 largest companies in 47 different sectors. Listing on the indexes is based on a thorough assessment of general and industry-specific criteria, which is then verified by an external auditor.
Attachment 1 Docket R-30021 Page 47 of 150
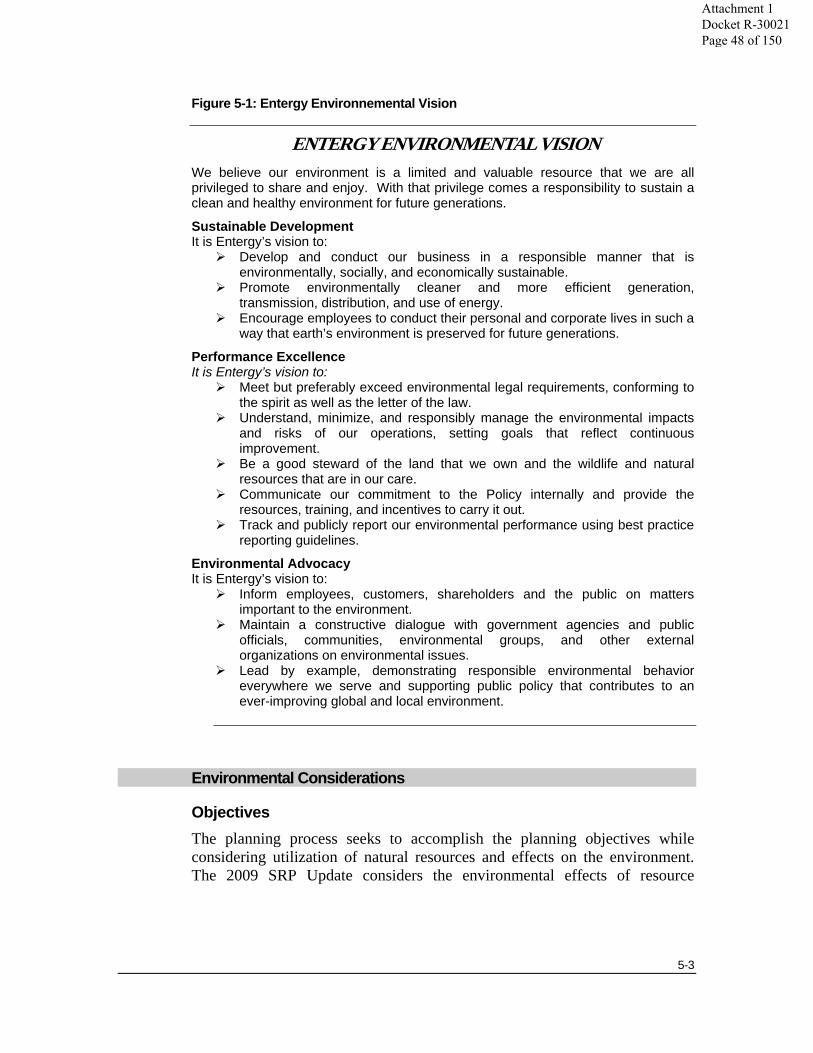
5-3
Figure 5-1: Entergy Environnemental Vision
ENTERGY ENVIRONMENTAL VISION We believe our environment is a limited and valuable resource that we are all privileged to share and enjoy. With that privilege comes a responsibility to sustain a clean and healthy environment for future generations.
Sustainable Development It is Entergy’s vision to:
Develop and conduct our business in a responsible manner that is environmentally, socially, and economically sustainable.
Promote environmentally cleaner and more efficient generation, transmission, distribution, and use of energy.
Encourage employees to conduct their personal and corporate lives in such a way that earth’s environment is preserved for future generations.
Performance Excellence It is Entergy’s vision to:
Meet but preferably exceed environmental legal requirements, conforming to the spirit as well as the letter of the law.
Understand, minimize, and responsibly manage the environmental impacts and risks of our operations, setting goals that reflect continuous improvement.
Be a good steward of the land that we own and the wildlife and natural resources that are in our care.
Communicate our commitment to the Policy internally and provide the resources, training, and incentives to carry it out.
Track and publicly report our environmental performance using best practice reporting guidelines.
Environmental Advocacy It is Entergy’s vision to:
Inform employees, customers, shareholders and the public on matters important to the environment.
Maintain a constructive dialogue with government agencies and public officials, communities, environmental groups, and other external organizations on environmental issues.
Lead by example, demonstrating responsible environmental behavior everywhere we serve and supporting public policy that contributes to an ever-improving global and local environment.
Environmental Considerations
Objectives The planning process seeks to accomplish the planning objectives while considering utilization of natural resources and effects on the environment. The 2009 SRP Update considers the environmental effects of resource
Attachment 1 Docket R-30021 Page 48 of 150
5-4
alternatives, including renewable generation alternatives, and of resource portfolios in several ways, including:
• The process recognizes that environmental factors, such as CO2 legislation, may have a direct effect on customer costs. The overall objective is to design a portfolio of resources that meet customers’ needs at the lowest reasonable cost. Determining what is reasonable requires considering risk and effects on the environment.
• The planning process considers the risk to reliability and cost associated with environmental concerns. For example, the process considers sensitivities associated with potential CO2 costs.
• The planning process assesses the implications of proposed portfolios on the use of natural resources and the effect on the environment by measuring key parameters such as CO2 emissions, natural gas use, and coal consumption.
Finally, in designing a recommended portfolio(s) of resources, preference is given to portfolios that provide greater benefit in terms of environmental effect and natural resource use to the extent consistent with the planning objectives.
Contours of Proposed Carbon Legislation
The carbon policy debate is a complex one with consequences extending beyond effects on the natural environment. The timing and nature of carbon regulation will have broad social and economic consequences for the U.S. Variables in this debate tend to be interconnected; outcomes in one area (for example, carbon prices) produce effects in other areas (for example, natural gas consumption for electric power generation). These interconnections make it difficult to assess the implications of any particular policy proposal. As a result there is uncertainty regarding both the eventual policy outcome (level and nature of carbon regulation) and the effects that the regulation will have on planning variables including:
• CO2 emissions cost;
• Natural gas demand and power; and
• Over all macro-economic activity including job growth and economic output.
Attachment 1 Docket R-30021 Page 49 of 150
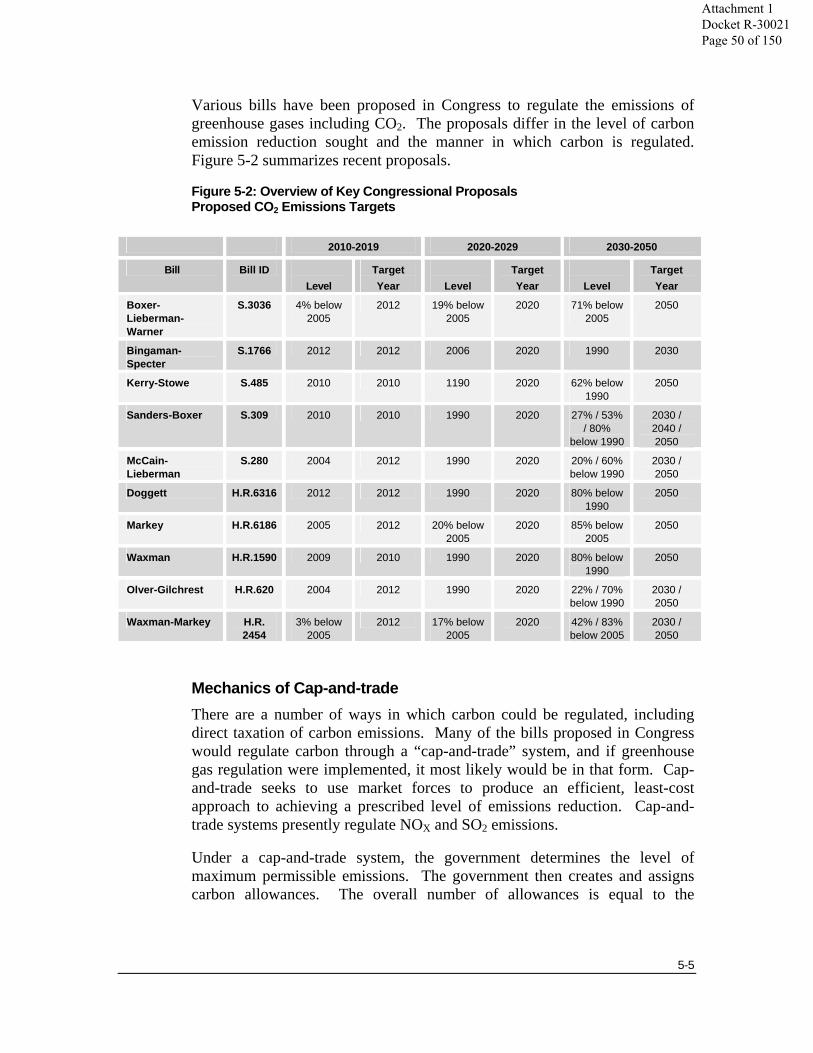
5-5
Various bills have been proposed in Congress to regulate the emissions of greenhouse gases including CO2. The proposals differ in the level of carbon emission reduction sought and the manner in which carbon is regulated. Figure 5-2 summarizes recent proposals.
Figure 5-2: Overview of Key Congressional Proposals Proposed CO2 Emissions Targets
2010-2019 2020-2029 2030-2050
Bill Bill ID Level
Target Year
Level
Target Year
Level
Target Year
Boxer-Lieberman-Warner
S.3036 4% below 2005
2012 19% below 2005
2020 71% below 2005
2050
Bingaman-Specter
S.1766 2012 2012 2006 2020 1990 2030
Kerry-Stowe S.485 2010 2010 1190 2020 62% below 1990
2050
Sanders-Boxer S.309 2010 2010 1990 2020 27% / 53% / 80%
below 1990
2030 / 2040 / 2050
McCain-Lieberman
S.280 2004 2012 1990 2020 20% / 60% below 1990
2030 / 2050
Doggett H.R.6316 2012 2012 1990 2020 80% below 1990
2050
Markey H.R.6186 2005 2012 20% below 2005
2020 85% below 2005
2050
Waxman H.R.1590 2009 2010 1990 2020 80% below 1990
2050
Olver-Gilchrest H.R.620 2004 2012 1990 2020 22% / 70% below 1990
2030 / 2050
Waxman-Markey H.R. 2454
3% below 2005
2012 17% below 2005
2020 42% / 83% below 2005
2030 / 2050
Mechanics of Cap-and-trade There are a number of ways in which carbon could be regulated, including direct taxation of carbon emissions. Many of the bills proposed in Congress would regulate carbon through a “cap-and-trade” system, and if greenhouse gas regulation were implemented, it most likely would be in that form. Cap-and-trade seeks to use market forces to produce an efficient, least-cost approach to achieving a prescribed level of emissions reduction. Cap-and-trade systems presently regulate NOX and SO2 emissions.
Under a cap-and-trade system, the government determines the level of maximum permissible emissions. The government then creates and assigns carbon allowances. The overall number of allowances is equal to the
Attachment 1 Docket R-30021 Page 50 of 150

5-6
emissions cap. Participants in the market meet carbon targets by either reducing their actual carbon emissions or by using allowances. Allowances can be purchased and sold among the market participants. This flexibility allows market participants to make decisions based on economic and environmental factors. The emissions cap is achieved, but the exact reductions occur where they are most economic.
Key issues in a cap-and-trade regime include:
• The level at which the emissions cap is set;
• The availability and level of allowed carbon offsets; and
• The methodology for the allocation of allowances.
The manner in which these issues are addressed determines the stringency of the CO2 regime, the cost at which allowances trade, and the way that the cost of reducing carbon emissions is borne by society (in short, who pays and how much).
Figure 5-3: Overview of Cap-and-trade Regime
Further, some proposals also allow a third form of compliance, carbon offsets. Certain actions that have the effect of reducing carbon in the atmosphere (for example planting of vegetation to sequester carbon) may be netted against actual carbon emissions.
Carbon Cost Assumptions
In order to consider the effects of carbon uncertainty on resource choice and portfolio design, the 2009 SRP Update relies on a range of projected CO2 cost outcomes. Two cases, high and low, were selected to represent “bookends,” that is, the range of possible outcomes. These cases were developed by Entergy personnel working with the ICF consulting firm. A third case, the Reference case, lies between the bounds. A description of the three cases follows.
Establish Emission Cap
Establish Emission Cap
Consume or Trade
Allowances
Consume or Trade
Allowances
Create Allowances
(Equal to Cap)
Create Allowances
(Equal to Cap)Allocate
AllowancesAllocate
Allowances
MarketAction
GovernmentAction
Attachment 1 Docket R-30021 Page 51 of 150
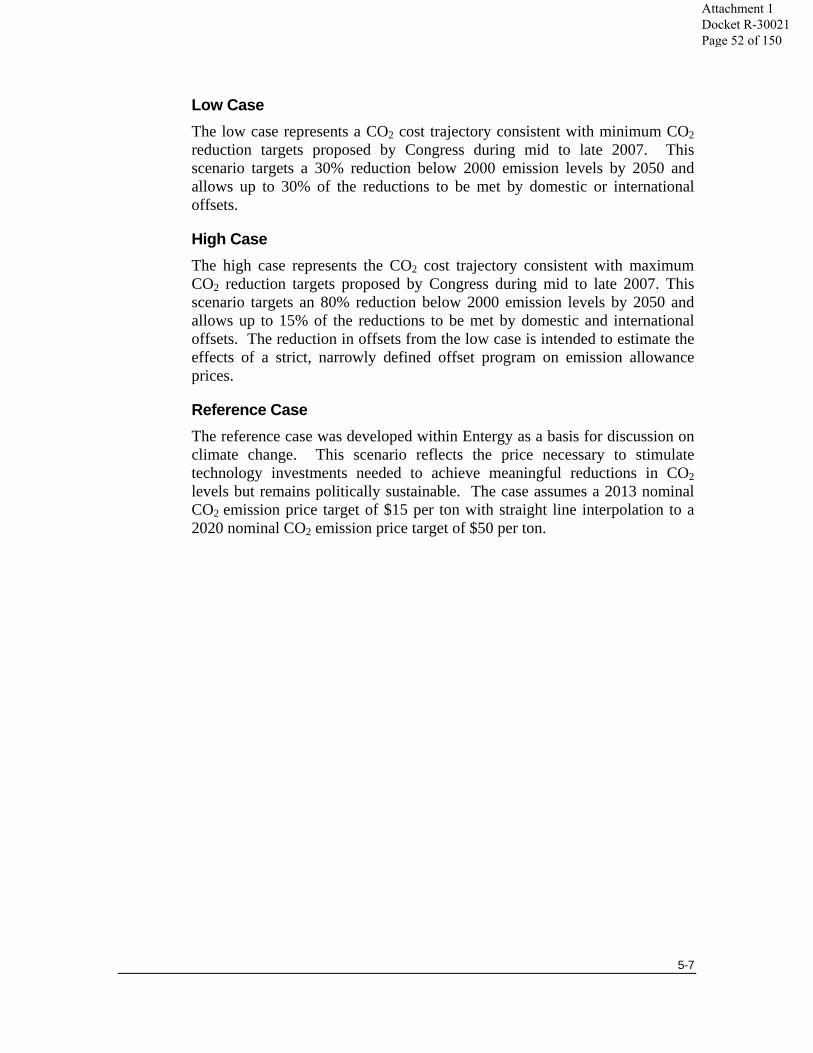
5-7
Low Case The low case represents a CO2 cost trajectory consistent with minimum CO2 reduction targets proposed by Congress during mid to late 2007. This scenario targets a 30% reduction below 2000 emission levels by 2050 and allows up to 30% of the reductions to be met by domestic or international offsets.
High Case The high case represents the CO2 cost trajectory consistent with maximum CO2 reduction targets proposed by Congress during mid to late 2007. This scenario targets an 80% reduction below 2000 emission levels by 2050 and allows up to 15% of the reductions to be met by domestic and international offsets. The reduction in offsets from the low case is intended to estimate the effects of a strict, narrowly defined offset program on emission allowance prices.
Reference Case The reference case was developed within Entergy as a basis for discussion on climate change. This scenario reflects the price necessary to stimulate technology investments needed to achieve meaningful reductions in CO2 levels but remains politically sustainable. The case assumes a 2013 nominal CO2 emission price target of $15 per ton with straight line interpolation to a 2020 nominal CO2 emission price target of $50 per ton.
Attachment 1 Docket R-30021 Page 52 of 150
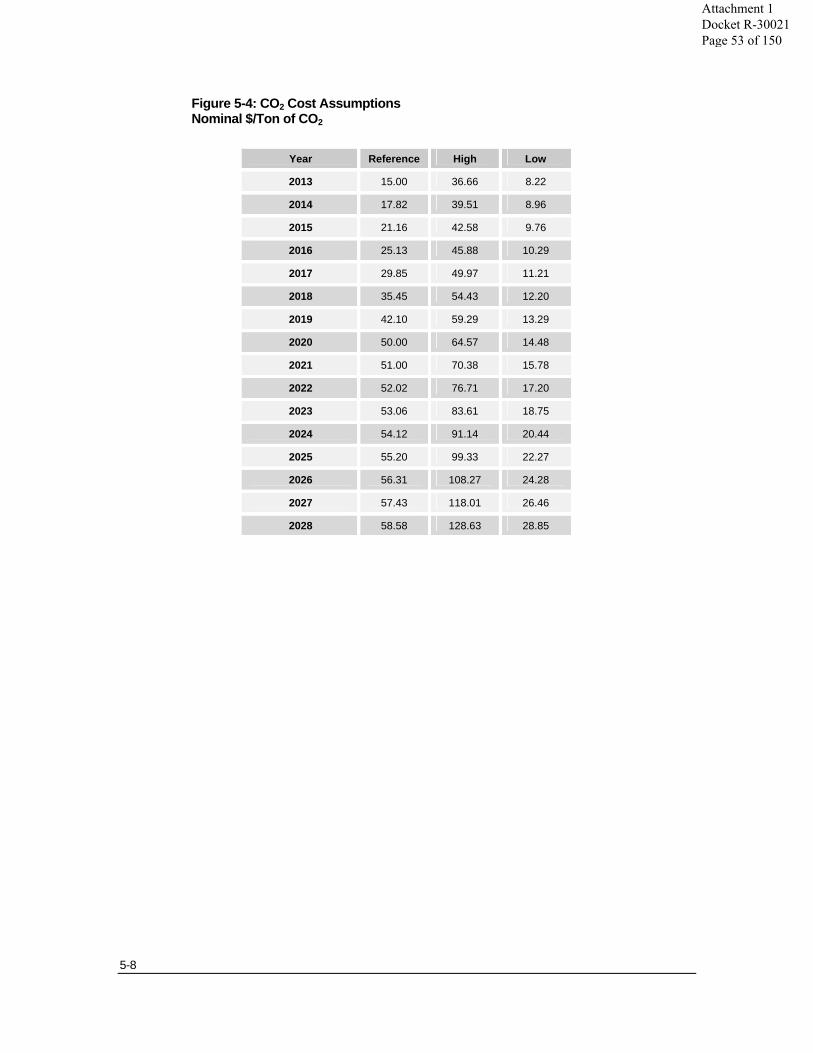
5-8
Figure 5-4: CO2 Cost Assumptions Nominal $/Ton of CO2
Year Reference High Low
2013 15.00 36.66 8.22
2014 17.82 39.51 8.96
2015 21.16 42.58 9.76
2016 25.13 45.88 10.29
2017 29.85 49.97 11.21
2018 35.45 54.43 12.20
2019 42.10 59.29 13.29
2020 50.00 64.57 14.48
2021 51.00 70.38 15.78
2022 52.02 76.71 17.20
2023 53.06 83.61 18.75
2024 54.12 91.14 20.44
2025 55.20 99.33 22.27
2026 56.31 108.27 24.28
2027 57.43 118.01 26.46
2028 58.58 128.63 28.85
Attachment 1 Docket R-30021 Page 53 of 150
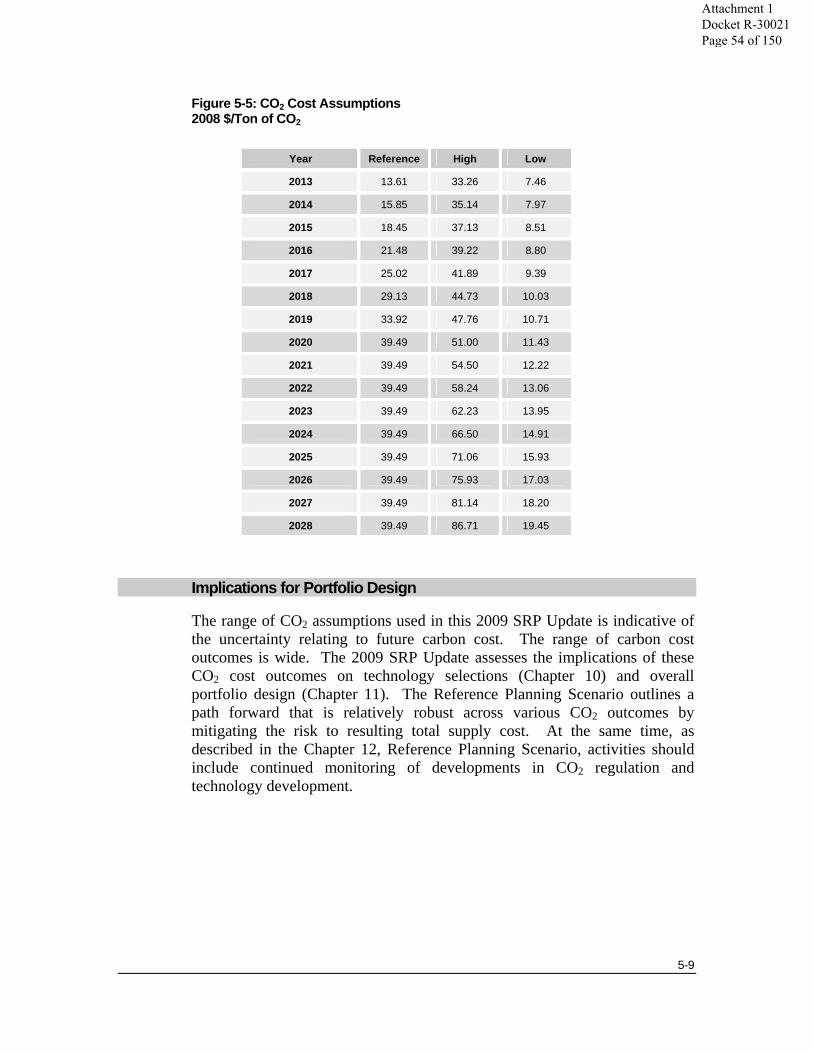
5-9
Figure 5-5: CO2 Cost Assumptions 2008 $/Ton of CO2
Year Reference High Low
2013 13.61 33.26 7.46
2014 15.85 35.14 7.97
2015 18.45 37.13 8.51
2016 21.48 39.22 8.80
2017 25.02 41.89 9.39
2018 29.13 44.73 10.03
2019 33.92 47.76 10.71
2020 39.49 51.00 11.43
2021 39.49 54.50 12.22
2022 39.49 58.24 13.06
2023 39.49 62.23 13.95
2024 39.49 66.50 14.91
2025 39.49 71.06 15.93
2026 39.49 75.93 17.03
2027 39.49 81.14 18.20
2028 39.49 86.71 19.45
Implications for Portfolio Design
The range of CO2 assumptions used in this 2009 SRP Update is indicative of the uncertainty relating to future carbon cost. The range of carbon cost outcomes is wide. The 2009 SRP Update assesses the implications of these CO2 cost outcomes on technology selections (Chapter 10) and overall portfolio design (Chapter 11). The Reference Planning Scenario outlines a path forward that is relatively robust across various CO2 outcomes by mitigating the risk to resulting total supply cost. At the same time, as described in the Chapter 12, Reference Planning Scenario, activities should include continued monitoring of developments in CO2 regulation and technology development.
Attachment 1 Docket R-30021 Page 54 of 150
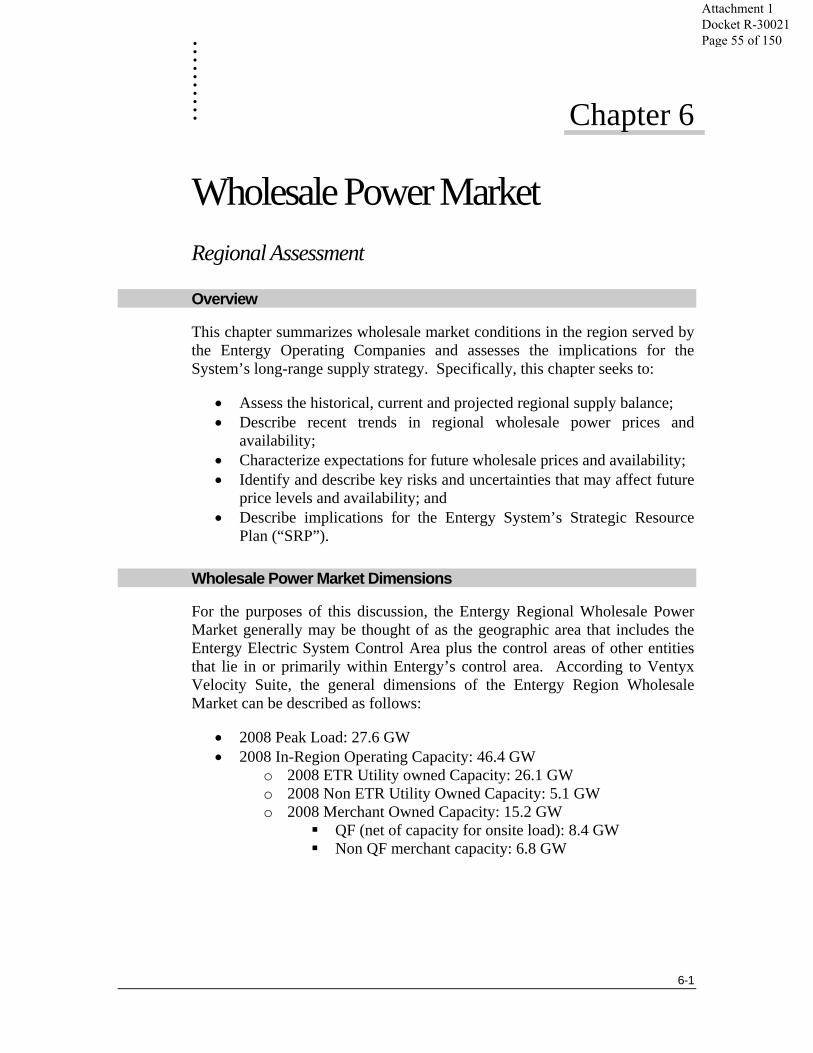
6-1
. . . . . . .. . . Chapter 6
Wholesale Power Market Regional Assessment
Overview
This chapter summarizes wholesale market conditions in the region served by the Entergy Operating Companies and assesses the implications for the System’s long-range supply strategy. Specifically, this chapter seeks to:
• Assess the historical, current and projected regional supply balance; • Describe recent trends in regional wholesale power prices and
availability; • Characterize expectations for future wholesale prices and availability; • Identify and describe key risks and uncertainties that may affect future
price levels and availability; and • Describe implications for the Entergy System’s Strategic Resource
Plan (“SRP”).
Wholesale Power Market Dimensions
For the purposes of this discussion, the Entergy Regional Wholesale Power Market generally may be thought of as the geographic area that includes the Entergy Electric System Control Area plus the control areas of other entities that lie in or primarily within Entergy’s control area. According to Ventyx Velocity Suite, the general dimensions of the Entergy Region Wholesale Market can be described as follows:
• 2008 Peak Load: 27.6 GW • 2008 In-Region Operating Capacity: 46.4 GW
o 2008 ETR Utility owned Capacity: 26.1 GW o 2008 Non ETR Utility Owned Capacity: 5.1 GW o 2008 Merchant Owned Capacity: 15.2 GW
QF (net of capacity for onsite load): 8.4 GW Non QF merchant capacity: 6.8 GW
Attachment 1 Docket R-30021 Page 55 of 150
6-2
Historical Experience in the Region In the 1990s, most of the Entergy Operating Companies’ retail regulators expressed interest in either considering or moving to a market characterized by the unbundling of traditional vertically integrated utilities. Both ETI (then operating as the Texas-jurisdictional portion of Entergy Gulf States, Inc.) and EAI were subject to legislative mandates to implement Retail Open Access by 2002. Mississippi and Louisiana regulators were studying Retail Open Access options. One of the consequences of the expectation of unbundling and Retail Open Access was a rapid growth in the wholesale power market and the entry of many new entrants into that market.
By the late 1990s, reserve margins had fallen to precarious levels, and market prices for power had increased both nationally and within the markets available to the Entergy Operating Companies.
In response to rising market prices, low natural gas prices, an existing natural gas pipeline infrastructure, and an abundant supply of turbines and water, non-utility market participants added over 19 GW of summer net capability within the System’s footprint over the ten year period from 1999-2008. Some of this newly-installed capability has been committed to utilities via acquisition or contract,1 and some of this new capacity was subsequently mothballed or dismantled. Therefore, a significant portion of this new merchant capacity is no longer sold into the economy power market.
Although the region benefited from an abundance of supply, much of the generation was poorly situated to meet load requirements. A large amount of the new generation was sited in the Central and Northern portions of the Entergy System, whereas a majority of the load is located in the Southern parts of the region closer to the Gulf of Mexico. The owners of these new merchant facilities have not elected to make the transmission investments that would be required to ensure firm transmission service, choosing instead to rely on non-firm transmission service. Constraints on the amount of power that can be moved from the areas with abundant supply to the areas with high demand, as well as limits on the ability to provide flexible capability, have limited the total amount of purchases that can be made from the wholesale market.
A few of the mothballed plants have returned to service.
1 For example, some of the Entergy Operating Companies have purchased merchant facilities (Perryville, Attala, Calcasieu and Ouachita) for the benefit of their customers.
Attachment 1 Docket R-30021 Page 56 of 150
6-3
• Reliant Choctaw, located in Choctaw, MS, returned to service in 2007 after being mothballed in 2004.
• Dell CCGT in Mississippi County, AR, which could serve either Entergy Region load or Associated Electric Cooperative (“AECI”) load in Missouri and Arkansas, went online in 2007. Its construction was suspended in 2003 and the plant was sold to AECI (a regulated utility) in 2005.
Current New Build Activity in the Region Recently, there has been a shift away from merchant activity toward utility self-supply new builds of various types. For example, the Lafayette Utilities System has constructed four natural gas-fired combustion turbines, adding 192 MW of new capacity since 2005 and CLECO is in the final stages of constructing the 595 MW Rodemacher petroleum coke circulating fluidizing bed plant, which is expected to enter commercial service in late 2009.
Recent development activity has focused on new solid fuel plants, but the concerns about CO2, rising construction costs and other factors have caused some of these projects to slip. For example:
• LS Power, LLC has begun constructing the 665 MW Plum Point plant, a facility designed to burn Powder River Basin coal. That unit is expected to enter service in 2010. LS Power, LLC also has announced a 665 MW Phase II at Plum Point. Phase II is in the permitting stage, and the initial June 2012 in-service date has already slipped to March 2014 due to CO2 concerns.
• Louisiana Generating, LLC proposed to expand the Big Cajun II coal facility by 775 MW, but that proposal has now been postponed.
In addition to strictly merchant facilities, cogeneration activity continues at a measured pace.
• Georgia-Pacific began operation of a 58 MW project in Port Hudson, LA, just north of Baton Rouge, in June 2007. That plant was estimated to cost $160 million, approximately $2,759/kW. While the primary fuel for this project is petroleum coke, wood waste serves as a secondary fuel. All 58 MW of this facility has been committed to electric onsite use by Georgia-Pacific.
• Air Products began commercial operation of Port Arthur 2, a 98 MW CCGT plant, in December 2006. This unit is owned 100% by Air Products Corp, and all of the energy produced by this facility will be used in onsite industrial processes.
Attachment 1 Docket R-30021 Page 57 of 150
6-4
Despite an increase in the market price for power over the last year or so, measured by implied heat rates, turbines from some plants are literally being relocated to where demand is higher:
• Four of the eight large combustion turbines at the Duke South Haven facility have been removed and sent to Kuwait, with plans to relocate the remaining four. The facility became non-operational in late 2007.
• 300 MW of CT capacity formerly owned by Warren Power was sold to East Texas Electric Cooperative, and was disassembled and moved from near Jackson, Mississippi to south-east Texas.
Capacity/Generation Issues
The Entergy Operating Companies are highly reliant on gas-fired generation to meet their capacity and load-following needs. In terms of total energy production, the Operating Companies’ gas and nuclear generation exceeds national averages. Nationally, most electricity production comes from coal-fired generation.
Overall regional supply, including but not limited to resources owned by Entergy Operating Companies, also reflects reliance on gas-fired resources. CCGTs accounted for 35% of 2008 capacity within the region and 32% of total generation. Gas-fired steam units accounted for 30% of capacity and about 11% of total regional generation.
A major element of the regional generation portfolio consists of more than 8 GW of cogeneration facilities. These facilities can produce power for onsite use and, if designated as a Qualified Facility (“QF”), also can schedule sales of power to third parties or sell energy to the grid on a no-notice, if, as, and when available basis. Regional cogeneration capacity has doubled since 2000, and capacity available to the grid above normal onsite use exceeds 3 GW. Prior to 2000, most cogeneration capacity connected to the Entergy System was sized for onsite use, meaning net MW to the grid was typically minimal as long as the host load was operating. Since 2000, a number of QF facilities have been built with the intent of selling power into the market.
While some QF sales are made pursuant to bilateral contracts, most are simply “put” sales where the incumbent utility is required to take the energy and pay the seller the lower of avoided cost or market prices. The amount of put energy can change hour by hour, and the System does not know ahead of time how much energy it must “take.” Currently, the total QF capacity less typical onsite load is 3.1 GW. After adjusting for current bilateral contracts, net cogeneration capacity is 1.8 GW.
Attachment 1 Docket R-30021 Page 58 of 150
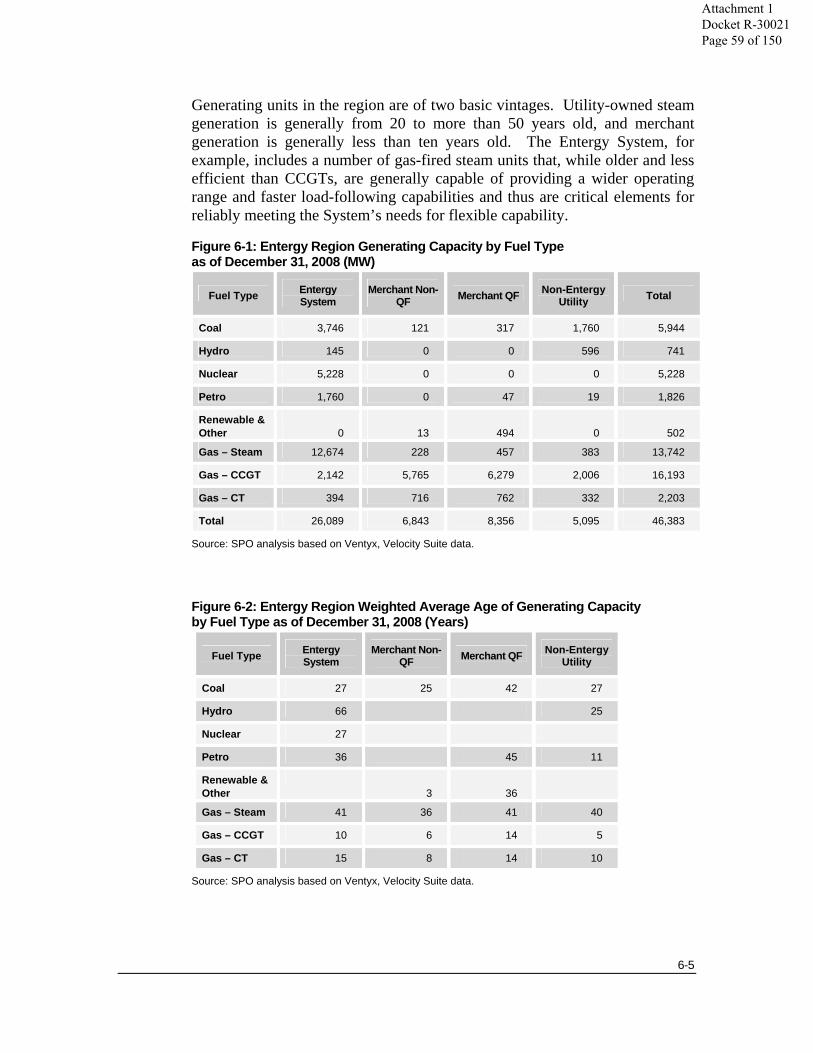
6-5
Generating units in the region are of two basic vintages. Utility-owned steam generation is generally from 20 to more than 50 years old, and merchant generation is generally less than ten years old. The Entergy System, for example, includes a number of gas-fired steam units that, while older and less efficient than CCGTs, are generally capable of providing a wider operating range and faster load-following capabilities and thus are critical elements for reliably meeting the System’s needs for flexible capability.
Figure 6-1: Entergy Region Generating Capacity by Fuel Type as of December 31, 2008 (MW)
Fuel Type Entergy System
Merchant Non-QF Merchant QF Non-Entergy
Utility Total
Coal 3,746 121 317 1,760 5,944
Hydro 145 0 0 596 741
Nuclear 5,228 0 0 0 5,228
Petro 1,760 0 47 19 1,826
Renewable & Other
0
13
494 0
502
Gas – Steam 12,674 228 457 383 13,742
Gas – CCGT 2,142 5,765 6,279 2,006 16,193
Gas – CT 394 716 762 332 2,203
Total 26,089 6,843 8,356 5,095 46,383
Source: SPO analysis based on Ventyx, Velocity Suite data.
Figure 6-2: Entergy Region Weighted Average Age of Generating Capacity by Fuel Type as of December 31, 2008 (Years)
Fuel Type Entergy System
Merchant Non-QF Merchant QF Non-Entergy
Utility
Coal 27 25 42 27
Hydro 66 25
Nuclear 27
Petro 36 45 11
Renewable & Other
3
36
Gas – Steam 41 36 41 40
Gas – CCGT 10 6 14 5
Gas – CT 15 8 14 10
Source: SPO analysis based on Ventyx, Velocity Suite data.
Attachment 1 Docket R-30021 Page 59 of 150

6-6
The advanced age of existing utility gas fired generation will, over time, require the Operating Companies to place a greater reliance on purchased power (or to acquire additional capability from existing facilities) and/or the construction of self supply options as the economics and reliability of over 12 GW of older generation become less tenable.
Despite efforts to develop more solid fuel options in the future, the region overall is expected to be more dependent upon natural gas-fired generation over the next 10 years. Utilization of new CCGTs and CTs is expected to increase over this period and reliance on gas steam units is expected to decrease.
The Entergy System is one of the most interconnected regions in terms of natural gas infrastructure and proximity to natural gas supplies. In addition, as discussed in Chapter 5, a major transformation is occurring in the U.S. natural gas industry in terms of moving from conventional to unconventional on-shore supplies (including an increased availability of Liquefied Natural Gas). This shift is not likely to pose a risk to the Entergy System’s gas supply, and may actually result in improved availability of gas supply in the future.
Despite the vast network of gas pipelines, some power generation is constrained by limitations to the amount of swing (flexible) gas service delivered to the power plants. These gas supply limitations may limit the operational flexibility of the power plants. Many merchant plants are connected to only one gas pipeline and swing gas service is not always available, and/or it may be expensive relative to other options. Furthermore, in addition to limits imposed by fuel supply constraints, other factors may inhibit the ability of in-region merchant suppliers to offer the kind of flexible capability that the System needs to operate reliably.
The amount of in-region firm power that the Operating Companies can reliably include in their resource portfolio is also limited by the deliverability of certain resources. Merchant providers have been unwilling to fund transmission investments to increase the deliverability of the output of their facilities, and therefore transmission upgrades have not kept up with the amount of new generation added. The lack of merchant investment in transmission facilities has resulted in significant increases in congestion on the transmission system, which means that there are limits on the amount of new generation for which firm service can be obtained.
Regional Power Prices and Heat Rates
Within the Entergy region, gas-fired generation is on the margin (i.e., the resource that sets the price) in most on-peak hours. While gas-fired generation may be on the margin during some seasonal off-peak hours, coal-fired generation may also
Attachment 1 Docket R-30021 Page 60 of 150
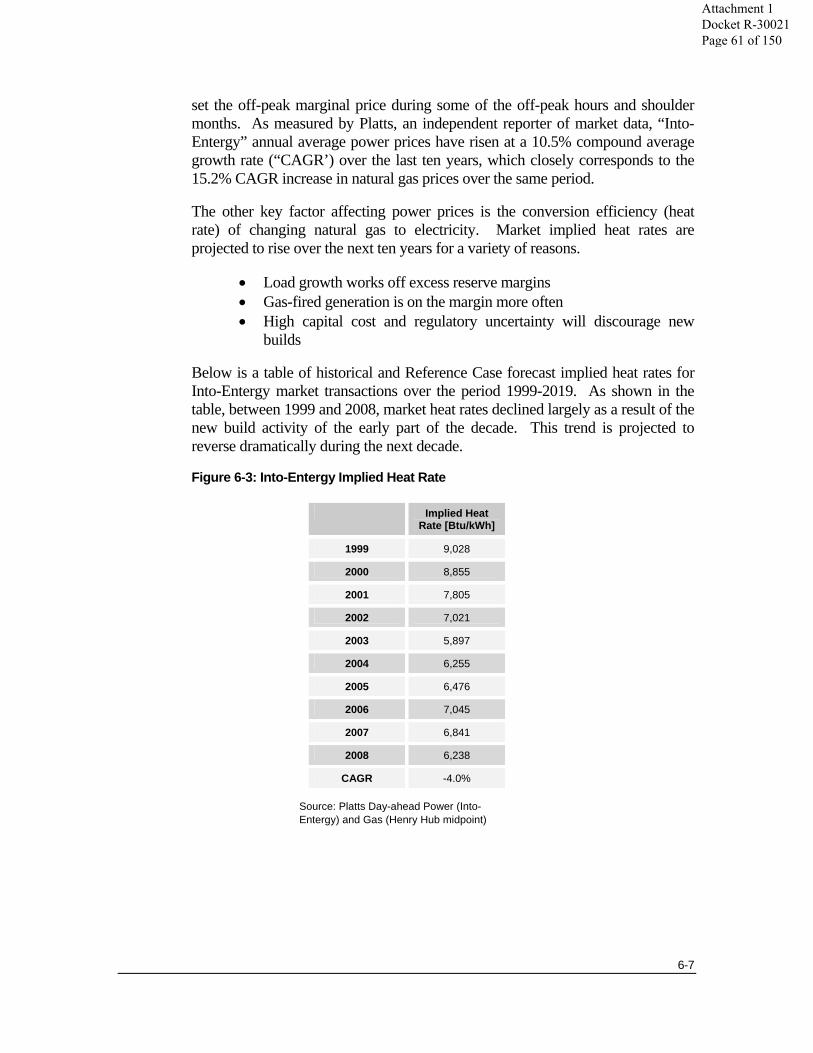
6-7
set the off-peak marginal price during some of the off-peak hours and shoulder months. As measured by Platts, an independent reporter of market data, “Into-Entergy” annual average power prices have risen at a 10.5% compound average growth rate (“CAGR’) over the last ten years, which closely corresponds to the 15.2% CAGR increase in natural gas prices over the same period.
The other key factor affecting power prices is the conversion efficiency (heat rate) of changing natural gas to electricity. Market implied heat rates are projected to rise over the next ten years for a variety of reasons.
• Load growth works off excess reserve margins • Gas-fired generation is on the margin more often • High capital cost and regulatory uncertainty will discourage new
builds
Below is a table of historical and Reference Case forecast implied heat rates for Into-Entergy market transactions over the period 1999-2019. As shown in the table, between 1999 and 2008, market heat rates declined largely as a result of the new build activity of the early part of the decade. This trend is projected to reverse dramatically during the next decade.
Figure 6-3: Into-Entergy Implied Heat Rate
Implied Heat Rate [Btu/kWh]
1999 9,028
2000 8,855
2001 7,805
2002 7,021
2003 5,897
2004 6,255
2005 6,476
2006 7,045
2007 6,841
2008 6,238
CAGR -4.0%
Source: Platts Day-ahead Power (Into-Entergy) and Gas (Henry Hub midpoint)
Attachment 1 Docket R-30021 Page 61 of 150
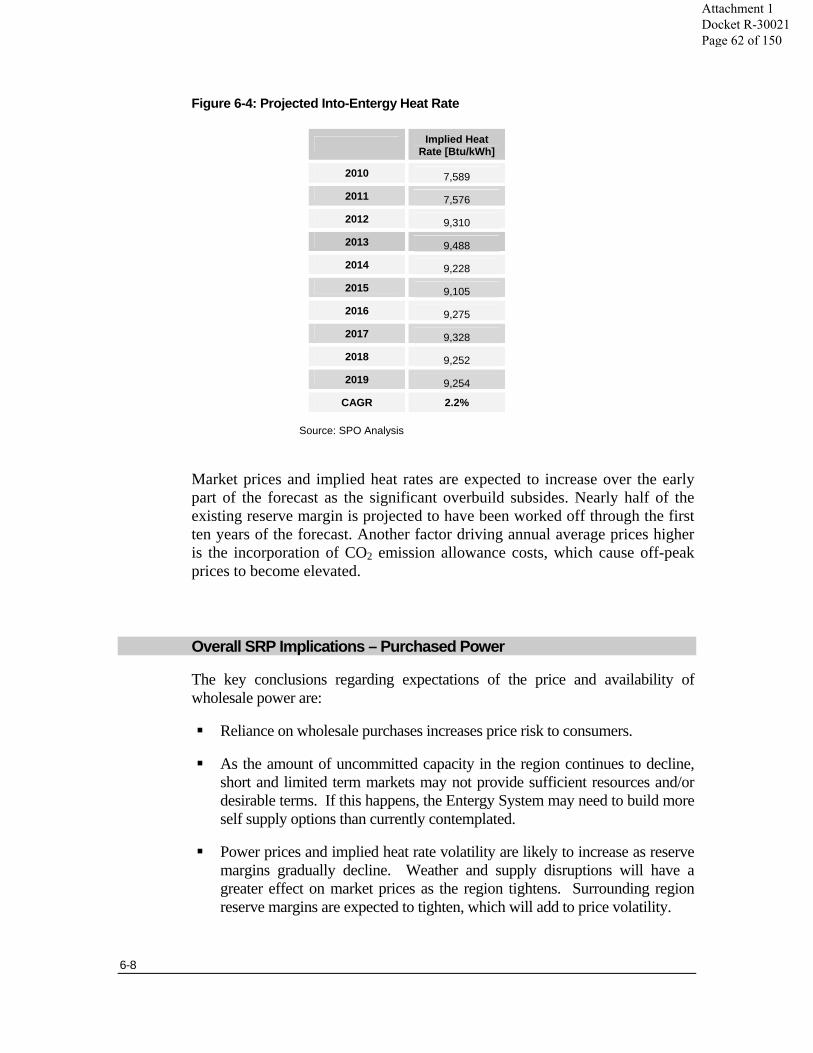
6-8
Figure 6-4: Projected Into-Entergy Heat Rate
Implied Heat Rate [Btu/kWh]
2010 7,589
2011 7,576
2012 9,310
2013 9,488
2014 9,228
2015 9,105
2016 9,275
2017 9,328
2018 9,252
2019 9,254
CAGR 2.2%
Source: SPO Analysis
Market prices and implied heat rates are expected to increase over the early part of the forecast as the significant overbuild subsides. Nearly half of the existing reserve margin is projected to have been worked off through the first ten years of the forecast. Another factor driving annual average prices higher is the incorporation of CO2 emission allowance costs, which cause off-peak prices to become elevated.
Overall SRP Implications – Purchased Power
The key conclusions regarding expectations of the price and availability of wholesale power are:
Reliance on wholesale purchases increases price risk to consumers.
As the amount of uncommitted capacity in the region continues to decline, short and limited term markets may not provide sufficient resources and/or desirable terms. If this happens, the Entergy System may need to build more self supply options than currently contemplated.
Power prices and implied heat rate volatility are likely to increase as reserve margins gradually decline. Weather and supply disruptions will have a greater effect on market prices as the region tightens. Surrounding region reserve margins are expected to tighten, which will add to price volatility.
Attachment 1 Docket R-30021 Page 62 of 150

6-9
The ability to ensure deliverability of purchased power will be an increasingly important consideration in resource planning.
Gas is likely to be on the margin in more hours in the future as load grows, however, the completion of several solid fuel units in the 2010-2012 could alter that trend.
Environmental uncertainty is likely to favor new gas generation over coal generation. New environmental regulation is likely to drive increases in cost of both self-generation and wholesale market power purchases.
Attachment 1 Docket R-30021 Page 63 of 150

7-1
. . . . . . .. . . Chapter 7
Resource Needs Assessing Portfolio Requirements
Overview
The goal of the SRP process is to design a balanced, cost-effective portfolio of resources that meets the planning objectives set out by the Operating Committee. This requires determining both the right amount and the right type of capacity that will meet the System’s customers’ needs. A number of factors, including regional planning considerations, may affect resource needs. This chapter discusses expectations regarding:
• The amount of capacity that the Entergy Operating Companies will need over the next twenty years;
• The type of capacity that will be needed;
• The requirement for flexible capability;
• Area planning considerations that affect the location and priority of resource additions; and
• The role of limited-term purchased power within the portfolio of resources.
The Amount of Resources Needed
The Entergy Operating Companies must have adequate resources to meet customer needs reliably. The SRP presumes that the System and each Operating Company operating on a stand-alone basis will maintain sufficient generating capacity to reliably meet its own requirements, measured in terms of peak load plus adequate provision for planning reserves. Peak load refers to the level of highest customer demand during the year. The System must have sufficient resources to meet this level of demand. All other times during the year will have lower customer demand and, therefore, will require fewer resources to serve the customers. If resources are sufficient to meet peak demand, resources should be sufficient to meet demand throughout the remainder of the year.
Attachment 1 Docket R-30021 Page 64 of 150

7-2
Both customer demand and the availability of resources within the portfolio to meet demand are matters of uncertainty. Unknown events such as an unusually hot summer or an unplanned outage of a generating unit can affect the System’s ability to respond to peak load. To protect against the consequences of such unknown events, the SRP – consistent with good planning practices – provides for an additional amount of resources above projected peak demand, referred to as the planning reserve margin. The planning reserve margin may be expressed as a MW amount of or as a percentage of the peak load.
In recent years, the Entergy System has planned for a reserve margin of about 17%. This target was developed using a technique known as a Loss of Load Probability (“LOLP”) assessment. The LOLP technique is widely used through the industry for determining reserve margins. LOLP assesses the probability that resources will be adequate to meet load in light of uncertainties regarding customer load variability and unit outages. Results of the LOLP assessment indicated that a 17% reserve margin provided sufficient capacity to serve load for all but one day in ten years, also a traditional measure of reliability used within the industry.
Implications of EAI and EMI Exit from System Agreement This SRP Update results in a plan that positions EAI and EMI for reliable and economic service once they withdraw from the System Agreement and may possibly operate on a standalone basis. The SRP Update also prepares the remaining Operating Companies for operation as a four-company System after the exit of EAI and EMI. Accordingly, the SRP considers the amount of resources that will be needed by each of the three planning levels over the long-term, the System (four-Company in the long-term), by EAI, and by EMI. The capacity expansion scenarios for EAI and EMI position those companies to operate on a stand alone basis following their of exit from the System Agreement. However, EAI and EMI may determine to enter into other arrangements including possible coordination agreements or reserve sharing arrangements following their exit from the System Agreement. It is not possible at this time to predict the outcome of those uncertainties. However, the result of any such alternative arrangement would tend to reduce overall resource needs for EAI and EMI as compared to standalone operations. As a result, this plan results in adequate resources to meet EAI and EMI under alternative assumptions.
A number of factors influence the level of planning reserves that are required to provide reliability. One of the most important variables is the size of the generating units within the portfolio in relation to peak load. Relying on large generating stations involves greater risk because an outage at a single unit has more significant consequences. Therefore, the larger the generating units
Attachment 1 Docket R-30021 Page 65 of 150
7-3
within the portfolio in relation to peak load the greater the planning reserve margin that is required.
This relationship has consequences for the level of planning reserves that will be required in light of the exit of EAI and EMI from the System Agreement. As EAI and EMI exit, the relevant planning entities (a four-Company System, EAI standalone, and EMI standalone) become smaller. At the same time, the size of the generating units within each portfolio does not change. Because the size of the generating units as compared to the peak load increases, the LOLP assessment indicates a need for additional planning reserves at each planning entity. The results of the LOLP calculations indicate much higher reserve requirements at EAI and EMI.
In determining the target planning reserve margins, the SRP Update considered that the actual operating configuration of EAI and EMI post exit from the System Agreement is uncertain. The SRP Update sought to determine a level of target planning reserves that balanced the objective of providing adequate resources to maintain reliability while avoiding commitment to long-term resources that may ultimately prove to be unnecessary. Accordingly, the SRP Update established the planning reserve margins for EAI and EMI based on the loss of the single largest generating unit. This yields planning reserve margins of 20% and 21% for EAI and EMI, respectively. Figure 7-1 provides the target reserve margin for each entity as it evolves over time.
Attachment 1 Docket R-30021 Page 66 of 150

7-4
Figure 7-1: Target Reserve Margins
* EAI and EMI stand-alone reserve margins are based on loss of the largest unit.
Incremental Long-Term Resource Needs The amount of incremental long-term resources that will be required to meet reliability requirements over the next twenty years will be determined by several factors:
• The level of long-term capacity in the portfolio relative to reliability requirements;
• Forecasted load growth based on expected customer demand; and
• Capacity deactivation assumptions.
Current Capacity Shortage Overall, the System’s long-term owned or controlled resources are presently about 1 GW short of the System’s long-term reliability requirement. To the extent that this shortfall is not met with long-term resources in the interim, it will be filled with short-term resources at the time of need. EAI, EMI and the remaining four-company System are all short of levels required for operation post-EAI and EMI exit.
Forecasted Load Growth Chapter 3 provides a more detailed discussion of load growth. Figure 7-2 summarizes the effects of load growth on incremental capacity needs over the planning horizon.
Attachment 1 Docket R-30021 Page 67 of 150
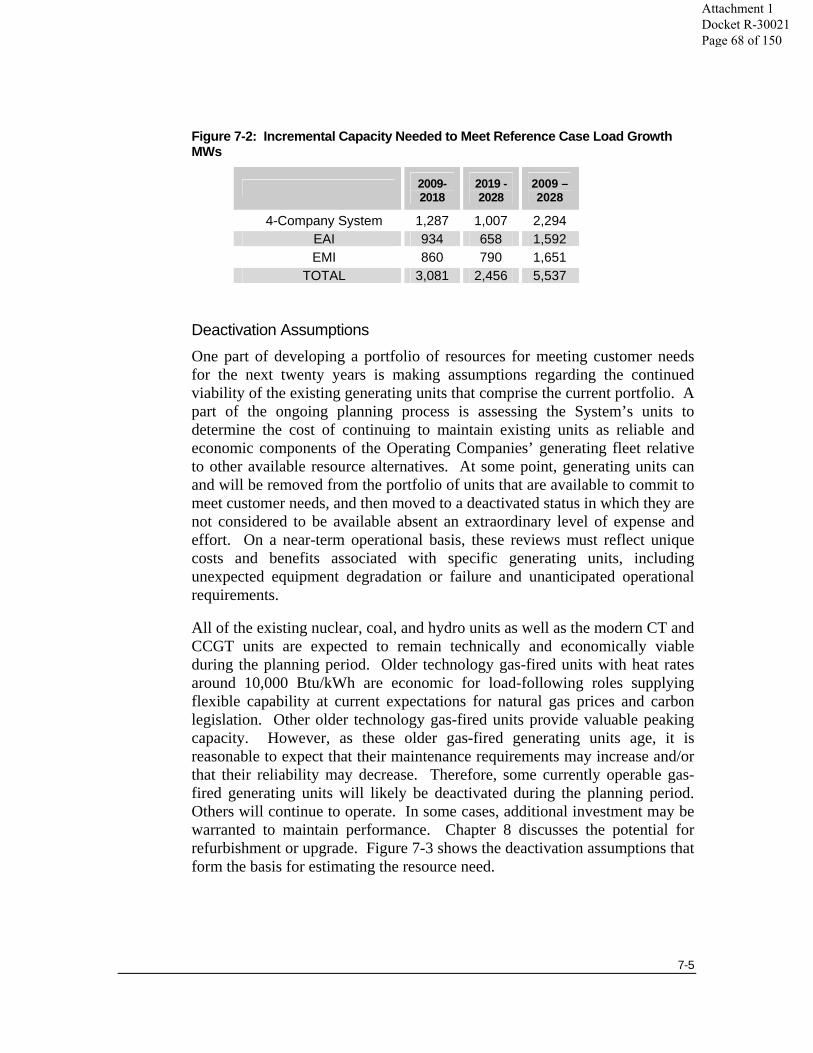
7-5
Figure 7-2: Incremental Capacity Needed to Meet Reference Case Load Growth MWs
2009- 2018
2019 - 2028
2009 – 2028
4-Company System 1,287 1,007 2,294 EAI 934 658 1,592 EMI 860 790 1,651
TOTAL 3,081 2,456 5,537
Deactivation Assumptions One part of developing a portfolio of resources for meeting customer needs for the next twenty years is making assumptions regarding the continued viability of the existing generating units that comprise the current portfolio. A part of the ongoing planning process is assessing the System’s units to determine the cost of continuing to maintain existing units as reliable and economic components of the Operating Companies’ generating fleet relative to other available resource alternatives. At some point, generating units can and will be removed from the portfolio of units that are available to commit to meet customer needs, and then moved to a deactivated status in which they are not considered to be available absent an extraordinary level of expense and effort. On a near-term operational basis, these reviews must reflect unique costs and benefits associated with specific generating units, including unexpected equipment degradation or failure and unanticipated operational requirements.
All of the existing nuclear, coal, and hydro units as well as the modern CT and CCGT units are expected to remain technically and economically viable during the planning period. Older technology gas-fired units with heat rates around 10,000 Btu/kWh are economic for load-following roles supplying flexible capability at current expectations for natural gas prices and carbon legislation. Other older technology gas-fired units provide valuable peaking capacity. However, as these older gas-fired generating units age, it is reasonable to expect that their maintenance requirements may increase and/or that their reliability may decrease. Therefore, some currently operable gas-fired generating units will likely be deactivated during the planning period. Others will continue to operate. In some cases, additional investment may be warranted to maintain performance. Chapter 8 discusses the potential for refurbishment or upgrade. Figure 7-3 shows the deactivation assumptions that form the basis for estimating the resource need.
Attachment 1 Docket R-30021 Page 68 of 150
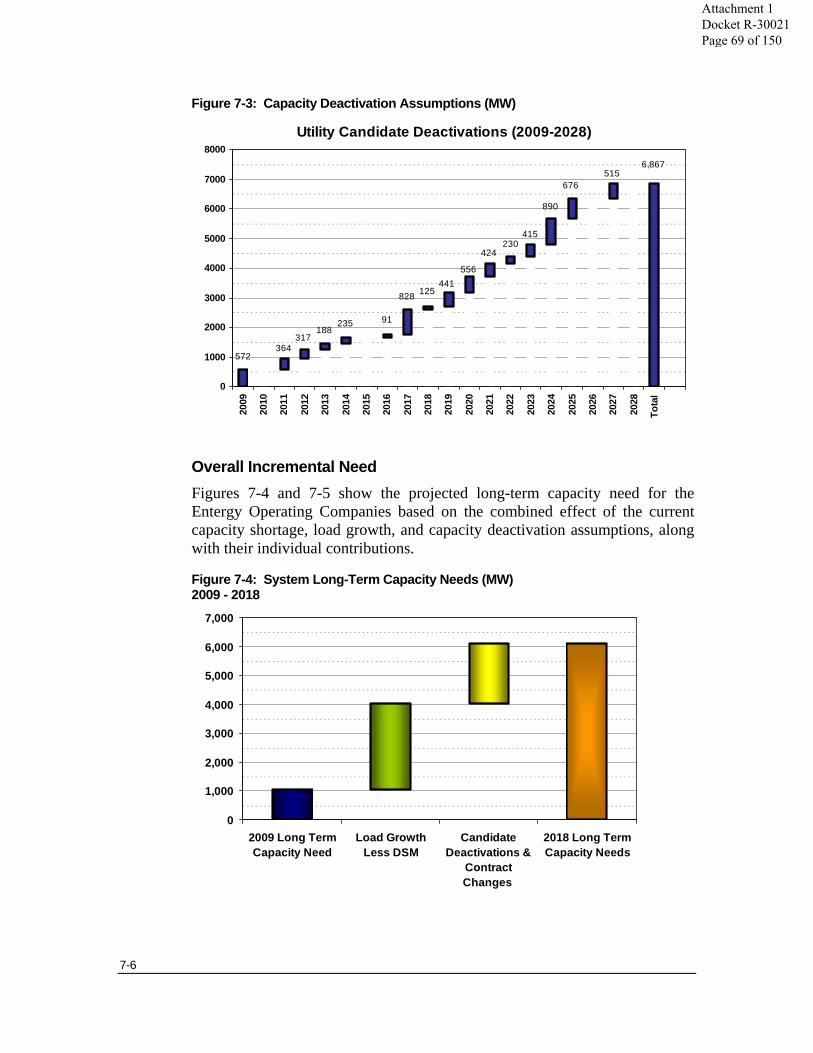
7-6
Figure 7-3: Capacity Deactivation Assumptions (MW)
Overall Incremental Need Figures 7-4 and 7-5 show the projected long-term capacity need for the Entergy Operating Companies based on the combined effect of the current capacity shortage, load growth, and capacity deactivation assumptions, along with their individual contributions.
Figure 7-4: System Long-Term Capacity Needs (MW) 2009 - 2018
Utility Candidate Deactivations (2009-2028)
6,867515
676
890
415230
424
556441
125828
91235188
317364
572
0
1000
2000
3000
4000
5000
6000
7000
8000
2009
2010
2011
2012
2013
2014
2015
2016
2017
2018
2019
2020
2021
2022
2023
2024
2025
2026
2027
2028
Tota
l
0
1,000
2,000
3,000
4,000
5,000
6,000
7,000
2009 Long TermCapacity Need
Load GrowthLess DSM
CandidateDeactivations &
ContractChanges
2018 Long TermCapacity Needs
Attachment 1 Docket R-30021 Page 69 of 150
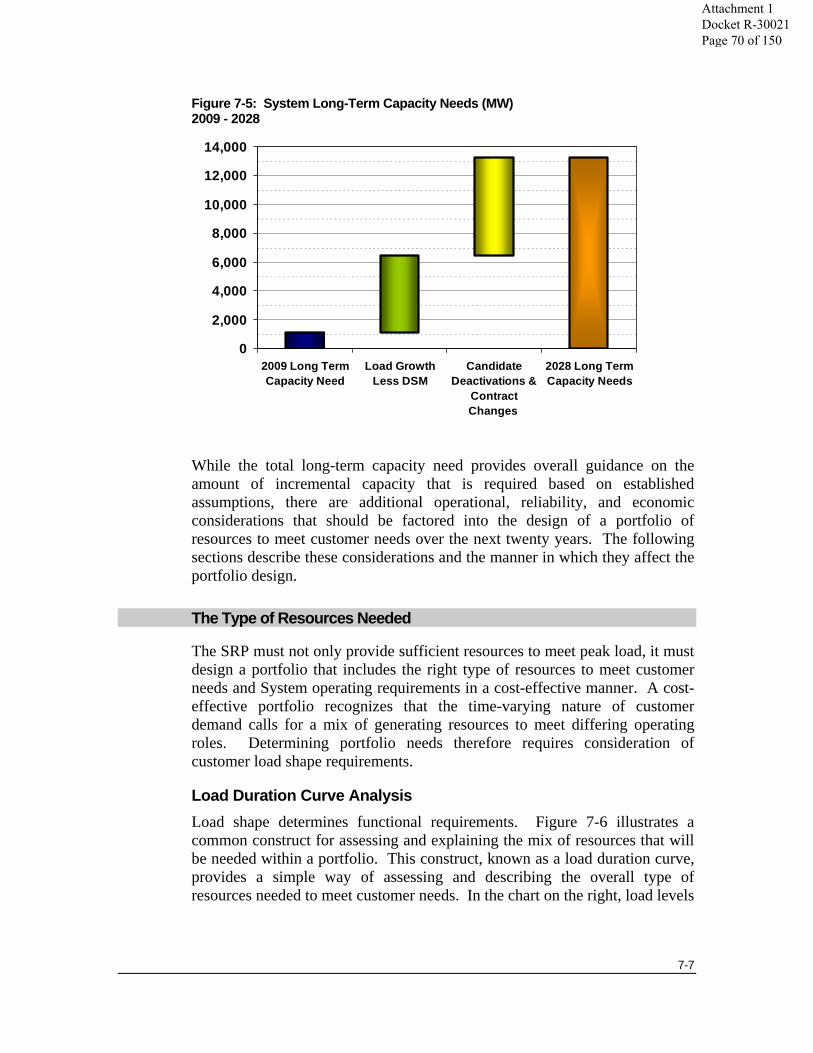
7-7
Figure 7-5: System Long-Term Capacity Needs (MW) 2009 - 2028
While the total long-term capacity need provides overall guidance on the amount of incremental capacity that is required based on established assumptions, there are additional operational, reliability, and economic considerations that should be factored into the design of a portfolio of resources to meet customer needs over the next twenty years. The following sections describe these considerations and the manner in which they affect the portfolio design.
The Type of Resources Needed
The SRP must not only provide sufficient resources to meet peak load, it must design a portfolio that includes the right type of resources to meet customer needs and System operating requirements in a cost-effective manner. A cost-effective portfolio recognizes that the time-varying nature of customer demand calls for a mix of generating resources to meet differing operating roles. Determining portfolio needs therefore requires consideration of customer load shape requirements.
Load Duration Curve Analysis Load shape determines functional requirements. Figure 7-6 illustrates a common construct for assessing and explaining the mix of resources that will be needed within a portfolio. This construct, known as a load duration curve, provides a simple way of assessing and describing the overall type of resources needed to meet customer needs. In the chart on the right, load levels
0
2,000
4,000
6,000
8,000
10,000
12,000
14,000
2009 Long TermCapacity Need
Load GrowthLess DSM
CandidateDeactivations &
ContractChanges
2028 Long TermCapacity Needs
Attachment 1 Docket R-30021 Page 70 of 150

7-8
are shown on the vertical axis. The curve represents load over the period of a year sorted from the highest load level to the lowest. Points along the curve indicate the MW levels of capacity needed to meet generalized supply roles.
Figure 7-6: Illustrative Load Duration Curve Analysis
The results of load duration curve are used throughout this report to describe the resource needs for the Entergy Operating Companies and for assessing how well resources are matched to load shape requirements. However, load duration curve analysis, while a valuable tool, also has limitations. The results of load shape analysis are intended as general guidelines for portfolio planning purposes without consideration of practical operational requirements. As described later in this chapter, the System must have sufficient flexible capacity to meet and respond to changing load conditions. The load duration curve analysis does not address this requirement. Moreover, in assessing existing resources relative to load shape requirements, each unit has been assigned within a specific supply role. In actuality, the distinction between supply roles is neither sharp nor static.
Supply Roles This SRP Update considered a number of generalized supply roles in assessing long-term resource needs. The supply role requirements, which are intended as general guidelines for portfolio planning purposes without consideration of practical operational requirements, are described as follows:
Baseload The baseload requirement is the aggregate customer demand for electricity that persists most hours of the year. As a guideline, baseload requirements are defined as the level of firm load that is served 85% of the hours in a year.
Chronological Hours (One Year)
ENTERGY SYSTEM HOURLY LOAD
Max Load~ 21 GW
Min Load~ 11 GW
GENERATION CAPACITY REQUIREMENTS
Load Duration Curve Rearranges Hourly Load
MW
Reserve
Base Load
Load Following
Peaking
MW
Attachment 1 Docket R-30021 Page 71 of 150

7-9
Core Load Following The core load following requirement is the aggregate customer demand for electricity that is greater than baseload requirement, but less than seasonal load following requirement. As a guideline, core load following requirements are defined as the level of firm load that is served more than 85% of the hours in a year, but less than 30% of the hours of the year.
Seasonal Load Following The seasonal load following requirement is the aggregate customer demand for electricity that is greater than core load following requirement, but less than peaking requirement. As a guideline, seasonal dispatch requirements are defined as the level of firm load that is served more than 30% of the hours in a year, but less than 15% of the hours of the year.
Peaking The peaking requirement is the aggregate customer demand for electricity that is greater than seasonal load following requirement, but less than reserve requirement. As a guideline, seasonal dispatch requirements are defined as the level of firm load that is served more than 15% of the hours in a year.
Reserve The target reserve margin, described earlier, is used to maintain reliability by protecting against unplanned and unknown circumstances.
Consistent with the identified supply role requirements, resource alternatives appropriate for serving each supply role can be identified. Each resource alternative has its own unique cost and performance characteristics that allow it to be functionally and economically suited to serving certain supply roles. Existing resources are matched with supply role requirements as follows:
Technology Considerations Because the cost and performance characteristics of technologies differ, no single technology or generation type economically meets the diverse planning objectives of the SRP. For example, the economic alternatives for base load operation typically cost more to construct on a per-megawatt (“MW”) basis than peaking resources but operate with relatively low variable cost. Despite its relatively high construction cost, a base load resource can be the most economic alternative to serve the base load supply role, because the resource is expected to operate in most hours at high utilization levels. Consequently, its capital cost is spread over many megawatt hours (“MWh”) of output, resulting in a relatively low cost on a $/MWh basis. Conversely, a peaking unit is expected to operate at low capacity utilization levels. As such, the most economic alternatives for peaking and reserve capacity would be a unit
Attachment 1 Docket R-30021 Page 72 of 150
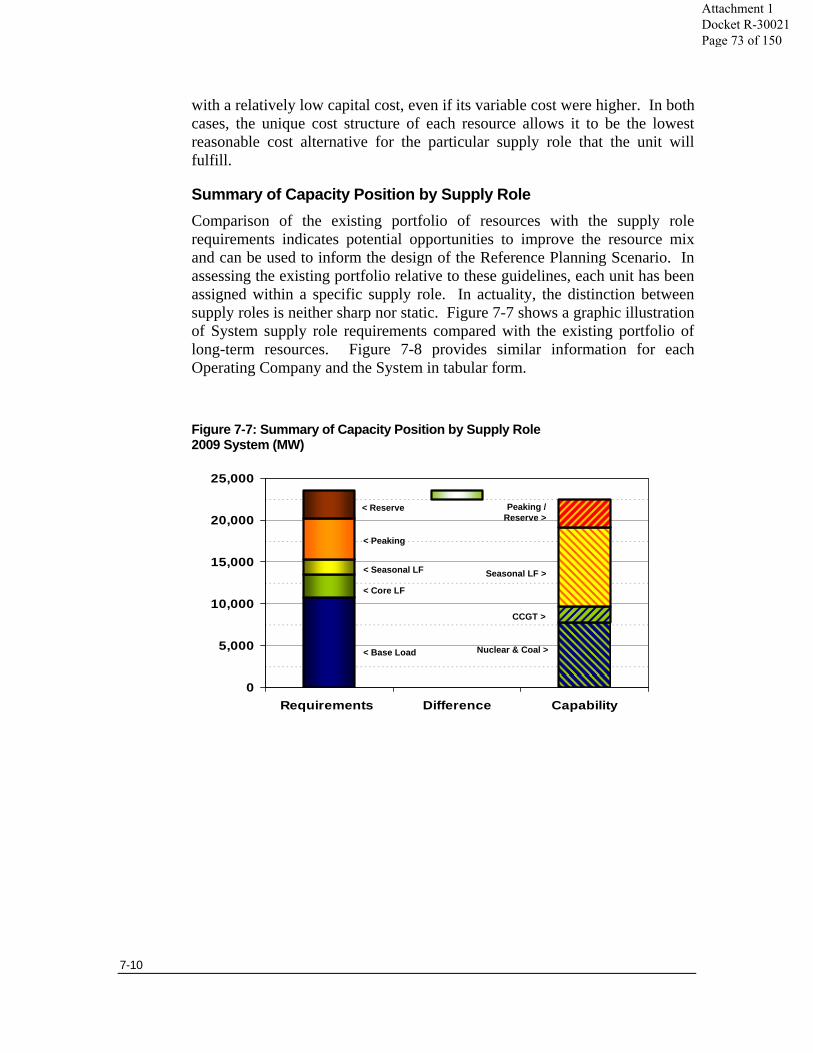
7-10
with a relatively low capital cost, even if its variable cost were higher. In both cases, the unique cost structure of each resource allows it to be the lowest reasonable cost alternative for the particular supply role that the unit will fulfill.
Summary of Capacity Position by Supply Role Comparison of the existing portfolio of resources with the supply role requirements indicates potential opportunities to improve the resource mix and can be used to inform the design of the Reference Planning Scenario. In assessing the existing portfolio relative to these guidelines, each unit has been assigned within a specific supply role. In actuality, the distinction between supply roles is neither sharp nor static. Figure 7-7 shows a graphic illustration of System supply role requirements compared with the existing portfolio of long-term resources. Figure 7-8 provides similar information for each Operating Company and the System in tabular form.
Figure 7-7: Summary of Capacity Position by Supply Role 2009 System (MW)
0
5,000
10,000
15,000
20,000
25,000
Requirements Difference Capability
Peaking / Reserve >
< Reserve
Nuclear & Coal >< Base Load
< Core LF
< Seasonal LF
< Peaking
CCGT >
Seasonal LF >
Attachment 1 Docket R-30021 Page 73 of 150
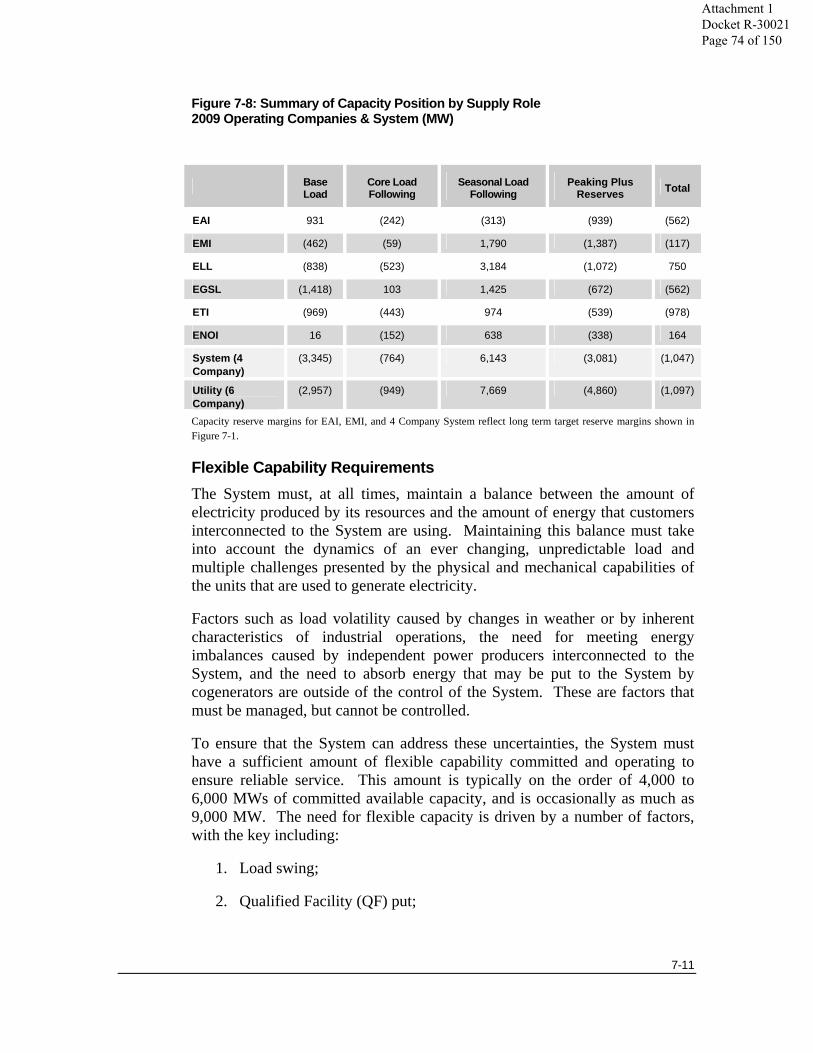
7-11
Figure 7-8: Summary of Capacity Position by Supply Role 2009 Operating Companies & System (MW)
Base Load
Core Load Following
Seasonal Load Following
Peaking Plus Reserves Total
EAI 931 (242) (313) (939) (562)
EMI (462) (59) 1,790 (1,387) (117)
ELL (838) (523) 3,184 (1,072) 750
EGSL (1,418) 103 1,425 (672) (562)
ETI (969) (443) 974 (539) (978)
ENOI 16 (152) 638 (338) 164
System (4 Company)
(3,345) (764) 6,143 (3,081) (1,047)
Utility (6 Company)
(2,957) (949) 7,669 (4,860) (1,097)
Capacity reserve margins for EAI, EMI, and 4 Company System reflect long term target reserve margins shown in Figure 7-1.
Flexible Capability Requirements The System must, at all times, maintain a balance between the amount of electricity produced by its resources and the amount of energy that customers interconnected to the System are using. Maintaining this balance must take into account the dynamics of an ever changing, unpredictable load and multiple challenges presented by the physical and mechanical capabilities of the units that are used to generate electricity.
Factors such as load volatility caused by changes in weather or by inherent characteristics of industrial operations, the need for meeting energy imbalances caused by independent power producers interconnected to the System, and the need to absorb energy that may be put to the System by cogenerators are outside of the control of the System. These are factors that must be managed, but cannot be controlled.
To ensure that the System can address these uncertainties, the System must have a sufficient amount of flexible capability committed and operating to ensure reliable service. This amount is typically on the order of 4,000 to 6,000 MWs of committed available capacity, and is occasionally as much as 9,000 MW. The need for flexible capacity is driven by a number of factors, with the key including:
1. Load swing;
2. Qualified Facility (QF) put;
Attachment 1 Docket R-30021 Page 74 of 150
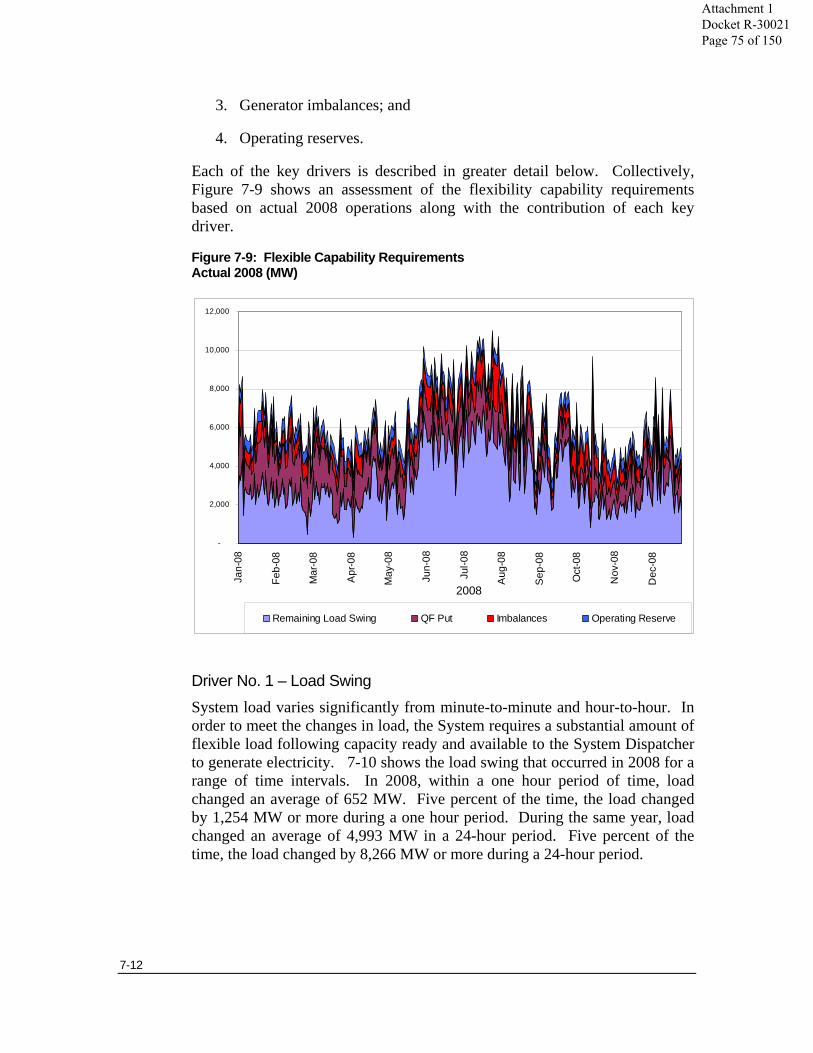
7-12
3. Generator imbalances; and
4. Operating reserves.
Each of the key drivers is described in greater detail below. Collectively, Figure 7-9 shows an assessment of the flexibility capability requirements based on actual 2008 operations along with the contribution of each key driver.
Figure 7-9: Flexible Capability Requirements Actual 2008 (MW)
-
2,000
4,000
6,000
8,000
10,000
12,000
Jan-
08
Feb-
08
Mar
-08
Apr
-08
May
-08
Jun-
08
Jul-0
8
Aug
-08
Sep
-08
Oct
-08
Nov
-08
Dec
-08
Remaining Load Swing QF Put Imbalances Operating Reserve
2008
Driver No. 1 – Load Swing System load varies significantly from minute-to-minute and hour-to-hour. In order to meet the changes in load, the System requires a substantial amount of flexible load following capacity ready and available to the System Dispatcher to generate electricity. 7-10 shows the load swing that occurred in 2008 for a range of time intervals. In 2008, within a one hour period of time, load changed an average of 652 MW. Five percent of the time, the load changed by 1,254 MW or more during a one hour period. During the same year, load changed an average of 4,993 MW in a 24-hour period. Five percent of the time, the load changed by 8,266 MW or more during a 24-hour period.
Attachment 1 Docket R-30021 Page 75 of 150
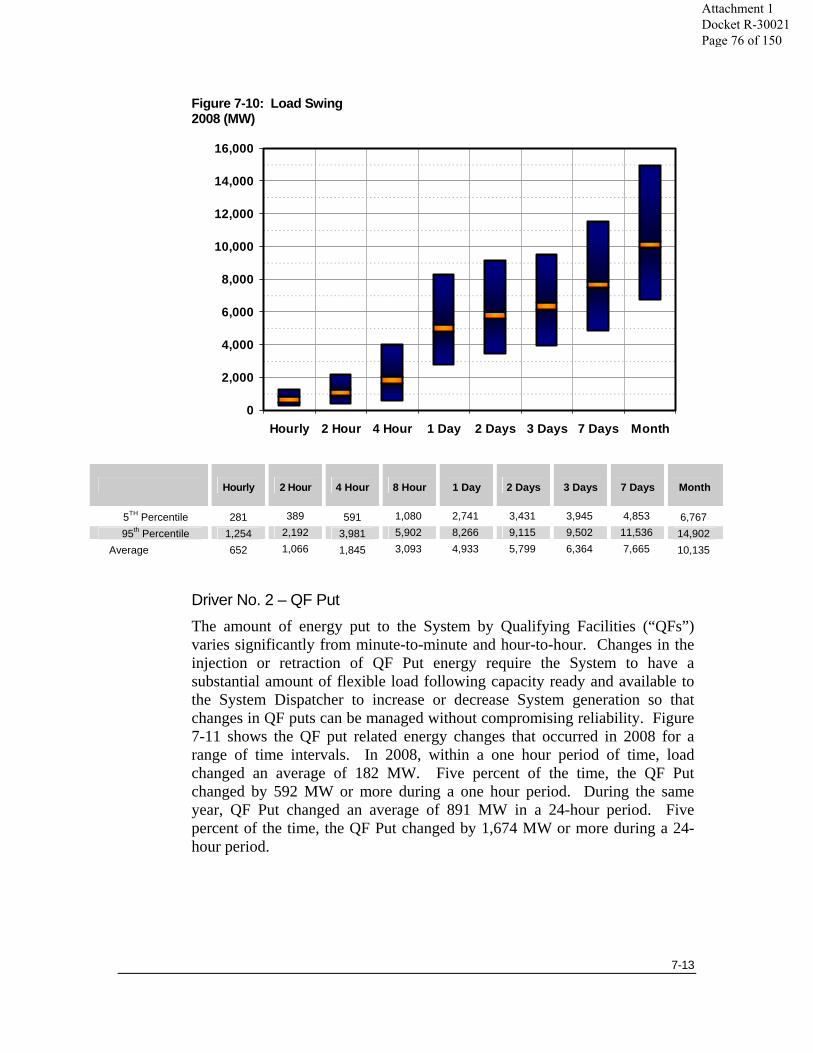
7-13
Figure 7-10: Load Swing 2008 (MW)
Hourly 2 Hour 4 Hour 8 Hour 1 Day 2 Days 3 Days 7 Days Month
5TH Percentile 281 389 591 1,080 2,741 3,431 3,945 4,853 6,767 95th Percentile 1,254 2,192 3,981 5,902 8,266 9,115 9,502 11,536 14,902
Average 652 1,066 1,845 3,093 4,933 5,799 6,364 7,665 10,135
Driver No. 2 – QF Put The amount of energy put to the System by Qualifying Facilities (“QFs”) varies significantly from minute-to-minute and hour-to-hour. Changes in the injection or retraction of QF Put energy require the System to have a substantial amount of flexible load following capacity ready and available to the System Dispatcher to increase or decrease System generation so that changes in QF puts can be managed without compromising reliability. Figure 7-11 shows the QF put related energy changes that occurred in 2008 for a range of time intervals. In 2008, within a one hour period of time, load changed an average of 182 MW. Five percent of the time, the QF Put changed by 592 MW or more during a one hour period. During the same year, QF Put changed an average of 891 MW in a 24-hour period. Five percent of the time, the QF Put changed by 1,674 MW or more during a 24-hour period.
0
2,000
4,000
6,000
8,000
10,000
12,000
14,000
16,000
Hourly 2 Hour 4 Hour 1 Day 2 Days 3 Days 7 Days Month
Attachment 1 Docket R-30021 Page 76 of 150

7-14
Figure 7-11: QF Put 2008 (MW)
1 Hour 2 Hours 4 Hours 8 Hours 12 Hours
16 Hours 24 Hours
5TH Percentile 30 42 63 178 263 294 346 95th Percentile 592 817 1,053 1,273 1,367 1,534 1,674
Average 182 277 408 629 710 819 891
Driver No. 3 – Generator Imbalances When a merchant generator does not deliver enough energy to the transmission system to meet the amount of energy that is scheduled for delivery, the System must increase the output of one or more of the Operating Companies’ generators to make up the difference between what the merchant generator said it would deliver and what it did deliver; this “make-up” energy is necessary to maintain the balance between generation and load. If the merchant generator delivers more energy than is called for under the schedule, then the System must decrease the output of the Operating Companies’ generators to accept the excess energy necessary to maintain the balance between generation and load. Because no notice is provided by the merchant generators of such imbalances, the adjustment of the output of Entergy System generators must occur on a moment-to-moment basis.
0
200
400
600
800
1,000
1,200
1,400
1,600
1,800
1 Hour 2 Hours 4 Hours 8 Hours 12 Hours 16 Hours 24 Hours
Attachment 1 Docket R-30021 Page 77 of 150

7-15
Driver No. 4 – Operating Reserves Operating reserves are provided by sources of power that can be called upon within a short period of time in the event of a contingency, such as the sudden loss of a generator or transmission line. The operating reserve requirement can only be met on the System by generating units that are committed, unloaded, and ready to respond.
Locational Considerations
The area planning process evaluates the physical and operational practicalities that define regional reliability issues, which must be considered when planning for resource needs. For planning purposes, the region served by the Entergy Operating Companies is divided into four major planning areas and two sub-areas which are determined based on the ability to transfer power between areas as defined by the available transfer capability, the location and amount of load, and the location and amount of generation.
The area planning process evaluates the reliability and economic needs of the planning areas to identify supply needs within areas of the Entergy System, evaluate supply options to meet those needs, and establish targeted regional supply portfolios. Consistent with and supportive of the overall SRP objectives, the area planning process influences siting decisions and priorities for resource additions. The area planning process identified the following resource needs during the period 2009 - 20181:
• WOTAB, approximately 500 MW as early as 2011 to support WOTAB needs; and
• Western, approximately 500 MW as early as 2014 to support Western and WOTAB needs; and
• DSG, approximately 500 MW as early as 2015 to support DSG and Amite South needs.
Detailed assumptions regarding area supply requirements have been reflected in the first 10 years of the planning horizon.
Reliance On Limited-Term Power
The SRP assumes that reliability requirements are met largely from long-term resources, whether owned assets or long-term power purchase agreements. The emphasis on long-term resource mitigates exposure to price volatility and
1 See Chapter 2 for a description and the location of each planning region.
Attachment 1 Docket R-30021 Page 78 of 150

7-16
ensures the availability of resources sufficient to meet long-term reliability needs.
Although the bulk of reliability requirements will be met from long-term resources, a significant portion of resources will be provided by short and limited-term products. Depending on the particular year, the Reference Planning Scenario assumes the inclusion within the portfolio of about 700 to 2,000 MWs of limited-term power purchases consisting of a variety of products. Each year, the Operating Companies expect to purchase several hundred MW of dispatchable load-following generation unit capacity from CCGT or CT generators, pursuant to multi-year unit capacity purchase agreements and multi-year unit capacity call options. In addition to multi-year unit capacity purchases, the Operating Companies expect to make seasonal and annual power purchases using products such as call options, firm block-energy or liquidated damages products, or other purchased power resources through the use of multiple procurement processes including formal Requests for Proposals.
Attachment 1 Docket R-30021 Page 79 of 150
8-1
. . . . . . .. . . Chapter 8
Current Resource Portfolio Challenges and Opportunities
Overview
This chapter describes the existing portfolio of generating units used to serve the Operating Companies’ customers. The existing portfolio of generating units provides an economical source of flexible and reliable resources. However, the current portfolio also faces a number of challenges, which are being addressed through the SRP process and ongoing Portfolio Transformation Strategy. In addition to continued operations of the generating units comprising the existing portfolio, there may be opportunities to further enhance the reliability and operational performance of certain units through repowering, refurbishment, and/or upgrades.
Key Conclusions
The current resource portfolio has met customer needs effectively and will provide the foundation for meeting customer needs in the future. Key attributes of the existing portfolio include:
• Nuclear and coal units comprise only about one third of the existing portfolio’s capacity, but account for 69% of the generation produced by the System’s owned resources.
• Existing generating capacity generally benefits from a well established and redundant fuel supply and transmission infrastructure.
• Opportunities may be available to further enhance the effectiveness of certain existing units.
• During this time of uncertainty, the existing generation portfolio provides a valuable low risk alternative.
Attachment 1 Docket R-30021 Page 80 of 150

8-2
General Description
The existing portfolio of generating units has a total combined capability of more than 21,000 MW and is comprised of 77 units, located at 32 plant sites, dispersed throughout the four-state service territory.
Figure 8-1: System Map
The System’s existing portfolio consists predominantly of gas-fired units, as shown in Figure 8-2. Over half of the System’s existing portfolio is over 30 years old, as shown in Figure 8-3. Nuclear and coal assets, while comprising only 34% of capacity, account for about 69% of the generation produced by the System’s owned resources in 2008.
Attachment 1 Docket R-30021 Page 81 of 150
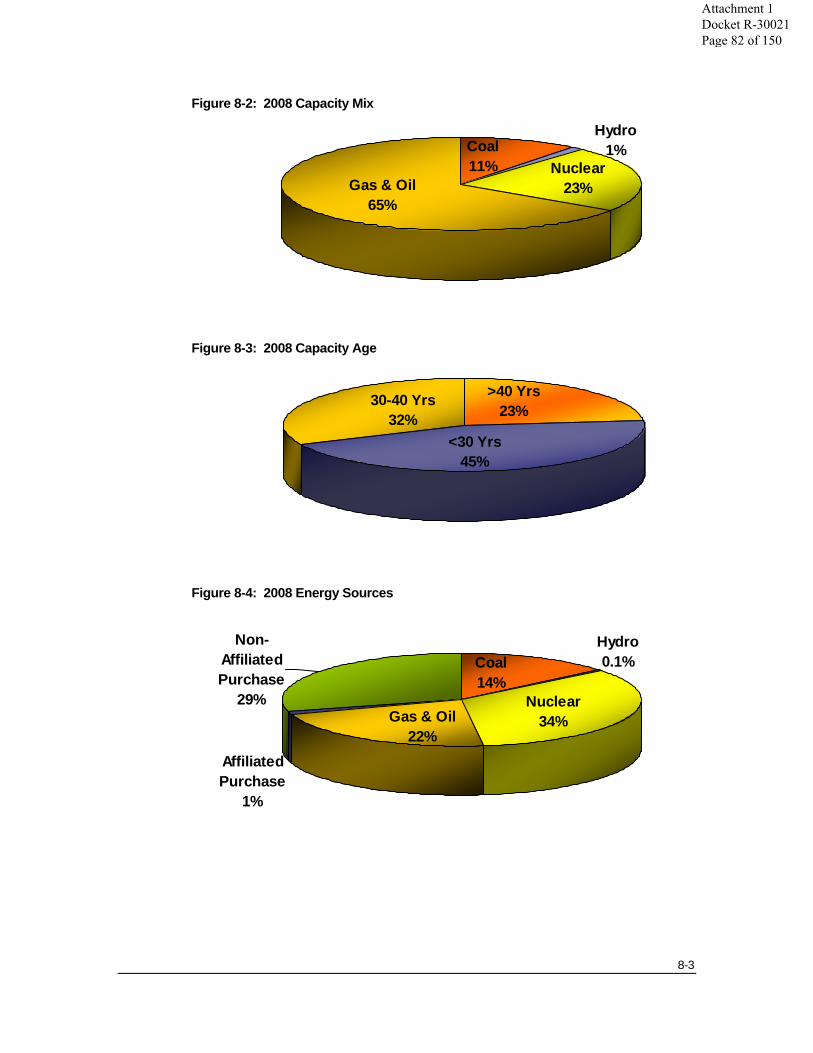
8-3
Figure 8-2: 2008 Capacity Mix Figure 8-3: 2008 Capacity Age Figure 8-4: 2008 Energy Sources
Gas & Oil65%
Hydro1%Coal
11% Nuclear23%
>40 Yrs23%
<30 Yrs45%
30-40 Yrs32%
Gas & Oil22%
Coal14%
Hydro0.1%
Affiliated Purchase
1%
Nuclear34%
Non-Affiliated Purchase
29%
Attachment 1 Docket R-30021 Page 82 of 150
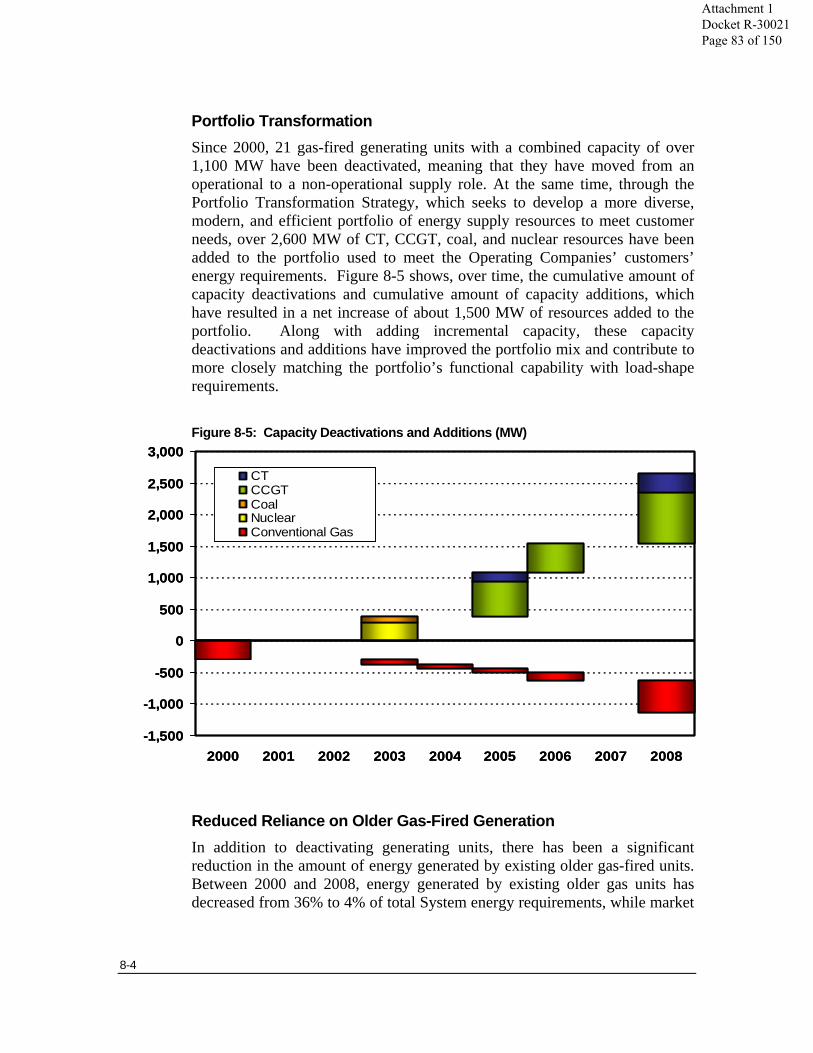
8-4
Portfolio Transformation Since 2000, 21 gas-fired generating units with a combined capacity of over 1,100 MW have been deactivated, meaning that they have moved from an operational to a non-operational supply role. At the same time, through the Portfolio Transformation Strategy, which seeks to develop a more diverse, modern, and efficient portfolio of energy supply resources to meet customer needs, over 2,600 MW of CT, CCGT, coal, and nuclear resources have been added to the portfolio used to meet the Operating Companies’ customers’ energy requirements. Figure 8-5 shows, over time, the cumulative amount of capacity deactivations and cumulative amount of capacity additions, which have resulted in a net increase of about 1,500 MW of resources added to the portfolio. Along with adding incremental capacity, these capacity deactivations and additions have improved the portfolio mix and contribute to more closely matching the portfolio’s functional capability with load-shape requirements.
Figure 8-5: Capacity Deactivations and Additions (MW)
Reduced Reliance on Older Gas-Fired Generation In addition to deactivating generating units, there has been a significant reduction in the amount of energy generated by existing older gas-fired units. Between 2000 and 2008, energy generated by existing older gas units has decreased from 36% to 4% of total System energy requirements, while market
-1,500
-1,000
-500
0
500
1,000
1,500
2,000
2,500
3,000
2000 2001 2002 2003 2004 2005 2006 2007 2008
CTCCGTCoalNuclearConventional Gas
-1,500
-1,000
-500
0
500
1,000
1,500
2,000
2,500
3,000
2000 2001 2002 2003 2004 2005 2006 2007 2008
CTCCGTCoalNuclearConventional Gas
Attachment 1 Docket R-30021 Page 83 of 150
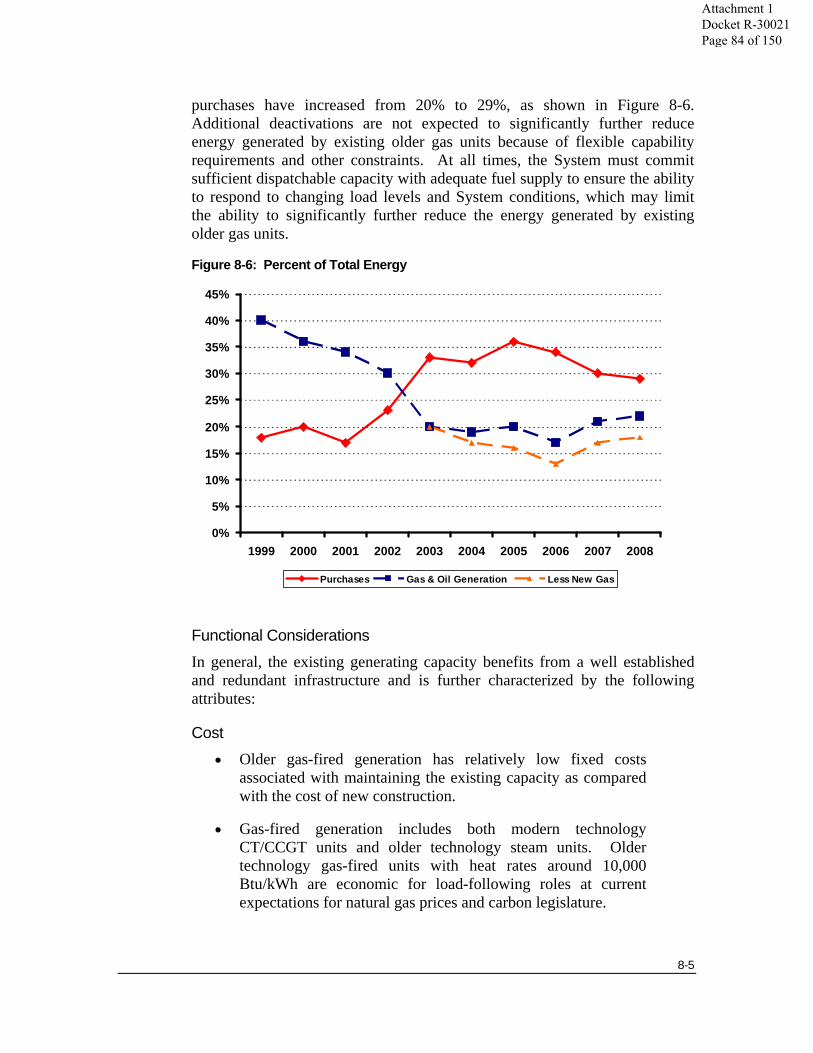
8-5
purchases have increased from 20% to 29%, as shown in Figure 8-6. Additional deactivations are not expected to significantly further reduce energy generated by existing older gas units because of flexible capability requirements and other constraints. At all times, the System must commit sufficient dispatchable capacity with adequate fuel supply to ensure the ability to respond to changing load levels and System conditions, which may limit the ability to significantly further reduce the energy generated by existing older gas units.
Figure 8-6: Percent of Total Energy
0%
5%
10%
15%
20%
25%
30%
35%
40%
45%
1999 2000 2001 2002 2003 2004 2005 2006 2007 2008
Purchases Gas & Oil Generation Less New Gas
Functional Considerations In general, the existing generating capacity benefits from a well established and redundant infrastructure and is further characterized by the following attributes:
Cost • Older gas-fired generation has relatively low fixed costs
associated with maintaining the existing capacity as compared with the cost of new construction.
• Gas-fired generation includes both modern technology CT/CCGT units and older technology steam units. Older technology gas-fired units with heat rates around 10,000 Btu/kWh are economic for load-following roles at current expectations for natural gas prices and carbon legislature.
Attachment 1 Docket R-30021 Page 84 of 150

8-6
Location • The existing portfolio of generating units is geographically
dispersed, which enhances reliability by reducing exposure to coincident outages.
• Many of the existing plant sites are located near major load centers.
Fuel • Most of the gas-fired generators have access to multiple gas
pipelines, which improves reliability and flexibility of the fuel supply. Additionally, several generating units are connected to the Spindletop gas storage facility further enhancing reliability and flexibility of the fuel supply.
• A number of the gas units are “dual fuel” units that also are capable of operating on fuel oil in the event of gas supply disruptions. Plant sites with units capable of burning fuel oil have storage tanks that provide on-site inventory.
• Sites with coal units maintain on-site inventory to protect against potential fuel shortages for reasons such as supply disruptions, equipment failures, and measurement and delivery uncertainties.
Transmission • Most units have redundant transmission outlet capacity that
allows the units to deliver power when transmission elements are removed from service for maintenance or unplanned forced outages.
Operational Flexibility • Many of the units are equipped with automatic generation
control that allows them to respond to instantaneous changes in load demand without operator involvement.
• Many of the units have large turndown ratios (ratio of maximum capacity to minimum capacity) that provide a wide operating range allowing them to adjust their output as load demand changes.
Attachment 1 Docket R-30021 Page 85 of 150
8-7
Current Portfolio Challenges
Overall, the System faces a number of challenges with respect to generation supply. Additional challenges pertaining to individual Operating Companies and the Entergy System post exit of EAI and EMI are discussed in subsequent sections.
Challenge No. 1 – Capacity Shortage • The amount of generation that the System either owns or
controls on a long-term basis is currently about 1 GW short of meeting the System’s reliability requirement. This assessment is based on the current capability ratings of the existing operating fleet, the expected peak load requirement, and the planning reserve margin target.
• Capacity requirements are expected to grow by approximately 600 MW/year on average over the next twenty years due to growth in projected peak load and expected deactivation of some of the System’s less economic generating units.
Challenge No. 2 – Aging Fleet • More than 55% of the existing oil and gas-fired generating
units are greater than 30 years old.
• As generating units age, it is reasonable to expect that their maintenance requirements may increase and/or that their reliability may decrease.
Challenge No. 3 – Portfolio Mix • The existing generation portfolio is not functionally matched to
projected load requirements. The current portfolio has too few lower-cost baseload generating resources.
• Load shape analysis indicates that the optimal portfolio mix would include additional stable-priced resources for baseload needs and modern efficient CCGT and CT resources for load-following and flexible capability needs.
Challenge No. 4 – Transmission System • With the additional usage of the Entergy Transmission System
resulting from the recent addition of merchant and QF
Attachment 1 Docket R-30021 Page 86 of 150

8-8
facilities, there is increasing congestion on the transmission system. This congestion can, at times, affect the ability to dispatch the System’s generating resources.
Challenge No. 5 – Exposure to Gas Prices • The variable cost of existing energy production is highly
correlated to natural gas prices resulting in extremely volatile (and high in the recent past) fuel-related energy costs.
Challenge No. 6 – Flexible Capability Requirement • The System must, at all times, have a sufficient amount of
flexible capability committed and operating to ensure reliable service. The measure of capacity flexibility is multifaceted and variable.
• The amount of flexible capacity that must be operating at any particular time is typically on the order of 4,000 to 6,000 MWs. At times during the year, the amount of flexible capacity that must be committed can be as much as 9,000 MWs.
Challenge No. 7 – Potential Legislative Requirements
• As discussed elsewhere in this SRP, the potential for carbon legislation and/or the adoption of a federal renewable portfolio standard represents uncertainties that could have significant implications for long term portfolio decisions.
Progress on addressing these challenges has been made through the SRP process and through the pursuit of the Portfolio Transformation Strategy, which has led to the deactivation of several older gas-fired generating units and the addition of several resources since 2003 including stable-priced resources for baseload needs and modern efficient CCGT and CT generating units.
Flexible Capability Sources The System currently uses its existing gas and oil generating units to provide load-following capacity and operational flexibility. The almost 15,000 MW of gas and oil-fired capacity on the System can provide almost 11,000 MW of load-following capability. The availability of flexible fuel supplies is critical to ensuring that generating units can actually operate in a flexible, load-following role. Many of the System’s gas and oil units have access to multiple pipelines, which enables the System to operate the units in a more flexible manner. In addition, a subset of units also has dual-fuel capability and can burn fuel oil from storage on-site for added flexibility. In addition to
Attachment 1 Docket R-30021 Page 87 of 150
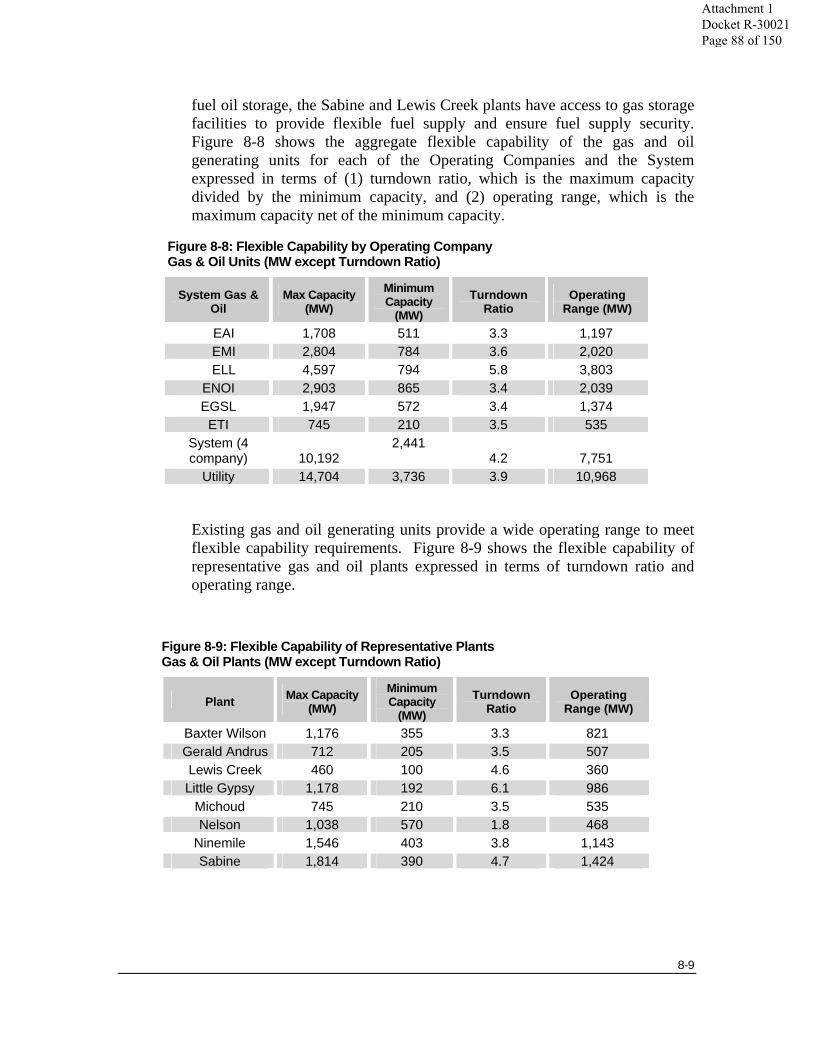
8-9
fuel oil storage, the Sabine and Lewis Creek plants have access to gas storage facilities to provide flexible fuel supply and ensure fuel supply security. Figure 8-8 shows the aggregate flexible capability of the gas and oil generating units for each of the Operating Companies and the System expressed in terms of (1) turndown ratio, which is the maximum capacity divided by the minimum capacity, and (2) operating range, which is the maximum capacity net of the minimum capacity.
Figure 8-8: Flexible Capability by Operating Company Gas & Oil Units (MW except Turndown Ratio)
System Gas & Oil
Max Capacity (MW)
Minimum Capacity
(MW) Turndown
Ratio Operating
Range (MW)
EAI 1,708 511 3.3 1,197 EMI 2,804 784 3.6 2,020 ELL 4,597 794 5.8 3,803
ENOI 2,903 865 3.4 2,039 EGSL 1,947 572 3.4 1,374
ETI 745 210 3.5 535 System (4 company) 10,192
2,441 4.2 7,751
Utility 14,704 3,736 3.9 10,968
Existing gas and oil generating units provide a wide operating range to meet flexible capability requirements. Figure 8-9 shows the flexible capability of representative gas and oil plants expressed in terms of turndown ratio and operating range.
Figure 8-9: Flexible Capability of Representative Plants Gas & Oil Plants (MW except Turndown Ratio)
Plant Max Capacity (MW)
Minimum Capacity
(MW) Turndown
Ratio Operating
Range (MW)
Baxter Wilson 1,176 355 3.3 821 Gerald Andrus 712 205 3.5 507 Lewis Creek 460 100 4.6 360 Little Gypsy 1,178 192 6.1 986
Michoud 745 210 3.5 535 Nelson 1,038 570 1.8 468
Ninemile 1,546 403 3.8 1,143 Sabine 1,814 390 4.7 1,424
Attachment 1 Docket R-30021 Page 88 of 150

8-10
Opportunities
Although the existing generation portfolio faces challenges, it provides a significant adaptable resource during a time when the current environment for resource planning is characterized by uncertainty in environmental regulations, construction costs, capital constraints, and fuel supply. These resources represent potential alternatives for economically meeting customers’ needs through continued operations, repowering, refurbishment, and/or upgrades. The optionality provided by the existing generation portfolio provides a valuable low risk alternative during this time of uncertainty.
Continued Operations As part of the ongoing planning process, the existing units are assessed to determine their ability to economically remain in the portfolio relative to other available resource alternatives. All of the existing nuclear, coal, and hydro units as well as the modern CT and CCGT units are expected to remain viable during the planning period. Older technology gas fired units with heat rates around 10,000 Btu/kWh are economic for load following roles at current expectations for natural gas prices and carbon legislature. Some currently operable gas-fired generating units will likely be deactivated during the planning period; however, the decision to deactivate a generating unit will be made contemporaneously using the best information available at that time.
Repowering Repowering involves replacing the existing steam supply of an existing generating unit with a new, more efficient steam source. This may consist of coupling a CT and heat recovery steam generator (“HRSG”) or a new solid-fueled boiler to the steam turbine of an existing generating unit. In the case of a CT with a HRSG, steam generated using the CT waste heat is sent to the existing steam turbine. Once repowered, the unit has performance, operating, and design characteristics similar to that of a new CCGT. Use of the existing steam turbine and other plant infrastructure can result in significant cost savings compared to building a new CCGT. Considering the technology design and capacity size, several of the existing gas-fired generating units are candidates for repowering.
Refurbishment and Upgrade (Plant Betterment) Plant betterment activities, involve proactive repair and replacement of specific components to maintain capability and safety of a generating unit. These repairs and replacements are consistent with the original equipment manufacturer / vendor recommendations and good utility practice. Some of the existing gas-fired generating units may be candidates for refurbishment and/or upgrade beyond proactive repair and replacement.
Attachment 1 Docket R-30021 Page 89 of 150
8-11
As part of the planning process, the existing units are assessed to determine their ability to economically remain in the portfolio relative to other available resource alternatives. This assessment seeks to consider the total supply cost and operational attributes of the existing generating units relative to the available resource alternatives to determine whether the existing units should be removed from the portfolio, phased out of the portfolio over time, proactively maintained in their current state to remain in the portfolio, or refurbished and/or upgraded to remain in the portfolio. Units that are expected to be removed from the portfolio or phased out of the portfolio over time are reflected in the unit deactivation assumptions for assessing capacity needs. Whereas, units that are expected to be maintained in their current state to remain in the portfolio or refurbished and/or upgraded to remain in the portfolio defer the need for new capacity additions.
To develop a long-term strategic plan for the existing gas-fired generating units, the expected forward cost and operational attributes of the existing generating units are compared with other resource alternatives. This process begins with defining the future role for the existing gas-fired generating units in terms of operating expectations based on consideration of historical operations, forecasted operations, and other operational needs. Assessments are performed on the generating units to determine their current condition and to estimate the repair and maintenance costs necessary for the generating units to meet the future operating expectations. Additionally, qualitative assessments are used to identify and value the operational characteristics that are inherent in the existing gas-fired generating units, such as flexible capability, fuel security, fuel flexibility, and local reliability support.
For comparison, resource alternatives are identified along with their associated cost and performance characteristics. The expected total supply cost, including both fixed cost and variable cost, of the existing units is compared with the total supply cost of the resource alternatives. In addition to the total supply cost, qualitative assessments of the operational characteristics are used to compare the existing gas-fired generating units with the resource alternatives. Using this information, long-term strategic plans are developed for the existing gas-fired generating units, which includes the expected future role and associated forward cost for proactive maintenance, refurbishment and/or upgrade consistent with that role.
The long-term strategic plans for the existing gas-fired generating units can change because the projected cost to maintain a generating unit can be affected by unexpected equipment degradation or failure and unanticipated operational requirements that significantly impact unit condition. Also, the estimated cost and performance characteristics of the resource alternatives can change over time, and along with changes in the forecasted natural gas and purchase power prices, may affect the economic and operational viability of
Attachment 1 Docket R-30021 Page 90 of 150

8-12
the existing generating units. Therefore, the long-term strategic plans for the existing gas-fired generating units are reassessed as necessary to reflect recent changes and updated forecasts. This on-going assessment results in long-term strategic plans for each of the existing gas-fired generating units, which includes the projected operating expectations and the estimated forward cost to allow the unit to function in that role.
Attachment 1 Docket R-30021 Page 91 of 150
9-1
. . . . . . .. . . Chapter 9
Demand-side Resources Potential and Challenge
Overview
This chapter discusses the role that demand-side management (“DSM”) programs will play in the portfolio of resource alternatives for meeting the long-term power needs of the Entergy Operating Companies’ customers. DSM refers to programs or projects undertaken to manage the demand for electricity by reducing energy use, changing the timing of use, or both. This chapter outlines:
• The basis for DSM assumptions included in the Reference Planning Scenario;
• The level of DSM included in the Reference Planning Scenario; and
• The factors that may affect the deployment of DSM over the planning horizon.
DSM Alternatives The scope of DSM alternatives considered in this plan includes resources that the Operating Companies have or may be able to deploy to manage the level and timing of customers’ energy use over the planning horizon. This includes existing utility-sponsored DSM programs, incremental utility-sponsored DSM programs, and energy efficiency or conservation activities not requiring utility participation. While this chapter focuses on the potential for utility-sponsored DSM as an incremental resource to meet long-term power needs, other DSM resources are briefly described below.
Interruptible Load All of the Entergy Operating Companies offer interruptible load programs that provide an Operating Company with the right to curtail all or some service to a customer that elects to participate. Participating customers pay a lower price for interruptible, non-firm energy consistent with the lower value interruptible service. The SRP planning framework determines the resource needs of the
Attachment 1 Docket R-30021 Page 92 of 150
9-2
Entergy Operating Companies based on peak load reduced for the projected effect of existing interruptible load programs (the “firm peak” load). A further discussion of the assumptions regarding interruptible load programs is presented in the chapter on the Load Forecast.
Existing Utility-sponsored DSM Programs Entergy Texas, Inc. (“ETI”) has offered energy efficiency programs since 2002. Texas legislation passed in 1999 mandated energy efficiency programs to reduce peak demand. The original legislative goal aimed to reduce peak demand by 10% of annual growth. For ETI, this averaged about 5-6 MW per year. Subsequent legislation increased the goal to 15% of annual growth in 2008 and 20% of annual growth beginning in 2009. ETI recovers expenditures for these programs through an Energy Efficiency Rider that collects funds expended in the previous year. ETI is also eligible to receive bonus recovery for exceeding energy efficiency targets. From 2002 to 2008, ETI achieved more than 34 MW of cumulative peak demand savings. Because these programs are of significant size and have been in place for more than 7 years, the impact of these programs is discernable in ETI’s electricity sales. The ongoing impact of ETI’s DSM programs is considered in the development of the retail sales forecast for ETI.
Entergy Arkansas, Inc. (“EAI”) participated in a collaborative process involving the Arkansas Public Service Commission (“APSC”) and other key stakeholders to determine a structure for offering energy efficiency programs and launched Quick Start programs in late 2007 and continuing through 2009. Because EAI’s energy efficiency programs are fairly new, no assumption for the on-going impact of EAI’s energy efficiency programs is included in EAI’s retail sales forecast. As the programs mature and their impact becomes clear, they will be considered in the forecast of retail sales for EAI.
In collaboration with community stakeholders, Entergy New Orleans, Inc. (“ENOI”) is developing Energy Smart energy efficiency programs that are expected to begin in January 2010. About $3.1 million annual funding was established in the settlement provisions of a 2008 rate case. Because ENOI’s energy efficiency programs have not yet been fully designed and implemented, no assumption for the on-going impact of energy efficiency programs is included in the Company’s retail sales forecast. As Energy Smart programs advance, they will be considered in the forecast of retail sales for ENOI.
Utility-sponsored energy efficiency programs are being considered in other jurisdictions, but at this time, the scope and timing of the programs have not been determined. No assumption for the effect of utility-sponsored energy efficiency programs at other Operating Companies is included in the forecast of retail sales.
Attachment 1 Docket R-30021 Page 93 of 150
9-3
Customer-sponsored Initiatives Customers take steps to improve the energy efficiency of their home or business every day. In addition, new appliances or other energy-using devices tend to be more energy-efficient than older models, so routine replacement decisions result in increased efficiency. Native, or organic, improvements in energy efficiency are captured within the retail sales forecasts for each of the Entergy Operating Companies. This chapter does not address actions that customers may take on their own initiative to improve the efficiency of their energy consumption.
Incremental Utility-sponsored DSM Programs
In recent years, a number of developments have renewed interest in and improved the potential for DSM as a resource alternative. These developments include such factors as:
• Rising fuel price levels and increasing volatility of fuel prices;
• Concerns regarding environmental matters, particularly the effects and costs associated with CO2 emissions;
• The escalating capital cost associated with conventional generation; and
• On-going technological advances that have the potential to enable DSM.
Recognizing the changing environment, the Entergy Operating Companies undertook a study to assess the potential of DSM as a cost-effective alternative to meet long-term power needs. The results of this study form the basis for the DSM assumption in the Reference Planning Scenario.
Market Achievable Potential The Entergy Operating Companies engaged the services of ICF Consulting to assess the potential for utility-sponsored energy efficiency programs. ICF completed its study in May 2008. The study considered a broad range of DSM measures across the residential, commercial, and industrial sectors.
The ICF study recognized a distinction between the levels of DSM that may be technically achievable, economically achievable, and the levels of DSM that can be practically implemented. It is not appropriate to include technical, economic, or maximum achievable potential in the 2009 SRP Update. Technical potential is a theoretical construct and the economic and maximum achievable potential does not consider the realities of customer participation rates. However, market achievable potential is a reasonable estimate of peak
Attachment 1 Docket R-30021 Page 94 of 150
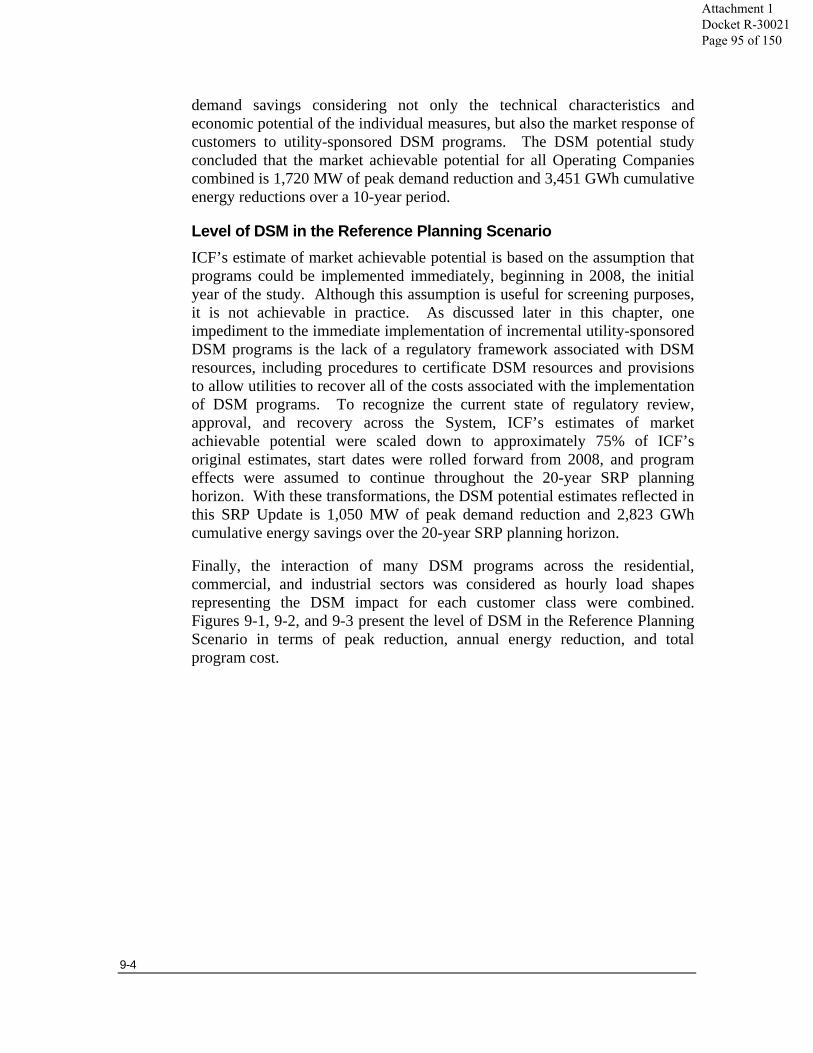
9-4
demand savings considering not only the technical characteristics and economic potential of the individual measures, but also the market response of customers to utility-sponsored DSM programs. The DSM potential study concluded that the market achievable potential for all Operating Companies combined is 1,720 MW of peak demand reduction and 3,451 GWh cumulative energy reductions over a 10-year period.
Level of DSM in the Reference Planning Scenario ICF’s estimate of market achievable potential is based on the assumption that programs could be implemented immediately, beginning in 2008, the initial year of the study. Although this assumption is useful for screening purposes, it is not achievable in practice. As discussed later in this chapter, one impediment to the immediate implementation of incremental utility-sponsored DSM programs is the lack of a regulatory framework associated with DSM resources, including procedures to certificate DSM resources and provisions to allow utilities to recover all of the costs associated with the implementation of DSM programs. To recognize the current state of regulatory review, approval, and recovery across the System, ICF’s estimates of market achievable potential were scaled down to approximately 75% of ICF’s original estimates, start dates were rolled forward from 2008, and program effects were assumed to continue throughout the 20-year SRP planning horizon. With these transformations, the DSM potential estimates reflected in this SRP Update is 1,050 MW of peak demand reduction and 2,823 GWh cumulative energy savings over the 20-year SRP planning horizon.
Finally, the interaction of many DSM programs across the residential, commercial, and industrial sectors was considered as hourly load shapes representing the DSM impact for each customer class were combined. Figures 9-1, 9-2, and 9-3 present the level of DSM in the Reference Planning Scenario in terms of peak reduction, annual energy reduction, and total program cost.
Attachment 1 Docket R-30021 Page 95 of 150
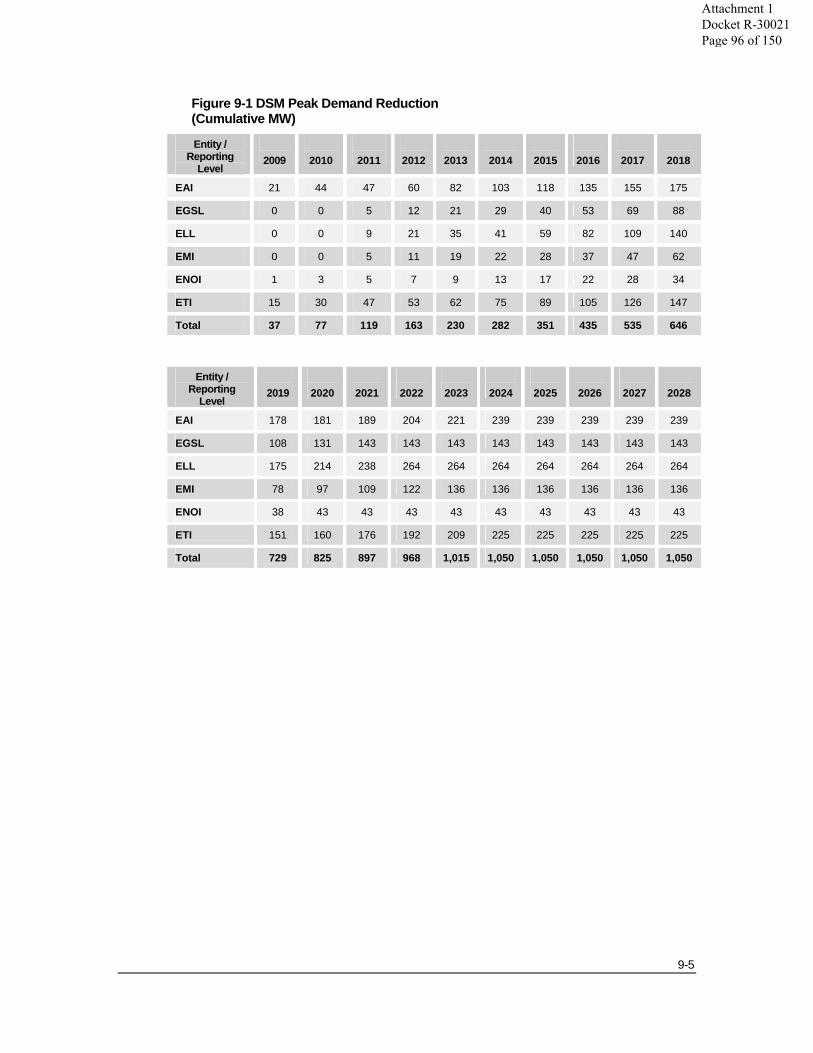
9-5
Figure 9-1 DSM Peak Demand Reduction (Cumulative MW)
Entity / Reporting
Level
2009
2010
2011
2012
2013
2014
2015
2016
2017
2018
EAI 21 44 47 60 82 103 118 135 155 175
EGSL 0 0 5 12 21 29 40 53 69 88
ELL 0 0 9 21 35 41 59 82 109 140
EMI 0 0 5 11 19 22 28 37 47 62
ENOI 1 3 5 7 9 13 17 22 28 34
ETI 15 30 47 53 62 75 89 105 126 147
Total 37 77 119 163 230 282 351 435 535 646
Entity / Reporting
Level
2019
2020
2021
2022
2023
2024
2025
2026
2027
2028
EAI 178 181 189 204 221 239 239 239 239 239
EGSL 108 131 143 143 143 143 143 143 143 143
ELL 175 214 238 264 264 264 264 264 264 264
EMI 78 97 109 122 136 136 136 136 136 136
ENOI 38 43 43 43 43 43 43 43 43 43
ETI 151 160 176 192 209 225 225 225 225 225
Total 729 825 897 968 1,015 1,050 1,050 1,050 1,050 1,050
Attachment 1 Docket R-30021 Page 96 of 150

9-6
Figure 9-2 DSM Annual Energy Reduction (Cumulative GWh)
Entity / Reporting
Level
2009
2010
2011
2012
2013
2014
2015
2016
2017
2018
EAI 77 160 172 206 246 294 351 416 486 562
EGSL 0 0 22 52 89 123 165 216 272 336
ELL 0 0 33 76 132 183 246 320 403 498
EMI 0 0 15 35 59 79 104 134 168 206
ENOI 4 9 16 22 30 38 48 59 72 85
ETI 54 114 171 209 252 299 352 412 477 547
Total 135 283 429 599 807 1,017 1,266 1,557 1,877 2,234
Entity / Reporting
Level
2019
2020
2021
2022
2023
2024
2025
2026
2027
2028
EAI 567 574 580 588 596 607 606 606 606 607
EGSL 407 484 488 488 488 490 488 488 488 490
ELL 603 719 727 738 738 740 738 738 738 740
EMI 249 296 300 305 311 312 311 311 311 312
ENOI 87 89 89 89 89 89 89 89 89 89
ETI 554 562 568 576 583 592 590 590 590 592
Total 2,466 2,724 2,752 2,784 2,806 2,830 2,823 2,823 2,823 2,830
Attachment 1 Docket R-30021 Page 97 of 150
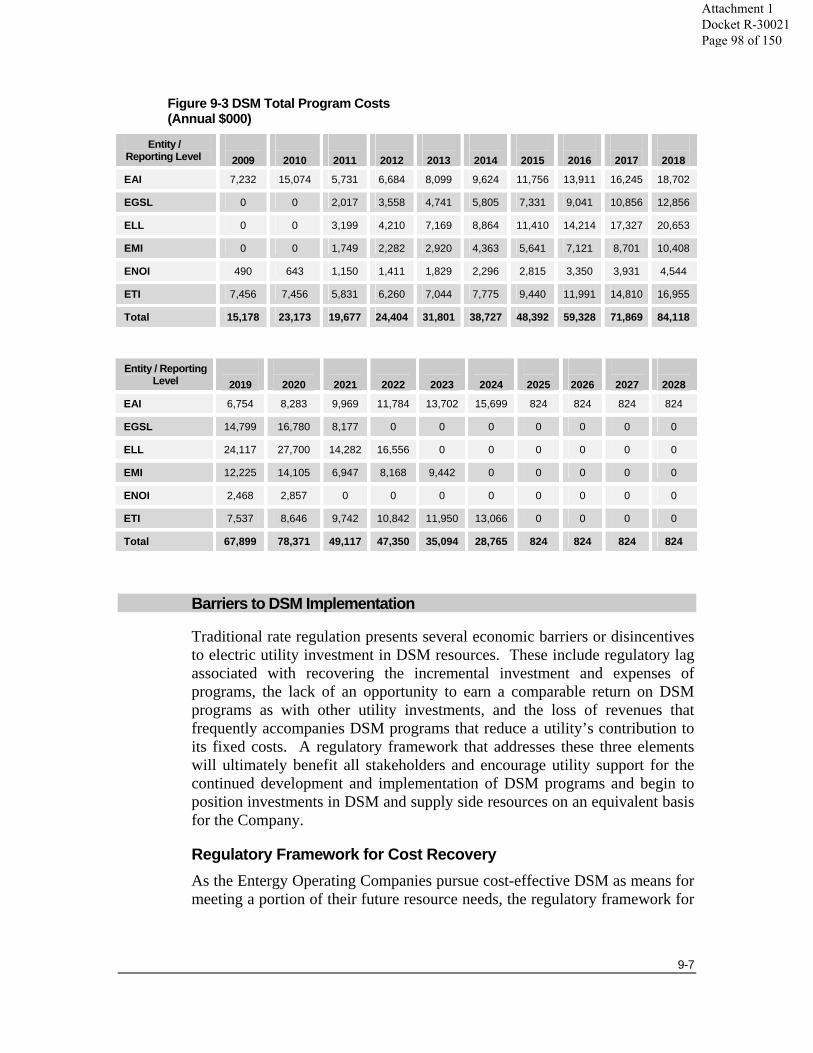
9-7
Figure 9-3 DSM Total Program Costs (Annual $000)
Entity / Reporting Level
2009
2010
2011
2012
2013
2014
2015
2016
2017
2018
EAI 7,232 15,074 5,731 6,684 8,099 9,624 11,756 13,911 16,245 18,702
EGSL 0 0 2,017 3,558 4,741 5,805 7,331 9,041 10,856 12,856
ELL 0 0 3,199 4,210 7,169 8,864 11,410 14,214 17,327 20,653
EMI 0 0 1,749 2,282 2,920 4,363 5,641 7,121 8,701 10,408
ENOI 490 643 1,150 1,411 1,829 2,296 2,815 3,350 3,931 4,544
ETI 7,456 7,456 5,831 6,260 7,044 7,775 9,440 11,991 14,810 16,955
Total 15,178 23,173 19,677 24,404 31,801 38,727 48,392 59,328 71,869 84,118
Entity / Reporting Level
2019
2020
2021
2022
2023
2024
2025
2026
2027
2028
EAI 6,754 8,283 9,969 11,784 13,702 15,699 824 824 824 824
EGSL 14,799 16,780 8,177 0 0 0 0 0 0 0
ELL 24,117 27,700 14,282 16,556 0 0 0 0 0 0
EMI 12,225 14,105 6,947 8,168 9,442 0 0 0 0 0
ENOI 2,468 2,857 0 0 0 0 0 0 0 0
ETI 7,537 8,646 9,742 10,842 11,950 13,066 0 0 0 0
Total 67,899 78,371 49,117 47,350 35,094 28,765 824 824 824 824
Barriers to DSM Implementation
Traditional rate regulation presents several economic barriers or disincentives to electric utility investment in DSM resources. These include regulatory lag associated with recovering the incremental investment and expenses of programs, the lack of an opportunity to earn a comparable return on DSM programs as with other utility investments, and the loss of revenues that frequently accompanies DSM programs that reduce a utility’s contribution to its fixed costs. A regulatory framework that addresses these three elements will ultimately benefit all stakeholders and encourage utility support for the continued development and implementation of DSM programs and begin to position investments in DSM and supply side resources on an equivalent basis for the Company.
Regulatory Framework for Cost Recovery As the Entergy Operating Companies pursue cost-effective DSM as means for meeting a portion of their future resource needs, the regulatory framework for
Attachment 1 Docket R-30021 Page 98 of 150
9-8
treatment of DSM investments will need to be addressed. An equitable regulatory framework that addresses the removal of the economic disincentives for the implementation of DSM programs is a fundamental prerequisite to creating a successful DSM environment. The lack of necessary regulatory mechanisms means that DSM and supply-side resources are not on a level playing field. Appropriate mechanisms must be implemented to ensure that the benefits of DSM accrue to customers and that investors are adequately compensated for their investment.
Uncertainty A variety of factors, many which are highly uncertain, will affect the amount of DSM that might be achieved over the planning horizon. Therefore, DSM assumptions are not intended as definitive commitments to particular programs, program levels, or program timing. At this time, with some exceptions, there is enough uncertainty regarding critical decisions outside of the control of the Operating Companies that the Operating Companies have not been able to propose a full slate of DSM programs for implementation. The level of DSM programs that will be implemented over the planning horizon will depend on a number of factors including:
• The level of DSM that the Operating Companies’ retail regulators agree should be deployed, and the implementation of appropriate regulatory review, approval, and cost recovery mechanisms to allow the Operating Companies a reasonable opportunity to recover the costs associated with those programs;
• The relative cost of DSM versus alternative supply-side resource options. Chapter 10 discusses the uncertainties that affect supply-side alternatives, both conventional and renewable alternatives. The cost and availability of supply-side alternatives are matters of uncertainty which could alter the relative attractiveness of DSM alternatives.
• Experience with the DSM programs. As DSM programs are implemented over time, the Operating Companies will be able to refine their estimates of market-achievable potential, the cost of implementing programs, and the speed at which programs can be deployed.
DSM is an important component of the SRP process. In light of the uncertainties that will affect DSM, the SRP process will continue to assess the market achievable potential and make adjustments as needed due to changes in external market forces, changes to Operating Company schedules for implementing DSM programs as well as the communications infrastructure
Attachment 1 Docket R-30021 Page 99 of 150
9-9
systems that enable demand response programs. Changes to these assumptions and others may result in the need to revise the overall DSM resource potential or the timing of when those resources may be available.
Strategic Conclusions
• DSM offers the potential to contribute in meaningful levels to the incremental resource needs of the Entergy Operating Companies’ customers.
• Appropriate levels of cost-effective DSM can help reduce costs and mitigate risk relating to total supply costs stemming from such uncertainties as natural gas price fluctuations and CO2 costs. However, the cost-effectiveness of DSM alternatives can be significantly affected by alternative forecasts of natural gas prices and CO2 costs.
• Appropriate levels of cost-effective DSM can help mitigate the effects of potential Renewable Portfolio Standards on total supply costs.
• The implementation of cost-effective DSM requires consistent, sustained regulatory support and approval. The Operating Companies’ investment in DSM must be met with a reasonable opportunity to timely recover all of the costs associated with those programs. Appropriate mechanisms must be put into place to ensure the DSM potential actually accrues to the benefit of customers and that utility investors are adequately compensated for their investment.
• Although the Operating Companies are committed to pursuing cost-effective DSM programs, information on market potential and penetration rates leads System Planning to conclude that DSM cannot be relied upon to meet all, or even a majority, of future resource needs. Supply-side alternatives, both conventional and renewable, will be needed to meet the bulk of needs reliably and economically over the next twenty years.
Attachment 1 Docket R-30021 Page 100 of 150
10-1
. . . . . . .. . . Chapter 10
Generation Technologies Alternatives and Uncertainties
Overview
This chapter discusses the supply-side alternatives that were evaluated during the preparation of the SRP Update. Demand-side management (“DSM”) alternatives are discussed separately in Chapter 9. The scope of the analysis described in this chapter comprehends the range of conventional and renewable generation alternatives reasonably expected to be available to meet customers’ power needs during the twenty-year planning horizon.
The assumptions used in the analysis are consistent with the level of detail that is appropriate to use in a long-term screening study. Accordingly, the supply-side alternatives assessed in the analysis are generalized or generic representations of technology options. Except as noted, the cost and performance assumptions are intended to represent the costs that would be incurred to deploy that technology within the general footprint of the areas in which the Entergy Operating Companies operate. However, consistent with the level of detail that is appropriate to consider in developing a long-term strategic resource plan, the supply-side resource assumptions do not consider site-specific costs, benefits or limitations that are appropriately addressed in the portfolio execution process.
Similarly, the long-term strategic resource planning process assumes that a decision specifying transaction structure cannot be made until the time that an actual project is identified. Consistent with that approach, the analysis used to develop this plan makes no distinction between owned or long-term contracted resources. For long-term planning purposes, cost assumptions reflect traditional utility financing.
The relative economics of technology alternatives (including DSM), and thus the optimal portfolio mix, depend on the outcome of a number of key uncertainties including, but not limited to, future natural gas prices, future coal prices, and the cost of complying with future environmental requirements – the most significant of which is the potential for imposing costs associated
Attachment 1 Docket R-30021 Page 101 of 150

10-2
with the emission of CO2. Consequently, the results of the technology assessment should be viewed as subject to change with changes in circumstances. Decisions regarding incremental resources including technology, timing, and location, will be made as actual projects are identified and evaluated during the portfolio execution process. By deferring these decisions until they need to be made, the Entergy Operating Companies are able to recalibrate the resource plan over time to achieve a better portfolio mix as information becomes available and as uncertainties are resolved.
The analysis recognizes that improvements in technology may occur over time. Emerging technologies are subject to higher levels of uncertainty. The analysis therefore considers technology cost and performance assumptions during two time periods: 2009 – 2018 and 2019 – 2028.
Key Conclusions
The results of the analysis indicate the following:
• Combined Cycle Gas Turbine (“CCGT”) technology remains economically attractive across a wide range of operating roles and uncertainty outcomes. CCGTs can be developed in relatively small increments, with a fairly short lead time, and at a comparably low installed cost. CCGT technology is operationally and economically suited for load-following roles and remains the technology of choice for that purpose. Further, CCGT technology is economic for base load operation at current expectations for natural gas and carbon costs. Given its economic and risk profile, CCGT technology is the basic component of the Reference Planning Scenario.
• Under most assumptions, new carbon-based solid fuel (e.g., coal or petroleum coke) technologies are not economically attractive. This conclusion holds in both the 2009 – 2018 and the 2019 – 2028 timeframe, even assuming that carbon capture and sequestration (“CCS”) technology is available in the latter time frame. The high capital cost and long lead times associated with the development of projects deploying solid fuel technologies result in commitment risk that further complicates deployment of these technologies. However, these conclusions could be altered by a number of uncertainties including the emergence of economically attractive CCS technologies. Consequently, the Entergy Operating Companies plan to continue to evaluate solid fuel technologies, especially CCS.
Attachment 1 Docket R-30021 Page 102 of 150

10-3
• Continued evaluation of new nuclear as an alternative for meeting long-term base load needs is merited, but given current cost estimates, the economics of new nuclear are not attractive. Under reference case assumptions, the total supply cost of new nuclear approaches rough parity with CCGT technology. However, the high capital cost required to deploy new nuclear and the uncertainty of those estimates result in a commitment risk that dictates a cautious approach to deployment.
• It is reasonable to expect that renewable generation will become a component of the System’s long-term supply portfolio over the next decade. However, it is not realistic to assume that renewable generation can satisfy all or even most of the System’s incremental needs. Conventional generation alternatives will still be needed to serve the needs of customers. In general, renewable generation alternatives are not economically viable compared to conventional technologies. There are unique risks and issues associated with renewable generation as well. Furthermore, the opportunity for renewable generation within the Entergy supply portfolio is constrained by a number of factors, including:
• Compared with other regions of the country, the Entergy region is not climatically well-situated for either wind or solar power.
• Some renewable technologies, including in-stream hydro, utility-scale solar photovoltaics (“PV”), and off-shore wind, have high capital costs and are not at a sufficient state of technical maturity to support an expectation of economic deployment within the next decade.
• The nature of some renewable alternatives is such that the magnitude of the long-term deployment opportunity is limited even under the best of circumstances. For example, although biomass alternatives benefit from factors that suggest the potential for near-term deployment within the local region – proven (mature) combustion technologies, reasonable economics, and availability of fuel – biomass is not likely to provide more than a modest element of the System’s overall supply needs. The challenges associated with fuel availability, transportation and handling limit the scale of deployment.
Attachment 1 Docket R-30021 Page 103 of 150
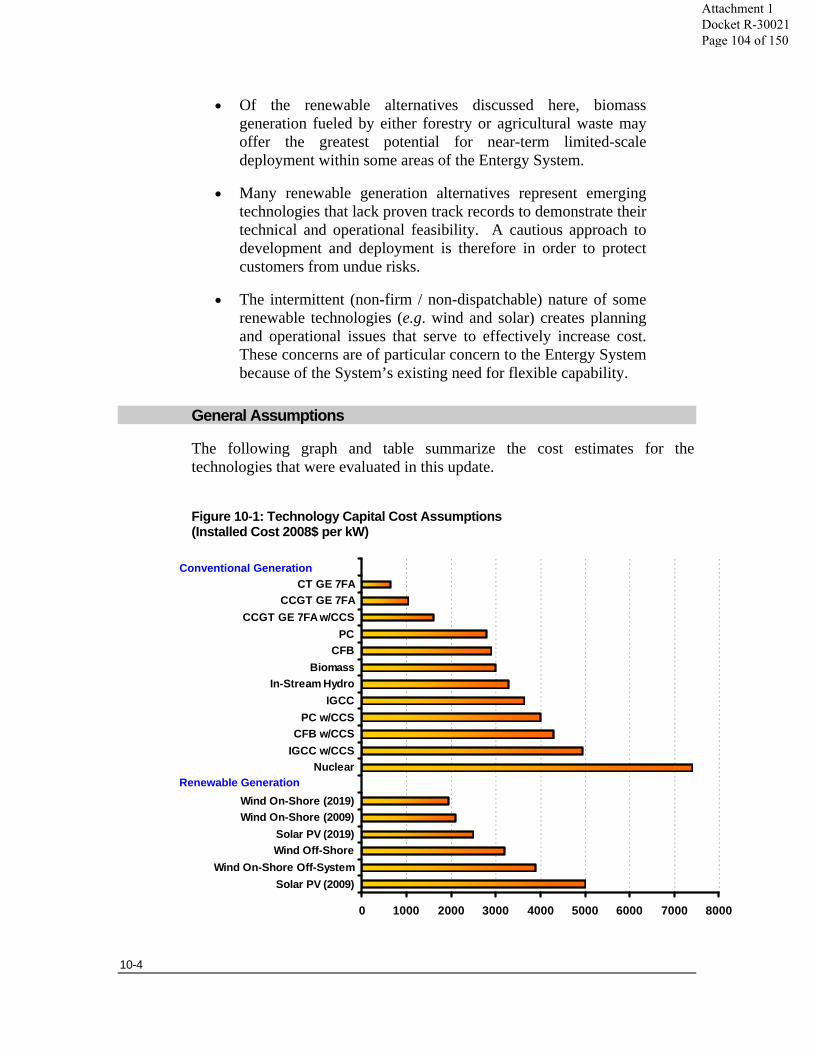
10-4
• Of the renewable alternatives discussed here, biomass generation fueled by either forestry or agricultural waste may offer the greatest potential for near-term limited-scale deployment within some areas of the Entergy System.
• Many renewable generation alternatives represent emerging technologies that lack proven track records to demonstrate their technical and operational feasibility. A cautious approach to development and deployment is therefore in order to protect customers from undue risks.
• The intermittent (non-firm / non-dispatchable) nature of some renewable technologies (e.g. wind and solar) creates planning and operational issues that serve to effectively increase cost. These concerns are of particular concern to the Entergy System because of the System’s existing need for flexible capability.
General Assumptions
The following graph and table summarize the cost estimates for the technologies that were evaluated in this update.
Figure 10-1: Technology Capital Cost Assumptions (Installed Cost 2008$ per kW)
0 1000 2000 3000 4000 5000 6000 7000 8000
Solar PV (2009)Wind On-Shore Off-System
Wind Off-ShoreSolar PV (2019)
Wind On-Shore (2009)Wind On-Shore (2019)
NuclearIGCC w/CCSCFB w/CCS
PC w/CCSIGCC
In-Stream HydroBiomass
CFBPC
CCGT GE 7FA w/CCSCCGT GE 7FA
CT GE 7FA
Renewable Generation
Conventional Generation
Attachment 1 Docket R-30021 Page 104 of 150
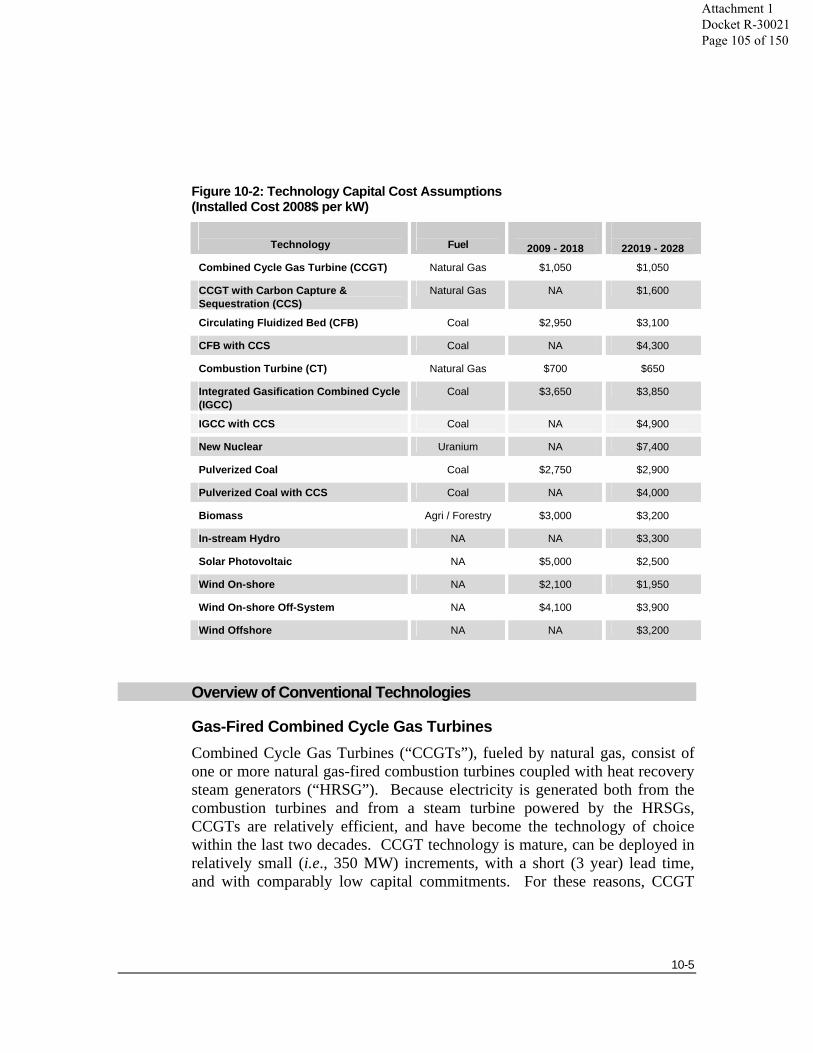
10-5
Figure 10-2: Technology Capital Cost Assumptions (Installed Cost 2008$ per kW)
Technology
Fuel
2009 - 2018
22019 - 2028
Combined Cycle Gas Turbine (CCGT) Natural Gas $1,050 $1,050
CCGT with Carbon Capture & Sequestration (CCS)
Natural Gas NA $1,600
Circulating Fluidized Bed (CFB) Coal $2,950 $3,100
CFB with CCS Coal NA $4,300
Combustion Turbine (CT) Natural Gas $700 $650
Integrated Gasification Combined Cycle (IGCC)
Coal $3,650 $3,850
IGCC with CCS Coal NA $4,900
New Nuclear Uranium NA $7,400
Pulverized Coal Coal $2,750 $2,900
Pulverized Coal with CCS Coal NA $4,000
Biomass Agri / Forestry $3,000 $3,200
In-stream Hydro NA NA $3,300
Solar Photovoltaic NA $5,000 $2,500
Wind On-shore NA $2,100 $1,950
Wind On-shore Off-System NA $4,100 $3,900
Wind Offshore NA NA $3,200
Overview of Conventional Technologies
Gas-Fired Combined Cycle Gas Turbines Combined Cycle Gas Turbines (“CCGTs”), fueled by natural gas, consist of one or more natural gas-fired combustion turbines coupled with heat recovery steam generators (“HRSG”). Because electricity is generated both from the combustion turbines and from a steam turbine powered by the HRSGs, CCGTs are relatively efficient, and have become the technology of choice within the last two decades. CCGT technology is mature, can be deployed in relatively small (i.e., 350 MW) increments, with a short (3 year) lead time, and with comparably low capital commitments. For these reasons, CCGT
Attachment 1 Docket R-30021 Page 105 of 150
10-6
technology remains economically attractive across a wide range of operating roles and uncertainty outcomes.
Under reference assumptions, CCGT technology is economic for both base load and load-following operation. Figures 10-3 and 10-4 compare the levelized cost of electricity for conventional supply alternatives available to meet long-term power needs in the 2009 and 2019 time periods, respectively. In all but the high natural gas price case, CCGTs are the most economic alternative. Further, CCGT technology is operational and economically suited for load-following roles and its advantage relative to other generation technologies improves as capacity factors decline. For load-following applications, CCGTs provide attractive economics relative to other alternatives across a wide range of natural gas price and CO2 cost assumptions.
Given its economic and risk profile, CCGT technology is the basic portfolio building block in the Reference Planning Scenario. In the near-term, the addition of modern efficient gas-fired CCGTs can provide a relatively low risk alternative to meet the reliability needs over the next several years as the Entergy Operating Companies continue to evaluate new nuclear and other long-term base load alternatives. Considerations supporting CCGTs in this role include the facts that CCGTs:
• Are suited for a wide range of operating roles.
• Represent the technology of choice for load-following applications.
• Are well suited for meeting the flexible capability needs of the Entergy Operating Companies.
• Have a higher level of efficiency than existing gas units, thus partially offsetting the continued exposure to the continued reliance on natural gas in the portfolio.
• Require lower capital investment which reduces the risk of deployment relative to other alternatives.
Given these considerations, the addition of CCGT technology in the near-term in levels consistent with long-term reliability requirements fits long-term supply needs regardless of how uncertainties eventually resolve.
Gas-Fired Combustion Turbines Combustion turbine (“CT”) technology is operationally suited for load-following and peaking roles. CTs are, in essence, the front half of a CCGT. Because the exhaust of CTs is not captured to generate steam, they have a
Attachment 1 Docket R-30021 Page 106 of 150
10-7
higher heat rate than CCGTs and are less economic than CCGT technology when operating at higher capacity factors. However, because of its lower capital cost, CT technology is operational and economic suited for peaking and low capacity factor load following duty.
Coal-Fired Technology The SRP Update assessed a range of carbon-based solid fuel (coal or petroleum coke) alternatives: pulverized coal, integrated gasification combined cycle, and circulating fluidized bed. Given current assumptions regarding costs, heat rates, and emission profiles, neither greenfield nor brownfield development of new projects using these technologies appears to be economic over the twenty year planning horizon. In the near-term the high capital cost of new coal-fired technology coupled with uncertainties regarding CO2 legislation, combine to make coal a risky alternative.
Growing concerns about the effects of greenhouse gases and the potential for federal legislation to regulate carbon emissions threaten the long-term viability of coal generation as an economic alternative to meet long-term supply needs. The long-term viability of coal-fired generation, as an alternative to meet generation supply needs, most likely hinges on the availability of economically attractive carbon capture and sequestration (“CCS”) technology. However, the availability and cost of CCS in the future is a matter of uncertainty. CCS technology presently is not available on a commercial basis. However, the potential exists that it could become available in the next decade. In the longer-term (second half of the planning horizon) this analysis assessed coal-fired technology assuming the availability of CCS technology.
New Nuclear Although the Entergy System has made no commitment to build a new nuclear plant, the Entergy Operating Companies have and continue to assess new nuclear technology as an option for meeting long-term base load needs. New nuclear technology continues to offer a potential long-range alterative as an economic source of stable-priced power with zero carbon emissions beyond the planning horizon for this SRP. However, given current planning assumptions regarding cost and timing, the economics of new nuclear do not appear attractive and the Reference Planning Scenario described in Chapter 12 does not include the expectation that any new nuclear capacity will enter service at any of the Operating Companies over the study period.
The economic benefits of new nuclear depend on a number of uncertainties. Recent declines in long-term projections for natural gas prices (as discussed in Chapter 4) have eroded the projected economics of new nuclear relative to gas-fired CCGT technology. The economics of new nuclear are also a
Attachment 1 Docket R-30021 Page 107 of 150

10-8
function of high fixed costs. Of all technologies considered in this assessment, new nuclear is by far the most costly to build. See Figure 10-1. The high capital cost and long-lead time required to build a new nuclear facility involve risks that dictate a cautious approach to deployment.
In recent years the Entergy System was taking steps to deploy new nuclear in the 2017 - 2018 timeframe. The System filed Combined Construction and Operating License Applications (“COLA”) for new nuclear facilities at the Grand Gulf and River Bend sites. Both COLAs were based on the assumption that the new plants would use GE Hitachi’s Economic Simplified Boiling Water Reactor (“ESBWR”) design, one of several reactor designs undergoing certification by the NRC. In early 2009 the Entergy System suspended development of the ESBWR because the System was not able to come to mutually agreeable terms and conditions with the vendors for the potential deployment of an ESBWR.
At this time, the Entergy Operating Companies continue to evaluate new nuclear alternatives. The decision to build a new nuclear plant will be based on several factors, including an assessment of customer need for additional electricity and estimated costs of electricity as compared to costs from other fuel sources.
Although current economics do not appear attract, continued assessment of new nuclear is merited. A number of uncertainties could alter the relative economic of new nuclear, including:
• The cost of building new nuclear. Current estimates for new nuclear are uncertain.
• Long-term natural gas price projections. Although long-term natural gas price projections have declined over the past year, the projections remain uncertain. A number of factors could push natural gas prices higher in the long-term. Under high natural gas prices, new nuclear appears attractive relative to gas-fired CCGT technology.
• CO2 legislation. There seems to be an emerging momentum to implement CO2 legislation during the next one to two years. Because new nuclear is a zero emitting technology, under more stringent and higher cost CO2 outcomes, the economics of new nuclear appear more attractive.
The New Nuclear Planning Scenario discussed in Chapter 12 discusses how the Reference Planning Scenario would be adjusted in the event that ongoing monitoring activities conclude that new nuclear is an economic alternative to meet supply needs in the second half of the planning horizon.
Attachment 1 Docket R-30021 Page 108 of 150
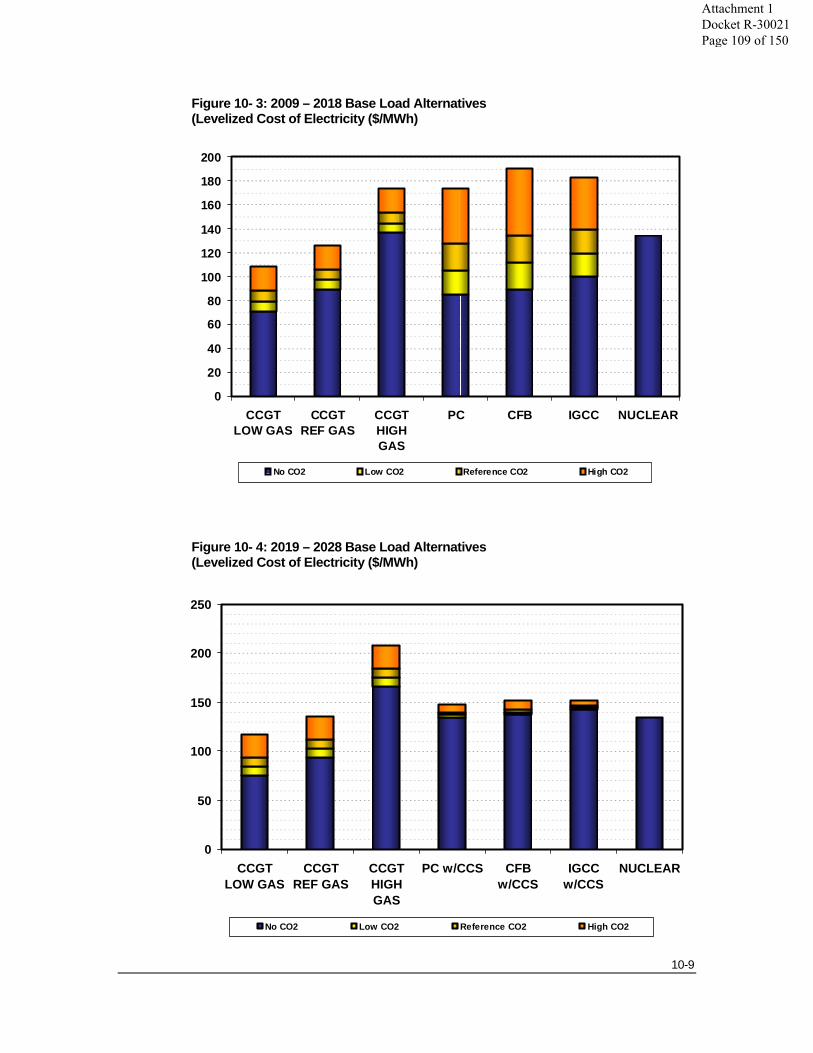
10-9
Figure 10- 3: 2009 – 2018 Base Load Alternatives (Levelized Cost of Electricity ($/MWh)
Figure 10- 4: 2019 – 2028 Base Load Alternatives (Levelized Cost of Electricity ($/MWh)
0
20
40
60
80
100
120
140
160
180
200
CCGTLOW GAS
CCGTREF GAS
CCGTHIGHGAS
PC CFB IGCC NUCLEAR
No CO2 Low CO2 Reference CO2 High CO2
0
50
100
150
200
250
CCGTLOW GAS
CCGTREF GAS
CCGTHIGHGAS
PC w/CCS CFBw/CCS
IGCCw/CCS
NUCLEAR
No CO2 Low CO2 Reference CO2 High CO2
Attachment 1 Docket R-30021 Page 109 of 150
10-10
Renewable Generation
Key Conclusions Major conclusions regarding the role of renewable generation in the System’s supply portfolio include the following:
• This study considered a wide range of renewable generation alternatives, including all of the options that could be considered to be reasonably feasible to deploy within the local region over the planning horizon. The alternatives included in this study present a range of differing costs, operational capabilities, and risk profiles. This analysis considered renewable generation along with and on the same basis as other alternatives for meeting customer needs. The economics and risks of these technologies relative to conventional generation also differ. Some renewable alternatives (e.g. biomass fueled by forestry or agricultural waste) offer reasonably attractive economics at this time and may present opportunities for near-term deployment. Other technologies (e.g. solar PV and in-stream hydro) represent emerging technologies whose economics, while not compelling at this time, offer the potential for long term improvement.
• It is reasonable to expect that renewable generation will become a component of the System’s long-term supply portfolio over the next decade. However, it is not realistic to assume that renewable generation can satisfy all or even most of the System’s incremental needs. Conventional generation alternatives will still be a substantial part of the resource portfolios that the Operating Companies will need to provide reliable and economic service to their customers. In general, renewable generation alternatives are not economically viable when compared to conventional technologies. There are unique risks and issues associated with renewable generation as well. Furthermore, the opportunity for renewable generation within the Operating Companies’ supply portfolio is constrained by a number of factors, including:
• The nature of some renewable alternatives is such that the magnitude of the long-term deployment opportunity is limited even under the best of circumstances. For example, although biomass alternatives benefit from factors that
Attachment 1 Docket R-30021 Page 110 of 150

10-11
suggest the potential for near-term deployment within the local region – proven (mature) combustion technologies, reasonable economics, and availability of fuel – biomass is not likely to provide more than a modest element of the System’s overall supply needs. The challenges associated with fuel availability, transportation and handling limit the scale of deployment.
• Many renewable generation alternatives represent emerging technologies that lack proven track records to demonstrate their technical and operational feasibility. A cautious approach to development and deployment is, therefore, to protect customers from undue risks.
• The intermittent (non-firm / non-dispatchable) nature of some renewable technologies (e.g. wind and solar) create planning and operational issues that serve to effectively increase cost. The inclusion of intermittent technologies in the portfolio would result in additional need for flexible capability.
• Of the renewable alternatives discussed here, biomass generation fueled by either forestry or agricultural waste may offer the greatest potential for near-term limited-scale deployment within some areas of the Entergy System.
• Some renewable technologies, including in-stream hydro, utility-scale solar PV, and off-shore wind, have high capital costs and are not at a sufficient state of technical maturity to support an expectation of economic deployment within the next decade. However, the field of renewable generation is rapidly changing. Planning efforts will continue to monitor developments.
Challenges Associated with Renewable Generation The planning process considers the benefits of renewable generation, described above, in the context of renewable generation’s overall economic and operational risks. Although renewable generation alternatives provide potential benefits, they also tend to involve costs and risks that differ from other resource alternatives. The costs and benefits are weighed, and the net benefit of each renewable generation alternative is compared with that of other resource alternatives. The overall objective in resource selection is to identify a portfolio of resources that meet customers’ needs at the lowest reasonable cost.
Attachment 1 Docket R-30021 Page 111 of 150
10-12
Economics In general, the economics of renewable generation are not as attractive as conventional generation alternatives. Under most reasonable assumptions about cost drivers, such as fuel and CO2, conventional generation alternatives result in lower overall energy costs than most renewable generation alternatives. Chapter 3 discusses in more detail the relative economics of renewable and conventional generation alternatives.
This conclusion represents a generalization. The economics of renewable generation alternatives differ among one another, and hence each renewable alternative must be assessed on its own merits. Further, the costs of all technologies, whether renewable or conventional, are subject to uncertainty regarding assumptions about cost elements such as construction, fuel, and environmental compliance. Compared with conventional generation alternatives, renewable generation alternatives tend to be in a less mature state of commercial and economic development. Therefore, cost and performance characteristics of renewable generation technologies may be subject to more rapid change than more mature conventional alternatives.
The on-going planning process will continue to evaluate renewable alternatives. Future procurement efforts, including Requests for Proposals, should provide opportunities for renewable generation alternatives. Market tests provide opportunities to test the conclusions and planning assumptions and to recalibrate planning scenarios based on the best information available.
Intermittency The intermittent (non-firm / non-dispatchable) nature of some renewable technologies (i.e. wind and solar) create planning and operational issues that serve to effectively increase cost. The system planning and operational costs resulting from intermittency should be considered in assessing the relative economics of renewable alternatives. Uncertainty about output from intermittent resources results in the need for additional:
Backup Capacity – Additional reserves are required to back-up intermittent resources to maintain desired reliability.
Flexible Capability – Uncertainty around output levels places a burden on the System. To address these uncertainties, the System must have a sufficient amount of flexible capability committed and operating to ensure reliable service. Drivers of flexible capability include:
• Load swings;
• QF put;
Attachment 1 Docket R-30021 Page 112 of 150
10-13
• Generator imbalances; and
• Operating reserve requirements.
As the load uncertainties associated with intermittent resources increase, the burden on the System becomes greater. The subsequent discussions regarding solar and wind will provide more discussion about the implications of these costs for each technology.
Summary of Renewable Technologies
Biomass • Biomass Alternatives fired by either agricultural crop residue
(or dedicated crops) or forestry products provide the most significant opportunity to deploy economic renewable generation within certain areas of the Entergy region in the near-term. Forestry products appear, in particular, to offer an economic alternative in the near-term.
• In general, biomass generation relies on conventional boiler technologies. These are mature technologies with relatively low deployment and operational risk.
• Non-conventional biomass technologies (e.g. landfill gas or plasma arc furnaces), although potentially economic, are more limited in the scope of deployment.
• The principal challenge associated with conventional biomass technology is fuel sourcing, transporting, and handling. Biomass fuel sources are relatively low in density. As a consequence, compared to conventional carbon fuels such as coal, significantly greater volumes of biomass matter is required to fuel a boiler per unit of output. The cost associated with transporting and handling fuel becomes a driver of economics.
• Biomass is capable of serving a base load role. Capital costs are similar to those of solid fuel alternatives, and competitive economics are attainable based on high utilization levels.
• The size of individual biomass deployments are limited by the fuel availability, transportation and handling cost. Because transportation cost increases with distance, biomass installations must be located in relative proximity to the fuel source (i.e. within 50 miles) in order to achieve attractive economics. Further, space is needed to handle the large
Attachment 1 Docket R-30021 Page 113 of 150
10-14
volume of biomass matter required to fuel a facility. Although the availability of forestry and agricultural products within the local region implies a technical potential for biomass deployment, the issues associated with fuel transportation and handling limit potential deployments to small scale applications (50 – 80 MW) dispersed geographically.
Biomass (Other) • The opportunity associated with producing electricity by
burning municipal solid waste (MSW) or landfill gas is less than other renewable options.
• The economics of waste-to-heat projects inherently involve complexities and risks not present in conventional power generation. Commercial arrangements require interaction with parties not normally associated with the power business. At the same time, the collection and disposal of garbage is an industry in itself, requiring a unique set of competencies with which the Entergy System is not experienced.
• The nature of some processes (i.e. gasification processes) may provide opportunities to structure arrangements in ways that mitigate these concerns.
In-Stream Hydro • In-stream turbines rely on the kinetic energy of flowing water.
Turbines, similar to windmills, are inserted directly into stream or river.
• Unlike conventional hydro facilities, in-stream hydro does not require construction of dams or other artificial water-heads. The effect on the environment is less significant than the effects associated with conventional hydroelectric dams.
• This technology is in a relatively early state of development. A number of technical issues must be resolved before large-scale deployments can be achieved. Even if technical issues are resolved, it will take some time before these improvements translate into learning curve cost reductions. At this time, it is premature to consider this technology for deployment.
• Costs of in-stream hydro are uncertain but are likely in excess of those required for wind. In some sense, this technology is similar to a wind turbine. However, inherently it will involve additional costs associated with in-stream deployment.
Attachment 1 Docket R-30021 Page 114 of 150

10-15
• The Mississippi River offers potential for long-range deployment within the Entergy region. Although this technology is not likely to emerge as an element of the portfolio until the end of the planning horizon or beyond, the technology bears monitoring. Several developers have sought preliminary permits for Mississippi River projects.
Solar -- PV • The category of solar photovoltaics includes a range of
technologies that convert sunlight into electricity through the naturally occurring process known as the “photovoltaic effect.” Generally, these utility-scale technologies are relative immature. Economics are not attractive at this time.
• Research and development efforts are underway, and it is possible that advances could lead to economically attractive deployment opportunities by the end of the planning horizon. However, at this time and absent commercial breakthroughs, it does not appear likely that utility-scale solar PV will achieve widespread commercialization within the next ten to fifteen years.
• In the event that research and development efforts do yield advances, solar PV could emerge as one of the more attractive renewable alternatives for the Entergy System.
• Presently, solar PV applications primarily are distributed in nature. There is little experience with utility scale applications.
Solar – Thermal • Solar thermal technologies are more developed (ready for
deployment) than PV. However, economics remain unattractive. Installations in place and under development depend on government subsidies to achieve economics.
• Because of higher average cloud cover levels, the area served by the Operating Companies is not an attractive location for siting of solar thermal technologies due to lack of direct solar radiation.
• Overall, solar thermal is not expected to be a component of the Entergy portfolio.
Attachment 1 Docket R-30021 Page 115 of 150
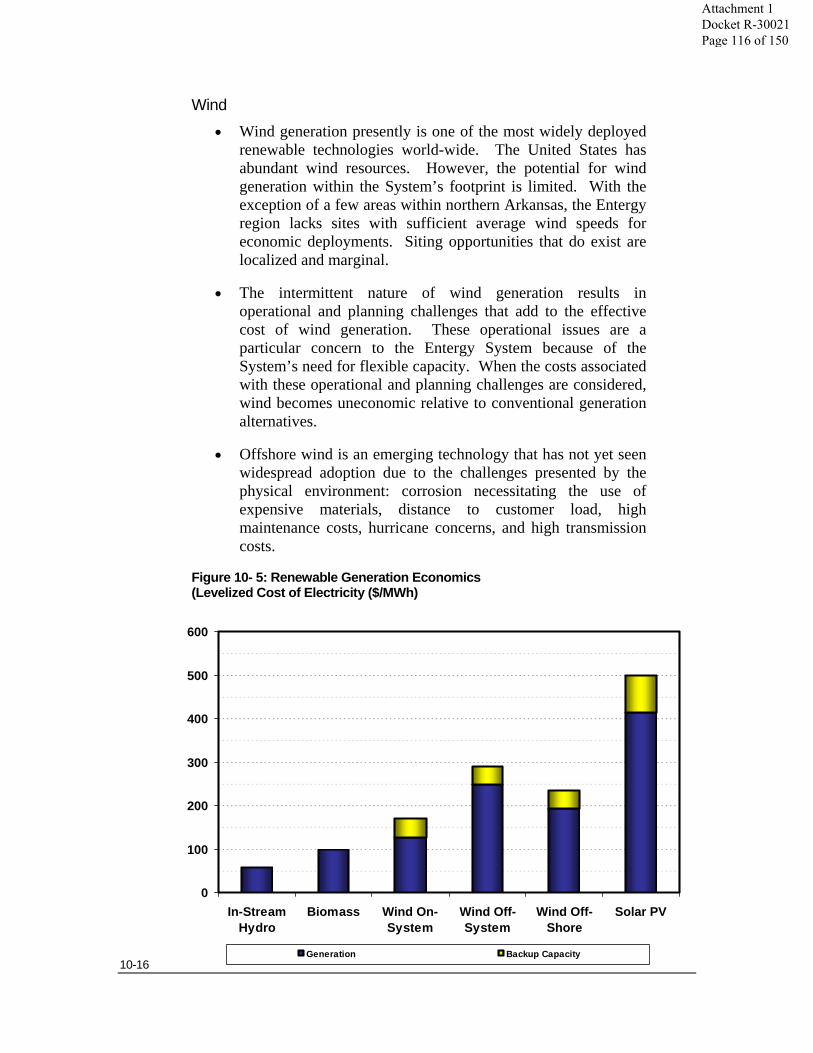
10-16
Wind • Wind generation presently is one of the most widely deployed
renewable technologies world-wide. The United States has abundant wind resources. However, the potential for wind generation within the System’s footprint is limited. With the exception of a few areas within northern Arkansas, the Entergy region lacks sites with sufficient average wind speeds for economic deployments. Siting opportunities that do exist are localized and marginal.
• The intermittent nature of wind generation results in operational and planning challenges that add to the effective cost of wind generation. These operational issues are a particular concern to the Entergy System because of the System’s need for flexible capacity. When the costs associated with these operational and planning challenges are considered, wind becomes uneconomic relative to conventional generation alternatives.
• Offshore wind is an emerging technology that has not yet seen widespread adoption due to the challenges presented by the physical environment: corrosion necessitating the use of expensive materials, distance to customer load, high maintenance costs, hurricane concerns, and high transmission costs.
Figure 10- 5: Renewable Generation Economics (Levelized Cost of Electricity ($/MWh)
0
100
200
300
400
500
600
In-StreamHydro
Biomass Wind On-System
Wind Off-System
Wind Off-Shore
Solar PV
Generation Backup Capacity
Attachment 1 Docket R-30021 Page 116 of 150
11-1
. . . . . . .. . . Chapter 11
Portfolio Strategy Assessment Exploring the Cost – Risk Tradeoff
Overview
If the future were known with reasonable certainty, it might be possible to reduce the portfolio design effort to an algorithm that precisely solves for the optimal solution. Such is not the world today. The planning environment is uncertain and dynamic. The long-term economics of resource alternatives depend on any number of inputs which are subject to uncertainty. In this world an attempt to mathematically solve for the optimal long-term portfolio solution is little more than a theoretical exercise. Mathematically, interesting. Pragmatically, of limited value.
In the practical reality of today’s planning environment, designing a portfolio of resources to meet planning objectives over the long-term requires weighing trade-offs between cost and risk. The analysis discussed in this chapter, the Portfolio Strategy Assessment, considered a range of portfolio strategies in the context of uncertainty. The analysis sought to identify broad portfolio strategies that best balance cost and risk by providing reasonable economics across a broad range of outcomes. Coupled with the results of the analyses outlined in the prior chapters especially the technical assessment of supply-side alternatives, the Portfolio Strategy Assessment provides a basis for establishing a strategic direction and developing long-term portfolio scenarios for the Entergy Operating Companies.
Attachment 1 Docket R-30021 Page 117 of 150
11-2
Approach
Scope For the purpose of the Portfolio Strategy Assessment, SPO formulated several long-term portfolios reflecting a range of strategic alternatives. The portfolios were then assessed across a range of outcomes for the following key uncertainties:
• Natural Gas Prices;
• CO2 Costs; and
• Renewable Portfolio Standards.
The analysis described in this chapter was conducted at the overall utility level. Additional analyses were also prepared to confirm that strategic conclusions remained valid for other planning levels (four-Company System, EAI Standalone, and EMI Standalone).
Methodology To assess the Portfolio Strategy, the SPO:
• Developed eight conceptual portfolio scenarios (alternative strategies). The scenarios comprehended portfolios including gas, renewable, solid-fuel and new nuclear alternatives.
• Conducted probability analysis for each portfolio considering 3000 iterations of gas and CO2 outcomes.
• Assessed 20-year total supply cost for each portfolio.
• Considered results with and without levels of Renewable Portfolio Standards (“RPS.”)
Treatment of Load Uncertainty The Portfolio Strategy Assessment is based on the base case load forecast. The SRP Update recognizes that long-term load growth is uncertain and will have implications for the long-term resource needs of the Entergy Operating Companies. Implications of load uncertainty on long-term planning needs are assessed separately through planning scenarios described in Chapter 12. The SRP assumes that the amount or timing of portfolio additions would be adjusted up or down to reflect actual changes in long-term load growth.
Attachment 1 Docket R-30021 Page 118 of 150
11-3
However, changes in load levels are not expected to alter the conclusions regarding the strategic direction for overall portfolio composition.
Consideration of Implementation Risk The Portfolio Strategy Assessment assumes, as a given, the cost and availability of the various technologies included in each portfolio. In reality, these assumptions are matters of uncertainty. The cost of implementing any of the portfolios over the twenty-year planning horizon are likely to, in fact, differ from the assumptions made in this analysis.
The SRP process addresses this uncertainty by providing flexibility to respond to changing conditions. This SRP Update is based on the best information available at the time of its development. Assumptions about future resource additions reflected in Planning Scenarios represent placeholders that will be adjusted in future updates as better information becomes available. On-going planning efforts will continue to monitor changes in the cost and availability of resource alternatives. Future SRP Updates reflect revised assumptions as needed. Decisions regarding actual resources additions are not made until the execution phase of process.
Reliability The analysis assumes that reliability must be maintained. Accordingly, all portfolios assessed in the Portfolio Strategy Assessment were constructed to meet planning reserve margins.
DSM The Portfolio Strategy Assessment assumed the implementation of DSM described in Chapter 9. As noted there the level of DSM programs that will be implemented over the planning horizon will depend on a number of factors. Uncertainties relating to the level of DSM that would actually be implemented and the effect that such levels may have on load were considered as a component of load uncertainty and accordingly addressed along with other elements of load uncertainty in Chapter 12.
Portfolio Assumptions
The table shown below describes the eight portfolios considered in the Portfolio Strategy Assessment. All portfolios assume a common level of demand-side management, which is the level included in the reference case.
All portfolios – by design – provided comparable levels of reliability. However, some renewable technologies – wind and solar – are intermittent (non-firm; non-dispatchable) in that output from these technologies depend on non-controllable factors. The System Dispatcher cannot order the wind to
Attachment 1 Docket R-30021 Page 119 of 150

11-4
blow harder or softer, and cannot control the amount of sunlight hitting the earth. The uncertainty regarding the output of solar or wind facilities means that additional capacity is required to meet planning reserves. Consequently, portfolios that include intermittent generation include greater levels of total capacity.
Figure 11-1: Portfolio Descriptions
Portfolio
Description
Gas Centric All incremental resources met by gas-fired CCGT.
Green Gold 2000 MW of RG by 2028. All remaining incremental resource needs met by the gas-fired CCGT.
Deep Green 5000 MW of RG by 2028. All remaining incremental resource needs met by gas-fired CCGT.
Max Green 8000 MW of RG by 2028. All remaining incremental resource needs met by gas-fired CCGT.
Nuclear Reaction 2000 MW of new nuclear added after 2019. All remaining incremental resource needs met by gas-fired CCGT.
Solid Foundation 2000 MW new coal-fired capacity with CCS added after 2019. All remaining
Solid Green 2000 MW of RG by 2028. 2000 MWs of solid-fuel capacity added after 2019. All remaining incremental resource needs met by gas-fired CCGT.
Nuclear Green 2000 MW of RG by 2028. 2000 MWs of new nuclear added after 2019. All remaining incremental resource needs met by gas-fired CCGT.
Figure 11-2: Incremental Portfolio Additions (MWs)
7,5006,000
4,500 3,5005,500 5,500
4,000 4,000
2,000 5,000 8,000
2,000 2,000
2,000 2,000 2,0002,000
0
2,000
4,000
6,000
8,000
10,000
12,000
Gas Centric Green Gold Deep Green Max Green NuclearReaction
SolidFoundation
NuclearGreen
Solid Green
CCGT/CT Renewable Generation Nuclear New Coal
Attachment 1 Docket R-30021 Page 120 of 150
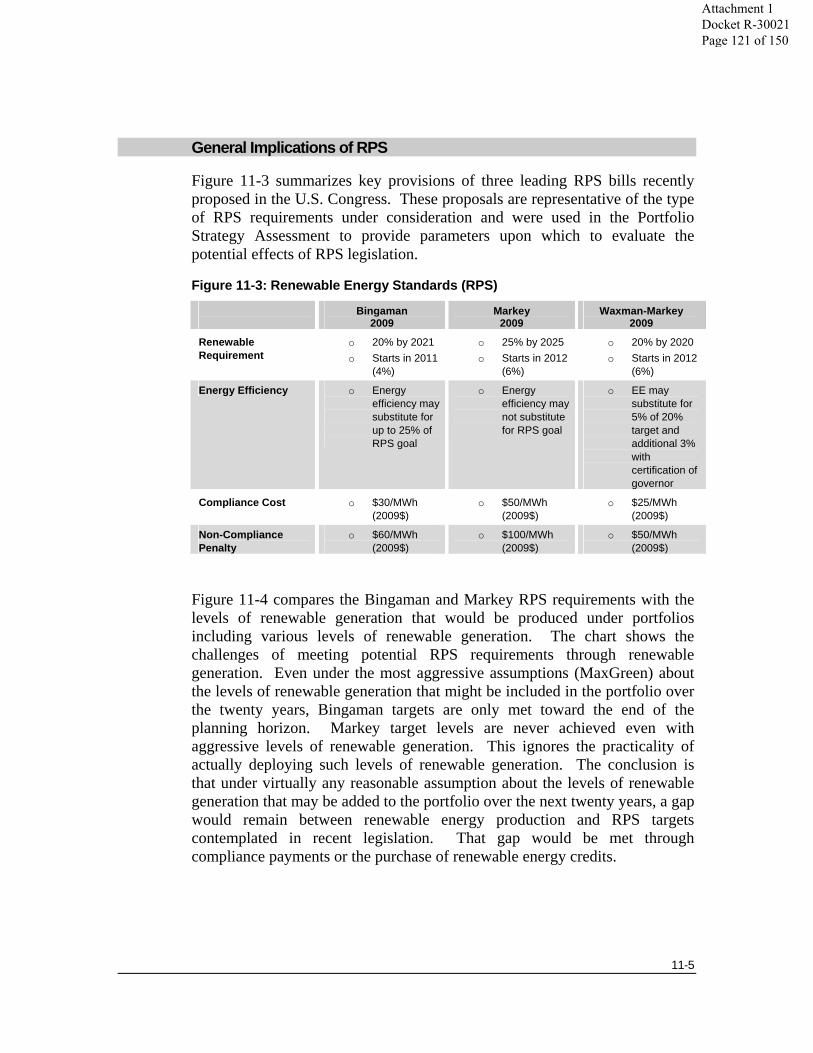
11-5
General Implications of RPS
Figure 11-3 summarizes key provisions of three leading RPS bills recently proposed in the U.S. Congress. These proposals are representative of the type of RPS requirements under consideration and were used in the Portfolio Strategy Assessment to provide parameters upon which to evaluate the potential effects of RPS legislation.
Figure 11-3: Renewable Energy Standards (RPS)
Bingaman 2009
Markey 2009
Waxman-Markey 2009
Renewable Requirement
o 20% by 2021 o Starts in 2011
(4%)
o 25% by 2025 o Starts in 2012
(6%)
o 20% by 2020 o Starts in 2012
(6%)
Energy Efficiency o Energy efficiency may substitute for up to 25% of RPS goal
o Energy efficiency may not substitute for RPS goal
o EE may substitute for 5% of 20% target and additional 3% with certification of governor
Compliance Cost o $30/MWh (2009$)
o $50/MWh (2009$)
o $25/MWh (2009$)
Non-Compliance Penalty
o $60/MWh (2009$)
o $100/MWh (2009$)
o $50/MWh (2009$)
Figure 11-4 compares the Bingaman and Markey RPS requirements with the levels of renewable generation that would be produced under portfolios including various levels of renewable generation. The chart shows the challenges of meeting potential RPS requirements through renewable generation. Even under the most aggressive assumptions (MaxGreen) about the levels of renewable generation that might be included in the portfolio over the twenty years, Bingaman targets are only met toward the end of the planning horizon. Markey target levels are never achieved even with aggressive levels of renewable generation. This ignores the practicality of actually deploying such levels of renewable generation. The conclusion is that under virtually any reasonable assumption about the levels of renewable generation that may be added to the portfolio over the next twenty years, a gap would remain between renewable energy production and RPS targets contemplated in recent legislation. That gap would be met through compliance payments or the purchase of renewable energy credits.
Attachment 1 Docket R-30021 Page 121 of 150
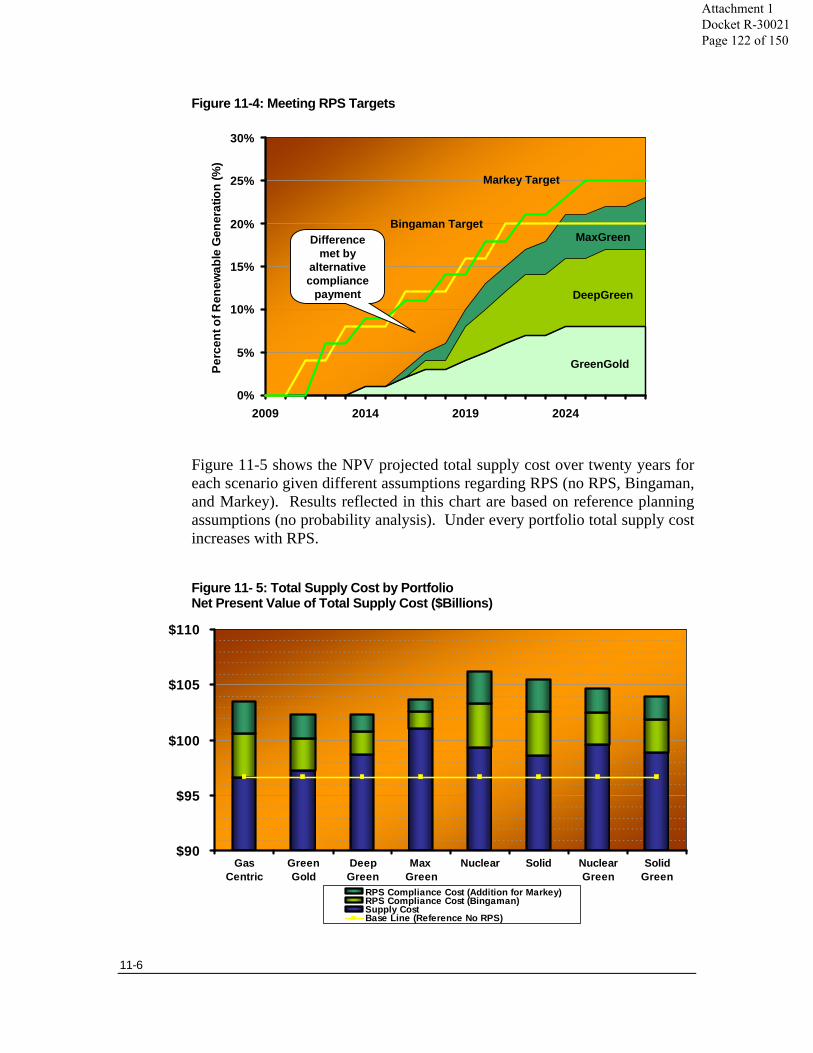
11-6
Figure 11-4: Meeting RPS Targets
Figure 11-5 shows the NPV projected total supply cost over twenty years for each scenario given different assumptions regarding RPS (no RPS, Bingaman, and Markey). Results reflected in this chart are based on reference planning assumptions (no probability analysis). Under every portfolio total supply cost increases with RPS.
Figure 11- 5: Total Supply Cost by Portfolio Net Present Value of Total Supply Cost ($Billions)
0%
5%
10%
15%
20%
25%
30%
2009 2014 2019 2024
Perc
ent o
f Ren
ewab
le G
ener
atio
n (%
)Bingaman Target
Markey Target
GreenGold
DeepGreen
MaxGreenDifference met by
alternative compliance
payment
$90
$95
$100
$105
$110
GasCentric
GreenGold
DeepGreen
Max Green
Nuclear Solid NuclearGreen
SolidGreen
RPS Compliance Cost (Addition for Markey)RPS Compliance Cost (Bingaman)Supply CostBase Line (Reference No RPS)
Attachment 1 Docket R-30021 Page 122 of 150
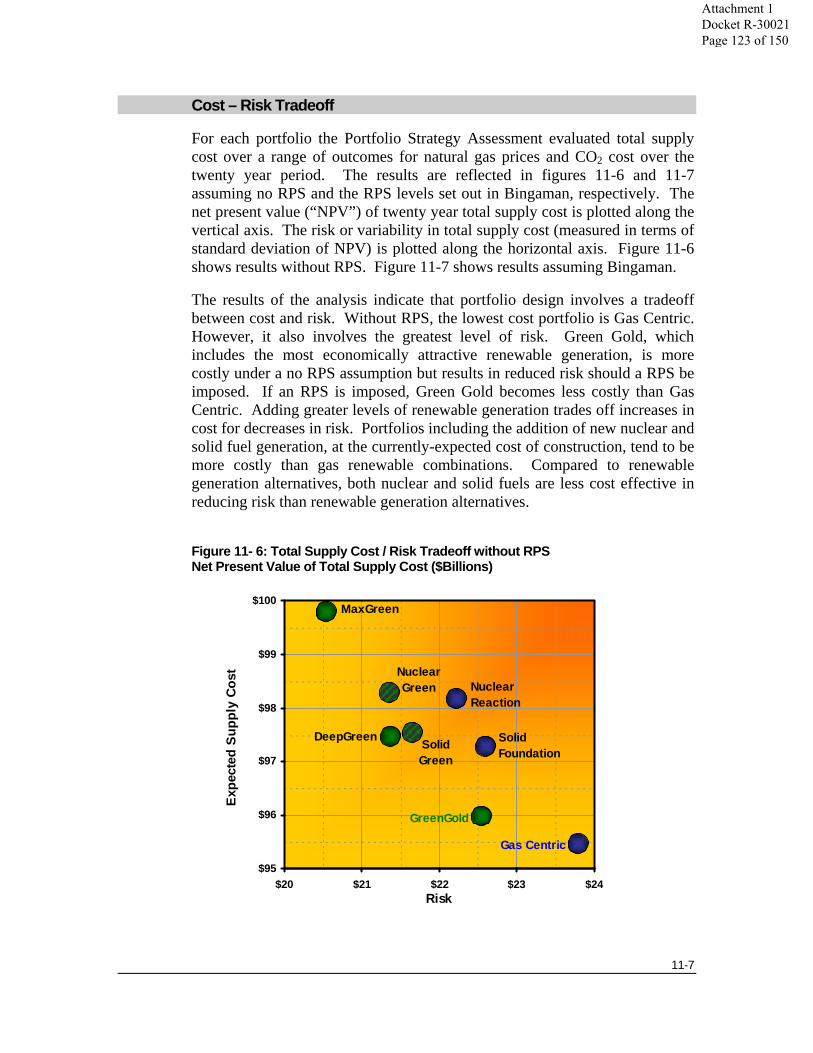
11-7
Cost – Risk Tradeoff
For each portfolio the Portfolio Strategy Assessment evaluated total supply cost over a range of outcomes for natural gas prices and CO2 cost over the twenty year period. The results are reflected in figures 11-6 and 11-7 assuming no RPS and the RPS levels set out in Bingaman, respectively. The net present value (“NPV”) of twenty year total supply cost is plotted along the vertical axis. The risk or variability in total supply cost (measured in terms of standard deviation of NPV) is plotted along the horizontal axis. Figure 11-6 shows results without RPS. Figure 11-7 shows results assuming Bingaman.
The results of the analysis indicate that portfolio design involves a tradeoff between cost and risk. Without RPS, the lowest cost portfolio is Gas Centric. However, it also involves the greatest level of risk. Green Gold, which includes the most economically attractive renewable generation, is more costly under a no RPS assumption but results in reduced risk should a RPS be imposed. If an RPS is imposed, Green Gold becomes less costly than Gas Centric. Adding greater levels of renewable generation trades off increases in cost for decreases in risk. Portfolios including the addition of new nuclear and solid fuel generation, at the currently-expected cost of construction, tend to be more costly than gas renewable combinations. Compared to renewable generation alternatives, both nuclear and solid fuels are less cost effective in reducing risk than renewable generation alternatives.
Figure 11- 6: Total Supply Cost / Risk Tradeoff without RPS Net Present Value of Total Supply Cost ($Billions)
NuclearGreen
Solid Green
MaxGreen
Nuclear Reaction
DeepGreen Solid Foundation
GreenGold
Gas Centric
$95
$96
$97
$98
$99
$100
$20 $21 $22 $23 $24Risk
Expe
cted
Sup
ply
Cost
Attachment 1 Docket R-30021 Page 123 of 150

11-8
Figure 11- 7: Total Supply Cost / Risk Tradeoff with RPS Net Present Value of Total Supply Cost ($Billions)
Strategic Conclusions
The results of the Portfolio Strategy Assessment suggest that a portfolio strategy incorporating the following attributes balances planning objectives in a reasonable manner:
• A focus on gas-fired CCGT capacity as the basic building block of the portfolio.
• Reasonable levels of economically attractive renewable generation.
• Including reasonable levels of renewable generation in the portfolio can help mitigate the cost of RPS compliance.
• The Operating Companies cannot realistically meet the renewable energy targets embodied in recently proposed Congressional legislation cannot realistically solely through the deployment of renewable generation. Compliance will require
NuclearGreen
Solid Green
MaxGreen
Nuclear Reaction
DeepGreen
Solid Foundation
GreenGold
Gas Centric
$99
$100
$101
$102
$103
$20 $21 $22 $23 $24Risk
Expe
cted
Sup
ply
Cost
Attachment 1 Docket R-30021 Page 124 of 150
11-9
purchase of Renewable Energy Credits (“RECs”) and or Compliance Payments.
• At this time based on current assumptions, neither new nuclear nor solid fuel technologies – although for somewhat different reasons – appear to provide an attractive tradeoff between cost and risk.
• Uncertainties regarding RPS, CO2 cost, and natural gas prices affect total supply cost and the relative attractiveness of portfolio design options.
Attachment 1 Docket R-30021 Page 125 of 150
12-1
. . . . . . .. . . Chapter 12
Reference Planning Scenario Charting a Course
Overview
The SRP Update relies on the analysis and information described in the prior chapters to design a Reference Planning Scenario portfolio. The Reference Planning Scenario describes a resource portfolio that would be appropriate for meeting future customer needs, based on a reasonably-likely set of assumptions, over the next twenty years. However, the future is uncertain, and the SRP Update reflects this uncertainty. The outcome of a wide number of uncertainties will affect customer needs, the cost and performance characteristics of alternative resources, and the best portfolio choices to meet those needs over the next two decades. Accordingly, the Reference Planning Scenario charts a course that meets planning objectives while providing the flexibility to respond to changing conditions. This chapter describes:
• The portfolio assumptions reflected in the Reference Planning Scenario;
• The strategic direction recommended by the Reference Planning Scenario; and
• Plans for addressing uncertainties including several alternative planning scenarios.
While this chapter provides some information about portfolio assumptions for the individual Companies, the focus here is on the overall 6-Company Utility level portfolio. Additional sections of the SRP Update provide details regarding individual Operating Companies and the Entergy System post exit of EAI and EMI.
Reference Planning Scenario
The Reference Planning Scenario describes a portfolio of resources to meet customer needs for the next twenty years. The Reference Planning Scenario meets the following criteria.
Attachment 1 Docket R-30021 Page 126 of 150
12-2
• Balances the supply objectives of reliability, cost, and risk mitigation;
• Accomplishes these planning objectives while considering utilization of natural resources and effects on the environment;
• Results in sufficient capacity to meet reliability requirements for the Entergy System, EAI stand-alone, and EMI stand-alone throughout the twenty year planning horizon; and
• Addresses reliability needs within all planning regions.
• Outlines a disciplined approach to resource additions while allowing the flexibility to respond to changing circumstances.
• Meets bulk of reliability needs through long-term resources (owned or power purchase contracts).
• Addresses fuel diversity through the addition of renewable generation while monitoring the economics of other stable priced generation alternatives.
Reference Planning Scenario Assumptions The Reference Planning Scenario assumes that incremental resource needs will be met primarily by gas-fired CCGT resources coupled with economically attractive renewable generation and levels of DSM consistent with regulatory approval and appropriate cost recovery mechanisms. Specific portfolio assumptions include the following:
• 6.9 GWs of existing gas-fired steam capacity is deactivated.
• 8.6 GWs of gas-fired CCGT resources are added.
• 2.0 GWs of renewable generation is added from 2014 to 2028, representing a level of economically attractive renewable generation that is realistically achievable given current cost estimates. The Entergy System is currently conducting a Request for Information relating to renewables and anticipates conducting a Request for Proposals for renewable generation within the next year. The results of those initiatives will inform future planning efforts and will result in appropriate adjustments to the levels of renewable generation included in future SRP Updates.
• All existing coal-fired capacity remains in operation throughout the planning horizon.
Attachment 1 Docket R-30021 Page 127 of 150
12-3
• All existing nuclear facilities remain in operation throughout the planning horizon.
• 0.3 GWs of nuclear capacity is added in the form of nuclear uprates at existing facilities. As of late June, the Operating Companies have not entered into any binding commitments to execute any of these uprates. The Operating Companies are evaluating the technical and economic feasibility of nuclear uprate projects, and have taken steps to ensure that potential uprate projects remain viable resource options. If the projects prove to be uneconomic or technically unfeasible, the incremental MW associated with nuclear uprates would be replaced with additional CCGT resources.
• No new solid fuel or new nuclear capacity is added over the twenty years.
• The Little Gypsy Repowering Project is suspended indefinitely.
Strategic Recommendations The Reference Planning Scenario reflects the following strategic recommendations:
• Focus on gas-fired CCGT capacity as the basic building block of the portfolio.
• Pursue reasonable levels of economically attractive renewable generation. The levels and type of renewable generation actually deployed will depend on on-going assessment of cost and availability including the results of a RFP anticipated to be conducted within the next 12 months. Preliminary assumptions included in the Reference Planning Scenario reflect that:
• Near-term additions are anticipated to be primarily biomass and wind.
• The addition of 700 MWs Renewable Generation (Six Companies) over the first ten years.
• Continue to monitor the costs and benefits of new nuclear and solid fuel and strike on these options in the future if and when analyses warrant.
• Maintain readiness of new nuclear through spending levels consistent with results of on-going assessment.
Attachment 1 Docket R-30021 Page 128 of 150

12-4
• However, the Reference Planning Scenario does not reflect an expectation that any new nuclear or solid fuel resources will enter service over the 20 year planning horizon.
• Continue development of long term integrated planning efforts with Entergy Transmission to identify portfolio solutions that best balance planning objectives. Results of integrated supply and transmission planning efforts that are now allowed subsequent to FERC’s Order 717 may result in adjustments to the timing and location of resource needs.
• Pursue cost effective DSM subject to appropriate regulatory approvals.
• The Reference Planning Scenario includes assumptions about DSM consistent with results of the ICF potential study (about 628 MWs over the first ten years) adjusted for reasonable implementation and approval timeline.
• The level of DSM that will be implemented over the planning horizon will depend on a number of factors including the level of DSM that the Operating Companies’ retail regulators agree should be deployed, and the implementation of appropriate regulatory review, approval, and cost recovery mechanisms to allow the Operating Companies a reasonable opportunity to recover the total costs associated with those programs.
Regional Needs The Reference Planning Scenario includes assumptions about resource additions to meet specific regional needs. Specifically, the Reference Planning Scenario assumes:
• CCGT resources are located within each planning region to address load following needs.
• The 2009 Western RFP results in the addition of a CCGT resource in the Western Region to meet long-term reliability requirements. The resource is assumed to begin in 2014. The System has identified a self-supply alternative in the Western division of the WOTAB planning region and is market testing the option in the January 2009 Western RFP.
• The Summer 2009 RFP results in the addition of a CCGT resource to meet long-term reliability needs in the Amite South planning region. The resource is assumed to begin in 2015. The System has identified a self-supply alternative in the Amite South region and anticipates market testing it in the Summer 2009 RFP.
Attachment 1 Docket R-30021 Page 129 of 150
12-5
• A CCGT resource is added in WOTAB in 2017 to address regional reliability requirements. The System has identified a self-supply alternative in the WOTAB region which could form the basis of a future market test.
Operating Company Needs The Reference Planning Scenario assumes the addition of CCGT resources in the near-term to address specific Operating Company requirements. Additional CCGT capacity is added to position EAI and EMI to operate on a stand-alone basis. These resources could be supplied through the Summer 2009 RFP, bilateral negotiations, future RFPs, or self-supply alternatives.
Strategic Flexibility As described throughout this document, a large number of uncertainties can affect the long-term resource needs of the Entergy Operating Companies, the alternatives available to meet those needs, and the relative attractiveness of those alternatives in terms of cost and performance. Attempting to describe resource additions twenty years into the future, therefore, is froth with risks. The SRP explicitly recognizes these risks. Key points include:
• Assumptions included in SRP planning scenarios regarding the timing, cost, and regional location of long-term generating capacity additions are meant to represent “placeholders” and do not prescribe definitive technology choices or site selections. The SRP envisions that decisions about technology and location of resource additions will be made as generation projects are implemented over the planning horizon. The Entergy Operating Companies will choose technologies, select sites, and determine resource timing based on the best information available at the time.
• The disciplined approach to incremental additions and the emphasis on CCGT resources – which can be implemented with relatively short lead times and in relatively small increments – avoids the risk associated with over commitment to supply-side resources.
• The near-term focus on the addition of CCGT resources provides portfolio flexibility in that these resources are technically and economically suited for a wide-range of operating roles. CCGT technology is economically suited for load-following roles and remains the technology of choice for that purpose which the System needs. Further, CCGT technology is economic for base load operation at current expectations for natural gas and carbon. Consequently, CCGT resources fit long-term needs regardless of how uncertainties eventually resolve. The relatively short lead times associated with
Attachment 1 Docket R-30021 Page 130 of 150
12-6
gas-fired facilities as compared to new nuclear or coal resources allow flexibility to adjust long-term capacity plans as uncertainties resolve.
Supply Diversity The SRP seeks to mitigate exposure to risk, including both exposure to price volatility associated with uncertainties in fuel and purchased power costs and exposure to major supply disruptions or systematic risks. To accomplish these objectives, the SRP seeks to utilize a mix of generating technologies and fuel sources within the generation portfolio.
In an attempt to mitigate risk, prior SRP Updates have sought to provide each Operating Company with long-term controllable Stable Fuel Price Capacity resources (specifically, coal, petroleum coke, or nuclear resources) that would move each Operating Company toward the objective of having resources that could provide its base load firm energy requirements from resources with highly predictable fuel prices. However, the results of the 2009 SRP Update indicate that neither coal nor new nuclear represent attractive alternatives under reference assumptions.
New Nuclear On a $/MWh basis, new nuclear achieves rough parity with CCGT under reference assumptions in the later half of the planning horizon. However, the required commitment of capital to construct ($/kW and large size) coupled with operating inflexibility create risk in the current environment of uncertainty. Although its economics depend on the outcome of a number of uncertainties, including the long-term cost of natural gas and CO2 regulation, new nuclear offers the potential for an economic source of stable-priced power with zero carbon emissions to meet long-term base load needs. Under high natural gas price assumptions new nuclear appears economically attractive relative to gas-fired CCGT technology. Consequently, continued assessment of new nuclear is merited.
Solid Fuel Prospects for CO2 regulation represent a significant challenge for solid fuel technology. In the long term, the availability and cost of CCS is uncertain. But, under current reference assumptions solid fuel resources with CCS does not appear attractive relative to CCGTs.
Capital Cost Risk Both solid fuel and new nuclear are costly to build. Consequently, commitment to these technologies involves additional risk if uncertainties ultimately prove unfavorable. Moreover, because the cost of constructing these technologies is so high, the economics depend on base load operation.
Attachment 1 Docket R-30021 Page 131 of 150

12-7
This is in contrast to gas-fired CCGT technology, which is the technology of choice for load-following applications under virtually all reasonable assumptions.
It is possible that either, or both, new nuclear and solid fuel technologies ultimately may prove attractive alternatives for meeting customer power needs. But, at this time the risks stemming from key uncertainties are too great to include new nuclear or solid fuel resources in the Reference Planning Scenario.
Conclusions Reflected in 2009 SRP Update At currently-expected levels of fuel price, construction costs, and the cost of controlling CO2 emissions, solid fuel and new nuclear resources are too costly and uncertain. However, the economics of these options bear monitoring given that key uncertainties – including the cost of the technologies themselves – can alter the relative economics. The 2009 SRP Update adopts a “wait and see” approach regarding solid fuel and new nuclear. No new nuclear or incremental solid fuel resources are assumed to enter service in the Reference Planning Scenario over the twenty year planning horizon. However, the development of these technologies will be monitored. If uncertainties resolve in a favorable manner, the Entergy Operating Companies can strike on new nuclear or solid fuel alternatives in the longer-term. Meanwhile, a focus on the addition of gas-fired CCGT resources coupled with economically attractive renewable generation and levels of DSM consistent with regulatory approval and cost recovery represent a “no-regrets” strategy.
New Nuclear Readiness Although the Reference Planning Scenario does not include new nuclear, the SRP recognizes that new nuclear offers the potential for an economic source of stable priced base load capacity with zero carbon emissions. In light of the uncertainties that may affect new nuclear and the potential of new nuclear to meet long-term base load needs, the SRP calls for continued monitoring of new nuclear. Entergy Operating Companies will maintain readiness of new nuclear through spending levels consistent with results of the on-going assessment. In the event that economics change, the Entergy Operating Companies will be prepared to propose new nuclear as a portfolio alternative in the later half of the planning horizon. A subsequent section in this chapter, Alternative Planning Scenarios, describes a New Nuclear Planning Scenario that would include new nuclear in the 2020 – 2025 time frame if uncertainties resolve in a manner that is favorable to new nuclear.
Attachment 1 Docket R-30021 Page 132 of 150
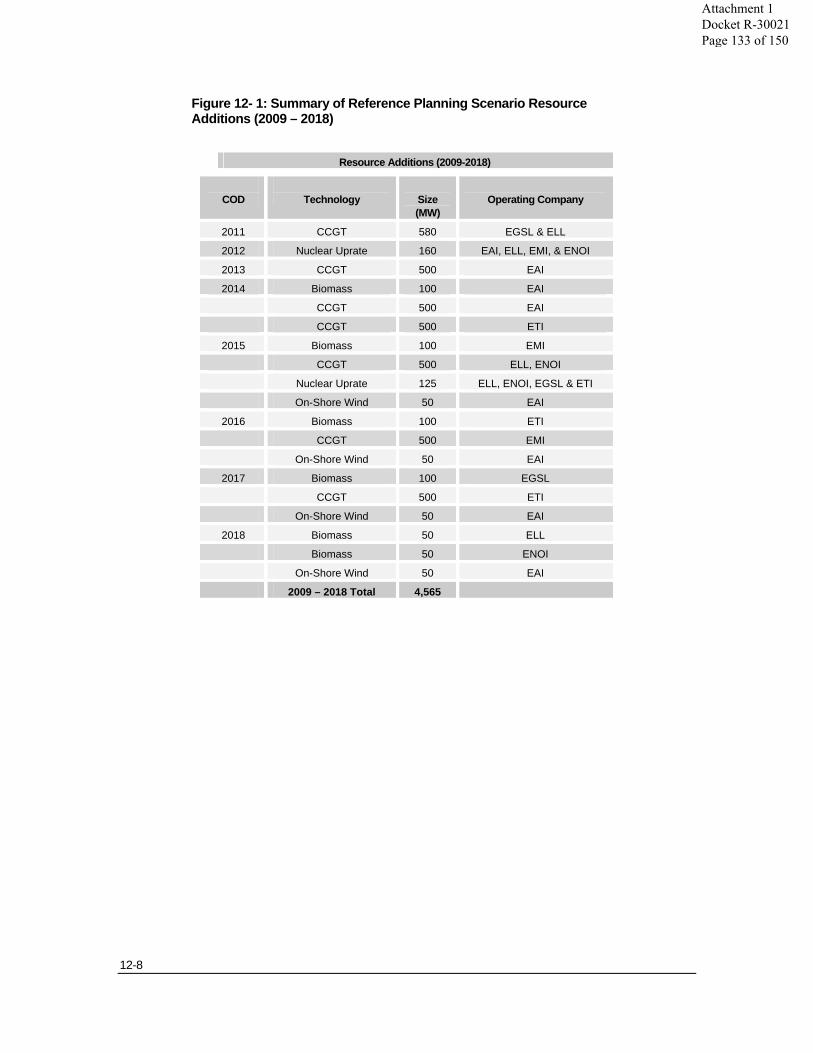
12-8
Figure 12- 1: Summary of Reference Planning Scenario Resource Additions (2009 – 2018)
Resource Additions (2009-2018)
COD
Technology
Size (MW)
Operating Company
2011 CCGT 580 EGSL & ELL
2012 Nuclear Uprate 160 EAI, ELL, EMI, & ENOI
2013 CCGT 500 EAI
2014 Biomass 100 EAI
CCGT 500 EAI
CCGT 500 ETI
2015 Biomass 100 EMI
CCGT 500 ELL, ENOI
Nuclear Uprate 125 ELL, ENOI, EGSL & ETI
On-Shore Wind 50 EAI
2016 Biomass 100 ETI
CCGT 500 EMI
On-Shore Wind 50 EAI
2017 Biomass 100 EGSL
CCGT 500 ETI
On-Shore Wind 50 EAI
2018 Biomass 50 ELL
Biomass 50 ENOI
On-Shore Wind 50 EAI
2009 – 2018 Total 4,565
Attachment 1 Docket R-30021 Page 133 of 150

12-9
Figure 12-2: Summary of Reference Planning Scenario Resource Additions (2019 – 2028)
Resource Additions (2019-2028)
COD
Technology
Size (MW)
Operating Company
2019 Biomass 100 ELL
In-Stream Hydro 50 EMI
2020 Biomass 100 EAI
CCGT 500 EAI
CCGT 500 EMI
In-Stream Hydro 50 EGSL
2021 Biomass 100 ETI
In-Stream Hydro 50 ELL
2022 CCGT 500 ETI
CCGT 500 EMI
In-Stream Hydro 50 ELL
Off-System Wind 100 ETI
Off-System Wind 100 EMI
Off-System Wind 50 EGSL
2023 In-Stream Hydro 50 ELL
Off-System Wind 150 ELL
Off-System Wind 50 EGSL
Off-System Wind 50 EMI
2024 CCGT 500 EGSL
CCGT 500 ETI
In-Stream Hydro 50 EMI
2025 CCGT 500 EMI
CCGT 500 ETI
In-Stream Hydro 50 EGSL
2026 In-Stream Hydro 50 EAI
2027 CCGT 500 EMI
CCGT 500 ENOI
In-Stream Hydro 50 ETI
2028 In-Stream Hydro 50 ENOI
2019 – 2028 Total 6,300
2009 – 2028 Total 10,865
Attachment 1 Docket R-30021 Page 134 of 150
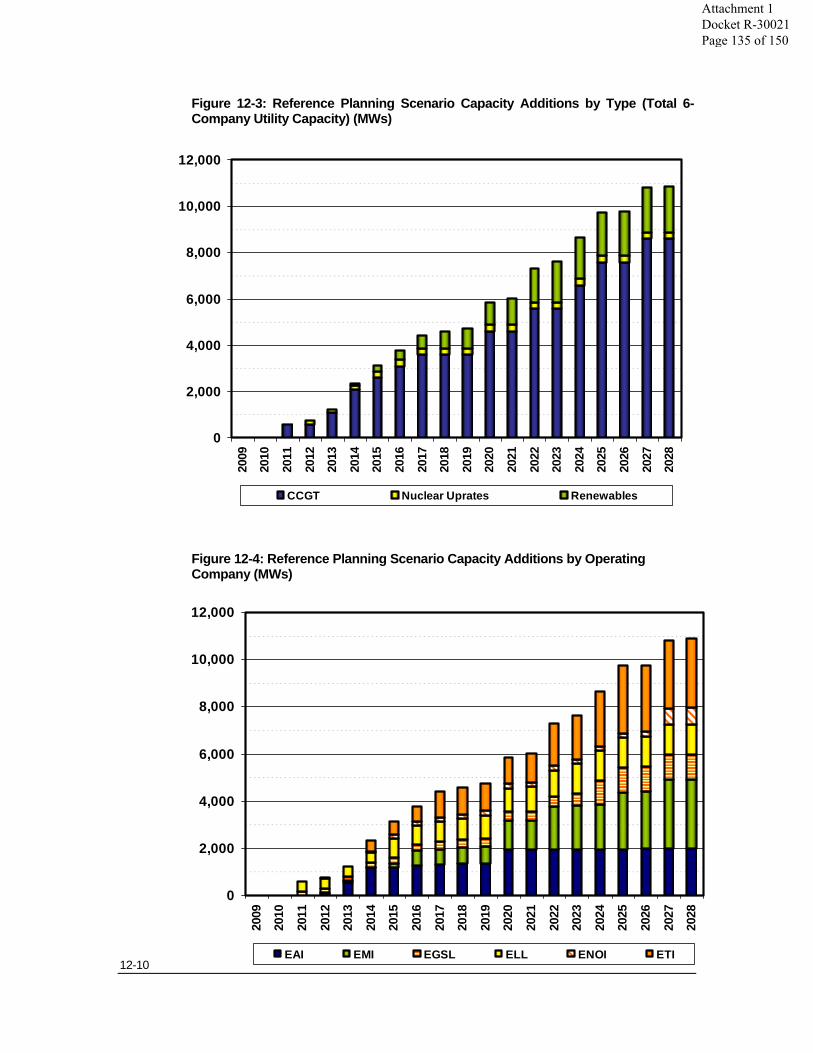
12-10
Figure 12-3: Reference Planning Scenario Capacity Additions by Type (Total 6-Company Utility Capacity) (MWs)
Figure 12-4: Reference Planning Scenario Capacity Additions by Operating Company (MWs)
0
2,000
4,000
6,000
8,000
10,000
12,000
2009
2010
2011
2012
2013
2014
2015
2016
2017
2018
2019
2020
2021
2022
2023
2024
2025
2026
2027
2028
CCGT Nuclear Uprates Renewables
0
2,000
4,000
6,000
8,000
10,000
12,000
2009
2010
2011
2012
2013
2014
2015
2016
2017
2018
2019
2020
2021
2022
2023
2024
2025
2026
2027
2028
EAI EMI EGSL ELL ENOI ETI
Attachment 1 Docket R-30021 Page 135 of 150
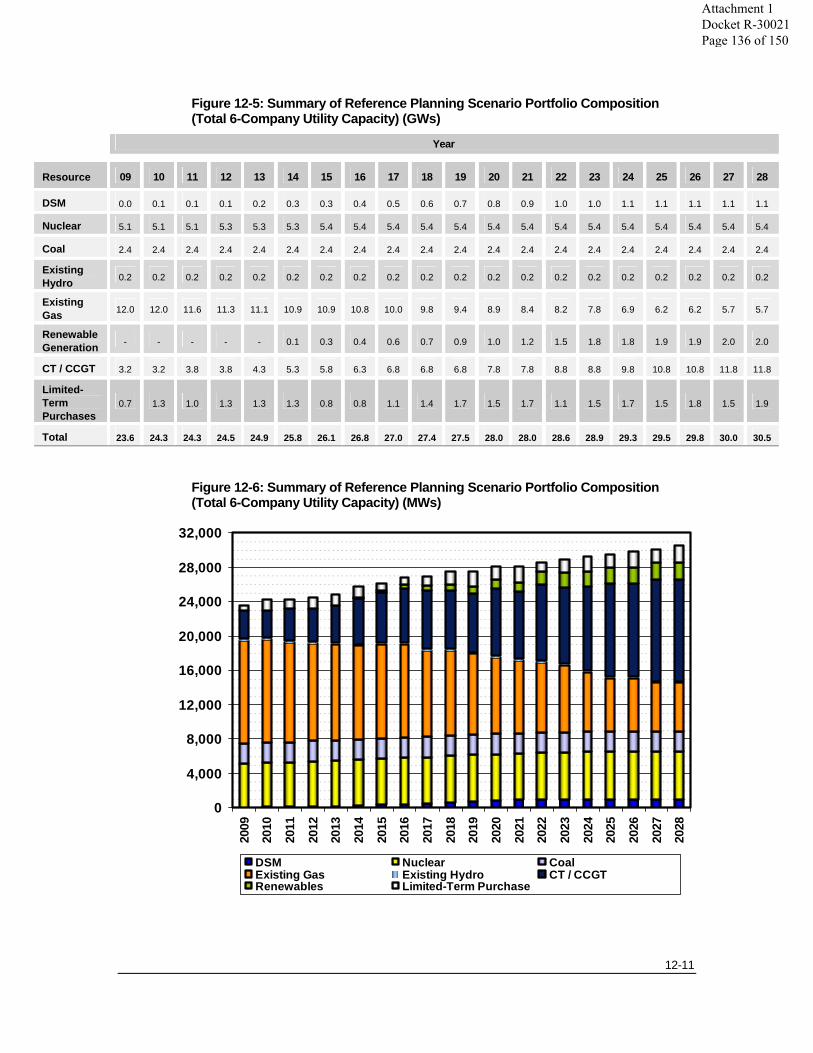
12-11
Figure 12-5: Summary of Reference Planning Scenario Portfolio Composition (Total 6-Company Utility Capacity) (GWs)
Year
Resource 09 10 11 12 13 14 15 16 17 18 19 20 21 22 23 24 25 26 27 28
DSM 0.0 0.1 0.1 0.1 0.2 0.3 0.3 0.4 0.5 0.6 0.7 0.8 0.9 1.0 1.0 1.1 1.1 1.1 1.1 1.1
Nuclear 5.1 5.1 5.1 5.3 5.3 5.3 5.4 5.4 5.4 5.4 5.4 5.4 5.4 5.4 5.4 5.4 5.4 5.4 5.4 5.4
Coal 2.4 2.4 2.4 2.4 2.4 2.4 2.4 2.4 2.4 2.4 2.4 2.4 2.4 2.4 2.4 2.4 2.4 2.4 2.4 2.4
Existing Hydro 0.2 0.2 0.2 0.2 0.2 0.2 0.2 0.2 0.2 0.2 0.2 0.2 0.2 0.2 0.2 0.2 0.2 0.2 0.2 0.2
Existing Gas 12.0 12.0 11.6 11.3 11.1 10.9 10.9 10.8 10.0 9.8 9.4 8.9 8.4 8.2 7.8 6.9 6.2 6.2 5.7 5.7
Renewable Generation - - - - - 0.1 0.3 0.4 0.6 0.7 0.9 1.0 1.2 1.5 1.8 1.8 1.9 1.9 2.0 2.0
CT / CCGT 3.2 3.2 3.8 3.8 4.3 5.3 5.8 6.3 6.8 6.8 6.8 7.8 7.8 8.8 8.8 9.8 10.8 10.8 11.8 11.8
Limited-Term Purchases
0.7 1.3 1.0 1.3 1.3 1.3 0.8 0.8 1.1 1.4 1.7 1.5 1.7 1.1 1.5 1.7 1.5 1.8 1.5 1.9
Total 23.6 24.3 24.3 24.5 24.9 25.8 26.1 26.8 27.0 27.4 27.5 28.0 28.0 28.6 28.9 29.3 29.5 29.8 30.0 30.5
Figure 12-6: Summary of Reference Planning Scenario Portfolio Composition (Total 6-Company Utility Capacity) (MWs)
0
4,000
8,000
12,000
16,000
20,000
24,000
28,000
32,000
2009
2010
2011
2012
2013
2014
2015
2016
2017
2018
2019
2020
2021
2022
2023
2024
2025
2026
2027
2028
DSM Nuclear CoalExisting Gas Existing Hydro CT / CCGTRenewables Limited-Term Purchase
Attachment 1 Docket R-30021 Page 136 of 150
12-12
Alternative Planning Scenarios
The Reference Planning Scenario charts a course for meeting customer needs that balances the planning objectives of reliability, reasonable cost, and risk mitigation. In doing so, the Reference Planning Scenario considers uncertainty and describes a portfolio of resources that is reasonably robust in accomplishing these objectives across a range of outcomes. However, the SRP recognizes that a wide range of uncertainties will affect customer needs and the best alternatives to meet those needs.
Alternative Planning Scenarios have been developed to describe how the Reference Planning Scenario would be adjusted in the future to respond to specific contingencies. These scenarios include:
• New Nuclear Planning Scenario
• High Growth Planning Scenario
• Low Growth Planning Scenario
• High Load Factor Planning Scenario
Each is described in the following sections.
New Nuclear Planning Scenario Although the Reference Planning Scenario does not include new nuclear, the SRP recognizes that new nuclear offers the potential for an economic source of stable priced base load capacity with zero carbon emissions. In light of this potential, the Reference Planning Scenario assumes the following strategic actions with respect to new nuclear:
• Continue to monitor the economics of new nuclear and solid fuel and propose to strike on these options in the future if and when analyses warrant.
• Maintain readiness of new nuclear through spending levels consistent with results of on-going assessment.
The New Nuclear Planning Scenario describes how planned resource additions would be adjusted if results of on-going monitoring activities indicate that new nuclear technology proves to be a viable, economically attractive alternative to meet base load needs in the future. The Nuclear Planning Scenario assumes the addition of new nuclear in the 2020 – 2025 time frame. Detailed assumptions include the following:
• Two units, 1,000 MWs each, are added in 2021 and 2024, respectively.
Attachment 1 Docket R-30021 Page 137 of 150

12-13
• Given lead times associated with new nuclear development, it is not anticipated that new nuclear could be incorporated into portfolios prior to the second half of the planning horizon.
• The unit capacity assumptions are generic representations of potential new nuclear unit additions and do not reflect an assumption as to the specific technology chosen. The actual unit size and number of units would depend on technology selected.
• If new nuclear is determined to be economic, it is not anticipated that more than 2,000 MWs of new nuclear could be added in this planning horizon. The capital cost and challenges associated with development and construction limit the amount of new nuclear that realistically could be deployed within a defined time period.
• The GE ESBWR technology contemplates a unit size of about 1,500 MWs. The Nuclear Planning Scenario assumes that if this technology were chosen, only one unit would be deployable within the planning horizon.
• New nuclear additions would be expected to replace comparable amounts of CCGT capacity in the Reference Planning Scenario.
Attachment 1 Docket R-30021 Page 138 of 150
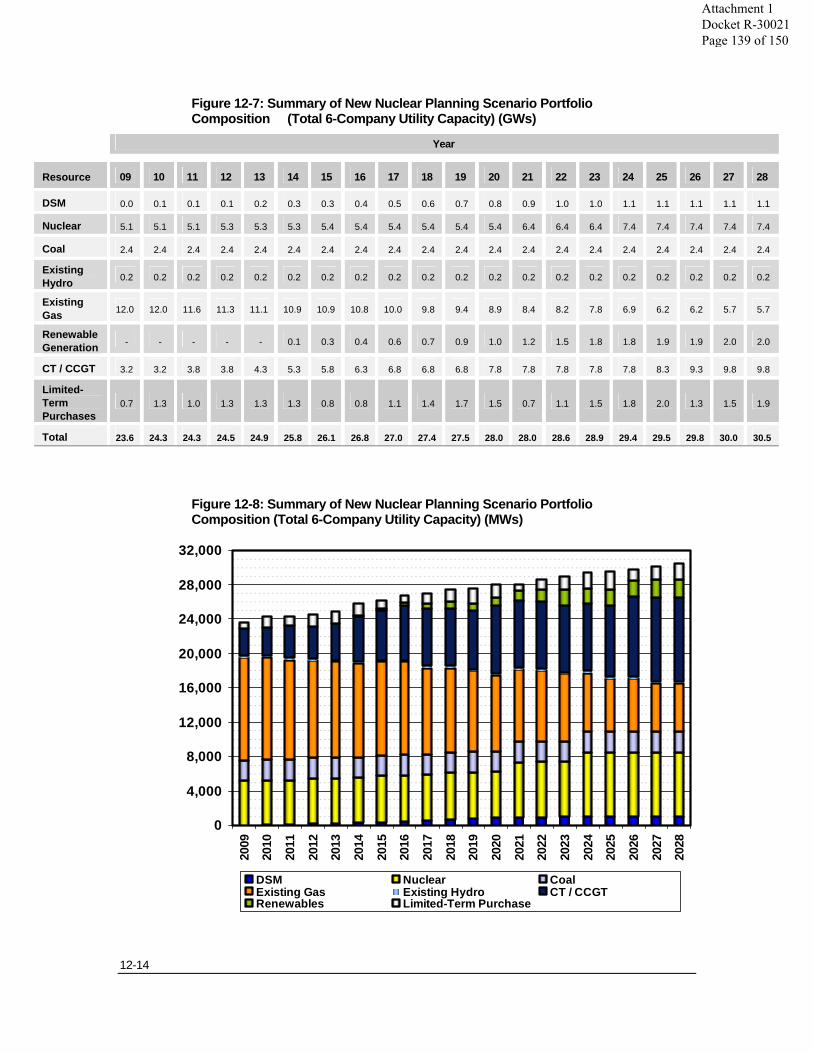
12-14
Figure 12-7: Summary of New Nuclear Planning Scenario Portfolio Composition (Total 6-Company Utility Capacity) (GWs)
Year
Resource 09 10 11 12 13 14 15 16 17 18 19 20 21 22 23 24 25 26 27 28
DSM 0.0 0.1 0.1 0.1 0.2 0.3 0.3 0.4 0.5 0.6 0.7 0.8 0.9 1.0 1.0 1.1 1.1 1.1 1.1 1.1
Nuclear 5.1 5.1 5.1 5.3 5.3 5.3 5.4 5.4 5.4 5.4 5.4 5.4 6.4 6.4 6.4 7.4 7.4 7.4 7.4 7.4
Coal 2.4 2.4 2.4 2.4 2.4 2.4 2.4 2.4 2.4 2.4 2.4 2.4 2.4 2.4 2.4 2.4 2.4 2.4 2.4 2.4
Existing Hydro 0.2 0.2 0.2 0.2 0.2 0.2 0.2 0.2 0.2 0.2 0.2 0.2 0.2 0.2 0.2 0.2 0.2 0.2 0.2 0.2
Existing Gas 12.0 12.0 11.6 11.3 11.1 10.9 10.9 10.8 10.0 9.8 9.4 8.9 8.4 8.2 7.8 6.9 6.2 6.2 5.7 5.7
Renewable Generation - - - - - 0.1 0.3 0.4 0.6 0.7 0.9 1.0 1.2 1.5 1.8 1.8 1.9 1.9 2.0 2.0
CT / CCGT 3.2 3.2 3.8 3.8 4.3 5.3 5.8 6.3 6.8 6.8 6.8 7.8 7.8 7.8 7.8 7.8 8.3 9.3 9.8 9.8
Limited-Term Purchases
0.7 1.3 1.0 1.3 1.3 1.3 0.8 0.8 1.1 1.4 1.7 1.5 0.7 1.1 1.5 1.8 2.0 1.3 1.5 1.9
Total 23.6 24.3 24.3 24.5 24.9 25.8 26.1 26.8 27.0 27.4 27.5 28.0 28.0 28.6 28.9 29.4 29.5 29.8 30.0 30.5
Figure 12-8: Summary of New Nuclear Planning Scenario Portfolio Composition (Total 6-Company Utility Capacity) (MWs)
0
4,000
8,000
12,000
16,000
20,000
24,000
28,000
32,000
2009
2010
2011
2012
2013
2014
2015
2016
2017
2018
2019
2020
2021
2022
2023
2024
2025
2026
2027
2028
DSM Nuclear CoalExisting Gas Existing Hydro CT / CCGTRenewables Limited-Term Purchase
Attachment 1 Docket R-30021 Page 139 of 150

12-15
Carbon Implications Nuclear generation results in zero carbon emissions. Consequently, replacing CCGT capacity with new nuclear capacity would be expected to result in a lower carbon footprint. Figure 12-9 compares carbon emissions under the Reference Planning Scenario with the New Nuclear Planning Scenario.
Figure 12-9: Average Annual Carbon Emissions (Total 6-Company Utility) (Million Tons per Year)
High Growth Planning Scenario As described in Chapter 7, Resource Needs, the overall capacity needs of the Entergy Operating Companies will depend on load growth. Chapter 3, Load, describes a range of outcomes for load growth. The High Growth Planning Scenario describes how planned resource additions would be adjusted if actual load growth tends toward the upper end of the outcomes described in Chapter 3. The High Growth Planning Scenario assumes that additional supply-side resources would be required over the planning horizon in order to meet higher loads. Detailed assumptions include the following:
• Load growth averages about 2.0% over the twenty year planning horizon.
0
10
20
30
40
50
60
2009
2010
2011
2012
2013
2014
2015
2016
2017
2018
2019
2020
2021
2022
2023
2024
2025
2026
2027
2028
Reference Planning Scenario New Nuclear Planning Scenario
Attachment 1 Docket R-30021 Page 140 of 150
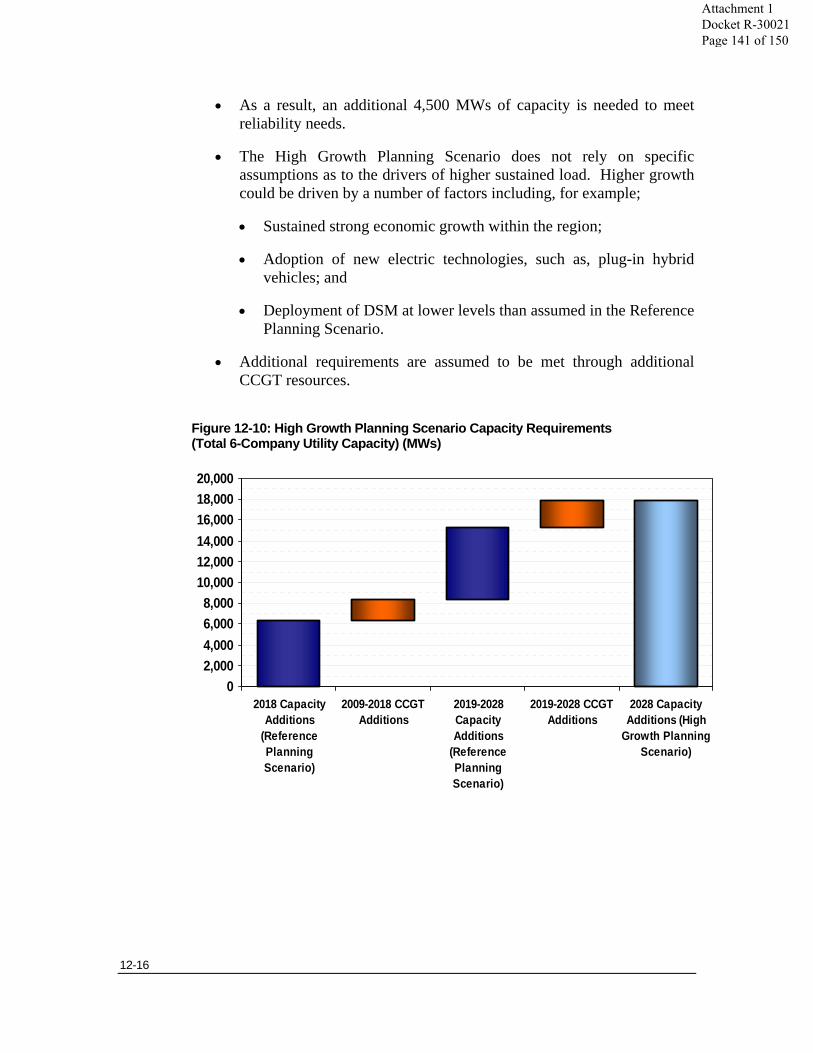
12-16
• As a result, an additional 4,500 MWs of capacity is needed to meet reliability needs.
• The High Growth Planning Scenario does not rely on specific assumptions as to the drivers of higher sustained load. Higher growth could be driven by a number of factors including, for example;
• Sustained strong economic growth within the region;
• Adoption of new electric technologies, such as, plug-in hybrid vehicles; and
• Deployment of DSM at lower levels than assumed in the Reference Planning Scenario.
• Additional requirements are assumed to be met through additional CCGT resources.
Figure 12-10: High Growth Planning Scenario Capacity Requirements (Total 6-Company Utility Capacity) (MWs)
02,0004,0006,0008,000
10,00012,00014,00016,00018,00020,000
2018 CapacityAdditions
(ReferencePlanningScenario)
2009-2018 CCGTAdditions
2019-2028CapacityAdditions
(ReferencePlanningScenario)
2019-2028 CCGTAdditions
2028 CapacityAdditions (High
Growth PlanningScenario)
Attachment 1 Docket R-30021 Page 141 of 150
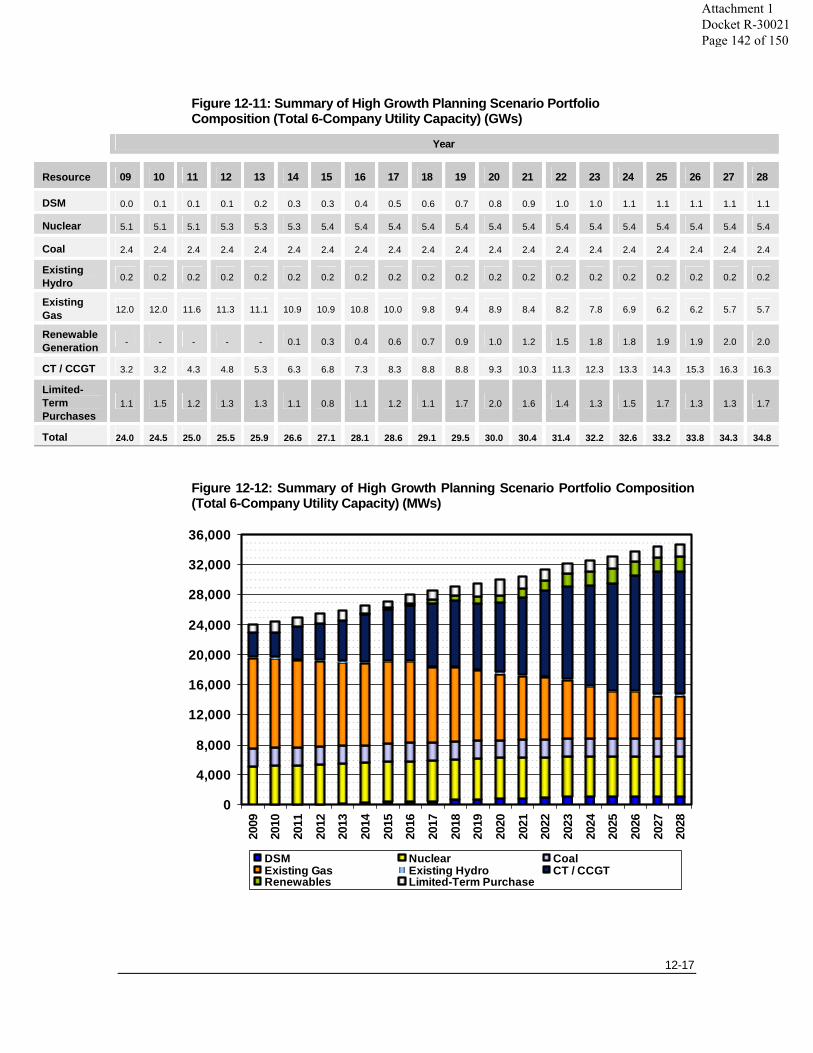
12-17
Figure 12-11: Summary of High Growth Planning Scenario Portfolio Composition (Total 6-Company Utility Capacity) (GWs)
Year
Resource 09 10 11 12 13 14 15 16 17 18 19 20 21 22 23 24 25 26 27 28
DSM 0.0 0.1 0.1 0.1 0.2 0.3 0.3 0.4 0.5 0.6 0.7 0.8 0.9 1.0 1.0 1.1 1.1 1.1 1.1 1.1
Nuclear 5.1 5.1 5.1 5.3 5.3 5.3 5.4 5.4 5.4 5.4 5.4 5.4 5.4 5.4 5.4 5.4 5.4 5.4 5.4 5.4
Coal 2.4 2.4 2.4 2.4 2.4 2.4 2.4 2.4 2.4 2.4 2.4 2.4 2.4 2.4 2.4 2.4 2.4 2.4 2.4 2.4
Existing Hydro 0.2 0.2 0.2 0.2 0.2 0.2 0.2 0.2 0.2 0.2 0.2 0.2 0.2 0.2 0.2 0.2 0.2 0.2 0.2 0.2
Existing Gas 12.0 12.0 11.6 11.3 11.1 10.9 10.9 10.8 10.0 9.8 9.4 8.9 8.4 8.2 7.8 6.9 6.2 6.2 5.7 5.7
Renewable Generation - - - - - 0.1 0.3 0.4 0.6 0.7 0.9 1.0 1.2 1.5 1.8 1.8 1.9 1.9 2.0 2.0
CT / CCGT 3.2 3.2 4.3 4.8 5.3 6.3 6.8 7.3 8.3 8.8 8.8 9.3 10.3 11.3 12.3 13.3 14.3 15.3 16.3 16.3
Limited-Term Purchases
1.1 1.5 1.2 1.3 1.3 1.1 0.8 1.1 1.2 1.1 1.7 2.0 1.6 1.4 1.3 1.5 1.7 1.3 1.3 1.7
Total 24.0 24.5 25.0 25.5 25.9 26.6 27.1 28.1 28.6 29.1 29.5 30.0 30.4 31.4 32.2 32.6 33.2 33.8 34.3 34.8
Figure 12-12: Summary of High Growth Planning Scenario Portfolio Composition (Total 6-Company Utility Capacity) (MWs)
0
4,000
8,000
12,000
16,000
20,000
24,000
28,000
32,000
36,000
2009
2010
2011
2012
2013
2014
2015
2016
2017
2018
2019
2020
2021
2022
2023
2024
2025
2026
2027
2028
DSM Nuclear CoalExisting Gas Existing Hydro CT / CCGTRenewables Limited-Term Purchase
Attachment 1 Docket R-30021 Page 142 of 150
12-18
Low Growth Planning Scenario The Low Growth Planning Scenario describes how planned resource additions would be adjusted if actual load growth tends toward the lower end of the outcomes described in Chapter 3. The Low Growth Planning Scenario assumes that, as compared to the Reference Planning Scenario, fewer supply-side resources would be required over the planning horizon in order to meet higher loads. Detailed assumptions include the following:
• Load growth averages about 0.5% over the twenty year planning horizon.
• As a result, compared with the Reference Planning Scenario, 3,000 MWs less of incremental capacity is needed to meet reliability needs over the twenty year planning horizon.
• The Low Growth Planning Scenario does not rely on specific assumptions as to the drivers of lower load. Lower loads could result from a number of factors including, for example;
• Sustained weak economic growth within the region;
• Adoption of energy efficiency by end use customers; and
• Higher levels of DSM deployment than assumed in the Reference Planning Scenario.
• Lower reliability planning requirements results in less CCGT capacity added to the portfolio.
Attachment 1 Docket R-30021 Page 143 of 150
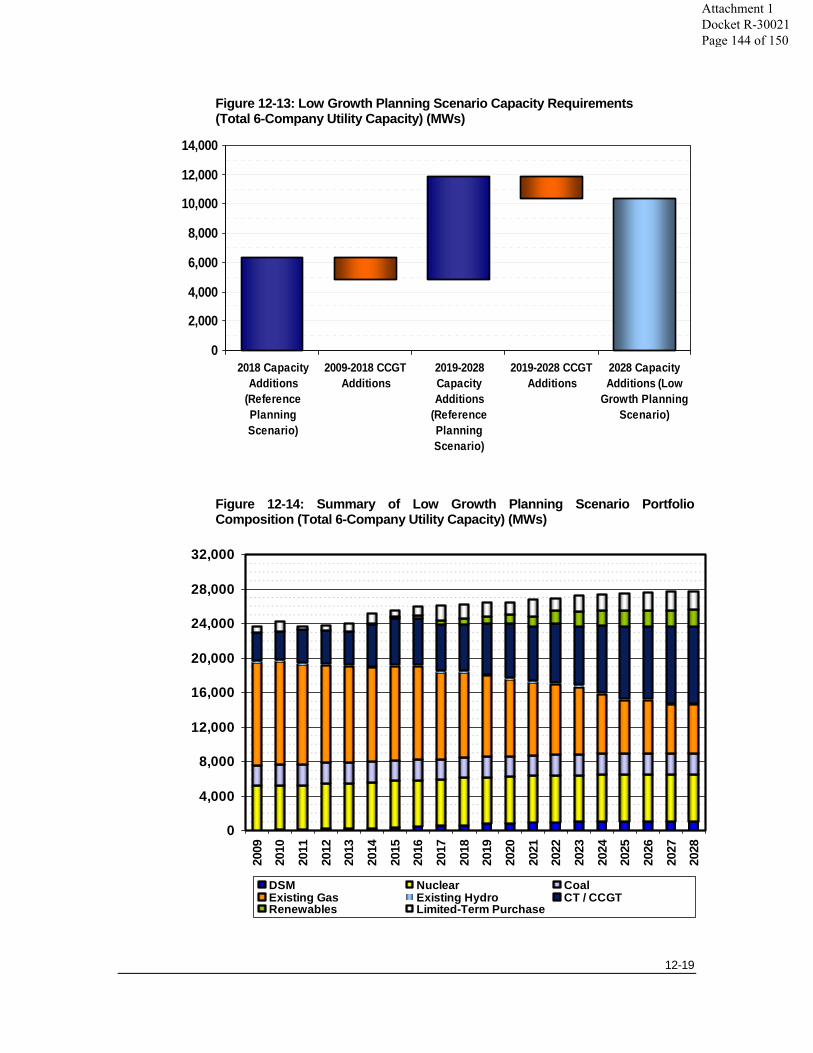
12-19
Figure 12-13: Low Growth Planning Scenario Capacity Requirements (Total 6-Company Utility Capacity) (MWs)
Figure 12-14: Summary of Low Growth Planning Scenario Portfolio Composition (Total 6-Company Utility Capacity) (MWs)
0
2,000
4,000
6,000
8,000
10,000
12,000
14,000
2018 CapacityAdditions
(ReferencePlanningScenario)
2009-2018 CCGTAdditions
2019-2028CapacityAdditions
(ReferencePlanningScenario)
2019-2028 CCGTAdditions
2028 CapacityAdditions (Low
Growth PlanningScenario)
0
4,000
8,000
12,000
16,000
20,000
24,000
28,000
32,000
2009
2010
2011
2012
2013
2014
2015
2016
2017
2018
2019
2020
2021
2022
2023
2024
2025
2026
2027
2028
DSM Nuclear CoalExisting Gas Existing Hydro CT / CCGTRenewables Limited-Term Purchase
Attachment 1 Docket R-30021 Page 144 of 150

12-20
Figure 12-15: Summary of Low Growth Planning Scenario Portfolio Composition (Total 6-Company Utility Capacity) (GWs)
Year
Resource 09 10 11 12 13 14 15 16 17 18 19 20 21 22 23 24 25 26 27 28
DSM 0.0 0.1 0.1 0.1 0.2 0.3 0.3 0.4 0.5 0.6 0.7 0.8 0.9 1.0 1.0 1.1 1.1 1.1 1.1 1.1
Nuclear 5.1 5.1 5.1 5.3 5.3 5.3 5.4 5.4 5.4 5.4 5.4 5.4 5.4 5.4 5.4 5.4 5.4 5.4 5.4 5.4
Coal 2.4 2.4 2.4 2.4 2.4 2.4 2.4 2.4 2.4 2.4 2.4 2.4 2.4 2.4 2.4 2.4 2.4 2.4 2.4 2.4
Existing Hydro 0.2 0.2 0.2 0.2 0.2 0.2 0.2 0.2 0.2 0.2 0.2 0.2 0.2 0.2 0.2 0.2 0.2 0.2 0.2 0.2
Existing Gas 12.0 12.0 11.6 11.3 11.1 10.9 10.9 10.8 10.0 9.8 9.4 8.9 8.4 8.2 7.8 6.9 6.2 6.2 5.7 5.7
Renewable Generation - - - - - 0.1 0.3 0.4 0.6 0.7 0.9 1.0 1.2 1.5 1.8 1.8 1.9 1.9 2.0 2.0
CT / CCGT 3.2 3.2 3.8 3.8 3.8 4.8 5.3 5.3 5.3 5.3 5.8 6.3 6.3 6.8 6.8 7.8 8.3 8.3 8.8 8.8
Limited-Term Purchases
0.7 1.3 0.4 0.6 0.9 1.2 0.6 1.0 1.7 1.7 1.6 1.4 1.9 1.4 1.8 1.8 2.0 2.0 2.1 2.1
Total 23.6 24.3 23.7 23.8 24.0 25.2 25.4 26.0 26.1 26.2 26.4 26.4 26.7 26.9 27.2 27.4 27.5 27.5 27.6 27.7
Figure 12-16: Range of Capacity Needs (Total 6-Company Utility Capacity) (MWs)
20,000
22,000
24,000
26,000
28,000
30,000
32,000
34,000
36,000
2009
2010
2011
2012
2013
2014
2015
2016
2017
2018
2019
2020
2021
2022
2023
2024
2025
2026
2027
2028
Spread (Low Growth Planning Scenario to High Growth Planning Scenario)
Reference Planning Scenario
20,000
22,000
24,000
26,000
28,000
30,000
32,000
34,000
36,000
2009
2010
2011
2012
2013
2014
2015
2016
2017
2018
2019
2020
2021
2022
2023
2024
2025
2026
2027
2028
Spread (Low Growth Planning Scenario to High Growth Planning Scenario)
Reference Planning Scenario Spread (Low Growth Planning Scenario to High Growth Planning Scenario)
Reference Planning Scenario
Attachment 1 Docket R-30021 Page 145 of 150
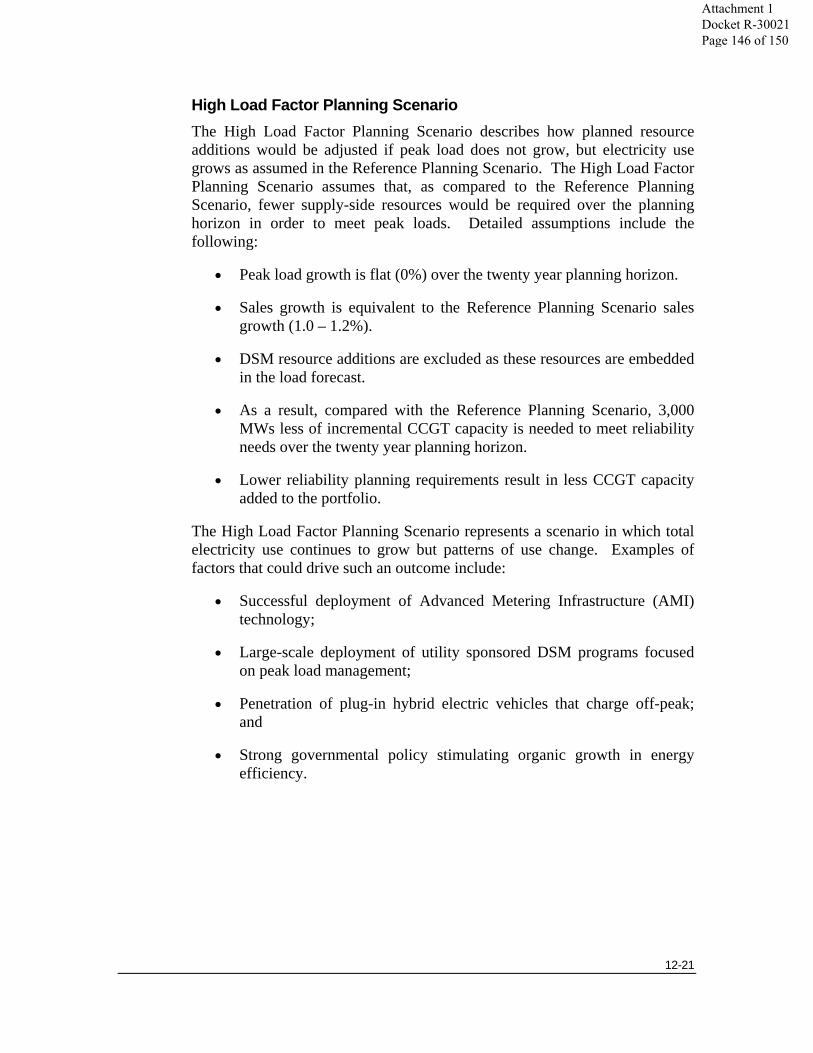
12-21
High Load Factor Planning Scenario The High Load Factor Planning Scenario describes how planned resource additions would be adjusted if peak load does not grow, but electricity use grows as assumed in the Reference Planning Scenario. The High Load Factor Planning Scenario assumes that, as compared to the Reference Planning Scenario, fewer supply-side resources would be required over the planning horizon in order to meet peak loads. Detailed assumptions include the following:
• Peak load growth is flat (0%) over the twenty year planning horizon.
• Sales growth is equivalent to the Reference Planning Scenario sales growth (1.0 – 1.2%).
• DSM resource additions are excluded as these resources are embedded in the load forecast.
• As a result, compared with the Reference Planning Scenario, 3,000 MWs less of incremental CCGT capacity is needed to meet reliability needs over the twenty year planning horizon.
• Lower reliability planning requirements result in less CCGT capacity added to the portfolio.
The High Load Factor Planning Scenario represents a scenario in which total electricity use continues to grow but patterns of use change. Examples of factors that could drive such an outcome include:
• Successful deployment of Advanced Metering Infrastructure (AMI) technology;
• Large-scale deployment of utility sponsored DSM programs focused on peak load management;
• Penetration of plug-in hybrid electric vehicles that charge off-peak; and
• Strong governmental policy stimulating organic growth in energy efficiency.
Attachment 1 Docket R-30021 Page 146 of 150
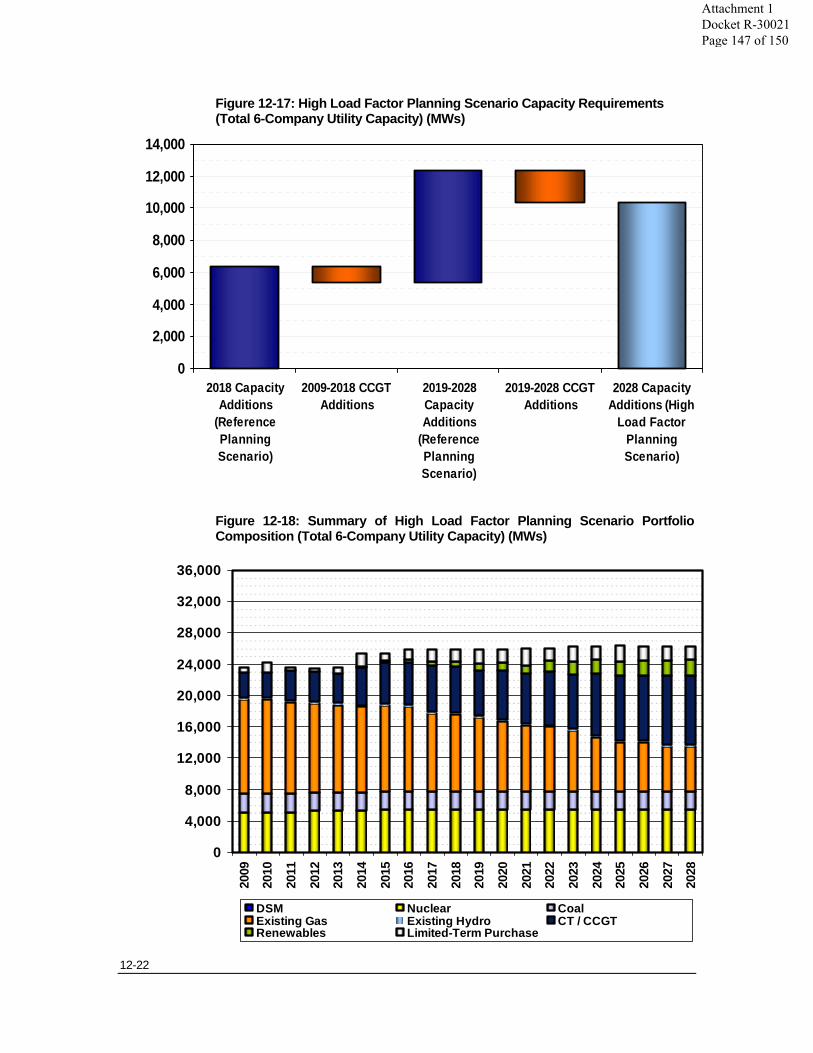
12-22
Figure 12-17: High Load Factor Planning Scenario Capacity Requirements (Total 6-Company Utility Capacity) (MWs)
Figure 12-18: Summary of High Load Factor Planning Scenario Portfolio Composition (Total 6-Company Utility Capacity) (MWs)
0
2,000
4,000
6,000
8,000
10,000
12,000
14,000
2018 CapacityAdditions
(ReferencePlanningScenario)
2009-2018 CCGTAdditions
2019-2028CapacityAdditions
(ReferencePlanningScenario)
2019-2028 CCGTAdditions
2028 CapacityAdditions (High
Load FactorPlanningScenario)
0
4,000
8,000
12,000
16,000
20,000
24,000
28,000
32,000
36,000
2009
2010
2011
2012
2013
2014
2015
2016
2017
2018
2019
2020
2021
2022
2023
2024
2025
2026
2027
2028
DSM Nuclear CoalExisting Gas Existing Hydro CT / CCGTRenewables Limited-Term Purchase
Attachment 1 Docket R-30021 Page 147 of 150
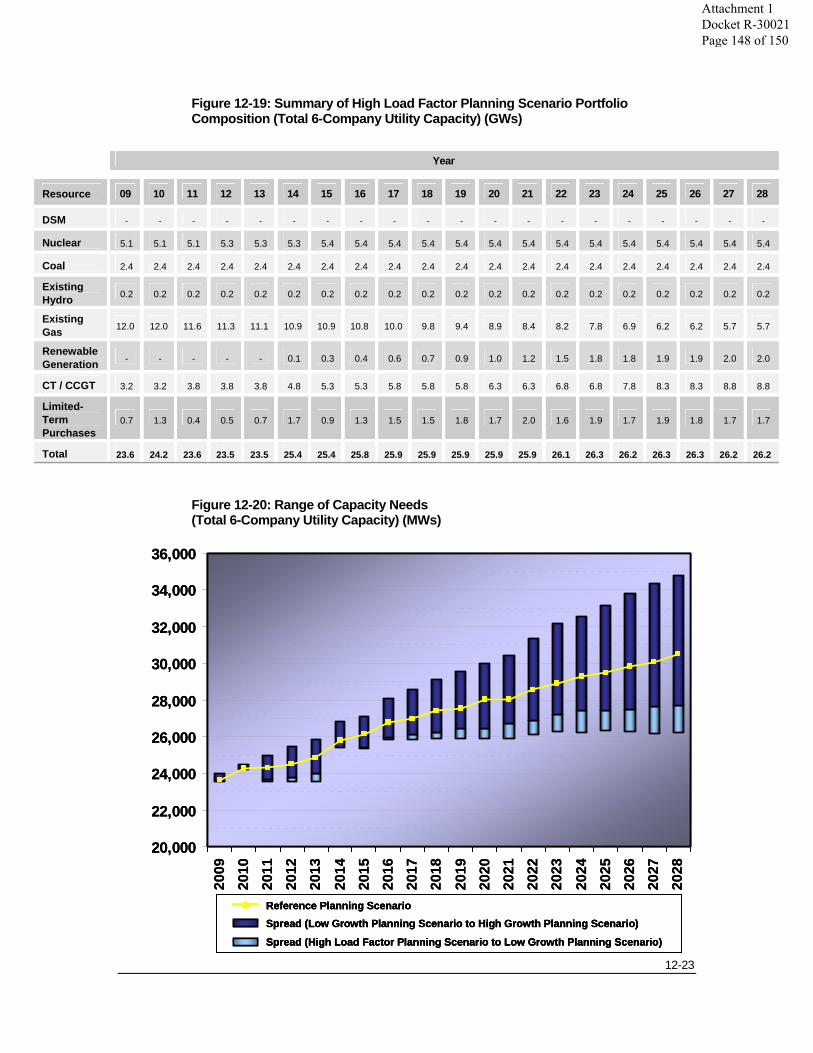
12-23
Figure 12-19: Summary of High Load Factor Planning Scenario Portfolio Composition (Total 6-Company Utility Capacity) (GWs)
Year
Resource 09 10 11 12 13 14 15 16 17 18 19 20 21 22 23 24 25 26 27 28
DSM - - - - - - - - - - - - - - - - - - - -
Nuclear 5.1 5.1 5.1 5.3 5.3 5.3 5.4 5.4 5.4 5.4 5.4 5.4 5.4 5.4 5.4 5.4 5.4 5.4 5.4 5.4
Coal 2.4 2.4 2.4 2.4 2.4 2.4 2.4 2.4 2.4 2.4 2.4 2.4 2.4 2.4 2.4 2.4 2.4 2.4 2.4 2.4
Existing Hydro 0.2 0.2 0.2 0.2 0.2 0.2 0.2 0.2 0.2 0.2 0.2 0.2 0.2 0.2 0.2 0.2 0.2 0.2 0.2 0.2
Existing Gas 12.0 12.0 11.6 11.3 11.1 10.9 10.9 10.8 10.0 9.8 9.4 8.9 8.4 8.2 7.8 6.9 6.2 6.2 5.7 5.7
Renewable Generation - - - - - 0.1 0.3 0.4 0.6 0.7 0.9 1.0 1.2 1.5 1.8 1.8 1.9 1.9 2.0 2.0
CT / CCGT 3.2 3.2 3.8 3.8 3.8 4.8 5.3 5.3 5.8 5.8 5.8 6.3 6.3 6.8 6.8 7.8 8.3 8.3 8.8 8.8
Limited-Term Purchases
0.7 1.3 0.4 0.5 0.7 1.7 0.9 1.3 1.5 1.5 1.8 1.7 2.0 1.6 1.9 1.7 1.9 1.8 1.7 1.7
Total 23.6 24.2 23.6 23.5 23.5 25.4 25.4 25.8 25.9 25.9 25.9 25.9 25.9 26.1 26.3 26.2 26.3 26.3 26.2 26.2
Figure 12-20: Range of Capacity Needs (Total 6-Company Utility Capacity) (MWs)
20,000
22,000
24,000
26,000
28,000
30,000
32,000
34,000
36,000
2009
2010
2011
2012
2013
2014
2015
2016
2017
2018
2019
2020
2021
2022
2023
2024
2025
2026
2027
2028
Spread (Low Growth Planning Scenario to High Growth Planning Scenario)Reference Planning Scenario
Spread (High Load Factor Planning Scenario to Low Growth Planning Scenario)
Spread (Low Growth Planning Scenario to High Growth Planning Scenario)Reference Planning Scenario
Spread (High Load Factor Planning Scenario to Low Growth Planning Scenario)
Attachment 1 Docket R-30021 Page 148 of 150

12-24
Other Key Portfolio Drivers
The Alternative Planning Scenarios described above provide guidance relating to the effect of uncertainties pertaining to new nuclear technology and load growth. The outcomes of these uncertainties are unknown at this time. But, the implications of these uncertainties on portfolio design and the range of foreseeable outcomes suggest both a potential benefit from developing alternative scenarios and a reasonable basis for doing so.
It is not possible, however, to predict all the factors that may affect portfolio design over the next twenty years. In the case of many other drivers, the uncertainties become so unknown or so speculative, that constructing specific alternative planning scenarios becomes practically impossible or, at least, of little planning value. In some cases the drivers themselves may not be identifiable at this time. The strategic flexibility inherent in the Reference Planning Scenario (described in an earlier section within this chapter) provides the key tool for responding to changing circumstances. However, two additional uncertainties, while not incorporated into alternative planning scenarios merit additional discussion, plant betterment opportunities and renewable generation alternatives.
Plant Betterment Initiative The Reference Planning Scenario assumes that almost 7.0 GWs of existing gas-fired generation is deactivated over the coming twenty years. These deactivation assumptions were developed for long-range planning purposes, as a basis for assessing long-term incremental capacity needs, and not as a schedule of retirements for existing units. While the assumptions about unit deactivations consider knowledge of unit condition and expectations about future operating role, these assumptions do not represent a decision to deactivate any particular unit. Specific unit portfolio decisions are made during the tactical business planning process (three-year planning horizon) based on economic and technical evaluation considering projected forward cost, anticipated operating roles, and cost of supply alternatives.
SPO is working with the Fossil Operating Group to assess potential opportunities presented by older gas-fired resources. In some cases, continued additional spending at these units may provide customers with economic benefits by deferring more expensive incremental capacity needs. This analysis is on-going and is anticipated to result in preliminary recommendations over the next twelve months. To the extent the analysis results in recommendations to maintain existing gas-fired resources in operation beyond currently assumed deactivation dates, the Reference Planning Scenario would be adjusted accordingly by deferring incremental CCGT additions or reducing limited-term purchases or both.
Attachment 1 Docket R-30021 Page 149 of 150

12-25
Renewable Generation The Reference Planning Scenario assumes that 2,000 MWs of renewable generation is added over the twenty-year planning horizon and provides assumptions about what type of technology might be deployed to achieve that level. These assumptions are based on current information about technology cost and availability, including projections of long-term cost for emerging technologies such as in-stream hydro. The actual amount and type of renewable generation that will be deployed over the twenty-year planning horizon will depend on actual prices and availability. The Entergy Operating Companies anticipate conducting a RFP for renewable resources within the next twelve months. The results of that effort will provide additional information about the potential for renewable generation. In the event that economic renewable generation cannot be identified in levels assumed in the Reference Planning Scenario, additional CCGT capacity would be anticipated to meet reliability requirements.
Attachment 1 Docket R-30021 Page 150 of 150

2009 Strategic Resource Plan Refresh
A Supplement to the 2009 Strategic Resource Plan for the Entergy Utility System and the Entergy Operating Companies updating and extending coverage through 2029.
Prepared by System Planning & Operations
September 17, 2010
Attachment 2 Docket R-30021 Page 1 of 40
2009 STRATEGIC RESOURCE PLAN REFRESH
TABLE OF CONTENTS
PURPOSE OF REFRESH SUPPLEMENT 1
Relationship to SRP Planning Process 1
Elements of the SRP Refresh Supplement 1
CONCLUSIONS AND FINDINGS 1
Summary of Conclusions 1
Summary of Findings 2
Re-Evaluation of 2009 Strategic Recommendations 3
SRP Action Plan 4
2010 REGULATORY ENVIRONMENT 4
Environmental Regulation Uncertainty 5
Support for Renewables 6
KEY DRIVERS OF SRP ANALYSIS 7
Load Forecast 7
Natural Gas 8
Wholesale Power Market 9
Carbon Impacts on the SRP 10
Generation Technology 10
Demand-side Resources 12
REFERENCE PLANNING SCENARIO 13
APPENDIX - SUPPORTING GRAPHICS AND DATA TABLES 15
Figure A-1 Historic Utility Operating Data 16
Figure A-2 Reference Case Total Sales & Firm Peak Load Forecast for the Six Company Utility 17
Figure A-3 Non-coincident Firm Peak Load (Reference Case Load Forecast 2010 – 2029) 18
Figure A-4 Electric Energy Total Sales (Reference Case Sales Forecast 2010 – 2029) 19
Figure A-5 Nominal Natural Gas Price Forecast 20
Attachment 2 Docket R-30021 Page 2 of 40

2009 STRATEGIC RESOURCE PLAN REFRESH Figure A-6 Real Natural Gas Price Forecast 20
Figure A-7 Into Entergy Implied Heat Rate 21
Figure A-8 Installed Capital Cost: New Build Options in the Entergy Retail Service Area (2010 – 2019 Timeframe) 22
Figure A-9 Levelized Cost of Current Baseload Alternatives 23
Figure A-10 Levelized Cost of Future Baseload Alternatives 24
Figure A-11 Renewables Vs. CCGT Levelized Nominal Cost Comparison 25
Figure A-13 Summary of Reference Planning Scenario Resource Additions (2020 – 2029) 27
Figure A-14 Summary of Reference Planning Scenario Portfolio Composition (Total 6-Company Utility Capacity) 28
Figure A-15 EAI Load and Capability (MW) 29
Figure A-16 EMI Load and Capability (MW) 30
Figure A-17 ELL Load and Capability (MW) 31
Figure A-18 ENOI Load and Capability 32
Figure A-19 EGSL Load and Capability 33
Figure A-20 ETI Load and Capability 34
Figure A-21 System Load and Capability 35
Figure A-22 Utility Load and Capability 36
Figure A-23 Potential Unit Deactivations 37
Attachment 2 Docket R-30021 Page 3 of 40

2009 STRATEGIC RESOURCE PLAN REFRESH
Supplement 1 to the 2009 SRP Page 1
Purpose of Refresh Supplement
Relationship to SRP Planning Process In 2009, Entergy Services, Inc.’s (“ESI”) System Planning and Operations (“SPO”) group prepared a comprehensive Strategic Resource Plan (“SRP”) for the Entergy System and Entergy Operating Companies. The SRP, which addressed resource needs over the 2009 – 2028 period, was approved by the Entergy Operating Committee. When the SPO presented the SRP to the Operating Companies and the Operating Committee, SPO indicated that it anticipated preparing a comprehensive revision to the SRP on a three-year cyclical basis. However, the SPO also informed the Operating Committee that it would monitor current developments and conditions and assess whether changes would warrant a comprehensive SRP update. Based on the review conducted in early 2010, the SPO determined that it would be reasonable to develop a supplement to the 2009 SRP in 2010 to refresh certain assumptions and extend coverage through 2029.
Elements of the SRP Refresh Supplement In evaluating the need for and results of a supplement to refresh the key data inputs into the SRP, the SPO undertook the following steps:
1. Review key drivers of the SRP analysis;
2. Assess business environment (market and regulatory) changes since the 2009 SRP was prepared;
3. Assess implications of changes for current and future resource needs; and 4. Determine whether a more comprehensive SRP update is warranted.
Conclusions and Findings
Summary of Conclusions
1. A comprehensive update of the SRP is not required at this time.
2. The overall strategic recommendations set out in the 2009 SRP remain sound.
3. The overall long-term portfolio solution, which is unchanged from the conclusions reached in the 2009 SRP, requires a combination of:
Attachment 2 Docket R-30021 Page 4 of 40
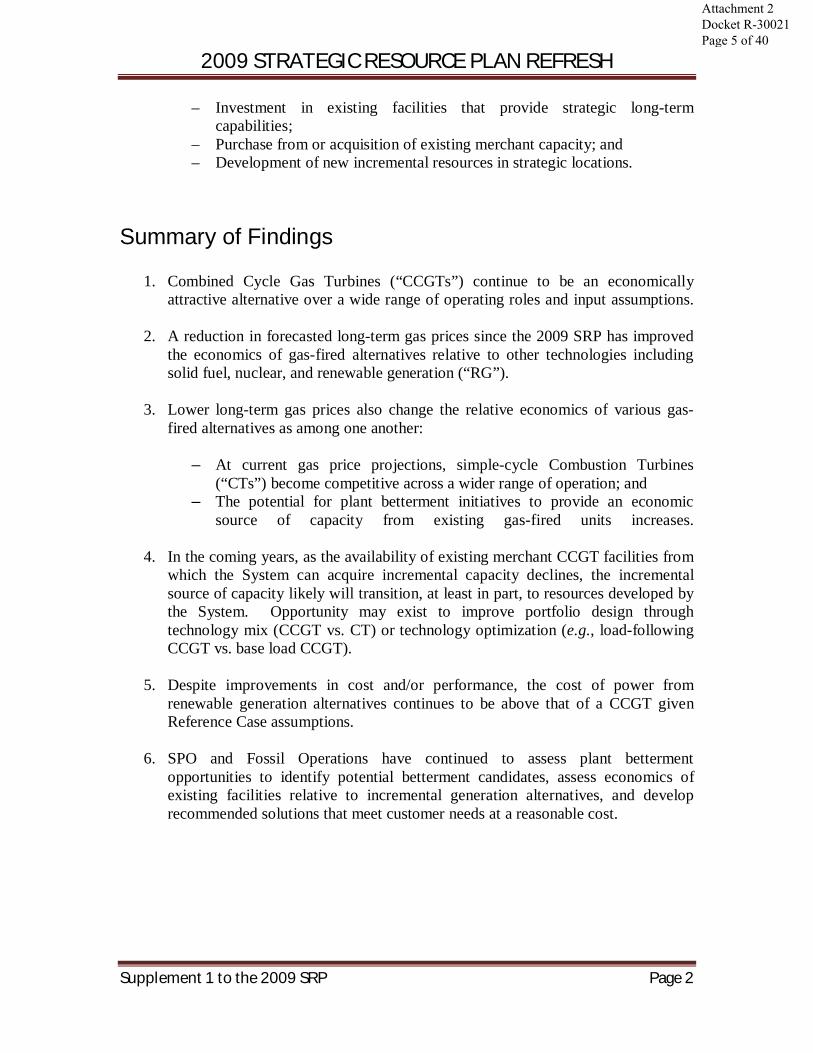
2009 STRATEGIC RESOURCE PLAN REFRESH
Supplement 1 to the 2009 SRP Page 2
– Investment in existing facilities that provide strategic long-term capabilities;
– Purchase from or acquisition of existing merchant capacity; and – Development of new incremental resources in strategic locations.
Summary of Findings
1. Combined Cycle Gas Turbines (“CCGTs”) continue to be an economically attractive alternative over a wide range of operating roles and input assumptions.
2. A reduction in forecasted long-term gas prices since the 2009 SRP has improved the economics of gas-fired alternatives relative to other technologies including solid fuel, nuclear, and renewable generation (“RG”).
3. Lower long-term gas prices also change the relative economics of various gas-
fired alternatives as among one another:
– At current gas price projections, simple-cycle Combustion Turbines (“CTs”) become competitive across a wider range of operation; and
– The potential for plant betterment initiatives to provide an economic source of capacity from existing gas-fired units increases.
4. In the coming years, as the availability of existing merchant CCGT facilities from which the System can acquire incremental capacity declines, the incremental source of capacity likely will transition, at least in part, to resources developed by the System. Opportunity may exist to improve portfolio design through technology mix (CCGT vs. CT) or technology optimization (e.g., load-following CCGT vs. base load CCGT).
5. Despite improvements in cost and/or performance, the cost of power from
renewable generation alternatives continues to be above that of a CCGT given Reference Case assumptions.
6. SPO and Fossil Operations have continued to assess plant betterment
opportunities to identify potential betterment candidates, assess economics of existing facilities relative to incremental generation alternatives, and develop recommended solutions that meet customer needs at a reasonable cost.
Attachment 2 Docket R-30021 Page 5 of 40
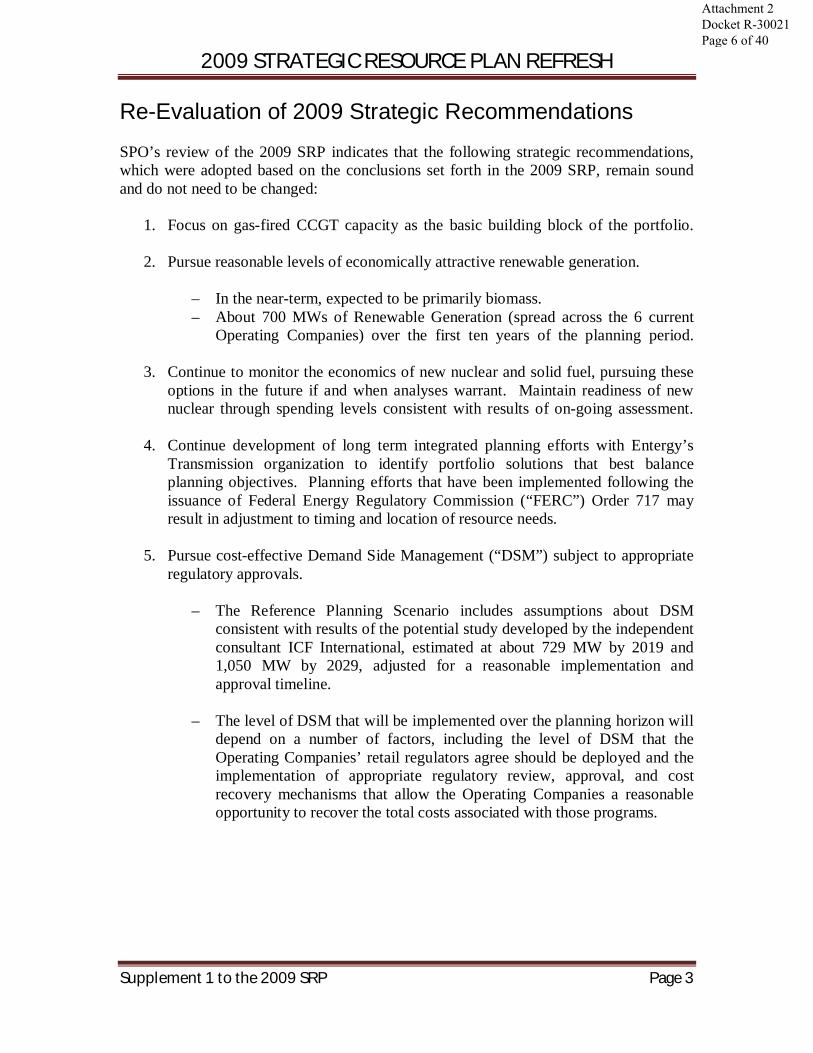
2009 STRATEGIC RESOURCE PLAN REFRESH
Supplement 1 to the 2009 SRP Page 3
Re-Evaluation of 2009 Strategic Recommendations SPO’s review of the 2009 SRP indicates that the following strategic recommendations, which were adopted based on the conclusions set forth in the 2009 SRP, remain sound and do not need to be changed:
1. Focus on gas-fired CCGT capacity as the basic building block of the portfolio.
2. Pursue reasonable levels of economically attractive renewable generation.
– In the near-term, expected to be primarily biomass. – About 700 MWs of Renewable Generation (spread across the 6 current
Operating Companies) over the first ten years of the planning period.
3. Continue to monitor the economics of new nuclear and solid fuel, pursuing these options in the future if and when analyses warrant. Maintain readiness of new nuclear through spending levels consistent with results of on-going assessment.
4. Continue development of long term integrated planning efforts with Entergy’s Transmission organization to identify portfolio solutions that best balance planning objectives. Planning efforts that have been implemented following the issuance of Federal Energy Regulatory Commission (“FERC”) Order 717 may result in adjustment to timing and location of resource needs.
5. Pursue cost-effective Demand Side Management (“DSM”) subject to appropriate
regulatory approvals.
– The Reference Planning Scenario includes assumptions about DSM consistent with results of the potential study developed by the independent consultant ICF International, estimated at about 729 MW by 2019 and 1,050 MW by 2029, adjusted for a reasonable implementation and approval timeline.
– The level of DSM that will be implemented over the planning horizon will
depend on a number of factors, including the level of DSM that the Operating Companies’ retail regulators agree should be deployed and the implementation of appropriate regulatory review, approval, and cost recovery mechanisms that allow the Operating Companies a reasonable opportunity to recover the total costs associated with those programs.
Attachment 2 Docket R-30021 Page 6 of 40
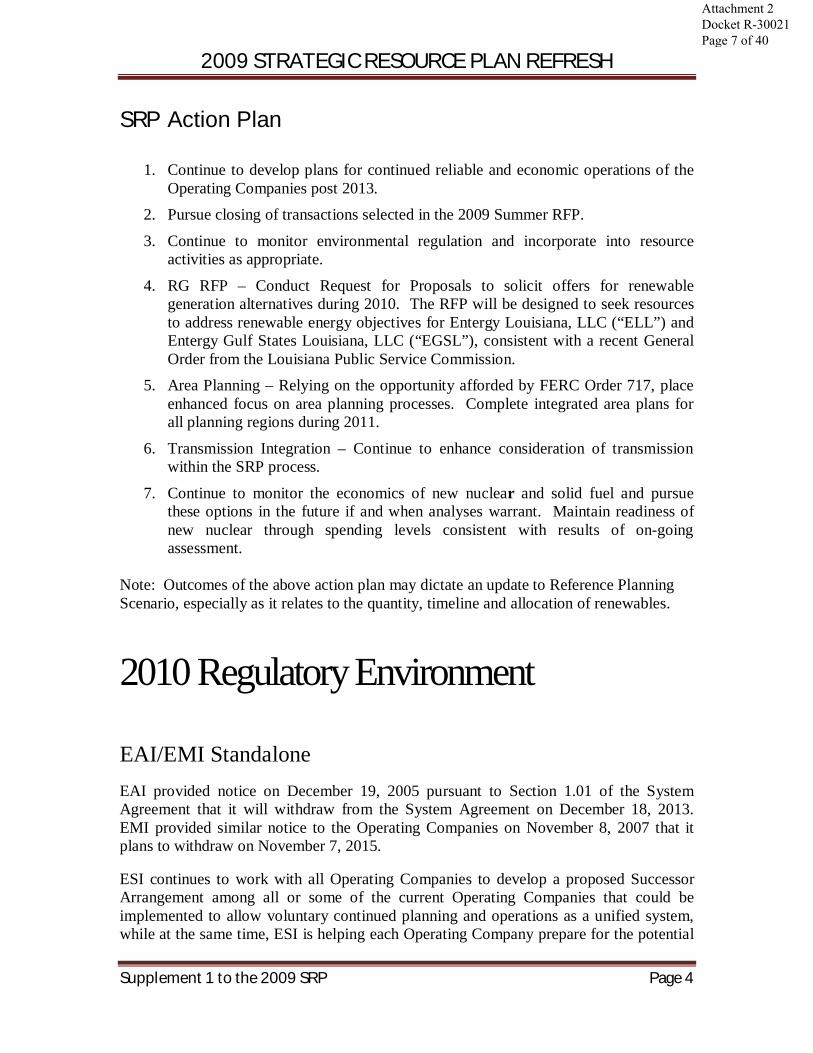
2009 STRATEGIC RESOURCE PLAN REFRESH
Supplement 1 to the 2009 SRP Page 4
SRP Action Plan
1. Continue to develop plans for continued reliable and economic operations of the Operating Companies post 2013.
2. Pursue closing of transactions selected in the 2009 Summer RFP.
3. Continue to monitor environmental regulation and incorporate into resource activities as appropriate.
4. RG RFP – Conduct Request for Proposals to solicit offers for renewable generation alternatives during 2010. The RFP will be designed to seek resources to address renewable energy objectives for Entergy Louisiana, LLC (“ELL”) and Entergy Gulf States Louisiana, LLC (“EGSL”), consistent with a recent General Order from the Louisiana Public Service Commission.
5. Area Planning – Relying on the opportunity afforded by FERC Order 717, place enhanced focus on area planning processes. Complete integrated area plans for all planning regions during 2011.
6. Transmission Integration – Continue to enhance consideration of transmission within the SRP process.
7. Continue to monitor the economics of new nuclear and solid fuel and pursue these options in the future if and when analyses warrant. Maintain readiness of new nuclear through spending levels consistent with results of on-going assessment.
Note: Outcomes of the above action plan may dictate an update to Reference Planning Scenario, especially as it relates to the quantity, timeline and allocation of renewables.
2010 Regulatory Environment
EAI/EMI Standalone EAI provided notice on December 19, 2005 pursuant to Section 1.01 of the System Agreement that it will withdraw from the System Agreement on December 18, 2013. EMI provided similar notice to the Operating Companies on November 8, 2007 that it plans to withdraw on November 7, 2015.
ESI continues to work with all Operating Companies to develop a proposed Successor Arrangement among all or some of the current Operating Companies that could be implemented to allow voluntary continued planning and operations as a unified system, while at the same time, ESI is helping each Operating Company prepare for the potential
Attachment 2 Docket R-30021 Page 7 of 40

2009 STRATEGIC RESOURCE PLAN REFRESH
Supplement 1 to the 2009 SRP Page 5
that a Successor Arrangement would not be in place by December 18, 2013 or November 7, 2015.
Successor to ICT Arrangements At the behest of Federal and retail regulators, the Transmission Business Unit and SPO are involved in a study that will examine the costs and benefits of alternative future transmission operations regimes, including Regional Transmission Organization (“RTO”) membership. This study is in progress, and no results of that study are available to consider within the context of a refreshed SRP. Any changes to the current Independent Coordinator of Transmission (“ICT”) structure could have implications for the quantity and mix of resource requirements over the planning period. It is clear, however, that the current resources needs are sufficient to justify moving forward with the 2009 RFP selection regardless of what future transmission arrangements may be implemented.
Environmental Regulation Uncertainty
CO2 Uncertainty
The issue of potential climate change associated with atmospheric greenhouse gases has continued to result in legislative and regulatory deliberations, but not resolution. While most policy experts continue to expect a mechanism to limit carbon emission for utility generation, the timing and scope of this mechanism remains unclear.
EPA Questions Arkansas CAVR State Implementation Plan The Clean Air Visibility Rule (“CAVR”) is expected to require the installation of scrubbers and related equipment at EAI’s White Bluff coal-fired generating station. EAI sought a public interest finding from the Arkansas Public Service Commission (“APSC”) for an Environmental Controls Project that would result in the installation of scrubbers at White Bluff. This project, and EAI’s application with the APSC, has been suspended to allow time for the Arkansas Department of Environmental Quality (“ADEQ”) to address concerns that the United States Environmental Protection Agency (“EPA”) has raised with respect to the ADEQ’s plan to meet CAVR requirements. It is expected that White Bluff will not be required to comply with the CAVR until five years after the Arkansas CAVR State Implementation Plan is approved. While the delay associated with the Environmental Controls Project preserves capital for now, it generates uncertainty regarding the long-term viability of the White Bluff facility. A smaller capital project to install environmental controls at EAI's Lake Catherine 4, which is subject the CAVR rules, also is on hold.
Attachment 2 Docket R-30021 Page 8 of 40
2009 STRATEGIC RESOURCE PLAN REFRESH
Supplement 1 to the 2009 SRP Page 6
Other Environmental Regulation Uncertainty
A high level of uncertainty characterizes the current air regulatory context, with electric generators facing a wide range of new future requirements from EPA, Congress or both. New regulations for SO2 and NOx, have been proposed by EPA. New regulations on hazardous air pollutants (“HAP”s) including Mercury are expected. In addition, new regulations on water intake and waste management could drive significant expenditures at both coal and natural gas fired power plants, however, the largest burden is expected at coal fired facilities. While economics would likely drive most of facilities to comply rather than shut-down, that is before layering a CO2 cost compliance burden. The SRP Supplement Reference Planning Scenario does not contemplate any shut-down of operating company resources due to future environmental regulation; however, additional capital expenditures for environmental compliance are likely.
Support for Renewables Federal Renewable Energy Standard It is unclear if Congress will pass a Renewable Energy Standard (“RES”) (which may also be referred to as a Renewable Portfolio Standard (“RPS”)). Either term usually refers to a requirement that a specific percentage of annual energy used to meet ultimate customer load comes from a qualifying resource. The definition of what qualifies as renewable depends on the specific legislation. In some cases, demand side resources and nuclear additions or uprates may count toward meeting the RES. Although many states across the nation have state-level RES/PRS programs, Texas is the only state in which the Operating Companies do business currently with such a requirement, which means that at present only ETI is subject to one of these programs. Jurisdictional Actions
In General Order R-28271, dated July 20, 2010, the Louisiana Public Service Commission (“LPSC”) approved a pilot renewable resource program designed to provide the LPSC with more specific information regarding the availability and cost of renewable resources in Louisiana. The pilot program directs that LPSC-jurisdictional utilities (including EGSL and ELL) do the following:
1. Issue an, RFP seeking a prescribed level of renewable resources ( 240 MW between EGSL and ELL subject to finalization), with the LPSC retaining the right to deny certification of a contract for the purchase of power from a particular resource selected through the RFP;
2. Develop and issue a standard offer tariff to support up to 30 MW of small (less than 5 MW per project), developmental projects or, in the alternative, build three self-supply projects < 300 KW each in Louisiana.
Attachment 2 Docket R-30021 Page 9 of 40
2009 STRATEGIC RESOURCE PLAN REFRESH
Supplement 1 to the 2009 SRP Page 7
In both instances, the LPSC has directed that the pilot programs include only renewable resources located within the State of Louisiana and that are defined as eligible under a to be issued LPSC General Order adopting the details of the renewable pilot.
ESI plans to issue an RFP later in 2010 on behalf of EGSL and ELL seeking up to 240 MW of renewable resources. ETI has determined it is more economic to purchase Renewable Energy Credits (“RECs”), and EAI, EMI and Entergy New Orleans, Inc. (“ENOI”) have decided not to participate.
As will be discussed in more detail later in this supplement, without subsidies or RECs, renewable generation continues to have a cost premium compared to traditional resource alternatives, however, there are still compelling arguments for the System and the Operating Companies to pursue a limited amount of renewable resources at this time.
Key Drivers of SRP Analysis Load Forecast Recovery and Growth In 2009, the Entergy Electric System peaked at 21,009 MW, a 1.1% decrease from the previous year, and total electric energy retail sales were 99,148 GWh, a 1.5% decrease from the previous year. These results are not weather normalized. Depressed retail sales and peaks primarily reflect the economic downturn. See Figure A-1 in the Appendix for historic utility operating data. The updated Reference Case load forecast for the 2009 SRP Refresh Supplement projects a gradual recovery from the economic recession, followed by moderate growth in residential and commercial load. The industrial customer class, which has been more negatively affected by the economic recession, is expected to experience a slower rate of recovery. The economic recovery is reflected in an electric energy sales forecast slightly below the 2009 SRP forecast through 2018 and slightly above thereafter. Hot weather in June 2009 provided an opportunity to calibrate the load forecast model’s calculated peaks against actual peaks. The current load forecast model calculated a 2009 peak of 20,942 MW with an average System temperature of 98 F, which is a 0.3% variance from the actual peak, which occurred when the average System temperature was 98 F. With this calibration, the updated Reference Case forecasted peaks are above the 2009 SRP forecast in all years. See Appendix Figure A-2 – Reference Case Total Sales & Firm Peak Load Forecast For the Six Company Utility.
Attachment 2 Docket R-30021 Page 10 of 40
2009 STRATEGIC RESOURCE PLAN REFRESH
Supplement 1 to the 2009 SRP Page 8
Projected 10-year compound annual growth rates for Reference Case peak load and electric energy sales are unchanged from the 2009 SRP Update.
Energy growth for the Entergy Operating Companies is expected to be 1.4% per year from 2010 to 2019 with about a 66% load factor. Electric sales growth over a 20-year period remains about 1.0 to 1.2% per year.
The 10-year compound annual growth rate for peak load is expected to be 1.2%.
The rate over the entire 20-year planning horizon has increased 0.1%. Projected non-coincident firm peak loads by Operating Company, the coincident firm peaks for the Entergy System and the combination of the six Operating Companies are presented in the Appendix Figure A-3. Projected electric energy sales by Operating Company, for the Electric System, and for the combination of the six Operating Companies are found in Appendix Figure A-4. A graph visualizing the data of Appendix Figures A-3 and A-4 can be found in Appendix Figure A-2. The updated Reference Case load forecast for the 2009 SRP Supplement increases the generation resources needed to meet the peak load forecast by about 3%. This equates to an additional 600 MW after 10 years and an additional 800 MW after 20 years. While significant, this change is well bounded by the sensitivity cases outlined in the 2009 SRP Update to consider load uncertainties on long-term resource needs. Natural Gas Events Validate the Plan In 2009, as measured by Platts Henry Hub day-ahead midpoint prices, natural gas prices fell from an average cash price of $5.25/MMBtu in January to a low of $2.90/MMBtu average during September. For the year, gas prices averaged $3.92/MMBtu, considerably below the 2009 SRP forecast of $6.04. While the price volatility was notable, 2009 was most remarkable as a year with strong domestic production in spite of falling gas prices and recession-weakened demand. Gas displacement of coal-fired generation provided some demand support, but the natural gas market was generally over supplied. The lowered natural gas price forecast for the 2009 SRP Refresh Supplement reflects increased confidence in domestic non-conventional resources and the viability of technology innovations (horizontal drilling and fracking) to bring large volumes of low cost gas to market. Correspondingly, in the calculation of the expected case, the weight given to the Reference Case was increased from 60% to 65% and the weight for the Low Case was lowered from 30% to 25%. Appendix Figures A-5 and A-6 summarize the natural gas forecast in nominal and real dollars.
Attachment 2 Docket R-30021 Page 11 of 40
2009 STRATEGIC RESOURCE PLAN REFRESH
Supplement 1 to the 2009 SRP Page 9
Many of the Entergy Operating Companies depend heavily on natural gas as a fuel for owned generation and wholesale purchases. The lowered natural gas price forecast for the 2009 SRP Supplement
1. Reduces overall supply cost; 2. Improves the relative economics of gas-fired resource alternatives;
3. Enhances the selection of the CCGT as the basic portfolio building block;
4. Improves the relative economics of existing gas resources to new resources; and
5. Improves the relative performance of new CTs versus new CCGTs.
Wholesale Power Market Power Prices Down from 2009 SRP The methodology for developing the regional power price and heat rate forecast has remained the same, but changes to the underlying fundamentals have resulted in a significant drop in both actual and forecasted power prices. In 2009, gas prices at the Henry Hub dropped from their 2008 highs and “Into Entergy Region” power prices, being heavily tied to gas price, experienced a similar price decrease. Figure A-7 in the Appendix contains the historical average annual heat rate for 2009 and forecasted heat rate for the years 2010-2019. Regional power demand also dropped in 2009 as a result of the economic recession, temporarily raising the Entergy region’s reserve margin and lowering spot power prices. Recessionary impacts are generally temporary. In fact, 2010 year-over-year improvements in industrial demand are already apparent. Therefore, the 2009 impacts do not negate the Entergy System’s need or desire for incremental long-term resources. Regionally, a small number of projects that were already under construction before the drop in power demand are starting to come online. CLECO’s 600 MW Rodemacher 3 circulating fluidized-bed unit fueled by petroleum coke began operation early in 2010, and the 665 MW Plum Point coal facility is expected online during summer 2010. However, these two resources are not available to meet the needs of the Entergy Operating Companies. The current regional capacity surplus coupled with high capital requirements for new resources is likely to keep power plant development low, but potential environmental legislation could result in the addition of renewable or clean energy projects in the region.
Attachment 2 Docket R-30021 Page 12 of 40
2009 STRATEGIC RESOURCE PLAN REFRESH
Supplement 1 to the 2009 SRP Page 10
Entergy region power prices are expected to rise as gas prices recover from their 2009 lows and as the capacity surplus gradually declines. Potential legislation on CO2 could further raise power prices, especially during the off-peak hours when coal resources are often setting the marginal price. Carbon Impacts on the SRP The 2009 SRP Refresh has not incorporated any changes related to the impact of pending CO2 legislation. If legislation is not passed this year, a start date after 2013 (the date assumed in the 2009 SRP) is likely. Nevertheless, future national carbon legislation is still likely and needed to send the proper price signal to all carbon emitters. The Entergy System is presently evaluating its long-term point-of-view on carbon cost in light of the status of regulation. However, a new point-of-view is not anticipated to be available until sometime in 2011. During this interim resource evaluations may consider CO2 assumptions that reflect best available information. Generation Technology 2010 Technology Assessment Update A reduction in forecasted long-term gas prices since the 2009 SRP has improved the economics of gas-fired alternatives relative to other technologies including solid fuel, nuclear, and renewable generation (“RG”). Since the 2009 SRP, the long-term point-of- view for Reference Case natural gas prices has declined ($1.69 per MMBtu levelized real 2009$s for 30 year period 2009-2038). Lower long-term gas prices also change the relative economics of various gas-fired alternatives as among one another: At current gas price projections, CTs become competitive across a wider range of operation; and the potential for plant betterment alternatives to provide an economic source of capacity increases. In the coming years, as the availability of existing merchant CCGT facilities declines, the source of incremental capacity will transition to resources developed by or at the behest of one or more of the Operating Companies. Opportunity may exist to improve portfolio design through technology mix (CCGT vs. CT) or technology optimization (e.g., load-following CCGT vs. base load CCGT). The SPO is evaluating the incremental capital costs that may be required to ensure that the enhanced portfolio can supply the amount of flexible capability needed for reliable operations. Capital cost for new CCGTs on a $/kW basis has increased about 20% or about $200/KW in 2009$s versus the POV in the 2009 SRP. This is partially driven by improved performance (slightly better heat rate of the newest class of turbines) and an expected
Attachment 2 Docket R-30021 Page 13 of 40
2009 STRATEGIC RESOURCE PLAN REFRESH
Supplement 1 to the 2009 SRP Page 11
higher cost for raw materials and other components in the Supply Chain. However, the capital cost increase is more than offset by the combination of better performance and lower expected natural gas prices when evaluating the life cycle revenue requirement of a typical CCGT. Renewables continue to require a premium absent subsidies or government mandates. Since the 2009 SRP, SPO has developed a greater understanding of most renewable technologies especially biomass, wind, solar PV and geothermal. Refreshed installed capital cost estimates on a $/KW basis for new generation options are shown in Appendix A-8. SPO also developed a more rigorous biomass fuel forecast and examined how wind resource performance might improve if the resource was located in the Southwest Power Pool (SPP) region versus the Energy System region. From last year to this year, the potential capacity factor for SPP wind has been raised from 35% to 39%, but its capacity value has been lowered from 30% to 5%. The SPP RTO gives wind a 5% capacity value. CTs may have a place in the portfolio. The potential advantages of CTs vis-à-vis CCGTs include lower installed capital cost, smaller footprint, quick-start-up, and shorter construction time. In addition, some CTs may be convertible to CCGTs through later additions of heat recovery steam generators, which provide an additional option value. Lower natural gas prices improve the CT value relative to CCGTs in low capacity load following roles. The SRP Refresh has not replaced any specific planned CCGT with a CT, but CTs will be considered on a case-by-case basis when new gas fired resources are needed in a peaking or load following situation. New Build Bus Bar Costs (COD 2010-2019) Figure A-9 in the Appendix provides the bus bar cost of various base load generation technologies currently available to the Entergy System. While some of the components have changed, the relative economics have not materially changed over the past year. New Build Bus Bar Costs (For COD 2020-2029) By 2020, it may be possible to utilize carbon capture and storage technology to reduce or eliminate the negative impacts of CO2 emissions from coal plants. Figure A-10 in the Appendix still indicates that CCGTs provide lower levelized cost. This is driven by the higher capital and O&M cost needed to operate coal plants with carbon capture. The transportation and storage cost of the captured CO2 is not considered. Nor is any economic benefit from the capture of CO2. The Green Spread Without regulatory or tax-driven subsidies, the bus bar cost of renewables remains above that of conventional generation. Lower natural gas prices make it even harder for
Attachment 2 Docket R-30021 Page 14 of 40
2009 STRATEGIC RESOURCE PLAN REFRESH
Supplement 1 to the 2009 SRP Page 12
renewables to compete. Despite their higher cost, renewables in moderate quantities are beneficial to the System’s portfolio because they improve fuel diversity and security, which lowers customer price risk. Furthermore, they have environmental and economic development benefits that indirectly benefit customers. See a bus bar cost comparison of renewables and CCGTs in Figure A-11 in the Appendix. Demand-side Resources
Progressing Toward the Goal From inception through 2009, utility-sponsored DSM programs have reduced the System peak by an estimated 80 MW. The Entergy Operating Companies are committed to pursuing cost-effective DSM; however, long term success requires consistent, sustained regulatory support and approval.
Entergy Texas, Inc. (“ETI”) has offered energy efficiency programs since 2002. ETI achieved stable program funding in its 2008 rate case which established a rider for recovery of program expenses. In addition, performance incentives are available if ETI surpasses its annual energy efficiency goal.
Entergy Arkansas, Inc. (“EAI”) is working towards transitioning from “Quick
Start” programs implemented in 2008 and to more comprehensive programs. EAI has stable program cost recovery through an Energy Efficiency Cost Recovery Rider, while mechanisms to recover the lost contribution to fixed costs and shared savings or incentives remains under consideration by the APSC.
Entergy New Orleans, Inc. (“ENOI”) collaborated with community stakeholders
to develop “Energy Smart” programs that begin in 2010. Annual funding was established in the settlement provisions of its 2008 rate case. ENOI received a matching Department of Energy stimulus grant to administer a Smart Grid pilot that will include a demand response program for low income customers. The pilot will begin in 2011.
Entergy Louisiana, LLC (“ELL”) and Entergy Gulf States Louisiana, L.L.C.
(“EGSL”) are participating in an LPSC docket to consider energy efficiency programs. In addition, a Smart Grid pilot program that includes demand response programs has been underway since 2008.
Entergy Mississippi, Inc. (“EMI”) is participating in an exploratory docket on
energy efficiency at the Mississippi Public Service Commission (“MPSC”). EMI is also piloting a state-wide weatherization program with recovery of program costs through a rider.
Attachment 2 Docket R-30021 Page 15 of 40
2009 STRATEGIC RESOURCE PLAN REFRESH
Supplement 1 to the 2009 SRP Page 13
No changes have been made to the level of DSM in the Reference Case Planning Scenario which includes 1,050 MW of peak reduction over the 20-year SRP planning horizon. The utility-sponsored DSM programs at ETI, EAI, and ENOI are generally on track to meet their proportional shares of the System-wide goal. The level of DSM that the System ultimately achieves depends on the level of DSM that the Operating Companies’ retail regulators agree should be deployed and the implementation of cost recovery mechanisms to allow a reasonable opportunity to recover the costs associated with those programs.
Reference Planning Scenario The major structure of the 2009 SRP Reference Planning Structure remains unchanged. Planning assumptions still maintain a CCGT centric portfolio transformation, with the same timetable and quantity of renewables coming into the portfolio. Material changes from the 2009 SRP Reference Planning Scenario include:
1. Updated Load Forecast from FEA094 to FEA102.
2. Updated seasonal unit ratings from Summer 2008 to Summer 2010 ratings.
3. Changed Wind resource capacity value from 30% to 5% of total unit capacity (see Technology). A lower capacity value increases the cost of backup generation. The higher cost was incorporated into the bus-bar cost of wind resources in Figures A-11 in the Appendix.
4. Updated unit deactivation schedule to match more current information including the deactivation of Sterlington 6 beginning in 2010 due to unit inoperability and accelerated Lynch 3 deactivation from 2014 to 2012.
5. Increased the unit rating of future CCGTs from 500 MW to 600 MW based on improved performance from GE Model 5 versus Model 3 used in the 2009 SRP.
6. Accelerated EMI’s 2016 CCGT resource to 2012.
7. Accelerated EAI’s 2013 CCGT resource to 2012.
8. Accelerated ETI’s 2014 CCGT resource to 2012. In addition to the Reference Planning Scenario, the 2009 SRP also considered other planning scenarios. At this time those alternative scenarios are still valid and if refreshed would not change materially, therefore they have not been refreshed.
Attachment 2 Docket R-30021 Page 16 of 40
2009 STRATEGIC RESOURCE PLAN REFRESH
Supplement 1 to the 2009 SRP Page 14
For specifics on the Reference Planning Scenario please see Figures A-12 through A-23 in the Appendix.
Figure A-12 Summary of Reference Planning Scenario Resource Additions (2010 – 2019)
Figure A-13 Summary of Reference Planning Scenario Resource Additions (2020 – 2029)
Figure A-14 Summary of Reference Planning Scenario Portfolio Composition (Total 6-Company Utility Capacity)
Figure A-15 EAI Load and Capability (MW) – Need to update due to Lynch 3 move to 2012
Figure A-16 EMI Load and Capability (MW) Figure A-17 ELL Load and Capability (MW) Figure A-18 ENOI Load and Capability Figure A-19 EGSL Load and Capability Figure A-20 ETI Load and Capability Figure A-21 System Load and Capability Figure A-22 Utility Load and Capability Figure A-23 Potential Unit Deactivations
Attachment 2 Docket R-30021 Page 17 of 40

2009 STRATEGIC RESOURCE PLAN REFRESH
Supplement 1 to the 2009 SRP Page 15
APPENDIX - SUPPORTING GRAPHICS AND DATA TABLES
Attachment 2 Docket R-30021 Page 18 of 40

2009 STRATEGIC RESOURCE PLAN REFRESH
Supplement 1 to the 2009 SRP Page 16
Figure A-1 Historic Utility Operating Data Non-Coincident Peak Load by Operating Company and System Coincident Peak (MW)
Entity / Reporting
Level
1999
2000
2001
2002
2003
2004
2005
2006
2007
2008
2009
EAI 5,145 5,533 5,207 5,099 5,223 5,072 5,273 5,238 5,297 5,080 4,701
EGSL 3,435 3,704 3,363 3,332 3,563 3,532 3,508 3,639 3,676 3,901 4,046
ELL 5,515 5,333 5,133 5,169 4,899 5,091 5,236 5,257 5,341 5,235 5,252
EMI 2,941 3,174 2,959 2,859 3,021 3,113 3,195 3,308 3,354 3,210 3,118
ENOI 1,255 1,276 1,161 1,162 1,188 1,210 1,254 788 904 882 998
ETI 3,205 3,338 3,143 3,185 3,248 3,512 3,434 3,571 3,711 3,176 3,246
Total System
20,664 22,052 20,315 20,419 20,162 21,174 21,391 20,887 22,001 21,241 21,009
Electric Energy Sales (Retail Sales) (GWh)
Entity / Reporting
Level
1999
2000
2001
2002
2003
2004
2005
2006
2007
2008
2009
EAI 18,664 19,333 19,377 19,600 19,650 19,735 21,005 21,331 21,371 21,038 19,926
EGSL 19,515 20,150 18,952 18,773 18,440 19,249 18,939 19,084 19,134 18,492 17,962
ELL 29,095 29,680 28,524 29,566 27,778 28,183 26,889 27,387 28,149 27,892 28,396
EMI 12,518 12,847 12,621 12,829 12,891 12,978 13,341 13,477 13,538 13,171 12,697
ENOI 5,895 5,880 5,597 5,875 5,844 6,055 4,712 3,759 4,299 4,483 4,721
ETI 14,833 15,325 14,885 14,987 15,366 16,026 14,979 15,383 15,521 15,533 15,446
Total System (1)
100,519 103,216 99,956 101,631 99,968 102,226 99,865
100,421
102,013 100,609 99,148
(1) Total System electric energy retail sales for 2005 and 2006 include ENOI which is generally disaggregated in public reports of utility operating data for these years.
Attachment 2 Docket R-30021 Page 19 of 40

2009 STRATEGIC RESOURCE PLAN REFRESH
Supplement 1 to the 2009 SRP Page 17
Figure A-2 Reference Case Total Sales & Firm Peak Load Forecast for the Six Company Utility Total Sales GWh; Firm Peaks MW
80,000
90,000
100,000
110,000
120,000
130,000
140,000
150,000
160,000
2010 2012 2014 2016 2018 2020 2022 2024 2026 2028
Elec
tric
Ener
gy S
ales
(MW
h)
10,000
15,000
20,000
25,000
30,000
35,000
40,000
Peak
Dem
and
(MW
)
Updated Reference Case - Sales Reference Case - Sales
Updated Reference Case - Firm Peak Reference Case - Firm Peak
Attachment 2 Docket R-30021 Page 20 of 40
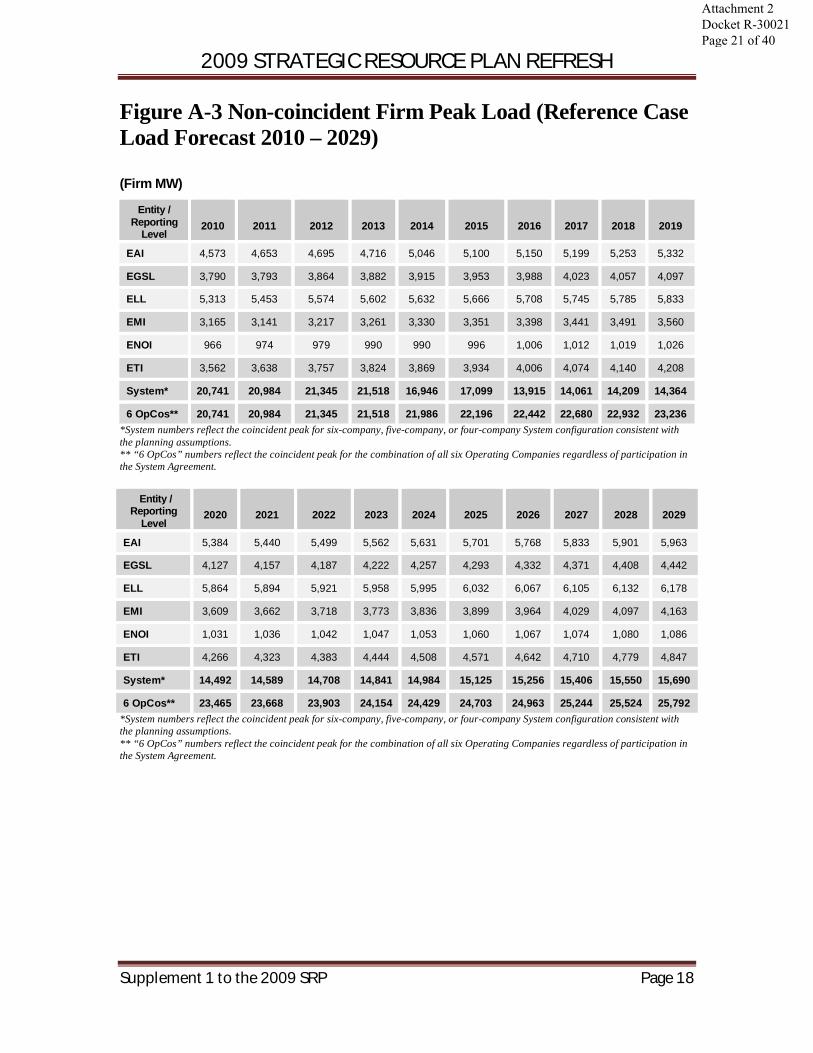
2009 STRATEGIC RESOURCE PLAN REFRESH
Supplement 1 to the 2009 SRP Page 18
Figure A-3 Non-coincident Firm Peak Load (Reference Case Load Forecast 2010 – 2029) (Firm MW)
Entity / Reporting
Level
2010
2011
2012
2013
2014
2015
2016
2017
2018
2019
EAI 4,573 4,653 4,695 4,716 5,046 5,100 5,150 5,199 5,253 5,332
EGSL 3,790 3,793 3,864 3,882 3,915 3,953 3,988 4,023 4,057 4,097
ELL 5,313 5,453 5,574 5,602 5,632 5,666 5,708 5,745 5,785 5,833
EMI 3,165 3,141 3,217 3,261 3,330 3,351 3,398 3,441 3,491 3,560
ENOI 966 974 979 990 990 996 1,006 1,012 1,019 1,026
ETI 3,562 3,638 3,757 3,824 3,869 3,934 4,006 4,074 4,140 4,208
System* 20,741 20,984 21,345 21,518 16,946 17,099 13,915 14,061 14,209 14,364
6 OpCos** 20,741 20,984 21,345 21,518 21,986 22,196 22,442 22,680 22,932 23,236 *System numbers reflect the coincident peak for six-company, five-company, or four-company System configuration consistent with the planning assumptions. ** “6 OpCos” numbers reflect the coincident peak for the combination of all six Operating Companies regardless of participation in the System Agreement.
Entity / Reporting
Level
2020
2021
2022
2023
2024
2025
2026
2027
2028
2029
EAI 5,384 5,440 5,499 5,562 5,631 5,701 5,768 5,833 5,901 5,963
EGSL 4,127 4,157 4,187 4,222 4,257 4,293 4,332 4,371 4,408 4,442
ELL 5,864 5,894 5,921 5,958 5,995 6,032 6,067 6,105 6,132 6,178
EMI 3,609 3,662 3,718 3,773 3,836 3,899 3,964 4,029 4,097 4,163
ENOI 1,031 1,036 1,042 1,047 1,053 1,060 1,067 1,074 1,080 1,086
ETI 4,266 4,323 4,383 4,444 4,508 4,571 4,642 4,710 4,779 4,847
System* 14,492 14,589 14,708 14,841 14,984 15,125 15,256 15,406 15,550 15,690
6 OpCos** 23,465 23,668 23,903 24,154 24,429 24,703 24,963 25,244 25,524 25,792 *System numbers reflect the coincident peak for six-company, five-company, or four-company System configuration consistent with the planning assumptions. ** “6 OpCos” numbers reflect the coincident peak for the combination of all six Operating Companies regardless of participation in the System Agreement.
Attachment 2 Docket R-30021 Page 21 of 40
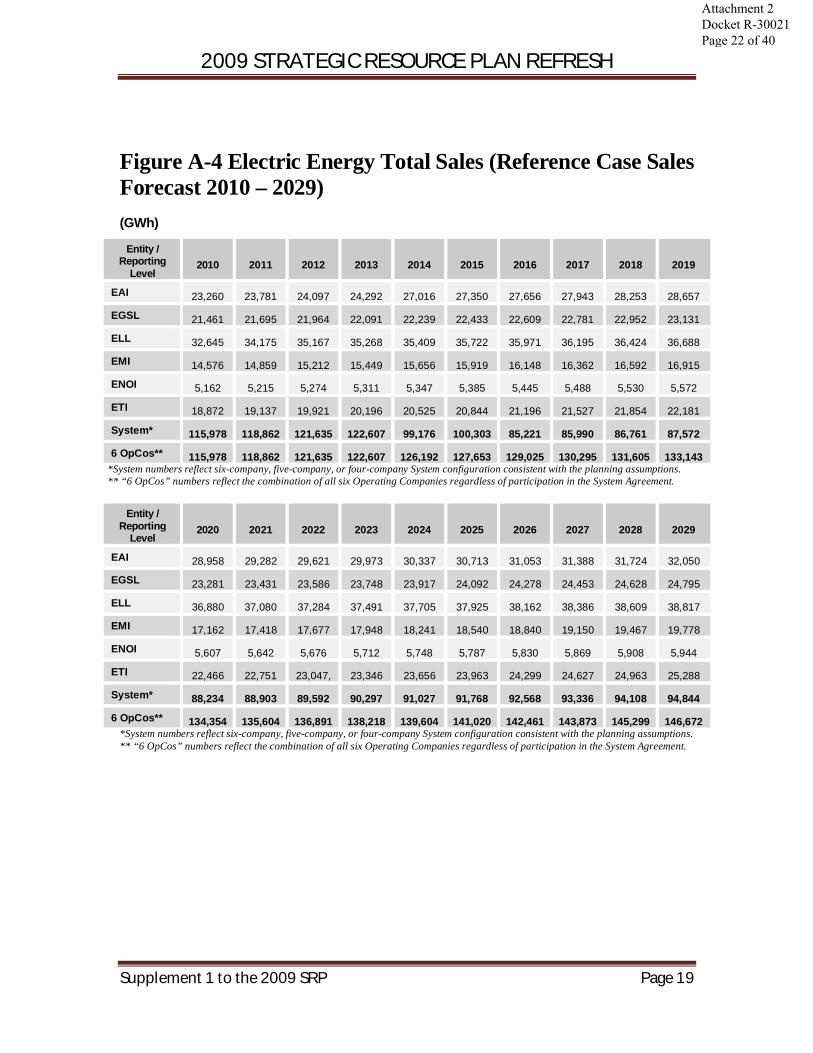
2009 STRATEGIC RESOURCE PLAN REFRESH
Supplement 1 to the 2009 SRP Page 19
Figure A-4 Electric Energy Total Sales (Reference Case Sales Forecast 2010 – 2029) (GWh)
Entity / Reporting
Level
2010
2011
2012
2013
2014
2015
2016
2017
2018
2019
EAI 23,260 23,781 24,097 24,292 27,016 27,350 27,656 27,943 28,253 28,657
EGSL 21,461 21,695 21,964 22,091 22,239 22,433 22,609 22,781 22,952 23,131
ELL 32,645 34,175 35,167 35,268 35,409 35,722 35,971 36,195 36,424 36,688
EMI 14,576 14,859 15,212 15,449 15,656 15,919 16,148 16,362 16,592 16,915
ENOI 5,162 5,215 5,274 5,311 5,347 5,385 5,445 5,488 5,530 5,572
ETI 18,872 19,137 19,921 20,196 20,525 20,844 21,196 21,527 21,854 22,181
System* 115,978 118,862 121,635 122,607 99,176 100,303 85,221 85,990 86,761 87,572
6 OpCos** 115,978 118,862 121,635 122,607 126,192 127,653 129,025 130,295 131,605 133,143 *System numbers reflect six-company, five-company, or four-company System configuration consistent with the planning assumptions. ** “6 OpCos” numbers reflect the combination of all six Operating Companies regardless of participation in the System Agreement.
Entity / Reporting
Level
2020
2021
2022
2023
2024
2025
2026
2027
2028
2029
EAI 28,958 29,282 29,621 29,973 30,337 30,713 31,053 31,388 31,724 32,050
EGSL 23,281 23,431 23,586 23,748 23,917 24,092 24,278 24,453 24,628 24,795
ELL 36,880 37,080 37,284 37,491 37,705 37,925 38,162 38,386 38,609 38,817
EMI 17,162 17,418 17,677 17,948 18,241 18,540 18,840 19,150 19,467 19,778
ENOI 5,607 5,642 5,676 5,712 5,748 5,787 5,830 5,869 5,908 5,944
ETI 22,466 22,751 23,047, 23,346 23,656 23,963 24,299 24,627 24,963 25,288
System* 88,234 88,903 89,592 90,297 91,027 91,768 92,568 93,336 94,108 94,844
6 OpCos** 134,354 135,604 136,891 138,218 139,604 141,020 142,461 143,873 145,299 146,672 *System numbers reflect six-company, five-company, or four-company System configuration consistent with the planning assumptions. ** “6 OpCos” numbers reflect the combination of all six Operating Companies regardless of participation in the System Agreement.
Attachment 2 Docket R-30021 Page 22 of 40
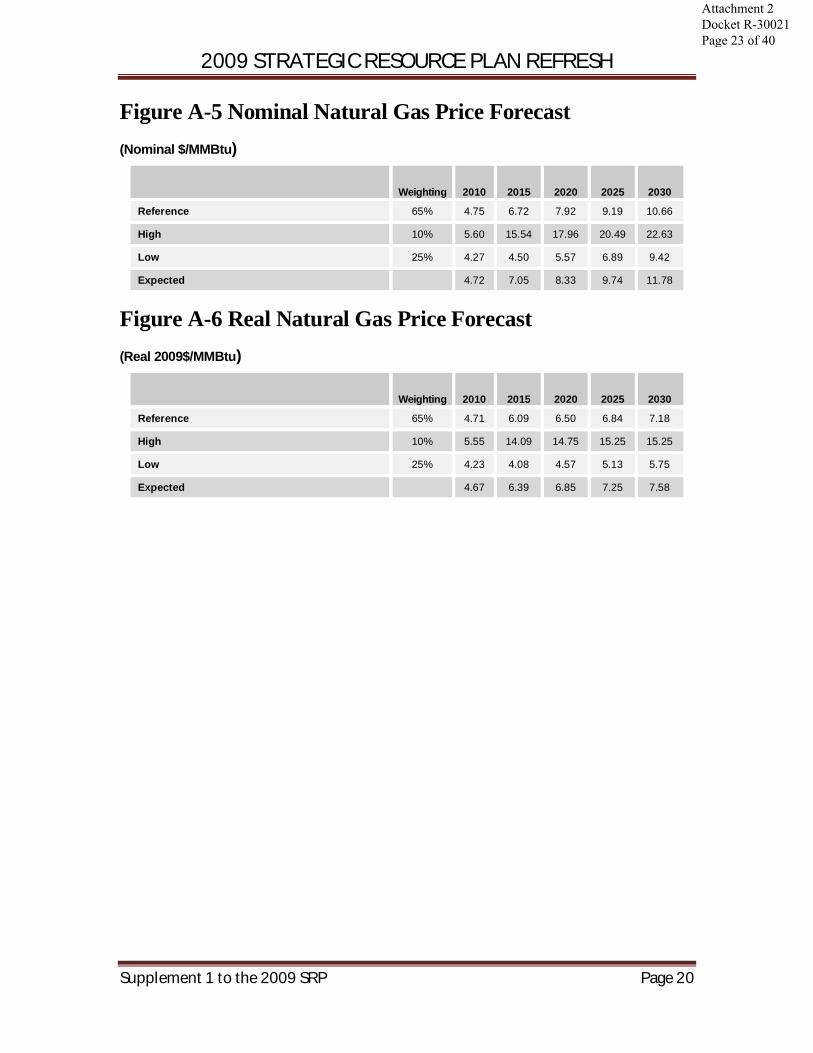
2009 STRATEGIC RESOURCE PLAN REFRESH
Supplement 1 to the 2009 SRP Page 20
Figure A-5 Nominal Natural Gas Price Forecast (Nominal $/MMBtu)
Weighting
2010
2015
2020
2025
2030
Reference 65% 4.75 6.72 7.92 9.19 10.66
High 10% 5.60 15.54 17.96 20.49 22.63
Low 25% 4.27 4.50 5.57 6.89 9.42
Expected 4.72 7.05 8.33 9.74 11.78
Figure A-6 Real Natural Gas Price Forecast (Real 2009$/MMBtu)
Weighting
2010
2015
2020
2025
2030
Reference 65% 4.71 6.09 6.50 6.84 7.18
High 10% 5.55 14.09 14.75 15.25 15.25
Low 25% 4.23 4.08 4.57 5.13 5.75
Expected 4.67 6.39 6.85 7.25 7.58
Attachment 2 Docket R-30021 Page 23 of 40
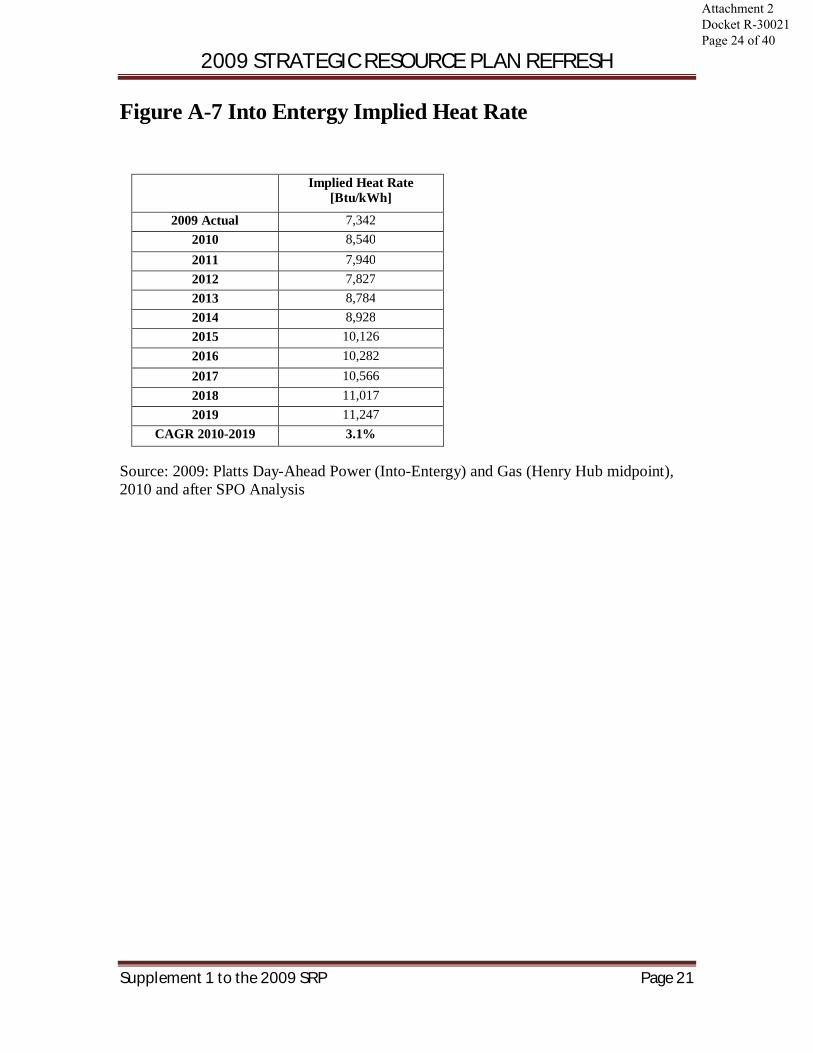
2009 STRATEGIC RESOURCE PLAN REFRESH
Supplement 1 to the 2009 SRP Page 21
Figure A-7 Into Entergy Implied Heat Rate
Source: 2009: Platts Day-Ahead Power (Into-Entergy) and Gas (Henry Hub midpoint), 2010 and after SPO Analysis
Implied Heat Rate [Btu/kWh]
2009 Actual 7,342 2010 8,540 2011 7,940 2012 7,827 2013 8,784 2014 8,928 2015 10,126 2016 10,282 2017 10,566 2018 11,017 2019 11,247
CAGR 2010-2019 3.1%
Attachment 2 Docket R-30021 Page 24 of 40

2009 STRATEGIC RESOURCE PLAN REFRESH
Supplement 1 to the 2009 SRP Page 22
Figure A-8 Installed Capital Cost: New Build Options in the Entergy Retail Service Area (2010 – 2019 Timeframe)
(Installed Cost 2009$ per kW)
Technology
Fuel
20010 - 2019
Combined Cycle Gas Turbine (CCGT) Natural Gas $1,200
CCGT with Carbon Capture & Sequestration (CCS) Natural Gas NA
Circulating Fluidized Bed (CFB) Coal $3,300
CFB with CCS Coal NA
Combustion Turbine (CT) Natural Gas $900
Integrated Gasification Combined Cycle (IGCC) Coal $3,600
IGCC with CCS Coal NA
New Nuclear Uranium NA
Pulverized Coal Coal $3,000
Pulverized Coal with CCS Coal NA
Biomass Agri / Forestry $3,500
In-stream Hydro NA NA
Solar Photovoltaic NA $5,000
Wind On-shore NA $2,000
Wind On-shore Off-System* NA $2,500
Wind Offshore NA NA
*SPP Resource, includes $500/KW transmission investment
Attachment 2 Docket R-30021 Page 25 of 40
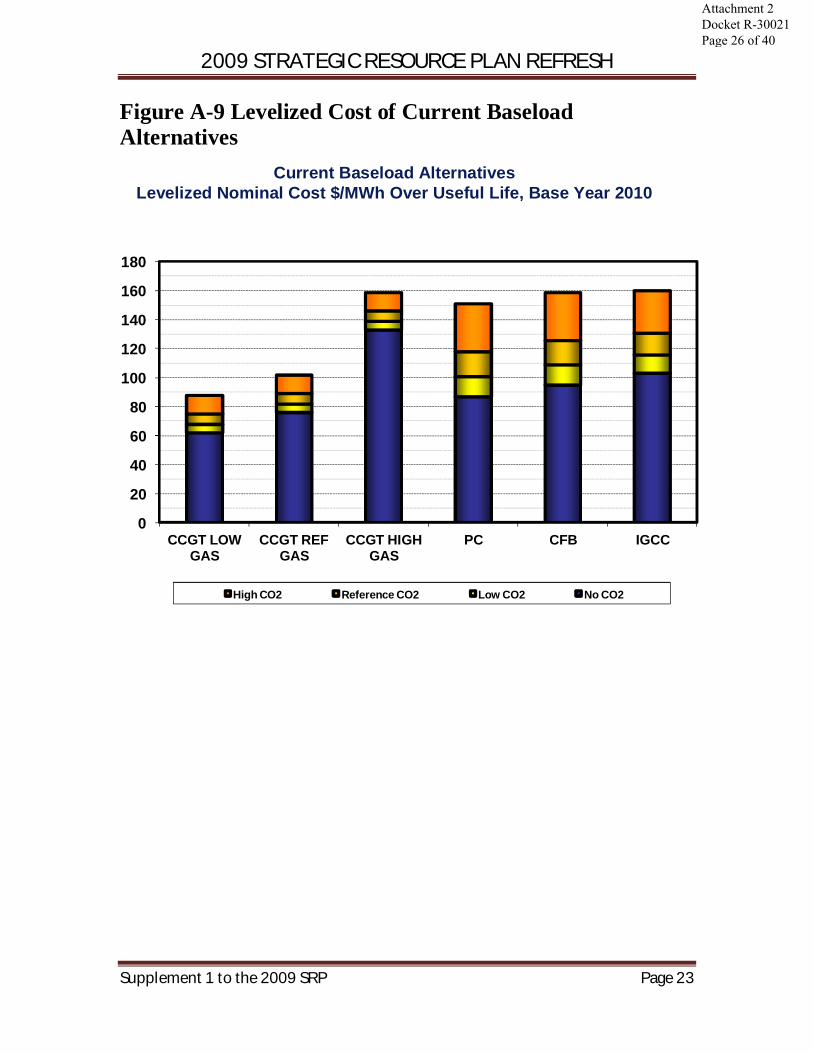
2009 STRATEGIC RESOURCE PLAN REFRESH
Supplement 1 to the 2009 SRP Page 23
Figure A-9 Levelized Cost of Current Baseload Alternatives
Current Baseload AlternativesLevelized Nominal Cost $/MWh Over Useful Life, Base Year 2010
0
20
40
60
80
100
120
140
160
180
CCGT LOW GAS
CCGT REF GAS
CCGT HIGH GAS
PC CFB IGCC
High CO2 Reference CO2 Low CO2 No CO2
Attachment 2 Docket R-30021 Page 26 of 40
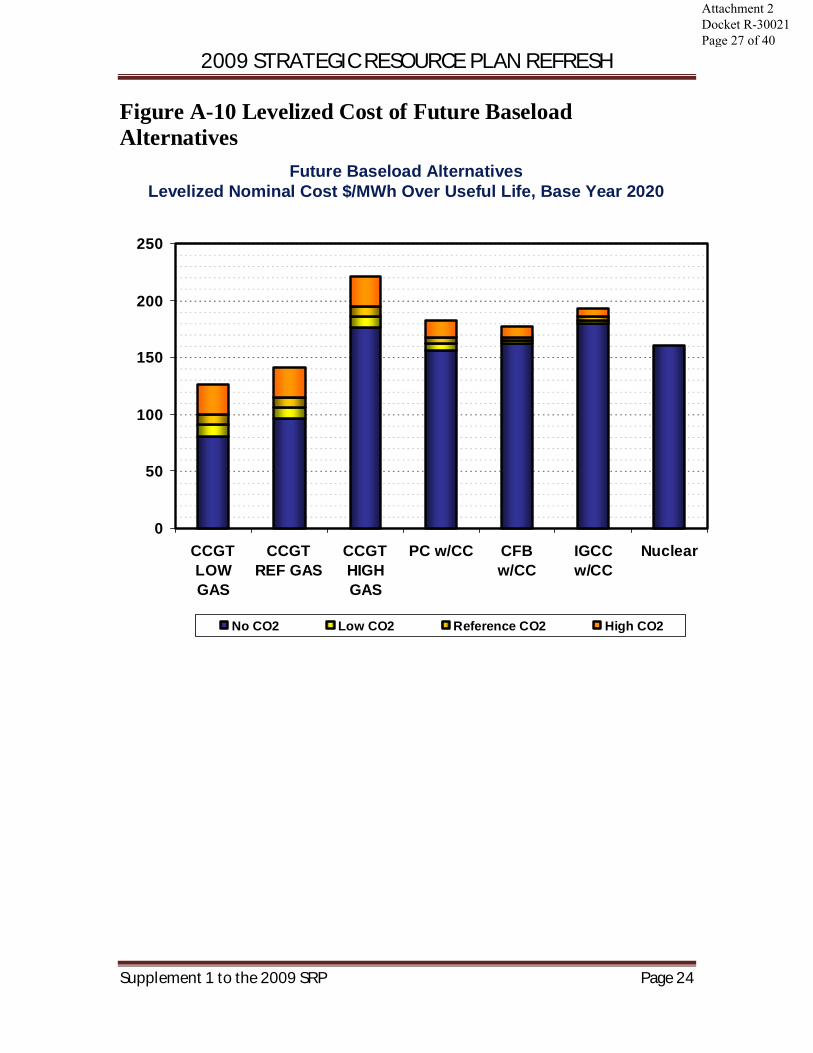
2009 STRATEGIC RESOURCE PLAN REFRESH
Supplement 1 to the 2009 SRP Page 24
Figure A-10 Levelized Cost of Future Baseload Alternatives
Future Baseload AlternativesLevelized Nominal Cost $/MWh Over Useful Life, Base Year 2020
0
50
100
150
200
250
CCGTLOWGAS
CCGTREF GAS
CCGTHIGHGAS
PC w/CC CFBw/CC
IGCCw/CC
Nuclear
No CO2 Low CO2 Reference CO2 High CO2
Attachment 2 Docket R-30021 Page 27 of 40

2009 STRATEGIC RESOURCE PLAN REFRESH
Supplement 1 to the 2009 SRP Page 25
Figure A-11 Renewables Vs. CCGT Levelized Nominal Cost Comparison Levelized Nominal Cost $/MWh Over Useful Life, Base Year 2010
CCGT with Ref. Gas, Strawman CO2; 65%
CFCCGT with Low Gas;
no CO2; 80% CF
Assumptions• Off-System Wind assumes $500/kW generic off-system transmission adder. • Resources are assumed to be located in or close to the Entergy utility service area. Off-System wind is assumed to be located in SPP. • Costs do not include incentives or REC value.• Wind and Solar costs include flexible cost and backup capacity cost.
Attachment 2 Docket R-30021 Page 28 of 40
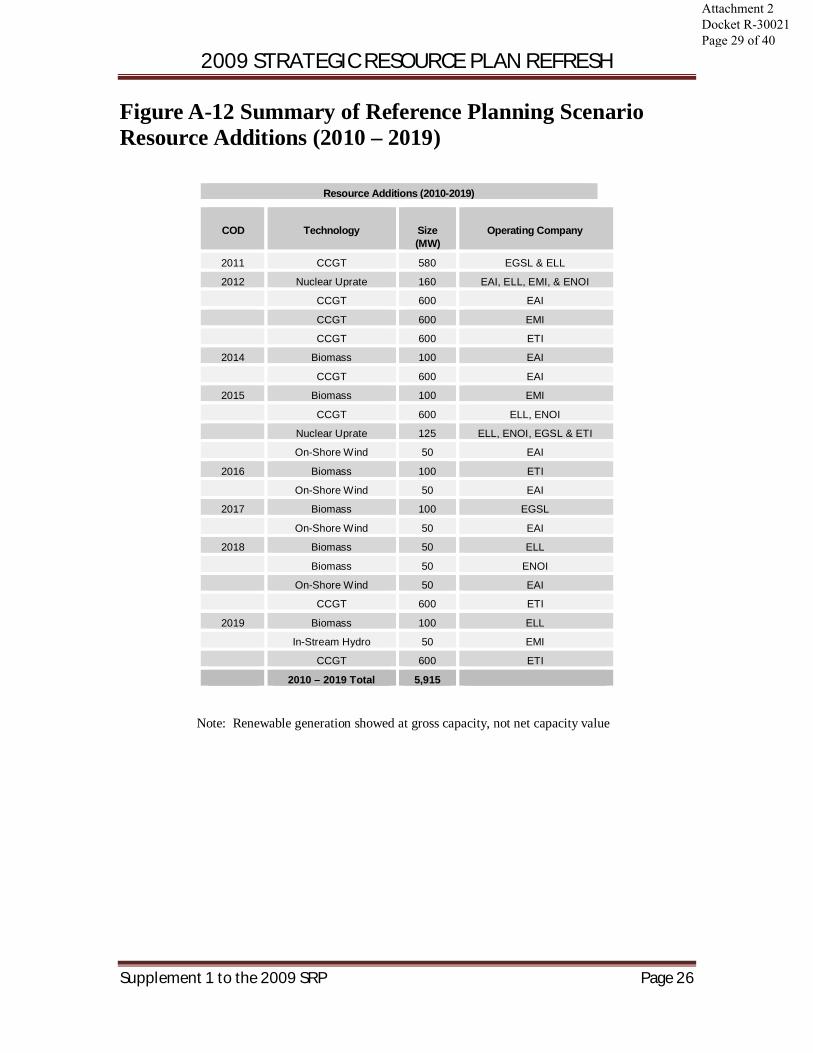
2009 STRATEGIC RESOURCE PLAN REFRESH
Supplement 1 to the 2009 SRP Page 26
Figure A-12 Summary of Reference Planning Scenario Resource Additions (2010 – 2019)
Resource Additions (2010-2019)
COD
Technology
Size (MW)
Operating Company
2011 CCGT 580 EGSL & ELL
2012 Nuclear Uprate 160 EAI, ELL, EMI, & ENOI
CCGT 600 EAI
CCGT 600 EMI
CCGT 600 ETI
2014 Biomass 100 EAI
CCGT 600 EAI
2015 Biomass 100 EMI
CCGT 600 ELL, ENOI
Nuclear Uprate 125 ELL, ENOI, EGSL & ETI
On-Shore Wind 50 EAI
2016 Biomass 100 ETI
On-Shore Wind 50 EAI
2017 Biomass 100 EGSL
On-Shore Wind 50 EAI
2018 Biomass 50 ELL
Biomass 50 ENOI
On-Shore Wind 50 EAI
CCGT 600 ETI
2019 Biomass 100 ELL
In-Stream Hydro 50 EMI
CCGT 600 ETI
2010 – 2019 Total 5,915
Note: Renewable generation showed at gross capacity, not net capacity value
Attachment 2 Docket R-30021 Page 29 of 40
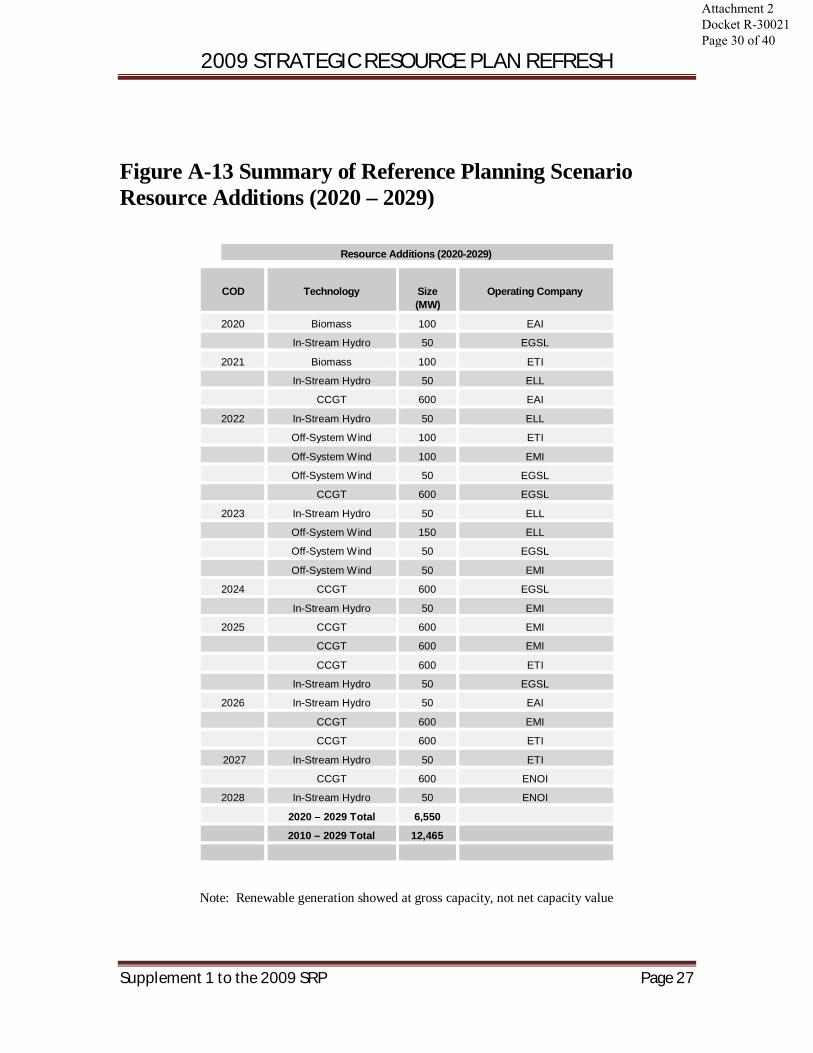
2009 STRATEGIC RESOURCE PLAN REFRESH
Supplement 1 to the 2009 SRP Page 27
Figure A-13 Summary of Reference Planning Scenario Resource Additions (2020 – 2029)
Resource Additions (2020-2029)
COD
Technology
Size (MW)
Operating Company
2020 Biomass 100 EAI
In-Stream Hydro 50 EGSL
2021 Biomass 100 ETI
In-Stream Hydro 50 ELL
CCGT 600 EAI
2022 In-Stream Hydro 50 ELL
Off-System Wind 100 ETI
Off-System Wind 100 EMI
Off-System Wind 50 EGSL
CCGT 600 EGSL
2023 In-Stream Hydro 50 ELL
Off-System Wind 150 ELL
Off-System Wind 50 EGSL
Off-System Wind 50 EMI
2024 CCGT 600 EGSL
In-Stream Hydro 50 EMI
2025 CCGT 600 EMI
CCGT 600 EMI
CCGT 600 ETI
In-Stream Hydro 50 EGSL
2026 In-Stream Hydro 50 EAI
CCGT 600 EMI
CCGT 600 ETI
2027 In-Stream Hydro 50 ETI
CCGT 600 ENOI
2028 In-Stream Hydro 50 ENOI
2020 – 2029 Total 6,550
2010 – 2029 Total 12,465
Note: Renewable generation showed at gross capacity, not net capacity value
Attachment 2 Docket R-30021 Page 30 of 40

2009 STRATEGIC RESOURCE PLAN REFRESH
Supplement 1 to the 2009 SRP Page 28
Figure A-14 Summary of Reference Planning Scenario Portfolio Composition (Total 6-Company Utility Capacity) (GW)
Year
Resource 10 11 12 13 14 15 16 17 18 19 20 21 22 23 24 25 26 27 28 29
DSM 0.1 0.1 0.1 0.2 0.3 0.3 0.4 0.5 0.6 0.7 0.8 0.9 1.0 1.0 1.1 1.1 1.1 1.1 1.1 1.1
Nuclear 5.1 5.1 5.3 5.3 5.3 5.4 5.4 5.4 5.4 5.4 5.4 5.4 5.4 5.4 5.4 5.4 5.4 5.4 5.4 5.4
Coal 2.4 2.4 2.4 2.4 2.4 2.4 2.4 2.4 2.4 2.4 2.4 2.4 2.4 2.4 2.4 2.4 2.4 2.4 2.4 2.4
Existing Hydro 0.2 0.2 0.2 0.2 0.2 0.2 0.2 0.2 0.2 0.2 0.2 0.2 0.2 0.2 0.2 0.2 0.2 0.2 0.2 0.2
Existing Gas 11.8 11.8 11.2 11.0 10.9 10.9 10.8 10.0 9.4 8.9 8.9 8.5 8.2 7.8 7.4 6.3 5.7 5.2 5.2 5.2
Renewable Generation - - - - 0.1 0.2 0.3 0.4 0.5 0.7 0.8 1.0 1.0 1.1 1.2 1.2 1.3 1.3 1.4 1.4
CT / CCGT 4.1 4.1 5.9 5.9 6.5 7.1 7.1 7.1 7.7 8.3 8.3 8.9 9.5 9.5 10.1 11.9 13.1 13.7 13.7 13.7
Limited-Term Purchases
0.5 0.9 0.3 0.2 0.5 0.5 0.6 1.5 1.5 1.4 1.5 1.4 1.1 1.7 1.8 1.4 1.1 1.2 1.5 1.8
Total 24.1 24.6 25.4 25.2 26.1 27.0 27.2 27.5 27.7 28.0 28.3 28.6 28.8 29.2 29.6 29.8 30.3 30.5 30.8 31.1
Note: Renewable generation showed at gross capacity, not net capacity value
Attachment 2 Docket R-30021 Page 31 of 40
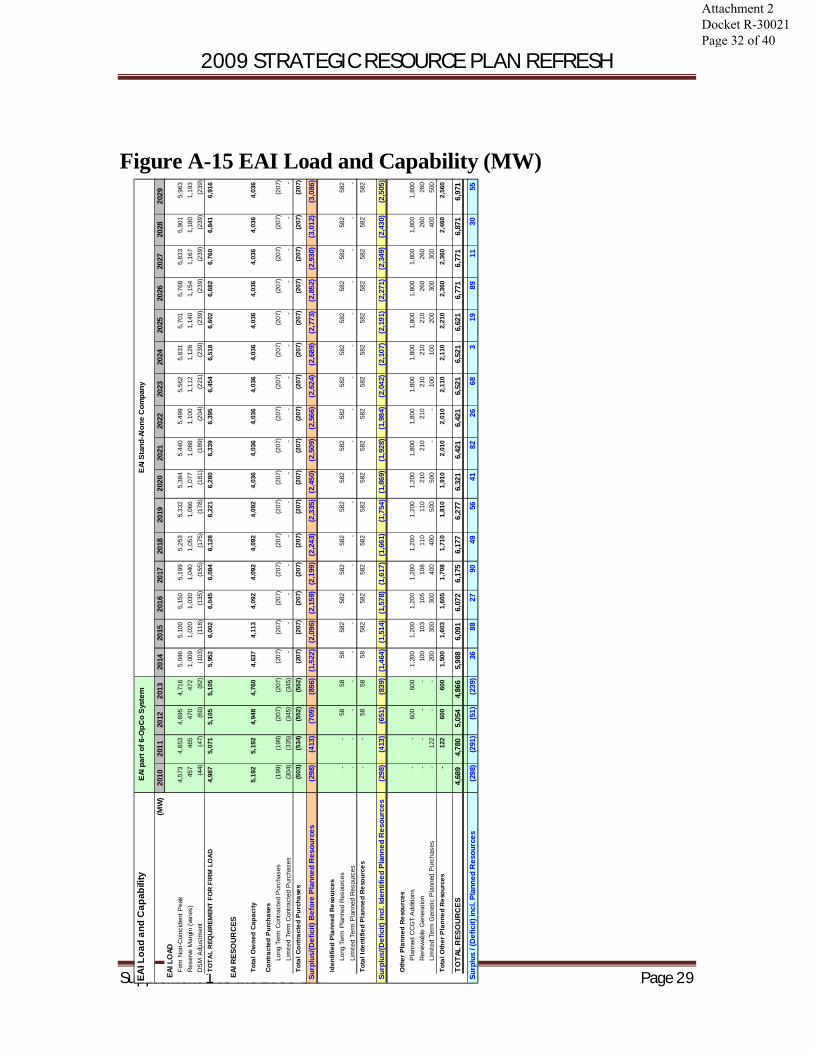
2009 STRATEGIC RESOURCE PLAN REFRESH
Supplement 1 to the 2009 SRP Page 29
Figure A-15 EAI Load and Capability (MW)
EAI L
oad
and
Cap
abili
ty
(MW
)
2010
2011
2012
2013
2014
2015
2016
2017
2018
2019
2020
2021
2022
2023
2024
2025
2026
2027
2028
2029
EAI
LO
ADFi
rm N
on-C
oinc
iden
t Pea
k4,
573
4,65
3
4,
695
4,71
6
5,
046
5,10
0
5,
150
5,19
9
5,
253
5,33
2
5,
384
5,44
0
5,
499
5,56
2
5,
631
5,70
1
5,
768
5,83
3
5,
901
5,96
3
Res
erve
Mar
gin
(var
ies)
457
46
5
470
47
2
1,00
9
1,
020
1,03
0
1,
040
1,05
1
1,
066
1,07
7
1,
088
1,10
0
1,
112
1,12
6
1,
140
1,15
4
1,
167
1,18
0
1,
193
D
SM
Adj
ustm
ent
(44)
(4
7)
(60)
(8
2)
(103
)
(1
18)
(135
)
(1
55)
(175
)
(1
78)
(1
81)
(189
)
(204
)
(221
)
(239
)
(239
)
(239
)
(239
)
(239
)
(239
)
TOTA
L R
EQUI
REM
ENT
FOR
FIRM
LO
AD4,
987
5,07
1
5,
105
5,10
5
5,
952
6,00
2
6,
045
6,08
4
6,
128
6,22
1
6,
280
6,33
9
6,
395
6,45
4
6,
518
6,60
2
6,
682
6,76
0
6,
841
6,91
6
EAI
RES
OU
RC
ES
Tota
l Ow
ned
Cap
acity
5,19
2
5,
192
4,94
8
4,
760
4,63
7
4,
113
4,09
2
4,
092
4,09
2
4,
092
4,03
6
4,
036
4,03
6
4,
036
4,03
6
4,
036
4,03
6
4,
036
4,03
6
4,
036
Cont
ract
ed P
urch
ases
Long
Ter
m C
ontra
cted
Pur
chas
es(1
99)
(199
)
(2
07)
(207
)
(2
07)
(207
)
(2
07)
(207
)
(2
07)
(207
)
(207
)
(2
07)
(2
07)
(2
07)
(2
07)
(2
07)
(2
07)
(2
07)
(2
07)
(2
07)
Li
mite
d Te
rm C
ontra
cted
Pur
chas
es(3
04)
(335
)
(3
45)
(345
)
-
-
-
-
-
-
-
-
-
-
-
-
-
-
-
-
To
tal C
ontra
cted
Pur
chas
es(5
03)
(534
)
(5
52)
(552
)
(2
07)
(207
)
(2
07)
(207
)
(2
07)
(207
)
(207
)
(2
07)
(2
07)
(2
07)
(2
07)
(2
07)
(2
07)
(2
07)
(2
07)
(2
07)
Sur
plus
/(Def
icit)
Bef
ore
Plan
ned
Res
ourc
es(2
98)
(413
)
(7
09)
(896
)
(1
,522
)
(2,0
96)
(2
,159
)
(2,1
99)
(2
,243
)
(2,3
35)
(2,4
50)
(2
,509
)
(2,5
66)
(2
,624
)
(2,6
89)
(2
,773
)
(2,8
52)
(2
,930
)
(3,0
12)
(3
,086
)
Iden
tifie
d P
lann
ed R
esou
rces
Long
Ter
m P
lann
ed R
esou
rces
-
-
58
58
58
582
58
2
582
58
2
582
58
2
582
58
2
582
58
2
582
58
2
582
58
2
582
Lim
ited
Term
Pla
nned
Res
ourc
es-
-
-
-
-
-
-
-
-
-
-
-
-
-
-
-
-
-
-
-
To
tal I
dent
ified
Pla
nned
Res
ourc
es-
-
58
58
58
58
2
582
58
2
582
58
2
582
58
2
582
58
2
582
58
2
582
58
2
582
58
2
Sur
plus
/(Def
icit)
incl
. Ide
ntifi
ed P
lann
ed R
esou
rces
(298
)
(4
13)
(651
)
(8
39)
(1,4
64)
(1
,514
)
(1,5
78)
(1
,617
)
(1,6
61)
(1
,754
)
(1
,869
)
(1,9
28)
(1
,984
)
(2,0
42)
(2
,107
)
(2,1
91)
(2
,271
)
(2,3
49)
(2
,430
)
(2,5
05)
Oth
er P
lann
ed R
esou
rces
Pla
nned
CC
GT
Add
ition
s-
-
60
0
600
1,
200
1,20
0
1,
200
1,20
0
1,
200
1,20
0
1,
200
1,80
0
1,
800
1,80
0
1,
800
1,80
0
1,
800
1,80
0
1,
800
1,80
0
Ren
ewab
le G
ener
atio
n-
-
-
-
10
0
103
10
5
108
11
0
110
21
0
210
21
0
210
21
0
210
26
0
260
26
0
260
Lim
ited
Term
Gen
eric
Pla
nned
Pur
chas
es-
122
-
-
20
0
300
30
0
400
40
0
500
50
0
-
-
100
10
0
200
30
0
300
40
0
500
Tota
l Oth
er P
lann
ed R
esou
rces
-
12
2
600
60
0
1,50
0
1,
603
1,60
5
1,
708
1,71
0
1,
810
1,91
0
2,
010
2,01
0
2,
110
2,11
0
2,
210
2,36
0
2,
360
2,46
0
2,
560
TOTA
L R
ESO
UR
CES
4,68
9
4,78
0
5,05
4
4,86
6
5,98
8
6,09
1
6,07
2
6,17
5
6,17
7
6,27
7
6,
321
6,
421
6,42
1
6,
521
6,52
1
6,
621
6,77
1
6,
771
6,87
1
6,
971
Sur
plus
/ (D
efic
it) in
cl. P
lann
ed R
esou
rces
(298
)
(2
91)
(51)
(239
)
36
88
27
90
49
56
41
82
26
68
3
19
89
11
30
55
EAI p
art o
f 6-O
pCo
Syst
emEA
I Sta
nd-A
lone
Com
pany
Attachment 2 Docket R-30021 Page 32 of 40
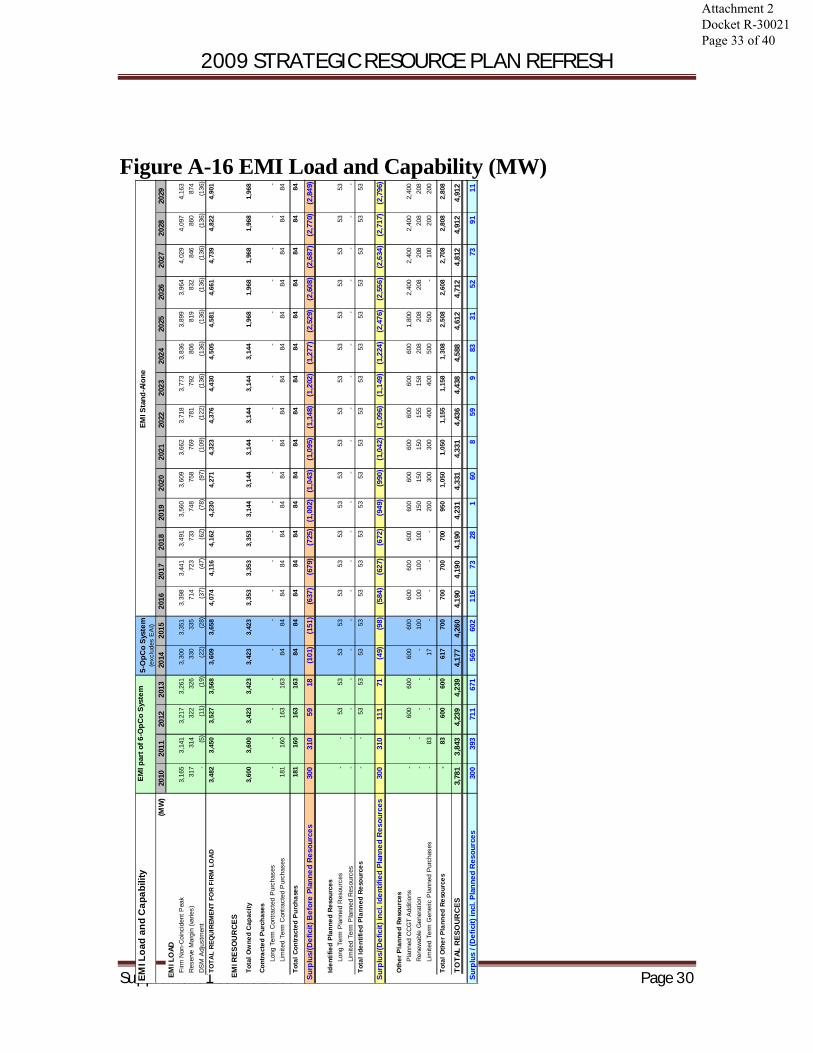
2009 STRATEGIC RESOURCE PLAN REFRESH
Supplement 1 to the 2009 SRP Page 30
Figure A-16 EMI Load and Capability (MW)
EMI L
oad
and
Cap
abili
ty
(MW
)
2010
2011
2012
2013
2014
2015
2016
2017
2018
2019
2020
2021
2022
2023
2024
2025
2026
2027
2028
2029
EM
I LO
ADFi
rm N
on-C
oinc
iden
t Pea
k3,
165
3,14
1
3,
217
3,26
1
3,
300
3,35
1
3,
398
3,44
1
3,
491
3,56
0
3,
609
3,66
2
3,
718
3,77
3
3,
836
3,89
9
3,
964
4,02
9
4,
097
4,16
3
R
eser
ve M
argi
n (v
arie
s)31
7
314
32
2
326
33
0
335
71
4
723
73
3
748
75
8
769
78
1
792
80
6
819
83
2
846
86
0
874
D
SM
Adj
ustm
ent
-
(5
)
(11)
(1
9)
(22)
(2
8)
(37)
(4
7)
(62)
(7
8)
(97)
(1
09)
(1
22)
(1
36)
(1
36)
(1
36)
(1
36)
(1
36)
(1
36)
(1
36)
TO
TAL
REQ
UIRE
MEN
T FO
R FI
RM L
OAD
3,48
2
3,
450
3,52
7
3,
568
3,60
9
3,
658
4,07
4
4,
116
4,16
2
4,
230
4,27
1
4,
323
4,37
6
4,
430
4,50
5
4,
581
4,66
1
4,
739
4,82
2
4,
901
EM
I RES
OU
RC
ES
Tota
l Ow
ned
Cap
acity
3,60
0
3,
600
3,42
3
3,
423
3,42
3
3,
423
3,35
3
3,
353
3,35
3
3,
144
3,14
4
3,
144
3,14
4
3,
144
3,14
4
1,
968
1,96
8
1,
968
1,96
8
1,
968
Con
tract
ed P
urch
ases
Long
Ter
m C
ontra
cted
Pur
chas
es-
-
-
-
-
-
-
-
-
-
-
-
-
-
-
-
-
-
-
-
Li
mite
d Te
rm C
ontra
cted
Pur
chas
es18
1
160
16
3
163
84
84
84
84
84
84
84
84
84
84
84
84
84
84
84
84
Tota
l Con
tract
ed P
urch
ases
181
16
0
163
16
3
84
84
84
84
84
84
84
84
84
84
84
84
84
84
84
84
Sur
plus
/(Def
icit)
Bef
ore
Plan
ned
Res
ourc
es30
0
31
0
59
18
(1
01)
(151
)
(6
37)
(679
)
(7
25)
(1,0
02)
(1
,043
)
(1,0
95)
(1
,148
)
(1,2
02)
(1
,277
)
(2,5
29)
(2
,608
)
(2,6
87)
(2
,770
)
(2,8
49)
Iden
tifie
d P
lann
ed R
esou
rces
Long
Ter
m P
lann
ed R
esou
rces
-
-
53
53
53
53
53
53
53
53
53
53
53
53
53
53
53
53
53
53
Li
mite
d Te
rm P
lann
ed R
esou
rces
-
-
-
-
-
-
-
-
-
-
-
-
-
-
-
-
-
-
-
-
Tota
l Ide
ntifi
ed P
lann
ed R
esou
rces
-
-
53
53
53
53
53
53
53
53
53
53
53
53
53
53
53
53
53
53
Sur
plus
/(Def
icit)
incl
. Ide
ntifi
ed P
lann
ed R
esou
rces
300
310
111
71
(49)
(98)
(584
)
(6
27)
(672
)
(9
49)
(990
)
(1
,042
)
(1,0
96)
(1
,149
)
(1,2
24)
(2
,476
)
(2,5
56)
(2
,634
)
(2,7
17)
(2
,796
)
Oth
er P
lann
ed R
esou
rces
Pla
nned
CC
GT
Add
ition
s-
-
60
0
600
60
0
600
60
0
600
60
0
600
60
0
600
60
0
600
60
0
1,80
0
2,
400
2,40
0
2,
400
2,40
0
R
enew
able
Gen
erat
ion
-
-
-
-
-
10
0
100
10
0
100
15
0
150
15
0
155
15
8
208
20
8
208
20
8
208
20
8
Lim
ited
Term
Gen
eric
Pla
nned
Pur
chas
es-
83
-
-
17
-
-
-
-
200
30
0
300
40
0
400
50
0
500
-
100
20
0
200
Tota
l Oth
er P
lann
ed R
esou
rces
-
83
60
0
600
61
7
700
70
0
700
70
0
950
1,
050
1,05
0
1,
155
1,15
8
1,
308
2,50
8
2,
608
2,70
8
2,
808
2,80
8
TOTA
L R
ESO
UR
CES
3,78
1
3,84
3
4,23
9
4,23
9
4,17
7
4,26
0
4,19
0
4,19
0
4,19
0
4,23
1
4,33
1
4,33
1
4,
436
4,43
8
4,
588
4,61
2
4,
712
4,81
2
4,
912
4,91
2
Sur
plus
/ (D
efic
it) in
cl. P
lann
ed R
esou
rces
300
393
711
671
569
602
116
73
28
1
60
8
59
9
83
31
52
73
91
11
EMI p
art o
f 6-O
pCo
Syst
em5-
OpC
o Sy
stem
(exc
lude
s E
AI)
EMI S
tand
-Alo
ne
Attachment 2 Docket R-30021 Page 33 of 40
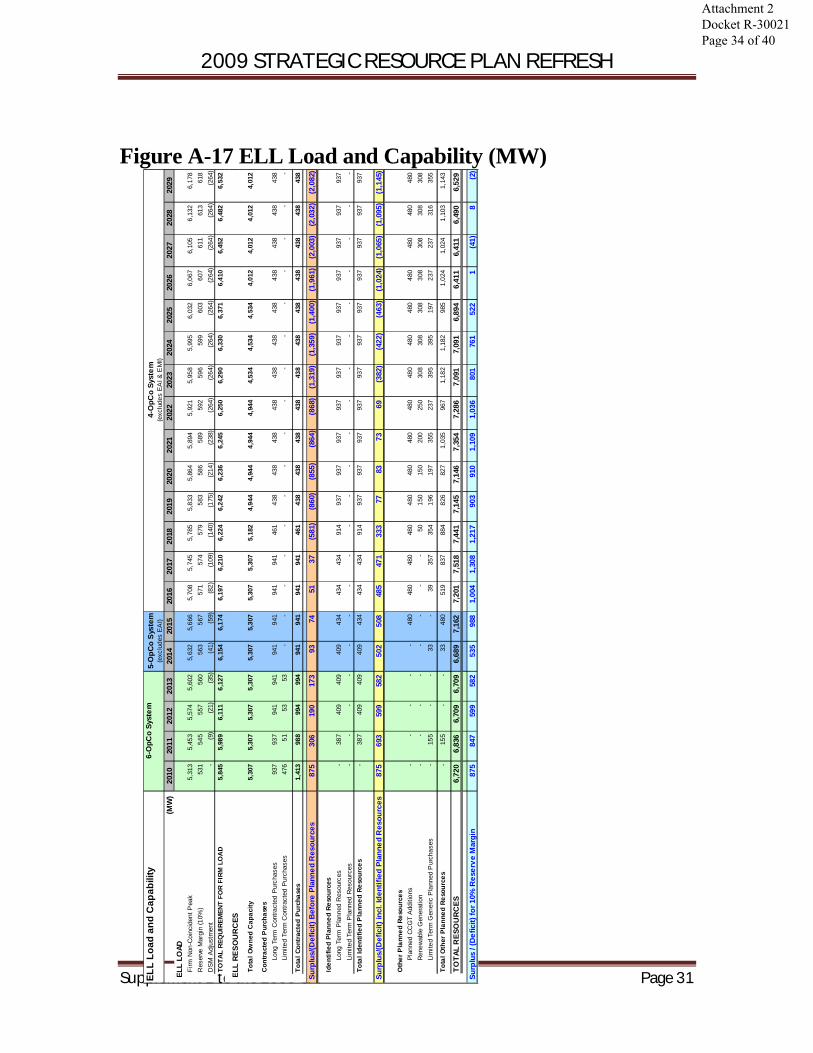
2009 STRATEGIC RESOURCE PLAN REFRESH
Supplement 1 to the 2009 SRP Page 31
Figure A-17 ELL Load and Capability (MW)
ELL
Load
and
Cap
abili
ty
(MW
)
2010
2011
2012
2013
2014
2015
2016
2017
2018
2019
2020
2021
2022
2023
2024
2025
2026
2027
2028
2029
ELL
LO
ADFi
rm N
on-C
oinc
iden
t Pea
k5,
313
5,45
3
5,
574
5,60
2
5,
632
5,66
6
5,
708
5,74
5
5,
785
5,83
3
5,
864
5,89
4
5,
921
5,95
8
5,
995
6,03
2
6,
067
6,10
5
6,
132
6,17
8
R
eser
ve M
argi
n (1
0%)
531
54
5
557
56
0
563
56
7
571
57
4
579
58
3
586
58
9
592
59
6
599
60
3
607
61
1
613
61
8
DS
M A
djus
tmen
t-
(9)
(2
1)
(35)
(4
1)
(59)
(8
2)
(109
)
(1
40)
(175
)
(2
14)
(238
)
(264
)
(264
)
(264
)
(264
)
(264
)
(264
)
(264
)
(264
)
TOTA
L RE
QUI
REM
ENT
FOR
FIRM
LO
AD
5,84
5
5,
989
6,11
1
6,
127
6,15
4
6,
174
6,19
7
6,
210
6,22
4
6,
242
6,23
6
6,
245
6,25
0
6,
290
6,33
0
6,
371
6,41
0
6,
452
6,48
2
6,
532
ELL
RES
OU
RC
ES
Tota
l Ow
ned
Cap
acity
5,30
7
5,
307
5,30
7
5,
307
5,30
7
5,
307
5,30
7
5,
307
5,18
2
4,
944
4,94
4
4,
944
4,94
4
4,
534
4,53
4
4,
534
4,01
2
4,
012
4,01
2
4,
012
Con
tract
ed P
urch
ases
Long
Ter
m C
ontra
cted
Pur
chas
es93
7
937
94
1
941
94
1
941
94
1
941
46
1
438
43
8
438
43
8
438
43
8
438
43
8
438
43
8
438
Li
mite
d Te
rm C
ontra
cted
Pur
chas
es47
6
51
53
53
-
-
-
-
-
-
-
-
-
-
-
-
-
-
-
-
Tota
l Con
trac
ted
Purc
hase
s1,
413
988
99
4
994
94
1
941
94
1
941
46
1
438
43
8
438
43
8
438
43
8
438
43
8
438
43
8
438
Sur
plus
/(Def
icit)
Bef
ore
Plan
ned
Res
ourc
es87
5
30
6
19
0
17
3
93
74
51
37
(5
81)
(860
)
(8
55)
(864
)
(8
68)
(1,3
19)
(1
,359
)
(1,4
00)
(1
,961
)
(2,0
03)
(2
,032
)
(2,0
82)
Iden
tifie
d Pl
anne
d Re
sour
ces
Long
Ter
m P
lann
ed R
esou
rces
-
38
7
409
40
9
409
43
4
434
43
4
914
93
7
937
93
7
937
93
7
937
93
7
937
93
7
937
93
7
Lim
ited
Term
Pla
nned
Res
ourc
es-
-
-
-
-
-
-
-
-
-
-
-
-
-
-
-
-
-
-
-
To
tal I
dent
ified
Pla
nned
Res
ourc
es-
387
40
9
409
40
9
434
43
4
434
91
4
937
93
7
937
93
7
937
93
7
937
93
7
937
93
7
937
Sur
plus
/(Def
icit)
incl
. Ide
ntifi
ed P
lann
ed R
esou
rces
875
693
599
582
502
508
485
471
333
77
83
73
69
(382
)
(4
22)
(463
)
(1
,024
)
(1,0
65)
(1
,095
)
(1,1
45)
Oth
er P
lann
ed R
esou
rces
Pla
nned
CC
GT
Add
ition
s-
-
-
-
-
480
48
0
480
48
0
480
48
0
480
48
0
480
48
0
480
48
0
480
48
0
480
R
enew
able
Gen
erat
ion
-
-
-
-
-
-
-
-
50
150
15
0
200
25
0
308
30
8
308
30
8
308
30
8
308
Li
mite
d Te
rm G
ener
ic P
lann
ed P
urch
ases
-
15
5
-
-
33
-
39
35
7
354
19
6
197
35
5
237
39
5
395
19
7
237
23
7
316
35
5
Tota
l Oth
er P
lann
ed R
esou
rces
-
15
5
-
-
33
480
51
9
837
88
4
826
82
7
1,03
5
96
7
1,18
2
1,
182
985
1,
024
1,02
4
1,
103
1,14
3
TOTA
L R
ESO
UR
CES
6,72
0
6,83
6
6,70
9
6,70
9
6,68
9
7,16
2
7,20
1
7,51
8
7,44
1
7,14
5
7,14
6
7,35
4
7,
286
7,09
1
7,
091
6,89
4
6,
411
6,41
1
6,
490
6,52
9
Sur
plus
/ (D
efic
it) fo
r 10%
Res
erve
Mar
gin
875
847
599
582
535
988
1,00
4
1,30
8
1,21
7
903
910
1,10
9
1,
036
801
76
1
522
1
(41)
8
(2)
6-O
pCo
Syst
em5-
OpC
o Sy
stem
(exc
lude
s E
AI)
4-O
pCo
Syst
em(e
xclu
des
EA
I & E
MI)
Attachment 2 Docket R-30021 Page 34 of 40

2009 STRATEGIC RESOURCE PLAN REFRESH
Supplement 1 to the 2009 SRP Page 32
Figure A-18 ENOI Load and Capability
ENO
I Loa
d an
d C
apab
ility
(MW
)
2010
2011
2012
2013
2014
2015
2016
2017
2018
2019
2020
2021
2022
2023
2024
2025
2026
2027
2028
2029
EN
OI L
OAD
Firm
Non
-Coi
ncid
ent P
eak
966
97
4
979
99
0
990
99
6
1,00
6
1,
012
1,01
9
1,
026
1,03
1
1,
036
1,04
2
1,
047
1,05
3
1,
060
1,06
7
1,
074
1,08
0
1,
086
Res
erve
Mar
gin
(10%
)97
97
98
99
99
10
0
101
10
1
102
10
3
103
10
4
104
10
5
105
10
6
107
10
7
108
10
9
DS
M A
djus
tmen
t(3
)
(5)
(7
)
(9)
(1
3)
(17)
(2
2)
(28)
(3
4)
(38)
(4
3)
(43)
(4
3)
(43)
(4
3)
(43)
(4
3)
(43)
(4
3)
(43)
TO
TAL
REQ
UIR
EMEN
T FO
R F
IRM
LO
AD1,
060
1,06
6
1,
071
1,08
0
1,
076
1,07
8
1,
084
1,08
6
1,
087
1,09
0
1,
092
1,09
7
1,
103
1,10
9
1,
116
1,12
3
1,
131
1,13
8
1,
146
1,15
2
EN
OI R
ESO
UR
CES
Tota
l Ow
ned
Cap
acity
939
93
9
939
93
9
939
93
9
939
93
9
939
93
9
939
93
9
706
70
6
706
70
6
706
19
1
191
19
1
Con
tract
ed P
urch
ases
Long
Ter
m C
ontra
cted
Res
ourc
es26
7
267
27
1
271
27
1
271
27
1
271
27
1
271
27
1
271
27
1
271
27
1
271
27
1
271
27
1
271
Li
mite
d Te
rm C
ontra
cted
Res
ourc
es7
-
-
-
-
-
-
-
-
-
-
-
-
-
-
-
-
-
-
-
Tota
l Con
tract
ed P
urch
ases
274
26
7
271
27
1
271
27
1
271
27
1
271
27
1
271
27
1
271
27
1
271
27
1
271
27
1
271
27
1
Sur
plus
/(Def
icit)
Bef
ore
Plan
ned
Res
ourc
es15
3
14
1
14
0
13
1
13
5
13
2
12
7
12
5
12
4
12
1
11
9
11
3
(125
)
(1
32)
(138
)
(1
45)
(153
)
(6
76)
(683
)
(6
89)
Iden
tifie
d Pl
anne
d R
esou
rces
Long
Ter
m P
lann
ed R
esou
rces
-
-
27
27
27
40
40
40
40
40
40
40
40
40
40
40
40
40
40
40
Li
mite
d Te
rm P
lann
ed R
esou
rces
-
-
-
-
-
-
-
-
-
-
-
-
-
-
-
-
-
-
-
-
Tota
l Ide
ntifi
ed P
lann
ed R
esou
rces
-
-
27
27
27
40
40
40
40
40
40
40
40
40
40
40
40
40
40
40
Sur
plus
/(Def
icit)
incl
. Ide
ntifi
ed P
lann
ed R
esou
rces
153
141
167
158
162
172
166
165
164
160
159
153
(8
6)
(92)
(9
9)
(105
)
(1
14)
(636
)
(6
43)
(650
)
Oth
er P
lann
ed R
esou
rces
Pla
nned
CC
GT
Add
ition
s-
-
-
-
-
120
12
0
120
12
0
120
12
0
120
12
0
120
12
0
120
12
0
720
72
0
720
R
enew
able
Gen
erat
ion
-
-
-
-
-
-
-
-
50
50
50
50
50
50
50
50
50
50
10
0
100
Li
mite
d Te
rm G
ener
ic P
lann
ed P
urch
ases
-
26
-
-
5
-
6
56
56
31
31
56
37
62
62
31
37
37
50
56
Tota
l Oth
er P
lann
ed R
esou
rces
-
26
-
-
5
120
12
6
176
22
6
201
20
1
226
20
7
232
23
2
201
20
7
807
87
0
876
TOTA
L R
ESO
UR
CES
1,21
3
1,23
3
1,23
8
1,23
8
1,24
3
1,37
0
1,37
7
1,42
7
1,47
7
1,45
2
1,45
1
1,47
6
1,
225
1,24
9
1,
249
1,21
8
1,
225
1,31
0
1,
372
1,37
8
Sur
plus
/ (D
efic
it) fo
r 10%
Res
erve
Mar
gin
153
167
167
158
168
292
293
341
390
362
360
379
12
1
140
13
3
96
94
171
22
6
226
6-O
pCo
Syst
em5-
OpC
o Sy
stem
(exc
lude
s E
AI)
4-O
pCo
Syst
em(e
xclu
des
EA
I & E
MI)
Attachment 2 Docket R-30021 Page 35 of 40
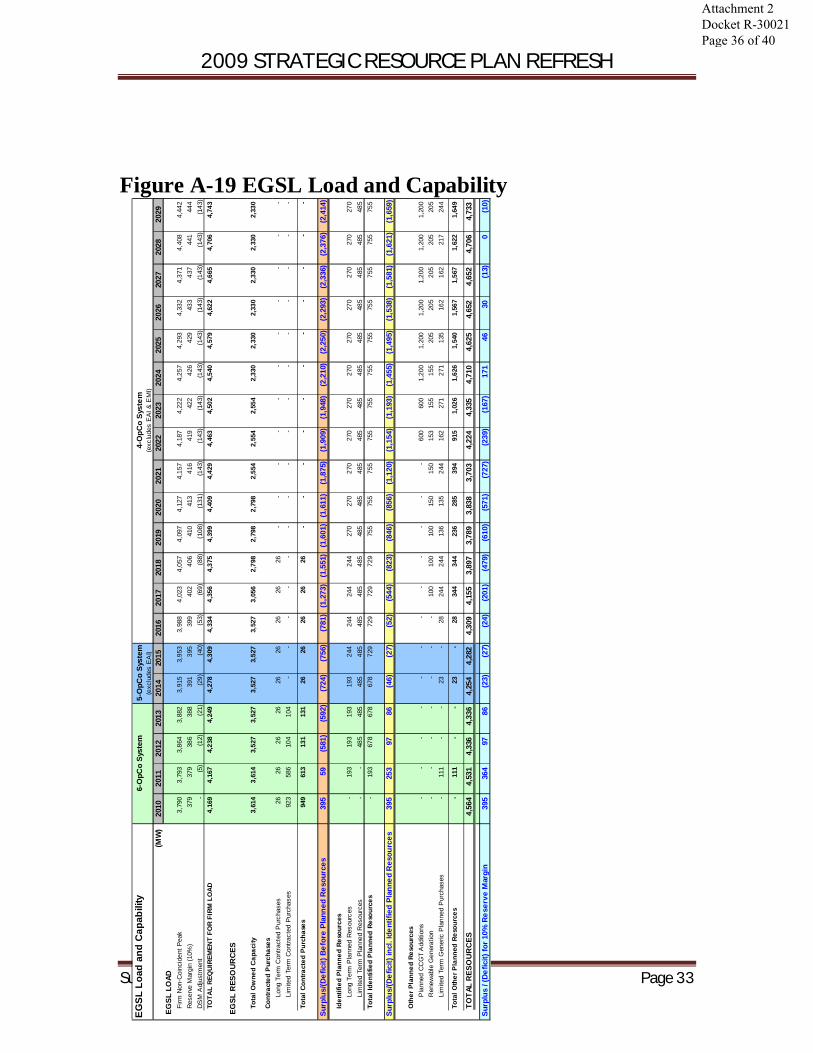
2009 STRATEGIC RESOURCE PLAN REFRESH
Supplement 1 to the 2009 SRP Page 33
Figure A-19 EGSL Load and Capability
EGSL
Loa
d an
d C
apab
ility
(MW
)
2010
2011
2012
2013
2014
2015
2016
2017
2018
2019
2020
2021
2022
2023
2024
2025
2026
2027
2028
2029
EG
SL L
OAD
Firm
Non
-Coi
ncid
ent P
eak
3,79
0
3,
793
3,86
4
3,
882
3,91
5
3,
953
3,98
8
4,
023
4,05
7
4,
097
4,12
7
4,
157
4,18
7
4,
222
4,25
7
4,
293
4,33
2
4,
371
4,40
8
4,
442
Res
erve
Mar
gin
(10%
)37
9
379
38
6
388
39
1
395
39
9
402
40
6
410
41
3
416
41
9
422
42
6
429
43
3
437
44
1
444
D
SM
Adj
ustm
ent
-
(5
)
(12)
(2
1)
(29)
(4
0)
(53)
(6
9)
(88)
(1
08)
(131
)
(1
43)
(1
43)
(1
43)
(1
43)
(1
43)
(1
43)
(1
43)
(1
43)
(1
43)
TO
TAL
REQ
UIRE
MEN
T FO
R FI
RM L
OAD
4,16
9
4,
167
4,23
8
4,
249
4,27
8
4,
309
4,33
4
4,
356
4,37
5
4,
399
4,40
9
4,
429
4,46
3
4,
502
4,54
0
4,
579
4,62
2
4,
665
4,70
6
4,
743
EG
SL R
ESO
UR
CES
Tota
l Ow
ned
Cap
acity
3,61
4
3,
614
3,52
7
3,
527
3,52
7
3,
527
3,52
7
3,
056
2,79
8
2,
798
2,79
8
2,
554
2,55
4
2,
554
2,33
0
2,
330
2,33
0
2,
330
2,33
0
2,
330
Cont
ract
ed P
urch
ases
Long
Ter
m C
ontra
cted
Pur
chas
es26
26
26
26
26
26
26
26
26
-
-
-
-
-
-
-
-
-
-
-
Lim
ited
Term
Con
tract
ed P
urch
ases
923
58
6
104
10
4
-
-
-
-
-
-
-
-
-
-
-
-
-
-
-
-
Tota
l Con
tract
ed P
urch
ases
949
61
3
131
13
1
26
26
26
26
26
-
-
-
-
-
-
-
-
-
-
-
Sur
plus
/(Def
icit)
Bef
ore
Plan
ned
Res
ourc
es39
5
59
(5
81)
(592
)
(7
24)
(756
)
(7
81)
(1,2
73)
(1
,551
)
(1,6
01)
(1
,611
)
(1,8
75)
(1
,909
)
(1,9
48)
(2
,210
)
(2,2
50)
(2
,293
)
(2,3
36)
(2
,376
)
(2,4
14)
Iden
tifie
d Pl
anne
d Re
sour
ces
Long
Ter
m P
lann
ed R
esou
rces
-
19
3
193
19
3
193
24
4
244
24
4
244
27
0
270
27
0
270
27
0
270
27
0
270
27
0
270
27
0
Lim
ited
Term
Pla
nned
Res
ourc
es-
-
48
5
485
48
5
485
48
5
485
48
5
485
48
5
485
48
5
485
48
5
485
48
5
485
48
5
485
To
tal I
dent
ified
Pla
nned
Res
ourc
es-
193
67
8
678
67
8
729
72
9
729
72
9
755
75
5
755
75
5
755
75
5
755
75
5
755
75
5
755
Sur
plus
/(Def
icit)
incl
. Ide
ntifi
ed P
lann
ed R
esou
rces
395
253
97
86
(46)
(27)
(52)
(544
)
(8
23)
(846
)
(8
56)
(1,1
20)
(1
,154
)
(1,1
93)
(1
,455
)
(1,4
95)
(1
,538
)
(1,5
81)
(1
,621
)
(1,6
59)
Oth
er P
lann
ed R
esou
rces
Pla
nned
CC
GT
Add
ition
s-
-
-
-
-
-
-
-
-
-
-
-
60
0
600
1,
200
1,20
0
1,
200
1,20
0
1,
200
1,20
0
R
enew
able
Gen
erat
ion
-
-
-
-
-
-
-
10
0
100
10
0
150
15
0
153
15
5
155
20
5
205
20
5
205
20
5
Lim
ited
Term
Gen
eric
Pla
nned
Pur
chas
es-
111
-
-
23
-
28
244
24
4
136
13
5
244
16
2
271
27
1
135
16
2
162
21
7
244
Tota
l Oth
er P
lann
ed R
esou
rces
-
11
1
-
-
23
-
28
34
4
344
23
6
285
39
4
915
1,
026
1,62
6
1,
540
1,56
7
1,
567
1,62
2
1,
649
TOTA
L R
ESO
UR
CES
4,56
4
4,53
1
4,33
6
4,33
6
4,25
4
4,28
2
4,30
9
4,15
5
3,89
7
3,78
9
3,83
8
3,70
3
4,
224
4,33
5
4,
710
4,62
5
4,
652
4,65
2
4,
706
4,73
3
Sur
plus
/ (D
efic
it) fo
r 10%
Res
erve
Mar
gin
395
364
97
86
(23)
(27)
(24)
(201
)
(4
79)
(610
)
(5
71)
(727
)
(2
39)
(167
)
17
1
46
30
(13)
0
(10)
6-O
pCo
Syst
em5-
OpC
o Sy
stem
(exc
lude
s E
AI)
4-O
pCo
Syst
em(e
xclu
des
EA
I & E
MI)
Attachment 2 Docket R-30021 Page 36 of 40
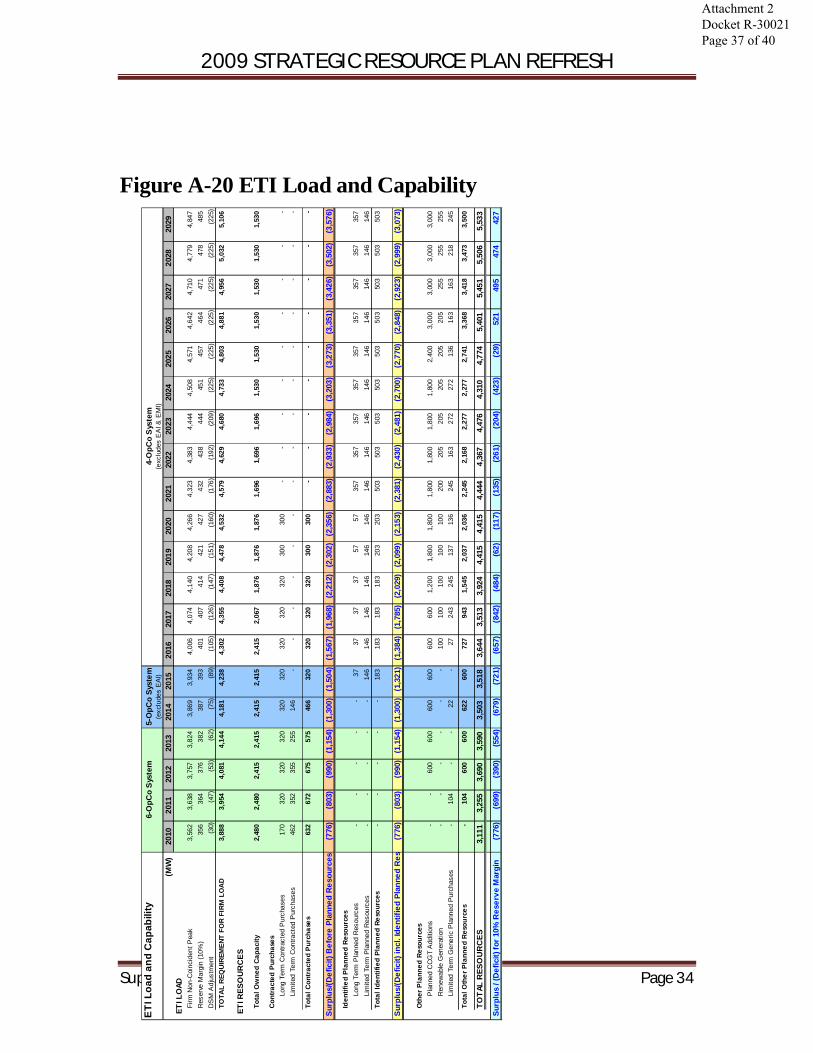
2009 STRATEGIC RESOURCE PLAN REFRESH
Supplement 1 to the 2009 SRP Page 34
Figure A-20 ETI Load and Capability
ETI
Loa
d an
d C
apab
ility
(MW
)
2010
2011
2012
2013
2014
2015
2016
2017
2018
2019
2020
2021
2022
2023
2024
2025
2026
2027
2028
2029
ETI
LO
ADFi
rm N
on-C
oinc
iden
t Pea
k3,
562
3,63
8
3,
757
3,82
4
3,
869
3,93
4
4,
006
4,07
4
4,
140
4,20
8
4,
266
4,32
3
4,
383
4,44
4
4,
508
4,57
1
4,
642
4,71
0
4,
779
4,84
7
R
eser
ve M
argi
n (1
0%)
356
36
4
376
38
2
387
39
3
401
40
7
414
42
1
427
43
2
438
44
4
451
45
7
464
47
1
478
48
5
DS
M A
djus
tmen
t(3
0)
(47)
(5
3)
(62)
(7
5)
(89)
(1
05)
(126
)
(1
47)
(151
)
(1
60)
(176
)
(192
)
(209
)
(225
)
(225
)
(225
)
(225
)
(225
)
(225
)
TOTA
L R
EQU
IREM
ENT
FOR
FIR
M L
OA
D3,
888
3,95
4
4,
081
4,14
4
4,
181
4,23
8
4,
302
4,35
5
4,
408
4,47
8
4,
532
4,57
9
4,
629
4,68
0
4,
733
4,80
3
4,
881
4,95
6
5,
032
5,10
6
ETI
RES
OU
RC
ES
Tota
l Ow
ned
Cap
acity
2,48
0
2,
480
2,41
5
2,
415
2,41
5
2,
415
2,41
5
2,
067
1,87
6
1,
876
1,87
6
1,
696
1,69
6
1,
696
1,53
0
1,
530
1,53
0
1,
530
1,53
0
1,
530
Con
trac
ted
Pur
chas
esLo
ng T
erm
Con
tract
ed P
urch
ases
170
32
0
320
32
0
320
32
0
320
32
0
320
30
0
300
-
-
-
-
-
-
-
-
-
Lim
ited
Term
Con
tract
ed P
urch
ases
462
35
2
355
25
5
146
-
-
-
-
-
-
-
-
-
-
-
-
-
-
-
Tota
l Con
trac
ted
Pur
chas
es63
2
672
67
5
575
46
6
320
32
0
320
32
0
300
30
0
-
-
-
-
-
-
-
-
-
Sur
plus
/(Def
icit)
Bef
ore
Plan
ned
Res
ourc
es(7
76)
(803
)
(9
90)
(1,1
54)
(1
,300
)
(1,5
04)
(1
,567
)
(1,9
68)
(2
,212
)
(2,3
02)
(2
,356
)
(2,8
83)
(2
,933
)
(2,9
84)
(3
,203
)
(3,2
73)
(3
,351
)
(3,4
26)
(3
,502
)
(3,5
76)
Iden
tifie
d P
lann
ed R
esou
rces
Long
Ter
m P
lann
ed R
esou
rces
-
-
-
-
-
37
37
37
37
57
57
35
7
357
35
7
357
35
7
357
35
7
357
35
7
Lim
ited
Term
Pla
nned
Res
ourc
es-
-
-
-
-
146
14
6
146
14
6
146
14
6
146
14
6
146
14
6
146
14
6
146
14
6
146
To
tal I
dent
ified
Pla
nned
Res
ourc
es-
-
-
-
-
183
18
3
183
18
3
203
20
3
503
50
3
503
50
3
503
50
3
503
50
3
503
Sur
plus
/(Def
icit)
incl
. Ide
ntifi
ed P
lann
ed R
esou
rces(776
)
(8
03)
(990
)
(1
,154
)
(1,3
00)
(1
,321
)
(1,3
84)
(1
,785
)
(2,0
29)
(2
,099
)
(2,1
53)
(2
,381
)
(2,4
30)
(2
,481
)
(2,7
00)
(2
,770
)
(2,8
48)
(2
,923
)
(2,9
99)
(3
,073
)
Oth
er P
lann
ed R
esou
rces
Pla
nned
CCG
T A
dditi
ons
-
-
600
60
0
600
60
0
600
60
0
1,20
0
1,
800
1,80
0
1,
800
1,80
0
1,
800
1,80
0
2,
400
3,00
0
3,
000
3,00
0
3,
000
Ren
ewab
le G
ener
atio
n-
-
-
-
-
-
10
0
100
10
0
100
10
0
200
20
5
205
20
5
205
20
5
255
25
5
255
Li
mite
d Te
rm G
ener
ic P
lann
ed P
urch
ases
-
10
4
-
-
22
-
27
24
3
245
13
7
136
24
5
163
27
2
272
13
6
163
16
3
218
24
5
Tota
l Oth
er P
lann
ed R
esou
rces
-
10
4
600
60
0
622
60
0
727
94
3
1,54
5
2,
037
2,03
6
2,
245
2,16
8
2,
277
2,27
7
2,
741
3,36
8
3,
418
3,47
3
3,
500
TOTA
L R
ESO
UR
CES
3,11
1
3,25
5
3,69
0
3,59
0
3,50
3
3,51
8
3,64
4
3,51
3
3,92
4
4,41
5
4,41
5
4,44
4
4,
367
4,47
6
4,
310
4,77
4
5,
401
5,45
1
5,
506
5,53
3
Sur
plus
/ (D
efic
it) fo
r 10%
Res
erve
Mar
gin
(776
)
(6
99)
(390
)
(5
54)
(679
)
(7
21)
(657
)
(8
42)
(484
)
(6
2)
(1
17)
(135
)
(2
61)
(204
)
(4
23)
(29)
52
1
495
47
4
427
6-O
pCo
Sys
tem
5-O
pCo
Syst
em(e
xclu
des
EA
I)4-
OpC
o S
yste
m(e
xclu
des
EA
I & E
MI)
Attachment 2 Docket R-30021 Page 37 of 40
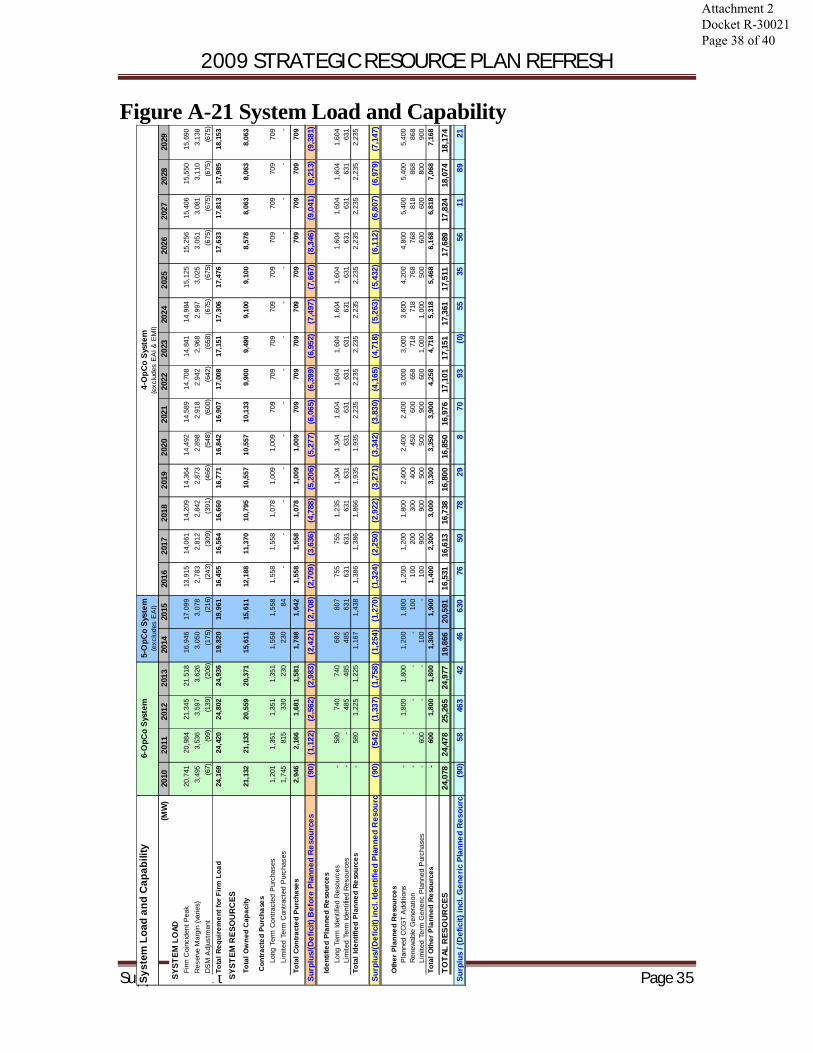
2009 STRATEGIC RESOURCE PLAN REFRESH
Supplement 1 to the 2009 SRP Page 35
Figure A-21 System Load and Capability
Syst
em L
oad
and
Cap
abili
ty
(MW
)
2010
2011
2012
2013
2014
2015
2016
2017
2018
2019
2020
2021
2022
2023
2024
2025
2026
2027
2028
2029
SYS
TEM
LO
ADFi
rm C
oinc
iden
t Pea
k20
,741
20
,984
21
,345
21
,518
16
,946
17
,099
13
,915
14
,061
14
,209
14
,364
14
,492
14
,589
14
,708
14
,841
14
,984
15,1
25
15
,256
15,4
06
15
,550
15,6
90
R
eser
ve M
argi
n (v
arie
s)3,
495
3,53
6
3,
597
3,62
6
3,
050
3,07
8
2,
783
2,81
2
2,
842
2,87
3
2,
898
2,91
8
2,
942
2,96
8
2,
997
3,02
5
3,
051
3,08
1
3,
110
3,13
8
D
SM
Adj
ustm
ent
(67)
(9
9)
(139
)
(208
)
(175
)
(216
)
(2
43)
(309
)
(3
91)
(466
)
(5
48)
(600
)
(6
42)
(658
)
(6
75)
(6
75)
(6
75)
(6
75)
(6
75)
(6
75)
To
tal R
equi
rem
ent f
or F
irm L
oad
24,1
69
24,4
20
24,8
02
24,9
36
19,8
20
19,9
61
16,4
55
16,5
64
16,6
60
16,7
71
16,8
42
16,9
07
17,0
08
17,1
51
17,3
06
17
,476
17,6
33
17
,813
17,9
85
18
,153
SYS
TEM
RES
OU
RC
ESTo
tal O
wne
d C
apac
ity21
,132
21
,132
20
,559
20
,371
15
,611
15
,611
12
,188
11
,370
10
,795
10
,557
10
,557
10
,133
9,
900
9,49
0
9,
100
9,10
0
8,
578
8,06
3
8,
063
8,06
3
Con
tract
ed P
urch
ases
Long
Ter
m C
ontra
cted
Pur
chas
es1,
201
1,35
1
1,
351
1,35
1
1,
558
1,55
8
1,
558
1,55
8
1,
078
1,00
9
1,
009
709
70
9
709
70
9
709
70
9
709
70
9
709
Li
mite
d Te
rm C
ontra
cted
Pur
chas
es1,
745
815
33
0
230
23
0
84
-
-
-
-
-
-
-
-
-
-
-
-
-
-
Tota
l Con
tract
ed P
urch
ases
2,94
6
2,
166
1,68
1
1,
581
1,78
8
1,
642
1,55
8
1,
558
1,07
8
1,
009
1,00
9
70
9
709
70
9
709
70
9
709
70
9
709
70
9
Sur
plus
/(Def
icit)
Bef
ore
Plan
ned
Res
ourc
es(9
0)
(1,1
22)
(2
,562
)
(2,9
83)
(2
,421
)
(2,7
08)
(2
,709
)
(3,6
36)
(4
,788
)
(5,2
06)
(5
,277
)
(6,0
65)
(6
,399
)
(6,9
52)
(7
,497
)
(7,6
67)
(8
,346
)
(9,0
41)
(9
,213
)
(9,3
81)
Iden
tifie
d P
lann
ed R
esou
rces
Long
Ter
m Id
entif
ied
Res
ourc
es-
580
74
0
740
68
2
807
75
5
755
1,
235
1,30
4
1,
304
1,60
4
1,
604
1,60
4
1,
604
1,60
4
1,
604
1,60
4
1,
604
1,60
4
Li
mite
d Te
rm Id
entif
ied
Res
ourc
es-
-
48
5
485
48
5
631
63
1
631
63
1
631
63
1
631
63
1
631
63
1
631
63
1
631
63
1
631
To
tal I
dent
ified
Pla
nned
Res
ourc
es-
580
1,
225
1,22
5
1,
167
1,43
8
1,
386
1,38
6
1,
866
1,93
5
1,
935
2,23
5
2,
235
2,23
5
2,
235
2,23
5
2,
235
2,23
5
2,
235
2,23
5
Sur
plus
/(Def
icit)
incl
. Ide
ntifi
ed P
lann
ed R
esou
rces
(90)
(5
42)
(1,3
37)
(1
,758
)
(1,2
54)
(1
,270
)
(1,3
24)
(2
,250
)
(2,9
22)
(3
,271
)
(3,3
42)
(3
,830
)
(4,1
65)
(4
,718
)
(5,2
63)
(5
,432
)
(6,1
12)
(6
,807
)
(6,9
79)
(7
,147
)
Oth
er P
lann
ed R
esou
rces
Pla
nned
CC
GT
Add
ition
s-
-
1,
800
1,80
0
1,
200
1,80
0
1,
200
1,20
0
1,
800
2,40
0
2,
400
2,40
0
3,
000
3,00
0
3,
600
4,20
0
4,
800
5,40
0
5,
400
5,40
0
R
enew
able
Gen
erat
ion
-
-
-
-
-
10
0
100
20
0
300
40
0
450
60
0
658
71
8
718
76
8
768
81
8
868
86
8
Lim
ited
Term
Gen
eric
Pla
nned
Pur
chas
es-
600
-
-
10
0
-
10
0
900
90
0
500
50
0
900
60
0
1,00
0
1,
000
500
60
0
600
80
0
900
To
tal O
ther
Pla
nned
Res
ourc
es-
600
1,
800
1,80
0
1,
300
1,90
0
1,
400
2,30
0
3,
000
3,30
0
3,
350
3,90
0
4,
258
4,71
8
5,
318
5,46
8
6,
168
6,81
8
7,
068
7,16
8
TOTA
L R
ESO
UR
CES
24,0
78
24,4
78
25,2
65
24,9
77
19,8
66
20,5
91
16,5
31
16,6
13
16,7
38
16,8
00
16,8
50
16,9
76
17,1
01
17,1
51
17,3
61
17,5
11
17,6
89
17,8
24
18,0
74
18,1
74
Sur
plus
/ (D
efic
it) in
cl. G
ener
ic P
lann
ed R
esou
rces
(90)
58
46
3
42
46
63
0
76
50
78
29
8
70
93
(0)
55
35
56
11
89
21
6-O
pCo
Syst
em5-
OpC
o Sy
stem
(exc
lude
s E
AI)
4-O
pCo
Syst
em(e
xclu
des
EA
I & E
MI)
Attachment 2 Docket R-30021 Page 38 of 40
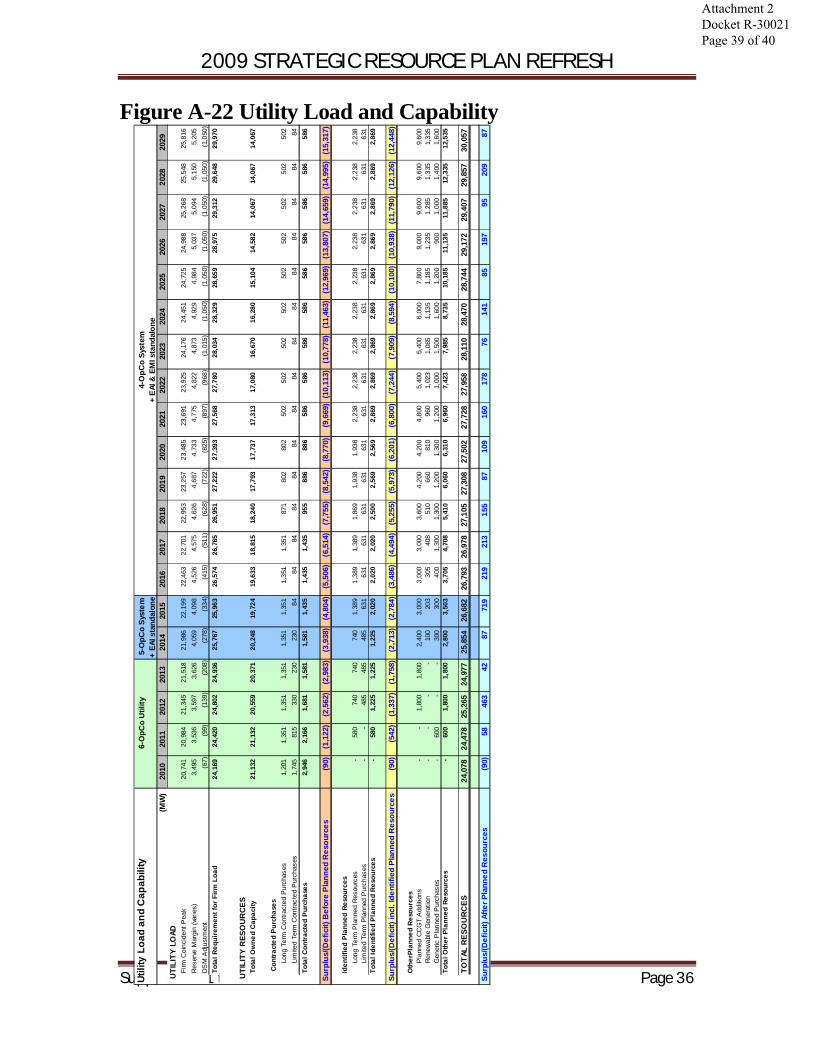
2009 STRATEGIC RESOURCE PLAN REFRESH
Supplement 1 to the 2009 SRP Page 36
Figure A-22 Utility Load and Capability
Utili
ty L
oad
and
Cap
abili
ty
(MW
)
2010
2011
2012
2013
2014
2015
2016
2017
2018
2019
2020
2021
2022
2023
2024
2025
2026
2027
2028
2029
UTI
LITY
LO
ADFi
rm C
oinc
iden
t Pea
k20
,741
20
,984
21
,345
21
,518
21
,986
22
,199
22
,463
22
,701
22
,953
23
,257
23
,485
23
,691
23,9
25
24
,176
24,4
51
24
,725
24,9
88
25
,268
25,5
48
25
,816
Rese
rve
Mar
gin
(var
ies)
3,49
5
3,
536
3,59
7
3,
626
4,05
9
4,
098
4,52
6
4,
575
4,62
6
4,
687
4,73
3
4,
775
4,82
2
4,
873
4,92
9
4,
984
5,03
7
5,
094
5,15
0
5,
205
DSM
Adj
ustm
ent
(67)
(9
9)
(139
)
(208
)
(278
)
(334
)
(4
15)
(511
)
(6
28)
(722
)
(8
25)
(897
)
(968
)
(1,0
15)
(1,0
50)
(1,0
50)
(1,0
50)
(1,0
50)
(1,0
50)
(1,0
50)
Tota
l Req
uire
men
t for
Firm
Loa
d24
,169
24
,420
24
,802
24
,936
25
,767
25
,963
26
,574
26
,765
26
,951
27
,222
27
,393
27
,568
27,7
80
28
,034
28,3
29
28
,659
28,9
75
29
,312
29,6
48
29
,970
UTI
LITY
RES
OU
RC
ESTo
tal O
wne
d C
apac
ity21
,132
21
,132
20
,559
20
,371
20
,248
19
,724
19
,633
18
,815
18
,240
17
,793
17
,737
17
,313
17,0
80
16
,670
16,2
80
15
,104
14,5
82
14
,067
14,0
67
14
,067
Con
trac
ted
Pur
chas
esLo
ng T
erm
Con
tract
ed P
urch
ases
1,20
1
1,
351
1,35
1
1,
351
1,35
1
1,
351
1,35
1
1,
351
871
80
2
802
50
2
502
50
2
502
50
2
502
50
2
502
50
2
Lim
ited
Term
Con
tract
ed P
urch
ases
1,74
5
81
5
330
23
0
230
84
84
84
84
84
84
84
84
84
84
84
84
84
84
84
Tota
l Con
trac
ted
Pur
chas
es2,
946
2,16
6
1,
681
1,58
1
1,
581
1,43
5
1,
435
1,43
5
95
5
886
88
6
586
58
6
586
58
6
586
58
6
586
58
6
586
Sur
plus
/(Def
icit)
Bef
ore
Pla
nned
Res
ourc
es(9
0)
(1,1
22)
(2
,562
)
(2,9
83)
(3
,938
)
(4,8
04)
(5
,506
)
(6,5
14)
(7
,755
)
(8,5
42)
(8
,770
)
(9,6
69)
(1
0,11
3)
(10,
778)
(1
1,46
3)
(12,
969)
(1
3,80
7)
(14,
659)
(1
4,99
5)
(15,
317)
Iden
tifie
d P
lann
ed R
esou
rces
Long
Ter
m P
lann
ed R
esou
rces
-
58
0
740
74
0
740
1,
389
1,38
9
1,
389
1,86
9
1,
938
1,93
8
2,
238
2,23
8
2,
238
2,23
8
2,
238
2,23
8
2,
238
2,23
8
2,
238
Lim
ited
Term
Pla
nned
Pur
chas
es-
-
48
5
485
48
5
631
63
1
631
63
1
631
63
1
631
63
1
631
63
1
631
63
1
631
63
1
631
To
tal I
dent
ified
Pla
nned
Res
ourc
es-
580
1,
225
1,22
5
1,
225
2,02
0
2,
020
2,02
0
2,
500
2,56
9
2,
569
2,86
9
2,
869
2,86
9
2,
869
2,86
9
2,
869
2,86
9
2,
869
2,86
9
Sur
plus
/(Def
icit)
incl
. Ide
ntifi
ed P
lann
ed R
esou
rces
(90)
(5
42)
(1,3
37)
(1
,758
)
(2,7
13)
(2
,784
)
(3,4
86)
(4
,494
)
(5,2
55)
(5
,973
)
(6,2
01)
(6
,800
)
(7,2
44)
(7
,909
)
(8,5
94)
(1
0,10
0)
(10,
938)
(1
1,79
0)
(12,
126)
(1
2,44
8)
Oth
erPl
anne
d R
esou
rces
Plan
ned
CCG
T A
dditi
ons
-
-
1,80
0
1,
800
2,40
0
3,
000
3,00
0
3,
000
3,60
0
4,
200
4,20
0
4,
800
5,40
0
5,
400
6,00
0
7,
800
9,00
0
9,
600
9,60
0
9,
600
Rene
wab
le G
ener
atio
n-
-
-
-
10
0
203
30
5
408
51
0
660
81
0
960
1,
023
1,08
5
1,
135
1,18
5
1,
235
1,28
5
1,
335
1,33
5
G
ener
ic P
lann
ed P
urch
ases
-
60
0
-
-
300
30
0
400
1,
300
1,30
0
1,
200
1,30
0
1,
200
1,00
0
1,
500
1,60
0
1,
200
900
1,
000
1,40
0
1,
600
Tota
l Oth
er P
lann
ed R
esou
rces
-
60
0
1,80
0
1,
800
2,80
0
3,
503
3,70
5
4,
708
5,41
0
6,
060
6,31
0
6,
960
7,42
3
7,
985
8,73
5
10
,185
11,1
35
11
,885
12,3
35
12
,535
TOTA
L R
ESO
UR
CE
S24
,078
24
,478
25
,265
24
,977
25
,854
26
,682
26
,793
26
,978
27
,105
27
,308
27
,502
27
,728
27
,958
28
,110
28
,470
28
,744
29
,172
29
,407
29
,857
30
,057
Sur
plus
/(Def
icit)
Afte
r Pla
nned
Res
ourc
es(9
0)
58
463
42
87
719
219
213
155
87
109
160
17
8
76
14
1
85
19
7
95
20
9
87
6-O
pCo
Util
ity5-
OpC
o Sy
stem
+ EA
I sta
ndal
one
4-O
pCo
Syst
em+
EAI
& E
MI s
tand
alon
e
Attachment 2 Docket R-30021 Page 39 of 40
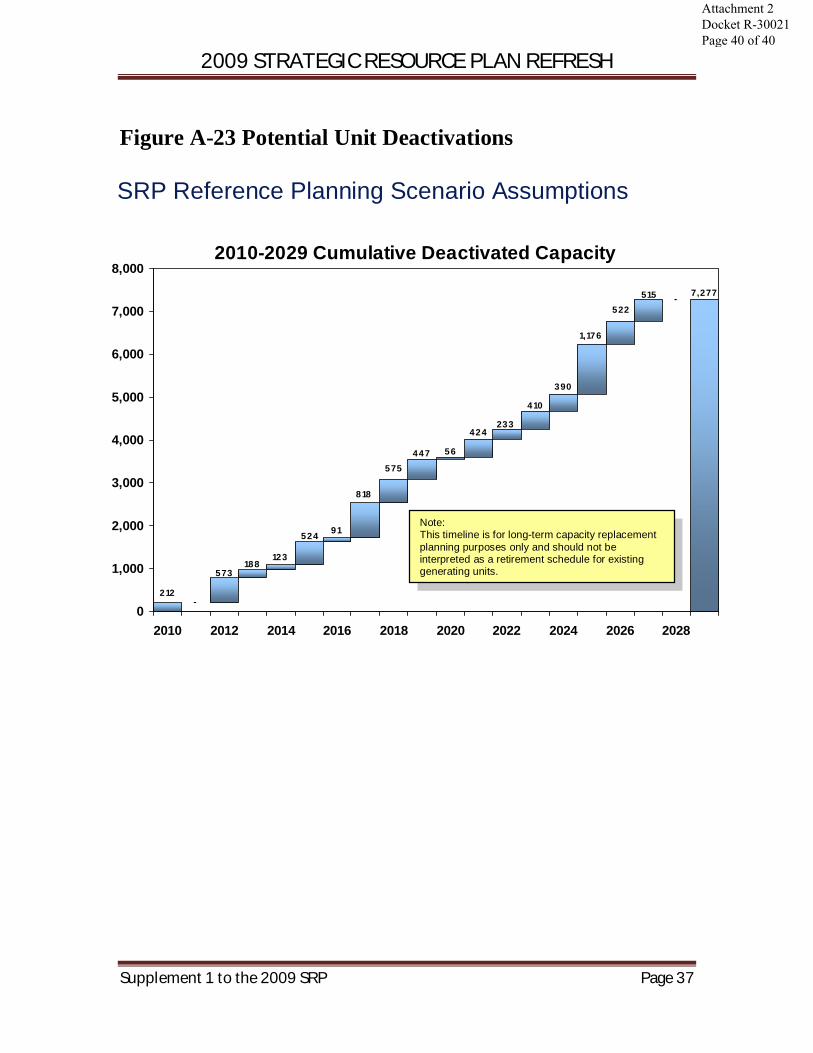
2009 STRATEGIC RESOURCE PLAN REFRESH
Supplement 1 to the 2009 SRP Page 37
Figure A-23 Potential Unit Deactivations
2010-2029 Cumulative Deactivated Capacity
7,277515 -
- 212
573188
123
524
818
575447
424233
410
390
1,176
522
91
56
0
1,000
2,000
3,000
4,000
5,000
6,000
7,000
8,000
2010 2012 2014 2016 2018 2020 2022 2024 2026 2028
Note: This timeline is for long-term capacity replacement planning purposes only and should not be interpreted as a retirement schedule for existing generating units.
SRP Reference Planning Scenario Assumptions
Attachment 2 Docket R-30021 Page 40 of 40
ELL- 1
..........
Entergy Louisiana, LLC An Integrated Resource Plan (2009 – 2028)
Scope and Structure
This document describes Entergy Louisiana, LLC’s (“ELL”) long-term integrated resource plan (“IRP”)1 for the period 2009 – 2028. The IRP represents a component of the Entergy System’s Strategic Resource Plan (“SRP”) for the same period. The SRP for the Entergy System as a whole is described in a separate document; the underlying modeling constructs and assumptions are presented in the documentation associated with the SRP.
For well over the past half century, ELL has planned and operated as part of a larger integrated system – the Entergy System.2 Entergy Arkansas Inc. (“EAI”) and Entergy Mississippi Inc. (“EMI”) have provided notice that as of December 2013 and November 2015, respectively, they will withdraw from the Entergy System Agreement. That means that, for the time being, ELL will be planned and operated under the terms of a 5-company System Agreement as of 2014 (excluding EAI), and a 4-company System Agreement as of 2016 (excluding EMI). The future is uncertain. The future Entergy System may or may not include EAI and EMI, depending on whether a successor System Agreement is realized. Excluding EAI and EMI from the larger integrated system will result in higher resource requirements for the remaining four Operating Companies, including ELL. The IRP assumes, as a base planning assumption, that EAI and EMI will terminate participation in the System Agreement by December 2013 and November 2015, respectively. Accordingly, the IRP results in a plan that positions ELL for reliable and
1 Throughout this document, unless otherwise noted, the term “IRP” refers to the IRP for ELL which is a component of the Strategic Resource Plan for the Entergy System and the Entergy Operating Companies. 2 The Entergy Operating Companies are planned and operated as a single, integrated electric system, pursuant to the Entergy System Agreement. The six Entergy Operating Companies include Entergy Arkansas, Inc. (“EAI”), Entergy Gulf States Louisiana, LLC (“EGSL”), Entergy Louisiana, LLC (“ELL”), Entergy Mississippi, Inc. (“EMI”), Entergy New Orleans, Inc. (“ENO”), and Entergy Texas, Inc. (“ETI”). The electric generation and bulk transmission facilities of these Operating Companies are planned and operated on an integrated, coordinated basis as a single electric system pursuant to the terms and conditions of the Entergy System Agreement and are referred to collectively as the “Entergy System” or the “System.”
Attachment 3 Docket R-30021 Page 1 of 28
ELL-2
economic operations as part of the 5-company and eventually 4-company Entergy System.
With the exit of EAI and EMI from the Entergy System Agreement, the 4-company System will face new resource planning challenges. In addition to the challenges posed by potential national and state initiatives to address greenhouse gas emissions (including renewable portfolio standards (“RPS”), demand-side management (“DSM”) and smart grid evolution, and new cap and trade programs limiting CO2 emissions), unprecedented volatility in natural gas prices, and the aging generating fleet, the 4-company System also must address replacement capacity once EAI and EMI withdraw from the Entergy System Agreement.
The IRP assumes, as a base planning assumption, that EAI and EMI will exit the Entergy System Agreement and the four remaining Operating Companies will be planned and operated as an integrated 4-company System. The IRP includes capacity expansion scenarios that provide guidance regarding future resource needs and additions. It is not possible at this time to predict the outcome of uncertainties surrounding load growth, new nuclear resources, solid fuel resources, renewable portfolio standards, and the aging generating fleet. However, this plan results in adequate resources to meet the 4-company System needs under the current assumptions.
With that background, this IRP presents ELL’s perspective on its:
� resource requirements over the next 20 years;
� current resource portfolio;
� Reference Planning Scenario for meeting long-term needs with a combination of Demand-Side Management and traditional and renewable generating units; and
� plans for addressing uncertainties including several alternative planning scenarios.
Regulatory Context for ELL’s Integrated Resource Planning
The Louisiana Public Service Commission (“LPSC”) has opened a docket investigating the potential for implementing an IRP process. However, the docket is currently inactive pending resolution of a separate re-evaluation of a new RPS for Louisiana.
Attachment 3 Docket R-30021 Page 2 of 28
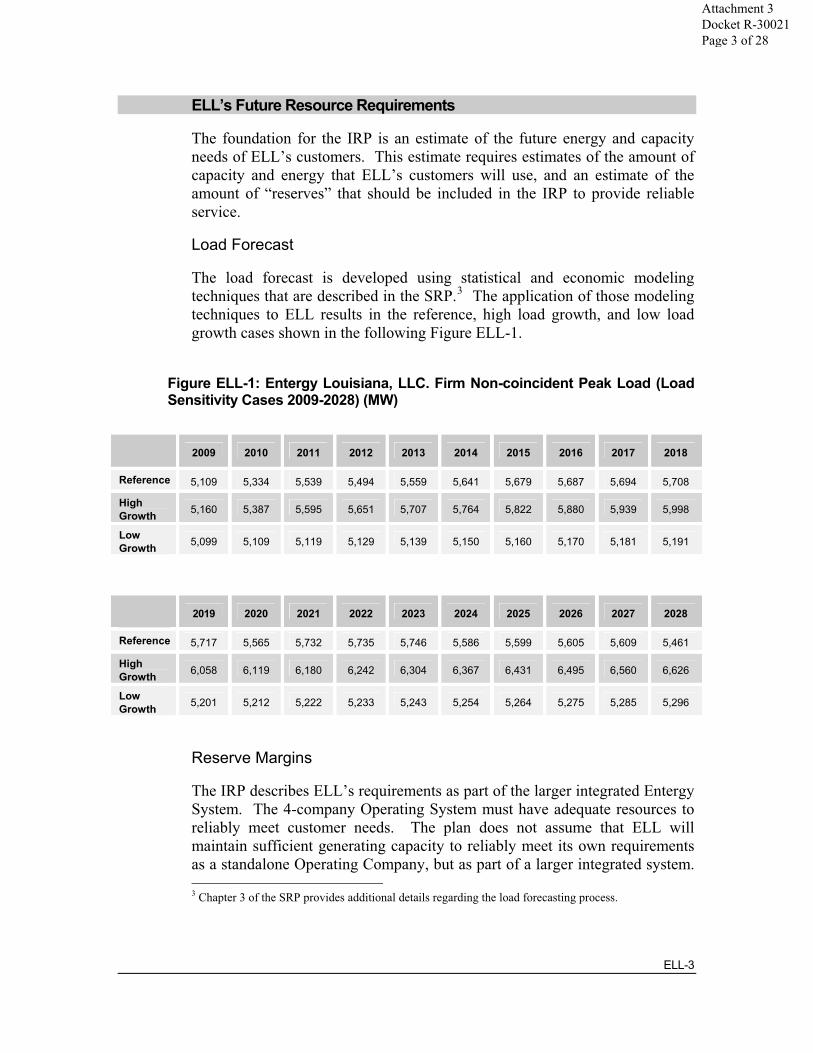
ELL-3
ELL’s Future Resource Requirements
The foundation for the IRP is an estimate of the future energy and capacity needs of ELL’s customers. This estimate requires estimates of the amount of capacity and energy that ELL’s customers will use, and an estimate of the amount of “reserves” that should be included in the IRP to provide reliable service.
Load Forecast
The load forecast is developed using statistical and economic modeling techniques that are described in the SRP.3 The application of those modeling techniques to ELL results in the reference, high load growth, and low load growth cases shown in the following Figure ELL-1.
Figure ELL-1: Entergy Louisiana, LLC. Firm Non-coincident Peak Load (Load Sensitivity Cases 2009-2028) (MW)
2009 2010 2011 2012 2013 2014 2015 2016 2017 2018
Reference 5,109 5,334 5,539 5,494 5,559 5,641 5,679 5,687 5,694 5,708
HighGrowth 5,160 5,387 5,595 5,651 5,707 5,764 5,822 5,880 5,939 5,998
Low Growth 5,099 5,109 5,119 5,129 5,139 5,150 5,160 5,170 5,181 5,191
2019 2020 2021 2022 2023 2024 2025 2026 2027 2028
Reference 5,717 5,565 5,732 5,735 5,746 5,586 5,599 5,605 5,609 5,461
HighGrowth 6,058 6,119 6,180 6,242 6,304 6,367 6,431 6,495 6,560 6,626
Low Growth 5,201 5,212 5,222 5,233 5,243 5,254 5,264 5,275 5,285 5,296
Reserve Margins
The IRP describes ELL’s requirements as part of the larger integrated Entergy System. The 4-company Operating System must have adequate resources to reliably meet customer needs. The plan does not assume that ELL will maintain sufficient generating capacity to reliably meet its own requirements as a standalone Operating Company, but as part of a larger integrated system. 3 Chapter 3 of the SRP provides additional details regarding the load forecasting process.
Attachment 3 Docket R-30021 Page 3 of 28
ELL-4
This ability is measured in terms of peak load plus an adequate provision for planning reserves. Peak load (shown in Figure ELL-1) refers to the level of highest customer demand during the year. If resources are sufficient to meet peak demand, resources should be sufficient to meet demand throughout the remainder of the year.
Both customer demand and the availability of resources within the portfolio to meet demand are matters of uncertainty. Unknown events such as an unusually hot summer or an unplanned outage of a generating unit can create situations in which the System’s ability to meet the experienced peak load is challenged. To protect against the consequences of such unknown events the IRP – consistent with good utility practice – provides for an additional amount of resources above projected peak demand, referred to as the planning reserve margin. The planning reserve margin may be expressed as a MW amount or as a percentage of the peak load.
A number of factors influence the level of planning reserves that are required to provide reliability. One of the most important variables is the size of the generating units within the portfolio in relation to peak load. Relying on large generating stations involves greater risk because an outage at a single unit has more significant consequences. Therefore, the larger the generating units within the portfolio in relation to peak load the greater the planning reserve margin that is required.
This relationship has consequences for the level of planning reserves that will be required in light of EAI and EMI exiting the System Agreement. In recent years the System has planned for about a 17% reserve margin. This target was developed using a technique known as a Loss of Load Probability (“LOLP”) assessment. The LOLP technique is widely used throughout the industry for determining reserve margins. LOLP assesses the probability that resources will be adequate to meet load in light of uncertainties regarding customer load variability and of unit outages. Results of the LOLP assessment indicated that a 17% reserve margin provided sufficient capacity to serve load for all but one day in ten years, also a traditional measure of reliability used within the industry.
However, the loss of EAI and EMI would result in a smaller electric system. At the same time, the size of the four remaining Operating Companies’ generating units would not change. Because the size of the generating units as compared to the peak load increases, the LOLP assessment indicates a need for additional planning reserves for the 4-company System to achieve the same level of reliability. The results of the LOLP calculations indicate much higher reserve requirements for a 4-company System.
Attachment 3 Docket R-30021 Page 4 of 28

ELL-5
In determining the target planning reserve margins, the IRP considered the following:
� The actual operating configuration of the 5-company System and 4-company System, after EAI and EMI exit the System Agreement, is uncertain.
� A number of actions may be available to mitigate risk and lower required reserve margins after the exit of EAI and EMI including possible reserve sharing arrangements.
In recognition of these factors, the IRP sought to determine a level of target planning reserves that balanced the objective of providing adequate resources to maintain reliability while avoiding commitment to long-term resources that may ultimately prove to be unnecessary. Accordingly, the IRP established the planning reserve margins for the 5-company System and the 4-company System based on the loss of the single largest generating unit. This analysis yields a planning reserve margin of 18% for the 5-company System (2014 – 2015) and 20% for the 4-company System (2016 and beyond).
For operating companies planned and dispatched within the integrated system, a 10% reserve margin is used for each company. The 10% planning reserve margin ensures that each Operating Company provides a proportionate share of the resources that are expected to be used for overall System reliability and coordinated dispatch. The 10% reserve margin represents a guideline used solely for the purposes of Operating Company Portfolio Planning within the context of operation within the System.
Other Uncertainties
In addition to load, a number of uncertainties will affect long-term resource requirements and the alternatives available to meet those needs.
CarbonThe issue of potential climate change associated with atmospheric greenhouse gases has received growing attention among the scientific community, in the media, and with governmental policy makers. A number of bills proposing to regulate carbon emissions have been proposed in the United States Congress. It is not possible to predict whether CO2 legislation will eventually be enacted, and if so, when it would become effective or what form it would take. However, any form of CO2 legislation would likely result in higher cost of electric generation because emissions from power plants are a major source of carbon, primarily in the form of CO2. Moreover, because alternative technologies emit different levels of CO2 per MWh of generation, CO2legislation would likely have an effect on the relative economics of supply
Attachment 3 Docket R-30021 Page 5 of 28
ELL-6
alternatives. Consequently, assumptions regarding potential CO2 cost represent a key input in the 2009 SRP Update.
In order to consider the effects of carbon uncertainty on resource choice and portfolio design, the 2009 SRP Update relies on a range of projected CO2 cost outcomes. The Reference Case assumes a 2013 nominal CO2 emission price target of $15 per ton with straight line interpolation to a 2020 nominal CO2emission price target of $50 per ton. By 2028, under the Reference Case, the nominal CO2 emission price target may be $58.58 per ton.
Renewable Portfolio Standards There is growing discussion regarding the potential implementation of a Renewable Portfolio Standard (“RPS”) (also sometimes known as a “Renewable Energy Standard”) either at the federal or state level. Several bills have been proposed in the U.S. Congress that would establish various targets for renewable generation and differing levels of compliance cost. If enacted, a federal RPS likely will result in higher cost for customers. Renewable generation alternatives generally are more costly than conventional generation alternatives.
FuelLong-term natural gas price levels remain uncertain. A wide range of factors may affect natural gas price levels and volatility in the future. Natural gas prices are expected to vary between $6.04 in 2009 (nominal $/MMBtu) to $10.06 in 2020 (nominal $/MMBtu), based on the Reference Case.
Current Resource Portfolio
The ultimate objective of an IRP is to inform the decisions that must be made in the course of the development of a future resource portfolio. The need to acquire future resources is not determined just by an estimate of future resource requirements. After there is an estimate of the level of resources that will be needed in the future, the next step in the development of an IRP is an assessment of the current portfolio of resources. This assessment should consider the amount, type, and age of the existing fleet. Then, current resources can be compared to future requirements to develop expectations regarding the need for additional resource acquisitions in the future.
Figure ELL-2 lists the resources in ELL’s current resource portfolio. Figures ELL-3 and ELL-4 characterize the portfolio mix based on the attributes of fuel and resource age. These figures illustrate a few key points:
Attachment 3 Docket R-30021 Page 6 of 28
ELL-7
� ELL’s existing portfolio of generating units has a total combined capability of 6,370 MW including 20 units at 12 sites.
� The resource mix includes a significant amount element of nuclear capacity (1,600 MW) representing 25% on a capacity basis.
� The portfolio includes only 259 MW of modern gas-fired combined cycle combustion turbine (“CCGT”) capacity, including ELL’s allocation of the Perryville facility (134 MW) and a long-term PPA with Occidental Chemical associated with the output of Occidental’s Taft facility (125 MW).4
4 The Taft-Occidental contract is divided into three components: 295 MW is considered baseload capacity, 125 MW is considered CCGT capacity, and 60 MW is considered peaking
Attachment 3 Docket R-30021 Page 7 of 28
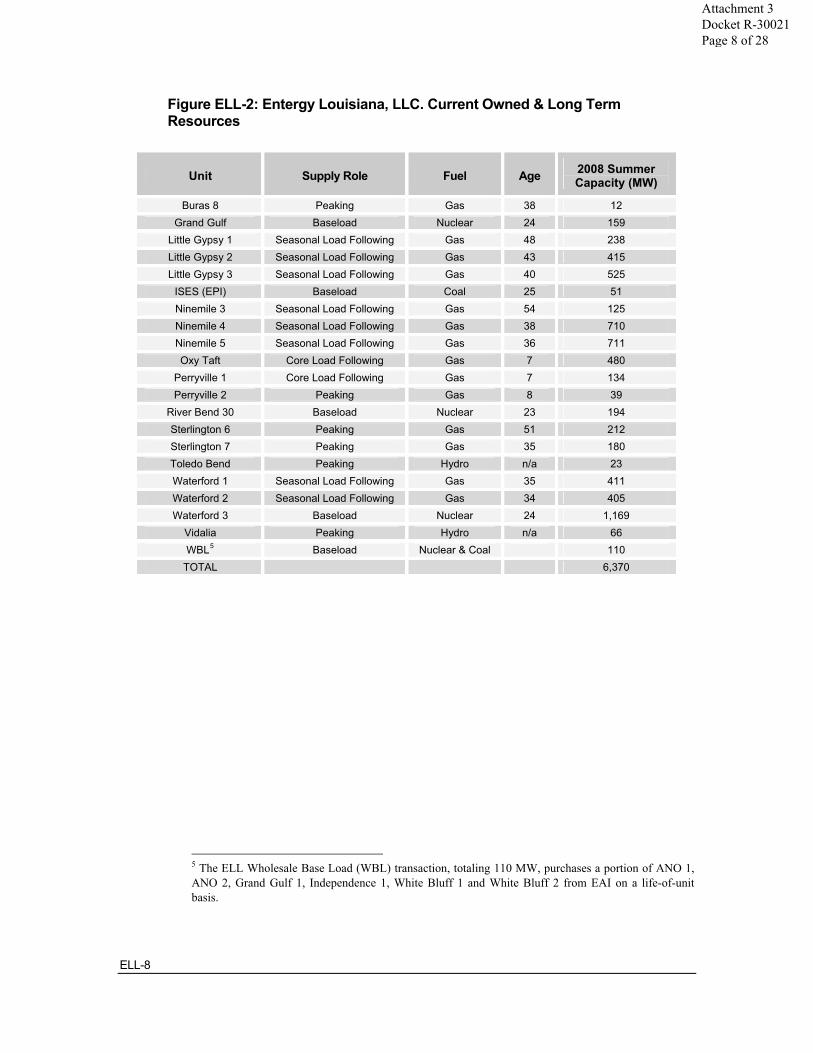
ELL-8
Figure ELL-2: Entergy Louisiana, LLC. Current Owned & Long Term Resources
Unit Supply Role Fuel Age 2008 Summer Capacity (MW)
Buras 8 Peaking Gas 38 12Grand Gulf Baseload Nuclear 24 159
Little Gypsy 1 Seasonal Load Following Gas 48 238Little Gypsy 2 Seasonal Load Following Gas 43 415Little Gypsy 3 Seasonal Load Following Gas 40 525
ISES (EPI) Baseload Coal 25 51Ninemile 3 Seasonal Load Following Gas 54 125Ninemile 4 Seasonal Load Following Gas 38 710Ninemile 5 Seasonal Load Following Gas 36 711Oxy Taft Core Load Following Gas 7 480
Perryville 1 Core Load Following Gas 7 134Perryville 2 Peaking Gas 8 39
River Bend 30 Baseload Nuclear 23 194Sterlington 6 Peaking Gas 51 212Sterlington 7 Peaking Gas 35 180Toledo Bend Peaking Hydro n/a 23Waterford 1 Seasonal Load Following Gas 35 411Waterford 2 Seasonal Load Following Gas 34 405Waterford 3 Baseload Nuclear 24 1,169
Vidalia Peaking Hydro n/a 66WBL5
Baseload Nuclear & Coal 110TOTAL 6,370
5 The ELL Wholesale Base Load (WBL) transaction, totaling 110 MW, purchases a portion of ANO 1, ANO 2, Grand Gulf 1, Independence 1, White Bluff 1 and White Bluff 2 from EAI on a life-of-unit basis.
Attachment 3 Docket R-30021 Page 8 of 28
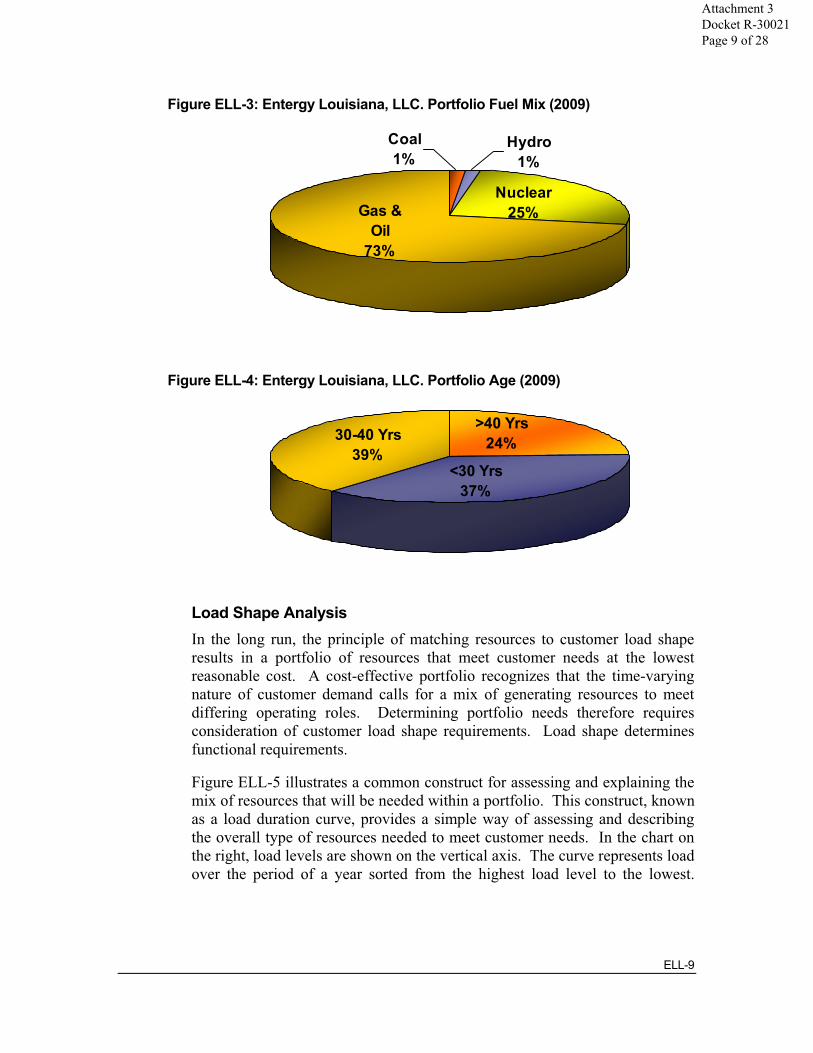
ELL-9
Figure ELL-3: Entergy Louisiana, LLC. Portfolio Fuel Mix (2009)
Figure ELL-4: Entergy Louisiana, LLC. Portfolio Age (2009)
Load Shape Analysis In the long run, the principle of matching resources to customer load shape results in a portfolio of resources that meet customer needs at the lowest reasonable cost. A cost-effective portfolio recognizes that the time-varying nature of customer demand calls for a mix of generating resources to meet differing operating roles. Determining portfolio needs therefore requires consideration of customer load shape requirements. Load shape determines functional requirements.
Figure ELL-5 illustrates a common construct for assessing and explaining the mix of resources that will be needed within a portfolio. This construct, known as a load duration curve, provides a simple way of assessing and describing the overall type of resources needed to meet customer needs. In the chart on the right, load levels are shown on the vertical axis. The curve represents load over the period of a year sorted from the highest load level to the lowest.
Nuclear25%Gas &
Oil73%
Coal1%
Hydro1%
>40 Yrs24%
<30 Yrs37%
30-40 Yrs39%
Attachment 3 Docket R-30021 Page 9 of 28
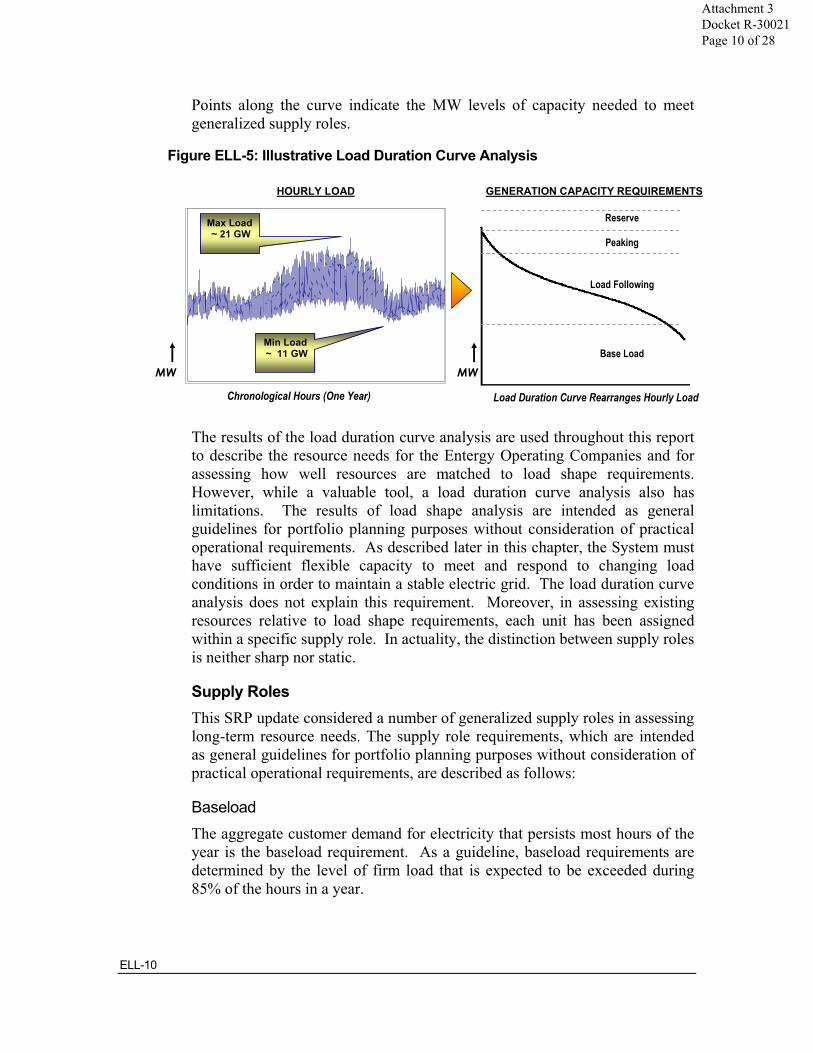
ELL-10
Points along the curve indicate the MW levels of capacity needed to meet generalized supply roles.
Figure ELL-5: Illustrative Load Duration Curve Analysis
The results of the load duration curve analysis are used throughout this report to describe the resource needs for the Entergy Operating Companies and for assessing how well resources are matched to load shape requirements. However, while a valuable tool, a load duration curve analysis also has limitations. The results of load shape analysis are intended as general guidelines for portfolio planning purposes without consideration of practical operational requirements. As described later in this chapter, the System must have sufficient flexible capacity to meet and respond to changing load conditions in order to maintain a stable electric grid. The load duration curve analysis does not explain this requirement. Moreover, in assessing existing resources relative to load shape requirements, each unit has been assigned within a specific supply role. In actuality, the distinction between supply roles is neither sharp nor static.
Supply Roles This SRP update considered a number of generalized supply roles in assessing long-term resource needs. The supply role requirements, which are intended as general guidelines for portfolio planning purposes without consideration of practical operational requirements, are described as follows:
BaseloadThe aggregate customer demand for electricity that persists most hours of the year is the baseload requirement. As a guideline, baseload requirements are determined by the level of firm load that is expected to be exceeded during 85% of the hours in a year.
Chronological Hours (One Year)
HOURLY LOAD
Max Load~ 21 GW
Min Load~ 11 GW
GENERATION CAPACITY REQUIREMENTS
Load Duration Curve Rearranges Hourly Load
MW
Reserve
Base Load
Load Following
Peaking
MW
Attachment 3 Docket R-30021 Page 10 of 28

Core Load Following The aggregate customer demand for electricity that is greater than baseload requirement, but less than seasonal load following requirement. As a guideline, core load following requirements are determined by the level of firm load expected to be exceeded during 30% of the hours in a year.
Seasonal Load Following The aggregate customer demand for electricity that is greater than core load following requirement, but less than peaking requirement. As a guideline, seasonal dispatch requirements are determined to be the level of firm load that is expected to be exceeded during 15% of the hours in a year.
PeakingThe aggregate customer demand for electricity that is greater than seasonal load following requirement, but less than reserve requirement.
ReserveThe target reserve margin, as described earlier, to maintain reliability by protecting against the consequence of potential unknown events.
Consistent with the identified supply role requirements, resource alternatives appropriate for serving each supply role can be identified. Each resource alternative has its own unique cost and performance characteristics that allow it to be functionally and economically suited to serving certain supply roles.
Figure ELL-6: Entergy Louisiana, LLC. 2009 Summary of Capacity Position by Supply Role (MW)
ELL-11
0
1,000
2,000
3,000
4,000
5,000
6,000
7,000
Requirements Difference Capability
Peaking / Reserve >
< Reserve
Nuclear & Coal >< Base Load
< Core LF
< Seasonal LF
< Peaking
CCGT >
Seasonal LF >
0
1,000
2,000
3,000
4,000
5,000
6,000
7,000
Requirements Difference Capability
Peaking / Reserve >
< Reserve
Nuclear & Coal >< Base Load
< Core LF
< Seasonal LF
< Peaking
CCGT >
Seasonal LF >
Attachment 3 Docket R-30021 Page 11 of 28

ELL-12
The results of the analysis presented in Figure ELL-6 comparing ELL’s resource needs with its current portfolio of long-term resources indicate the following key points:
� ELL’s current portfolio of nuclear and coal capacity is “short” of its base load requirements by 838 MW.
� ELL’s current portfolio includes only 259 MW of modern gas-fired combined cycle combustion turbine (“CCGT”) capacity, Perryville (134 MW) and Oxy-Taft (125 MW)6. Modern gas-fired CCGT resources are the technology of choice to meet incremental load following needs.7 Consequently, incremental long-term resource additions can be expected to be weighted toward gas-fired CCGT resources.
� ELL’s current portfolio is heavily weighted toward seasonal load following resources. The amount of gas fired capacity in the portfolio exceeds current seasonal load following needs.
� ELL’s current portfolio of long-term resources currently meets planning reserve margin, and, in fact is “long” by about 750 MW, based on a 10% reserve margin.8 This surplus, however, will decrease due to load growth and potential unit deactivations.
ChallengesELL’s resource portfolio faces a number of challenges.
Potential Unit Deactivations ELL’s current portfolio of long-term resources may potentially have 1,040 MW of resources deactivate over the planning horizon. Additional capacity must be added to replace the attrition of existing capacity.
Age of Existing Resources The existing portfolio of long-term resources includes a number of gas-fired resources that are in excess of 35 years of age. In and of itself, the age of a generating unit is not the determinant as to whether any specific unit should be deactivated or retired. The ability of a generating unit to continue to 6 The Taft-Occidental contract is divided into three components: 295 MW is considered baseload capacity, 125 MW is considered CCGT capacity, and 60 MW is considered peaking 7 This is explained in detail in Chapter 10 (Generation Technologies) of the SRP. 8 The 10% reserve margin represents a guideline used solely for the purposes of Operating Company Portfolio Planning within the context of operation within the System. This guideline does not represent the reserve margin requirements for the System and standalone Operating Companies.
Attachment 3 Docket R-30021 Page 12 of 28
ELL-13
provide economic and reliable service is a function of capital expenditures, service role, and general condition. However, experience indicates that at some point it is likely that it will be more economic to replace existing capacity rather than to continue to incur capital and operating and maintenance expenses.
Baseload and Core Load-following Needs ELL’s portfolio lacks sufficient base load and modern gas-fired CCGT capacity. System resources must support ELL’s base load and core load following requirements.
Reference Planning Scenario
There are a myriad of uncertainties affecting future resource needs and alternatives available to meet those needs. However, a Reference Planning Scenario has been developed for ELL which charts a course through a reasonable set of assumptions, and results in a plan that satisfies the planning objectives while providing the flexibility to respond to changing conditions. The Reference Planning Scenario is a reference point that can be used to evaluate a variety of future outcomes, but the outcome of a wide number of uncertainties will affect customer needs and the best portfolio choices to meet those needs over the next two decades.
This section describes the Reference Planning Scenario, by discussing:
� Portfolio assumptions;
� Recommendations regarding strategic direction; and
� Plans for addressing uncertainties (including several alternative planning scenarios)
The Reference Planning Scenario describes a portfolio of resources to meet ELL customer needs for the next 20 years. The Reference Planning Scenario:
� Balances the supply objectives of reliability, cost minimization, and risk mitigation;
� Accomplishes these planning objectives while considering utilization of natural resources and effects on the environment;
� Outlines a disciplined approach to resource additions while allowing the flexibility to respond to changing circumstances;
� Meets the bulk of reliability needs through long-term resources (owned or power purchase contracts);
Attachment 3 Docket R-30021 Page 13 of 28
ELL-14
� Includes the addition of gas-fired CCGT resources to meet load-following needs and overall reliability requirements;
� Includes the addition of reasonable levels of renewable generation and DSM to address fuel diversity and to meet overall capacity needs.
Reference Planning Scenario Assumptions The Reference Planning Scenario assumes that incremental resource needs will be met primarily by gas-fired CCGT resources coupled with economically attractive levels of renewable generation and DSM consistent with regulatory mandates and appropriate cost recovery mechanisms. Specific portfolio assumptions include the following:
� 1,000 MW of existing gas-fired steam capacity is deactivated.
� 800 MW of gas-fired CCGT resources are added.
� 500 MW of renewable generation resources are added between 2014 and 2028, representing a level of economically attractive renewable generation that is realistically achievable given current cost estimates. Entergy Services, Inc. conducted a Request for Information (“RFI”) relating to renewable generation and, depending on federal and/or state RPS activity, may conduct a Request for Proposals for renewable generation within the next year. The results of those initiatives will inform future planning efforts and will result in appropriate adjustments to the levels of renewable generation included in future SRP Updates.
� The continued operation of all existing coal-fired capacity throughout the planning horizon.
� The continued operation of all existing nuclear facilities throughout the planning horizon.
� The addition of 22 MW (160 MW Utility total) of nuclear capacity through an uprate at the Grand Gulf Nuclear Station in 2012 and 25 MW (125 MW Utility total) of nuclear capacity through an uprate at the River Bend Station in 2015. However, there have been no final decisions to implement the uprates. If the projects prove to be uneconomic or technically unfeasible, this capacity would be replaced with additional CCGT resources.
� No new solid fuel or nuclear facilities additions (other than the uprates previously discussed) over the following 20 years. Potential new nuclear capacity is addressed among the alternative planning scenarios.
Attachment 3 Docket R-30021 Page 14 of 28
ELL-15
Strategic Recommendations The Reference Planning Scenario incorporates the following strategic recommendations:
� Focus on gas-fired CCGT capacity as the basic building block of the portfolio.
� Pursue reasonable levels of economically attractive renewable generation. The levels and type of renewable generation actually deployed will depend on evolving mandates and an on-going assessment of cost and availability, including market tests with suppliers. The Reference Planning Scenario indicates that:
� Near-term renewable resource additions are anticipated to be primarily biomass.
� 50 MW of renewable capacity (700 MW for all six of the Operating Companies) may be added to ELL’s portfolio over the first 10 years.
� Continue to monitor the costs and benefits of new nuclear and solid fuel and propose specific plans to implement these options in the future if and when analyses results warrant. The Reference Planning Scenario does not reflect an expectation that any new nuclear or solid fuel resources will enter service over the 20 year planning horizon. However, it would be appropriate to maintain readiness of new nuclear through spending levels consistent with results of on-going assessment.
� Continue to develop long-term integrated planning efforts with Entergy Transmission to identify portfolio solutions that best balance planning objectives. Results of integrated supply and transmission planning efforts that are now allowed subsequent to FERC Order 717 may result in adjustments to the timing and location of resource needs.
� Pursue cost-effective DSM, consistent with the following discussion.
Demand Side Management Assumptions The Reference Planning Scenario assumes that, over the SRP planning horizon, ELL-sponsored DSM programs reduce peak load by 264 MW and reduce cumulative energy consumption by 740 GWh by 2028 at an eventual cost of $170 million (nominal $, cumulative). These results are consistent
Attachment 3 Docket R-30021 Page 15 of 28

ELL-16
with a detailed potential study recently prepared by ICF International, a leading consulting firm in the DSM community.9 The ICF International study found a potential of about 140 MW over first 10 years for ELL, adjusted for reasonable implementation and approval timeline.
Figure ELL-7: Entergy Louisiana, LLC. DSM Potential Assumption – Cumulative Non-Coincident Peak Demand Reduction (MW) and Energy Saved (GWh)
2009 2010 2011 2012 2013 2014 2015 2016 2017 2018
Demand Reduction 0 0 9 21 35 41 59 82 109 140
Energy Saved 0 0 33 76 132 183 246 320 403 498
2019 2020 2021 2022 2023 2024 2025 2026 2027 2028
Demand Reduction 175 214 238 264 264 264 264 264 264 264
Energy Saved 603 719 727 738 738 740 738 738 738 740
Barriers to DSM Implementation Traditional rate regulation presents several barriers or disincentives to electric utility investment in DSM resources. These include regulatory lag associated with recovering the incremental investment and expenses of programs, the lack of an opportunity to earn a comparable return on DSM programs as with other utility investments, and the loss of revenues that frequently accompanies DSM programs that reduce a utility’s contribution to its fixed costs. A regulatory framework that addresses these three elements will ultimately benefit all stakeholders and encourage utility support for the continued development and implementation of DSM programs and begin to position investments in DSM and supply side resources on an equivalent basis for the Company.
Regulatory Framework for Cost Recovery As ELL pursues cost-effective DSM as a means for meeting a portion of its future resource needs, the regulatory framework for treatment of DSM investments will need to be addressed. An equitable regulatory framework that addresses the removal of the disincentives for the implementation of DSM programs is a fundamental prerequisite to creating a successful DSM 9 The ICF, International study is discussed in detail in Chapter 9 of the SRP.
Attachment 3 Docket R-30021 Page 16 of 28
ELL-17
environment. The lack of necessary regulatory mechanisms means that DSM and supply-side resources are not on a level playing field. Appropriate mechanisms must be implemented to ensure that the benefits of DSM accrue to customers and that investors are adequately compensated for their investment. It is important to note that the LPSC has recently opened a new rulemaking docket to address energy efficiency. Based on recent comments of the LPSC Staff, it is anticipated that the energy efficiency rulemaking will begin in earnest during early 2010.
DSM is an important component of the resource planning process and requires that the Company properly assess the market achievable potential and make adjustments as needed due to changes in external market forces, changes to Operating Company schedules for implementing DSM programs as well as the advanced metering infrastructure (“AMI”) systems that enable demand response programs. Changes to these assumptions and others may result in the need to revise the overall DSM resource potential or the timing of when those resources may be available.
UncertaintyThe amount of market-achievable DSM potential that should be reflected in the 2009 SRP Update is subject to a variety of factors, many of which are highly uncertain. These DSM assumptions are not intended as definitive commitments to particular programs, program levels, or program timing. The level of DSM programs that will be implemented over the planning horizon will depend on a number of factors including:
� The level of DSM that the Operating Companies’ retail regulators agree should be deployed, and the implementation of appropriate regulatory review, approval, and cost recovery mechanisms to allow the Operating Companies a reasonable opportunity to recover the costs associated with those programs;
� The relative cost of DSM versus alternative supply-side options. Chapter 10 discusses the uncertainties that affect supply-side alternatives, both conventional and renewable alternatives. The cost and availability of supply-side alternatives are matters of uncertainty which could alter the relative attractiveness of DSM alternatives.
� Experience with the DSM programs. As DSM programs are implemented over time, ELL will be able to refine the estimates of market-achievable potential, the cost of implementing programs, and the speed at which programs can be deployed.
Attachment 3 Docket R-30021 Page 17 of 28
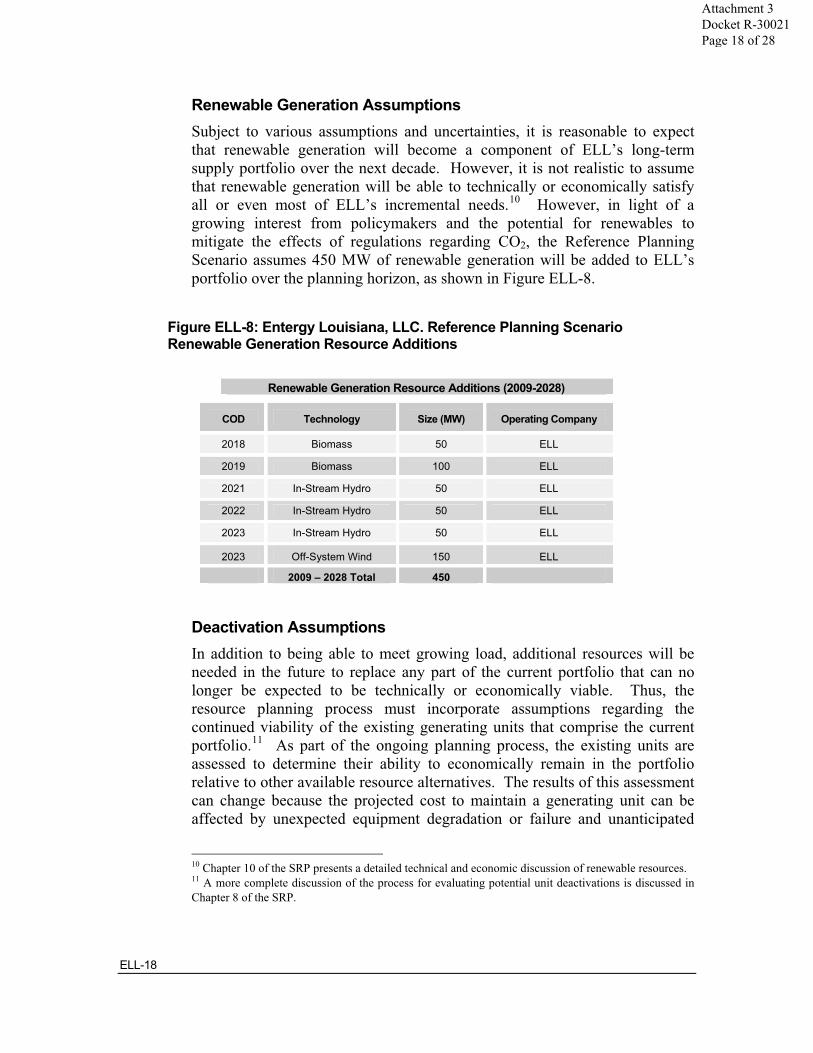
ELL-18
Renewable Generation Assumptions Subject to various assumptions and uncertainties, it is reasonable to expect that renewable generation will become a component of ELL’s long-term supply portfolio over the next decade. However, it is not realistic to assume that renewable generation will be able to technically or economically satisfy all or even most of ELL’s incremental needs.10 However, in light of a growing interest from policymakers and the potential for renewables to mitigate the effects of regulations regarding CO2, the Reference Planning Scenario assumes 450 MW of renewable generation will be added to ELL’s portfolio over the planning horizon, as shown in Figure ELL-8.
Figure ELL-8: Entergy Louisiana, LLC. Reference Planning Scenario Renewable Generation Resource Additions
Renewable Generation Resource Additions (2009-2028)
COD Technology Size (MW) Operating Company
2018 Biomass 50 ELL
2019 Biomass 100 ELL
2021 In-Stream Hydro 50 ELL
2022 In-Stream Hydro 50 ELL
2023 In-Stream Hydro 50 ELL
2023 Off-System Wind 150 ELL
2009 – 2028 Total 450
Deactivation Assumptions In addition to being able to meet growing load, additional resources will be needed in the future to replace any part of the current portfolio that can no longer be expected to be technically or economically viable. Thus, the resource planning process must incorporate assumptions regarding the continued viability of the existing generating units that comprise the current portfolio.11 As part of the ongoing planning process, the existing units are assessed to determine their ability to economically remain in the portfolio relative to other available resource alternatives. The results of this assessment can change because the projected cost to maintain a generating unit can be affected by unexpected equipment degradation or failure and unanticipated
10 Chapter 10 of the SRP presents a detailed technical and economic discussion of renewable resources. 11 A more complete discussion of the process for evaluating potential unit deactivations is discussed in Chapter 8 of the SRP.
Attachment 3 Docket R-30021 Page 18 of 28
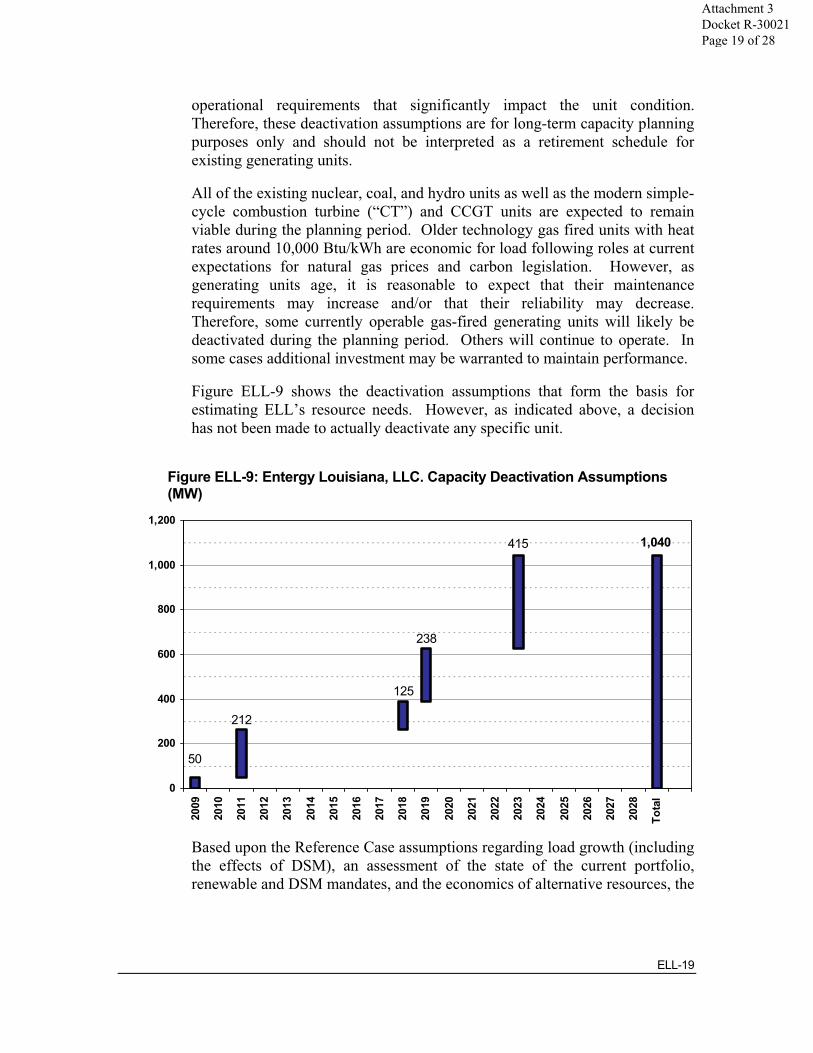
ELL-19
operational requirements that significantly impact the unit condition. Therefore, these deactivation assumptions are for long-term capacity planning purposes only and should not be interpreted as a retirement schedule for existing generating units.
All of the existing nuclear, coal, and hydro units as well as the modern simple-cycle combustion turbine (“CT”) and CCGT units are expected to remain viable during the planning period. Older technology gas fired units with heat rates around 10,000 Btu/kWh are economic for load following roles at current expectations for natural gas prices and carbon legislation. However, as generating units age, it is reasonable to expect that their maintenance requirements may increase and/or that their reliability may decrease. Therefore, some currently operable gas-fired generating units will likely be deactivated during the planning period. Others will continue to operate. In some cases additional investment may be warranted to maintain performance.
Figure ELL-9 shows the deactivation assumptions that form the basis for estimating ELL’s resource needs. However, as indicated above, a decision has not been made to actually deactivate any specific unit.
Figure ELL-9: Entergy Louisiana, LLC. Capacity Deactivation Assumptions (MW)
Based upon the Reference Case assumptions regarding load growth (including the effects of DSM), an assessment of the state of the current portfolio, renewable and DSM mandates, and the economics of alternative resources, the
1,040415
238
125
212
50
0
200
400
600
800
1,000
1,200
2009
2010
2011
2012
2013
2014
2015
2016
2017
2018
2019
2020
2021
2022
2023
2024
2025
2026
2027
2028
Tota
l
Attachment 3 Docket R-30021 Page 19 of 28
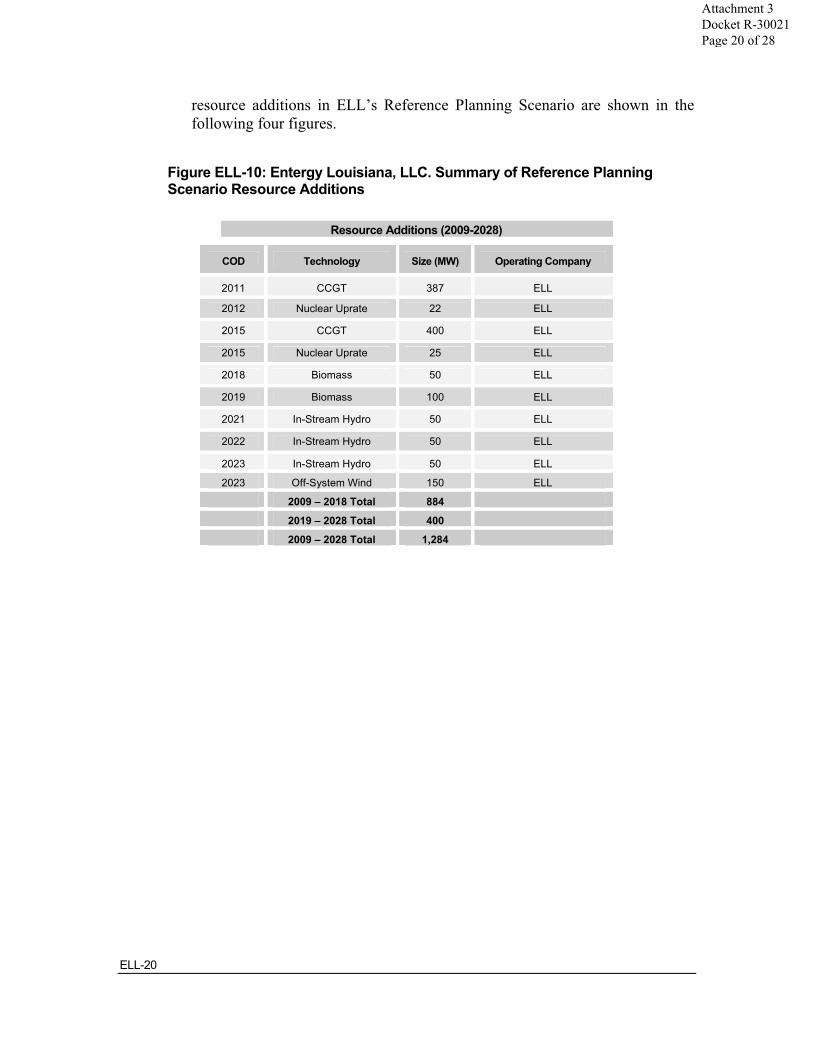
ELL-20
resource additions in ELL’s Reference Planning Scenario are shown in the following four figures.
Figure ELL-10: Entergy Louisiana, LLC. Summary of Reference Planning Scenario Resource Additions
Resource Additions (2009-2028)
COD Technology Size (MW) Operating Company
2011 CCGT 387 ELL
2012 Nuclear Uprate 22 ELL
2015 CCGT 400 ELL
2015 Nuclear Uprate 25 ELL
2018 Biomass 50 ELL
2019 Biomass 100 ELL
2021 In-Stream Hydro 50 ELL
2022 In-Stream Hydro 50 ELL
2023 In-Stream Hydro 50 ELL
2023 Off-System Wind 150 ELL
2009 – 2018 Total 884
2019 – 2028 Total 400
2009 – 2028 Total 1,284
Attachment 3 Docket R-30021 Page 20 of 28

ELL-21
Figure ELL-11: Entergy Louisiana, LLC. Reference Planning Scenario Capacity Additions by Type (MW)
Figure ELL-12: Entergy Louisiana, LLC. Summary of Reference Planning Scenario Portfolio Composition (GW)
Year
Resource 09 10 11 12 13 14 15 16 17 18 19 20 21 22 23 24 25 26 27 28
DSM 0.0 0.0 0.0 0.0 0.0 0.0 0.1 0.1 0.1 0.1 0.2 0.2 0.2 0.3 0.3 0.3 0.3 0.3 0.3 0.3
Nuclear 1.6 1.6 1.6 1.6 1.6 1.6 1.7 1.7 1.7 1.7 1.7 1.7 1.7 1.7 1.7 1.7 1.7 1.7 1.7 1.7
Coal 0.1 0.1 0.1 0.1 0.1 0.1 0.1 0.1 0.1 0.1 0.1 0.1 0.1 0.1 0.1 0.1 0.1 0.1 0.1 0.1
ExistingHydro
0.1 0.1 0.1 0.1 0.1 0.1 0.1 0.1 0.1 0.1 0.1 0.1 0.1 0.1 0.1 0.1 0.1 0.1 0.1 0.1
ExistingGas
3.9 4.0 3.8 3.8 3.8 3.8 3.8 3.8 3.8 3.6 3.4 3.4 3.4 3.4 3.0 3.0 3.0 3.0 3.0 3.0
Renewable Generation
0.0 0.0 0.0 0.0 0.0 0.0 0.0 0.0 0.0 0.1 0.2 0.2 0.2 0.3 0.5 0.5 0.5 0.5 0.5 0.5
CT / CCGT 0.7 0.7 1.0 1.0 1.0 1.0 1.4 1.4 1.4 1.4 1.4 1.4 1.4 1.4 1.4 1.4 1.4 1.4 1.4 1.4
Limited-TermPurchases
0.1 0.4 0.2 0.3 0.2 0.3 0.1 0.0 0.2 0.2 0.2 0.3 0.3 0.2 0.4 0.4 0.2 0.3 0.3 0.4
Total 6.4 6.8 6.8 6.9 6.9 6.9 7.2 7.2 7.3 7.3 7.2 7.3 7.5 7.4 7.4 7.4 7.2 7.2 7.3 7.4
0
200
400
600
800
1,000
1,200
1,400
2009
2010
2011
2012
2013
2014
2015
2016
2017
2018
2019
2020
2021
2022
2023
2024
2025
2026
2027
2028
CCGT Nuclear Uprates Renewables
Attachment 3 Docket R-30021 Page 21 of 28
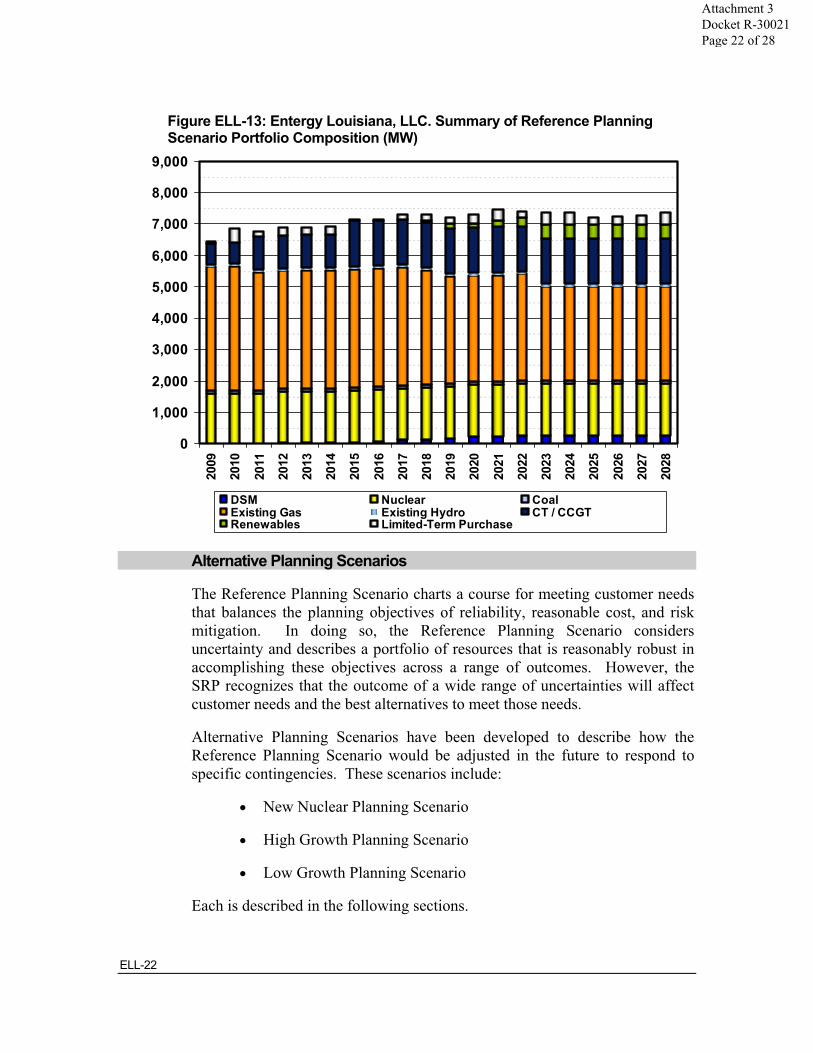
ELL-22
Figure ELL-13: Entergy Louisiana, LLC. Summary of Reference Planning Scenario Portfolio Composition (MW)
Alternative Planning Scenarios
The Reference Planning Scenario charts a course for meeting customer needs that balances the planning objectives of reliability, reasonable cost, and risk mitigation. In doing so, the Reference Planning Scenario considers uncertainty and describes a portfolio of resources that is reasonably robust in accomplishing these objectives across a range of outcomes. However, the SRP recognizes that the outcome of a wide range of uncertainties will affect customer needs and the best alternatives to meet those needs.
Alternative Planning Scenarios have been developed to describe how the Reference Planning Scenario would be adjusted in the future to respond to specific contingencies. These scenarios include:
� New Nuclear Planning Scenario
� High Growth Planning Scenario
� Low Growth Planning Scenario
Each is described in the following sections.
0
1,000
2,000
3,000
4,000
5,000
6,000
7,000
8,000
9,000
2009
2010
2011
2012
2013
2014
2015
2016
2017
2018
2019
2020
2021
2022
2023
2024
2025
2026
2027
2028
DSM Nuclear CoalExisting Gas Existing Hydro CT / CCGTRenewables Limited-Term Purchase
Attachment 3 Docket R-30021 Page 22 of 28
ELL-23
New Nuclear Planning Scenario Although the Reference Planning Scenario does not presume that a new nuclear facility will begin supplying capacity and energy to ELL’s customers over the course of the planning period, the SRP recognizes that new nuclear offers the potential for an economic source of stable-priced base load capacity with zero carbon emissions. In light of this potential, the Reference Planning Scenario assumes the following strategic actions with respect to new nuclear:
� Continue to monitor the economics of new nuclear and propose to strike on this option in the future if and when analyses warrant.
� Maintain the readiness to evaluate and develop new nuclear through spending levels consistent with results of on-going assessment.
The New Nuclear Planning Scenario describes how planned resource additions would be adjusted if results of on-going monitoring activities indicate that new nuclear technology proves to be a viable, economically attractive alternative to meet base load needs in the future. The New Nuclear Planning Scenario assumes the addition of new nuclear in the 2020 – 2025 time frame. Detailed assumptions include the following:
� Two units, 1,000 MW each, are added in 2021 and 2024, respectively. ELL will own 40% of each unit for a total of 800 MW.
� Given lead times associated with new nuclear development, it is not anticipated that new nuclear could be incorporated into portfolios prior to the second half of the planning horizon.
� The unit capacity assumptions are generic representations of potential new nuclear unit additions and do not reflect an assumption as to the specific technology chosen. The actual unit size and number of units would depend on technology selected.
� If new nuclear is determined to be economic, it is not anticipated that more than 2,000 MW of new nuclear could be added in this planning horizon. The capital cost and challenges associated with development and construction limit the amount of new nuclear that realistically could be deployed within a defined time period.
� The GE ESBWR technology contemplates a unit size of about 1,500 MW. The Nuclear Planning Scenario assumes that if this technology were chosen, only one unit would be deployable within the planning horizon.
� New nuclear additions would be expected to replace comparable amounts of CCGT capacity in the Reference Planning Scenario.
Attachment 3 Docket R-30021 Page 23 of 28
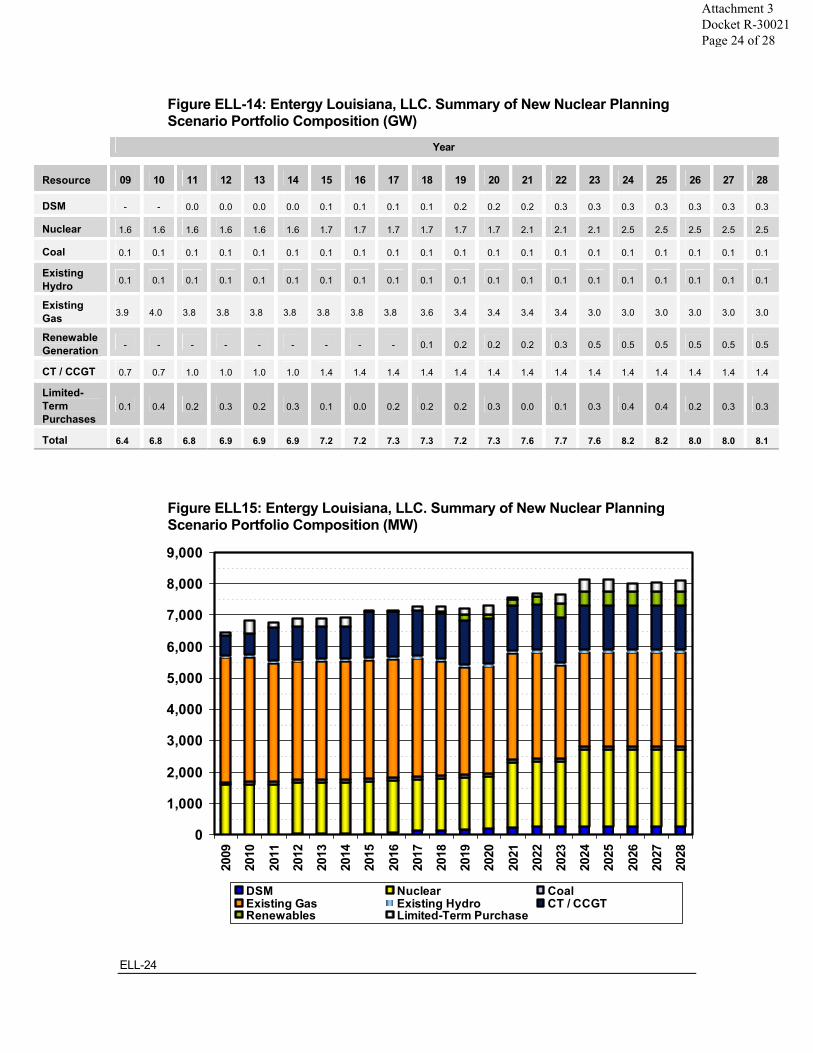
ELL-24
Figure ELL-14: Entergy Louisiana, LLC. Summary of New Nuclear Planning Scenario Portfolio Composition (GW)
Year
Resource 09 10 11 12 13 14 15 16 17 18 19 20 21 22 23 24 25 26 27 28
DSM - - 0.0 0.0 0.0 0.0 0.1 0.1 0.1 0.1 0.2 0.2 0.2 0.3 0.3 0.3 0.3 0.3 0.3 0.3
Nuclear 1.6 1.6 1.6 1.6 1.6 1.6 1.7 1.7 1.7 1.7 1.7 1.7 2.1 2.1 2.1 2.5 2.5 2.5 2.5 2.5
Coal 0.1 0.1 0.1 0.1 0.1 0.1 0.1 0.1 0.1 0.1 0.1 0.1 0.1 0.1 0.1 0.1 0.1 0.1 0.1 0.1
ExistingHydro 0.1 0.1 0.1 0.1 0.1 0.1 0.1 0.1 0.1 0.1 0.1 0.1 0.1 0.1 0.1 0.1 0.1 0.1 0.1 0.1
ExistingGas 3.9 4.0 3.8 3.8 3.8 3.8 3.8 3.8 3.8 3.6 3.4 3.4 3.4 3.4 3.0 3.0 3.0 3.0 3.0 3.0
Renewable Generation - - - - - - - - - 0.1 0.2 0.2 0.2 0.3 0.5 0.5 0.5 0.5 0.5 0.5
CT / CCGT 0.7 0.7 1.0 1.0 1.0 1.0 1.4 1.4 1.4 1.4 1.4 1.4 1.4 1.4 1.4 1.4 1.4 1.4 1.4 1.4
Limited-TermPurchases
0.1 0.4 0.2 0.3 0.2 0.3 0.1 0.0 0.2 0.2 0.2 0.3 0.0 0.1 0.3 0.4 0.4 0.2 0.3 0.3
Total 6.4 6.8 6.8 6.9 6.9 6.9 7.2 7.2 7.3 7.3 7.2 7.3 7.6 7.7 7.6 8.2 8.2 8.0 8.0 8.1
Figure ELL15: Entergy Louisiana, LLC. Summary of New Nuclear Planning Scenario Portfolio Composition (MW)
0
1,000
2,000
3,000
4,000
5,000
6,000
7,000
8,000
9,000
2010
2011
2012
2013
2014
2015
2016
2017
2018
2019
2020
2021
2022
2023
2024
2025
2026
2027
2028
2009
DSM Nuclear CoalExisting Gas Existing Hydro CT / CCGTRenewables Limited-Term Purchase
Attachment 3 Docket R-30021 Page 24 of 28
ELL-25
Carbon Implications Nuclear generation results in zero carbon emissions. Consequently, replacing CCGT capacity with new nuclear capacity would be expected to result in a lower carbon footprint.
High Growth Planning Scenario In addition to a reference case, the load forecast described above includes both high and low load growth projections. The High Growth Planning Scenario describes how planned resource additions would be adjusted if actual load growth tends toward the upper forecast. Load growth averages 2.0% over the 20 year planning horizon in the High Growth Planning Scenario. This scenario assumes that additional supply-side resources would be required over the planning horizon in order to meet higher projected loads.
� The High Growth Planning Scenario does not rely on specific assumptions as to the drivers of higher sustained load. Higher growth could be driven by a number of factors including, for example;
� Sustained strong economic growth within the region;
� Adoption of new electric technologies, such as, plug-in hybrid vehicles; and
� Deployment of DSM at lower levels than assumed in the Reference Planning Scenario.
As described above, it is assumed for planning purposes that ELL will remain a participant in the Entergy System Agreement in whatever form that may take. Therefore, ELL’s capacity additions will support the larger integrated 5-company, or 4-company, Entergy System. The System’s overall capacity needs will depend on load growth.
As a result, the 4-company Operating System (post EAI and EMI exit) will need 2,000 MW of additional capacity to meet reliability needs. ELL’s planned capacity under the High Growth Planning Scenario is not expected to vary from that under the Reference Planning Scenario. Due to greater reliability requirements, these 2,000 MW of incremental capacity may be added to EGSL and ETI (1,000 MW each).
Low Growth Planning Scenario The Low Growth Planning Scenario describes how planned resource additions would be adjusted if actual load growth tends toward the lower forecast. Load growth averages about 0.5% over the 20 year planning horizon in the Low Growth Planning Scenario. This scenario assumes that, as compared to the
Attachment 3 Docket R-30021 Page 25 of 28
ELL-26
Reference Planning Scenario, fewer supply-side resources would be required over the planning horizon in order to meet lower projected load growth.
� The Low Growth Planning Scenario does not rely on specific assumptions as to the drivers of lower load. Lower loads could result from a number of factors including, for example:
� Sustained weak economic growth within the region;
� Adoption of energy efficiency by end use customers; and
� Higher levels of DSM deployment than assumed in the Reference Planning Scenario.
As a result, compared with the Reference Planning Scenario, 1,000 MW less of incremental capacity is needed to meet reliability needs over the twenty year planning horizon for the 4-company Operating System (post EAI and EMI exit). ELL’s planned capacity under the Low Growth Planning Scenario is not expected to vary from that under the Reference Planning Scenario. Instead, 1,000 MW of incremental capacity would be reduced within ETI’s jurisdiction, due to lower reliability requirements.
Other Key Portfolio Drivers
The Alternative Planning Scenarios described above provide guidance relating to the effect of uncertainties pertaining to load growth and new nuclear. The outcomes of these uncertainties are unknown at this time. But, the implications of these uncertainties on portfolio design and the range of foreseeable outcomes suggest both a potential benefit from developing alternative scenarios and a reasonable basis for doing so.
It is not possible, however, to predict all the factors that may affect portfolio design over the next 20 years. In the case of many other drivers the uncertainties become so unknown or so speculative, that constructing specific alternative planning scenarios becomes practically impossible or, at least, of little planning value. In some cases the drivers themselves may not be identifiable at this time. The strategic flexibility inherent in the Reference Planning Scenario (described in an earlier section within this chapter) provides the key tool for responding to changing circumstances. However, two additional uncertainties, while not incorporated into alternative planning scenarios merit additional discussion, plant betterment opportunities and renewable generation alternatives.
Attachment 3 Docket R-30021 Page 26 of 28
ELL-27
Plant Betterment Initiative The Reference Planning Scenario assumes that 1,040 MW of ELL’s existing gas-fired generation is deactivated over the coming twenty years. These deactivation assumptions were developed for long-range planning purposes, as a basis for assessing long-term incremental capacity needs, and not as a schedule of retirements for existing units. While the assumptions about unit deactivations consider knowledge of unit condition and expectations about future operating role, these assumptions do not represent a decision to deactivate any particular unit. Specific unit portfolio decisions are made during the tactical business planning process (three-year planning horizon) based on economic and technical evaluation considering projected forward cost, anticipated operating roles, and cost of supply alternatives.
Plant betterment activities involve proactive repair and replacement of specific components to maintain capability and safety of a generating unit. These repairs and replacements are consistent with OEM/Vendor recommendations and good utility practice. Some of the existing gas-fired generating units may be candidates for refurbishment and/or upgrade beyond proactive repair and replacement.
Planners and plant engineers are currently assessing potential opportunities presented by older gas-fired resources. In some cases continued additional spending at these units may provide customers with economic benefits by deferring more expensive incremental capacity needs. This analysis is on-going and is anticipated to result in preliminary recommendations over the next twelve months. To the extent the analysis results in recommendations to proactively maintain existing gas-fired resources in operation beyond currently assumed deactivation dates, the Reference Planning Scenario would be adjusted accordingly by deferring incremental CCGT additions or reducing limited-term purchases or both.
Renewable Generation The Reference Planning Scenario assumes that 450 MW of renewable generation is added over the twenty year planning horizon and provides assumptions about what type of technology might be deployed to achieve that level. These assumptions are based on current information about technology cost and availability, including projections of long-term cost for emerging technologies such as in-stream hydro. The actual amount and type of renewable generation that will be deployed over the twenty-year planning horizon will depend on actual prices, availability, as well as consideration of any federal and/or state mandates. Depending on possible federal and/or state legislation, the Entergy Operating Companies may conduct a RFP for renewable resources within the next twelve months. The results of that effort should provide additional information about the potential for renewable
Attachment 3 Docket R-30021 Page 27 of 28

ELL-28
generation. In the event that economic renewable generation cannot be identified in levels assumed in the Reference Planning Scenario, additional CCGT capacity would be anticipated to meet reliability requirements.
Attachment 3 Docket R-30021 Page 28 of 28

EGSL- 1
..........
Entergy Gulf States Louisiana, LLC An Integrated Resource Plan (2009 – 2028)
Scope and Structure
This document describes Entergy Gulf States Louisiana, LLC’s (“EGSL”) long-term integrated resource plan (“IRP”)1 for the period 2009 – 2028. The IRP represents a component of the Entergy System’s Strategic Resource Plan (“SRP”) for the same period. The SRP for the Entergy System as a whole is described in a separate document; the underlying modeling constructs and assumptions are presented in the documentation associated with the SRP.
For well over the past half century, EGSL has planned and operated as part of a larger integrated system – the Entergy System.2 Entergy Arkansas Inc. (“EAI”) and Entergy Mississippi Inc. (“EMI”) have provided notice that as of December 2013 and November 2015, respectively, they will withdraw from the Entergy System Agreement. That means that, for the time being, EGSL will be planned and operated under the terms of a 5-company System Agreement as of 2014 (excluding EAI), and a 4-company System Agreement as of 2016 (excluding EMI). The future is uncertain. The future Entergy System may or may not include EAI and EMI, depending on whether a successor System Agreement is realized. Excluding EAI and EMI from the larger integrated system will result in higher resource requirements for the remaining four Operating Companies, including EGSL. The IRP assumes, as a base planning assumption, that EAI and EMI will terminate participation in the System Agreement by December 2013 and November 2015, respectively. Accordingly, the IRP results in a plan that positions EGSL for reliable and
1 Throughout this document, unless otherwise noted, the term “IRP” refers to the IRP for EGSL which is a component of the Strategic Resource Plan for the Entergy System and the Entergy Operating Companies. 2 The Entergy Operating Companies are planned and operated as a single, integrated electric system, pursuant to the Entergy System Agreement. The six Entergy Operating Companies include Entergy Arkansas, Inc. (“EAI”), Entergy Gulf States Louisiana, LLC (“EGSL”), Entergy Louisiana, LLC (“ELL”), Entergy Mississippi, Inc. (“EMI”), Entergy New Orleans, Inc. (“ENO”), and Entergy Texas, Inc. (“ETI”). The electric generation and bulk transmission facilities of these Operating Companies are planned and operated on an integrated, coordinated basis as a single electric system pursuant to the terms and conditions of the Entergy System Agreement and are referred to collectively as the “Entergy System” or the “System.”
Attachment 4 Docket R-30021 Page 1 of 29
EGSL-2
economic operations as part of the 5-company and eventually 4-company Entergy System.
With the exit of EAI and EMI from the Entergy System Agreement, the 4-company System will face new resource planning challenges. In addition to the challenges posed by potential national and state initiatives to address greenhouse gas emissions (including renewable portfolio standards (“RPS”), demand-side management (“DSM”) and smart grid evolution, and new cap and trade programs limiting CO2 emissions), unprecedented volatility in natural gas prices, and the aging generating fleet, the 4-company System also must address replacement capacity once EAI and EMI withdraw from the Entergy System Agreement.
The IRP assumes, as a base planning assumption, that EAI and EMI will exit the Entergy System Agreement and the four remaining Operating Companies will be planned and operated as an integrated 4-company System. The IRP includes capacity expansion scenarios that provide guidance regarding future resource needs and additions. It is not possible at this time to predict the outcome of uncertainties surrounding load growth, new nuclear resources, solid fuel resources, renewable portfolio standards, and the aging generating fleet. However, this plan results in adequate resources to meet the 4-company System needs under the current assumptions.
With that background, this IRP presents EGSL’s perspective on its:
� resource requirements over the next 20 years;
� current resource portfolio;
� Reference Planning Scenario for meeting long-term needs with a combination of Demand-Side Management and traditional and renewable generating units; and
� plans for addressing uncertainties including several alternative planning scenarios.
Regulatory Context for EGSL’s Integrated Resource Planning
The Louisiana Public Service Commission (“LPSC”) has opened a docket investigating the potential for implementing an IRP process. However, the docket is currently inactive pending resolution of a separate re-evaluation of a new RPS for Louisiana.
Attachment 4 Docket R-30021 Page 2 of 29

EGSL-3
EGSL’s Future Resource Requirements
The foundation for the IRP is an estimate of the future energy and capacity needs of EGSL’s customers. This estimate requires estimates of the amount of capacity and energy that EGSL’s customers will use, and an estimate of the amount of “reserves” that should be included in the IRP to provide reliable service.
Load Forecast
The load forecast is developed using statistical and economic modeling techniques that are described in the SRP.3 The application of those modeling techniques to EGSL results in the reference, high load growth, and low load growth cases shown in the following Figure EGSL-1.
Figure EGSL-1: Entergy Gulf States Louisiana, LLC. Firm Non-coincident Peak Load (Load Sensitivity Cases 2009-2028) (MW)
2009 2010 2011 2012 2013 2014 2015 2016 2017 2018
Reference 3,860 3,675 3,722 3,769 3,792 3,797 3,818 3,837 3,854 3,872
HighGrowth 3,898 3,937 3,977 4,016 4,057 4,097 4,138 4,179 4,221 4,263
Low Growth 3,821 3,638 3,641 3,645 3,649 3,652 3,656 3,660 3,663 3,667
2019 2020 2021 2022 2023 2024 2025 2026 2027 2028
Reference 3,894 3,919 3,932 3,950 3,970 3,993 4,009 4,031 4,055 4,082
HighGrowth 4,306 4,349 4,393 4,437 4,481 4,526 4,571 4,617 4,662 4,710
Low Growth 3,671 3,674 3,678 3,682 3,685 3,689 3,693 3,696 3,700 3,704
Reserve Margins
The IRP describes EGSL’s requirements as part of the larger integrated Entergy System. The 4-company Operating System must have adequate resources to reliably meet its customers’ needs. The plan does not assume that EGSL will maintain sufficient generating capacity to reliably meet its own requirements as a standalone Operating Company, but as part of a larger 3 Chapter 3 of the SRP provides additional details regarding the load forecasting process.
Attachment 4 Docket R-30021 Page 3 of 29

EGSL-4
integrated system. This ability is measured in terms of peak load plus an adequate provision for planning reserves. Peak load (shown in Figure EGSL-1) refers to the level of highest customer demand during the year. If resources are sufficient to meet peak demand, resources should be sufficient to meet demand throughout the remainder of the year.
Both customer demand and the availability of resources within the portfolio to meet demand are matters of uncertainty. Unknown events such as an unusually hot summer or an unplanned outage of a generating unit can create situations in which the System’s ability to meet the experienced peak load is challenged. To protect against the consequences of such unknown events the IRP – consistent with good utility practice – provides for an additional amount of resources above projected peak demand, referred to as the planning reserve margin. The planning reserve margin may be expressed as a MW amount or as a percentage of the peak load.
A number of factors influence the level of planning reserves that are required to provide reliability. One of the most important variables is the size of the generating units within the portfolio in relation to peak load. Relying on large generating stations involves greater risk because an outage at a single unit has more significant consequences. Therefore, the larger the generating units within the portfolio in relation to peak load the greater the planning reserve margin that is required.
This relationship has consequences for the level of planning reserves that will be required in light of EAI and EMI exiting the System Agreement. In recent years the System has planned for about a 17% reserve margin. This target was developed using a technique known as a Loss of Load Probability (“LOLP”) assessment. The LOLP technique is widely used throughout the industry for determining reserve margins. LOLP assesses the probability that resources will be adequate to meet load in light of uncertainties regarding customer load variability and of unit outages. Results of the LOLP assessment indicated that a 17% reserve margin provided sufficient capacity to serve load for all but one day in ten years, also a traditional measure of reliability used within the industry.
However, the loss of EAI and EMI would result in a smaller electric system. At the same time, the size of the four remaining Operating Companies’ generating units would not change. Because the size of the generating units as compared to the peak load increases, the LOLP assessment indicates a need for additional planning reserves for the 4-company System to achieve the same level of reliability. The results of the LOLP calculations indicate much higher reserve requirements for a 4-company System.
Attachment 4 Docket R-30021 Page 4 of 29
EGSL-5
In determining the target planning reserve margins, the IRP considered the following:
� The actual operating configuration of the 5-company System and 4-company System, after EAI and EMI exit the System Agreement, is uncertain.
� A number of actions may be available to mitigate risk and lower required reserve margins after the exit of EAI and EMI including possible reserve sharing arrangements.
In recognition of these factors, the IRP sought to determine a level of target planning reserves that balanced the objective of providing adequate resources to maintain reliability while avoiding commitment to long-term resources that may ultimately prove to be unnecessary. Accordingly, the IRP established the planning reserve margins for the 5-company System and the 4-company System based on the loss of the single largest generating unit. This analysis yields a planning reserve margin of 18% for the 5-company System (2014 – 2015) and 20% for the 4-company System (2016 and beyond).
For operating companies planned and dispatched within the integrated system, a 10% reserve margin is used for each company. The 10% planning reserve margin ensures that each Operating Company provides a proportionate share of the resources that are expected to be used for overall System reliability and coordinated dispatch. The 10% reserve margin represents a guideline used solely for the purposes of Operating Company Portfolio Planning within the context of operation within the System.
Other Uncertainties
In addition to load, a number of uncertainties will affect long-term resource requirements and the alternatives available to meet those needs.
CarbonThe issue of potential climate change associated with atmospheric greenhouse gases has received growing attention among the scientific community, in the media, and with governmental policy makers. A number of bills proposing to regulate carbon emissions have been proposed in the United States Congress. It is not possible to predict whether CO2 legislation will eventually be enacted, and if so, when it would become effective or what form it would take. However, any form of CO2 legislation would likely result in higher cost of electric generation because emissions from power plants are a major source of carbon, primarily in the form of CO2. Moreover, because alternative technologies emit different levels of CO2 per MWh of generation, CO2legislation would likely have an effect on the relative economics of supply
Attachment 4 Docket R-30021 Page 5 of 29
EGSL-6
alternatives. Consequently, assumptions regarding potential CO2 cost represent a key input in the 2009 SRP Update.
In order to consider the effects of carbon uncertainty on resource choice and portfolio design, the 2009 SRP Update relies on a range of projected CO2 cost outcomes. The Reference Case assumes a 2013 nominal CO2 emission price target of $15 per ton with straight line interpolation to a 2020 nominal CO2emission price target of $50 per ton. By 2028, under the Reference Case, the nominal CO2 emission price target may be $58.58 per ton.
Renewable Portfolio Standards There is growing discussion regarding the potential implementation of a Renewable Portfolio Standard (“RPS”) (also sometimes known as a “Renewable Energy Standard”) either at the federal or state level. Several bills have been proposed in the U.S. Congress that would establish various targets for renewable generation and differing levels of compliance cost. If enacted, a federal RPS likely will result in higher cost for customers. Renewable generation alternatives generally are more costly than conventional generation alternatives.
FuelLong-term natural gas price levels remain uncertain. A wide range of factors may affect natural gas price levels and volatility in the future. Natural gas prices are expected to vary between $6.04 in 2009 (nominal $/MMBtu) to $10.06 in 2020 (nominal $/MMBtu), based on the Reference Case.
Current Resource Portfolio
The ultimate objective of an IRP is to inform the decisions that must be made in the course of the development of a future resource portfolio. The need to acquire future resources is not determined just by an estimate of future resource requirements. After there is an estimate of the level of resources that will be needed in the future, the next step in the development of an IRP is an assessment of the current portfolio of resources. This assessment should consider the amount, type, and age of the existing fleet. Then, current resources can be compared to future requirements to develop expectations regarding the need for additional resource acquisitions in the future.
Figure EGSL-2 lists the resources in EGSL’s current resource portfolio. Figures EGSL-3 and EGSL-4 characterize the portfolio mix based on the attributes of fuel and resource age. These figures illustrate a few key points:
Attachment 4 Docket R-30021 Page 6 of 29

EGSL-7
� EGSL’s existing portfolio of generating units has a total combined capability of 3,683 MW including 21 units at 10 sites.
� The resource mix includes a significant amount of gas-fired capacity (2,903 MW) representing 78% on a capacity basis.
� The portfolio includes 499 MW of modern gas-fired combined cycle combustion turbine (“CCGT”) capacity, including EGSL’s allocation of the Perryville facility (231 MW) and the Ouachita plant (268 MW).
Figure EGSL-2: Entergy Gulf States Louisiana, LLC. Current Owned & Long Term Resources
Unit Supply Role Fuel Age 2008 Summer Capacity (MW)
Big Cajun 2, 3 Baseload Coal 26 142
Calcasieu 1 Peaking Gas 9 87
Calcasieu 2 Peaking Gas 8 92
Lewis Creek 1 Seasonal Load Following Gas 39 132
Lewis Creek 2 Seasonal Load Following Gas 38 132
Ouachita Core Load Following Gas 7 268
Perryville 1 Core Load Following Gas 7 231
Perryville 2 Peaking Gas 8 67
River Bend Baseload Nuclear 23 391
Roy S. Nelson 3 Seasonal Load Following Gas 49 88
Roy S. Nelson 4 Seasonal Load Following Gas 39 288
Roy S. Nelson 6 Baseload Coal 27 221
Sabine 1 Seasonal Load Following Gas 47 122
Sabine 2 Seasonal Load Following Gas 47 122
Sabine 3 Seasonal Load Following Gas 43 224
Sabine 4 Seasonal Load Following Gas 35 305
Sabine 5 Seasonal Load Following Gas 30 270
Toledo Bend Peaking Hydro n/a 26
Willow Glen 1 Peaking Gas 49 87
Willow Glen 2 Peaking Gas 45 118
Willow Glen 4 Peaking Gas 36 270
TOTAL 3,683
Attachment 4 Docket R-30021 Page 7 of 29
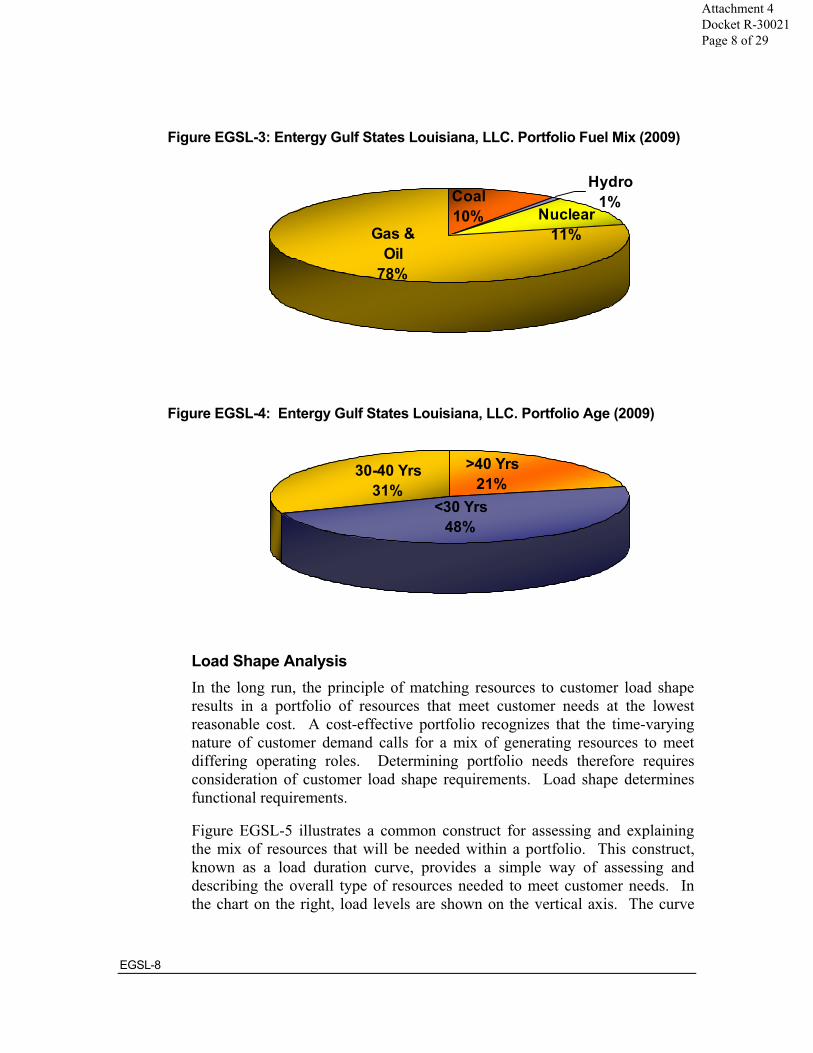
EGSL-8
Figure EGSL-3: Entergy Gulf States Louisiana, LLC. Portfolio Fuel Mix (2009)
Figure EGSL-4: Entergy Gulf States Louisiana, LLC. Portfolio Age (2009)
Load Shape Analysis In the long run, the principle of matching resources to customer load shape results in a portfolio of resources that meet customer needs at the lowest reasonable cost. A cost-effective portfolio recognizes that the time-varying nature of customer demand calls for a mix of generating resources to meet differing operating roles. Determining portfolio needs therefore requires consideration of customer load shape requirements. Load shape determines functional requirements.
Figure EGSL-5 illustrates a common construct for assessing and explaining the mix of resources that will be needed within a portfolio. This construct, known as a load duration curve, provides a simple way of assessing and describing the overall type of resources needed to meet customer needs. In the chart on the right, load levels are shown on the vertical axis. The curve
Gas & Oil
78%
Hydro1%Coal
10% Nuclear11%
>40 Yrs21%
<30 Yrs48%
30-40 Yrs31%
Attachment 4 Docket R-30021 Page 8 of 29

EGSL-9
represents load over the period of a year sorted from the highest load level to the lowest. Points along the curve indicate the MW levels of capacity needed to meet generalized supply roles.
Figure EGSL-5: Illustrative Load Duration Curve Analysis
The results of the load duration curve analysis are used throughout this report to describe the resource needs for the Entergy Operating Companies and for assessing how well resources are matched to load shape requirements. However, while a valuable tool, a load duration curve analysis also has limitations. The results of load shape analysis are intended as general guidelines for portfolio planning purposes without consideration of practical operational requirements. As described later in this chapter, the System must have sufficient flexible capacity to meet and respond to changing load conditions in order to maintain a stable electric grid. The load duration curve analysis does not explain this requirement. Moreover, in assessing existing resources relative to load shape requirements, each unit has been assigned within a specific supply role. In actuality, the distinction between supply roles is neither sharp nor static.
Supply Roles This SRP update considered a number of generalized supply roles in assessing long-term resource needs. The supply role requirements, which are intended as general guidelines for portfolio planning purposes without consideration of practical operational requirements, are described as follows:
BaseloadThe aggregate customer demand for electricity that persists most hours of the year is the baseload requirement. As a guideline, baseload requirements are determined by the level of firm load that is expected to be exceeded during 85% of the hours in a year.
Chronological Hours (One Year)
HOURLY LOAD
Max Load~ 21 GW
Min Load~ 11 GW
GENERATION CAPACITY REQUIREMENTS
Load Duration Curve Rearranges Hourly Load
MW
Reserve
Base Load
Load Following
Peaking
MW
Attachment 4 Docket R-30021 Page 9 of 29
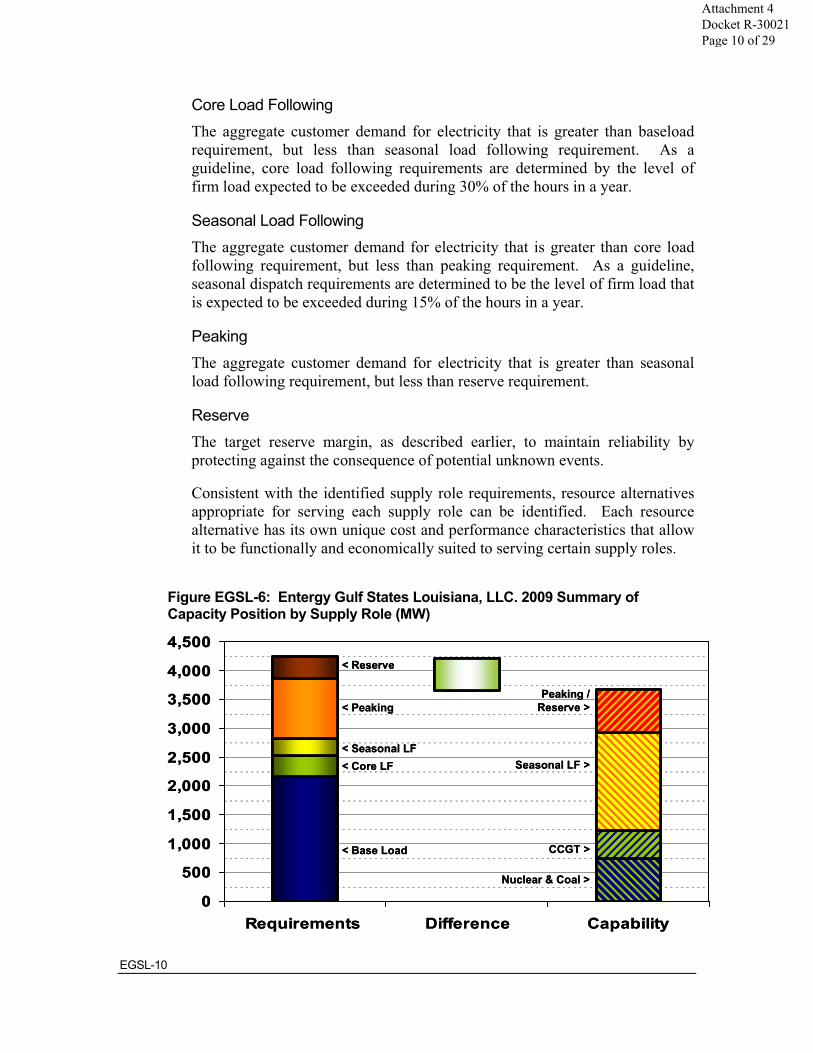
EGSL-10
Core Load Following The aggregate customer demand for electricity that is greater than baseload requirement, but less than seasonal load following requirement. As a guideline, core load following requirements are determined by the level of firm load expected to be exceeded during 30% of the hours in a year.
Seasonal Load Following The aggregate customer demand for electricity that is greater than core load following requirement, but less than peaking requirement. As a guideline, seasonal dispatch requirements are determined to be the level of firm load that is expected to be exceeded during 15% of the hours in a year.
PeakingThe aggregate customer demand for electricity that is greater than seasonal load following requirement, but less than reserve requirement.
ReserveThe target reserve margin, as described earlier, to maintain reliability by protecting against the consequence of potential unknown events.
Consistent with the identified supply role requirements, resource alternatives appropriate for serving each supply role can be identified. Each resource alternative has its own unique cost and performance characteristics that allow it to be functionally and economically suited to serving certain supply roles.
Figure EGSL-6: Entergy Gulf States Louisiana, LLC. 2009 Summary of Capacity Position by Supply Role (MW)
0
500
1,000
1,500
2,000
2,500
3,000
3,500
4,000
4,500
Requirements Difference Capability
Peaking / Reserve >
< Reserve
Nuclear & Coal >
< Base Load
< Core LF< Seasonal LF
< Peaking
CCGT >
Seasonal LF >
0
500
1,000
1,500
2,000
2,500
3,000
3,500
4,000
4,500
Requirements Difference Capability
Peaking / Reserve >
< Reserve
Nuclear & Coal >
< Base Load
< Core LF< Seasonal LF
< Peaking
CCGT >
Seasonal LF >
Attachment 4 Docket R-30021 Page 10 of 29
EGSL-11
The results of the analysis presented in Figure EGSL-6 comparing EGSL’s resource needs with its current portfolio of long-term resources indicate the following key points:
� EGSL’s current portfolio of nuclear and coal capacity is well “short” of its base load requirements by 1,418 MW.
� EGSL’s current portfolio includes 499 MW of modern gas-fired combined cycle combustion turbine (“CCGT”) capacity, Ouachita (268 MW) and Perryville 1 (231 MW). Modern gas-fired CCGT resources are the technology of choice to meet incremental load following needs.4 Consequently, incremental long-term resource additions can be expected to be weighted toward gas-fired CCGT resources.
� EGSL’s current portfolio is heavily weighted toward seasonal load following resources. The amount of gas fired capacity in the portfolio exceeds current seasonal load following needs.
� EGSL’s current portfolio of long-term resources does not meet planning reserve margin, and, in fact is “short” by about 562 MW, based on a 10% reserve margin.5 This deficit will continue to increase due to load growth and potential unit deactivations.
ChallengesEGSL’s resource portfolio faces a number of challenges.
Long term Capacity Shortage EGSL’s current portfolio of long-term resources is short of its reserve planning margin by about 562 MW, based on a 10% reserve margin. This deficit is expected to grow with load over the planning horizon.
Potential Unit Deactivations EGSL’s current portfolio of long-term resources may potentially have 1,578 MW of resources deactivate over the planning horizon. Additional capacity must be added to replace the attrition of existing capacity.
4 This is explained in detail in Chapter 10 (Generation Technologies) of the SRP. 5 The 10% reserve margin represents a guideline used solely for the purposes of Operating Company Portfolio Planning within the context of operation within the System. This guideline does not represent the reserve margin requirements for the System and standalone Operating Companies.
Attachment 4 Docket R-30021 Page 11 of 29
EGSL-12
Age of Existing Resources The existing portfolio of long-term resources includes a number of gas-fired resources that are in excess of 30 years of age. In and of itself, the age of a generating unit is not the determinant as to whether any specific unit should be deactivated or retired. The ability of a generating unit to continue to provide economic and reliable service is a function of capital expenditures, service role, and general condition. However, experience indicates that at some point it is likely that it will be more economic to replace existing capacity rather than to continue to incur capital and operating and maintenance expenses.
Base load and Core Load-following Needs EGSL’s portfolio lacks sufficient base load and modern gas-fired CCGT capacity. System resources must support EGSL’s base load and core load following requirements.
Reference Planning Scenario
There are a myriad of uncertainties affecting future resource needs and alternatives available to meet those needs. However, a Reference Planning Scenario has been developed for EGSL which charts a course through a reasonable set of assumptions, and results in a plan that satisfies the planning objectives while providing the flexibility to respond to changing conditions. The Reference Planning Scenario is a reference point that can be used to evaluate a variety of future outcomes, but the outcome of a wide number of uncertainties will affect customer needs and the best portfolio choices to meet those needs over the next two decades.
This section describes the Reference Planning Scenario, by discussing:
� Portfolio assumptions;
� Recommendations regarding strategic direction; and
� Plans for addressing uncertainties (including several alternative planning scenarios)
The Reference Planning Scenario describes a portfolio of resources to meet EGSL customer needs for the next 20 years. The Reference Planning Scenario:
� Balances the supply objectives of reliability, cost minimization, and risk mitigation;
Attachment 4 Docket R-30021 Page 12 of 29
EGSL-13
� Accomplishes these planning objectives while considering utilization of natural resources and effects on the environment;
� Outlines a disciplined approach to resource additions while allowing the flexibility to respond to changing circumstances;
� Meets the bulk of reliability needs through long-term resources (owned or power purchase contracts);
� Includes the addition of gas-fired CCGT resources to meet load-following needs and overall reliability requirements;
� Includes the addition of reasonable levels of renewable generation and DSM to address fuel diversity and to meet overall capacity needs.
Reference Planning Scenario Assumptions The Reference Planning Scenario assumes that incremental resource needs will be met primarily by gas-fired CCGT resources coupled with economically attractive levels of renewable generation and DSM consistent with regulatory mandates and appropriate cost recovery mechanisms. Specific portfolio assumptions include the following:
� 1,600 MW of existing gas-fired steam capacity is deactivated.
� 700 MW of gas-fired CCGT resources are added.
� 300 MW of renewable generation resources are added between 2014 and 2028, representing a level of economically attractive renewable generation that is realistically achievable given current cost estimates. Entergy Services, Inc. conducted a Request for Information (“RFI”) relating to renewable generation and, depending on federal and/or state RPS activity, may conduct a Request for Proposals for renewable generation within the next year. The results of those initiatives will inform future planning efforts and will result in appropriate adjustments to the levels of renewable generation included in future SRP Updates.
� The continued operation of all existing coal-fired capacity throughout the planning horizon.
� The continued operation of all existing nuclear facilities throughout the planning horizon.
� The addition of 50 MW (125 MW Utility total) of nuclear capacity through an uprate at the River Bend Station in 2015. However, there has been no final decision to implement the uprate. If the projects
Attachment 4 Docket R-30021 Page 13 of 29
EGSL-14
prove to be uneconomic or technically unfeasible, this capacity would be replaced with additional CCGT resources.
� No new solid fuel or nuclear facilities additions (other than the uprate previously discussed) over the following 20 years. Potential new nuclear capacity is addressed among the alternative planning scenarios.
Strategic Recommendations The Reference Planning Scenario incorporates the following strategic recommendations:
� Focus on gas-fired CCGT capacity as the basic building block of the portfolio.
� Pursue reasonable levels of economically attractive renewable generation. The levels and type of renewable generation actually deployed will depend on evolving mandates and an on-going assessment of cost and availability, including market tests with suppliers. The Reference Planning Scenario indicates that:
� Near-term renewable resource additions are anticipated to be primarily biomass.
� 100 MW of renewable capacity (700 MW for all six of the Operating Companies) may be added to EGSL’s portfolio over the first 10 years.
� Continue to monitor the costs and benefits of new nuclear and solid fuel and propose specific plans to implement these options in the future if and when analyses results warrant. The Reference Planning Scenario does not reflect an expectation that any new nuclear or solid fuel resources will enter service over the 20 year planning horizon. However, it would be appropriate to maintain readiness of new nuclear through spending levels consistent with results of on-going assessment.
� Continue to develop long-term integrated planning efforts with Entergy Transmission to identify portfolio solutions that best balance planning objectives. Results of integrated supply and transmission planning efforts that are now allowed subsequent to FERC Order 717 may result in adjustments to the timing and location of resource needs.
Attachment 4 Docket R-30021 Page 14 of 29

EGSL-15
� Pursue cost-effective DSM, consistent with the following discussion.
Demand Side Management Assumptions The Reference Planning Scenario assumes that, over the SRP planning horizon, EGSL-sponsored DSM programs reduce peak load by 143 MW and reduce cumulative energy consumption by 490 GWh by 2028 at an eventual cost of $96 million (nominal $, cumulative). These results are consistent with a detailed potential study recently prepared by ICF International, a leading consulting firm in the DSM community.6 The ICF International study found a potential of about 88 MW over the first ten years for EGSL, adjusted for reasonable implementation and approval timeline.
Figure EGSL-7: Entergy Gulf States Louisiana, LLC. DSM Potential Assumption – Cumulative Non-Coincident Peak Demand Reduction (MW) and Energy Saved (GWh)
2009 2010 2011 2012 2013 2014 2015 2016 2017 2018
Demand Reduction 0 0 5 12 21 29 40 53 69 88
Energy Saved 0 0 22 52 89 132 165 216 272 336
2019 2020 2021 2022 2023 2024 2025 2026 2027 2028
Demand Reduction 108 131 143 143 143 143 143 143 143 143
Energy Saved 407 484 488 488 488 490 488 488 488 490
Barriers to DSM Implementation Traditional rate regulation presents several barriers or disincentives to electric utility investment in DSM resources. These include regulatory lag associated with recovering the incremental investment and expenses of programs, the lack of an opportunity to earn a comparable return on DSM programs as with other utility investments, and the loss of revenues that frequently accompanies DSM programs that reduce a utility’s contribution to its fixed costs. A regulatory framework that addresses these three elements will ultimately benefit all stakeholders and encourage utility support for the continued development and implementation of DSM programs and begin to position
6 The ICF, International study is discussed in detail in Chapter 9 of the SRP.
Attachment 4 Docket R-30021 Page 15 of 29
EGSL-16
investments in DSM and supply side resources on an equivalent basis for the Company.
Regulatory Framework for Cost Recovery As EGSL pursues cost-effective DSM as a means for meeting a portion of its future resource needs, the regulatory framework for treatment of DSM investments will need to be addressed. An equitable regulatory framework that addresses the removal of the disincentives for the implementation of DSM programs is a fundamental prerequisite to creating a successful DSM environment. The lack of necessary regulatory mechanisms means that DSM and supply-side resources are not on a level playing field. Appropriate mechanisms must be implemented to ensure that the benefits of DSM accrue to customers and that investors are adequately compensated for their investment. It is important to note that the LPSC has recently opened a new rulemaking docket to address energy efficiency. Based on recent comments of the LPSC Staff, it is anticipated that the energy efficiency rulemaking will begin in earnest during early 2010.
DSM is an important component of the resource planning process and requires that the Company properly assess the market achievable potential and make adjustments as needed due to changes in external market forces, changes to Operating Company schedules for implementing DSM programs as well as the advanced metering infrastructure (“AMI”) systems that enable demand response programs. Changes to these assumptions and others may result in the need to revise the overall DSM resource potential or the timing of when those resources may be available.
UncertaintyThe amount of market-achievable DSM potential that should be reflected in the 2009 SRP Update is subject to a variety of factors, many of which are highly uncertain. These DSM assumptions are not intended as definitive commitments to particular programs, program levels, or program timing. The level of DSM programs that will be implemented over the planning horizon will depend on a number of factors including:
� The level of DSM that the Operating Companies’ retail regulators agree should be deployed, and the implementation of appropriate regulatory review, approval, and cost recovery mechanisms to allow the Operating Companies a reasonable opportunity to recover the costs associated with those programs;
� The relative cost of DSM versus alternative supply-side options. Chapter 10 discusses the uncertainties that affect
Attachment 4 Docket R-30021 Page 16 of 29

EGSL-17
supply-side alternatives, both conventional and renewable alternatives. The cost and availability of supply-side alternatives are matters of uncertainty which could alter the relative attractiveness of DSM alternatives.
� Experience with the DSM programs. As DSM programs are implemented over time, EGSL will be able to refine the estimates of market-achievable potential, the cost of implementing programs, and the speed at which programs can be deployed.
Renewable Generation Assumptions Subject to various assumptions and uncertainties, it is reasonable to expect that renewable generation will become a component of EGSL’s long-term supply portfolio over the next decade. However, it is not realistic to assume that renewable generation will be able to technically or economically satisfy all or even most of EGSL’s incremental needs.7 However, in light of a growing interest from policymakers and the potential for renewable generation to mitigate the effects of regulations regarding CO2, the Reference Planning Scenario assumes 300 MW of renewable generation will be added to EGSL’s portfolio over the planning horizon, as shown in Figure EGSL-8.
Figure EGSL-8: Entergy Gulf States Louisiana, LLC. Reference Planning Scenario Renewable Generation Resource Additions
Renewable Generation Resource Additions (2009-2028)
COD Technology Size (MW) Operating Company
2017 Biomass 100 EGSL
2020 In-Stream Hydro 50 EGSL
2022 Off-System Wind 50 EGSL
2023 Off-System Wind 50 EGSL
2025 In-Stream Hydro 50 EGSL
2009 – 2028 Total 300
Deactivation Assumptions In addition to being able to meet growing load, additional resources will be needed in the future to replace any part of the current portfolio that can no longer be expected to be technically or economically viable. Thus, the 7 Chapter 10 of the SRP presents a detailed technical and economic discussion of renewable resources.
Attachment 4 Docket R-30021 Page 17 of 29
EGSL-18
resource planning process must incorporate assumptions regarding the continued viability of the existing generating units that comprise the current portfolio.8 As part of the ongoing planning process, the existing units are assessed to determine their ability to economically remain in the portfolio relative to other available resource alternatives. The results of this assessment can change because the projected cost to maintain a generating unit can be affected by unexpected equipment degradation or failure and unanticipated operational requirements that significantly impact the unit condition. Therefore, these deactivation assumptions are for long-term capacity planning purposes only and should not be interpreted as a retirement schedule for existing generating units.
All of the existing nuclear, coal, and hydro units as well as the modern simple-cycle combustion turbine (“CT”) and CCGT units are expected to remain viable during the planning period. Older technology gas fired units with heat rates around 10,000 Btu/kWh are economic for load following roles at current expectations for natural gas prices and carbon legislation. However, as generating units age it is reasonable to expect that their maintenance requirements may increase and/or that their reliability may decrease. Therefore, some currently operable gas-fired generating units will likely be deactivated during the planning period. Others will continue to operate. In some cases additional investment may be warranted to maintain performance.
Figure EGSL-9 shows the deactivation assumptions that form the basis for estimating EGSL’s resource needs. However, as indicated above, a decision has not been made to actually deactivate any specific unit.
8 A more complete discussion of the process for evaluating potential unit deactivations is discussed in Chapter 8 of the SRP.
Attachment 4 Docket R-30021 Page 18 of 29
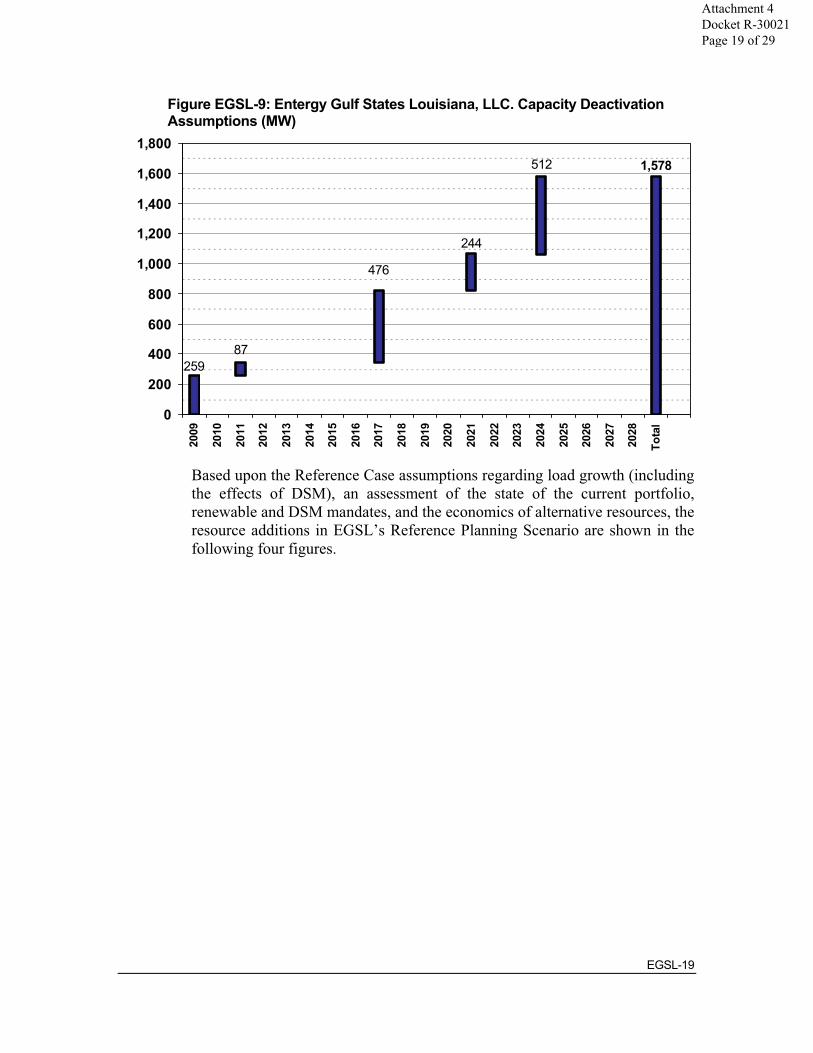
EGSL-19
Figure EGSL-9: Entergy Gulf States Louisiana, LLC. Capacity Deactivation Assumptions (MW)
Based upon the Reference Case assumptions regarding load growth (including the effects of DSM), an assessment of the state of the current portfolio, renewable and DSM mandates, and the economics of alternative resources, the resource additions in EGSL’s Reference Planning Scenario are shown in the following four figures.
1,578512
244
476
87259
0
200
400
600
800
1,000
1,200
1,400
1,600
1,800
2009
2010
2011
2012
2013
2014
2015
2016
2017
2018
2019
2020
2021
2022
2023
2024
2025
2026
2027
2028
Tota
l
Attachment 4 Docket R-30021 Page 19 of 29
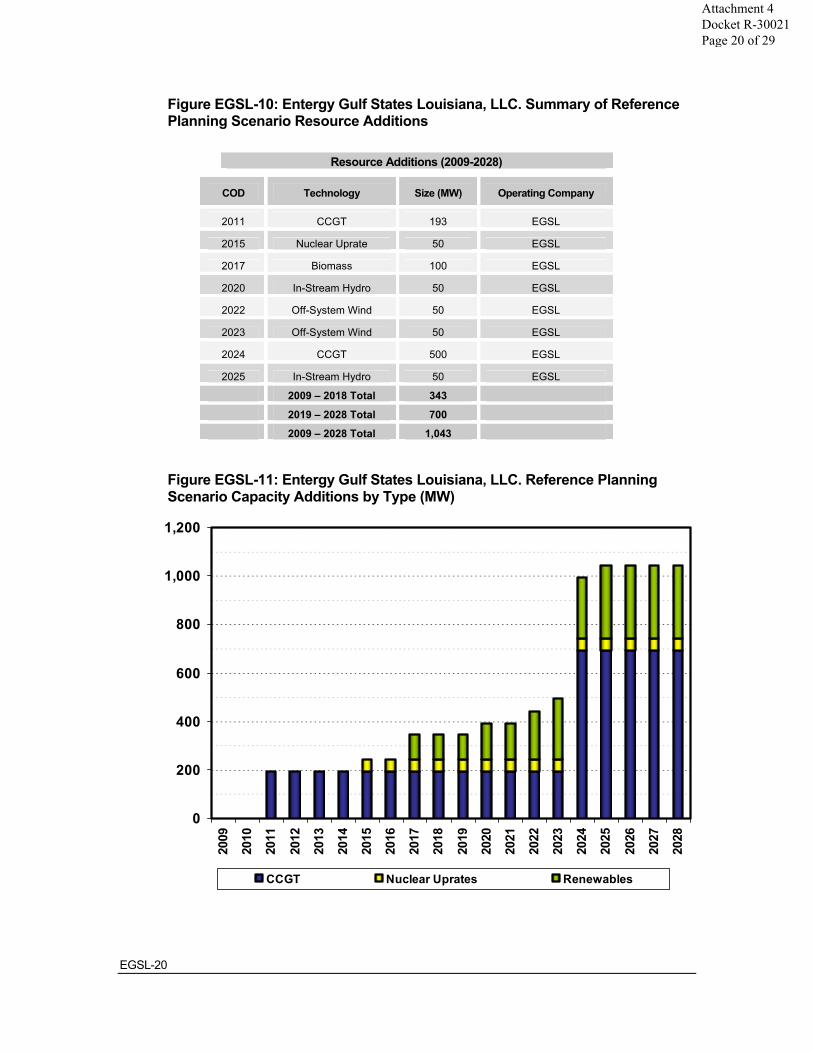
EGSL-20
Figure EGSL-10: Entergy Gulf States Louisiana, LLC. Summary of Reference Planning Scenario Resource Additions
Resource Additions (2009-2028)
COD Technology Size (MW) Operating Company
2011 CCGT 193 EGSL
2015 Nuclear Uprate 50 EGSL
2017 Biomass 100 EGSL
2020 In-Stream Hydro 50 EGSL
2022 Off-System Wind 50 EGSL
2023 Off-System Wind 50 EGSL
2024 CCGT 500 EGSL
2025 In-Stream Hydro 50 EGSL
2009 – 2018 Total 343
2019 – 2028 Total 700
2009 – 2028 Total 1,043
Figure EGSL-11: Entergy Gulf States Louisiana, LLC. Reference Planning Scenario Capacity Additions by Type (MW)
0
200
400
600
800
1,000
1,200
2009
2010
2011
2012
2013
2014
2015
2016
2017
2018
2019
2020
2021
2022
2023
2024
2025
2026
2027
2028
CCGT Nuclear Uprates Renewables
Attachment 4 Docket R-30021 Page 20 of 29
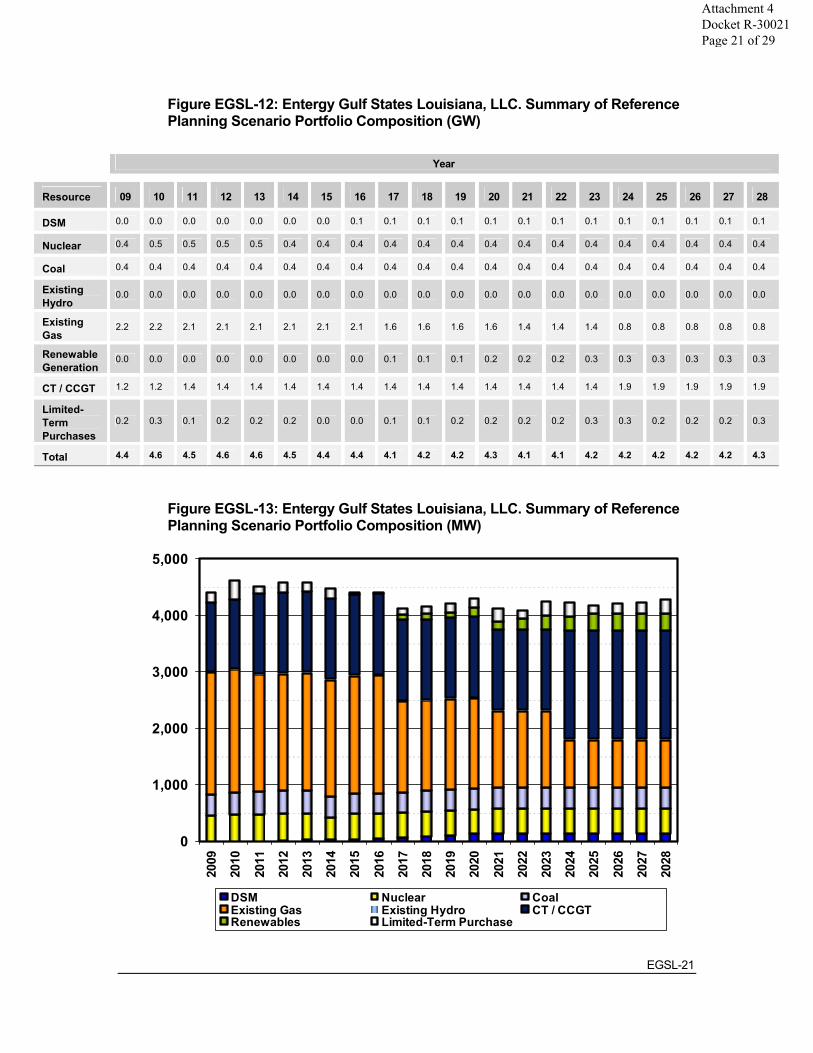
EGSL-21
Figure EGSL-12: Entergy Gulf States Louisiana, LLC. Summary of Reference Planning Scenario Portfolio Composition (GW)
Year
Resource 09 10 11 12 13 14 15 16 17 18 19 20 21 22 23 24 25 26 27 28
DSM 0.0 0.0 0.0 0.0 0.0 0.0 0.0 0.1 0.1 0.1 0.1 0.1 0.1 0.1 0.1 0.1 0.1 0.1 0.1 0.1
Nuclear 0.4 0.5 0.5 0.5 0.5 0.4 0.4 0.4 0.4 0.4 0.4 0.4 0.4 0.4 0.4 0.4 0.4 0.4 0.4 0.4
Coal 0.4 0.4 0.4 0.4 0.4 0.4 0.4 0.4 0.4 0.4 0.4 0.4 0.4 0.4 0.4 0.4 0.4 0.4 0.4 0.4
ExistingHydro
0.0 0.0 0.0 0.0 0.0 0.0 0.0 0.0 0.0 0.0 0.0 0.0 0.0 0.0 0.0 0.0 0.0 0.0 0.0 0.0
ExistingGas
2.2 2.2 2.1 2.1 2.1 2.1 2.1 2.1 1.6 1.6 1.6 1.6 1.4 1.4 1.4 0.8 0.8 0.8 0.8 0.8
Renewable Generation
0.0 0.0 0.0 0.0 0.0 0.0 0.0 0.0 0.1 0.1 0.1 0.2 0.2 0.2 0.3 0.3 0.3 0.3 0.3 0.3
CT / CCGT 1.2 1.2 1.4 1.4 1.4 1.4 1.4 1.4 1.4 1.4 1.4 1.4 1.4 1.4 1.4 1.9 1.9 1.9 1.9 1.9
Limited-TermPurchases
0.2 0.3 0.1 0.2 0.2 0.2 0.0 0.0 0.1 0.1 0.2 0.2 0.2 0.2 0.3 0.3 0.2 0.2 0.2 0.3
Total 4.4 4.6 4.5 4.6 4.6 4.5 4.4 4.4 4.1 4.2 4.2 4.3 4.1 4.1 4.2 4.2 4.2 4.2 4.2 4.3
Figure EGSL-13: Entergy Gulf States Louisiana, LLC. Summary of Reference Planning Scenario Portfolio Composition (MW)
0
1,000
2,000
3,000
4,000
5,000
2009
2010
2011
2012
2013
2014
2015
2016
2017
2018
2019
2020
2021
2022
2023
2024
2025
2026
2027
2028
DSM Nuclear CoalExisting Gas Existing Hydro CT / CCGTRenewables Limited-Term Purchase
Attachment 4 Docket R-30021 Page 21 of 29
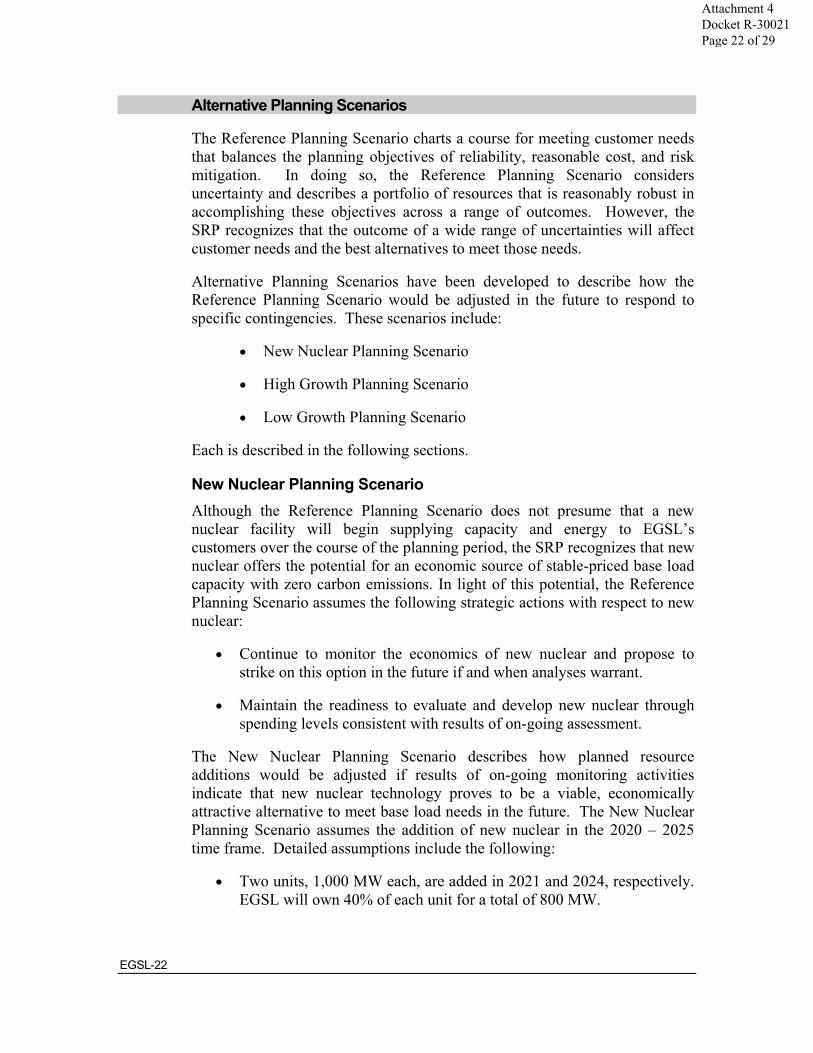
EGSL-22
Alternative Planning Scenarios
The Reference Planning Scenario charts a course for meeting customer needs that balances the planning objectives of reliability, reasonable cost, and risk mitigation. In doing so, the Reference Planning Scenario considers uncertainty and describes a portfolio of resources that is reasonably robust in accomplishing these objectives across a range of outcomes. However, the SRP recognizes that the outcome of a wide range of uncertainties will affect customer needs and the best alternatives to meet those needs.
Alternative Planning Scenarios have been developed to describe how the Reference Planning Scenario would be adjusted in the future to respond to specific contingencies. These scenarios include:
� New Nuclear Planning Scenario
� High Growth Planning Scenario
� Low Growth Planning Scenario
Each is described in the following sections.
New Nuclear Planning Scenario Although the Reference Planning Scenario does not presume that a new nuclear facility will begin supplying capacity and energy to EGSL’s customers over the course of the planning period, the SRP recognizes that new nuclear offers the potential for an economic source of stable-priced base load capacity with zero carbon emissions. In light of this potential, the Reference Planning Scenario assumes the following strategic actions with respect to new nuclear:
� Continue to monitor the economics of new nuclear and propose to strike on this option in the future if and when analyses warrant.
� Maintain the readiness to evaluate and develop new nuclear through spending levels consistent with results of on-going assessment.
The New Nuclear Planning Scenario describes how planned resource additions would be adjusted if results of on-going monitoring activities indicate that new nuclear technology proves to be a viable, economically attractive alternative to meet base load needs in the future. The New Nuclear Planning Scenario assumes the addition of new nuclear in the 2020 – 2025 time frame. Detailed assumptions include the following:
� Two units, 1,000 MW each, are added in 2021 and 2024, respectively. EGSL will own 40% of each unit for a total of 800 MW.
Attachment 4 Docket R-30021 Page 22 of 29

EGSL-23
� Given lead times associated with new nuclear development, it is not anticipated that new nuclear could be incorporated into portfolios prior to the second half of the planning horizon.
� The unit capacity assumptions are generic representations of potential new nuclear unit additions and do not reflect an assumption as to the specific technology chosen. The actual unit size and number of units would depend on technology selected.
� If new nuclear is determined to be economic, it is not anticipated that more than 2,000 MW of new nuclear could be added in this planning horizon. The capital cost and challenges associated with development and construction limit the amount of new nuclear that realistically could be deployed within a defined time period.
� The GE ESBWR technology contemplates a unit size of about 1,500 MW. The Nuclear Planning Scenario assumes that if this technology were chosen, only one unit would be deployable within the planning horizon.
� New nuclear additions would be expected to replace comparable amounts of CCGT capacity in the Reference Planning Scenario.
Figure EGSL-14: Entergy Gulf States Louisiana, LLC. Summary of New Nuclear Planning Scenario Portfolio Composition (GW)
Year
Resource 09 10 11 12 13 14 15 16 17 18 19 20 21 22 23 24 25 26 27 28
DSM - - 0.0 0.0 0.0 0.0 0.0 0.1 0.1 0.1 0.1 0.1 0.1 0.1 0.1 0.1 0.1 0.1 0.1 0.1
Nuclear 0.4 0.5 0.5 0.5 0.5 0.4 0.4 0.4 0.4 0.4 0.4 0.4 0.8 0.8 0.8 1.2 1.2 1.2 1.2 1.2
Coal 0.4 0.4 0.4 0.4 0.4 0.4 0.4 0.4 0.4 0.4 0.4 0.4 0.4 0.4 0.4 0.4 0.4 0.4 0.4 0.4
ExistingHydro 0.0 0.0 0.0 0.0 0.0 0.0 0.0 0.0 0.0 0.0 0.0 0.0 0.0 0.0 0.0 0.0 0.0 0.0 0.0 0.0
ExistingGas 2.2 2.2 2.1 2.1 2.1 2.1 2.1 2.1 1.6 1.6 1.6 1.6 1.4 1.4 1.4 0.8 0.8 0.8 0.8 0.8
Renewable Generation - - - - - - - - 0.1 0.1 0.1 0.2 0.2 0.2 0.3 0.3 0.3 0.3 0.3 0.3
CT / CCGT 1.2 1.2 1.4 1.4 1.4 1.4 1.4 1.4 1.4 1.4 1.4 1.4 1.4 1.4 1.4 1.4 1.4 1.4 1.4 1.4
Limited-TermPurchases
0.2 0.3 0.1 0.2 0.2 0.2 0.0 0.0 0.1 0.1 0.2 0.2 0.0 0.1 0.2 0.3 0.3 0.2 0.2 0.2
Total 4.4 4.6 4.5 4.6 4.6 4.5 4.4 4.4 4.1 4.2 4.2 4.3 4.3 4.4 4.6 4.5 4.6 4.5 4.5 4.6
Attachment 4 Docket R-30021 Page 23 of 29

EGSL-24
Figure EGSL-15: Entergy Gulf States Louisiana, LLC. Summary of New Nuclear Planning Scenario Portfolio Composition (MW)
Carbon Implications Nuclear generation results in zero carbon emissions. Consequently, replacing CCGT capacity with new nuclear capacity would be expected to result in a lower carbon footprint.
High Growth Planning Scenario As described above, EGSL’s overall capacity needs will depend on load growth. In addition to a reference case, the load forecast described above includes both high and low load growth projections. The High Growth Planning Scenario describes how planned resource additions would be adjusted if actual load growth tends toward the upper forecast. The High Growth Planning Scenario assumes that additional supply-side resources would be required over the planning horizon in order to meet higher projected loads. Detailed assumptions include the following:
� Load growth averages about 2.0% over the 20 year planning horizon.
� As a result, the 4-company Operating System (post EAI and EMI exit) will need 2,000 MW of incremental capacity to meet reliability needs. 1,000 MW, of the total 2,000 MW, may be added to EGSL’s planned
0
1,000
2,000
3,000
4,000
5,000
2010
2011
2012
2013
2014
2015
2016
2017
2018
2019
2020
2021
2022
2023
2024
2025
2026
2027
2028
2009
DSM Nuclear CoalExisting Gas Existing Hydro CT / CCGTRenewables Limited-Term Purchase
Attachment 4 Docket R-30021 Page 24 of 29
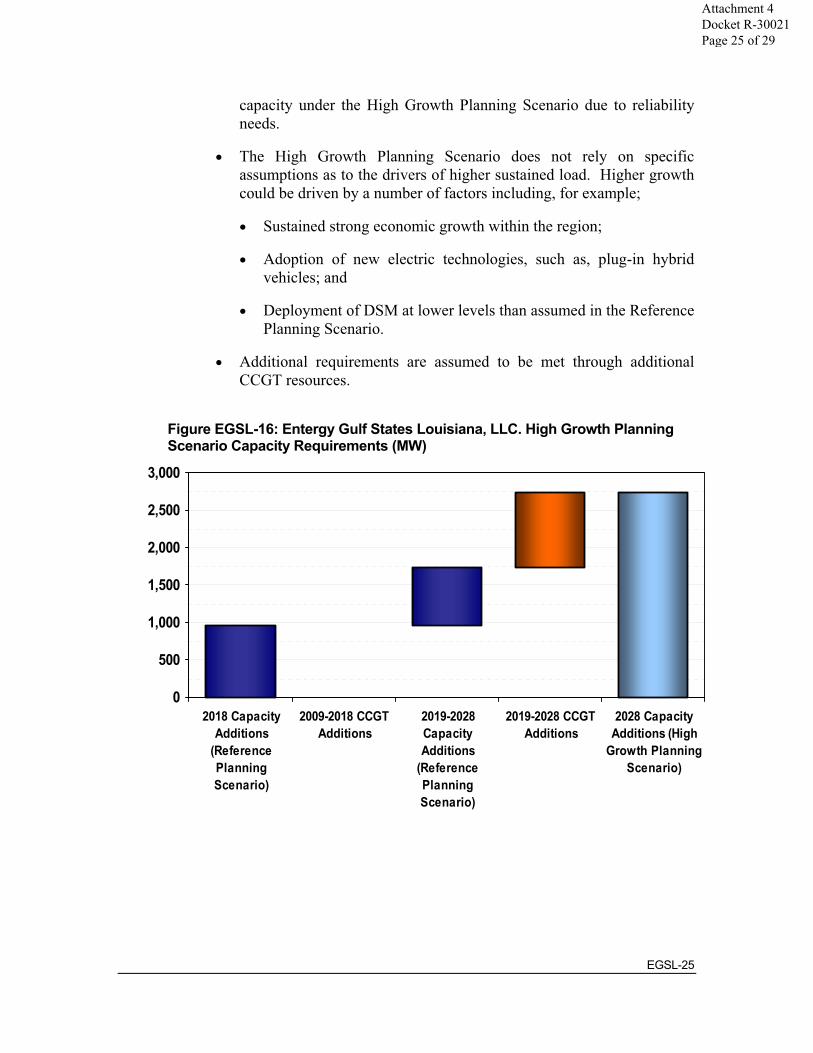
EGSL-25
capacity under the High Growth Planning Scenario due to reliability needs.
� The High Growth Planning Scenario does not rely on specific assumptions as to the drivers of higher sustained load. Higher growth could be driven by a number of factors including, for example;
� Sustained strong economic growth within the region;
� Adoption of new electric technologies, such as, plug-in hybrid vehicles; and
� Deployment of DSM at lower levels than assumed in the Reference Planning Scenario.
� Additional requirements are assumed to be met through additional CCGT resources.
Figure EGSL-16: Entergy Gulf States Louisiana, LLC. High Growth Planning Scenario Capacity Requirements (MW)
0
500
1,000
1,500
2,000
2,500
3,000
2018 CapacityAdditions
(ReferencePlanningScenario)
2009-2018 CCGTAdditions
2019-2028CapacityAdditions
(ReferencePlanningScenario)
2019-2028 CCGTAdditions
2028 CapacityAdditions (High
Growth PlanningScenario)
Attachment 4 Docket R-30021 Page 25 of 29
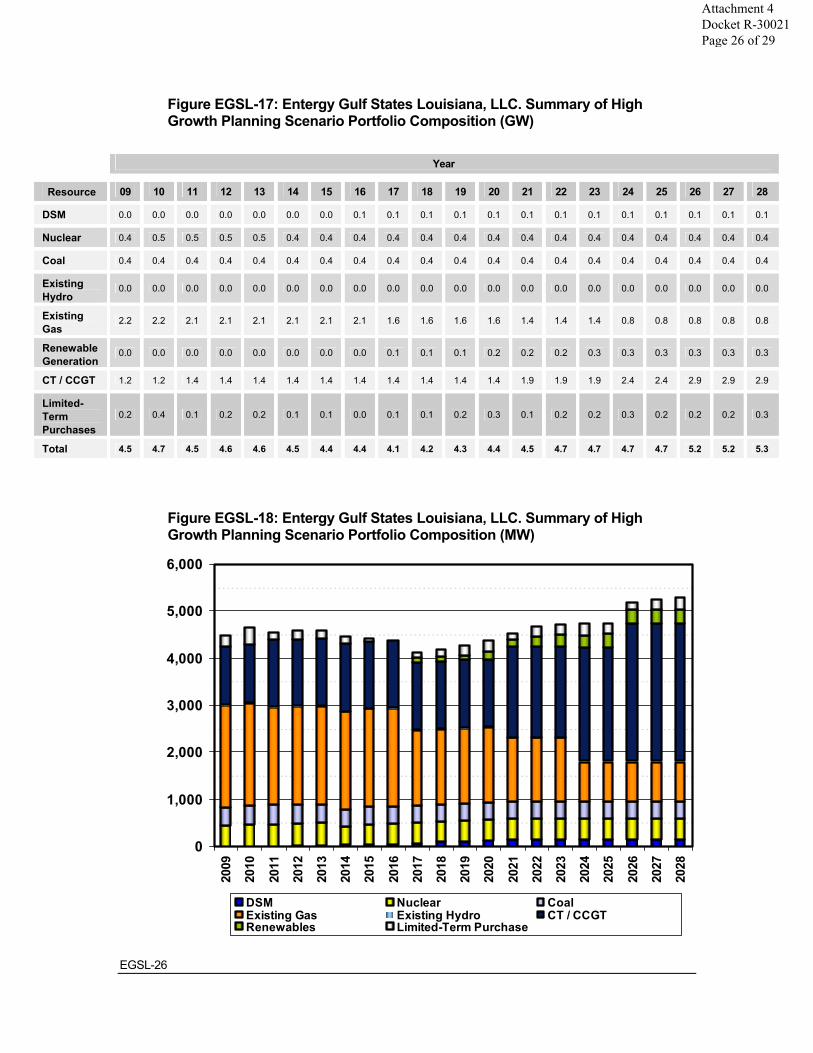
EGSL-26
Figure EGSL-17: Entergy Gulf States Louisiana, LLC. Summary of High Growth Planning Scenario Portfolio Composition (GW)
Year
Resource 09 10 11 12 13 14 15 16 17 18 19 20 21 22 23 24 25 26 27 28
DSM 0.0 0.0 0.0 0.0 0.0 0.0 0.0 0.1 0.1 0.1 0.1 0.1 0.1 0.1 0.1 0.1 0.1 0.1 0.1 0.1
Nuclear 0.4 0.5 0.5 0.5 0.5 0.4 0.4 0.4 0.4 0.4 0.4 0.4 0.4 0.4 0.4 0.4 0.4 0.4 0.4 0.4
Coal 0.4 0.4 0.4 0.4 0.4 0.4 0.4 0.4 0.4 0.4 0.4 0.4 0.4 0.4 0.4 0.4 0.4 0.4 0.4 0.4
ExistingHydro
0.0 0.0 0.0 0.0 0.0 0.0 0.0 0.0 0.0 0.0 0.0 0.0 0.0 0.0 0.0 0.0 0.0 0.0 0.0 0.0
ExistingGas
2.2 2.2 2.1 2.1 2.1 2.1 2.1 2.1 1.6 1.6 1.6 1.6 1.4 1.4 1.4 0.8 0.8 0.8 0.8 0.8
Renewable Generation
0.0 0.0 0.0 0.0 0.0 0.0 0.0 0.0 0.1 0.1 0.1 0.2 0.2 0.2 0.3 0.3 0.3 0.3 0.3 0.3
CT / CCGT 1.2 1.2 1.4 1.4 1.4 1.4 1.4 1.4 1.4 1.4 1.4 1.4 1.9 1.9 1.9 2.4 2.4 2.9 2.9 2.9
Limited-TermPurchases
0.2 0.4 0.1 0.2 0.2 0.1 0.1 0.0 0.1 0.1 0.2 0.3 0.1 0.2 0.2 0.3 0.2 0.2 0.2 0.3
Total 4.5 4.7 4.5 4.6 4.6 4.5 4.4 4.4 4.1 4.2 4.3 4.4 4.5 4.7 4.7 4.7 4.7 5.2 5.2 5.3
Figure EGSL-18: Entergy Gulf States Louisiana, LLC. Summary of High Growth Planning Scenario Portfolio Composition (MW)
0
1,000
2,000
3,000
4,000
5,000
6,000
2009
2010
2011
2012
2013
2014
2015
2016
2017
2018
2019
2020
2021
2022
2023
2024
2025
2026
2027
2028
DSM Nuclear CoalExisting Gas Existing Hydro CT / CCGTRenewables Limited-Term Purchase
Attachment 4 Docket R-30021 Page 26 of 29

EGSL-27
Low Growth Planning Scenario The Low Growth Planning Scenario describes how planned resource additions would be adjusted if actual load growth tends toward the lower forecast. Load growth averages about 0.5% over the twenty year planning horizon in the Low Growth Planning Scenario. This scenario assumes that, as compared to the Reference Planning Scenario, fewer supply-side resources would be required over the planning horizon in order to meet lower projected load growth.
� The Low Growth Planning Scenario does not rely on specific assumptions as to the drivers of lower load. Lower loads could result from a number of factors including, for example:
� Sustained weak economic growth within the region;
� Adoption of energy efficiency by end use customers; and
� Higher levels of DSM deployment than assumed in the Reference Planning Scenario.
As a result, compared with the Reference Planning Scenario, 1,000 MW less of incremental capacity is needed to meet reliability needs over the twenty year planning horizon for the 4-company Operating System (post EAI and EMI exit). EGSL’s planned capacity under the Low Growth Planning Scenario is not expected to vary from that under the Reference Planning Scenario. Instead, 1,000 MW of incremental capacity would be reduced within ETI’s jurisdiction, due to lower reliability requirements.
Other Key Portfolio Drivers
The Alternative Planning Scenarios described above provide guidance relating to the effect of uncertainties pertaining to load growth and new nuclear. The outcomes of these uncertainties are unknown at this time. But, the implications of these uncertainties on portfolio design and the range of foreseeable outcomes suggest both a potential benefit from developing alternative scenarios and a reasonable basis for doing so.
It is not possible, however, to predict all the factors that may affect portfolio design over the next 20 years. In the case of many other drivers the uncertainties become so unknown or so speculative, that constructing specific alternative planning scenarios becomes practically impossible or, at least, of little planning value. In some cases the drivers themselves may not be identifiable at this time. The strategic flexibility inherent in the Reference Planning Scenario (described in an earlier section within this chapter) provides the key tool for responding to changing circumstances. However, two additional uncertainties, while not incorporated into alternative planning
Attachment 4 Docket R-30021 Page 27 of 29

EGSL-28
scenarios merit additional discussion, plant betterment opportunities and renewable generation alternatives.
Plant Betterment Initiative The Reference Planning Scenario assumes that 1,578 MW of EGSL’s existing gas-fired generation is deactivated over the coming twenty years. These deactivation assumptions were developed for long-range planning purposes, as a basis for assessing long-term incremental capacity needs, and not as a schedule of retirements for existing units. While the assumptions about unit deactivations consider knowledge of unit condition and expectations about future operating role, these assumptions do not represent a decision to deactivate any particular unit. Specific unit portfolio decisions are made during the tactical business planning process (three-year planning horizon) based on economic and technical evaluation considering projected forward cost, anticipated operating roles, and cost of supply alternatives.
Plant betterment activities involve proactive repair and replacement of specific components to maintain capability and safety of a generating unit. These repairs and replacements are consistent with OEM/Vendor recommendations and good utility practice. Some of the existing gas-fired generating units may be candidates for refurbishment and/or upgrade beyond proactive repair and replacement.
Planners and plant engineers are currently assessing potential opportunities presented by older gas-fired resources. In some cases continued additional spending at these units may provide customers with economic benefits by deferring more expensive incremental capacity needs. This analysis is on-going and is anticipated to result in preliminary recommendations over the next twelve months. To the extent the analysis results in recommendations to proactively maintain existing gas-fired resources in operation beyond currently assumed deactivation dates, the Reference Planning Scenario would be adjusted accordingly by deferring incremental CCGT additions or reducing limited-term purchases or both.
Renewable Generation The Reference Planning Scenario assumes that 300 MW of renewable generation is added over the twenty year planning horizon and provides assumptions about what type of technology might be deployed to achieve that level. These assumptions are based on current information about technology cost and availability, including projections of long-term cost for emerging technologies such as in-stream hydro. The actual amount and type of renewable generation that will be deployed over the 20 year planning horizon will depend on actual prices, availability, as well as consideration of any federal and/or state mandates. Depending on possible federal and/or state
Attachment 4 Docket R-30021 Page 28 of 29

EGSL-29
legislation, the Entergy Operating Companies may conduct a RFP for renewable resources within the next twelve months. The results of that effort should provide additional information about the potential for renewable generation. In the event that economic renewable generation cannot be identified in levels assumed in the Reference Planning Scenario, additional CCGT capacity would be anticipated to meet reliability requirements.
Attachment 4 Docket R-30021 Page 29 of 29