Engineering High Energy Density Sodium Battery Anodes for ...
37
doi.org/10.26434/chemrxiv.11691714.v2 Engineering High Energy Density Sodium Battery Anodes for Improved Cycling with Superconcentrated Ionic Liquid Electrolytes Dmitrii A. Rakov, Fangfang Chen, Shammi A. Ferdousi, Hua Li, Thushan Pathirana, Alexandr Simonov, Patrick C. Howlett, Rob Atkin, Maria Forsyth Submitted date: 30/01/2020 • Posted date: 30/01/2020 Licence: CC BY-NC-ND 4.0 Citation information: Rakov, Dmitrii A.; Chen, Fangfang; Ferdousi, Shammi A.; Li, Hua; Pathirana, Thushan; Simonov, Alexandr; et al. (2020): Engineering High Energy Density Sodium Battery Anodes for Improved Cycling with Superconcentrated Ionic Liquid Electrolytes. ChemRxiv. Preprint. https://doi.org/10.26434/chemrxiv.11691714.v2 Non-uniform metal deposition and dendrite formation in high density energy storage devices reduces the efficiency, safety, and life of batteries with metal anodes. Superconcentrated ionic liquid (IL) electrolytes (e.g. 1:1 IL:alkali ion) coupled with anode preconditioning at more negative potentials can completely mitigate these issues, and therefore revolutionize high density energy storage devices. However, the mechanisms by which very high salt concentration and preconditioning potential enable uniform metal deposition and prevent dendrite formation at the metal anode during cycling are poorly understood, and therefore not optimized. Here, we use atomic-force microscopy and molecular dynamics simulations to unravel the influence of these factors on the interface chemistry in a sodium electrolyte, demonstrating how a molten salt like structure at the electrode surface results in dendrite free metal cycling at higher rates. Such a structure will support the formation of a more favorable solid electrolyte interphase (SEI) accepted as being a critical factor in stable battery cycling. This new understanding will enable engineering of efficient anode electrodes by tuning interfacial nanostructure via salt concentration and high voltage preconditioning. File list (2) download file view on ChemRxiv supplementary.pdf (5.03 MiB) download file view on ChemRxiv Manuscript-V1.pdf (2.06 MiB)
Transcript of Engineering High Energy Density Sodium Battery Anodes for ...

doi.org/10.26434/chemrxiv.11691714.v2
Engineering High Energy Density Sodium Battery Anodes for ImprovedCycling with Superconcentrated Ionic Liquid ElectrolytesDmitrii A. Rakov, Fangfang Chen, Shammi A. Ferdousi, Hua Li, Thushan Pathirana, Alexandr Simonov,Patrick C. Howlett, Rob Atkin, Maria Forsyth
Submitted date: 30/01/2020 • Posted date: 30/01/2020Licence: CC BY-NC-ND 4.0Citation information: Rakov, Dmitrii A.; Chen, Fangfang; Ferdousi, Shammi A.; Li, Hua; Pathirana, Thushan;Simonov, Alexandr; et al. (2020): Engineering High Energy Density Sodium Battery Anodes for ImprovedCycling with Superconcentrated Ionic Liquid Electrolytes. ChemRxiv. Preprint.https://doi.org/10.26434/chemrxiv.11691714.v2
Non-uniform metal deposition and dendrite formation in high density energy storage devices reduces theefficiency, safety, and life of batteries with metal anodes. Superconcentrated ionic liquid (IL) electrolytes (e.g.1:1 IL:alkali ion) coupled with anode preconditioning at more negative potentials can completely mitigate theseissues, and therefore revolutionize high density energy storage devices. However, the mechanisms by whichvery high salt concentration and preconditioning potential enable uniform metal deposition and preventdendrite formation at the metal anode during cycling are poorly understood, and therefore not optimized. Here,we use atomic-force microscopy and molecular dynamics simulations to unravel the influence of these factorson the interface chemistry in a sodium electrolyte, demonstrating how a molten salt like structure at theelectrode surface results in dendrite free metal cycling at higher rates. Such a structure will support theformation of a more favorable solid electrolyte interphase (SEI) accepted as being a critical factor in stablebattery cycling. This new understanding will enable engineering of efficient anode electrodes by tuninginterfacial nanostructure via salt concentration and high voltage preconditioning.
File list (2)
download fileview on ChemRxivsupplementary.pdf (5.03 MiB)
download fileview on ChemRxivManuscript-V1.pdf (2.06 MiB)

Supplementary Information for
Engineering high energy density Na battery anodes for improved
cycling with superconcentrated ionic liquid electrolytes
Dmitrii A. Rakov1,2, Fangfang Chen1,2*, Shammi A. Ferdousi1, Hua Li3, Thushan
Pathirana1, Alexandr N. Simonov4, Patrick C. Howlett1,2, Rob Atkin3, Maria Forsyth1,2*
1Institute for Frontier Materials, Deakin University, Geelong, VIC 3217, Australia. 2ARC
Centre of Excellence for Electromaterials Science (ACES), Deakin University, Burwood, 3125,
Australia. 3School of Molecular Sciences, University of Western Australia, 35 Stirling
Highway, Crawley, 6009, Australia. 4School of Chemistry, Monash University and the ARC
Centre of Excellence for Electromaterials Science, Clayton, 3800, Australia. Correspondence
and request for materials should be addressed to M. F. (email: [email protected])
and F. C. (email: [email protected]).
Computational details
The neat IL system consist of 216 C3mpyrFSI ion pairs (IPs) which are packed in a cubic
simulation box randomly using Packmol code1. The IL/salt systems are prepared by replacing
22 and 108 C3mpyrFSI with NaFSI salt for two salt concentrations of 10 and 50 mol%,
respectively. All IL systems are equilibrated firstly at both 293, 348 and 393 K for more than
10s ns using the NPT ensemble and the Nose-Hoover and Parrinello-Rahman methods for
temperature and pressure coupling. The densities were calculated through additional 7 ns MD
trajectory. The pressure is set at 1 bar. The electrostatic interactions were computed using PME
methods. A FTT grid spacing of 0.1 nm and cubic interpolation for charge distribution were
used to compute electrostatic interaction in reciprocal space. The cut-off distance of 1.2 nm
was adopted for electrostatics and Van der Waals interactions. The LINCS algorithm was used
to constrain the C-H bond. The Velocity Verlet integrator was adopted with a time step of 1 fs.
Trajectories were analysed by MDAnalysis code whenever the respective tool was unavailable
in GROMACS2. The simulated bulk phase densities are given in Supplementary Table 1 and
are compared with available experimental data (values in parentheses), and the errors are within
0.07–1.6% for both neat IL and IL/salt systems, suggesting the good consistency between the
simulation and experimental results.
Atomic force microscopy measurements and the water effect
Atomic force microscopy (AFM) measurements were conducted at ambient condition. Each IL
system was measured at least three times to ensure the results are reproducible. The ILs for
AFM studies were kept in degassed desiccator, and water content was also measured and did
not exceed 300 ppm in 10 days.
Previously, it was reported in AFM experiments that a large amount of water will affect both
the position and number of interfacial layered nanostructures3,4,5,6. Thereby, we also
investigated the impact of low water content (< 300 ppm) on the interfacial nanostructure of
current systems by mean of MD simulations. The force field of water adopted is the TIP3P
model7. The wet electrolytes were simulated at both PZC and -0.5 V vs. PZC voltage based on
the same procedure used for the dry system simulation. The 393 K was simulated to allow the
system to gain sufficient dynamics, and it was found previously that the temperature does not
significantly change the density profile when using the flat electrode surface through either the
non-polarisable force field with constant charge electrode8 or polarizable force field with
constant potential electrode9. The number density profiles of both cation, anion and Na+ were
calculated and compared with the results from dry system simulation in Supplementary Figure
2. It is found that the presence of 300 ppm of water does not significantly affect either the

position or the number of peaks of the number density profile of all ion species. Therefore, this
can eliminate concerns about a significant effect from a small amount of water on the interfacial
nanostructure. The shape of the innermost peaks was almost unaffected for C3mpyr. The peak
intensity of anions changes slightly, but the main characteristics of the peak in the dry system
remain in the wet system. The further discussion of water effect is our future work.
Supplementary Table 1. Simulated mass density (g/cm3) and box volume for neat C3mpyrFSI
IL and 10 and 50 mol% salt system at 298, 348, and 393 K. The experimental results10,11 are

given in brackets and compared with simulation results. The error of density is given in D=
(DMD-Dexp)/Dexp ´ 100%.
Supplementary Table 2. The charge densities ascribed to top layer of gold electrode used for
different electrostatic potential for both neat IL and IL/salt systems.
Salt concentration 0 mol% 10 mol% 50 mol%
Surface charge density, e/nm2 -0.13 -0.34 -0.14 -0.36 –0.23 -0.57
Voltage vs. PZC, V -0.5 -1.25 -0.5 -1.25 -0.5 -1.25
Supplementary Table 3. The average number of C3mpyr, FSI and Na in the innermost layer
within 0.61 nm from Au(111) surface, calculated over the 40 ns of MD trajectory file.
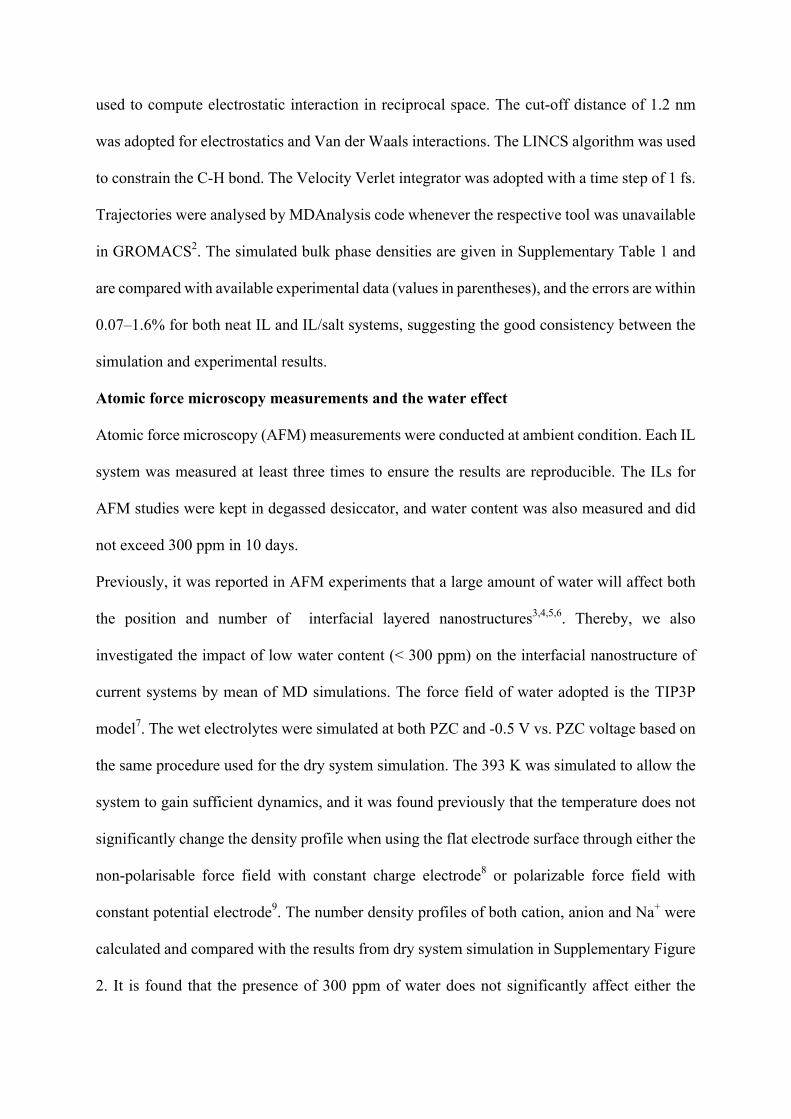
Supplementary Figure 1. Visual representation of electrolyte species and simulation box for
50 mol% NaFSI in C3mpyrFSI confined by two Au(111) electrodes.

Supplementary Figure 2. Number density profiles for cation, anion and sodium in (a-b) 0
mol%, (c-d)10 mol% and (e-f) 50 mol% system for both dry system and wet system with 300
ppm of water.

Supplementary Figure 3. Radial distribution function (RDF) of Na-FSI calculated at different
Z intervals (z) from the Au(111) surface at (a-c) PZC and (d-f) -0.5 V vs. PZC.
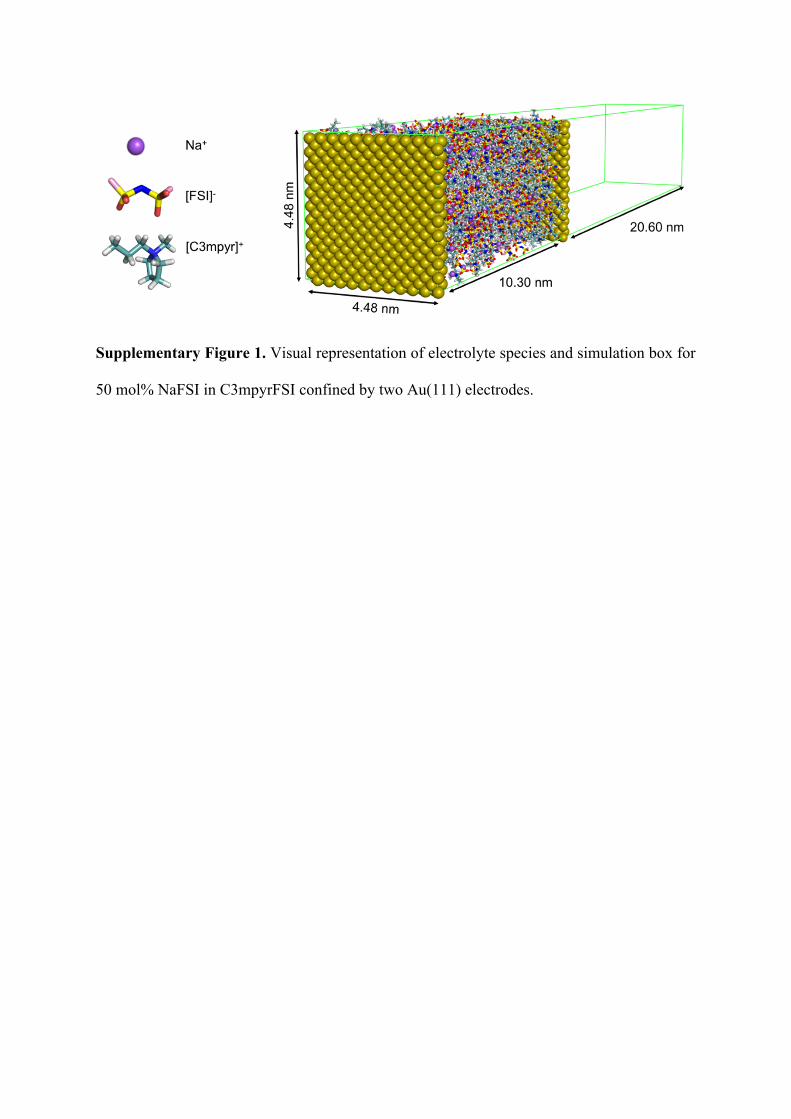
Supplementary Figure 4. Variation of the number of Na+ in the innermost layer near the
Au(111) surface with different applied potentials over time. The less noisy lines of the 10 mol%
system suggest the low frequencies in the change of the Na+ number, i.e. the less hopping
events, which is in contrast with the 50 mol% system.
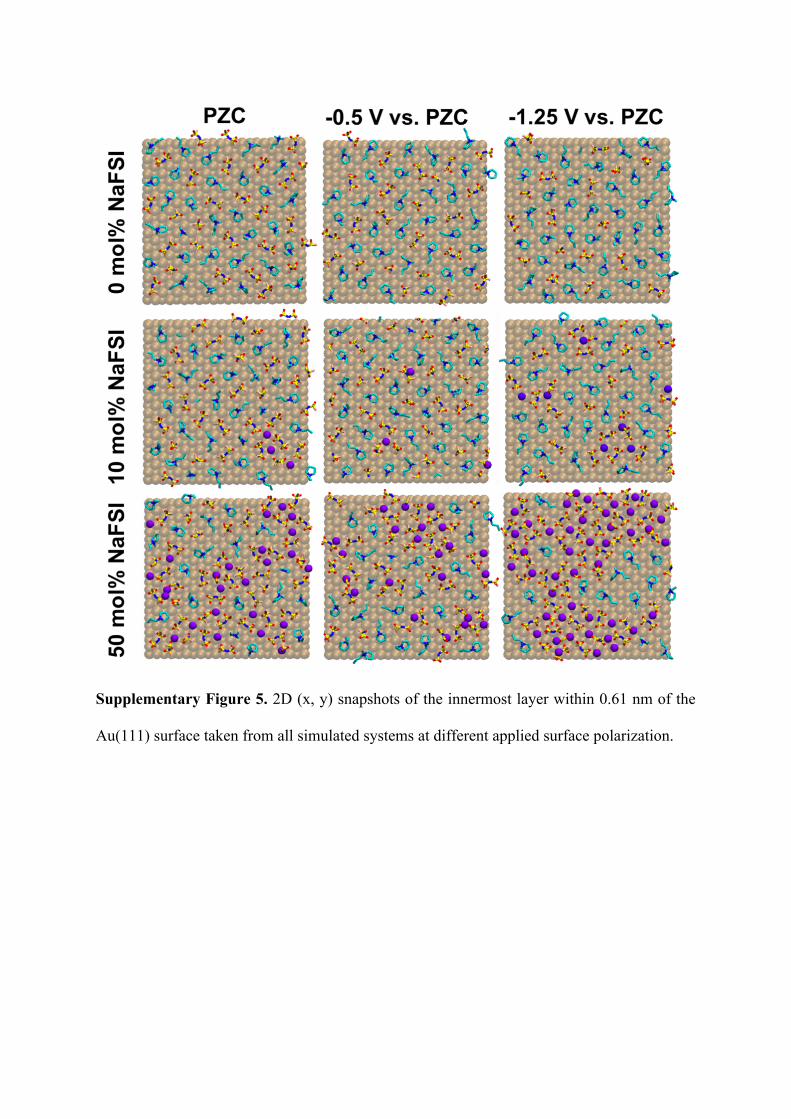
Supplementary Figure 5. 2D (x, y) snapshots of the innermost layer within 0.61 nm of the
Au(111) surface taken from all simulated systems at different applied surface polarization.

Supplementary Figure 6. (a) Representation of the selected normal vector (𝑛) which is
vertical to the pyrrolidinium ring. (b) Angle orientation distribution of vector (𝑛) relative to the
z axis calculated for [C3mpyr]+ in the innermost layer next to the Au(111) surface. The peaks
close to 90° and 0° / 180° stands for the [C3mpyr]+ ring perpendicular or parallel to the gold
surface, respectively.
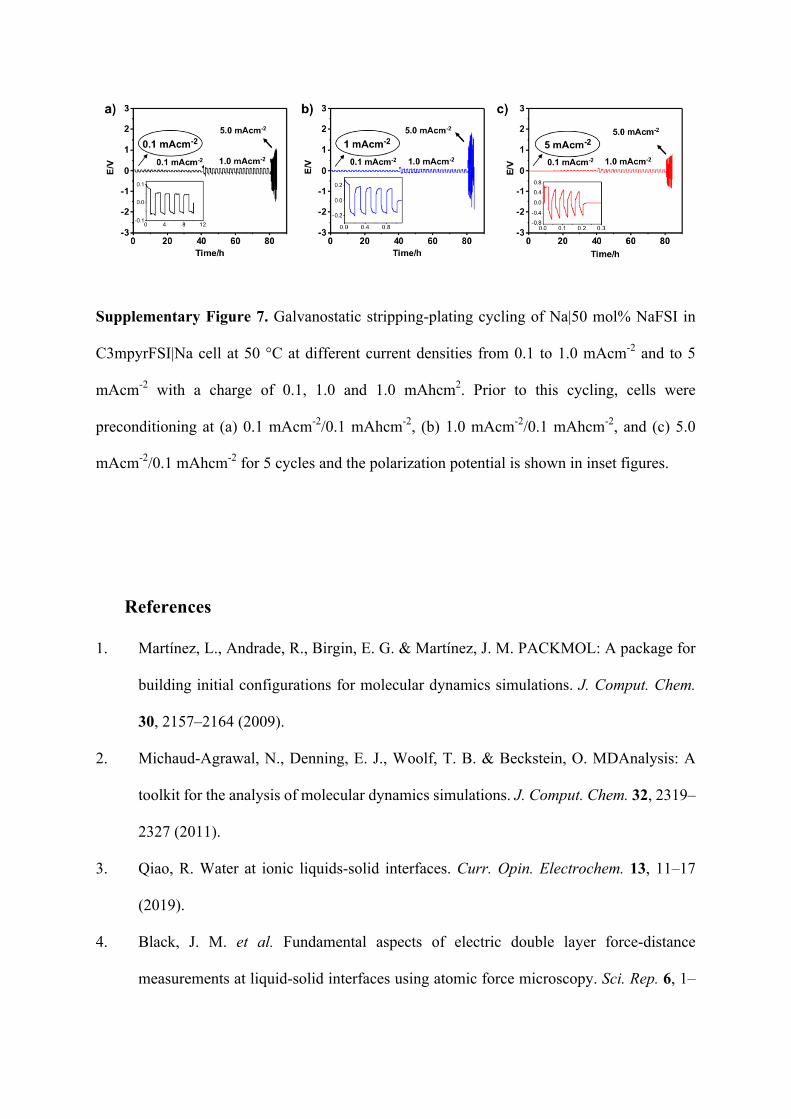
Supplementary Figure 7. Galvanostatic stripping-plating cycling of Na|50 mol% NaFSI in
C3mpyrFSI|Na cell at 50 °C at different current densities from 0.1 to 1.0 mAcm-2 and to 5
mAcm-2 with a charge of 0.1, 1.0 and 1.0 mAhcm2. Prior to this cycling, cells were
preconditioning at (a) 0.1 mAcm-2/0.1 mAhcm-2, (b) 1.0 mAcm-2/0.1 mAhcm-2, and (c) 5.0
mAcm-2/0.1 mAhcm-2 for 5 cycles and the polarization potential is shown in inset figures.
References
1. Martínez, L., Andrade, R., Birgin, E. G. & Martínez, J. M. PACKMOL: A package for
building initial configurations for molecular dynamics simulations. J. Comput. Chem.
30, 2157–2164 (2009).
2. Michaud-Agrawal, N., Denning, E. J., Woolf, T. B. & Beckstein, O. MDAnalysis: A
toolkit for the analysis of molecular dynamics simulations. J. Comput. Chem. 32, 2319–
2327 (2011).
3. Qiao, R. Water at ionic liquids-solid interfaces. Curr. Opin. Electrochem. 13, 11–17
(2019).
4. Black, J. M. et al. Fundamental aspects of electric double layer force-distance
measurements at liquid-solid interfaces using atomic force microscopy. Sci. Rep. 6, 1–
12 (2016).
5. Cheng, H. W. et al. The Effect of Water and Confinement on Self-Assembly of
Imidazolium Based Ionic Liquids at Mica Interfaces. Sci. Rep. 6, 1–9 (2016).
6. Sakai, K. et al. Effects of Water on Solvation Layers of Imidazolium-Type Room
Temperature Ionic Liquids on Silica and Mica. Langmuir 31, 6085–6091 (2015).
7. Bi, S. et al. Minimizing the electrosorption of water from humid ionic liquids on
electrodes. Nat. Commun. 9, (2018).
8. Begić, S. S. D., Chen, F., Jónsson, E. & Forsyth, M. Overscreening and crowding in
electrochemical ionic liquid systems. Phys. Rev. Mater. 3, 1–8 (2019).
9. Vatamanu, J., Xing, L., Li, W. & Bedrov, D. Influence of temperature on the capacitance
of ionic liquid electrolytes on charged surfaces. Phys. Chem. Chem. Phys. 16, 5174–
5182 (2014).
10. Matsumoto, K., Okamoto, Y., Nohira, T. & Hagiwara, R. Thermal and transport
properties of Na[N(SO2F)2]-[N-Methyl-N-propylpyrrolidinium][N(SO2F)2] ionic
liquids for Na secondary batteries. J. Phys. Chem. C 119, 7648–7655 (2015).
11. Chen, F., Howlett, P. & Forsyth, M. Na-Ion Solvation and High Transference Number
in Superconcentrated Ionic Liquid Electrolytes: A Theoretical Approach. J. Phys. Chem.
C 122, 105–114 (2018).

download fileview on ChemRxivsupplementary.pdf (5.03 MiB)

Engineering high energy density sodium battery anodes for
improved cycling with superconcentrated ionic liquid
electrolytes
Dmitrii A. Rakov1,2
, Fangfang Chen1,2*, Shammi A. Ferdousi
1, Hua Li
3, Thushan
Pathirana1, Alexandr N. Simonov
4, Patrick C. Howlett
1,2, Rob Atkin
3, Maria
Forsyth1,2*
1Institute for Frontier Materials, Deakin University, Geelong, VIC 3217, Australia.
2ARC
Centre of Excellence for Electromaterials Science (ACES), Deakin University, Burwood,
3125, Australia. 3School of Molecular Sciences, University of Western Australia, 35
Stirling Highway, Crawley, 6009, Australia. 4School of Chemistry and the ARC Centre of
Excellence for Electromaterials Science, Monash University, Clayton, 3800, Australia.
Correspondence and request for materials should be addressed to M. F. (email:
[email protected]) and F. C. (email: [email protected]).
Non-uniform metal deposition and dendrite formation in high density energy storage
devices reduces the efficiency, safety, and life of batteries with metal anodes.
Superconcentrated ionic liquid (IL) electrolytes (e.g. 1:1 IL:alkali ion) coupled with
anode preconditioning at more negative potentials can completely mitigate these
issues, and therefore revolutionize high density energy storage devices. However, the
mechanisms by which very high salt concentration and preconditioning potential
enable uniform metal deposition and prevent dendrite formation at the metal anode
during cycling are poorly understood, and therefore not optimized. Here, we use

atomic-force microscopy and molecular dynamics simulations to unravel the influence
of these factors on the interface chemistry in a sodium electrolyte, demonstrating how
a molten salt like structure at the electrode surface results in dendrite free metal
cycling at higher rates. Such a structure will support the formation of a more
favorable solid electrolyte interphase (SEI) accepted as being a critical factor in
stable battery cycling. This new understanding will enable engineering of efficient
anode electrodes by tuning interfacial nanostructure via salt concentration and high
voltage preconditioning.
The electrolyte/electrode interface and the solid electrolyte interphase layer at an alkali
metal electrode in a battery is critical for performance1,2,3,4. The SEI consists of an
insoluble passivating film on the electrode surface which prevents electrolyte
decomposition whilst presenting a low resistance pathway for alkali ion transfer during
deposition and stripping3,4,5,6, and a compact, homogeneous SEI suppresses dendrite
formation3,4,5,6. The composition and morphology of the SEI is controlled by the
arrangement and chemical species of various ions or solvent molecules at the interface (also
called interfacial nanostructure)3,4,5,6. However, a thorough understanding of the electrified
interface in any electrolyte/electrode system, and the criteria for optimization of the SEI,
remain unknown.
Ionic liquids (ILs)1,7 are pure salts in a liquid state. The strong forces between IL ions
(electrostatic, hydrogen bonding, van der Waals, etc), means ILs typically assemble into
well-formed interfacial layers near solid surfaces that can extend a few nanometers into
solution1,8. For pure ILs at electrode surfaces, application of an electrostatic potential
significantly enhances the interfacial IL structure, leading to more and well-defined layers,
as revealed by in situ surface-characterization techniques, including atomic force
microscopy (AFM)9,10,11, surface force apparatus (SFA)12, scanning tunneling microscopy

(STM)13,14, infrared reflection spectroscopy15,16, Raman spectroscopy17,18, sum frequency
generation spectroscopy (SFG)19, and molecular dynamics (MD) simulations9,10,20. The
interfacial nanostructures were demonstrated to link to electrochemical performance of an
IL/metal anode systems21,22,23; the IL cation and anion chemistry was also found to have a
dramatic effect on interfacial layering near the electrode surface9,10,21,24,25. The effect of
salt concentration on interfacial nanostructures was also considered but with a focus on
low to moderate salt concentration range26,27,28. From several recent studies29,30,31,32, we
know that dendrite free metal anode cycling is possible in so-called ‘superconcentrated’ IL
electrolytes (e.g. 1:1 ratio IL to Li or Na salt) even at high rates, whereas the contribution
and role of the interfacial nanostructure in these systems towards the reported enhanced
cycling is yet to be established.
Here, we investigate the effect of sodium bis(fluorosulfonyl)imide (NaFSI) salt
concentration and applied potential on the interfacial structure and composition of an IL
N-methyl-N-propyl pyrrolidinium bis(fluorosulfonyl)imide (C3mpyrFSI) (Supplementary
Fig. 1) at a negatively charged metal electrode. We suggest a novel engineering strategy
for the formation of a uniform interfacial electrolyte structure dominated by Nax(FSI)y
clusters and the exclusion of organic IL cation. This has multiple important effects: firstly,
avoiding parasitic reduction of the organic cation (eg. pyrrolidinium in this case) that leads
to a poorer SEI layer5,6; secondly, a more facile reduction of the [FSI]– anion which can
subsequently form a more uniform inorganic NaF layer; and finally, a significantly higher
interfacial Na+ ion concentration supporting homogeneous metal deposition. The
inorganic fluorides have been identified both in Li metal and Na metal anodes as important
components of SEI layers for alkali metal anode batteries5,6,33,34.
Atomic force microscopy (AFM) measurements were performed to examine the interfacial
nanostructure of C3mpyrFSI adjacent to a gold electrode at open circuit potential (OCP)

and OCP-0.5 V, focusing on the effect of low and high NaFSI salt concentrations and
applied potential (for details, see Methods and Electronic Supplementary Information).
The AFM force–distance profiles for C3mpyrFSI with 0, 10 and 50 mol% of NaFSI salt
presented in Fig.1a-f indicate a multi-layer IL interfacial nanostructure within 4.5 Å of the
gold electrode that attenuates in the bulk phase, consistent with previous reports9,10,24,25. A
series of pronounced, discrete steps are evident which are due to the repulsive interaction
from the AFM cantilever required to rupture the interfacial layers. The intensity of force
is reflected from the maximum of each step and the larger force is normally related to
the higher degree of ordering due to the stronger cohesive interactions in the ion layer.
The distinct effect on interfacial layering nanostructure from NaFSI concentration has been
captured here. Compared to the force-distance profile of the neat IL at OCP in Fig. 1a, the
10 mol% salt system in Fig. 1b shows a similar number of 4 - 5 steps, but these become
more pronounced, reflected as an increase in height. This indicates the rupture force
required to break each layer is enhanced in the 10 mol% system due to the strengthening in
ion-ion association. Further addition of NaFSI salt to 50 mol% significantly changes the
interfacial structure compared to that of 0 and 10 mol% systems, with only 2 or 3 steps
remaining along with a large decrease in the rupture force. Furthermore, the different
concentrations also shift the position of the discrete steps, therefore, indicating a change
in physical dimensions of interfacial ion packing.

Fig. 1 | Experimental AFM force-distance 2D histograms and ion number densities derived
from MD simulations (red – [FSI]–, green – [C3mpyr]
+, yellow – Na
+) at OCP and PZC
for C3mpyrFSI with different NaFSI salt concentrations of (a) 0 mol%, (b) 10 mol%, (c) 50
mol% near Au(111) electrode. AFM force-distance 2D histograms and MD ion number
densities obtained at OCP-0.5 V and -0.5 V vs. PZC for C3mpyrFSI with different NaFSI
salt concentrations of d) 0 mol%, e) 10 mol%, f) 50 mol% near Au(111) electrode.
Disruption of the IL interfacial layered structure by high salt concentration correlates with
the increase in the number of Na+ at the interface, which alters the chemical composition of
the inner electrolyte layers. Similar observations were also reported in previous works on N-
butyl- N-methylpyrrolidinium ([C4mpyr]+) cation based ILs with either Li or Na salt (up to
1 M)26,27,28. However, the results here for the Na salt and the smaller [C3mpyr]+ cation
show some distinct differences, likely related to the effect of the shorter alkyl substituent on
packing and surface organization. The effect of cation structure on IL interfacial
organization was demonstrated previously by Begic et at21.
The change in AFM force-distance profiles due to increased salt concentration is also
evident when -0.5 V is applied to the working electrode (Fig. 1d-f). When comparing the

structure at open circuit potential (OCP) relative to OCP-0.5 V, we see that this level of
applied negative potential has a negligible effect on the number of ion layers for a given
system, however, it displaces the AFM steps closer to the electrode surface and also
increases rupture forces, and this is particularly evident for the 0 and 10 mol% salt systems.
In order to gain further insight into the impact from salt concentration on interfacial
nanostructures, we conducted atomistic molecular dynamics (MD) simulations on an ideal
interface model consisting of IL electrolytes with different Na salt concentrations that are
confined between two flat Au(111) electrodes at potential of zero charge (PZC), -0.5, and -
1.25 V vs. PZC. Ion number density profiles of both cation, anion (generated through the
Nitrogen atom) and the Na ion at PZC and -0.5 V vs. PZC are also presented in Fig. 1. For
the 0 and 10 mol% salt systems, the number density profiles show around 5 and 5-6 peaks,
respectively, and this agrees well with the AFM results. The number of peaks in the density
profiles of both cations and anions reduces to 3 as the salt concentration increases to 50
mol% and this again reproduces the change observed in the AFM measurements.
Furthermore, the height of the first sharp peak for the IL cation reduces with increased salt
concentration whereas that of both anion and Na+ increases, suggesting the growth in the
number of both [FSI]– and Na+ ions in the innermost layer at higher salt concentration. It is
noticed here that the position of the first AFM step (between 2 and 9 Å) is related to the first
two peaks in the density profiles. The positions of other AFM steps match with peaks of
the anion density profiles better than that of cations. This means that more force is required
to displace the anions than the cations, which can be a consequence of the anion heavier
than [C3mpyr]+ (molecular mass in g mol
-1: [FSI]
– (180.12) > [C3mpyr]+ (128.23))10.
Furthermore, the possible effect from water traces on interfacial nanostructure was also
investigated via MD simulations, and no significant change on both position and number
of density peaks was found (Supplementary Fig. 2).

To reveal the molecular origin of the experimentally detected ionic layers, we divided the
simulation box adjacent to the negatively charged electrode surface into three regions,
covering the Z-distances of 0-0.61, 0.61-1.1 and 1.1-1.85 nm, respectively, and calculated
the radial distribution function (RDF) of Na-FSI within these three regions (Supplementary
Fig. 3). The RDF curves clearly demonstrate a decrease in Na-FSI structural order at a Z-
distance farther away from the electrode, which is supported by the attenuated AFM steps
shown in Fig. 1. This is also consistent with previously reported experimental
observations8,10,11,26,28,35. In general, the coordination number (CN) of Na-FSI of the 50
mol% system is higher than that of 10 mol% system, and the difference in CN becomes even
larger at -0.5 V vs. PZC. The increased CN of Na-FSI coordination is also reported in the
bulk phase simulation of this IL at the higher NaFSI salt concentrations, which was
suggested to be a consequence of the formation of extended Nax(FSI)y ion aggregates36.
The increase in Na-FSI coordination number not only results in a decrease in binding
strength between Na+ and [FSI]– due to enlarged anion repulsive energy30,31,36,37,38,39, but
also promotes the local dynamics of [FSI]– in the 50 mol% system, and consequently
enhances the Na ion hopping events demonstrated as a more frequent change in the number
of Na+ counted in the innermost layer (Supplementary Fig. 4) near the electrode.
To further analyse the chemical composition of the innermost interfacial layer in relation to
the salt concentration and applied electrode polarization, the cation/anion ratio and the
number of Na+ at all simulated potentials are plotted in Fig. 2. The presence of cations,
anions and sodium ions is not only affected by salt concentrations, but also responds
differently to applied electrode potentials. In the neat IL and low salt concentration
systems, the [C3mpyr]+/[FSI]
– ratio increases with increasingly negative applied potential.
This demonstrates that the increased negative charge on the electrode enriches
pyrrolidinium cations in the innermost layer to screen the excess negative surface charge

(Supplementary Table 3, Supplementary Fig. 5). In contrast, this ratio changes oppositely
in the 50 mol% salt system, decreasing from 0.60 to 0.33 as the potential is changed from
-0.5 V to -1.25 V vs. PZC. This is a result of the partial exclusion of IL cations and a
concomitant increase in anions. Additionally, the number of Na+ significantly increases in
in the innermost layer at -1.25 V compared to PZC or even -0.5 V (Fig. 2b). There is thus
a competition between [C3mpyr]+ and Na
+ entering the innermost layer to compensate the
negative charge on the electrode; an increase of the former will reduce the number of both
Na+ and [FSI]
– ions whereas an increase in Na+ brings accompanying [FSI]
– anions to satisfy
the coordination of the alkali metal cation. The smaller Na+ more readily fills the free space
in the innermost layer compared to the bulky [C3mpyr]+, consequently, providing
sufficient positive charges to screen the negatively charged surface. This also reduces the
layered nanostructuring at the interface compared to the more extensive layering found in
the case of 0 and 10 mol% systems that can be caused by inefficient surface charge screening
due to poor packing of the bulky cations26,27,28.
Fig. 2 | (a) Number ratio of [C3mpyr]+/[FSI]
– and (b) number of Na+ in the innermost layer
at the Au(111) electrode surface at PZC, -0.5 V, and -1.25 V vs PZC.
The angular distribution analysis of inner layer [C3mpyr]+ shows that the pyrrolidinium
ring tends to align parallel to the gold surface (Supplementary Fig. 6). In addition, the

subsequent decrease in the vertical orientation at the negative potential provides further insight
for the first AFM layer contraction found in Fig. 1 at OCP-0.5 V.
The co-existence of Na+ with [FSI]
– in the inner layer is another characteristic in these
systems. In previous studies considering salt concentration (e.g. < 0.5 M), the Na+ is
normally solvated by 2-3 [FSI]– anions26. Meanwhile, here our interest is in the
superconcentrated IL electrolytes that demonstrate superior battery performance30,31,40,41.
In this case, the Nax(FSI)y ion aggregation becomes more obvious and extensive. The Na-
FSI coordination structures are the same as those found in the bulk phase36 which are
denoted by A1 (Na+ coordinates to the N atom), A2 (bi-dentate, Na+ coordinates to oxygen
atoms on both sides of the N atom) and A3 (mono-dentate, Na+ coordinates to oxygen atoms
on one side of the N atom) on three RDF peaks between 0.2 and 0.6 nm in Fig. 3. The peaks
change differently between low and high salt concentration systems in particular as the applied
potential changes. In the 10 mol% system in Fig. 3a, the A2 Na-FSI coordination dominates
when the electrode becomes more negatively charged. This is accompanied by a decrease in
Na-FSI coordination number (CN) mainly relating to the decreased A3 coordination.
However, in the case of the 50 mol% system, the A2 coordination only increases slightly
from PZC to -0.5 V vs. PZC and then sharply decreases at -1.25 V vs. PZC as A3
coordination becomes prevalent. The increase in A3 and CN is a result of the formation of
large molten salt like Nax(FSI)y ion aggregates (Fig. 3d), which has been also reported in
the bulk IL phase with higher salt concentrations36. The A2 structure has a higher binding
energy than the A3 structure42,43 and thus is more difficult to break, this is consistent with
the higher rupture force found in the AFM studies for the 10 mol% system compared to
the 50 mol% system.

Fig. 3 | Radial distribution function g(r) and coordination number calculated for Na-NFSI
coordination in the innermost layer within 0.61 nm of the electrode surface for (a) 10 mol%
and (b) 50 mol% salt systems. Two snapshots show typical Nax(FSI)y complexes in the
innermost layer at -1.25 V vs. PZC in the (c) 10 mol% and (d) 50 mol% salt systems; three
types of Na-FSI coordination: A1, A2 and A3 are highlighted.
These simulation results also provide an insight into the underlying reason of the
commonly observed improved electrochemical cycling behavior, the uniform morphology
of metal anode surface, and/or the low-charge transfer resistance (Rct) reported in
superconcentrated ILs29,30,31. The existence of the extended highly coordinated Nax(FSI)y
aggregates at the electrified interface can lead to a higher nucleation rate for Na metal
deposition resulting from the dominance of the Na+ ions and their likely higher diffusivity
in these molten salt like IL electrolyte structures; previous MD simulations on the same IL,
for example, showed that the Na+ ion transport is faster in the 90 mol% NaFSI system due
to facilitated reorganization and exchange of the coordination environment36. In addition,

the uniform distribution of the [FSI]– near the anode surface and the expulsion of the
[C3mpyr]+ from the innermost layer contributes to the formation of more uniform and
homogeneous SEI layer from the decomposition of [FSI]– to form NaF, favoring a more
stable cycling6,33,44. Of further significance with respect to SEI layer design is that the 50
mol% system tends to form a molten salt like Nax(FSI)y aggregate interfacial structure
when a higher negative potential is applied, whereas the low salt concentration (10 mol%)
system does not. This indicates that not only the use of high salt concentration in IL30,31 but
also applying a high voltage pre-treatment could optimize interfacial chemistry and
improve the electrochemical performance of the battery.
In order to test this hypothesis, we applied different negative electrode polarizations, in an
experimental system based on the 50 mol% C3mpyrFSI IL as a precondition treatment
before electrochemical cycling in a Na symmetric cell at 50 °C. The different electrode
polarizations were realized through applying three different current densities of 0.1 mAcm-
2, 1.0 mAcm
-2, and 5.0 mAcm
-2, respectively for 5 brief cycles (0.1 mAh cm
-2 per step) on
three samples; the higher current density leads to the higher polarization potentials. Each
of these samples was further cycled at different current densities of 0.1 mAcm-2 and 1.0
mAcm-2
, for longer duration cycles (0.1 and 1.0 mAh cm-2 per step) of 20 cycles each. The
chronopotentiometry voltage profiles are given in Fig. 4 (Supplementary Fig. 7). It is clear
that the preconditioning at 5.0 mAcm-2 leads to the largest initial polarization potential and
the shortest deposition time (for an equivalent amount of charge), however, for the
subsequent cycling at both 0.1 mAcm-2 and 1.0 mAcm
-2 this cell shows the smallest
overpotential among the three cells. The electrochemical impedance spectra obtained after
20 cycles at 0.1 mAcm-2 confirms the formation of a lower Rct surface for the cell
preconditioned with a high current density (Fig. 4c). Further cycling at 1.0 mAcm-2
and 5.0

mAcm-2 also demonstrates that preconditioning at high current density favorably
contributes to symmetric cell cycling behavior at even higher rates, while the other two
cells preconditioned at lower currents (0.1 mAcm-2 and 1.0 mAcm
-2) either fail due to short
circuiting or exhibit unstable voltage profiles. In prior work, similar observations were
reported for the cycling of a symmetric Na cell with a solid state electrolyte based on a 90%
NaFSI salt in a phosphonium IL (methyl triisobutyl phosphonium FSI). In that work it was
also demonstrated that initial preconditioning of Na at higher current density lead to lower
polarization potential for subsequent cycling as observed here45 without giving any
explanation for this phenomenon. In this work we now have a clear understanding towards
the influence of the preconditioning voltage (as applied through deposition at higher
current density) on interfacial structuring near a negatively charged electrode and can infer
from this the positive formation of a favorable metal anode surface (SEI and/or uniform
morphology of anode surface). Very recently, we have also experimentally demonstrated
a similar effect for lithium metal anodes in an equivalent superconcentrated LiFSI
electrolyte (C3mpyrFSI with 50 mol% LiFSI) where, compared to deposition at 1.0 mAcm-
2, higher average cycling efficiency, more uniformed deposition and suppression of
dendrite growth was accompanied by the presence of a thinner, LiF dominated SEI layer (as
shown by XPS and ToF-SIMS surface analysis) upon deposition at high current densities
of 20 mAcm-2; deposition voltages in this case were more negative than -0.6 V vs Li34.

Fig. 4 | (a) The cells preconditioning at 0.1 mAcm-2
/0.1 mAhcm-2 (black), 1.0 mAcm
-2/0.1
mAhcm-2 (blue), and 5.0 mAcm
-2/0.1 mAhcm
-2 (red) within 5 cycles. (b) Galvanostatic
stripping-plating cycling of Na|50 mol% NaFSI in C3mpyrFSI|Na cell at 50 °C at 0.1
mAcm-2
/0.1 mAhcm-2
. (c) Nyquist plot recorded for the cells after 20 cycles at 0.1 mAcm-
2/0.1 mAhcm
-2. (b) Galvanostatic stripping-plating cycling of Na|50 mol% NaFSI in
C3mpyrFSI|Na cell at 50 °C at 5.0 mAcm-2
/1.0 mAhcm-2
.
In conclusion, by means of AFM and MD simulation, it is found that a superconcentrated
C3mpyrFSI IL electrolyte with 50 mol% NaFSI has a dramatically different interfacial
structure from that of a neat IL or its low salt concentration counterpart. A highly
aggregated Nax(FSI)y structure, reminiscent of the molten salt like structure previously

reported for the bulk phase36 is found in the innermost electrolyte layers, in particular at a
negatively electrified surface, that disrupts the interfacial nanostructuring as observed from
the significantly reduced number of steps in AFM force-distance profiles. The interfacial
structure in superconcentrated IL electrolytes can be further optimized through adopting a
high voltage pre-treatment, that promotes the formation of an even higher concentration
of Nax(FSI)y aggregates on the negative electrode and also excludes the [C3mpyr]+ cations.
The hypothesis that such structures lead to improved SEI layer and metal deposition was
confirmed by the demonstration of significantly improved electrochemical performance of
a superconcentrated C3mpyrFSI|NaFSI cell which was preconditioned with a high current
density protocol before further cycling. This work, for the first time, clearly discloses the
mechanism of improved cycling stability in superconcentrated IL electrolytes with respect
to the electrolyte structure at an electrified anode, and provides insights for rational
electrolyte design and engineering of metal anode surfaces for high energy density, high-
performance batteries with long cycle life.
Methods Materials
N-methyl-N-propylpyrrolidinium bis(fluorosulfonyl)imide (C3mpyrFSI, 99.9%) and
sodium bis(fluorosulfonyl)imide (NaFSI, 99.99%) were obtained from Solvionic and used
without further purification. The NaFSI salt contained electrolytes were prepared by
dissolving the salt in C3mpyrFSI in argon-atmosphere glove box with further heating at 50
°C for 24 h. The water content in these electrolytes was measured by coulometric Karl
Fischer method (831 Karl Fisher Coulometer with Hydranal® Coulomat AG as the titrant),
and does not exceed 55 ppm. All samples for electrochemical measurements were kept
inside argon-atmosphere glove box.
Electrochemical experiments
Symmetrical Na|Na CR2032 Hoshen coin cells were fabricated with two sodium metal

electrodes (Sigma-Aldrich, purity 99.9%), which were stored in paraffin oil (Merck
Millipore). Inside an argon filled glove box, sodium electrodes (8 mm diameter) were
prepared by removing paraffin oil traces with dried n-hexane, followed by rolling, brushing
and punching. A ½ inch (12.7 mm) diameter polyethylene separator (gratis, Lydall, 7P03A,
50 µm thickness, 85% 0.3 µm porosity) soaked with the electrolyte solution was used. Two
spacers of 0.5 mm and 1.4 mm spring were used to ensure contact. After sodium
symmetrical cell preparation and resting for 24 hours at 50°C, electrochemical impedance
spectroscopy (EIS) was used to monitor changes on the sodium electrode surface. The EIS
spectra were recorded by a multi Potentiostat VMP3 (Bio-Logic) in a frequency range of 50
mHz to 1 MHz with a 10 mV voltage amplitude. The result was analysed by using EC-Lab
software (Z Fit V. 10.44). These cells were cycled using chronopotentiometry mode with
various current densities being applied at 50 ⁰C (20 cycles at 0.1 mAcm-2
/0.1 mAhcm-2
,
1.0 mAcm-2
/1.0 mAhcm-2
, and 10 cycles at 5.0 mAcm-2
/1.0 mAhcm-2
) from low current to
high current densities. Prior to 20 chronopotentiometric cycles, each cell was
preconditioned at three different current densities at 50 ⁰C (5 cycles at 0.1, 1.0, 5.0 mAcm-
2) with amount of charge of 0.1 mAhcm
-2.
Molecular dynamic simulation
The all-atom classic molecular dynamic simulations were conducted with customized
GROMACS software package46. The Canongia Lopes-Padua (CL&P) force field
parameters were used in this work for C3mpyrFSI ionic liquids, which we also adopted
previously for bulk phase investigation of the same IL36. The Lennard-Jones potential
parameters (ε=22.1333 kJ/mol and σ=0.2629 nm) for Au electrode were adopted from
literature47, which were previously validated for pyrrolidinium-based IL/Au(111) interface
structure analysis.
The bulk phase densities of all systems (Supplementary Table 1) were calculated first and

the computational details are described in supplementary file. The interface models were
constructed with the IL electrolytes confined between two Au(111) face-centred cubic
electrodes (Supplementary Fig. 1). The simulation box consisting of electrode and
electrolytes has the x and y dimension according to the size of gold electrode, and the z-
length was calculated based on the bulk phase density of ILs. An extra vacuum space twice
the length of electrolyte was also introduced outside one side of electrode in order to
eliminate the artefact images resulting from the simulation in slab geometry1. An annealing
process was simulated at first by changing temperature from 393 K to 700 K and to 393 K
again before a long equilibration calculation at 393 K for a total of 12 ns using an NVT
ensemble and the Nose-Hoover thermostat. The annealing procedure allows the system to
gain sufficient dynamics to obtain a reasonable initial structure for equilibration
calculation. Both energies and pressures were checked to determine whether the system
reaches the equilibrium. An additional 40 ns production run were performed at 393 K for
structural and dynamics analysis. The trajectory file was written every 2 ps. The electrode
potential was determined according to Poisson equation11,20,47,48, by calculating the electric
double layer (EDL) potential drop between two electrodes U#$% = 𝜓()(*+,-.(/𝜓01)2 . The UEDL for
uncharged electrode was defined as potential zero charge (PZC). The electrode potential -0.5 and -1.25
V vs. PZC is defined as U#$% = 𝜓()(*+,-.(/𝜓01)2 − PZC. The surface charges used to achieve the
electrode potential are given in Supplementary Table 2.
Atomic force microscopy measurements
Atomic force microscopy (AFM) measurements were conducted on a Bruker Nanoscope
Ⅳ multimode instrument operating in contact mode. The ILs were syringed into a AFM
liquid cell, where the IL was isolated from the atmosphere and held by a
polytetrafluoroethylene O-ring next to polycrystalline gold surface (a 60 nm layer,
nominally of Au(111)), with measured root mean square roughness of 0.5 nm over 500 nm
× 500 nm area. The mica Au(111) coated substrate for AFM was obtained from Molecular
Imaging and pre-treated according to the published procedure25. Standard Si AFM
cantilevers (model NSC36, MikroMasch, Sofia, Bulgaria) were used throughout. The
surface and cantilever were cleaned by washing with deionized water and absolute ethanol,
before drying and irradiating using a UV-Ozone cleaner for 20 minutes prior to use. The
electrochemical cell consists of the Au(111)/mica substrate and two 0.25 mm platinum
wires (Alfa, 99,99%) as working, quasi-reference, and counter electrode. The potential for
redox couple for ferrocene/ferrocenium (Fc/Fc+) was assessed in examined ILs in order to
get the quasi-reference electrode potential. The potential of the quasi-reference platinum
electrode remained stable during all conducted experiments. The measured spring constant
was 1.6 N/m. The potential on the working electrode was applied and maintained by
Autolab PGSTAT20 software-controlled potentiostat in a three-electrode configuration.
More details on AFM measurements can be found in the Supplementary Information.
Acknowledgements
D.A.R., F.C., M.F., P.C.H., and A.N.S. acknowledge the Australian Research Council (ARC)
for funding via the Australian Centre for Electromaterials Science, grant CE140100012. M.F.
acknowledge the ARC grant DP160101178. The simulation work was undertaken with the
assistance of resources provided at the NCI National Facility systems at the Australian National
University through the National Computational Merit Allocation Scheme supported by the
Australian Government. D.A.R. would like to thank Dr. Srđan Begić and Dr. Erlendur Jónsson
for mentoring in simulation skills.
Author Contributions
M.F. conceived the idea. D.A.R. carried out the MD simulations and analysis under the

supervision of F.C. and M.F., and AFM experiment under the supervision of R.A. and H.L.,
S.A.F. and T.P. contributed to the electrochemical experiments under the supervision of
P.C.H., D.A.R. F.C. and M.F. drafted the manuscript. R.A. and A.N.S. helped in editing the
manuscript. All authors contributed to the discussion of results.
References
1. Fedorov, M. V. & Kornyshev, A. A. Ionic Liquids at Electrified Interfaces. Chem. Rev.
114, 2978–3036 (2014).
2. Xu, K. Electrolytes and interphases in Li-ion batteries and beyond. Chem. Rev. 114,
11503–11618 (2014).
3. Cheng, X. B. et al. A review of solid electrolyte interphases on lithium metal anode.
Adv. Sci. 3, 1–20 (2015).
4. Lin, D., Liu, Y. & Cui, Y. Reviving the lithium metal anode for high-energy batteries.
Nat. Nanotechnol. 12, 194–206 (2017).
5. Cheng, X. B., Zhang, R., Zhao, C. Z. & Zhang, Q. Toward Safe Lithium Metal Anode
in Rechargeable Batteries: A Review. Chem. Rev. 117, 10403–10473 (2017).
6. Lee, B., Paek, E., Mitlin, D. & Lee, S. W. Sodium Metal Anodes: Emerging Solutions
to Dendrite Growth. Chem. Rev. 119, 5416–5460 (2019).
7. Watanabe, M. et al. Application of Ionic Liquids to Energy Storage and Conversion
Materials and Devices. Chem. Rev. 117, 7190–7239 (2017).
8. Mezger, M. et al. Molecular Layering of Fluorinated Lonic Liquids at a Charged
Sapphire (0001) Surface. Science (80-. ). 322, 424–428 (2008).
9. Mao, X. et al. Self-assembled nanostructures in ionic liquids facilitate charge storage at
electrified interfaces. Nat. Mater. 18, 1350–1357 (2019).
10. Black, J. M. et al. Fundamental aspects of electric double layer force-distance
measurements at liquid-solid interfaces using atomic force microscopy. Sci. Rep. 6, 1–
12 (2016).
11. Black, J. M. et al. Bias-dependent molecular-level structure of electrical double layer in
ionic liquid on graphite. Nano Lett. 13, 5954–5960 (2013).
12. Smith, A. M., Lee, A. A. & Perkin, S. The Electrostatic Screening Length in
Concentrated Electrolytes Increases with Concentration. J. Phys. Chem. Lett. 7, 2157–
2163 (2016).
13. Su, Y.-Z., Fu, Y.-C., Yan, J.-W., Chen, Z.-B. & Mao, B.-W. Double Layer of
Au(100)/Ionic Liquid Interface and Its Stability in Imidazolium-Based Ionic Liquids.
Angew. Chemie Int. Ed. 48, 5148–5151 (2009).
14. Elbourne, A. et al. Nanostructure of the Ionic Liquid-Graphite Stern Layer. ACS Nano
9, 7608–7620 (2015).
15. Motobayashi, K., Minami, K., Nishi, N., Sakka, T. & Osawa, M. Hysteresis of potential-
dependent changes in ion density and structure of an ionic liquid on a gold electrode: In
situ observation by surface-enhanced infrared absorption spectroscopy. J. Phys. Chem.
Lett. 4, 3110–3114 (2013).
16. Nanbu, N., Sasaki, Y. & Kitamura, F. In situ FT-IR spectroscopic observation of a room-
temperature molten salt|gold electrode interphase. Electrochem. commun. 5, 383–387
(2003).
17. Rubim, J. C., Trindade, F. A., Gelesky, M. A., Aroca, R. F. & Dupont, J. Surface-
Enhanced Vibrational Spectroscopy of Tetrafluoroborate 1-n-Butyl-3-
methylimidazolium (BMIBF4) Ionic Liquid on Silver Surfaces. J. Phys. Chem. C 112,
19670–19675 (2008).
18. Yuan, Y.-X., Niu, T.-C., Xu, M.-M., Yao, J.-L. & Gu, R.-A. Probing the adsorption of
methylimidazole at ionic liquids/Cu electrode interface by surface-enhanced Raman
scattering spectroscopy. J. Raman Spectrosc. 41, 516–523 (2010).
19. Baldelli, S. Surface structure at the ionic liquid-electrified metal interface. Acc. Chem.
Res. 41, 421–431 (2008).
20. Hu, Z., Vatamanu, J., Borodin, O. & Bedrov, D. A molecular dynamics simulation study
of the electric double layer and capacitance of [BMIM][PF6] and [BMIM][BF4] room
temperature ionic liquids near charged surfaces. Phys. Chem. Chem. Phys. 15, 14234–
14247 (2013).
21. Begić, S., Li, H., Atkin, R., Hollenkamp, A. F. & Howlett, P. C. A comparative AFM
study of the interfacial nanostructure in imidazolium or pyrrolidinium ionic liquid
electrolytes for zinc electrochemical systems. Phys. Chem. Chem. Phys. 18, 29337–
29347 (2016).
22. Forsyth, M. et al. Tuning Sodium Interfacial Chemistry with Mixed-Anion Ionic Liquid
Electrolytes. ACS Appl. Mater. Interfaces (2019). doi:10.1021/acsami.9b12913
23. Liu, Z. et al. Dendrite-Free Nanocrystalline Zinc Electrodeposition from an Ionic Liquid
Containing Nickel Triflate for Rechargeable Zn-Based Batteries. Angew. Chemie - Int.

Ed. 55, 2889–2893 (2016).
24. Li, H., Endres, F. & Atkin, R. Effect of alkyl chain length and anion species on the
interfacial nanostructure of ionic liquids at the Au(111)-ionic liquid interface as a
function of potential. Phys. Chem. Chem. Phys. 15, 14624–14633 (2013).
25. Atkin, R. et al. AFM and STM studies on the surface interaction of [BMP]TFSA and
[EMIm]TFSA ionic liquids with Au(111). J. Phys. Chem. C 113, 13266–13272 (2009).
26. Carstens, T., Lahiri, A., Borisenko, N. & Endres, F. [Py1,4]-FSI-NaFSI-based ionic
liquid electrolyte for sodium batteries: Na+ solvation and interfacial nanostructure on
Au(111). J. Phys. Chem. C 120, 14736–14741 (2016).
27. Hoffmann, V. et al. Influence of a silver salt on the nanostructure of a Au(111)/ionic
liquid interface: An atomic force microscopy study and theoretical concepts. Phys.
Chem. Chem. Phys. 20, 4760–4771 (2018).
28. Lahiri, A., Carstens, T., Atkin, R., Borisenko, N. & Endres, F. In Situ Atomic Force
Microscopic Studies of the Interfacial Multilayer Nanostructure of LiTFSI-[Py1, 4]TFSI
on Au(111): Influence of Li+ Ion Concentration on the Au(111)/IL Interface. J. Phys.
Chem. C 119, 16734–16742 (2015).
29. Girard, G. M. A. et al. Spectroscopic Characterization of the SEI Layer Formed on
Lithium Metal Electrodes in Phosphonium Bis(fluorosulfonyl)imide Ionic Liquid
Electrolytes. ACS Appl. Mater. Interfaces 10, 6719–6729 (2018).
30. Yoon, H., Howlett, P. C., Best, A. S., Forsyth, M. & MacFarlane, D. R. Fast
charge/discharge of Li metal batteries using an ionic liquid electrolyte. J. Electrochem.
Soc. 160, 1629–1637 (2013).
31. Forsyth, M. et al. Novel Na+ Ion Diffusion Mechanism in Mixed Organic-Inorganic
Ionic Liquid Electrolyte Leading to High Na+ Transference Number and Stable, High
Rate Electrochemical Cycling of Sodium Cells. J. Phys. Chem. C 120, 4276–4286
(2016).
32. Zhang, H. et al. Ionic liquid electrolyte with highly concentrated LiTFSI for lithium
metal batteries. Electrochim. Acta 285, 78–85 (2018).
33. Choudhury, S. et al. Designing solid-liquid interphases for sodium batteries. Nat.
Commun. 8, 1–10 (2017).
34. Periyapperuma, K. et al. Towards high rate Li metal anodes: Enhanced performance at
high current density in a superconcentrated ionic liquid. J. Mater. Chem. A (2019).
doi:10.1039/C9TA12004A
35. Wakeham, D., Nelson, A., Warr, G. G. & Atkin, R. Probing the protic ionic liquid

surface using X-ray reflectivity. Phys. Chem. Chem. Phys. 13, 20828–20835 (2011).
36. Chen, F., Howlett, P. & Forsyth, M. Na-Ion Solvation and High Transference Number
in Superconcentrated Ionic Liquid Electrolytes: A Theoretical Approach. J. Phys. Chem.
C 122, 105–114 (2018).
37. Haskins, J. B., Bauschlicher, C. W. & Lawson, J. W. Ab Initio Simulations and
Electronic Structure of Lithium-Doped Ionic Liquids: Structure, Transport, and
Electrochemical Stability. J. Phys. Chem. B 119, 14705–14719 (2015).
38. Matsumoto, K., Okamoto, Y., Nohira, T. & Hagiwara, R. Thermal and transport
properties of Na[N(SO2F)2]-[N-Methyl-N-propylpyrrolidinium][N(SO2F)2] ionic
liquids for Na secondary batteries. J. Phys. Chem. C 119, 7648–7655 (2015).
39. Vicent-Luna, J. M. et al. Quantum and Classical Molecular Dynamics of Ionic Liquid
Electrolytes for Na/Li-based Batteries: Molecular Origins of the Conductivity Behavior.
ChemPhysChem 2473–2481 (2016). doi:10.1002/cphc.201600285
40. Giffin, G. A., Moretti, A., Jeong, S. & Passerini, S. Decoupling effective Li+ion
conductivity from electrolyte viscosity for improved room-temperature cell
performance. J. Power Sources 342, 335–341 (2017).
41. Gao, X., Wu, F., Mariani, A. & Passerini, S. Concentrated Ionic-Liquid-Based
Electrolytes for High-Voltage Lithium Batteries with Improved Performance at Room
Temperature. ChemSusChem 12, 4185–4193 (2019).
42. Wróbel, P., Kubisiak, P. & Eilmes, A. Interactions in Sodium
Bis(fluorosulfonyl)imide/1-Ethyl-3-methylimidazolium Bis(fluorosulfonyl)imide
Electrolytes for Na-Ion Batteries: Insights from Molecular Dynamics Simulations. J.
Phys. Chem. C 123, 14885–14894 (2019).
43. Tsuzuki, S., Hayamizu, K. & Seki, S. Origin of the low-viscosity of [emim][(FSO2)2N]
ionic liquid and its lithium salt mixture: Experimental and theoretical study of self-
diffusion coefficients, conductivities, and intermolecular interactions. J. Phys. Chem. B
114, 16329–16336 (2010).
44. Takenaka, N. et al. Microscopic Formation Mechanism of Solid Electrolyte Interphase
Film in Lithium-Ion Batteries with Highly Concentrated Electrolyte. J. Phys. Chem. C
122, 2564–2571 (2018).
45. Makhlooghiazad, F. et al. Phosphonium plastic crystal salt alloyed with a sodium salt as
a solid-state electrolyte for sodium devices: phase behaviour and electrochemical
performance. J. Mater. Chem. A 5, 5770–5780 (2017).
46. Lindahl, E., Hess, B. & van der Spoel, D. GROMACS 3.0: a package for molecular

simulation and trajectory analysis. Mol. Model. Annu. 7, 306–317 (2001).
47. Wang, R., Bi, S., Presser, V. & Feng, G. Systematic comparison of force fields for
molecular dynamic simulation of Au(111)/Ionic liquid interfaces. Fluid Phase Equilib.
463, 106–113 (2018).
48. Vatamanu, J., Xing, L., Li, W. & Bedrov, D. Influence of temperature on the capacitance
of ionic liquid electrolytes on charged surfaces. Phys. Chem. Chem. Phys. 16, 5174–
5182 (2014).

download fileview on ChemRxivManuscript-V1.pdf (2.06 MiB)


![Density Functional Theory investigation for Sodium atom on … · 2020-04-01 · case is the spatially dependent electron density [3]. Hence the name density functional theory comes](https://static.fdocuments.in/doc/165x107/5f5af946a114d867551012c7/density-functional-theory-investigation-for-sodium-atom-on-2020-04-01-case-is.jpg)