Energy Trading | Danske Commodities - Annual report 2019 · 2020. 3. 11. · Equinor’s power...
37
Annual report 2019
Transcript of Energy Trading | Danske Commodities - Annual report 2019 · 2020. 3. 11. · Equinor’s power...

Annual report 2019

3Annual Report 2019
TABLE OF CONTENTS
MANAGEMENT’S REVIEW
CEO Letter ........................................................................................................ 04
Financial Highlights ......................................................................................... 06
Business Model ............................................................................................... 08
Insight: US Power Trading .............................................................................. 12
Strategy ............................................................................................................ 14
Insight: Floating Wind ..................................................................................... 18
Financial Performance ................................................................................... 20
Risk Management ............................................................................................ 24
Insight: Post-Trade Automation ..................................................................... 28
People ............................................................................................................... 30
Statutory Reporting on Corporate Social Responsibility ............................. 32
Corporate Governance..................................................................................... 36
Management’s Statement ................................................................................ 40
Independent Auditor’s Report ......................................................................... 42
FINANCIAL STATEMENTS
Income Statement ............................................................................................ 47
Balance Sheet .................................................................................................. 48
Statement of Changes in Equity ...................................................................... 50
Cash Flow Statement ....................................................................................... 51
Notes ................................................................................................................. 52
Market Access ................................................................................................. 70
EBIT
EUR
mEU
Rm
%
50
49EQUITY RATIO
CASH AND CASH EQUIVALENTS
91

CEO LETTER CEO LETTER4 5
I am pleased to present Danske Commodities’ 2019 An nual Report. It has been an exciting and transforma-tive year for our company; a year, in which we became part of Equinor, onboarded new, promising business and expanded to new markets both inside and outside of Europe. It was also a year with less eventful energy mar kets than seen in previous years. Despite fewer oppor tunities in the markets, we successfully delivered strong financial results, once again demonstrating the robustness of our business model.
STRONG PERFORMANCE IN A TRANSFORMATIVE YEAR
In 2019, Danske Commodities de livered a strong financial perfor mance with EBIT of EUR 50 million in what can be character ised as re latively uneventful energy markets. At the same time, 2019 was a truly trans formative year for Danske Commodities as the Com pany be came part of one of the world’s biggest energy com pa nies, Equinor.
Danske Commodities that we can benefit from in the coming years. And we are already harvesting the first commercial synergies:
■ In February, Danske Commodities onboarded Equinor’s power trading activities to take advantage of Danske Commodities’ highly scalable platform.
■ During the summer, Danske Commodities entered into three long-term power purchase agreements in the UK, thereby increasing our total renewables portfolio in the UK by 50%.
■ In October, Danske Commodities signed the first gas-to-power contract with Equinor for a German utility, thereby entering a new business area with great potential.
■ In November, Equinor provided access to a down-stream gas storage portfolio of 20 TWh, concentra-ting short-term opportunistic gas trading in Danske Commodities.
In the coming years, we will continue to identify and unfold synergies between our two great companies.
DRIVING THE ENERGY TRANSITIONWe are proud to be at the forefront of Equinor’s ambi-tious investments in renewable energy production. Our role is to be Equinor’s route-to-market and create additional value through trading, helping to ensure that
green energy is an economically viable business. We do that by utilising our vast market footprint and ex pertise in offtaking and balancing renewables production. By managing Equinor’s growing renewables portfolio in the UK, we are off to a good start, but our shared ambitions are much greater, and we will continue to support Equinor in driving the energy transition forward.
GOING GLOBALIn 2019, we embarked on a new growth journey. Through the Equinor-owned company Danske Commodities US LLC, we entered the largest wholesale energy market in the US. Supporting Equinor’s US activities follows our entry into the Australian power market in 2018, marking the second time we have expanded our business model to markets outside Europe.
Global expansion continues to be a top priority for Danske Commodities and with our new owner Equinor, we expect to grow our global footprint in the coming years.
AUTOMATION ACROSS THE VALUE CHAINIn 2019, Danske Commodities carried out an average of 5,780 trades per day, an increase of 54% compared to 2018. On one very busy day in December just before the holidays, we reached a new record with 11,500 trades going smoothly through our systems without any bot-tlenecks, illustrating that we have the platform and pro-cesses in place to scale our business. Increasing the traded volumes and number of trades per day is a key factor for continued growth and success in markets with contracting margins. And as a tech-driven energy trading company, we excel in digitalisation across the value chain; from the use of machine learning and algorithms on the trading floors to automation of post-trade pro-cesses through the use of robotics.
Together with our focus on global growth, automation is a main pillar in our corporate strategy LEVEL UP, and it will remain a top priority in the coming years.
ENERGY IS OUR BUSINESS, PEOPLE ARE OUR ENERGY Energy trading moves at the speed of light, and in the 15 years Danske Commodities has existed, market con-ditions have undergone rapid developments. One thing has remained constant through the years, however, and that is the fact that Danske Commodities is driven by its people. This was proven again in 2019, as the people of Danske Commodities worked tirelessly to make our new alliance with Equinor a success, while maintaining a stern focus on our core business.
2019 was indeed a transformative year for Danske Commodities. We are an even stronger company today than we were a year ago, and we are ready to do our part in pushing the world towards a sustainable future.
STRONG PERFORMANCE IN LESS EVENTFUL MARKETSBenefitting from increased scale and automation, Danske Commodities presents a strong financial performance, delivering EBIT of EUR 50 million in 2019. The results were mainly driven by our ability to grow our traded vol-umes, as reflected in a 7% revenue increase, landing at EUR 10,046 million. Gross profit was EUR 108 million, and the cost base increased by 12%.
Energy markets were relatively uneventful in 2019. The markets saw a mild winter combined with a trade war between the US and China, which caused a drop in de mand for gas in Asia and in turn an oversupply of liquified natural gas in Europe. Comparing with pre-vious years, when we saw extreme weather conditions like cold spells across the continent and heat waves in south ern Europe combined with low levels in hydro reservoirs, 2019 was a less eventful year with fewer opportunities to trade spreads across the markets.
PART OF EQUINORIn February 2019, Danske Commodities became part of Norwegian energy major Equinor in an acquisition that combines Danske Commodities’ expertise in energy trading with Equinor’s growing renewables portfolio, leading position in gas and strong balance sheet. With Equinor in our corner, we have strengthened our financial muscle and unlocked new business opportunities for

FINANCIAL HIGHLIGHTS FINANCIAL HIGHLIGHTS6 7Danske Commodities Annual Report 2019
In 2019, energy markets were challenged by declining prices, less volatility and thinner margins than seen in previous years. The markets saw a mild winter combined with a trade war between the US and China, which redu- ced demand for liquified natural gas in Asia. The gas largely ended up in Europe instead, and with less demand because of warm weather and oversupply, gas prices fell, and margins were thin. At the same time, the lower gas prices sparked gas-fired power plants to produce electricity and because of a record wet autumn, hydro power in Europe produced more electricity than usual. Larger supply and lower demand of electricity also affec - t ed prices and margins on power. In these difficult mar-kets, Danske Commodities succeeded in delivering a strong financial performance with EBIT of EUR 50 million. Revenue growth continued in 2019 as Danske Commodi-ties’ ability to scale its business combined with its exper - tise in automation enabled the Company to increase traded volumes by 39%. The increase in traded volumes was, however, partly offset by lower prices in 2019 com-pared to 2018, and revenue grew EUR 669 million to EUR 10,046 million in 2019. Employing technologies such as algorithmic trading, machine learning and robotics, Danske Commodities grew its average trades per day by
FINANCIAL HIGHLIGHTS AND RATIOSHIGHLIGHTS OF THE YEAR
In a relatively uneventful year for energy markets, Danske Commodities delivered strong financial results. With EBIT of EUR 50 million and gross profit exceeding the EUR 100 millionmark for the third consecutive year, the Company proved the robustness of its business model.
54% compared to 2018 while growth in the total cost base was only 12% compared to 2018.
Evolving as a tech-driven energy trading company re -quires heavy investments in data and systems. In 2019, Danske Commodities became part of Equinor, one of the world’s biggest energy companies. Backed by a giant, the Company began to unlock the potential of digitalisa-tion, strengthened its financial position and gained access to new commercial opportunities. All of these initiatives contributed to an increase in total assets compared to 2018 to EUR 602 million at 31 December 2019. At the same time, the solvency of the Company was strengthened by significant long-term investments through capital in-jections by Equinor and retaining this year's profit. Equity grew almost fourfold compared to 2018 to EUR 293 mil-lion at 31 December 2019 and the equity ratio increased to 49%.
2019 was a truly transformative year for Danske Com-modities; a year when the Company became part of Equinor and solidified its position as a tech-driven ener- gy trading company. Taking on a new decade, Danske Commodities is well-positioned to embark on a new growth journey.
GROUP FIGURES EUR ’000 2019 2018 2017 2016 2015
Income statement
Revenue 10,046,074 9,376,686 5,471,723 3,320,551 2,936,265
Gross profit 107,879 123,472 103,439 84,709 82,071
Profit before financial income and expenses and tax (EBIT) 50,224 71,826 55,923 33,746 30,185
Net financials -917 -233 4,396 -40 467
Profit before tax (EBT) 49,307 71,593 60,319 33,706 30,652
Profit for the year 38,449 55,967 47,193 26,005 23,384
Balance sheet
Balance sheet total 601,709 373,271 361,962 290,772 271,905
Equity 292,666 76,235 105,855 83,795 77,518
Cash flow statement
Cash flow from operating activities -64,697 50,490 28,830 20,175 50,323
Cash flow from investing activities -91,899 -4,691 -4,174 -5,072 -3,913
– hereof investments in property, plant and equipment -1,025 -2,058 -130 -749 -694
Free cash flow -156,596 45,799 24,656 15,103 46,410
Cash flow from financing activities 178,471 -85,634 -25,647 -19,978 -10,732
Change in cash and cash equivalents for the year 21,875 -39,835 -991 -4,875 35,678
Cash and cash equivalents 91,031 69,545 107,768 104,275 110,738
Ratios in %
Gross margin 1.1% 1.3% 1.9% 2.6% 2.8%
EBIT margin 0.5% 0.8% 1.0% 1.0% 1.0%
Scalability 46.6% 58.2% 54.1% 39.8% 36.8%
Return on assets 8.3% 19.2% 15.4% 11.6% 11.1%
Return on capital employed 26.9% 77.1% 57.5% 40.8% 40.9%
Equity ratio 48.6% 20.4% 29.2% 28.8% 28.5%
Return on equity 20.8% 61.5% 49.8% 32.2% 32.9%
Average number of employees 281 267 262 272 297
Number of employees, end of year 317 295 290 279 299
The ratios have been prepared in accordance with the definitions set out in note 26 to the Financial Statements.
20192015 2016 2017 2018
78 84106
76
293
EBIT (EURm) EQUITY (EURm) Equity ratio
Equity ratio in 2019
49%EURm EBIT in 2019
50
2018
72
2019
50
2017
56
2016
34
2015
30
49%
20%
29%29%29%
BUSINESS MODEL BUSINESS MODEL8 9Danske Commodities Annual Report 2019
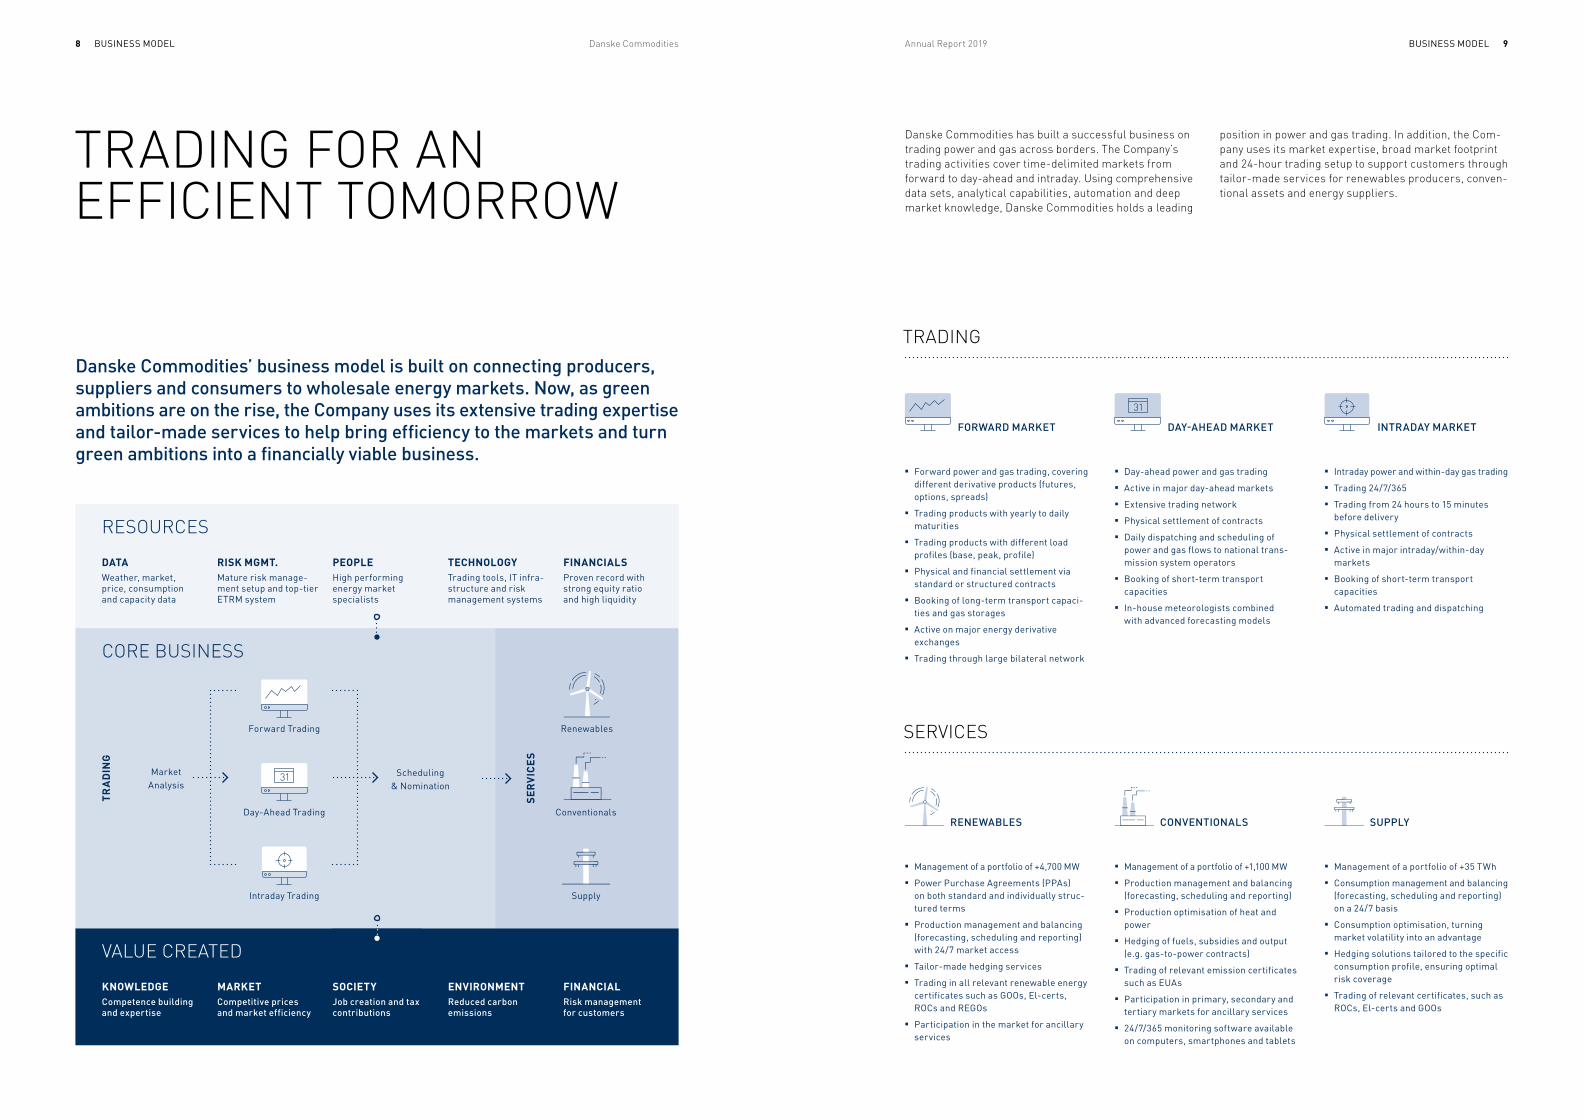
Danske Commodities has built a successful business on trading power and gas across borders. The Company’s trading activities cover time-delimited markets from forward to day-ahead and intraday. Using comprehensive data sets, analytical capabilities, automation and deep market knowledge, Danske Commodities holds a leading
■ Management of a portfolio of +35 TWh
■ Consumption management and balancing (forecasting, scheduling and reporting) on a 24/7 basis
■ Consumption optimisation, turning market volatility into an advantage
■ Hedging solutions tailored to the specific consumption profile, ensuring optimal risk coverage
■ Trading of relevant certificates, such as ROCs, El-certs and GOOs
TRADING FOR AN EFFICIENT TOMORROW
■ Intraday power and within-day gas trading
■ Trading 24/7/365
■ Trading from 24 hours to 15 minutes before delivery
■ Physical settlement of contracts
■ Active in major intraday/within-day markets
■ Booking of short-term transport capacities
■ Automated trading and dispatching
Danske Commodities’ business model is built on connecting producers, suppliers and consumers to wholesale energy markets. Now, as green ambitions are on the rise, the Company uses its extensive trading expertise and tailormade services to help bring efficiency to the markets and turn green ambitions into a financially viable business.
■ Management of a portfolio of +1,100 MW
■ Production management and balancing (forecasting, scheduling and reporting)
■ Production optimisation of heat and power
■ Hedging of fuels, subsidies and output (e.g. gas-to-power contracts)
■ Trading of relevant emission certificates such as EUAs
■ Participation in primary, secondary and tertiary markets for ancillary services
■ 24/7/365 monitoring software available on computers, smartphones and tablets
RENEWABLES
FORWARD MARKET
CONVENTIONALS
DAY-AHEAD MARKET
SUPPLY
INTRADAY MARKET
■ Management of a portfolio of +4,700 MW
■ Power Purchase Agreements (PPAs) on both standard and individually struc-tured terms
■ Production management and balancing (forecasting, scheduling and reporting) with 24/7 market access
■ Tailor-made hedging services
■ Trading in all relevant renewable energy certificates such as GOOs, El-certs, ROCs and REGOs
■ Participation in the market for ancillary services
SERVICES
position in power and gas trading. In addition, the Com-pany uses its market expertise, broad market footprint and 24-hour trading setup to support customers through tailor-made services for renewables producers, conven-tional assets and energy suppliers.
■ Day-ahead power and gas trading
■ Active in major day-ahead markets
■ Extensive trading network
■ Physical settlement of contracts
■ Daily dispatching and scheduling of power and gas flows to national trans-mission system operators
■ Booking of short-term transport capacities
■ In-house meteorologists combined with advanced forecasting models
■ Forward power and gas trading, covering different derivative products (futures, options, spreads)
■ Trading products with yearly to daily maturities
■ Trading products with different load profiles (base, peak, profile)
■ Physical and financial settlement via standard or structured contracts
■ Booking of long-term transport capaci-ties and gas storages
■ Active on major energy derivative exchanges
■ Trading through large bilateral network
TRADING
VALUE CREATED
KNOWLEDGECompetence building and expertise
MARKETCompetitive prices and market efficiency
SOCIETYJob creation and tax contributions
ENVIRONMENTReduced carbon emissions
FINANCIALRisk management for customers
RESOURCES
DATAWeather, market, price, consumption and capacity data
RISK MGMT.Mature risk manage-ment setup and top-tier ETRM system
PEOPLEHigh performing energy market specialists
TECHNOLOGYTrading tools, IT infra-structure and risk management systems
FINANCIALSProven record with strong equity ratio and high liquidity
CORE BUSINESS
SER
VIC
ES
TRA
DIN
G
Market Analysis
Scheduling & Nomination
Intraday Trading
Forward Trading
Day-Ahead Trading
Renewables
Conventionals
Supply

BUSINESS MODEL BUSINESS MODEL10 11Danske Commodities Annual Report 2019
MOVING ENERGY ACROSS BORDERS
39 Active power markets
23Active gas markets
347 TWh Power traded in 2019
772 TWh Gas traded in 2019
Danske Commodities realises the full potential of energy resources by offering energyrelated services to customers and trading power and gas in global energy markets.
ACTIVE ON 31 EXCHANGES
Borsa Istanbul, TRBSP SouthPool (SP), SICentral Eastern European Gas Exchange (CEEGEX), HUCentral European Gas Hub (CEGH), AUCroatian Power Exchange (CROPEX), HREuropean Energy Exchange (EEX), DEEuropean Power Exchange (EPEX SPOT), FREnergy Exchange Austria (EXAA), AUEnergy Exchange Istanbul (EPIAS), TRGaspoint Nordic, DKGestore Mercati Energetici (GME – IPEX), ITHellenic Energy Exchange S.A. (HENEX), GRHungarian Power Exchange (HUPX), HUHungarian Derivative Energy Exchange (HUDEX), HUICE Endex, NLICE Futures Europe, UKICE Futures US, US*Independent Bulgarian Energy Exchange, (IBEX), BGMEFF, ESMIBGAS, ESNasdaq OMX Europe, NONodal Exchange, US*Nord Pool (NP), NOOKTE, SKOMIE, ESOPCOM, ROOTE, CZPEGAS, FRPolish Power Exchange (TGE / POLPX), PLSEMO/SEMOpx, ILSEEPEX A.D., RS
* Danske Commodities' access to the US power market is through the Equinor-owned company Danske Commodities US LLC.
Renewables
Supply
Conventionals
FRANCE
ITALY
BENELUX
GERMANY
AUSTRIA
UNITED KINGDOM
AUSTRALIA
US*
DENMARK

INSIGHT: US POWER TRADING 13
In 2019, Danske Commodities expanded its business activities to the US by supporting the Equinor-owned company Danske Commodities US LLC, based in Stamford, Connecticut. Entering the US is the latest step in Danske Commodities’ strategy for global expansion under its new ownership with Equinor. Head of US Power Trading, Maarten Manders, explains why entering the US was a natural next step for Danske Commodities.
Since Danske Commodities was founded in 2004, we have built a successful business in energy trading and related services across the European continent by being at the forefront of the liberalisation of the European energy markets. Danske Commodities uses this trading expertise to support Equinor’s activities in the US. In 2018, we moved outside Europe for the first time, enter-ing the Australian market for power trading. 2019 saw a continuation of our global expansion as we entered the PJM and MISO, which manage two of the largest wholesale power markets in the world. Combined, the two markets cover 25 states and the District of Columbia, serving more than 100 million people.
MARKET DRIVERS AND NETWORKThere are several good reasons for choosing the US as the natural next step in a global expansion strategy. The price drivers in the US market are the same as in Europe, meaning that weather, fuel prices and outages are among the factors that determine the price of energy in Europe as well as in the US, especially given the steady growth in renewable energy sources in the US.
About Maarten Manders
■ Position: Head of US Power Trading
■ Employed since: January 2019 (employed with Danske Commodities since February 2014)
■ Educational background: Master’s in Banking and Finance
A NEW FRONTIER: TRADING POWER IN THE US
INSIGHT
Given the similar price drivers, Danske Commodities US can leverage on the experience we have built within me-teorology, price forecasting, outages tracking and spread trading over the past 15 years of operating in Europe. In short, both markets are data-driven, and we specialise in handling and processing vast amounts of data, which gives Danske Commodities US an edge in the American power markets.
Going forward, Danske Commodities US will continue to support Equinor’s growing trading activities in the US, combining high ambitions with sound business practice.

STRATEGy14 Danske Commodities
ADVANCING OUR BUSINESS TO THE NEXT LEVEL
Last year, Danske Commodities launched an ambitious growth strategy named ‘LEVEL UP’. The threeyear corporate strategy sets the direction for the Company and aims to advance Danske Commodities to the next level of energy trading. Now, a year on, several strategic leaps have been taken.
STRATEGIC LEAPS IN A TRANSFORMATIVE YEAR2019 marked the first year of Danske Commodities’ LEVEL UP strategy and the Company’s first year under Equinor ownership. During the year, Danske Commo - d ities achieved a number of strategic milestones, which will take the trading business to the next level and sup-port Equinor’s energy transition.
AUTOMATED TRADING IMPLEMENTED ACROSS THE BUSINESSIn 2019, Danske Commodities implemented trading algo-rithms throughout its power and gas business. To suc-ceed with the ambitious objectives for automated trading, the Company developed a data strategy that ensures high data quality and streamlined processes, cementing its position as a tech-driven energy trading company.
TRADING ACTIVITIES ESTABLISHED IN THE US Continuing its global expansion, Danske Commodities facilitated a trading desk in the US with Equinor. With activities already established in Australia, the Company
EXCEL IN CORE
By extracting value from trading price differentials across geograph - ical borders and time-delimited markets, we aim to leverage our commercial strongholds in gas and power and protect our leading posi-tion in short-term energy trading.
POSITION FOR GROWTH
To grow profit in energy markets with decreasing margins, we want to drive growth initiatives in new or untapped geographies, products and segments where we see signif-icant business opportunities.
HARVEST SYNERGIES
By combining our short-term trading expertise with Equinor’s leading gas position, growing renewables portfolio and strong balance sheet, we want to capture and develop synergies within power and gas.
DIGITALISATION
To remain competitive for the long term, we aim to improve speed and decision-making quality by in - creasingly applying advanced ana-lytics, algorithms and automation in pre-trade, trade and post-trade processes.
RISK MANAGEMENT
By applying risk-adjusted perfor-mance evaluation, we want to make risk-informed decisions and ensure that risk capital is dynamically allo-cated to the business opportunities with the best risk/reward ratio.
PEOPLE & CULTURE
To continue succeeding, we need passionate, highly talented and knowledgeable people. We commit to strengthen people development, foster our high-performance culture and recruit the needed capabilities to support our growth ambitions.
is looking to continue its expansion beyond European borders. As such, supporting Equinor’s trading activities in the US is another important step in the Company’s globalisation journey.
MULTIPLE LONG-TERM UK PPAS SIGNED As part of a planned onboarding of Equinor’s power trading business, Danske Commodities entered into three long-term balancing PPAs in the UK with a combined production capacity of +400 MW. The addition of these volumes to the Company’s portfolio strengthens the long-term business and underlines the commitment to the British renewables market.
GAS STORAGE PORTFOLIO INCREASED BY 20 TWHEquinor provided Danske Commodities with access to a downstream gas storage portfolio of 20 TWh as part of Equinor’s commercial strategy, focusing short-term op - portunistic gas trading in Danske Commodities. With this portfolio, a strengthened market presence in CSEE and an increase in traded volumes, Danske Commodities continues to expand the scope of its gas trading activities.
CROSS-COMMODITY TRADING UNLOCKED NEW GROWTH POTENTIAL In 2019, Danske Commodities grew its newly established cross-commodity trading setup. By expanding the Com-pany’s trading perspective on fundamental price drivers, Danske Commodities will be able to improve trading of cross-correlated commodities, like gas-to-power con - tracts, thereby strengthening the existing business.
OUR COMMERCIAL QUESTS AND ENABLERS
QUESTS
ENABLERS

STRATEGy STRATEGy16 17Danske Commodities Annual Report 2019
JOINING FORCES WITH A LEADING ENERGY PRODUCER In 2019, Danske Commodities became a part of one of the world’s biggest energy companies, Equinor. Combining a leading energy producer with a leading energy trading company has made for a landmark year, which included new longterm PPAs and the onboarding of a new 20 TWh downstream gas portfolio.
1 FEBRUARY 2019DANSKE COMMODITIES
BECAME PART OF EQUINOREuropean competition authorities approve Equinor’s acquisition and
Danske Commodities officially becomes part of one of the world’s
biggest energy companies.
29 MARCH 2019BANK AND PARENT COMPANY GUARANTEES RENEGOTIATED
Backed by the financial strength of Equinor, Danske Commodities
renegotiates bank and parent company guarantees, resulting
in significant annual savings.
1 MAY 2019CERTIFICATES
BUSINESS ONBOARDEDDanske Commodities onboards Equinor’s certificates trading activities, including handling
and trading of EUAs, El-certs, ROCs and REGOs.
15 MAY 2019FIRST CAPITAL
INJECTION RECEIVEDEquinor injects EUR 89 million into
Danske Commodities to unlock business growth and create better
conditions when trading with counterparties.
19 JUNE 201920-YEAR PPA ONBOARDED
As part of a planned onboarding of PPAs from Equinor, Danske
Commodities enters into a 20-year PPA with the world’s first floating
wind farm Hywind Scotland for 30 MW.
12 JULY 201915-YEAR PPA ONBOARDED
Continuing the onboarding of PPAs, Danske Commodities enters into
a 15-year PPA with British offshore wind farm Sheringham Shoal
for 126 MW.
15 JULY 2019SECOND CAPITAL
INJECTION RECEIVEDContinuing the advance of Danske
Commodities to the next level of energy trading, Equinor injects
EUR 90 million into Danske Commodities.
8 AUGUST 2019US POWER MARKET ENTEREDDanske Commodities expands business activities to the US through the Equinor-owned
company Danske Commodities US LLC.
2 OCTOBER 2019GAS-TO-POWER
CONTRACT SIGNEDEntering a new business area, Danske Commodities signs its
first gas-to-power contract with Equinor for a German utility.
1 NOVEMBER 2019GRADUAL ONBOARDING OF GAS STORAGE PORTFOLIO INITIATED
Equinor provides access to a down-stream gas storage portfolio of 20 TWh, concentrating its short-term
opportunistic trading in Danske Commodities.
16 JULY 201915-YEAR PPA ONBOARDEDCompleting the onboarding
of PPAs, Danske Commodities enters into a 15-year PPA with
British offshore wind farm Dudgeon for 281 MW.
12 DECEMBER 2019NORDIC SUPPLY CONTRACT SIGNED Danske Commodities signs contract
to supply Equinor’s assets in Norway, representing a total annual con - sumption portfolio of 6.6 TWh,
with power.

INSIGHT: FLOATING WIND INSIGHT: FLOATING WIND18 19Danske Commodities Annual Report 2019
In June 2019, Danske Commodities entered a 20-year Power Purchase Agreement (PPA) with the world’s first floating wind farm, Hywind, off the shores of Scotland. Turbines that float can be positioned in deeper waters than when using ordinary offshore turbines, meaning they hold a huge potential, explains Danske Commodities’ Head of Origination, Marco Verspuij.
Close to 80% of the ocean’s wind resource potential is in deep waters, where winds are typically stronger and more consistent because there is nothing to disrupt the wind flow. However, in the areas that hold the strongest poten-tial, it is impossible to establish conventional wind farms using bottom-fixed turbines, simply because of the water depths. The solution to this problem can be seen 30 km off the coast of Scotland, where Hywind’s floating wind turbines have been producing power since 2017. The farm, whose total volume is 30 MW, equalling the power con-sumption of around 20,000 households, is owned by Equinor (75%) and Masdar (25%). After signing the PPA in June 2019, Danske Commodities is now responsible for trading and balancing the wind farm’s production.
FLOATING WIND FARMS – HOW DOES IT WORK?Hywind’s floating wind turbines incorporate familiar off-shore technologies into a completely new design. Giant wind turbines are placed on top of floating vertical spars moored by cables or chains to the sea bed. The floating structure underneath each turbine consists of a steel cy -linder filled with ballast water and rock or iron ore, and Hywind uses a ballasted catenary layout with three moor ing cables with 60 tonne weights hanging from the mid point of each anchor cable to provide additional tension. Con trol software on board constantly monitors the operation of the wind turbines and alters the pitch of the blades to effectively dampen the motion of the tower and maxi mise production. Electricity produced is taken to shore through cables.
HIGH AMBITIONS FOR FLOATING WINDUntil recently, development of floating wind turbines had been confined to the drawing board, but the technology has now reached a tipping point in maturity, and while the floating wind market today consists almost exclusively of Hywind Scotland’s 30 MW park, we expect to see a rapid acceleration in growth, just as we have witnessed in other renewables technologies. By 2030, the total production of offshore wind will have passed 100 GW, and floating wind is estimated to constitute 10% of that market, pow-ering around 12 million homes worldwide. With decades of offshore experience and high project execution capa-bilities, Equinor will be at the very forefront of the expan-sion of floating offshore wind farms, and with our unique market access and highly efficient trading engine, Danske Commodities is well-positioned to optimise the outcome of renewable energy sources and is ready to help turn Equinor’s high ambitions into a profitable business.
About Marco Verspuij
■ Position: Head of Origination
■ Employed since: August 2019 (employed with Equinor since May 2010)
■ Educational background: Bachelor’s in Economics
FLOATING WIND FARM UNLOCKS NEW OPPORTUNITIES
INSIGHT

FINANCIAL PERFORMANCE FINANCIAL PERFORMANCE20 21Danske Commodities Annual Report 2019
In 2019, Danske Commodities became a part of Equinor. Joining forces with one of the world’s biggest energy companies brought new opportunities for business growth, as Equinor unlocked access to a strong balance sheet, a large portfolio of energy assets and global markets. Financially, this was primarily reflected in an increase in total assets, a changed composition of the balance sheet items and increased equity, resulting in a strong equity ratio of 48.6% in 2019.
REVENUEDanske Commodities continued to grow revenue in 2019, as the figure rose 7% to EUR 10,046 million from EUR 9,377 million in 2018. As in previous years, and as expected, traded volumes grew significantly in 2019; but the effect on revenue was partly offset by signifi-cant ly lower prices in both power and gas markets.
GROSS PROFITGross profit amounted to EUR 108 million in 2019 com-pared to EUR 123 million in 2018. The main reason for the lower gross profit in 2019 was the extraordinary year in 2018 affected by extreme weather conditions that resulted in increased market volatility and profitable trading conditions for Danske Commodities. Similar con - ditions were not seen in 2019, which was characterised by less volatility and lower prices compared to both 2017 and 2018. Despite the challenging market conditions, gross profit for the year exceeded the 2017 gross profit of EUR 103 million.
Suppressed margins in energy markets were a continuing trend in 2019, as reflected by the gross margin of 1.1% in 2019, down from 1.3% in 2018.
COSTSThe cost base increased in 2019 compared to 2018 through higher staff costs as well as increased amortisation, depreciation and impairment.
In 2019, Danske Commodities faced increased compli-ance and reporting requirements after becoming part of a major listed group, Equinor Group, large investments and an increase in activity levels and the addition of new ones, including supporting the entry into the US. As a result, the average number of em ployees increased by 5% to 281 FTEs in 2019. In 2019, Danske Commodities also improved the benefit schemes for employees with im proved pension and paternity leave schemes. Together with the increased average FTEs, this explains the in - crease in staff costs of 11% to EUR 39 million in 2019 from EUR 35 million in 2018.
A significant investment in contracts in 2019 reflected as contractual rights was the main explanation behind amortisation, depreciation and impairment increasing by EUR 3 million in 2019 to EUR 6 million. Amortisation, depreciation and impairment primarily consisted of amor - tisation of intangible assets, and given the large invest-ment in contracts in 2019, it will increase further in 2020 with a full year of amortisation of these assets.
Other external expenses decreased slightly in 2019, amounting to EUR 12 million compared to EUR 13 million in 2018. The Company succeeded in keeping costs low in 2019, despite increasing activities due to a strong focus on automation and cost awareness, and the ‘value for money’ mindset that is an integrated part of the culture at Danske Commodities.
EARNINGSEBIT of EUR 50 million in 2019 marked a strong perfor-mance in both core business and support functions in
FINANCIAL PERFORMANCE IN 2019
In a year with changes, challenges and new opportunities, Danske Commodities delivered a strong financial performance with EBIT of EUR 50 million. The results were driven by the Company’s scalable business model and datadriven approach to energy trading.
But 2019 was also a year with relatively uneventful ener gy markets compared to previous years. The markets saw a mild winter, an oversupply of gas, lower margins and more competition. Despite challenging mar ket conditions, Danske Commodities delivered a strong finan cial per-formance with EBIT of EUR 50 million and gross pro fit above EUR 100 million for the third consecutive year.
a transformative year for Danske Commodities, charac-terised by relatively uneventful energy markets, a high level of internal activity and increased internal require-ments due to the increase in activities. EBIT was down EUR 22 million compared to 2018 due to a combination of lower gross profit and higher total costs in 2019 com-pared to 2018, as earnings in the first quarter of 2018 were boosted by an extraordinary cold spell in Europe.
EBT was negatively affected by net financials of EUR 1 million and amounted to EUR 49 million, a decrease of 31% compared to 2018.
Joining forces with Equinor brought new opportunities for business growth.— LARS TROEN SØRENSEN, CFO
47%
58%
54%
108EURm gross profit in 2019
Revenue (EURb)
Power Price Index (2017)*
Gas Price Index (2017)**
* German annual average EPEX day-ahead
** NCG annual average VWAP day-ahead
2017
103
2018
123
2019
108
REVENUE AND PRICE INDEX
SCALABILITY — EBIT SHARE OF GROSS PROFIT
GROSS PROFIT AND GROSS MARGIN
1.9%
1.3%
1.1% Gross profit
(EURm)
Gross margin
10.09.4
5.5
201920182017
47%Scalability in 2019
2017
2018
2019
100
130
79
100
133
110

FINANCIAL PERFORMANCE FINANCIAL PERFORMANCE22 23Danske Commodities Annual Report 2019
With an effective tax rate of 22% in 2019, unchanged from 2018, tax on the profit for the year was, like EBT, down 31% compared to 2018, at EUR 11 million in 2019 com-pared to EUR 16 million in 2018. Consequently, profit for the year decreased by 31% from EUR 56 million in 2018 to EUR 38 million in 2019.
BALANCE SHEET AND EQUITY2019 was a transformative year for Danske Commodities, and that was clearly reflected in the balance sheet total, which was up by 61% from EUR 373 million in 2018 to EUR 602 million in 2019, and the composition of balance sheet items clearly shifted as a result.
Onboarding of activities enabled Danske Commodities to enter into contracts holding great opportunities and representing great value. When value is related directly to a contract, it entails an investment in the contractual right of the contract. In 2019, such investments were primarily related to long-term PPA contracts as reflected in contractual rights with a booked value of EUR 89 mil-lion at 31 December 2019 that drove intangible assets up by EUR 88 million compared to 2018. Property, plant and equipment was down by EUR 3 million in 2019 compared to 2018, primarily due to the carve-out of the subsidiary DC Generation at the beginning of 2019.
Inventories grew almost fourfold from EUR 38 million in 2018 to EUR 145 million in 2019. The significant in crease was attributable both to an increased gas storage and to green power certificates from the new acti vities on boar-ded in 2019. The increased gas storage was re lated to short-term gas storage optimisation acti vities on boarded from Equinor. Of the total inventory, the gas storage amounted to EUR 114 million at 31 December 2019 com-pared to EUR 38 million in 2018.
The increase in activity and changes in trading patterns resulted in both receivables and short-term debt going up in 2019 compared to 2018. Other receivables increased by EUR 38 million to EUR 91 million at 31 De cember 2019, mainly due to an increase in the fair value of deri-vative financial instruments. The increase was mostly attributable to an increase in the fair value of derivatives from gas forward contracts partly related to the increase in gas volumes in storage.
The total cash position grew 31% in 2019 despite signifi-cant investments during the year as they were offset by two capital injections from Equinor and solid ear nings for the year. Total cash at the end of December 2019 amounted to EUR 91 million, up from EUR 70 million in 2018.
Equity increased due to capital injections from Equinor. The capital injections were carried out as part of Equinor’s strategical investment in Danske Commodities and were made to prepare and bolster the Company for growth and the related necessary investments in 2019. Going forward, the increased capital will also contribute to ensuring that the Company can meet the requirements from stakeholders and counterparties re lated to the activities onboarded from Equinor and future activities.
Also, the profit for the year had a direct positive effect on equity. Equity was up EUR 216 million from the end of 2018 to EUR 293 million at the end of 2019. Compared to 2018, return on equity fell significantly in 2019, to 20.8%. This lower return on equity is considered satis-factory as the significant investments made by Equinor are long-term.
The equity ratio increased significantly from 20.4% in 2018 to 48.6% in 2019. With the solid cash position and equity at the end of 2019, Danske Commodities is an even stronger business partner.
CASH FLOWSignificant purchases of gas for storages and green power certificates in late 2019 have, despite solid ear-nings, resulted in the cash flow from operating activities being an outflow for the first time in company history. The purchases drove up inventories by EUR 107 million and were the main contributor to the cash outflow from operating activities of EUR 65 million compared to an inflow of EUR 50 million in 2018.
Cash flow from investing activities at EUR 92 million in 2019 was the largest outflow in company history, sig-nificantly exceeding the 2018 outflow of EUR 5 million. The outflow was attributable to the significant investments in contractual rights acquired when onboarding three long-term PPA contracts that were all in production. As cash flows from both operating and investing activities were outflows, the free cash flow was negative by EUR 157 million in 2019.
During 2019, Danske Commodities received two capital injections from Equinor, amounting to EUR 179 million which resulted in a cash inflow from financing activities of EUR 178 million.
Cash and cash equivalents amounted to EUR 91 million at 31 December 2019, up EUR 21 million from 31 Decem-ber 2018. The increase was possible due to a cash in flow from solid earnings and significant capital injections from Equinor that were partly offset by the significantly higher net working capital resulting from the purchase of inventories as well as significant investments made in 2019.
INTERNATIONAL OPERATIONSIn 2019, Danske Commodities continued to strengthen its activities outside Europe and increased the activities in Australia and entered the US market by supporting the activities in the Equinor-owned sister company Dan-ske Commodities US LLC.
Due to carve-out of one subsidiary and closing of subsi-d iaries in Croatia and Sweden, the number of subsidiaries was reduced during the year to optimise the organisa-tional structure of the group. Activities in these countries are now managed elsewhere in the group unaffected by the closures.
OUTLOOKAs expected, the EBIT performance in 2019 was not at the same level as in 2018. Compared with previous years, energy markets were relatively uneventful with fewer trading opportunities, and consequently, EBIT for 2019 came in slightly lower than expected. For 2020, perfor-mance in terms of EBIT is expected to be higher than in 2019, when the new business invested in during 2019 begins to materialise.
EQUITY AND RETURN ON EQUITY
CASH AND CASH EQUIVALENTS
2017
106
2018
76
2019
293 293EURm equityin 2019
91EURm in cash and cash equivalentsin 2019
49.8%
20.8%
61.5%
Equity (EURm)
Return on equity
Cash and cash equivalents (EURm)2019
91
2018
70
2017
108
RISk MANAGEMENT RISk MANAGEMENT24 25Danske Commodities Annual Report 2019
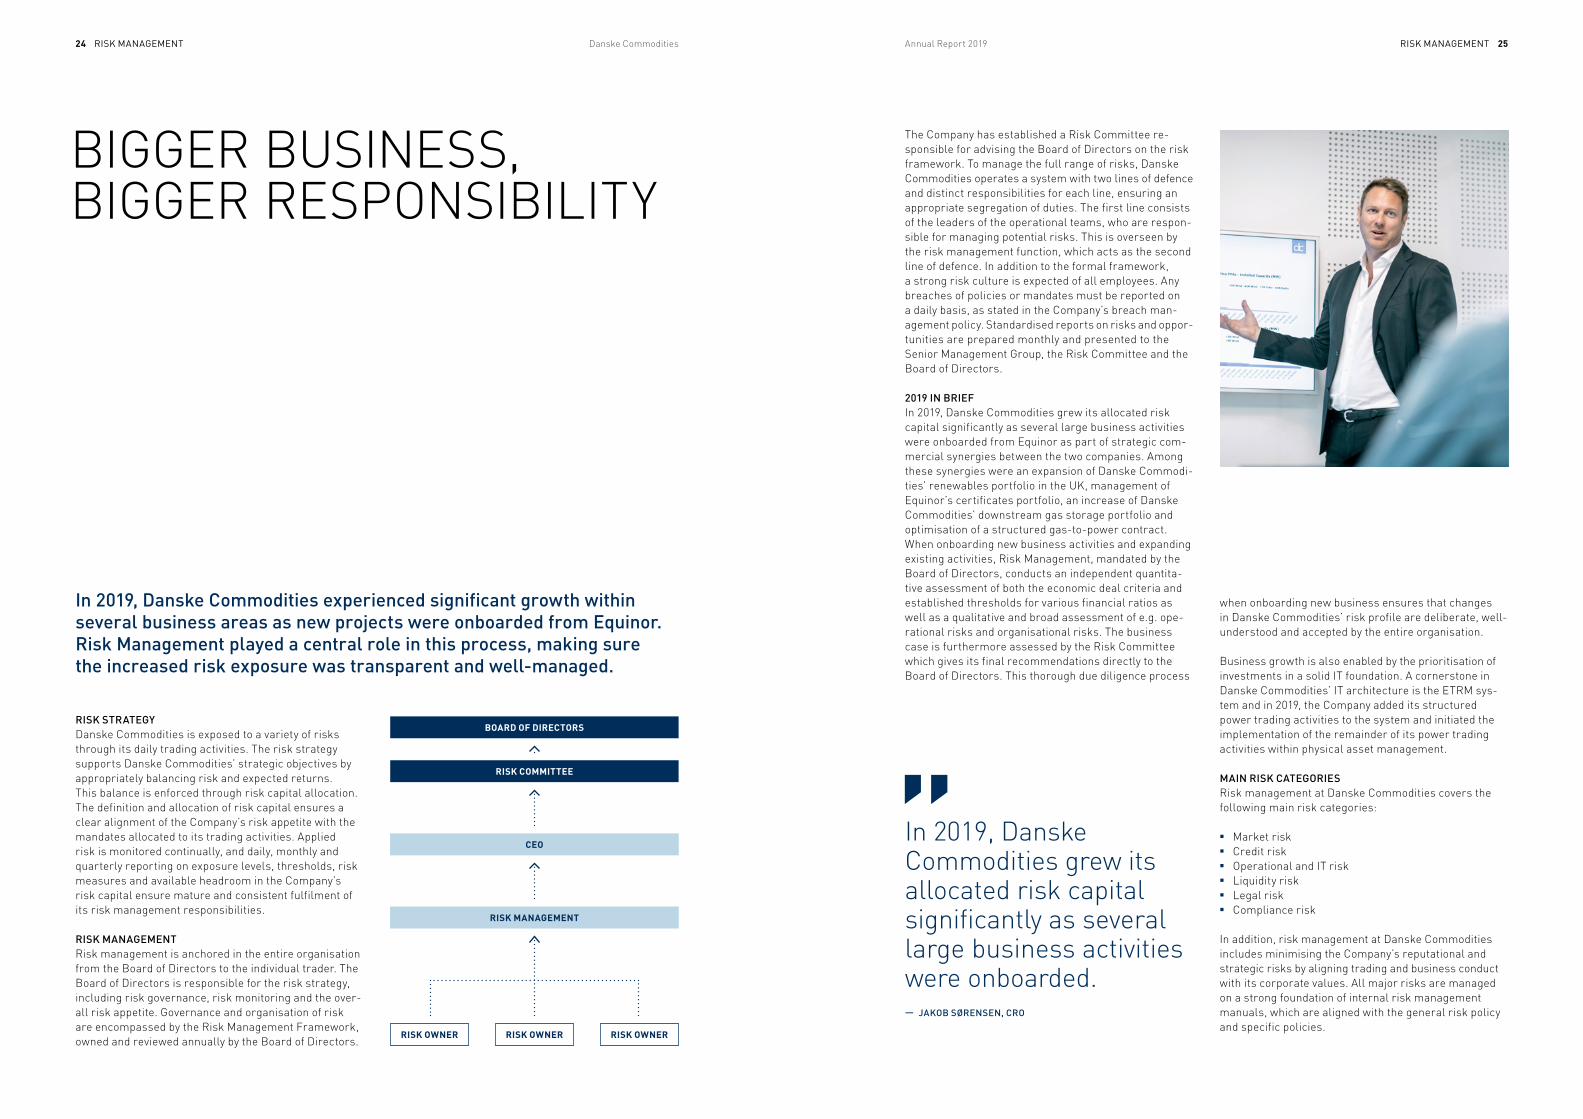
RISK STRATEGY Danske Commodities is exposed to a variety of risks through its daily trading activities. The risk strategy supports Danske Commodities’ strategic objectives by appropriately balancing risk and expected returns. This balance is enforced through risk capital allocation. The definition and allocation of risk capital ensures a clear alignment of the Company’s risk appetite with the mandates allocated to its trading activities. Applied risk is monitored continually, and daily, monthly and quarterly reporting on exposure levels, thresholds, risk measures and available headroom in the Company’s risk capital ensure mature and consistent fulfilment of its risk management responsibilities.
RISK MANAGEMENT Risk management is anchored in the entire organisation from the Board of Directors to the individual trader. The Board of Directors is responsible for the risk strategy, including risk governance, risk monitoring and the over-all risk appetite. Governance and organisation of risk are encompassed by the Risk Management Framework, owned and reviewed annually by the Board of Directors.
BIGGER BUSINESS, BIGGER RESPONSIBILITY
In 2019, Danske Commodities experienced significant growth within several business areas as new projects were onboarded from Equinor. Risk Management played a central role in this process, making sure the increased risk exposure was transparent and wellmanaged.
The Company has established a Risk Committee re - spon sible for advising the Board of Directors on the risk framework. To manage the full range of risks, Danske Commodities operates a system with two lines of defence and distinct responsibilities for each line, ensuring an appropriate segregation of duties. The first line consists of the leaders of the operational teams, who are respon-sible for managing potential risks. This is overseen by the risk management function, which acts as the second line of defence. In addition to the formal framework, a strong risk culture is expected of all employees. Any breaches of policies or mandates must be reported on a daily basis, as stated in the Company’s breach man - age ment policy. Standardised reports on risks and op por - tunities are prepared monthly and presented to the Senior Management Group, the Risk Committee and the Board of Directors.
2019 IN BRIEF In 2019, Danske Commodities grew its allocated risk capital significantly as several large business activities were onboarded from Equinor as part of strategic com-mercial synergies between the two companies. Among these synergies were an expansion of Danske Commodi-ties’ renewables portfolio in the UK, management of Equinor’s certificates portfolio, an increase of Danske Commodities’ downstream gas storage portfolio and optimisation of a structured gas-to-power contract. When onboarding new business activities and expanding existing activities, Risk Management, mandated by the Board of Directors, conducts an independent quantita-tive assessment of both the economic deal criteria and established thresholds for various financial ratios as well as a qualitative and broad assessment of e.g. ope-rational risks and organisational risks. The business case is furthermore assessed by the Risk Committee which gives its final recommendations directly to the Board of Directors. This thorough due diligence process
when onboarding new business ensures that changes in Danske Commodities’ risk profile are deliberate, well- understood and accepted by the entire organisation.
Business growth is also enabled by the prioritisation of investments in a solid IT foundation. A cornerstone in Danske Commodities’ IT architecture is the ETRM sys-tem and in 2019, the Company added its structured power trading activities to the system and initiated the implementation of the remainder of its power trading activities within physical asset management.
MAIN RISK CATEGORIES Risk management at Danske Commodities covers the following main risk categories:
■ Market risk ■ Credit risk ■ Operational and IT risk ■ Liquidity risk ■ Legal risk ■ Compliance risk
In addition, risk management at Danske Commodities includes minimising the Company’s reputational and strategic risks by aligning trading and business conduct with its corporate values. All major risks are managed on a strong foundation of internal risk management manuals, which are aligned with the general risk policy and specific policies.
In 2019, Danske Commodities grew its allocated risk capital significantly as several large business activities were onboarded. — JAKOB SØRENSEN, CRO
BOARD OF DIRECTORS
RISK COMMITTEE
RISK MANAGEMENT
RISK OWNER RISK OWNER RISK OWNER
CEO

RISk MANAGEMENT RISk MANAGEMENT26 27Danske Commodities Annual Report 2019
MARKET RISK
Market risk is the risk of the value of open posi-tions changing as a result of fluctuating market conditions.
Danske Commodities’ market risk arises in both com-mo dity and financial markets with fluctuating energy prices, production and consumption balancing and for-eign exchange rates constituting key risk factors. Due to the potential impact on the Company’s earnings, Danske Commodities continuously monitors and stress tests volatility and commodity price developments. Market risk is managed as set out in the Market Risk Policy and the Market Risk Manual. The Market Risk Policy defines the allowable products, regions and commodities where as the Market Risk Manual provides the specific mandates within the overall market risk appetite. The market risk appetite of Danske Commodities sets out the overall risk limits defined as the allocated risk capi-tal, and the aggregation of the different mandates is kept within those limits, ensuring that the Company monitors its risk profile at all times. Open positions are only accepted if mandates have been established. All open trading positions are monitored by a second line of defence on the Risk Management team. All mandates across the business are reviewed regularly and updated to ensure that they continue to comply with the overall risk appetite and are in sync with changing market con-ditions. As part of the monitoring process, Danske Commodities operates several warning levels and stop-loss limits to ensure timely action if a mandate is vio-lated. Structured product control, model validations and additional stress tests and risk measures, such as Value- at-Risk and Cash Flow-at-Risk, are used as an integral part of risk management for relevant products and activities. Foreign exchange risk, to which the daily com-mercial business is exposed, is mitigated and hedged on a daily basis using a Value-at-Risk approach. As for-eign exchange risk is not a core business for Danske Commodities, a hedging strategy anchored in the Treasury team is pursued to mitigate the foreign exchange risk. Hence, currency risk is an insignificant component of the overall risk appetite at Danske Commodities.
OVERVIEW OF MAIN RISKS
CREDIT RISK
Credit risk is the risk of financial loss resulting from a counterparty failing to meet contractual obligations.
Danske Commodities manages credit risk through a clearly defined framework of policies and procedures approved by the Board of Directors and defined by the Risk Management team. The Company has taken out credit insurance on the main portfolio of counterparties. This reduces the risk of potentially uncovered credit exposure. Thorough Know Your Customer (KYC) and sanctions screening processes are performed according to the agreed policy. The financial strength and credit-worthiness of counterparties, who are not covered by credit insurance, are assessed before the Company enters into any contract and on an ongoing basis during the duration of individual contracts. If required, addi-tional security is requested from counterparties and credit lines are monitored daily. The KYC process is reviewed regularly, and sanctions screening is done on a continual basis. Danske Commodities incurred zero credit-related losses in 2019.
OPERATIONAL AND IT RISK
Operational and IT risk covers the risk of financial loss due to loss of systems availability, human error or improper internal workflows.
Like most companies in the energy sector, Danske Com-modities is dependent on reliable IT systems. In 2019, the IT team continued its on-going efforts to reduce IT risk exposure. This included actions on Cloud platforms, implementation of extended logging capability and extended coverage of malware prevention and detection to ensure that Danske Commodities can match the evolving landscape of threats. In addition, mandatory annual awareness training is conducted for all Danske Commodities’ employees.
LIQUIDITY RISK
Liquidity risk is the risk of Danske Commodities not being able to meet its liabilities towards counterparties.
Danske Commodities is considered to have low liquidity risk, being under the ownership of Equinor and given its solid capital structure. Cash flows from operations, cash reserves and undrawn credit facilities are key aspects that for several years have ensured stable and adequate liquidity. Add to that the bolstering of equity through two capital injections by Equinor and access to internal credit facil ities, also provided by Equinor. Danske Commodities measures its overall liquidity, con-sisting of free liquidity, including cash collateral, other deposits and forecasted cash flows, on a daily basis. In addition, different liquidity outcomes are simulated through various stress tests. The stress testing process analyses daily forecasted liquidity against a minimum liquidity level, enabling the Company to better manage liquidity reserves and withstand extreme market move-ments at all times.
LEGAL RISK
Contractual relationships with customers and business partners bear the potential for legal risks.
Danske Commodities’ legal team is focused on proactive legal work and contributes in a structured way to iden-tifying, prioritising and managing legal risks and oppor-tunities in consultation with all support and business teams in the Company. The Legal team engages in the on-going business activities and decision-making pro-cesses at an early stage and takes part in the approval process for new products. By drafting and negotiating well-balanced contracts in accordance with the legal risk tolerance defined by the Board of Directors in line with local legislation and practice in the markets in which Danske Commodities operates, the Company conducts risk assessment on an ongoing basis. As such, the over-all level of claims and disputes can be held at a mini-mum. The legal counsels of Danske Commodities work closely with professional external advisers when expert knowledge is required.
COMPLIANCE RISK
Compliance risk is the risk posed to Danske Com-modities’ financial, organisational or reputational standing that could result from a failure to act in accordance with laws, regulations and prescribed standards.
Ensuring high ethical standards is fundamental for Danske Commodities, and therefore the implementation of a Code of Conduct was an important task in 2019. Focus was on creating awareness and providing straight- forward information on the application of the Code of Conduct. Information and guidance on the Regulation of Energy Market Integrity and Transparency (REMIT) and the Market Abuse Regulation (MAR) have been pro-vided to traders and other relevant staff through writ - ten guidelines, training sessions and frequent Q&A ses-sions with the Company’s compliance officer. This is the foundation for creating and maintaining a high level of aware ness of compliance risks. In 2019, Danske Com-modities updated its processes and systems for con - duc ting regulatory reporting (compliance with the re - porting obligations under EMIR and REMIT). Efforts have also been made to explore and harvest synergies with Equinor’s compliance teams, which have been success-ful and resulted in a greater pool of knowledge within the area of compliance risk. Compliance reports prepared on a regular basis provide the Senior Management Group, the Risk Committee and the Board of Directors with an updated status on compliance risks, ensuring an on going dialogue on the continued development of a strong com-pliance culture at Danske Commodities.
€
AAA

INSIGHT: POST-TRADE AUTOMATION 29
As margins continue to decrease across power and gas markets, energy trading has become a volumes game. Here, Danske Commodities’ Head of Finance & Accounting Jesper Vinter Christensen explains how the Company has utilised digitalisation to increase traded volumes over the past three years by more than 300% while keeping costs steady.
trade, meaning confirmation, clearing, settlement and reconciliation. By employing robotics technology, we can automate a great deal of these time-consuming processes. One example is invoice reception, which used to be a man-ual process. Now, the bot takes care of 80% of the +100 invoices coming in daily. And the potential is limitless. In 2019, post-trade automation technologies carried out standardised and repetitive tasks equivalent to the work of four full-time employees, allowing Danske Commodities to scale its business without incurring additional costs.
Post-trade automation has also been a key business en - abler for Danske Commodities. In 2019, we became part of Equinor, which expanded our power and gas trading business by a significant margin, including three long-term PPAs and a downstream gas storage portfolio equalling Denmark’s annual electricity consumption. By tapping the potential of post-trade automation, we have onboarded new business without bringing on more people to handle the massively increased post-trade processes.
SCALE TO WIN Succeeding with post-trade automation requires cross- organisational collaboration and continued investments in data processing. The winners will be those that can sig - nificantly scale volumes while lowering cost per trade and building capabilities to handle the exponential growth in data. With Equinor in our corner, we can accelerate our ability to scale our traded volumes and make investments in technology, data and automation across the value chain. And financial strength is not the only prerequisite to achiev-ing scale. It also takes close collaboration across the organisation. At Danske Commodities, the Finance team works shoulder to shoulder with the traders and IT, and together we are automating the entire trading value chain and capturing new opportunities in the markets.
Digitalisation has ushered in a new era of energy trading. It has become a valuable solution to offset the trend of narrowing margins by improving the quality of decision- making, increasing execution speed and reducing human errors. At the same time, automation eliminates tedious tasks and frees up time for innovation. Of course, most of our industry has seen a great potential in automating trades but post-trade processes have been widely over-looked. At Danske Commodities, we are going digital across the entire trading value chain, including post-trade processes.
THE POTENTIAL OF POST-TRADE AUTOMATION Over the past three years, Danske Commodities has increased traded volumes by more than 300%. By auto-mating large parts of the post-trade process, we have been able to do that without needing additional resources. As such, post-trade automation represents a huge un - tapped potential.
Often overlooked, post-trade processes are complex, extensive and time-consuming. This is the part of a trans-action that takes place after the trader has executed the
About Jesper Vinter Christensen
■ Position: Head of Finance & Accounting
■ Employed since: November 2014
■ Educational background: Master’s in Business Administration and Auditing
GOING DIGITAL ACROSS THE TRADING VALUE CHAIN
INSIGHT

PEOPLE 31Annual Report 2019PEOPLE30 Danske Commodities
The success and development of Danske Commodities is closely linked to the success and development of its people. It is the people of Danske Commodities who drive the Company’s expansion to new continents and the onboarding of new and bigger business. It is the people who unfold the full potential of being part of Equinor and thereby supporting the energy transition. And it is the people who keep driving Danske Commodities forward, every day and every hour. Consequently, development, motivation and well-being of the people are top priorities at Danske Commodities.
PROFESSIONAL AND PERSONAL DEVELOPMENTAt Danske Commodities, all employees are offered indi-vidual development plans which outline personal devel-opment opportunities and career aspirations during – and after – the employee’s time with Danske Commodities. To support this, all leaders have been trained in coaching and facilitating development dialogue.
Through DC University, an in-house hub for knowledge and training, Danske Commodities runs more than 50 courses every year, and traders are offered tailor-made training programmes which include mental and physical training, dietary advice, meteorology training, compliance training, money management, mentoring and meditation to increase personal health and performance. In addi-tion, Danske Commodities has offered change manage-ment training to all leaders in the transition period ahead of becoming part of Equinor, introduced a Leadership As sessment Programme for future leaders and invested in experienced employees wishing to advance their careers as specialists.
The targeted development of the Company’s people is com - bined with benefits such as 16 weeks paternity leave, per-sonal health checks, health insurance, a pension scheme as well as more than 100 social and professional events every year.
WITH EQUINOR COMES MORE OPPORTUNITIESSince Danske Commodities became part of Equinor in February 2019, the development and career opportunities
ENERGY IS OUR BUSINESS,PEOPLE ARE OUR ENERGY
There is no better place to boost your personal and professional development.
for the employees have expanded even further. All em - ployees now have access to Equinor University, where they are offered both online and on-site training courses, and to Equinor’s job portal with job openings across the world. Additionally, Danske Commodities’ employees are offered secondments with Equinor as a means of personal development and cross-company knowledge- sharing.
DIVERSITY ENHANCES PERFORMANCEDanske Commodities operates in complex markets across the world, so employing the right combination of top talent and highly specialised senior profiles is a prerequisite for success. At Danske Commodities, spe-cialists from more than 25 different countries – covering everything from meteorologists to quantum physicists – work closely together. In 2019, Danske Commodities continued to focus on strengthening diversity by increas-ing the talent pool when hiring the best and the brightest. As an example, the share of female applicants for posi-tions on the trading floors increased by 9.8 percentage points from 2018 to 2019.
AMBITIONS FOR THE FUTUREDanske Commodities has a strategic ambition to level up its leadership to remain the most attractive energy trading company to work for. Recognising leadership’s great impact on the motivation and development of the Company’s people, one of the new initiatives that Danske Commodities will roll out in 2020 is a clearer definition of which capabilities Danske Commodities’ leaders are expected to master in order to impact the business and grow their team members.
Just as the people drive Danske Commodities forward, Danske Commodities drives its people forward, partly by offering development plans, courses and peer-to-peer training, and partly by making sure that the Company's people always work with the newest technologies. In that way, the people ensure the future of the Company, and the Company future-proofs its people’s career opportu-nities – regardless of whether that career evolves inside or outside of Danske Commodities.
THE DC PEOPLE IN NUMBERS
Skills
Employees
317Employees at DC
STUDENT EMPLOyEES
INTERNATIONAL EMPLOyEES
WOMEN
MEN
HAS A PHD OR MASTER’S DEGREE
SPEAkS THREE OR MORE LANGUAGES
PARTICIPATED IN DEVELOPMENT TRAINING
LEADERS HIRED INTERNALLy
12%
20%
22%78%
71%
50%
63%
85%

STATUTORy REPORTING ON CORPORATE SOCIAL RESPONSIBILITy STATUTORy REPORTING ON CORPORATE SOCIAL RESPONSIBILITy32 33Danske Commodities Annual Report 2019
ETHICS
POLICIES AND IMPLEMENTATIONAn ethical business culture is the corner - stone of a sustainable company, which is entrenched in the Company’s Code of Con duct and its anti-corruption and anti- bribery policy, in corporating both anti- abuse regulations and anti-crime (money laundering and VAT fraud).
Code of conductThe Code of Conduct assists Danske Com - modities in conducting business in an ethical and transparent manner. The Code of Conduct applies to all employees and board members.
Anticorruption and briberyThe Company has a zero-tolerance approach to corruption in any form, including bribery,
facil itation payments and trading in influ - ence. Danske Commodities’ Ethics Helpline en ables anyone to anonymously convey any ir regularities or violations of the law. Further more, the Company has a no-gift policy, mitigating the risk of bribery and corruption.
Know your customer All counterparties undergo a know your Customer (kyC) process, which includes thorough background checks and financial assessments to avoid doing business with sanctioned parties.
RISKSCorruption undermines legitimate business activities, it is a hindrance for competition, it is devastating for reputations and it ex po - ses businesses and people to risk. Danske Commodities does not accept corruption in any shape or form, including bribery, faci - litation payments and trading in influence.
Danske Commodities will comply with all applicable anti-corruption laws and regula -tions and takes active steps to prevent corruption from occurring in the Company’s business.
RESULTS IN 2019■ Code of Conduct implemented.■ Anti-bribery and corruption training
conducted for all employees.■ No-gift policy implemented.■ Training in sanctions conducted for
relevant employees.
PRIORITIES FOR 2020■ Mandatory Code of Conduct training of
all employees.■ Guideline for compliance with applicable
sanctions to be compiled.■ Develop relevant awareness campaigns
to nurture high ethical standards.
EQUALITY
POLICIES AND IMPLEMENTATIONDanske Commodities respects human rights, maintains a high level of personal safety and supports the right to equality. See Danske Commodities' gender policy here: https://danskecommodities.com/gender-policy-2019/
Human rights The Company conducts its business consis - tently in accordance with the United Nations Guiding Prin ciples on Business and Human Rights and does not accept any violation of human rights by its employees, customers, partners or other stakeholders, neither through direct participation nor by silently standing by.
AntidiscriminationDanske Commodities does not accept dis - crimination and has a zero-tolerance policy for workplace harassment, which is outlined in the People Handbook and signed by all employees. Danske Commodities firmly believes that a diversified workforce benefits innovation and outperforms homogeneous teams.
Privacy, security and safetyDanske Commodities is committed to pro - viding a safe and secure environment for its people. The Company protects the privacy, integrity and confidentiality of stakeholders’ private information in accor dance with GDPR. Moreover, the Company has a contingency plan and an established Work Environment Organisation (WEO).
RISKSAs a growing company, securing data and protecting the business becomes increa - s ingly important. Accidents and violations of privacy can cause harm in many ways, which is why Danske Commodities has preventive processes and carries out infor - mative campaigns to uphold a high level of safety and security.
RESULTS IN 2019■ No violations of human rights or cases
related to discrimination were reported.■ A new gender policy developed and
increased focus on gender diversity. ■ IT security awareness training courses
conducted with a 100% attendance rate.
PRIORITIES FOR 2020■ Strengthened awareness of GDPR.■ Enhanced IT defence and protection
capabilities across platforms.
PEOPLE
POLICIES AND IMPLEMENTATIONDanske Commodities’ People Handbook comprises all relevant information on what the Company expects from its employees as well as what employees can expect from the Company. In 2019, the focus was on enhancing work-life balance, employee development and creating a healthy work environment.
Worklife balanceResearch in the younger generations of the workforce confirms that work-life balance is an important priority for personal well- being. This is even more so the case for parents of young children. In 2019, Danske Commodi ties changed its policy on paternal leave and implemented 16 weeks’ paid leave.
Employee developmentDanske Commodities’ employees con tin - u ously seek professional and personal de vel opment opportunities. In addition to extensive on-the-job-training, Danske Commodities offered more than 50 courses through the Company’s internal knowledge hub, DC University.
Healthy work environmentDanske Commodities has optimised its working environment with new office chairs for all employees, following an assessment of each employee’s ergonomic needs. Danske Commodities offered all employees an individual personal health assessment to promote the importance of good health.
RISKSAs Danske Commodities has become part of Equinor, there is a need to ensure the integration process remains successful.
To monitor the developments and take necessary action, the Company carries out regular Pulse surveys.
RESULTS IN 2019■ 51 development courses conducted with
an average satisfaction score of 4.38 on a 5-point scale.
■ 100% of male employees on paternity leave decided to take at least two weeks’ leave.
■ New office chairs for all employees.
PRIORITIES FOR 2020■ Implementation of new leadership
capability framework. ■ Addition of new office space to
accommodate growing organisation.
PLANET
POLICIES AND IMPLEMENTATIONThrough the corporate sustainability policy, Danske Commodities addresses a variety of internal and external societal and envi ron - mental challenges.
Light over MaliThrough the project Light over Mali, Danske Commodities provides schools and health clinics in rural Mali with solar panels. The solar panels generate and store energy du - ring the day, and the energy can then be used when night falls. This means that schools can educate children and adults after the sun sets. Also, health clinics are now able to cool medicine and treat people at night.
Sustainable procurementDanske Commodities applies environmental awareness in its day-to-day operations. Cleaning supplies are biodegradable and organic, all paper is FSC-certified and office supplies are Swan-labelled and recycled whenever possible. Through the outsourcing agreement with ISS catering, the Company supports the use of organic, local and un - processed food.
Recycling and refurbishingAt Danske Commodities, recycling is a vital focus area. In 2019, +170,000 coffee capsules were recycled and pull rings from soda cans were donated to hospitals and reused for prosthetics. Hardware near end-of-life - time (EOL) is sold to employees, ensuring maximum use of hardware lifetime. Apart from buybacks, Danske Commodities re furbishes, donates and recycles used IT equipment.
RISKSSucceeding with the Company’s sustain - ability policy requires an effort from all em-ployees. To ensure employee engagement, Danske Commodities launched an internal ‘Cut the Carbon’ campaign.
RESULTS IN 2019■ Light over Mali provided +5,000 Malians
with access to electricity through solar panels on health clinics and schools, installation of central lampposts and distribution of homework lamps.
■ A recycling programme of pull rings for prosthetics was implemented.
PRIORITIES FOR 2020■ Implementation of ‘Cut the Carbon’
campaign.■ Launch of an additional CSR project in
Benin with PlanBørnefonden.
EMBEDDING RESPONSIBILITY IN WHAT WE DO
Danske Commodities is committed to be a responsible business partner as well as an active participant in pushing the world towards a sustainable future. Acting responsibly is firmly embedded in the culture, values and business practices of Danske Commodities.
As a global company, Danske Commodities supports the 17 Sustainable Development Goals (SDGs) adopted by all United Nations member states in 2015 to address the most pressing economic, social and environmental challenges the world needs to solve. The Company sup-ports all the SDGs, but focuses its efforts on selected goals, which are connected to the core of Danske Com-modities’ business. As its main focus, the Company works towards advancing affordable and clean energy. In addition, the Company supports the goals on climate action and responsible consumption and production.
Danske Commodities employs a holistic corporate responsibility approach, covering four main themes: ethics, equality, people and planet.

STATUTORy REPORTING ON CORPORATE SOCIAL RESPONSIBILITy STATUTORy REPORTING ON CORPORATE SOCIAL RESPONSIBILITy34 35Danske Commodities Annual Report 2019
Danske Commodities’ sustainability programme ‘Cut the Carbon’ involves three main workstreams: 1 Reducing carbon emissions 2 Switching to renewable energy 3 Offsetting through certified carbon credits
For Danske Commodities, carbon neutrality is an on going journey, encompassing a long-term outlook on sustain-ability and striving for constant improvement of the Company’s business practices. In other words, Danske Commodities aims to reduce, balance and repeat.
REDUCEDanske Commodities currently emits CO2 directly through company vehicles and indirectly through purchased electricity, business travel, employee commuting, food and waste. To reduce these emissions, the Company has identified several initiatives.
Employee commuting and business travelDanske Commodities encourages carpooling, travelling by train and opting for teleconferencing instead of busi-ness trips where possible. Today, around 75% of employ - ees choose public transportation, bike or walk to work. Employees have the opportunity of working remotely, generating further CO2 reductions and around 80% avail themselves of this flexibility.
Energy efficiencyAs part of the ‘Cut the Carbon’ programme, employees are encouraged to enable power save mode and switch off and unplug office equipment when not in use. Addi-tionally, Danske Commodities’ headquarters is managed through an intelligent energy system which adjusts the air conditioning, heating and lighting through automatic sensors.
Waste managementIn 2019, the Company has taken the first steps towards better waste separation by acquiring new waste sorting stations to increase recycling, which helps diminish emissions, air pollution and environmental degradation. In addition, the canteen contributes by reducing the Company’s meat and dairy consumption and manages food waste by repurposing leftovers.
BALANCEFor Danske Commodities, carbon neutrality is a concept of balance. To balance, the Company sources renewable electricity from local Danish wind turbines and offsets the remaining emissions with carbon credits certified by the Gold Standard, established by WWF to ensure that carbon reduction projects under the UN’s Clean Develop -ment Mechanism contribute to sustainable development. The Company’s emission accounting is based on the world’s most widely used emission accounting standard, the Greenhouse Gas Protocol (GHG).
REPEATCarbon neutrality is an iterative process, meaning each time Danske Commodities repeats the cycle, the Com-pany moves closer to achieving the goal of becoming a truly green business. Danske Commodities’ climate tar-gets are aligned with the Paris Agreement and with the 2030 climate goal of the Danish government to reduce emissions by 70%.
Science-based emissions targets■ For 2020, the target is to reduce the Company’s
emissions by 10%■ For 2030, the target is to reduce the Company’s
emissions by 70%
Going forward, Danske Commodities will look at new ways to reduce the Company’s emissions further and include more emission types in the scope of Danske Commodities’ GHG inventory. The Company will increase its focus on long-term energy efficiency projects within the organisation and look for smarter ways to track inter nal emissions. This is because Danske Commodities firmly believes that a sustainability programme led through ambitious long-term targets is the business model of the future.
Car
bon
redu
ctio
ns (C
O2)
Car
bon
offs
ets
(CO
2)
DANSKE COMMODITIES GOES CARBON NEUTRAL
Climate change cannot be ignored. It will require a transition to a lowcarbon economy and Danske Commodities wants to be part of the solution by pushing the world towards a more sustainable future. In 2019, the Company decided to cut the carbon and become carbon neutral. And it won't end there.
Carbon emission 2019 (tCO2)
70%OUR GOAL
CO2 reductionin 2030
213.85
181.22
121.01
42.30
10.06
Total: 568.44
Company Vehicles
Waste & Paper
Business Travel
Employee Commuting
Electricity & Heat

CORPORATE GOVERNANCE36
SENIOR MANAGEMENT GROUP
In 2019, the Senior Management Group was expanded from four to seven members by dividing responsibility for Power and Gas Trading and having Risk Management and Legal & Compliance represented in the executive management.
The Senior Management Group is responsible for the implementation and execution of strategic initiatives and the operative supervision of the organisation. The Senior Management Group manages the overall performance of Danske Commodities through setting and following up on the Company’s targets and monitoring performance. In cooperation with the Board of Directors, the Senior Management Group defines the strategic direction of the Company.
The individual members of the Senior Management Group have operative management responsibility for the differ-ent areas of the organisation and to ensure that Danske Commodities keeps delivering on strategic targets, that Danske Commodities lives up to its corporate values and that these values are embedded in the organisation.
Formal meetings of the Senior Management Group take place three times a month. At these meetings, signifi-cant projects and initiatives across the organisation are coordinated and prioritised. Apart from the formal meet - ings, the members of the Senior Management Group are in close, daily contact.
JAKOB SØRENSEN
CRO and VP, Head of Risk Management
Background Various positions with Danske Commodities, including as Head of Power Markets and Head of Market Analysis.
MARIE-LOUISE BREBØL CHRISTENSEN
VP, Head of People & Culture
Background Head of Compensation & Performance Management at Danske Commodities. Interim Head of People & Communication at Lind Capital. Associate lawyer at Bech-Bruun, Lett law firm and SJ Law. International legal roles in London and Zurich at Hospital Corporation of America and Novo Nordisk.
JESPER PAPE LARSEN
VP, Head of Legal & Compliance
Background Director, Head of Legal & Compliance at Danske Commodities. Senior Legal Advisor at Vestas. Lawyer at Dahl Law.
JESPER TRONBORG
VP, Head of Power Trading & Origination
BackgroundHead of Gas Trading at Danske Commodities. Head of Markets at Statoil Gazelle. Oil & Gas Trader at Energi Danmark. Various posi tions globally with Maersk Group.
LARS TROEN SØRENSEN
CFO and VP, Head of IT & Finance
Background Various management positions globally with Equinor, including Head of Investor Relations, Head of Finance & Control in Russia, Country Manager in Azerbaijan, CFO in Tanzania and Head of Government & Regulatory Affairs in the Uk. Treasurer at Maersk Uk. Sales Representative at IBM.
MICHAEL VINCENT
VP, Head of Gas Trading & Origination
Background Director, Head of Gas Trading at Danske Commodities. Short Term Gas Team Lead at Neas Energy (curr. Centrica Energy Trading). Various trader positions with Nordea and Lind Capital.
HELLE ØSTERGAARD KRISTIANSEN
CEO
BackgroundCFO and CRO at Danske Commodities, several years of experience in controlling and compliance in the financial sector. Currently a board member of Systematic A/S and DS Norden A/S.

CORPORATE GOVERNANCE CORPORATE GOVERNANCE38 39Danske Commodities Annual Report 2019
BOARD OF DIRECTORS
Combining key industry insights, expertise from global energy markets, risk management and financial skills with several years of international management experience.
TOR MARTIN ANFINNSEN
BackgroundBSc. in Business (hon). Senior Vice President, Marketing and Trading, Midstream and Processing, Equinor ASA. Almost 30 years of experience from the energy sector.
CHAIRMAN
HELGE HAUGANE
BackgroundMSc in Economics and Finance. Vice President, Finance & Control, Marketing, Midstream and Processing, Equinor ASA. Previously held the role as CFO for Equinor’s US business.
VICE CHAIRMAN
PETER LORENS RAVN
BackgroundMSc in Engineering and PhD in System Science. Diploma in Business Administration (Finance and Credit). Long-standing career at SimCorp (1983-2012), including 11 years as CEO.
BOARD MEMBER
HENRIK LIND
BackgroundDiploma in Business Administration. CEO of Lind Invest and founder of Danske Commodities. Various board memberships, including in Lind Capital, Lind Capital Fondsmæglerselskab and Frey P/S.
BOARD MEMBER
BOARD MEMBER
JENS-PETER SAUL
BackgroundBSc in Engineering (Energy and Process Technology). President & CEO, Rambøll Group, Denmark. Former President and CEO, Siemens Wind Power, Denmark. Board member in Cubico Sustainable Investments.
SIV HELEN RYGH TORSTENSEN
BackgroundMSc in Law. Group General Counsel and Senior Vice President, Legal, Equinor ASA. Prior legal experience from the private and public sector.
BOARD MEMBER
BOARD MEMBER
JENS ØKLAND
BackgroundMSc in Business. Senior Vice President, Business Development, New Energy Solutions, Equinor ASA. Experienced leader with extensive knowledge of the entire energy value chain.
BOARD MEMBER
MOLLY MORRIS
BackgroundBSc in Chemical Engineering. Vice President, Products and Liquids Trading, Equinor ASA. More than 15 years’ trading experience in the US and global markets across several commodities.
The Board of Directors’ objective is to pro - mote the long-term interests of Danske Commodities. As part of creating long-term, sustainable value, Danske Commod ities establishes and maintains strong, con struc- tive relationships with its primary stake- holders. These include shareholders, cus- tomers, counterparties, regulatory entities and other relevant external partners.
The Board of Directors is responsible for the overall strategic direction of Danske Commodities and oversees that the finan - cial and managerial control of the Group is conducted effectively in all respects. In this role, the Board acts as formal adviser to the Company’s Senior Management Group in relation to strategic initiatives and mon - itors the Group’s financial condition, risk management and business activities on an ongoing basis.
The members of the Board of Directors are appointed with a view to ensuring the Board’s independence of any special interests.
Formal meetings of the Board of Directors are held six times a year.

MANAGEMENT'S STATEMENT40 Danske Commodities
MANAGEMENT’S STATEMENT ON THE ANNUAL REPORT
The Board of Directors and the Executive Board have today considered and approved the Annual Report of Danske Commodities A/S for the financial year 1 January – 31 December 2019.
The Annual Report has been prepared in accordance with the Danish Financial Statements Act.
In our opinion, the Consolidated Financial Statements and the Parent Company Financial Statements give a true and fair view of the financial position at 31 December 2019 of the Group and the Parent Company and of the results of the Group and the Parent Company operations as well as the consolidated cash flows for 2019.
Aarhus, 10 March 2020
EXECUTIVE BOARD BOARD OF DIRECTORS
Jens Økland Board member
Siv Helen Rygh Torstensen Board member
Jens-Peter Saul Board member
Helge Haugane Vice chairman
Lars Troen SørensenCFO
Tor Martin AnfinnsenChairman
Helle Østergaard Kristiansen CEO
Henrik Lind Board member
Molly Morris Board member
In our opinion, the Management’s Review includes a true and fair view of the development of the Group’s and the Parent Company’s operations and financial circum-stances, of the Group’s and the Parent Company’s results for the year and of the financial position. Furthermore, the Man agement’s Review provides a description of the most signi ficant risks and elements of uncertainty facing the Group.
We recommend the Annual Report for adoption at the Annual General Meeting.
Peter Lorens Ravn Board member

INDEPENDENT AUDITOR’S REPORT INDEPENDENT AUDITOR’S REPORT42 43Danske Commodities Annual Report 2019
sufficient and appropriate to provide a basis for our opinion. The risk of not detecting a material misstate-ment resulting from fraud is higher than for one resulting from error, as fraud may involve collusion, forgery, intentional omissions, misrepresentations or the over ride of internal control.
■ Obtain an understanding of internal control relevant to the audit in order to design audit procedures that are appropriate in the circumstances, but not for the pur-pose of expressing an opinion on the effectiveness of the Group’s and the Parent Company’s internal control.
■ Evaluate the appropriateness of accounting policies used and the reasonableness of accounting estimates and related disclosures made by Management.
■ Conclude on the appropriateness of Management’s use of the going concern basis of accounting in pre-paring the financial statements and, based on the audit evidence obtained, whether a material uncer-tainty exists related to events or conditions that may cast significant doubt on the Group’s and the Parent Company’s ability to continue as a going concern. If we conclude that a material uncertainty exists, we are required to draw attention in our auditor’s report to the related disclosures in the financial statements or, if such disclosures are inadequate, to modify our opinion. Our conclusions are based on the audit evi-dence obtained up to the date of our auditor’s report. However, future events or conditions may cause the Group and the Parent Company to cease to continue as a going concern.
■ Evaluate the overall presentation, structure and con-tents of the financial statements, including the note disclosures, and whether the financial statements represent the underlying transactions and events in a manner that gives a true and fair view.
■ Obtain sufficient appropriate audit evidence regarding the financial information of the entities or business activities within the Group to express an opinion on the consolidated financial statements. We are respon-sible for the direction, supervision and performance of the group audit. We remain solely responsible for our audit opinion.
We communicate with those charged with governance regarding, among other matters, the planned scope and timing of the audit and significant audit findings, includ-ing any significant deficiencies in internal control that we identify during our audit.
STATEMENT ON THE MANAGEMENT’S REVIEW Management is responsible for the Management’s review.
Our opinion on the financial statements does not cover the Management’s review, and we do not express any form of assurance conclusion thereon.
In connection with our audit of the financial statements, our responsibility is to read the Management’s review and, in doing so, consider whether the Management’s review is materially inconsistent with the financial state-ments or our knowledge obtained during the audit, or otherwise appears to be materially misstated.
Moreover, it is our responsibility to consider whether the Management’s review provides the information required under the Danish Financial Statements Act.
Based on the work we have performed, we conclude that the Management’s review is in accordance with the financial statements and has been prepared in accor-dance with the requirements of the Danish Financial Statements Act. We did not identify any material mis-statement of the Management’s review.
INDEPENDENT AUDITOR’S REPORT
To the Shareholders of Danske Commodities A/S
OPINION We have audited the consolidated financial statements and the parent company financial statements of Danske Commodities A/S for the financial year 1 January – 31 December 2019, which comprise income statement, balance sheet, statement of changes in equity and notes, including accounting policies, for the Group and the Parent Company, and a consolidated cash flow statement. The consolidated financial statements and the parent company financial statements are prepared in accordance with the Danish Financial Statements Act.
In our opinion, the consolidated financial statements and the parent company financial statements give a true and fair view of the financial position of the Group and the Parent Company at 31 December 2019 and of the results of the Group’s and the Parent Company’s opera-tions as well as the consolidated cash flows for the financial year 1 January – 31 December 2019 in accor-dance with the Danish Financial Statements Act.
BASIS FOR OPINION We conducted our audit in accordance with International Standards on Auditing (ISAs) and additional requirements applicable in Denmark. Our responsibilities under those standards and requirements are further described in the “Auditor’s responsibilities for the audit of the consolidated financial statements and the parent company financial statements” (hereinafter collectively referred to as “the financial statements”) section of our report. We believe that the audit evidence we have obtained is sufficient and appropriate to provide a basis for our opinion.
INDEPENDENCEWe are independent of the Group in accordance with the International Ethics Standards Board for Accountants’ Code of Ethics for Professional Accountants (IESBA Code) and additional requirements applicable in Denmark, and we have fulfilled our other ethical responsibilities in accordance with these rules and requirements.
MANAGEMENT’S RESPONSIBILITIES FOR THE FINANCIAL STATEMENTS Management is responsible for the preparation of con-solidated financial statements and parent company finan - cial statements that give a true and fair view in accordance with the Danish Financial Statements Act and for such internal control as Management determines is necessary to enable the preparation of financial statements that are free from material misstatement, whether due to fraud or error.
In preparing the financial statements, Management is responsible for assessing the Group’s and the Parent Company’s ability to continue as a going concern, dis-closing, as applicable, matters related to going concern and using the going concern basis of accounting in pre-paring the financial statements unless Management either intends to liquidate the Group or the Parent Com-pany or to cease operations, or has no realistic al ter-native but to do so.
AUDITOR’S RESPONSIBILITIES FOR THE AUDIT OF THE FINANCIAL STATEMENTS Our objectives are to obtain reasonable assurance as to whether the financial statements as a whole are free from material misstatement, whether due to fraud or error, and to issue an auditor’s report that includes our opinion. Reasonable assurance is a high level of assu-rance, but is not a guarantee that an audit conducted in accordance with ISAs and additional requirements applicable in Denmark will always detect a material misstatement when it exists. Misstatements can arise from fraud or error and are considered material if, indi-vidually or in the aggregate, they could reasonably be expected to influence the economic decisions of users taken on the basis of the financial statements.
As part of an audit conducted in accordance with ISAs and additional requirements applicable in Denmark, we exercise professional judgement and maintain pro-fessional scepticism throughout the audit. We also:
■ Identify and assess the risks of material misstatement of the financial statements, whether due to fraud or error, design and perform audit procedures responsive to those risks and obtain audit evidence that is
Aarhus, 10 March 2020
Ernst & Young
Godkendt Revisionspartnerselskab
CVR no. 30 70 02 28
Michael Laursen State Authorised Public Accountant mne26804
Claus Hammer-Pedersen State Authorised Public Accountant mne21334

financial statements 45Annual Report 2019
income statement ............................................................................................ 47
Balance sheet ................................................................................................. 48
statement of changes in equity ...................................................................... 50
cash flow statement ....................................................................................... 51
notes ................................................................................................................. 52
1. Basis of Preparation and General Policies ........................................ 52
2. Revenue ................................................................................................ 53
3. costs ..................................................................................................... 53
4. financial income and expenses ......................................................... 54
5. tax on Profit/loss for the Year ........................................................... 55
6. intangible assets ................................................................................. 56
7. Property, Plant and equipment .......................................................... 57
8. investments in subsidiaries ................................................................ 58
9. investments in associated companies .............................................. 60
10. Other fixed asset investments ........................................................... 60
11. inventories ........................................................................................... 61
12. Receivables .......................................................................................... 61
13. Other Provisions ................................................................................. 61
14. current and Deferred tax ................................................................... 62
15. Prepayments ........................................................................................ 62
16. current asset investments ................................................................. 62
17. equity .................................................................................................... 63
18. long-term Debt ................................................................................... 63
19. short-term Debt .................................................................................. 63
20. Proposed Distribution of Profit ........................................................... 64
21. cash flow ............................................................................................. 64
22. Derivative financial instruments and fair Value measures ............. 65
23. security and Other financial Obligations .......................................... 67
24. Ownership and Related Parties .......................................................... 68
25. events after the Balance sheet Date .................................................. 68
26. Definitions of financial Ratios ............................................................ 68
FINANCIAL STATEMENTS

incOme statement 47Annual Report 2019
GROUP PARENT
eUR ’000 note 2019 2018 2019 2018
Revenue 2 10,046,074 9,376,686 10,056,209 9,383,466
cost of sales 3 -9,938,195 -9,253,214 -9,949,929 -9,265,754
Gross profit 107,879 123,472 106,280 117,712
Other external expenses 3 -12,088 -12,623 -12,161 -12,176
staff costs 3 -39,225 -35,374 -38,654 -34,291
amortisation, depreciation and impairment of intangible assets and property, plant and equipment 3 -6,342 -3,649 -6,252 -2,795
Profit before financial income and expenses and tax (EBIT) 50,224 71,826 49,213 68,450
share of profit in subsidiaries after tax 8 0 0 329 2,344
share of profit in associated companies after tax 9 -476 -19 -476 -19
financial income 4 2,107 2,980 2,649 3,160
financial expenses 4 -2,548 -3,194 -2,524 -3,060
Profit before tax (EBT) 49,307 71,593 49,191 70,875
tax on profit/loss for the year 5 -10,858 -15,626 -10,742 -14,908
Profit for the year 38,449 55,967 38,449 55,967
INCOME STATEMENT1 JANUARY – 31 DECEMBER

Balance sHeet Balance sHeet48 49Danske Commodities Annual Report 2019
BALANCE SHEET
ASSETS GROUP PARENT
eUR ’000 note 2019 2018 2019 2018
contractual rights 88,957 0 88,957 0
software 8,176 9,262 8,175 9,261
cO2 quotas 0 0 0 0
Intangible assets 6 97,133 9,262 97,132 9,261
land and buildings 0 724 0 0
Other fixtures and fittings, tools and equipment 1,150 3,699 1,142 633
leasehold improvements 62 61 0 0
Property, plant and equipment 7 1,212 4,484 1,142 633
investments in subsidiaries 8 0 0 4,188 9,534
investments in associated companies 9 1,737 1,302 1,737 1,302
Other receivables 10 324 310 324 296
Fixed asset investments 2,061 1,612 6,249 11,132
Fixed assets 100,406 15,358 104,523 21,026
Inventories 11 144,696 37,880 144,696 37,880
trade receivables 12 162,678 192,079 159,345 181,117
Receivables from group enterprises 12 7,785 20 17,910 9,423
Receivables from associated companies 12 0 9 0 9
Other receivables 12, 22 90,512 52,263 71,191 39,223
corporation tax 14 77 99 0 0
Deferred tax 14 0 39 0 0
Prepayments 15 4,524 5,979 4,459 5,853
Receivables 265,576 250,488 252,905 235,625
Current asset investments 16 30,286 19,560 30,286 19,560
Cash at bank and in hand 60,745 49,985 57,389 44,743
Current assets 501,303 357,913 485,276 337,808
Assets 601,709 373,271 589,799 358,834
LIABILITIES AND EQUITY GROUP PARENT
eUR ’000 note 2019 2018 2019 2018
share capital 179,065 498 179,065 498
Reserve for net revaluation under the equity method 0 0 1,349 7,030
Reserve for development costs 0 0 4,378 4,975
Retained earnings 113,601 75,737 107,874 63,732
Equity 17 292,666 76,235 292,666 76,235
Provision for deferred tax 14 680 669 680 669
Other provisions 13 598 0 598 0
Provisions 1,278 669 1,278 669
Other payables 1,084 0 1,084 0
Long-term debt 18 1,084 0 1,084 0
Debt to mortgage credit institutions 18 0 117 0 0
trade payables 19 211,776 258,300 199,441 246,347
Payables to group enterprises 19 63,965 131 64,742 616
corporation tax 14 2,688 195 2,654 19
Other payables 19 28,252 37,624 27,934 34,948
Short-term debt 306,681 296,367 294,771 281,930
Debt 307,765 296,367 295,855 281,930
Liabilities and equity 601,709 373,271 589,799 358,834
AT 31 DECEMBER

statement Of cHanGes in eQUitY casH flOW statement50 51Danske Commodities Annual Report 2019
GROUP
eUR ’000 share capital
Reserve under the equity
method
Reserve for development
costsRetained earnings Total
equity at 1 January 2019 498 - - 75,737 76,235
capital decrease -498 - - 21 -477
capital increase 179,065 - - 0 179,065
exchange rate adjustment relating to independent foreign entities 0 - - -216 -216
fair value adjustments of hedging instruments, beginning of year 0 - - -506 -506
fair value adjustments of hedging instruments, end of year 0 - - 116 116
Profit for the year 0 - - 38,449 38,449
Equity at 31 December 2019 179,065 - - 113,601 292,666
PARENT
eUR ’000 note share capital
Reserve under the equity
method
Reserve for development
costsRetained earnings Total
equity at 1 January 2019 498 7,030 4,975 63,732 76,235
capital decrease -498 0 0 21 -477
capital increase 179,065 0 0 0 179,065
exchange rate adjustment relating to independent foreign entities 0 -216 0 0 -216
fair value adjustments of hedging instruments, beginning of year 0 0 0 -506 -506
fair value adjustments of hedging instruments, end of year 0 0 0 116 116
transferred to retained earnings 0 -5,318 0 5,318 0
Development costs for the year 0 0 -597 597 0
Profit for the year 0 -147 0 38,596 38,449
Equity at 31 December 2019 20 179,065 1,349 4,378 107,874 292,666
GROUP
eUR ’000 note 2019 2018
Profit for the year 38,449 55,967
adjustments 21 17,577 19,250
change in working capital 21 -112,345 -5,271
Cash flow from operating activities before financial income and expenses -56,319 69,946
financial income 2,496 1,368
financial expenses -2,548 -3,194
Cash flow from ordinary activities -56,371 68,120
corporation tax paid -8,326 -17,630
Cash flow from operating activities 21 -64,697 50,490
Purchase of intangible assets -93,656 -1,303
Purchase of property, plant and equipment -1,025 -2,058
sale of property, plant and equipment 3,711 0
investment in associated companies -915 -1,321
Payment of fixed asset investments -102 -13
Repayment of fixed asset investments 88 4
Cash flow from investing activities 21 -91,899 -4,691
Repayment of debt to mortgage credit institutions -117 -473
capital decrease -477 0
capital increase 179,065 0
Dividend paid 0 -85,161
Cash flow from financing activities 21 178,471 -85,634
Change in cash and cash equivalents 21,875 -39,835
cash and cash equivalents at 1 January 69,545 107,768
Value and exchange rate adjustments of cash and cash equivalents -389 1,612
Cash and cash equivalents at 31 December 91,031 69,545
cash and cash equivalents are specified as follows:
current asset investments 30,286 19,560
cash at bank and in hand 60,745 49,985
Cash and cash equivalents at 31 December 21 91,031 69,545
STATEMENT OF CHANGES IN EQUITY
CASH FLOW STATEMENT

nOtes nOtes52 53Danske Commodities Annual Report 2019
accounting policies related to specific line items are described in the notes to which they relate. the description of accounting policies in the notes form part of the overall description of accounting policies. accounting policies not directly related to a specific line item covered by a note are presented below.
BASIS OF PREPARATION
the annual Report of Danske commodities a/s for 2019 has been prepared in accordance with the provisions of the Danish financial statements act applying to large enterprises of reporting class c.
the consolidated financial statements are presented in euro (eUR) and all values are rounded to the nearest thousand (eUR 000’s).
the accounting policies applied remain unchanged from the previous year.
RECOGNITION AND MEASUREMENT
the consolidated financial statements have been prepared under the historical cost method.
Revenues are recognised in the income statement as earned. Value adjustments of financial assets and liabilities measured at fair value or amortised cost are also recognised. in addition, all expenses incurred to generate the earnings for the year are recog nised in the income statement, including depreciation, amortisation, impair - ment losses and provisions as well as reversals due to changed account ing estimates of amounts that were previously recognised in the income statement.
assets are recognised in the balance sheet when it is probable that future economic benefits attributable to the asset will flow to the company, and the value of the asset can be measured reliably.
liabilities are recognised in the balance sheet when it is probable that future economic benefits will flow from the company, and the value of the liability can be measured reliably.
assets and liabilities are initially measured at cost. subsequently, assets and liabilities are measured as described for each item in the notes.
certain financial assets and liabilities are measured at amortised cost, which involves the recognition of a constant effective interest rate over the maturity period. amortised cost is calculated as orig i - nal cost less any repayments and with the addition/deduction of the cumulative amortisation of any difference between cost and the nominal amount. in this way, capital losses and gains are allocated over the maturity period.
Recognition and measurement take into account predictable losses and risks occurring before the presentation of the annual Report which confirm or invalidate affairs and conditions existing at the ba - l ance sheet date. eUR is used as the measurement currency. all other currencies are regarded as foreign currencies.
Basis of consolidationthe consolidated financial statements comprise the Parent company, Danske commodities a/s, and subsidiaries in which the Parent com - pany directly or indirectly holds more than 50% of the votes or otherwise exercises control. entities, where the Group holds between 20% and 50% of the voting rights and exercise significant influence, but not con - trol are considered associated companies.
1 BASIS OF PREPARATION AND GENERAL POLICIES 2 REVENUE
3 COSTS
GROUP PARENT
eUR ’000 2019 2018 2019 2018
Power trade 4,837,695 3,782,676 4,847,830 3,789,456
Gas and other minerals trade 5,208,379 5,594,010 5,208,379 5,594,010
10,046,074 9,376,686 10,056,209 9,383,466
STAFF COSTS GROUP PARENT
eUR ’000 2019 2018 2019 2018
Wages and salaries 36,171 33,263 35,657 32,298
Pensions 1,949 975 1,930 940
Other staff costs 1,105 1,136 1,067 1,053
39,225 35,374 38,654 34,291
including remuneration to:
executive Board 1,249 1,221 1,249 1,221
Board of Directors 99 215 99 215
1,348 1,436 1,348 1,436
Average number of employees 281 267 277 257
ACCOUNTING POLICIES
Revenue is measured at the fair value of the agreed consideration exclusive of VAT and taxes charged on behalf of third parties. All dis - counts and rebates granted are recognised in revenue.
Revenue from the sale of power, gas, certificates and related services is recognised in the in come statement when the sale is considered effected based on the following criteria:
■ delivery has been made before year end; and ■ a binding sales agreement has been made; and■ the selling price has been determined; and■ payment has been received or may with reasonable
certainty be expected to be received.
The Company’s pan-European trading and asset management activ ities are to a very large extent carried out from the Company’s head quarter in Aarhus, Denmark. In addition, the European com - modity markets are becoming more and more integrated. On this basis a geographical split of activities is not considered relevant.
Remuneration to five members of the Board of Directors is paid by the ultimate parent, equinor asa.
the consolidated financial statements are prepared as a consolidation of the Parent company's and the individual subsidiaries' financial statements, which are prepared according to the Group's accounting policies. On consolidation, intra-group income and expenses, share - holdings, intra-group balances and dividends as well as realised and unrealised gains on intra-group transactions are eliminated. Unrealised gains on transactions with associated companies are eli - m inated in proportion to the Group's interest in the entity. Unrealised losses are eliminated in the same way as unrealised gains unless they do not reflect impairment.
the subsidiaries' financial statements are fully consolidated in the consolidated financial statements.
investments in associated companies are recognised in the consoli - dated financial statements using the equity method.
Translation policiestransactions in foreign currencies are translated at the exchange rates at the dates of transaction. Gains and losses arising due to dif - ferences between rates at the transaction date and the rates at the dates of payment are recognised in financial income or financial expenses in the income statement.
Receivables, payables and other monetary items in foreign currencies that have not been settled at the balance sheet date are translated at the exchange rates at the balance sheet date. any differences be - tween the exchange rates at the balance sheet date and the transaction date rates are recognised in financial income and expenses in the income statement; however, see the section on hedge accounting in note 22.
foreign subsidiaries and associated companies are considered sepa rate entities. the income statements are translated at the average exchange rates for the month, and the balance sheet items are trans lated at the ex change rates at the balance sheet date. foreign ex change differences arising on translation of the opening equity of foreign entities at the exchange rates at the balance sheet date and on translation of the income statements from average exchange rates to the exchange rates at the balance sheet date are recognised directly in equity.
for value-added tax reporting purposes, amounts are translated from measurement currency eUR into DKK using rates from the european central Bank.

nOtes nOtes54 55Danske Commodities Annual Report 2019
auditors' remuneration comprises fees to auditors appointed by the company at the annual General meeting.
ACCOUNTING POLICIES
Cost of salesCost of sales includes the purchase of power, gas and certificates for resale and transportation thereof incurred to achieve revenue for the year. Furthermore, cost of sales includes changes in the fair values of derivative financial instruments.
Other external expenses Other external expenses comprise other operating expenses, including expenses for premises, marketing and office expenses, etc.
Staff costsStaff costs comprise wages and salaries, pensions as well as payroll expenses.
Amortisation, depreciation and impairment losses Amortisation, depreciation and impairment losses comprise amor ti - sation, depreciation and impairment of intangible assets and property, plant and equipment.
LeasesAll leases are considered operating leases. Payments made under operating leases are recognised in the income statement on a straight- line basis over the lease term.
The Company's total liabilities relating to operating leases and other leases are disclosed in note 23.
ACCOUNTING POLICIES
Financial income and expenses comprise interest, realised and un - realised exchange rate adjustments, value adjustment of securities as well as interest on underpaid and overpaid tax under the on-account taxation scheme.
ACCOUNTING POLICIES
Tax for the year consists of current tax for the year and deferred tax for the year. The tax attributable to the profit for the year is recognised in the income statement, whereas the tax attributable to equity trans - actions is recognised directly in equity.
Any changes in deferred tax due to changes in tax rates are recognised in the income statement.
The Parent Company is subject to the Danish rules on compulsory joint taxation of the Danish group enterprises. The tax effect of the joint taxation is allocated to enterprises showing profit or loss in proportion to their taxable incomes. The jointly taxed enterprises have adopted the on-account taxation scheme.
4 FINANCIAL INCOME AND EXPENSES
5 TAX ON PROFIT/LOSS FOR THE YEAR
FINANCIAL INCOME GROUP PARENT
eUR ’000 2019 2018 2019 2018
interest income, group enterprises 0 0 833 752
Other financial income 2,107 2,980 1,816 2,408
2,107 2,980 2,649 3,160
GROUP PARENT
eUR ’000 2019 2018 2019 2018
current tax for the year 10,885 14,291 10,755 13,477
Deferred tax for the year 32 1,505 32 1,620
adjustment of tax relating to prior years -38 1,967 -24 1,947
adjustment of deferred tax relating to prior years -21 -2,137 -21 -2,136
tax on entries in equity relating to deferred tax 33 143 33 143
Total tax for the year 10,891 15,769 10,775 15,051
– specified as follows:
tax on profit/loss for the year 10,858 15,626 10,742 14,908
tax on entries in equity 33 143 33 143
10,891 15,769 10,775 15,051
Effective tax rate 22.1% 22.1% 22.1% 22.0%
FINANCIAL EXPENSES GROUP PARENT
eUR ’000 2019 2018 2019 2018
interest expenses, group enterprises 0 0 0 4
Other financial expenses 2,548 3,194 2,524 3,056
2,548 3,194 2,524 3,060
3 COSTS – CONTINUED
AUDITORS' REMUNERATION GROUP PARENT
eUR ’000 2019 2018 2019 2018
fee to auditors 139 182 139 182
Total remuneration 139 182 139 182
– specified as follows:
statutory audit fee 139 139
Total remuneration 139 139

nOtes nOtes56 57Danske Commodities Annual Report 2019
6 INTANGIBLE ASSETS 7 PROPERTY, PLANT AND EQUIPMENT
GROUP
eUR ’000 CO2 Quotas Contractual rights Software
cost at 1 January 255 0 21,698
additions for the year 0 92,115 1,541
Disposals for the year -255 0 -343
Cost at 31 December 0 92,115 22,896
amortisation and impairment losses at 1 January 255 0 12,436
amortisation for the year 0 3,158 2,627
Reversal of amortisation of disposals for the year -255 0 -343
Amortisation and impairment losses at 31 December 0 3,158 14,720
Carrying amount at 31 December 2019 0 88,957 8,176
GROUP
eUR ’000 Land and buildings
Other fixtures and fittings, tools
and equipmentLeasehold
improvements
cost at 1 January 1,805 10,791 2,534
exchange rate adjustment 0 -5 -12
additions for the year 0 1,006 19
Disposals for the year -1,805 -6,292 -130
Cost at 31 December 0 5,500 2,411
Depreciation and impairment losses at 1 January 1,081 7,092 2,473
exchange rate adjustment 0 -5 -3
Depreciation for the year 19 549 9
Reversal of depreciation on disposals for the year -1,100 -3,286 -130
Depreciation and impairment losses at 31 December 0 4,350 2,349
Carrying amount at 31 December 2019 0 1,150 62
PARENT
eUR ’000
Other fixtures and fittings, tools
and equipmentLeasehold
improvements
cost at 1 January 4,455 2,447
additions for the year 996 0
Disposals for the year -36 -130
Cost at 31 December 5,415 2,317
Depreciation and impairment losses at 1 January 3,822 2,447
Depreciation for the year 487 0
Reversal of depreciation on disposals for the year -36 -130
Depreciation and impairment losses at 31 December 4,273 2,317
Carrying amount at 31 December 2019 1,142 0
PARENT
eUR ’000 Contractual rights Software
cost at 1 January 0 21,568
additions for the year 92,115 1,541
Disposals for the year 0 -214
Cost at 31 December 92,115 22,895
amortisation and impairment losses at 1 January 0 12,307
amortisation for the year 3,158 2,627
Reversal of amortisation of disposals for the year 0 -214
Amortisation and impairment losses at 31 December 3,158 14,720
Carrying amount at 31 December 2019 88,957 8,175
ACCOUNTING POLICIES
Intangible assets are measured at cost less accumulated amortisa- tion and less any accumulated impairment losses.
Cost comprises the cost of acquisition and expenses directly related to the acquisition up until the time when the asset is ready for use.
Software projects containing significant development aspects are identified as intangible assets when they are clearly defined, identifiable, provide a development opportunity for Danske Commodities and future use is intended. Costs related to projects that do not meet the criteria for recognition in the balance sheet is recognised as expenses in the income statement as incurred.
Amortisation based on cost reduced by any residual value is calculated on a straight-line basis over the expected useful lives of the assets, which are:
CO2 quotas: 5 yearsContractual rights: 3-18 yearsSoftware: 3-5 years
A reserve is recognised in equity for software projects that meet the criteria as development projects. The amount recognised corre sponds to the amount capitalised as intangible assets for these projects since 1 January 2016. The reserve is reduced concurrently with amortisation of the software projects and presented after tax.
The carrying amounts of intangible assets are reviewed on an annual basis to determine whether there is any indication of impairment other than that expressed by amortisation. If so, an impairment test is carried out to determine whether the recoverable amount is lower than the carrying amount, and the asset is written down to its lower recoverable amount. This impairment test is performed on an annual basis for development projects in progress irrespective of any indication of impairment.
The recoverable amount of the asset is calculated as the higher of net selling price and value in use. Where a recoverable amount cannot be determined for the individual asset, assets are assessed in the smallest group of assets for which a reliable recoverable amount can be determined based on an overall assessment.
ACCOUNTING POLICIES
Individual components of property, plant and equipment that have different useful lives are accounted for as separate items, which are depreciated separately.
Property, plant and equipment are measured at cost less accumulated depreciation and less any accumulated impairment losses.
Cost comprises the cost of acquisition and expenses directly related to the acquisition up until the time when the asset is ready for use.
Depreciation based on cost reduced by any residual value is calculated on a straight-line basis over the expected useful lives of the assets, which are:
Buildings 15 yearsOther fixtures and fittings, tools and equipment 3-15 yearsLeasehold improvements 3-5 years
In the case of changes in the depreciation period or the residual value, the effect on the depreciation charges is recognised prospectively as a change in accounting estimates.
Carrying amounts of property, plant and equipment are reviewed on an annual basis to determine whether there is any indication of im - pairment other than that expressed by depreciation. If so, an im pairment test is carried out to determine whether the recoverable amount is lower than the carrying amount, and the asset is written down to its lower recover able amount.
The recoverable amount of the asset is calculated as the higher of net selling price and value in use. Where a recoverable amount cannot be determined for the individual asset, assets are assessed in the smallest group of assets for which a reliable recoverable amount can be deter - mined based on an overall assessment.

nOtes nOtes58 59Danske Commodities Annual Report 2019
8 INVESTMENTS IN SUBSIDIARIES 8 INVESTMENTS IN SUBSIDIARIES — CONTINUED
INVESTMENTS IN SUBSIDIARIES ARE SPECIFIED AS FOLLOWS:
name Place of registered office share capitalVotes and
ownership
Danske commodities albania sh.p.k. albania tall 14,000 100.00%
Danske commodities australia Pty limited australia taUD 0 100.00%
Danske commodities BH d.o.o. Bosnia and Herzegovina teUR 513 100.00%
Danske commodities Deutschland GmbH Germany teUR 25 100.00%
Danske commodities italia s.r.l. italy teUR 10 100.00%
Danske commodities Kosovo sH.P.K Kosovo teUR 11 100.00%
Danske commodities DOOel skopje macedonia tmKD 55,822 100.00%
Danske commodities serbia d.o.o. serbia tRsD 54 100.00%
Danske commodities turkey enerji ticaret a.Ş. turkey ttRY 11,700 100.00%
Danske commodities Ukraine llc Ukraine tUaH 229 100.00%
Danske commodities UK limited United Kingdom tGBP 0 100.00%
PARENT
eUR ’000 2019 2018
cost at 1 January 2,485 2,490
Disposals for the year -130 -5
Cost at 31 December 2,355 2,485
Value adjustments at 1 January 7,049 7,247
exchange rate adjustment -227 -542
net profit/loss for the year 329 2,344
Dividend 0 -2,014
Disposals for the year -5,318 14
Value adjustments at 31 December 1,833 7,049
Carrying amount at 31 December 4,188 9,534
ACCOUNTING POLICIES
Share of profit in subsidiaries after taxThe separate line item 'Share of profit in subsidiaries after tax' in the income statement includes the proportionate share of the underlying entities’ profit after tax for the year.
Investments in subsidiariesThe Parent Company has chosen to consider the equity method as the measurement method, and investments in subsidiaries are measured accordingly.
On initial recognition, investments in subsidiaries are measured at cost, i.e. plus transaction costs, and included in the item 'Investments in subsidiaries' in the balance sheet.
The total net revaluation of investments in subsidiaries is transferred upon distribution of profit to 'Reserve under the equity method' in equity. The reserve is reduced by dividends distributed to the Parent Company and adjusted for other equity movements in the subsidiaries.
Subsidiaries with a negative net asset value are recognised at EUR 0 and any receivables from them are written down by the Parent Com - pany’s share of the negative net asset value. Any legal or constructive obligation of the Parent Company to cover the negative balance of the enterprise is recognised in provisions.
Investments in subsidiaries measured at net asset value are subject to impairment test requirements if there is any indication of impairment.
Under UK law, Danske commodities UK limited is exempt from preparing individual audited accounts by virtue of section 479a of the companies act 2006.
in order to obtain the exemption for Danske commodities UK limited, the Parent company has provided a guarantee for the outstanding liabilities which Danske commodities UK limited was subject to at 31 December 2019.
Under German law, Danske commodities Deutschland GmbH is exempt from preparing individual audited accounts by virtue of section 264 (3) of the German commercial code.
in order to obtain the exemption for Danske commodities Deutschland GmbH, the Parent company has provided a guarantee for the out - standing liabilities which Danske commodities Deutschland GmbH was subject to at 31 December 2019 and remains subject to until 31 December 2020.

nOtes nOtes60 61Danske Commodities Annual Report 2019
10 OTHER FIXED ASSET INVESTMENTS
11 INVENTORIES
12 RECEIVABLES
GROUP PARENT
eUR ’000Other
receivablesOther
receivables
cost at 1 January 310 296
additions for the year 102 101
Disposals for the year -88 -73
Cost at 31 December 324 324
Carrying amount at 31 December 2019 324 324
inventories comprise goods for resale. the gas inventory includes a revaluation of eUR 29,445 thousand reflecting the fact that the net re- alisable value is lower than the cost of acquisition at 31 Decem ber 2019. for certificates the carrying amount equals the cost of acquisition.
ACCOUNTING POLICIES
Inventories are measured at the lower of cost according to weighted average and net realisable value. The net realisable value of inven - tories is calculated at the amount expected to be generated by sales during normal operations less selling expenses. The net realisable value is determined allowing for marketability, obsoles cence and development in expected sales.
ACCOUNTING POLICIES
Receivables are measured at amortised cost.
Write-down for bad and doubtful debts is made when there is objec - tive evidence that a receivable or a portfolio of receivables has been impaired. Provisions for bad debts are determined on the basis of an individual assessment of each receivable. Receivables and debts with the same counterparty that are settled on a net basis are presented as such in the balance sheet.
OTHER RECEIVABLES GROUP PARENT
eUR ’000 2019 2018 2019 2018
fair value of derivative financial instruments, net 48,684 15,114 48,684 15,114
Deposits related to trading 32,880 25,661 22,093 23,597
Other receivables 8,948 11,488 414 512
90,512 52,263 71,191 39,223
9 INVESTMENTS IN ASSOCIATED COMPANIES
GROUP PARENT
eUR ’000 2019 2018 2019 2018
cost at 1 January 1,321 0 1,321 0
additions for the year 915 1,321 915 1,321
Cost at 31 December 2,236 1,321 2,236 1,321
Value adjustments at 1 January -19 0 -19 0
exchange rate adjustment -4 0 -4 0
net profit/loss for the year -476 -19 -476 -19
Value adjustments at 31 December -499 -19 -499 -19
Carrying amount at 31 December 1,737 1,302 1,737 1,302
INVESTMENTS IN ASSOCIATED COMPANIES ARE SPECIFIED AS FOLLOWS:
name Place of registered office share capitalVotes and
ownership
frey GP aps Denmark tDKK 50 50.00%
frey P/s Denmark tDKK 5,000 50.00%
ACCOUNTING POLICIES
Share of profit in associated companies after taxThe separate line item 'Share of profit in associated companies after tax' in the income statement includes the proportionate share of the underlying entities’ profit after tax for the year.
Investments in associated companiesThe Parent Company has chosen to consider the equity method as the measurement method, and investments in associated companies are measured accordingly. On initial recognition, investments in associated companies are mea sured at cost, i.e. plus transaction costs, and included in the item 'Investments in associated companies' in the balance sheet.
The total net revaluation of investments in associated companies is transferred upon distribution of profit to 'Reserve under the equity method' in equity. The reserve is reduced by dividends distributed to the Parent Company and adjusted for other equity movements in the associated companies. Associated companies with a negative net asset value are recognised at EUR 0 and any receivables from them are written down by the Parent Company’s share of the negative net asset value. Any legal or constructive obligation of the Parent Company to cover the negative balance of the enterprise is recognised in provisions.
Investments in associated companies measured at net asset value are subject to impairment test requirements if there is any indication of impairment.
GROUP PARENT
eUR ’000 2019 2018 2019 2018
Gas 113,949 37,880 113,949 37,880
certificates 30,747 0 30,747 0
144,696 37,880 144,696 37,880
Of the Group’s and the Parent’s total receivables, eUR 823 thousand matures more than one year after the balance sheet date.
13 OTHER PROVISIONS
Other provisions consist of provisions for legal disputes. ACCOUNTING POLICIES
Provisions are recognised when the Group has a legal or constructive obligation as a consequence of a past event, and it is probable that there will be an outflow of the Group's financial resources. Provisions are measured as the Management's best estimate of the costs required to settle the obligation.

nOtes nOtes62 63Danske Commodities Annual Report 2019
17 EQUITY
18 LONG-TERM DEBT
Share capitalthe share capital consists of 3,546,937 shares of a nominal value of DKK 377 per share. all shares rank equally.
at 31 December 2019, the company held no treasury shares.
ACCOUNTING POLICIES
Dividend distribution proposed by the Management for the year is disclosed as a separate line item in equity. Proposed dividend is recognised as a liability at the date when it is adopted at the annual general meeting (declaration date).
GROUP PARENT
eUR ’000 2019 2018 2019 2018
the debt falls due as follows:
Debt to mortgage credit institutions
Short-term 0 117 0 0
Other payables
1-5 years 1,084 0 1,084 0
Long-term 1,084 0 1,084 0
19 SHORT-TERM DEBT
ACCOUNTING POLICIES
Other liabilities are measured at net realisable value. Debts and receivables with the same counterparty that are settled on a net basis are presented as such in the balance sheet.
OTHER PAYABLES GROUP PARENT
eUR ’000 2019 2018 2019 2018
Deposits received 12,697 27,964 12,584 25,794
staff obligations 12,923 8,372 12,909 8,175
Vat, taxes and other public payables 129 180 0 0
Other payables 2,503 1,108 2,441 979
28,252 37,624 27,934 34,948
14 CURRENT AND DEFERRED TAX
15 PREPAYMENTS
16 CURRENT ASSET INVESTMENTS
DEFERRED TAX GROUP PARENT
eUR ’000 2019 2019
Deferred tax at 1 January 630 669
Deferred tax recognised in profit for the year 11 11
sale of subsidiary 39 0
Deferred tax at 31 December 680 680
– recognised in the balance sheet as follows:
Provision for deferred tax 680 680
680 680
Prepayments comprise prepaid capacities, fees, maintenance, software licenses, rent and insurance premiums.
current asset investments consist of listed bonds and shares.
ACCOUNTING POLICIES
Prepayments comprise prepaid expenses concerning subsequent financial years.
ACCOUNTING POLICIES
Current asset investments are measured at their fair values at the balance sheet date. Fair value is determined on the basis of the latest quoted market price.
Deferred tax and provision for deferred tax comprise all temporary differences between the carrying amount and the tax base of intangible assets, property, plant and equipment, receivables and short-term debt.
ACCOUNTING POLICIES
Current tax receivables and liabilitiesCurrent tax receivables and liabilities are recognised in the balance sheet at the amount calculated on the basis of the expected taxable income for the year adjusted for tax on taxable incomes for prior years and tax paid on account. Tax receivables and liabilities are offset if there is a legally enforceable right of set-off and an intention to settle on a net basis or simultaneously.
Joint taxation contributions payable and receivable are recognised in the balance sheet as corporation tax receivable or corporation tax payable.
Deferred tax assets and liabilities Deferred tax is recognised in respect of all temporary differences between the carrying amount and the tax base of assets and liabilities.
Deferred tax assets, including the tax base of tax loss carry-forwards, are measured at the value at which the asset is expected to be realised, either by elimination in tax on future earnings or by set-off against deferred tax liabilities.
Deferred tax assets and liabilities are offset within the same legal tax entity and jurisdiction.
Deferred tax is measured according to the tax rules and at the tax rates applicable in the respective countries at the balance sheet date when the deferred tax is expected to crystallise as current tax.

nOtes nOtes64 65Danske Commodities Annual Report 2019
20 PROPOSED DISTRIBUTION OF PROFIT
21 CASH FLOW
PARENT
eUR ’000 2019 2018
extraordinary dividend paid out during the year 0 75,000
Reserve for net revaluation under the equity method -147 2,325
Retained earnings 38,596 -21,358
38,449 55,967
CASH FLOW STATEMENT – ADJUSTMENTS GROUP
eUR ’000 2019 2018
financial income -2,107 -2,980
financial expenses 2,548 3,194
share of profit in associated companies after tax 476 19
amortisation, depreciation and impairment losses incl. losses and gains on sale 6,342 3,649
Hedging contracts -500 149
tax on profit/loss for the year 10,858 15,626
exchange rate adjustments -40 -407
17,577 19,250
CASH FLOW STATEMENT – CHANGE IN WORKING CAPITAL GROUP
eUR ’000 2019 2018
change in inventories -106,816 -27,662
change in receivables -15,149 -20,839
change in payables 9,620 43,230
-112,345 -5,271
ACCOUNTING POLICIES
Cash flow statement The cash flow statement shows the Group’s cash flows for the year broken down by operating, investing and financing activities, changes for the year in cash and cash equivalents as well as the Group’s cash and cash equivalents at the beginning and end of the year.
Cash flows from operating activitiesCash flows from operating activities are calculated as the net profit/loss for the year adjusted for changes in working capital and non-cash operating items such as depreciation, amortisation and impairment losses and provisions. Working capital comprises current assets less short-term debt excluding items included in cash and cash equivalents.
Cash flows from investing activities Cash flows from investing activities comprise cash flows from acquisitions and disposals of intangible assets, property, plant and equipment as well as fixed asset investments.
Cash flows from financing activities Cash flows from financing activities comprise cash flows from the raising and repayment of long-term debt as well as payments to and from shareholders.
Cash and cash equivalents Cash and cash equivalents comprise 'Cash at bank and in hand' and 'Current asset investments'. 'Current asset investments' consist of short-term securities that can readily be turned into cash.
The cash flow statement cannot be derived exclusively from the published financial statements.
22 DERIVATIVE FINANCIAL INSTRUMENTS AND FAIR VALUE MEASURES
financial risks at Danske commodities affecting financial instru - ments are primarily market risk and credit risk. for more information about risk management in general, see the Risk management section on pages 24-27.
Market riskDanske commodities’ market risk arises in both commodity and financial markets, in which changing energy prices and volumes as well as foreign exchange rate fluctuations are key risk factors.
the risk related to fluctuations in energy prices and volumes are monitored and hedged in accordance with the policies and mandates assigned by the Risk management function. Value-at-Risk and cash flow-at-Risk are Danske commodities' primary market risk measures covering the majority of the company's business activity. Positions are only allowed within given mandates. the hedged positions account for a significant part of the derivatives’ fair value. at 31 December 2019, the financial instruments consist of commodity and financial deri vatives from the trading portfolio, customer business and hedging thereof. forwards and futures are the primary instruments traded for gas and power with physical delivery, while financially settled instruments also include options and swaps. the traded gross vol - umes of these derivatives were 740 tWh for physical gas derivatives, 114 tWh for physical power derivatives, 119 tWh for financial deriva - tives and 21 tWh for power capacities. Danske commodities' business is focused on short-term trading, which is reflected in the maturity of the financial instruments, that primarily falls due within 12 months.
the other key risk factor, exchange rate fluctuations, is not deemed to be a part of the core business of Danske commodities. the risk is mitigated and hedged by the treasury function on a daily basis in accordance with the mandates, policies and hedging strategy ap - proved by the Board of Directors. the risk relates to a wide range of curren cies to which the daily commercial business is exposed. at the end of 2019, the fair value of foreign exchange forward contracts amounted to eUR 0.6 million. the foreign exchange forward contracts were entered into for the purpose of hedging future cash flows and fair value in a range of currencies, primarily GBP at 31 December 2019. the hedging activity related to these currencies can be specified as follows:
■ Hedging of future net cash outflows in GBP was GBP 13.0 million. the GBP forward contracts have a duration of one to two months.
financial instruments in Danske commodities at 31 December 2019 can be grouped according to the below table. comparative figures are not disclosed, as data for periods before 1 January 2019 are not available. Danske commodities continuously works on improving data as the business expands and develops.
financial instruments in Danske commodities mainly consist of com - modity derivatives that are traded as part of the company's ordinary business activity. financial risks relating to the financial instruments are managed on a portfolio basis and the instruments are measured at fair value and recognised as a net amount in 'Other recevables'. the credit risk is assessed separately and presented in a table in the section credit Risk below. the net amount in 'Other receivables' can be specified as follows:
GROUP PARENT
eUR ’000 2019 2018 2019 2018
fair value of derivative financial instruments, asset 1,210,318 676,549 1,210,318 676,549
fair value of derivative financial instruments, liability -1,161,634 -661,435 -1,161,634 -661,435
Fair value of derivative financial instruments, net 48,684 15,114 48,684 15,114
GROUP PARENT
eUR ’000
Fair value of derivative
financial instruments –
asset
Fair value of derivative
financial instruments –
liability
Fair value of derivative
financial instruments –
asset
Fair value of derivative
financial instruments –
liability
Gas, physical 570,962 -536,920 570,962 -536,920
Power, physical 392,199 -385,054 392,199 -385,054
financial 240,903 -237372-237,372 240,903 -237,372
Power capacities 3,877 -553 3,877 -553
foreign exchange forwards 2,377 -1,735 2,377 -1,735
Total at 31 December 2019 1,210,318 -1,161,634 1,210,318 -1,161,634
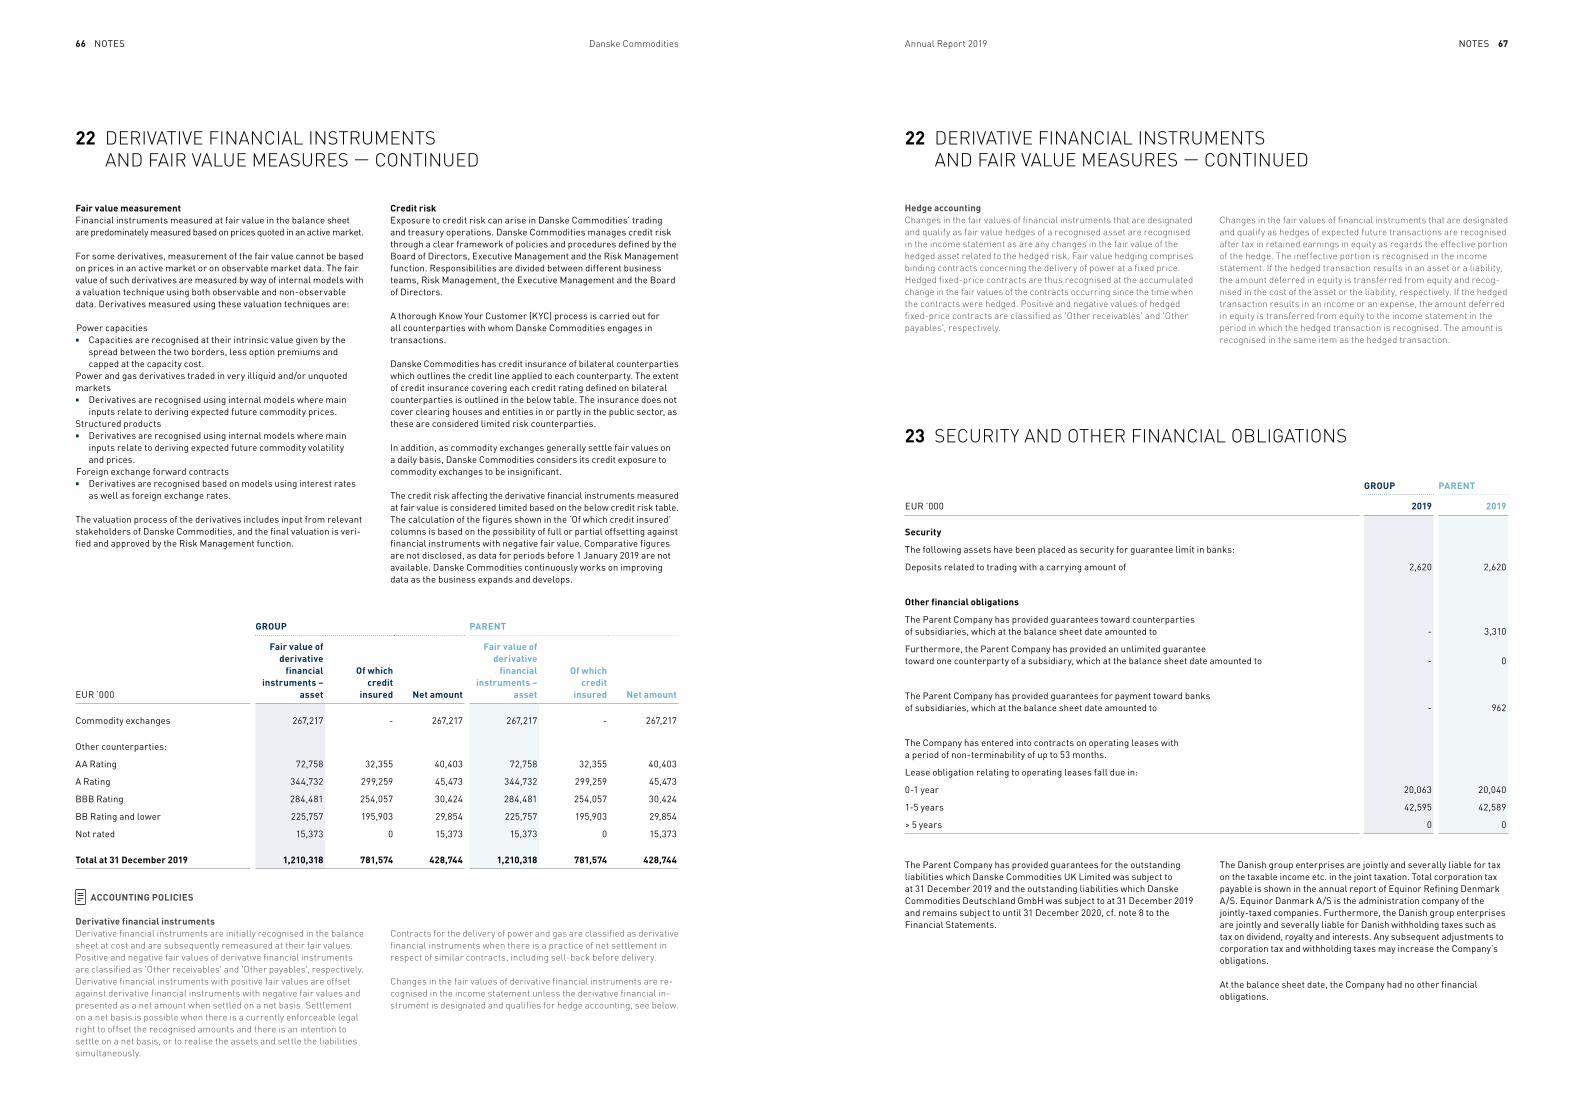
nOtes nOtes66 67Danske Commodities Annual Report 2019
Fair value measurementfinancial instruments measured at fair value in the balance sheet are predominately measured based on prices quoted in an active market.
for some derivatives, measurement of the fair value cannot be based on prices in an active market or on observable market data. the fair value of such derivatives are measured by way of internal models with a valuation technique using both observable and non-observable data. Derivatives measured using these valuation techniques are:
Power capacities■ capacities are recognised at their intrinsic value given by the
spread between the two borders, less option premiums and capped at the capacity cost.
Power and gas derivatives traded in very illiquid and/or unquoted markets ■ Derivatives are recognised using internal models where main
inputs relate to deriving expected future commodity prices.structured products ■ Derivatives are recognised using internal models where main
inputs relate to deriving expected future commodity volatility and prices.
foreign exchange forward contracts■ Derivatives are recognised based on models using interest rates
as well as foreign exchange rates.
the valuation process of the derivatives includes input from relevant stakeholders of Danske commodities, and the final valuation is veri - fied and approved by the Risk management function.
Credit riskexposure to credit risk can arise in Danske commodities’ trading and treasury operations. Danske commodities manages credit risk through a clear framework of policies and procedures defined by the Board of Directors, executive management and the Risk management function. Responsibilities are divided between different business teams, Risk management, the executive management and the Board of Directors.
a thorough Know Your customer (KYc) process is carried out for all counterparties with whom Danske commodities engages in transactions.
Danske commodities has credit insurance of bilateral counterparties which outlines the credit line applied to each counterparty. the extent of credit insurance covering each credit rating defined on bilateral counterparties is outlined in the below table. the insurance does not cover clearing houses and entities in or partly in the public sector, as these are considered limited risk counterparties.
in addition, as commodity exchanges generally settle fair values on a daily basis, Danske commodities considers its credit exposure to commodity exchanges to be insignificant.
the credit risk affecting the derivative financial instruments measured at fair value is considered limited based on the below credit risk table. the calculation of the figures shown in the ‘Of which credit insured’ columns is based on the possibility of full or partial offsetting against financial instruments with negative fair value. comparative figures are not disclosed, as data for periods before 1 January 2019 are not available. Danske commodities continuously works on improving data as the business expands and develops.
ACCOUNTING POLICIES
Derivative financial instrumentsDerivative financial instruments are initially recognised in the balance sheet at cost and are subsequently remeasured at their fair values. Po sitive and negative fair values of derivative financial instruments are classified as 'Other receivables' and 'Other payables', respectively. Derivative financial instruments with positive fair values are offset against derivative financial instruments with negative fair values and presented as a net amount when settled on a net basis. Settlement on a net basis is possible when there is a currently enforceable legal right to offset the recognised amounts and there is an intention to settle on a net basis, or to realise the assets and settle the liabilities simultaneously.
Contracts for the delivery of power and gas are classified as derivative financial instruments when there is a practice of net settlement in respect of similar contracts, including sell-back before delivery.
Changes in the fair values of derivative financial instruments are re - cognised in the income statement unless the derivative financial in - strument is designated and qualifies for hedge accounting, see below.
22 DERIVATIVE FINANCIAL INSTRUMENTS AND FAIR VALUE MEASURES — CONTINUED
GROUP PARENT
eUR ’000
Fair value of derivative
financial instruments –
asset
Of which credit
insured Net amount
Fair value of derivative
financial instruments –
asset
Of which credit
insured Net amount
commodity exchanges 267,217 - 267,217 267,217 - 267,217
Other counterparties:
aa Rating 72,758 32,355 40,403 72,758 32,355 40,403
a Rating 344,732 299,259 45,473 344,732 299,259 45,473
BBB Rating 284,481 254,057 30,424 284,481 254,057 30,424
BB Rating and lower 225,757 195,903 29,854 225,757 195,903 29,854
not rated 15,373 0 15,373 15,373 0 15,373
Total at 31 December 2019 1,210,318 781,574 428,744 1,210,318 781,574 428,744 the Parent company has provided guarantees for the outstanding liabilities which Danske commodities UK limited was subject to at 31 December 2019 and the outstanding liabilities which Danske commodities Deutschland GmbH was subject to at 31 December 2019 and remains subject to until 31 December 2020, cf. note 8 to the financial statements.
23 SECURITY AND OTHER FINANCIAL OBLIGATIONS
GROUP PARENT
eUR ’000 2019 2019
Security
the following assets have been placed as security for guarantee limit in banks:
Deposits related to trading with a carrying amount of 2,620 2,620
Other financial obligations
the Parent company has provided guarantees toward counterparties of subsidiaries, which at the balance sheet date amounted to - 3,310
furthermore, the Parent company has provided an unlimited guarantee toward one counterparty of a subsidiary, which at the balance sheet date amounted to - 0
the Parent company has provided guarantees for payment toward banks of subsidiaries, which at the balance sheet date amounted to - 962
the company has entered into contracts on operating leases with a period of non-terminability of up to 53 months.
lease obligation relating to operating leases fall due in:
0-1 year 20,063 20,040
1-5 years 42,595 42,589
> 5 years 0 0
the Danish group enterprises are jointly and severally liable for tax on the taxable income etc. in the joint taxation. total corporation tax payable is shown in the annual report of equinor Refining Denmark a/s. equinor Danmark a/s is the administration company of the jointly-taxed companies. furthermore, the Danish group enterprises are jointly and severally liable for Danish withholding taxes such as tax on dividend, royalty and interests. any subsequent adjustments to corporation tax and withholding taxes may increase the company’s obligations.
at the balance sheet date, the company had no other financial obligations.
Hedge accountingChanges in the fair values of financial instruments that are designated and qualify as fair value hedges of a recognised asset are recognised in the income statement as are any changes in the fair value of the hedged asset related to the hedged risk. Fair value hedging comprises binding contracts concerning the delivery of power at a fixed price. Hedged fixed-price contracts are thus recognised at the accumulated change in the fair values of the contracts occurring since the time when the contracts were hedged. Positive and negative values of hedged fixed-price contracts are classified as 'Other receivables' and 'Other payables', respectively.
Changes in the fair values of financial instruments that are designated and qualify as hedges of expected future transactions are recognised after tax in retained earnings in equity as regards the effective portion of the hedge. The ineffective portion is recognised in the income statement. If the hedged transaction results in an asset or a liability, the amount deferred in equity is transferred from equity and recog - nised in the cost of the asset or the liability, respectively. If the hedged transaction results in an income or an expense, the amount deferred in equity is transferred from equity to the income statement in the period in which the hedged transaction is recognised. The amount is recognised in the same item as the hedged transaction.
22 DERIVATIVE FINANCIAL INSTRUMENTS AND FAIR VALUE MEASURES — CONTINUED

nOtes68 Danske Commodities
24 OWNERSHIP AND RELATED PARTIES
25 EVENTS AFTER THE BALANCE SHEET DATE
26 DEFINITIONS OF FINANCIAL RATIOS
Controlequinor Refining norway as (Parent company)
the company is included in the consolidated financial statements of its ultimate Parent company, equinor asa.
the consolidated financial statements of equinor asa can be obtained at the following address:equinor asa, forusbeen 50, 4035 stavanger, norway
Other related partiesOther related parties comprise the management of equinor Refining norway as and equinor asa as well as the Board of Directors, exe - c utive Board and senior management Group of the company, together with their immediate families. furthermore, related parties include
no events have occured since the balance sheet date which could materially affect the company's financial position.
companies in which equinor asa and the aforementioned individuals have significant influence or control.
in January 2019, other related parties also comprised the manage - ment of lind invest aps and companies in which lind invest aps had significant influence or control.
in accordance with section 98c, seventh paragraph of the Danish financial statements act, the company only reports on transactions with related parties not completed on an arm’s length basis.
Ownershipequinor Refining norway as, 5954 mongstad, 1263 lindås, norway is registered in the company’s register of shareholders as holding 100% of the votes and shares.
Gross margin =Gross profit x 100
Revenue
eBit margin =eBit x 100
Revenue
scalability =eBit x 100
Gross profit
Return on assets =eBit x 100
total assets
Return on capital employed =eBit x 100
average total assets less non-interest bearing debt
equity ratio =equity at year end x 100
total assets
Return on equity =net profit for the year x 100
average equity
average number of employees: calculated as average number of full-time employees
number of employees, end of year: calculated as number of employees at end of year

maRKet access70 Danske Commodities
MARKET ACCESS
YEAR COUNTRIES POWER GRIDS* COUNTRIES GAS HUBS*
2004 DenmarkGermany
eneRGinet (DK1, DK2)50HeRtZ, amPRiOn, tRansnet-BW, tennet-De
_ _
2006 franceitalyspainluxembourgnetherlands
RteteRna (it1, it2, it3, it4, it5, it6)ReecReOstennet-nl
_ _
2007 austriaswitzerlandczech Republic
aPGsWissGRiDcePs
_ _
2008 BelgiumGreeceslovenia
eliaiPtO (aDmie)eles
_ _
2009 United Kingdomswedenfinlandnorway
natiOnal GRiDsVensKe KRaftnÄt (se1, se2, se3, se4)finGRiDstatnett (nO1, nO2, nO3, nO4, nO5)
DenmarkGermany
GtfGsPl, ncG, GsPl-l, ncG-l
2010 Hungary maViR czech Republic cZ VtP
2011 RomaniaserbiaBulgariaslovakiamacedoniaPortugalcroatiamontenegroPoland
tRanselectRicaemsesOsePsmePsORenHOPscGesPse
slovakiaaustriafrancenetherlands
PeG-n, tRsttf
2012 Ukraineturkeyalbaniaireland
UKReneRGOteiasOsteiRGRiD
italyPolandBelgium
PsVPl VtPZtP, Zee, ZtP-l
2013 KosovoBosnia and Herzegovina
KOsttnOs BiH
HungaryUnited Kingdomswitzerland
mGPnBPsWissGas
2015 lithuaniaestonialatvia
litGRiDeleRinGaUGstsPRieGUma H
slovenia PlinOVODi
2016 spain luxembourg
PVBcReOs
2017 Georgia GeORGian tRansmissiOn ireland Ukraine
iBPUKRtRansGaZ
2018 australia aemO BulgariaGreecenorway (north sea)Portugal
BulgartransgazDesfaGasscoRen Gasodutos
2019 United states of america**
PJm, misO turkey BOtaŞ
* D
ansk
e c
omm
odit
ies’
mar
ket a
cces
s as
of 2
019.
** D
ansk
e c
omm
odit
ies’
acc
ess
to th
e a
mer
ican
pow
er m
arke
t is
thro
ugh
the
equ
inor
-ow
ned
com
pany
Dan
ske
com
mod
itie
s U
s l
lc.
sUBsiDiaRies
Danske commodities albania sh.p.k.st. ibrahim Rugova, sky tower, floor 9/1, tiranaalbania
Danske commodities australia Pty limitedlevel 20, 1 market street, sydney nsW 2000australia
Danske commodities BH d.o.o.avaz twist tower, tešanjska broj 24a,71000 sarajevoBosnia and Herzegovina
Danske commodities Deutschland GmbHGroβe elbstraβe 42, 22767 HamburgGermany
Danske commodities Kosovo sH.P.K.mujo Ulqinaku, no. 5, ap. 10, Pejton 10000, PristineKosovo
Danske commodities DOOel skopje16, 8 septemvri Blvd, Hyperium Business center,2nd floor, 1000 skopjemacedonia
Danske commodities serbia d.o.o.Dragiše Brašovana 10, 11070 Belgradeserbia
Danske commodities turkey enerji ticaret a.Ş.esentepe mah. ali Kaya sok. Polat Plaza B Blok n.2 K.3 B.75, 34394 Şiṣli, istanbulturkey
Danske commodities Ukraine llcRognidyns’ka street 3, office 10, Kyiv 01004Ukraine
Danske commodities UK limited2nd floor, Waverley House, 7-12 noel streetlondon W1f 8GQUnited Kingdom
BRancHes
Danske commodities a/s, organizační složkaminoritská 10, 602 00 Brnoczech Republic
Danske commodities a/s aarhussucursala BucurestiBucharest, 1st District, 47 aviatorilor Boulevard,1st floor, Office no. 4Romania
Danske commodities UK2nd floor, Waverley House, 7-12 noel streetlondon W1f 8GQUnited Kingdom
KeY RelateD cOmPanY
Danske commodities Us llc251 little falls Drive, WilmingtonDe 19808, county of new castleDelawareUnited states
PaRent cOmPanY
Danske commodities a/sVaerkmestergade 38000 aarhus cDenmark
Phone +45 8833 8181fax +45 8612 2430
www.danskecommodities.comVat no. DK28113951

Danske Commodities challenges market inefficiencies with international trade, moving energy from where there is more than needed to where it is needed most.
As an agile energy trading house, we compete with established players to bring freedom of choice and fair energy prices to producers, suppliers and consumers.
We trade across borders, ensuring that energy markets stay competitive, efficient and balanced. Every minute of the day. Every day of the year.
We challenge. We compete. And then we repeat.