
Energy Sub-Metering for Measurement and Verification
80
ENERGY SUB-METERING FOR MEASUREMENT AND VERIFICATION
-
Upload
norman-henson -
Category
Documents
-
view
49 -
download
1
description
Energy Sub-Metering for Measurement and Verification. Objectives. What is measurement and verification? Why implement a measurement and verification program? How do you integrate M&V into the Design Process?. What is Measurement and Verification?. UI M&V Program Based on IPMVP. - PowerPoint PPT Presentation
Transcript of Energy Sub-Metering for Measurement and Verification
ENERGY SUB-METERING FOR MEASUREMENT AND VERIFICATION
1. What is measurement and verification?
2. Why implement a measurement and verification program?
3. How do you integrate M&V into the Design Process?
Objectives
What is Measurement and Verification?
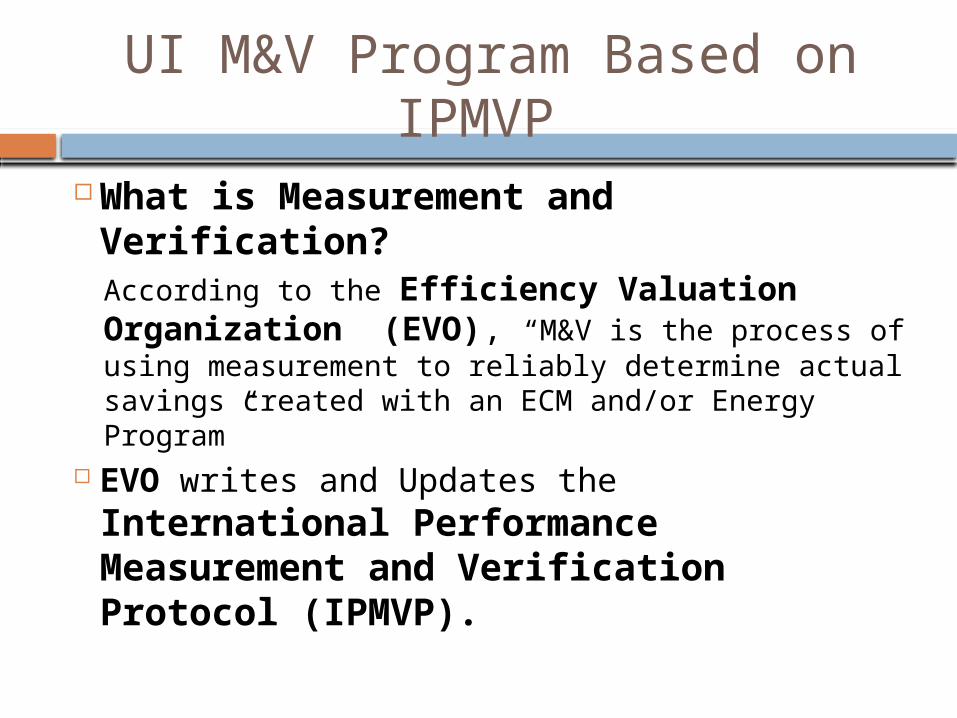
UI M&V Program Based on IPMVP
What is Measurement and Verification?According to the Efficiency Valuation Organization (EVO), “M&V is the process of using measurement to reliably determine actual savings created with an ECM and/or Energy Program”
EVO writes and Updates the International Performance Measurement and Verification Protocol (IPMVP).
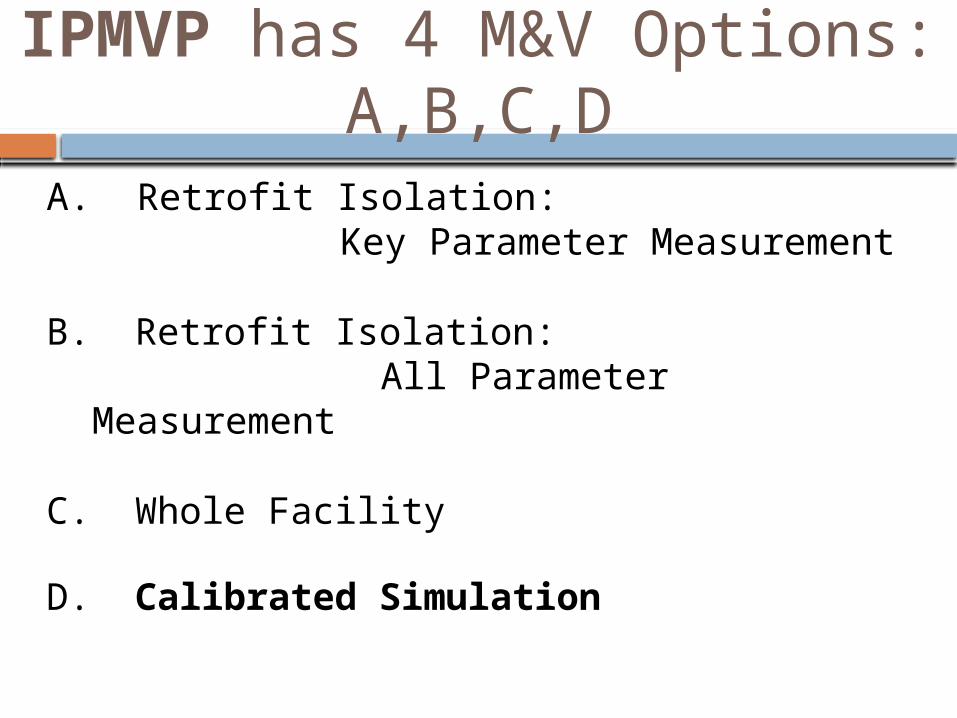
IPMVP has 4 M&V Options: A,B,C,D
A. Retrofit Isolation: Key Parameter Measurement
B. Retrofit Isolation: All Parameter Measurement
C. Whole Facility
D. Calibrated Simulation
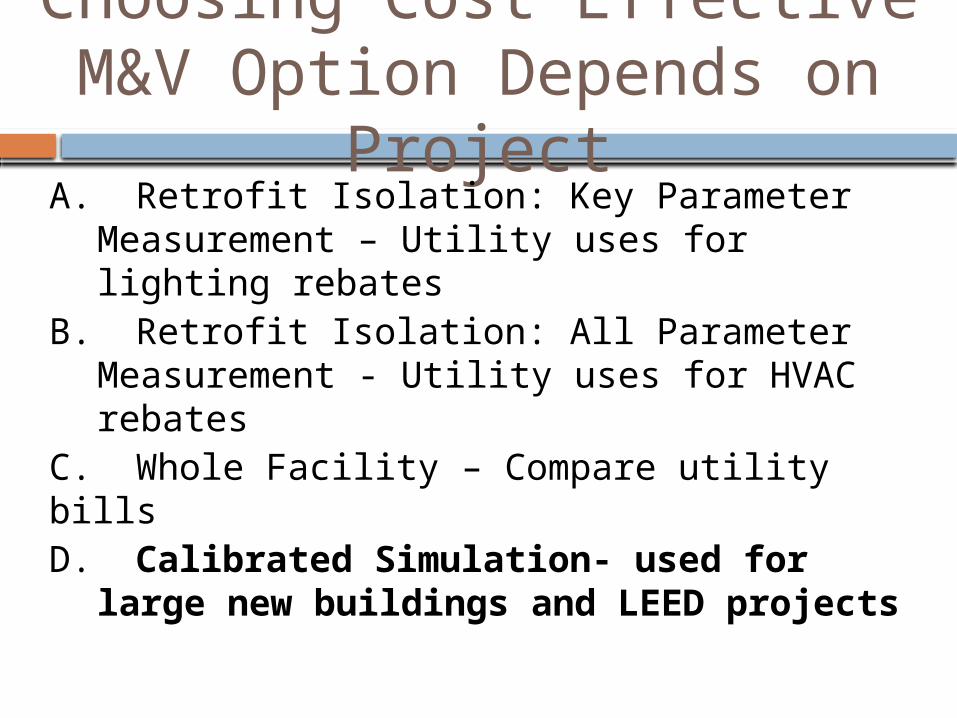
Choosing Cost Effective M&V Option Depends on ProjectA. Retrofit Isolation: Key Parameter
Measurement – Utility uses for lighting rebates
B. Retrofit Isolation: All Parameter Measurement - Utility uses for HVAC rebates
C. Whole Facility – Compare utility billsD. Calibrated Simulation- used for
large new buildings and LEED projects
YOU CAN’T CONTROL WHAT YOU DON’T
MEASURE
Why do Measurement and Verification?
UI M&V Program and Objectives
The purpose of M&V is to document the savings from our Energy Program and/or from specific ECMs.
M&V Plan must balance cost of M&V with project energy savings and required energy information
UI M&V Program and Objectives
M&V is cornerstone for Continuous Cx and maintaining Re-Cx savingsActual Energy Usage is compared to Predicted Energy Usage
Issues causing higher energy use are identified and resolved
Repeat Quarterly
UI M&V Program and Objectives
LEED EA 5 M&V - 3 Credits for LEED M&V and Metering Plan developed in DDs and refined during construction document phase
After Building Occupied: Compare actual energy usage to modeled energy usage monthly & quarterly
Model is calibrated and building baseline developed
Issues causing higher energy use are identified and resolved early instead of going on for years
DESIGN PHASE REQUIREMENTS
How is Measurement and Verification Implemented?
M&V PLAN Design Dev Phase
Identify what IPMVP Option to be used: New Buildings- Calibrated Simulation
Identify what needs to be measured: Buckets of Energy Lighting HVAC
Pumps Fans Cooling Heating
Water Develop a plan to determine how it will be measured:
Gather Base line data Decide on meters, trending, calculations, length of time etc. Screens on the BAS that show the buckets of energy
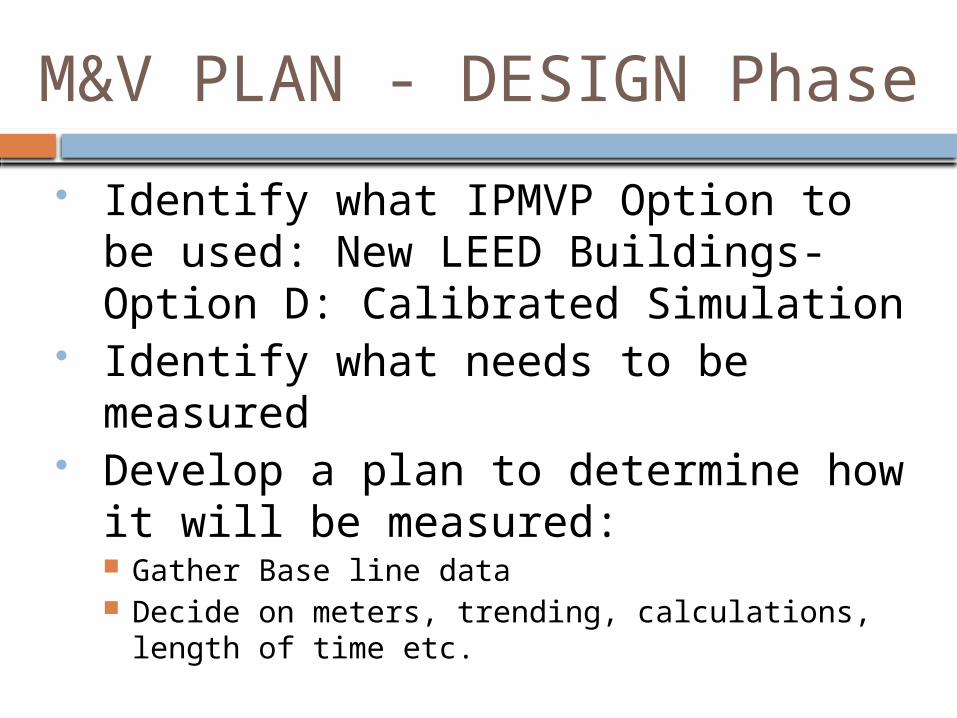
M&V PLAN - DESIGN Phase
Identify what IPMVP Option to be used: New LEED Buildings- Option D: Calibrated Simulation
Identify what needs to be measured
Develop a plan to determine how it will be measured: Gather Base line data Decide on meters, trending, calculations,
length of time etc.
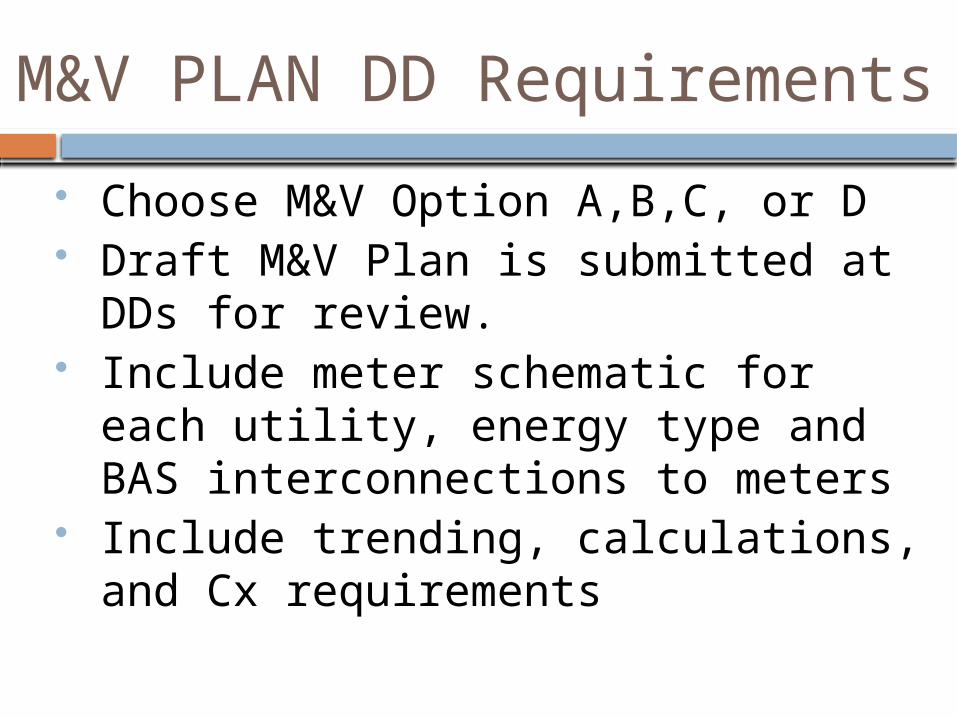
M&V PLAN DD Requirements
Choose M&V Option A,B,C, or D Draft M&V Plan is submitted at
DDs for review. Include meter schematic for each
utility, energy type and BAS interconnections to meters
Include trending, calculations, and Cx requirements
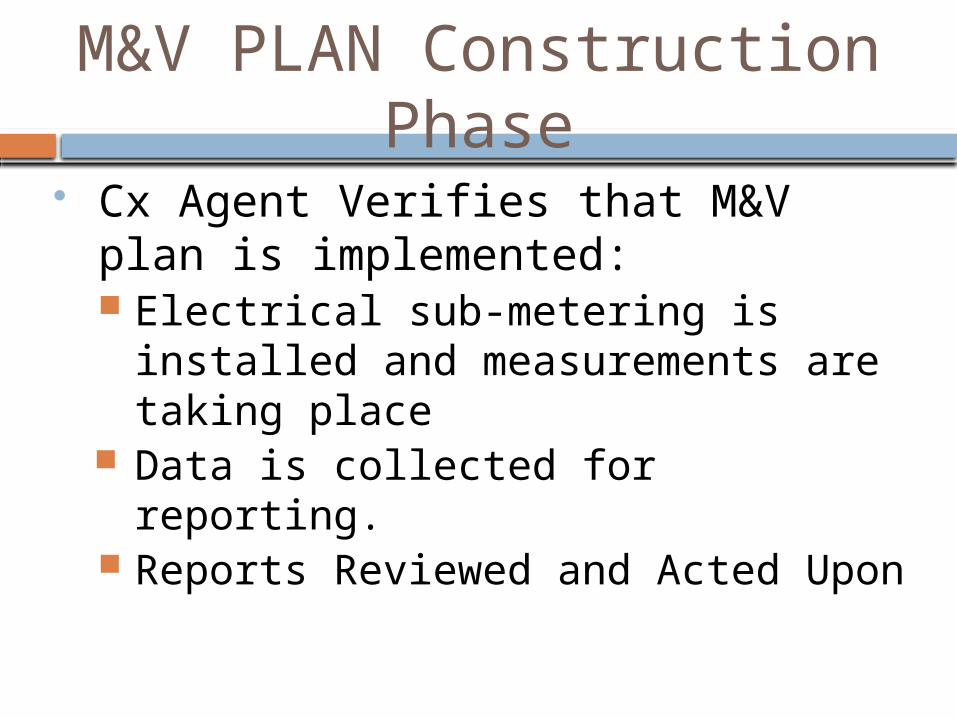
M&V PLAN Construction Phase
Cx Agent Verifies that M&V plan is implemented: Electrical sub-metering is
installed and measurements are taking place
Data is collected for reporting. Reports Reviewed and Acted
Upon
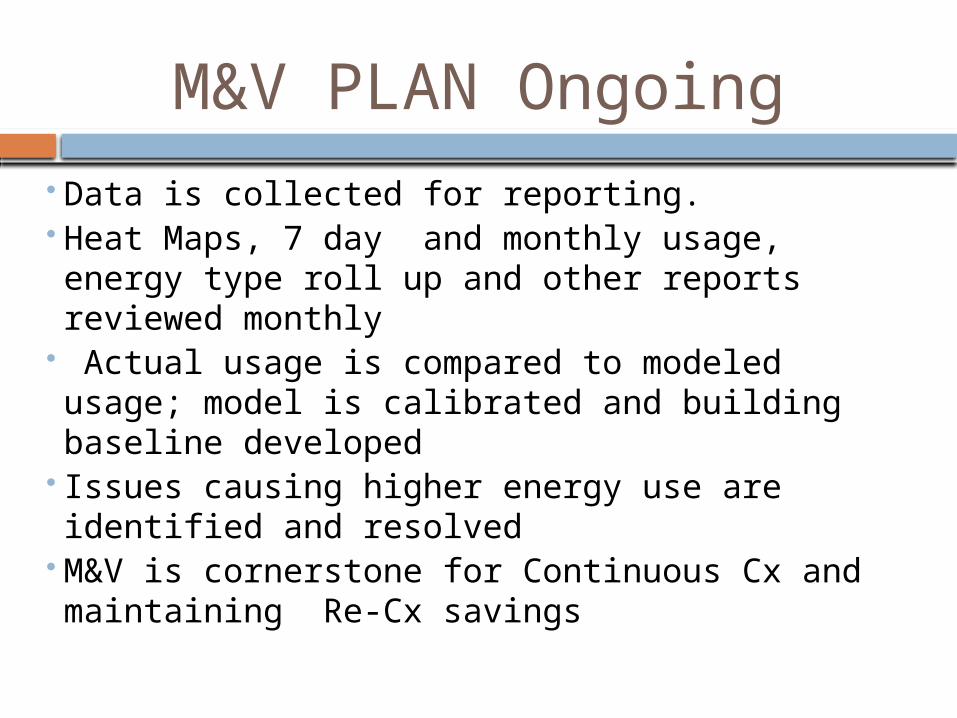
M&V PLAN Ongoing Data is collected for reporting. Heat Maps, 7 day and monthly usage, energy
type roll up and other reports reviewed monthly
Actual usage is compared to modeled usage; model is calibrated and building baseline developed
Issues causing higher energy use are identified and resolved
M&V is cornerstone for Continuous Cx and maintaining Re-Cx savings

University of Iowa New School of Music Facility
Design Case Study
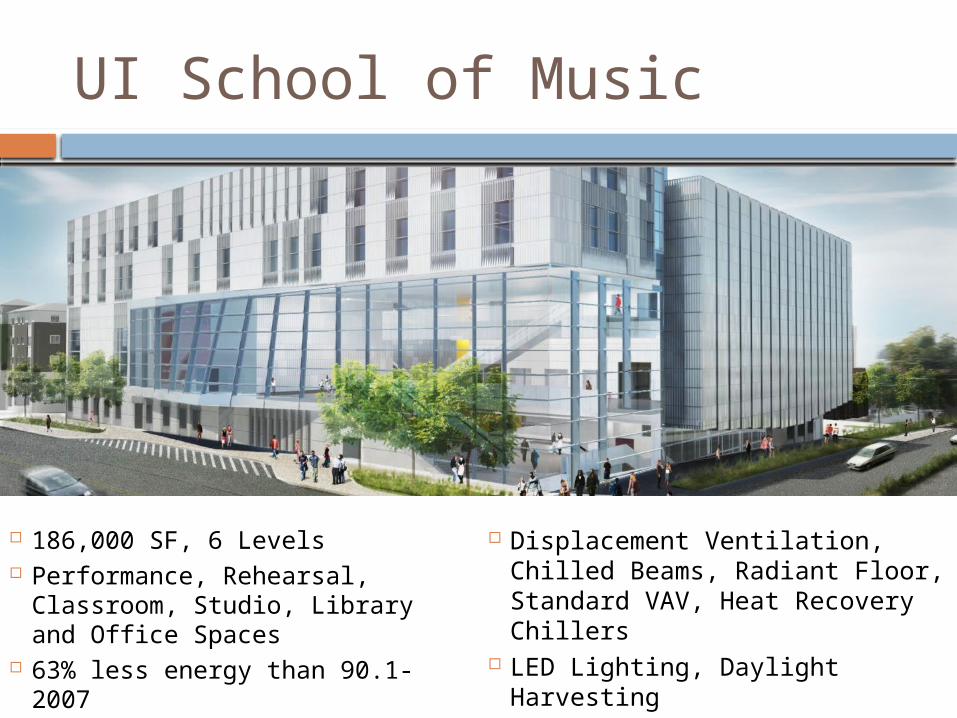
UI School of Music
186,000 SF, 6 Levels Performance, Rehearsal,
Classroom, Studio, Library and Office Spaces
63% less energy than 90.1-2007
Displacement Ventilation, Chilled Beams, Radiant Floor, Standard VAV, Heat Recovery Chillers
LED Lighting, Daylight Harvesting
Sub-metering System Design Process
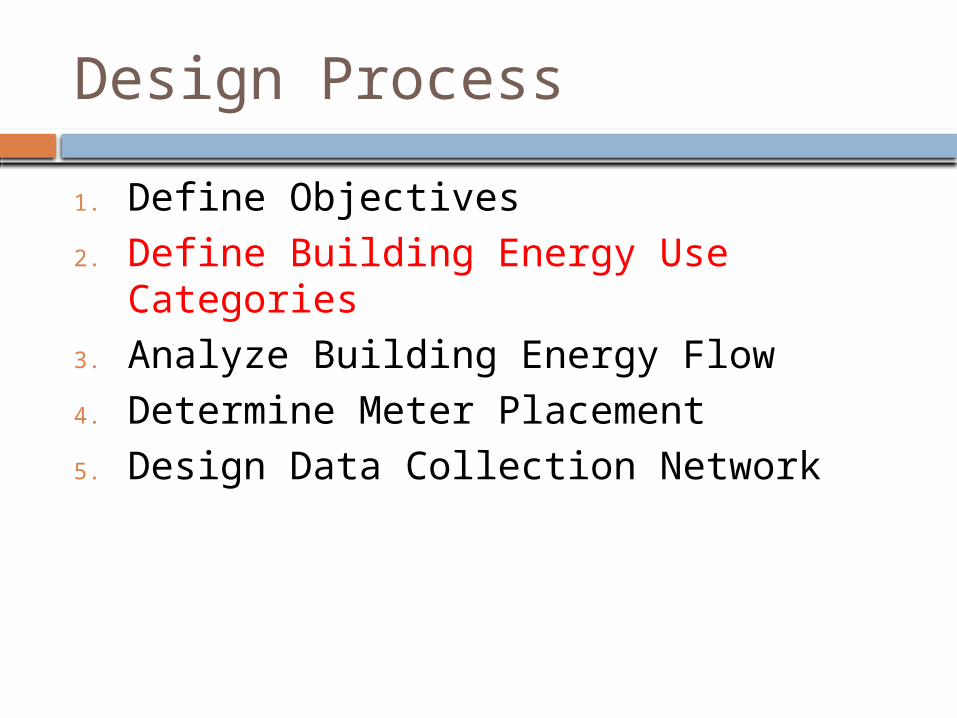
1. Define Objectives2. Define Building Energy Use Categories3. Analyze Building Energy Flow4. Determine Meter Placement5. Design Data Collection Network
Sub-metering System Design Process
1. Define Objectives2. Define Building Energy Use Categories3. Analyze Building Energy Flow4. Determine Meter Placement5. Design Data Collection Network
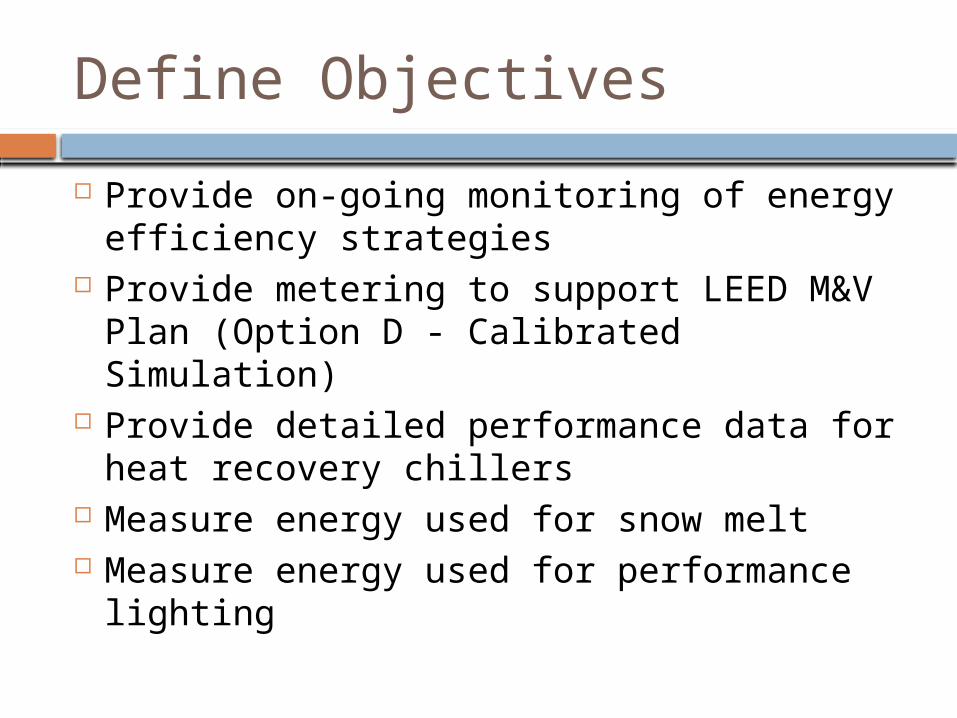
Define Objectives
Provide on-going monitoring of energy efficiency strategies
Provide metering to support LEED M&V Plan (Option D - Calibrated Simulation)
Provide detailed performance data for heat recovery chillers
Measure energy used for snow melt Measure energy used for performance
lighting
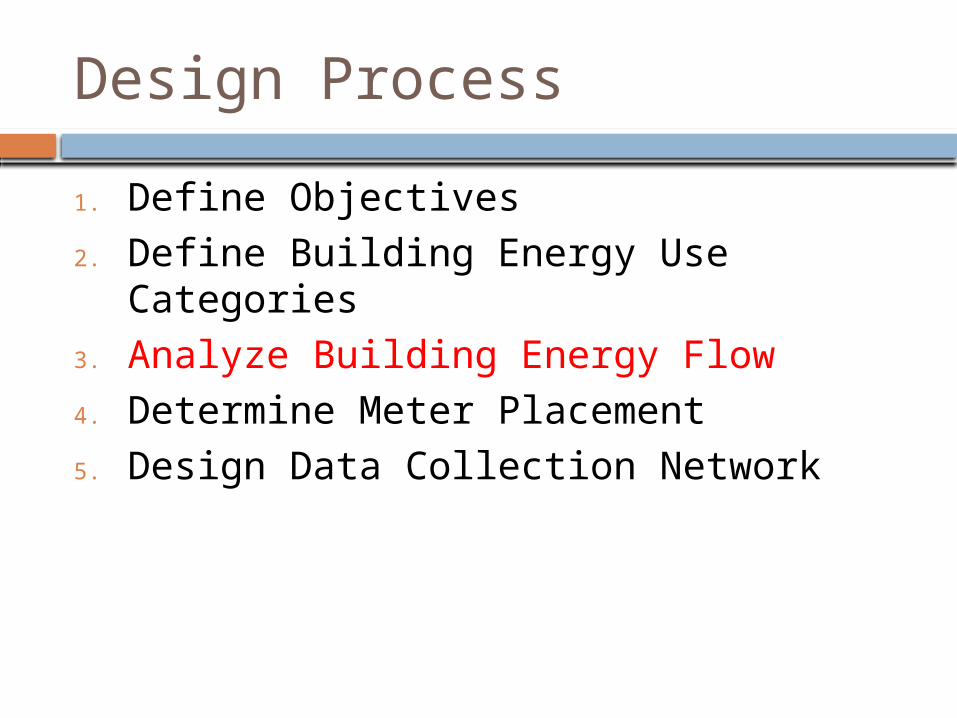
Design Process
1. Define Objectives2. Define Building Energy Use Categories3. Analyze Building Energy Flow4. Determine Meter Placement5. Design Data Collection Network
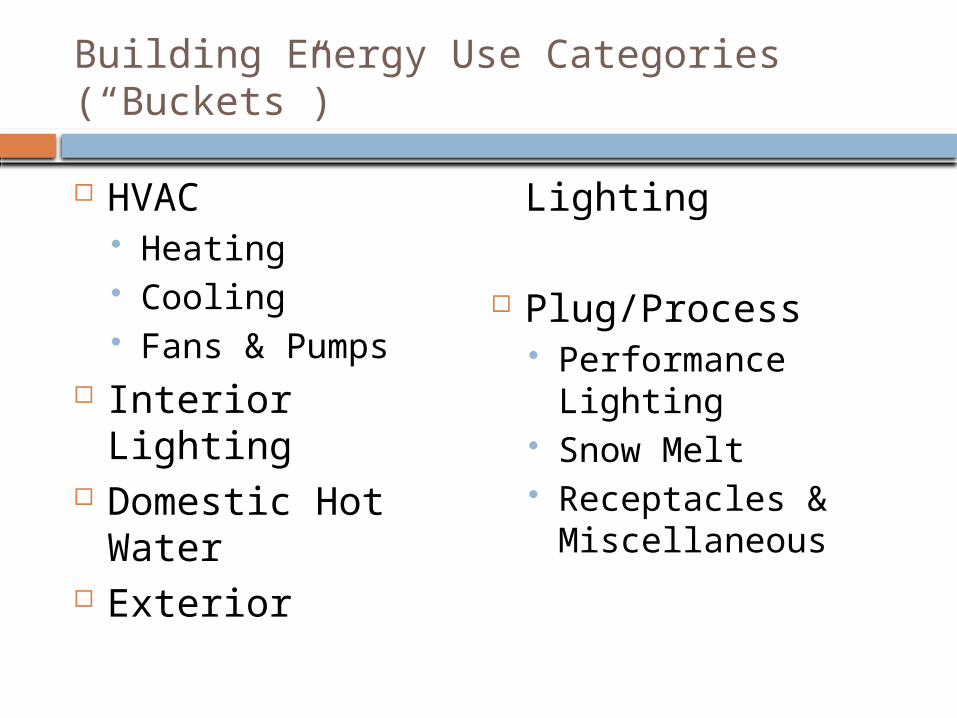
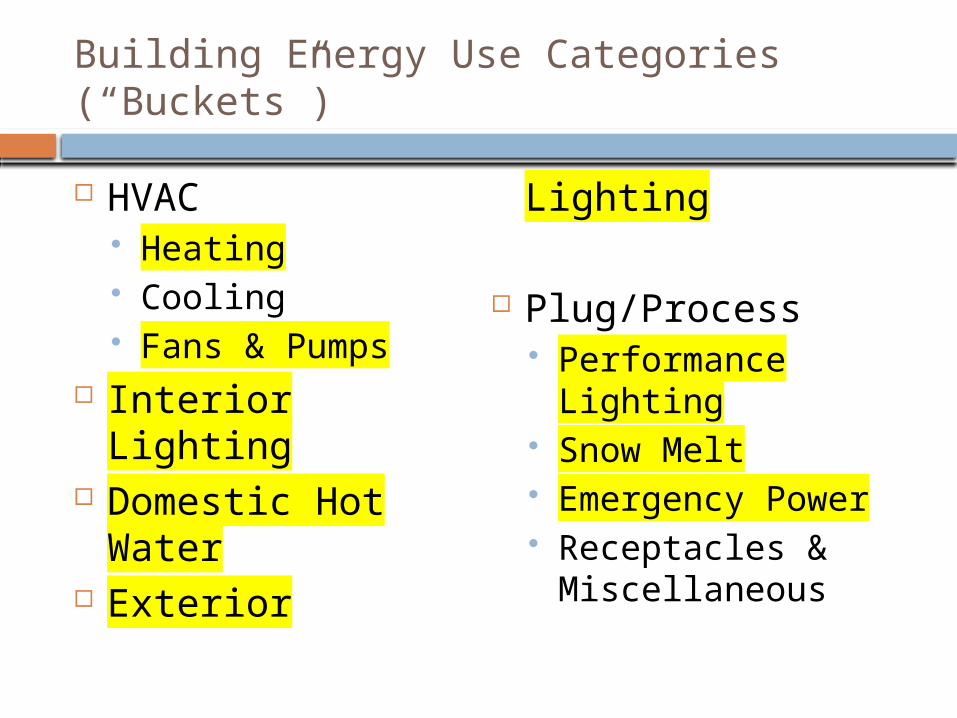
Building Energy Use Categories (“Buckets”)
HVAC Heating Cooling Fans & Pumps
Interior Lighting Domestic Hot
Water Exterior Lighting
Plug/Process Performance
Lighting Snow Melt Receptacles &
Miscellaneous
Design Process
1. Define Objectives2. Define Building Energy Use Categories3. Analyze Building Energy Flow4. Determine Meter Placement5. Design Data Collection Network
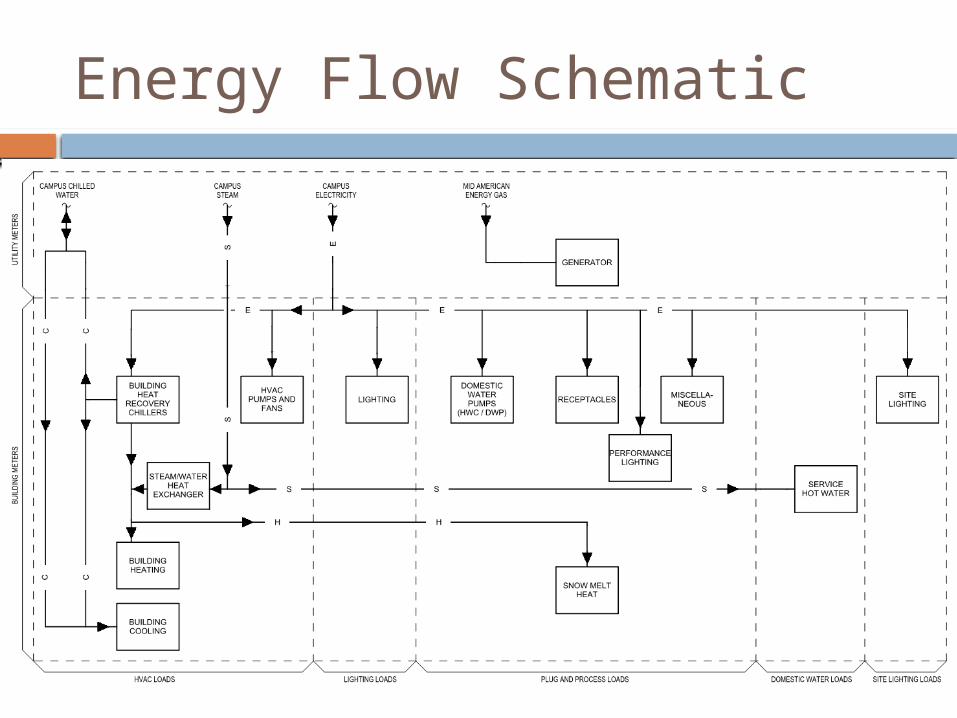
Energy Flow Schematic
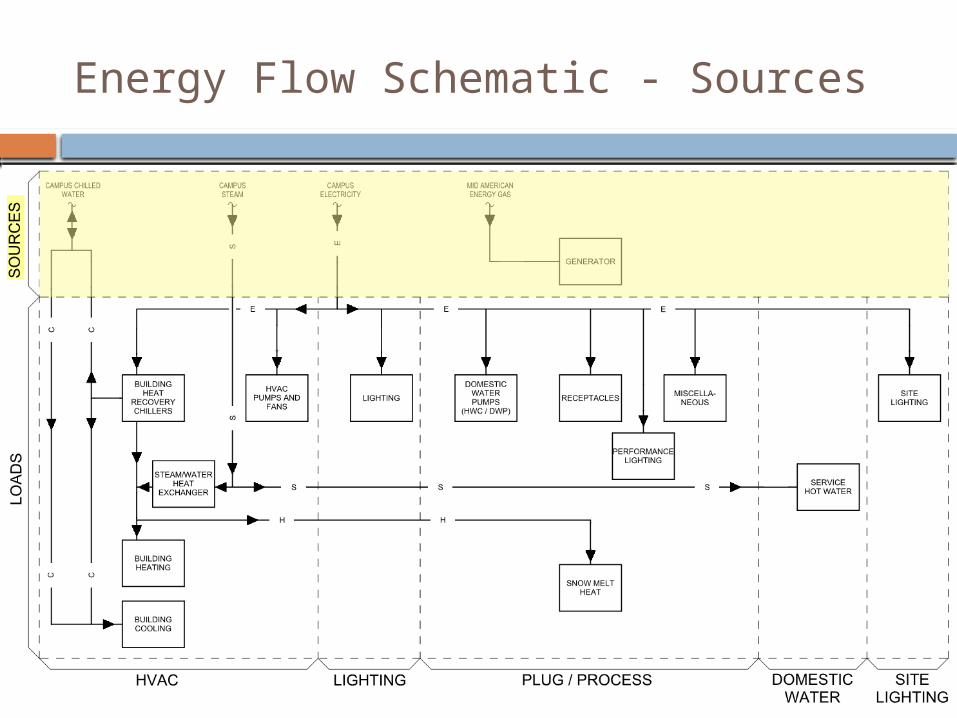
Energy Flow Schematic - Sources
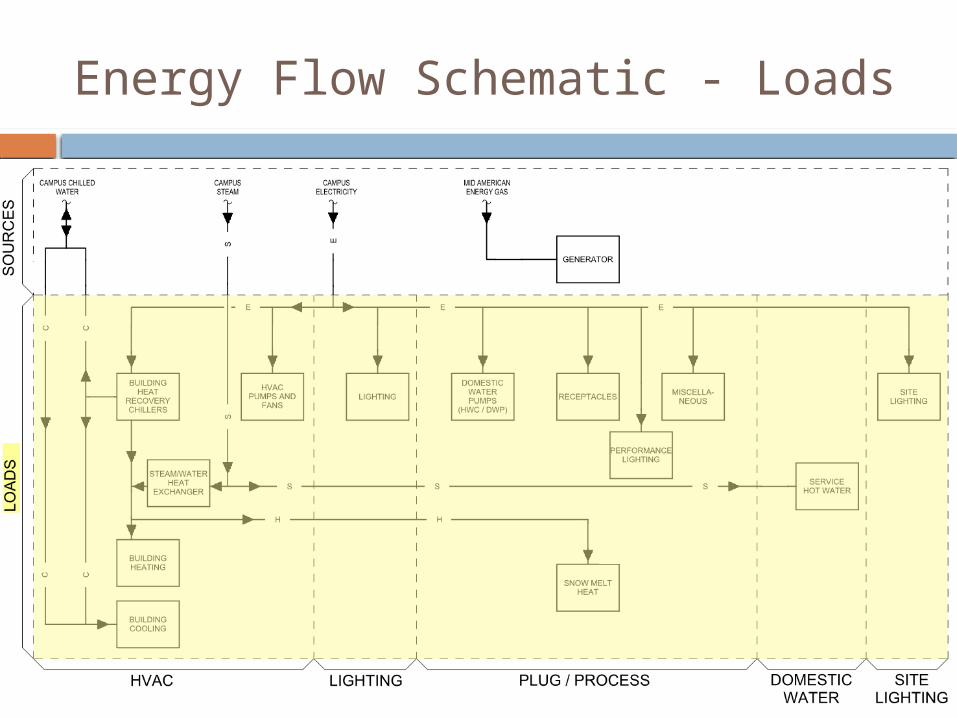
Energy Flow Schematic - Loads
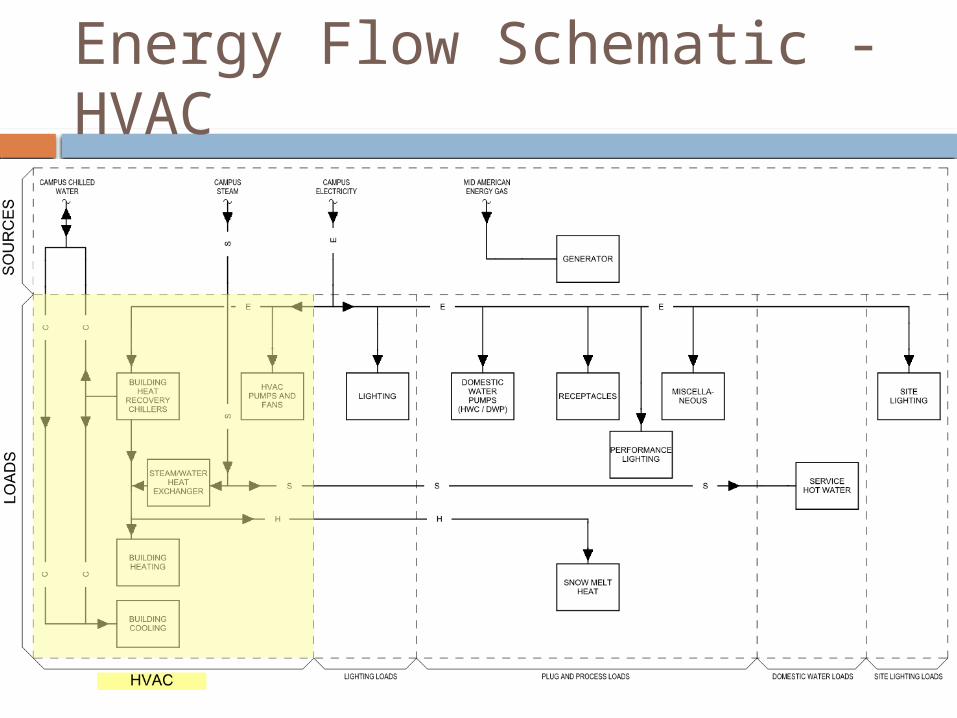
Energy Flow Schematic - HVAC
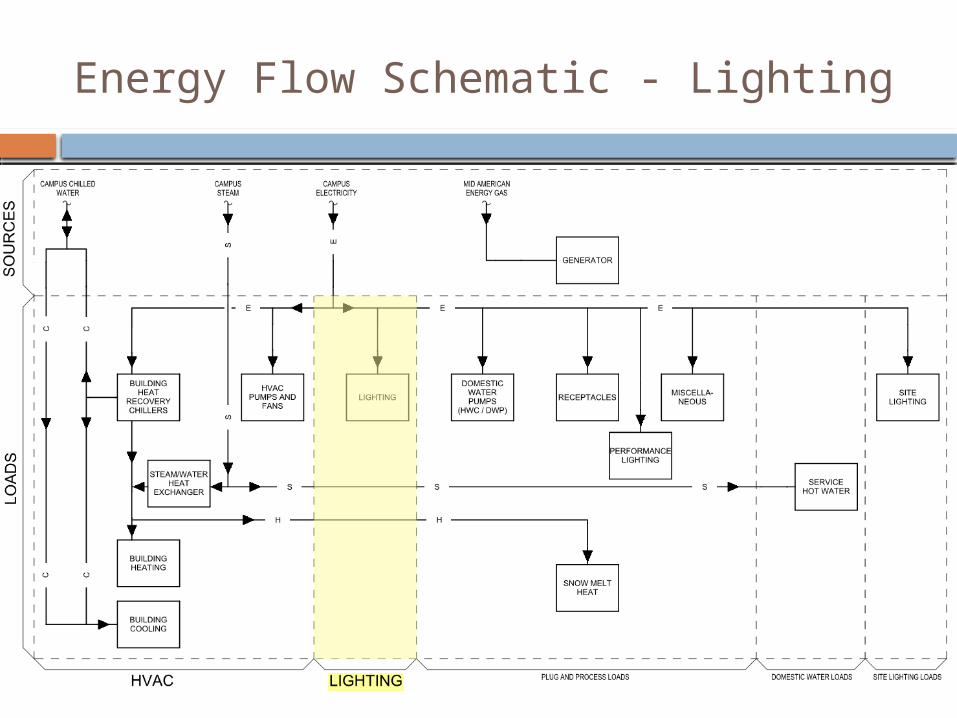
Energy Flow Schematic - Lighting
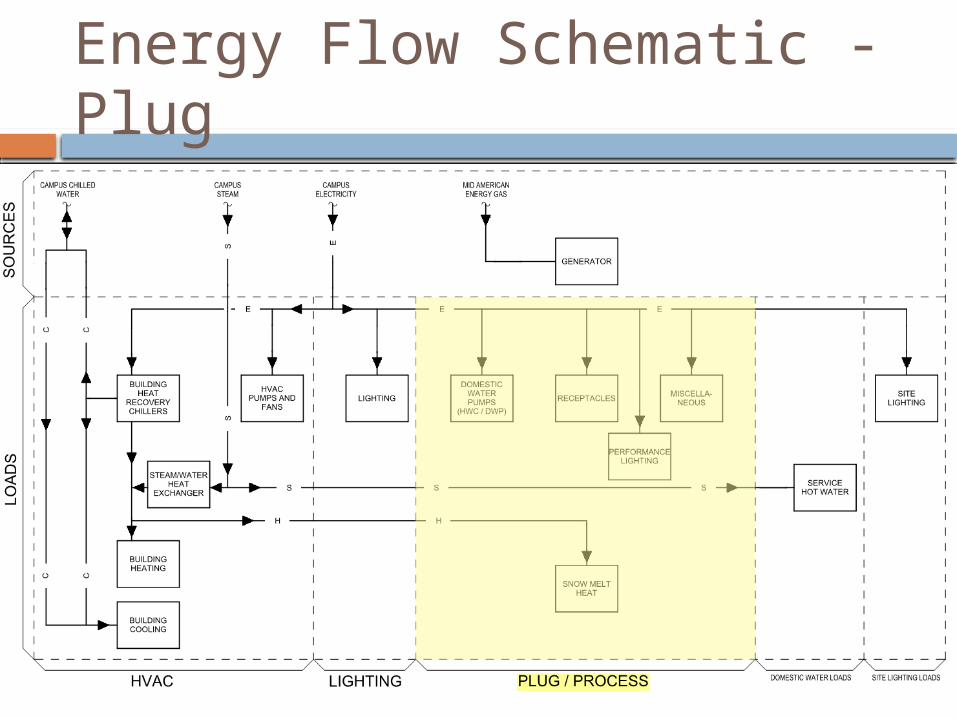
Energy Flow Schematic - Plug
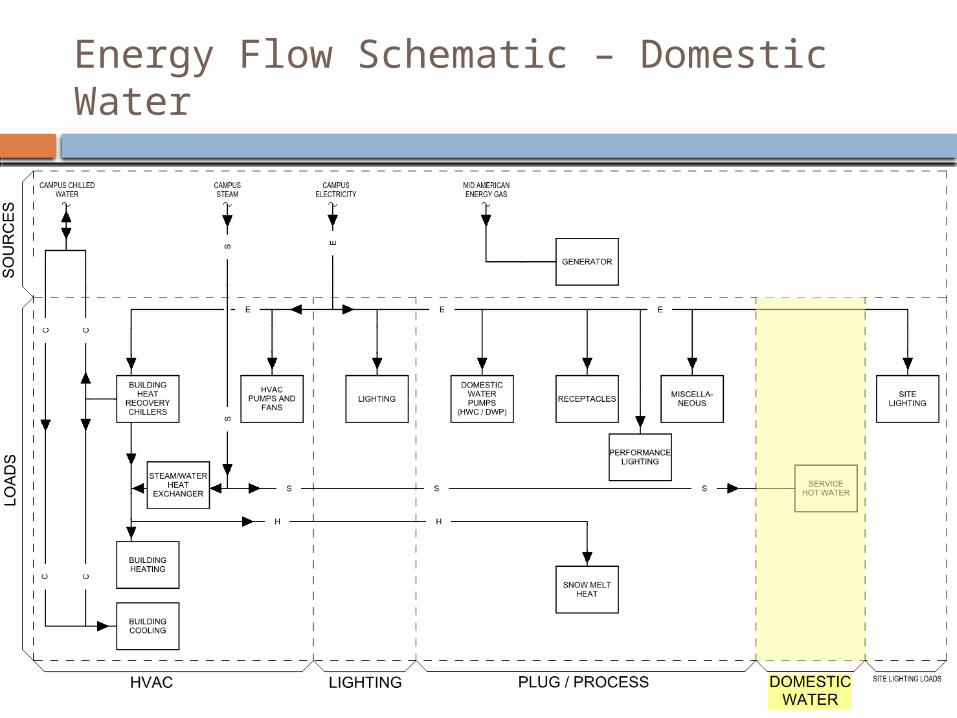
Energy Flow Schematic – Domestic Water
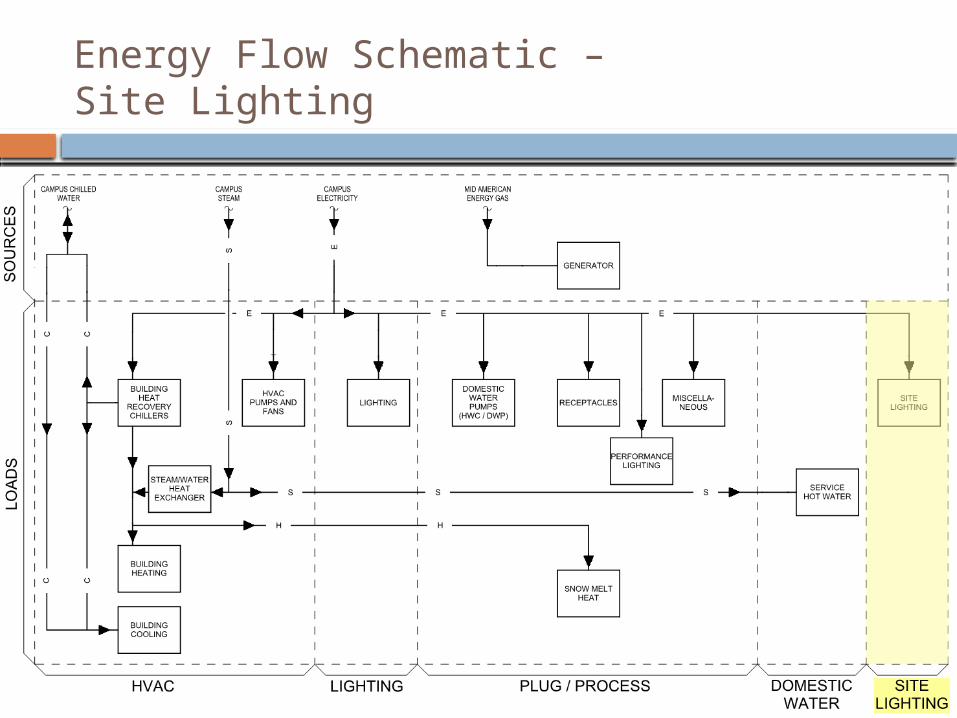
Energy Flow Schematic – Site Lighting
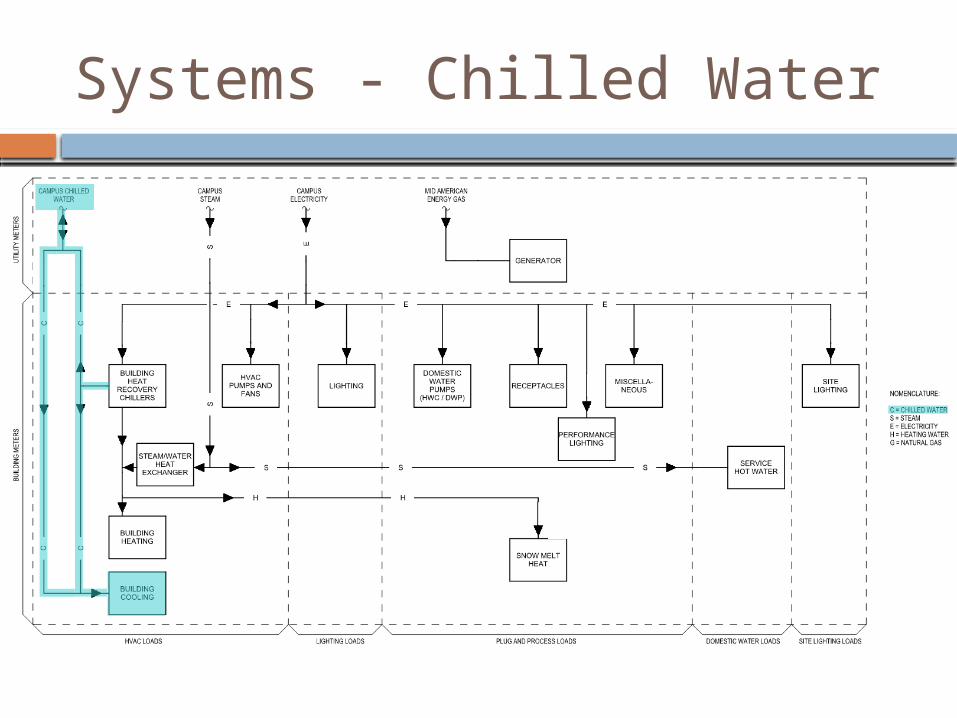
Systems - Chilled Water
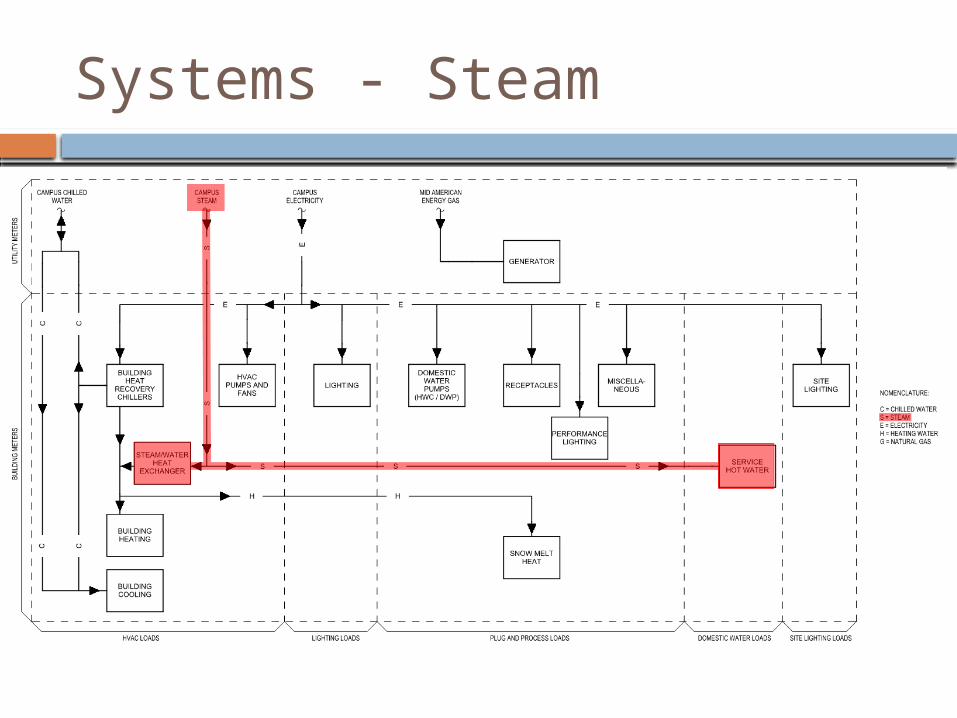
Systems - Steam
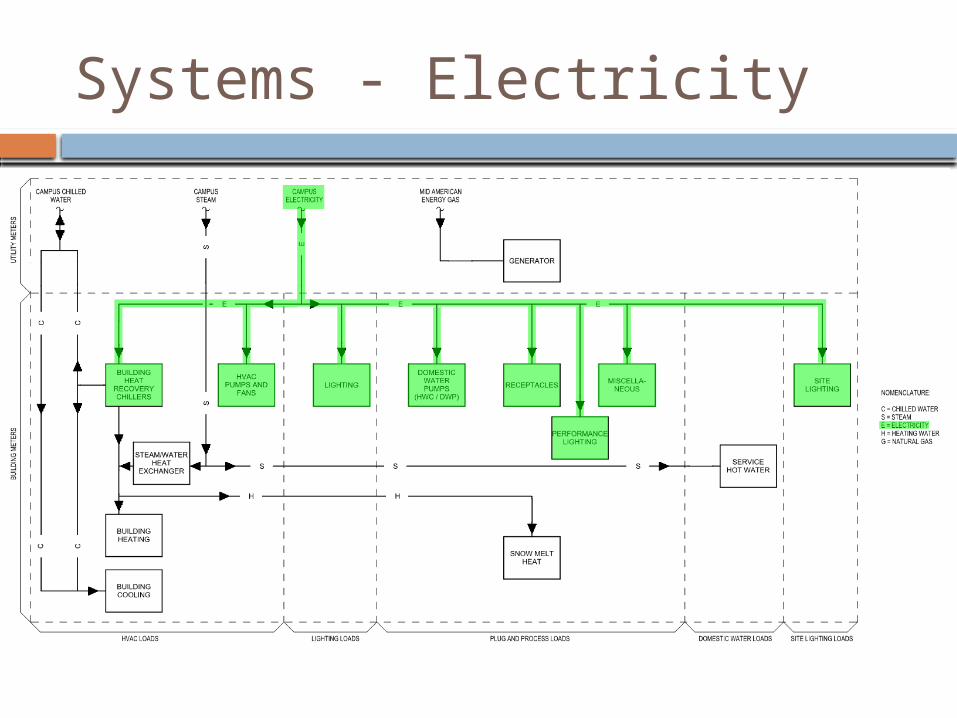
Systems - Electricity
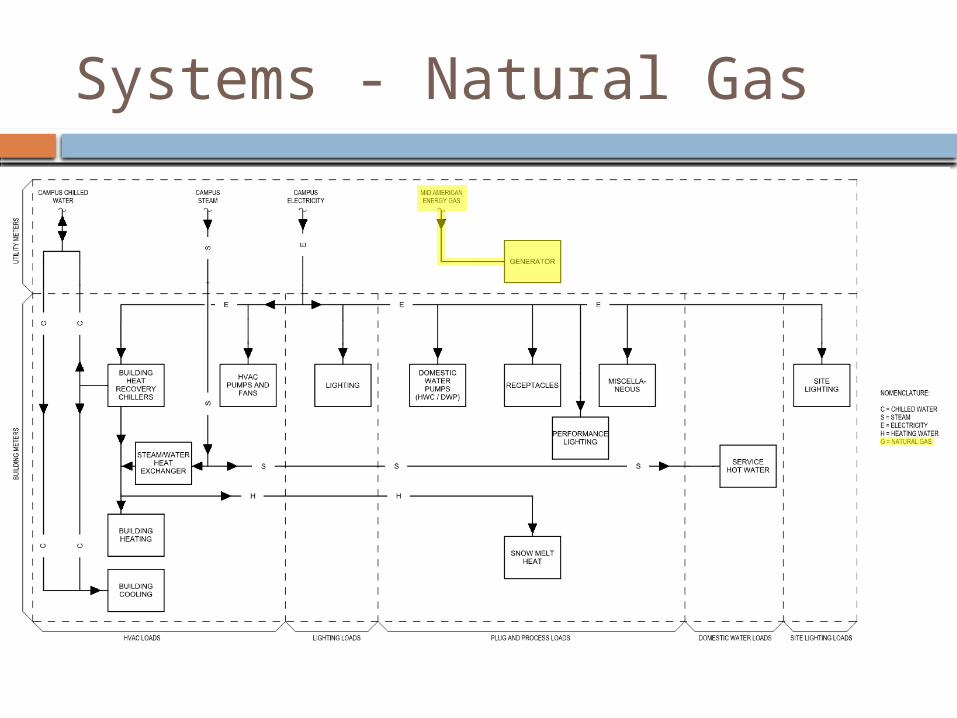
Systems - Natural Gas
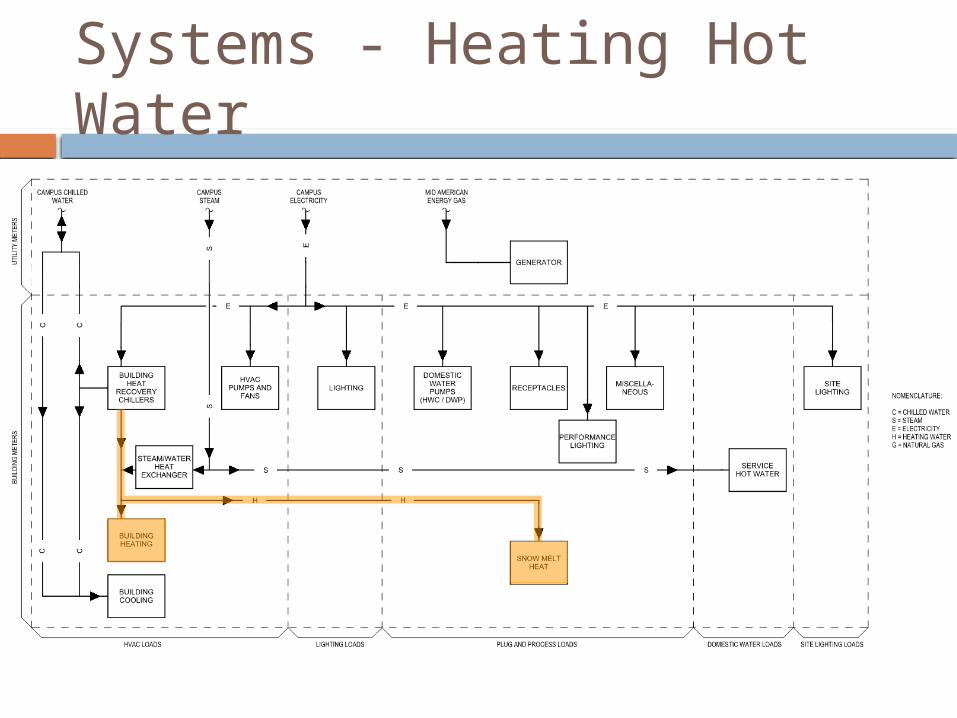
Systems - Heating Hot Water
Design Process
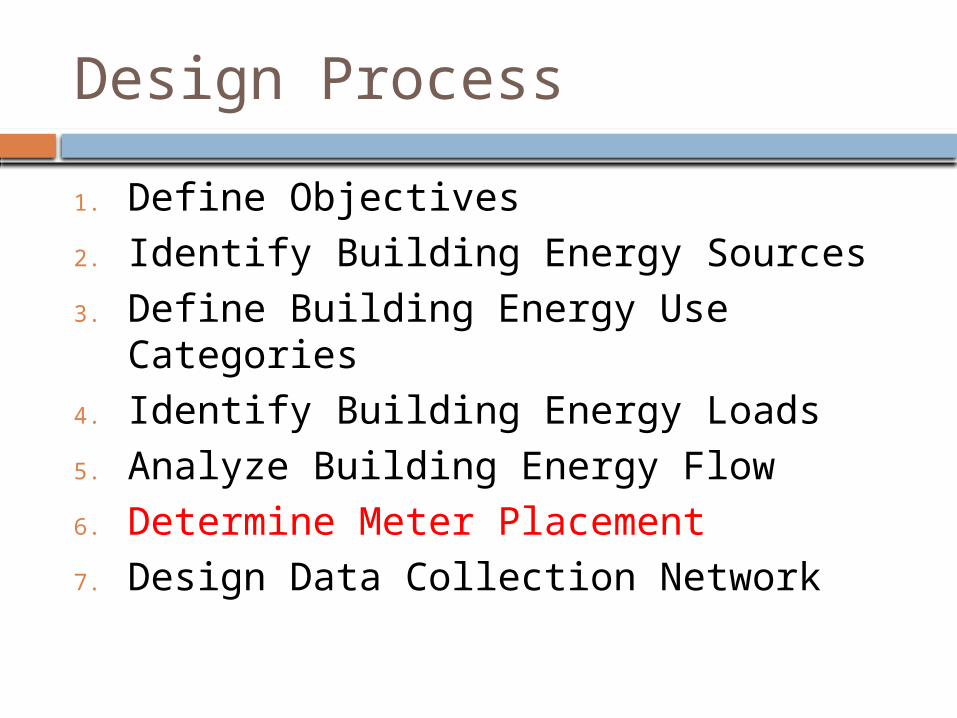
1. Define Objectives2. Identify Building Energy Sources3. Define Building Energy Use Categories4. Identify Building Energy Loads5. Analyze Building Energy Flow6. Determine Meter Placement7. Design Data Collection Network
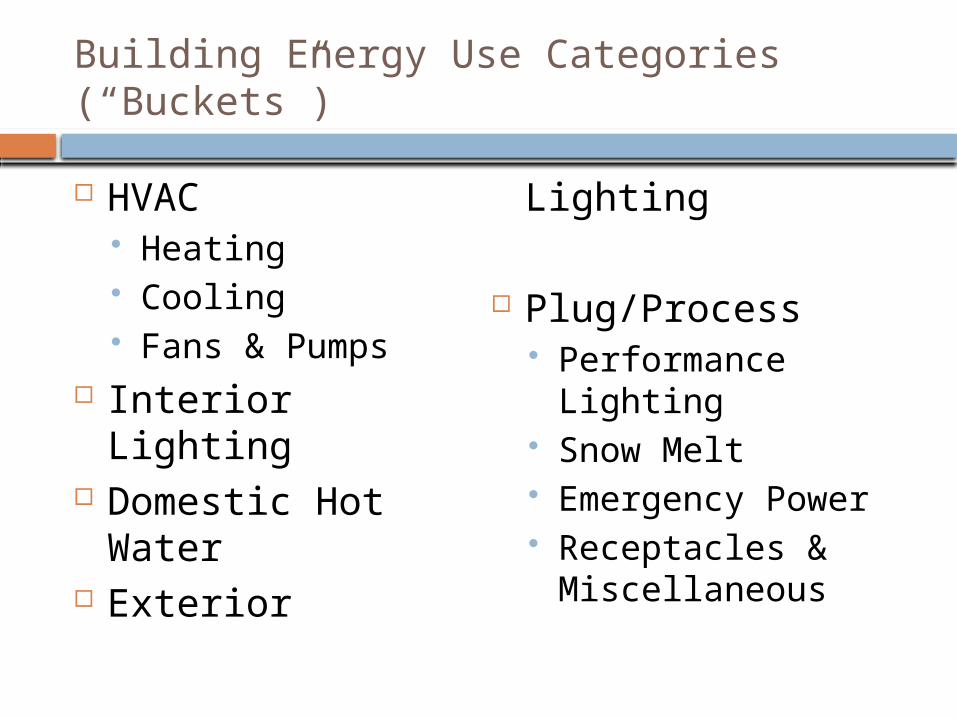
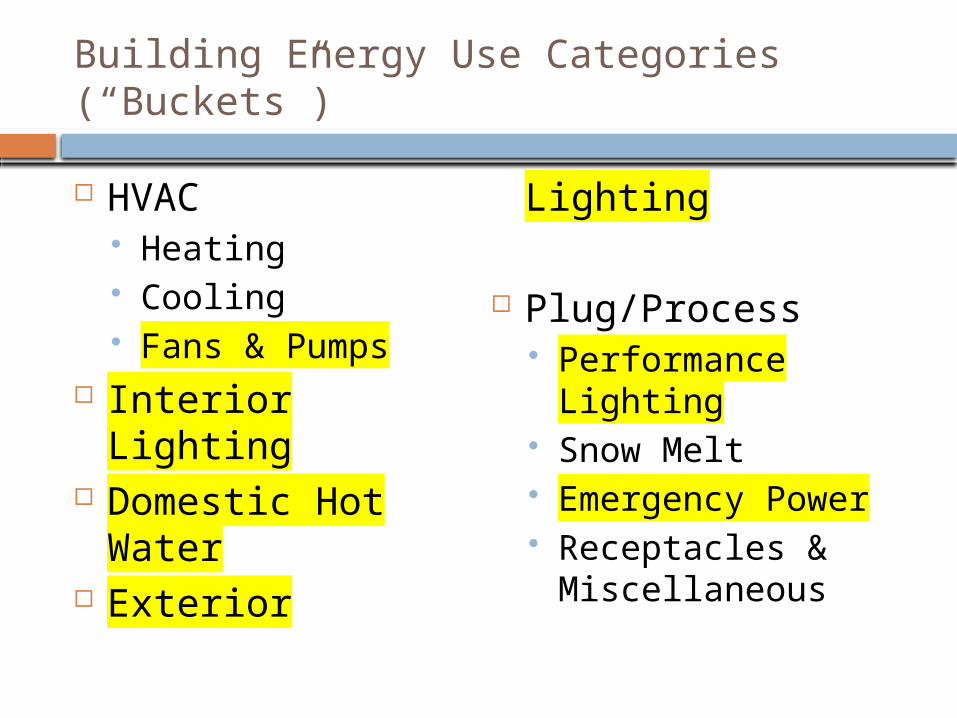
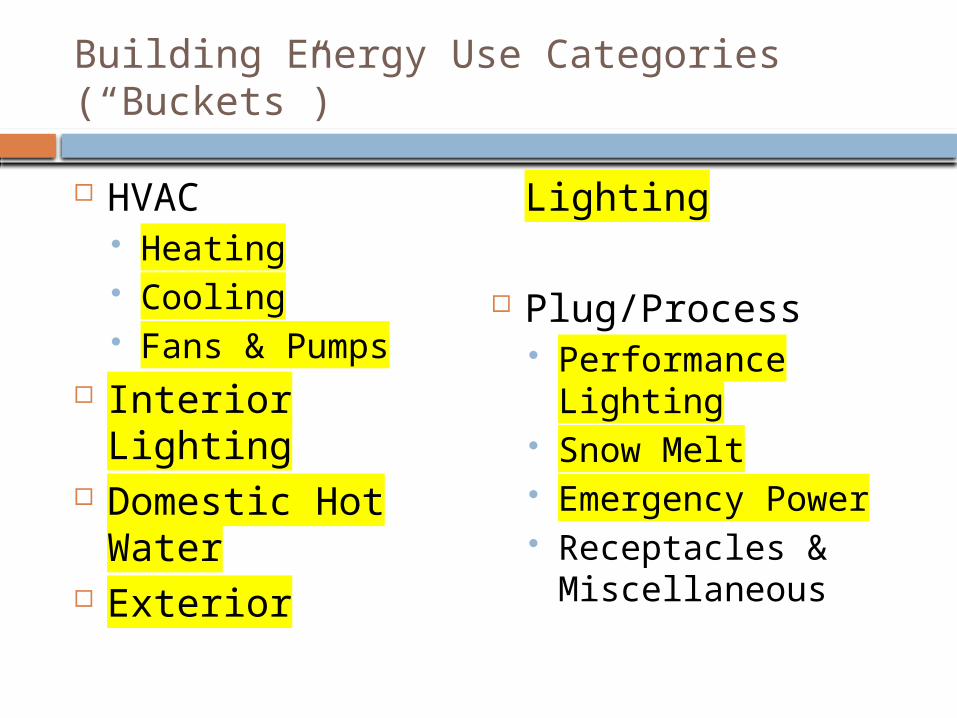
Building Energy Use Categories (“Buckets”)
HVAC Heating Cooling Fans & Pumps
Interior Lighting Domestic Hot
Water Exterior Lighting
Plug/Process Performance
Lighting Snow Melt Emergency Power Receptacles &
Miscellaneous
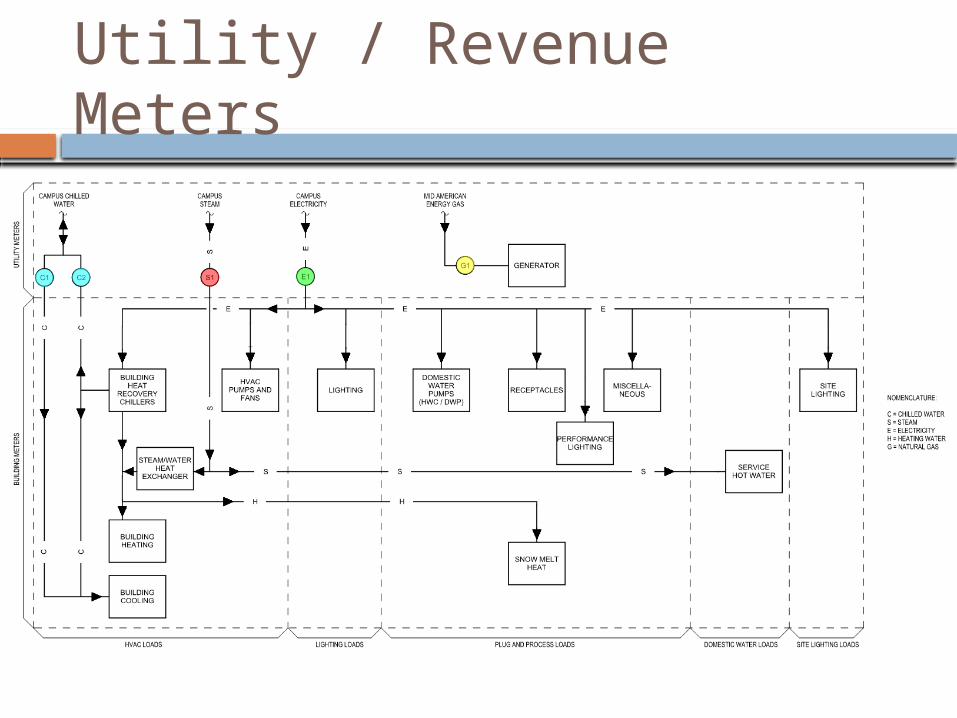
Utility / Revenue Meters
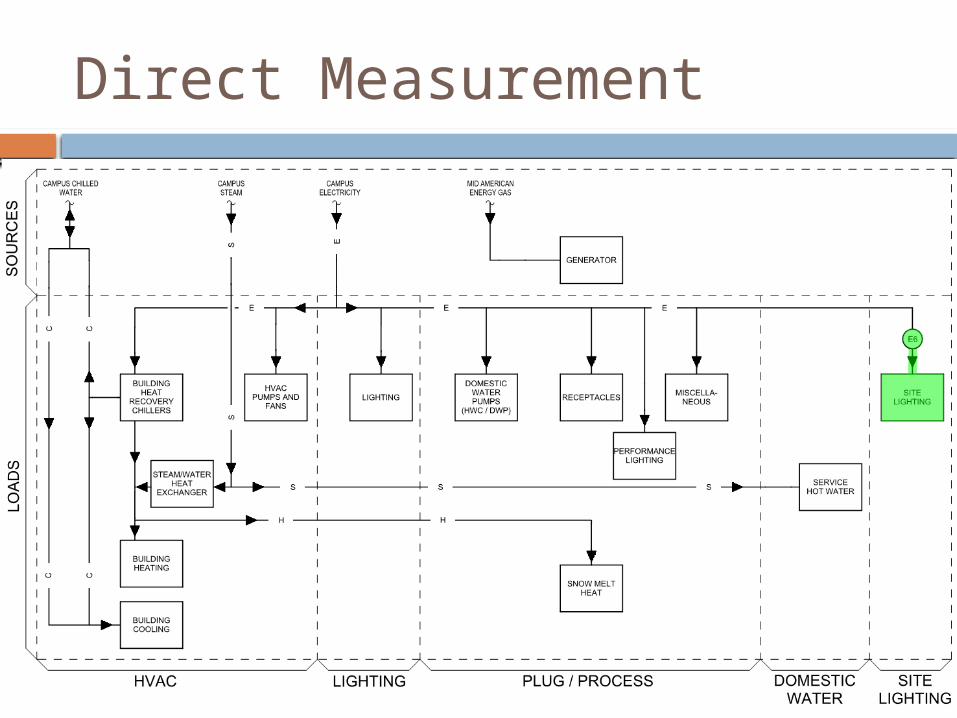
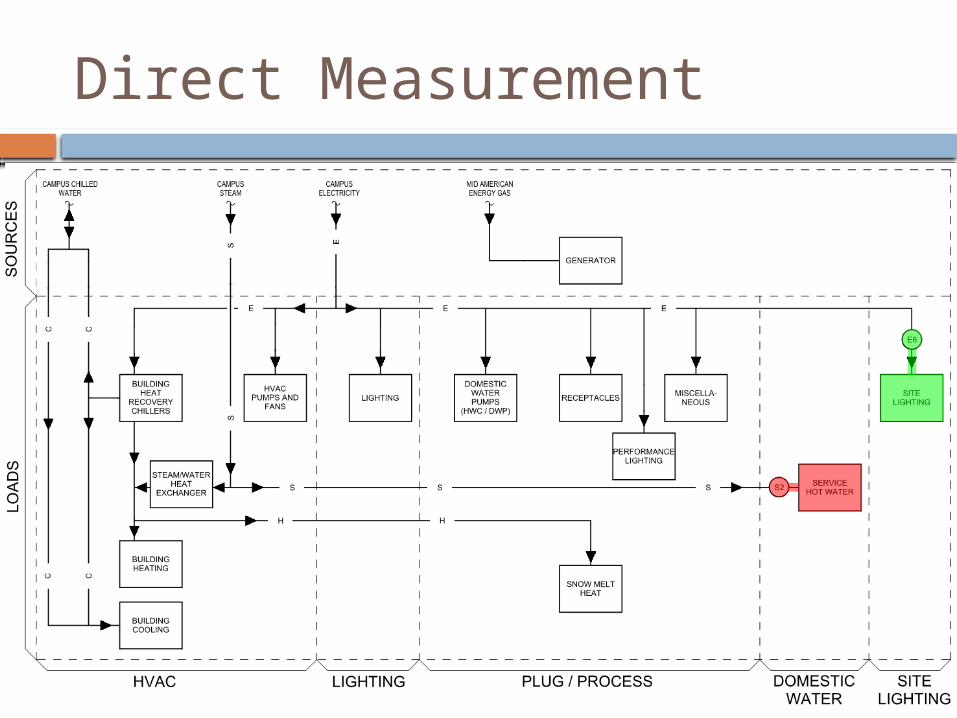
Direct Measurement
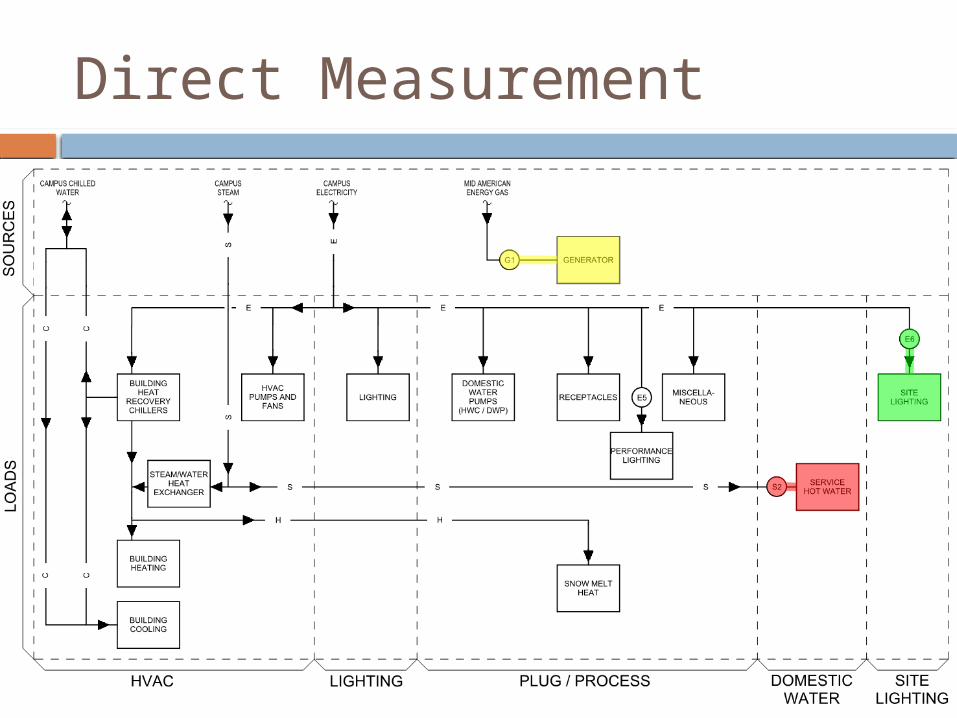
Direct Measurement
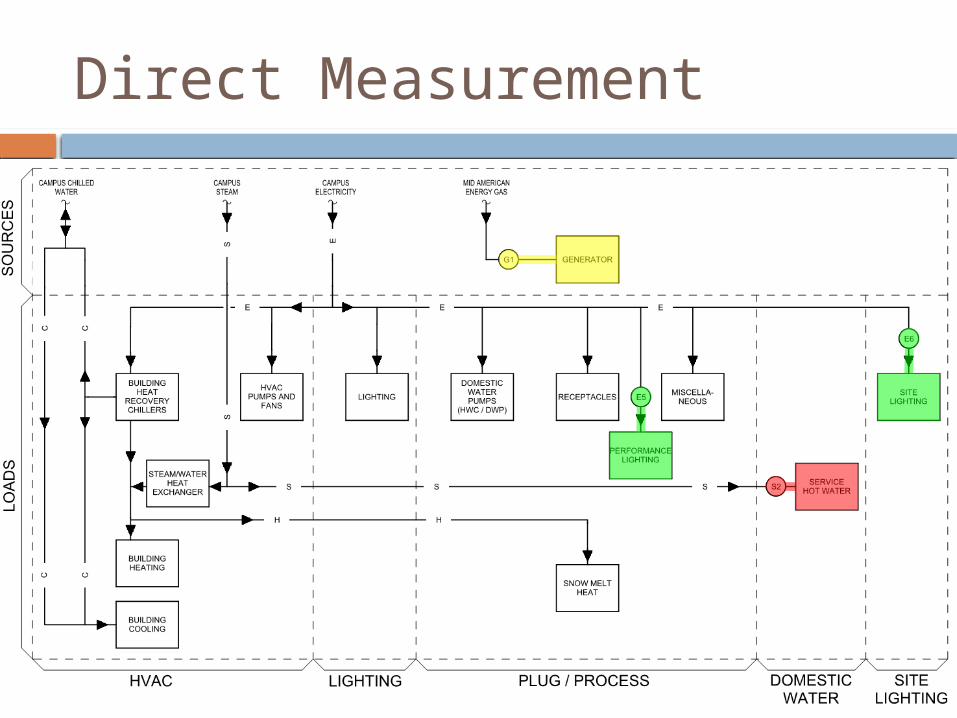
Direct Measurement
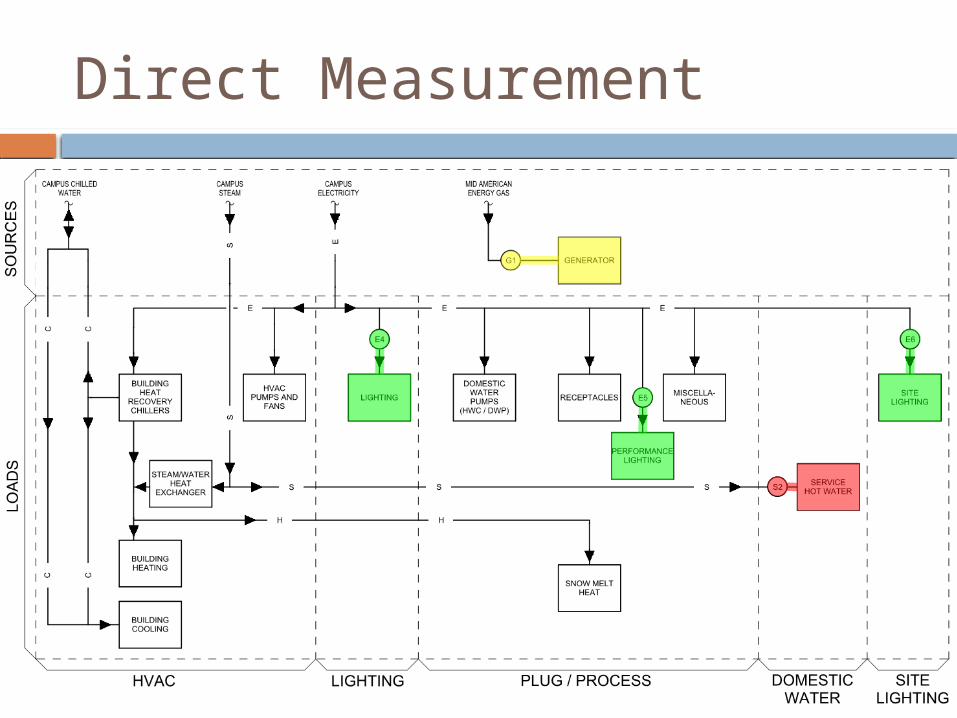
Direct Measurement
Direct Measurement
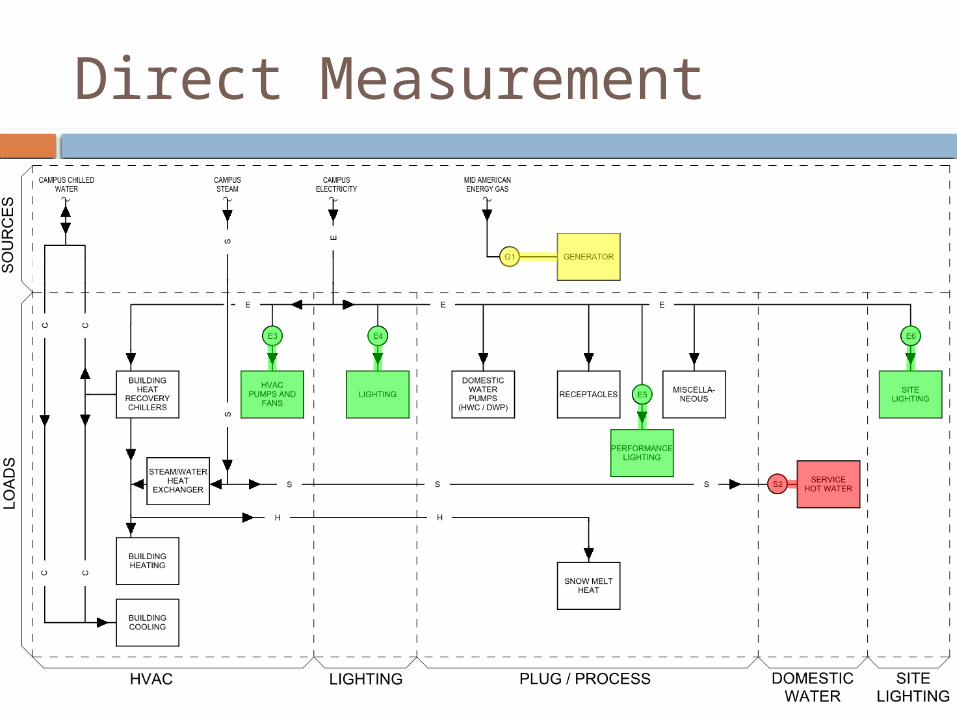
Direct Measurement
Building Energy Use Categories (“Buckets”)
HVAC Heating Cooling Fans & Pumps
Interior Lighting Domestic Hot
Water Exterior Lighting
Plug/Process Performance
Lighting Snow Melt Emergency Power Receptacles &
Miscellaneous
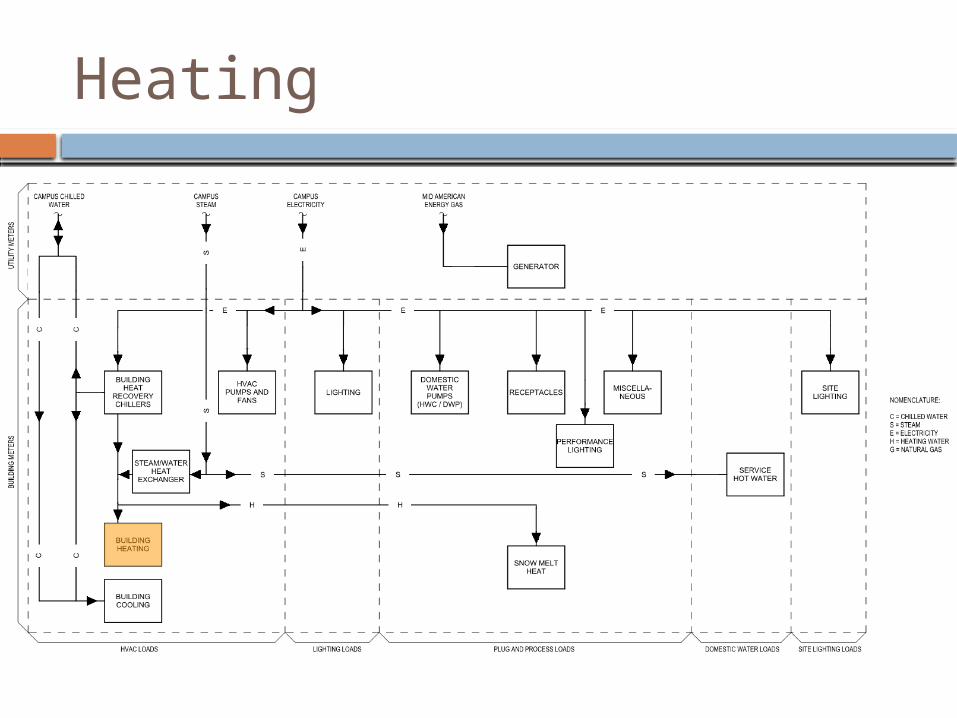
Heating
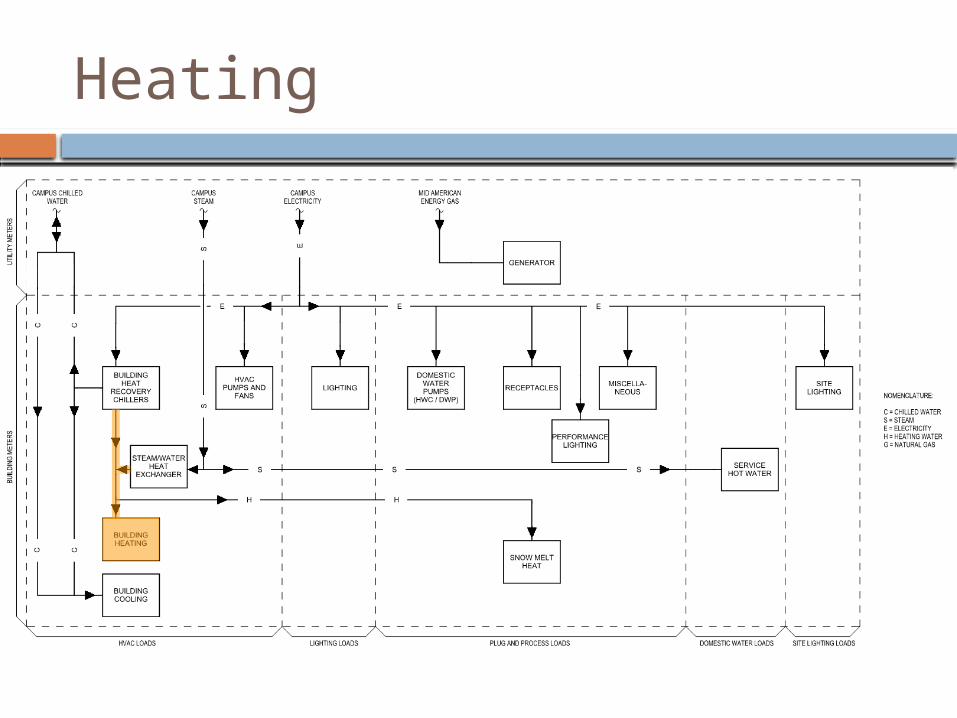
Heating
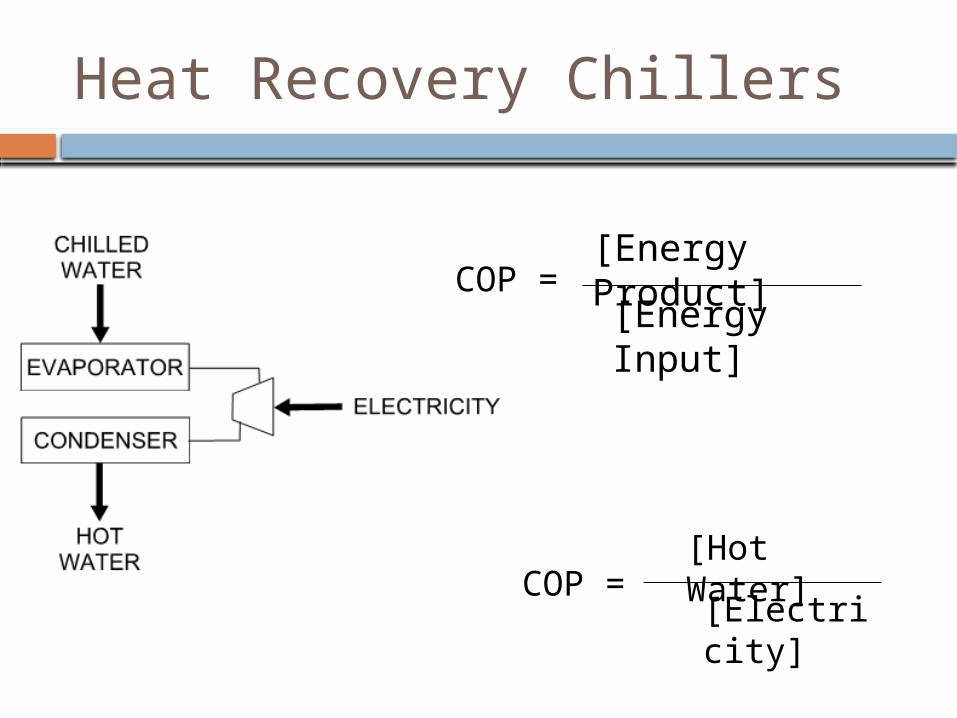
Heat Recovery Chillers
[Energy Product][Energy Input]
COP =
[Hot Water]
[Electricity]
COP =
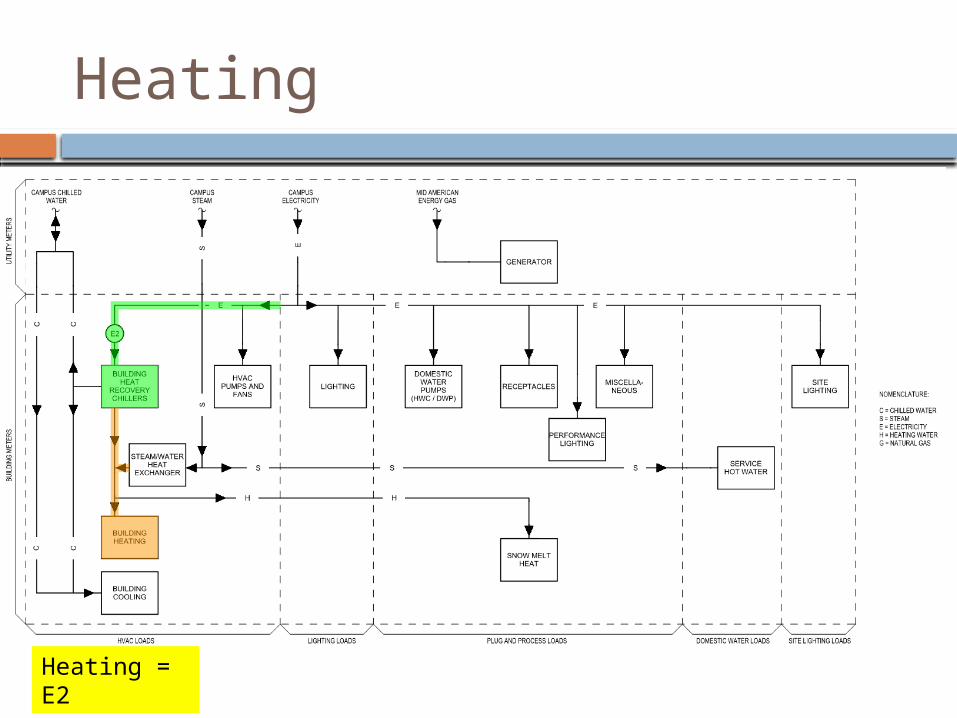
Heating
Heating = E2
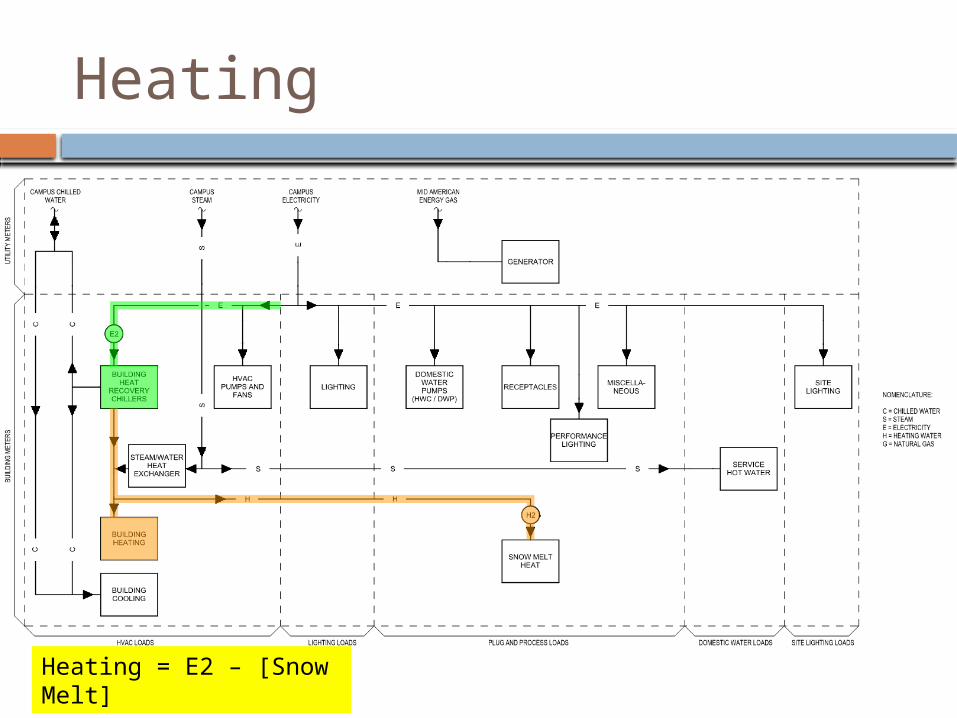
Heating
Heating = E2 – [Snow Melt]
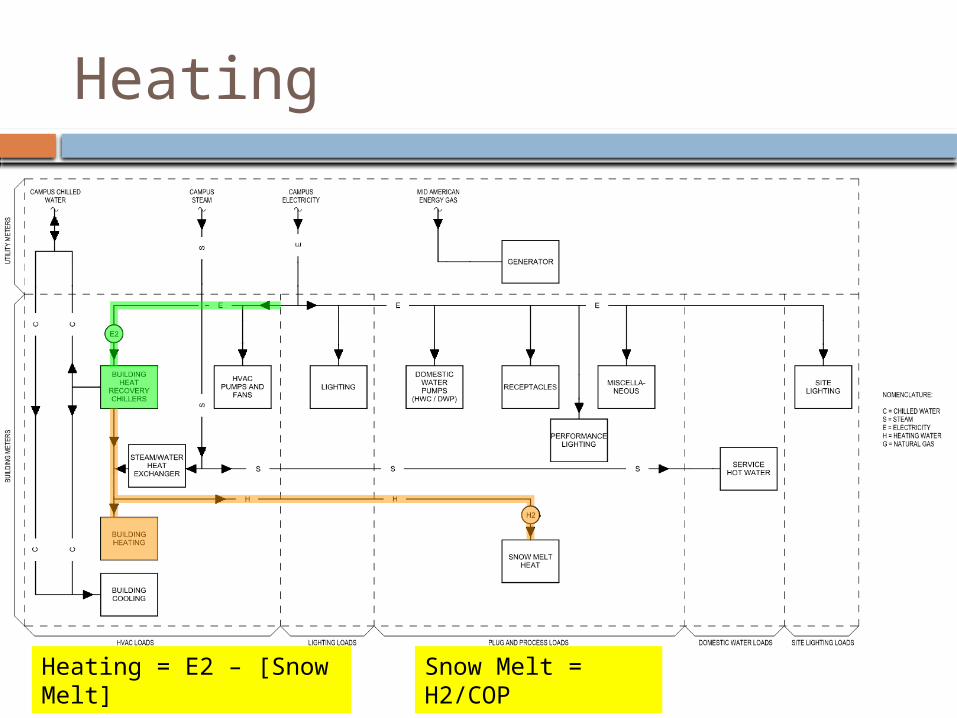
Heating
Heating = E2 – [Snow Melt]
Snow Melt = H2/COP
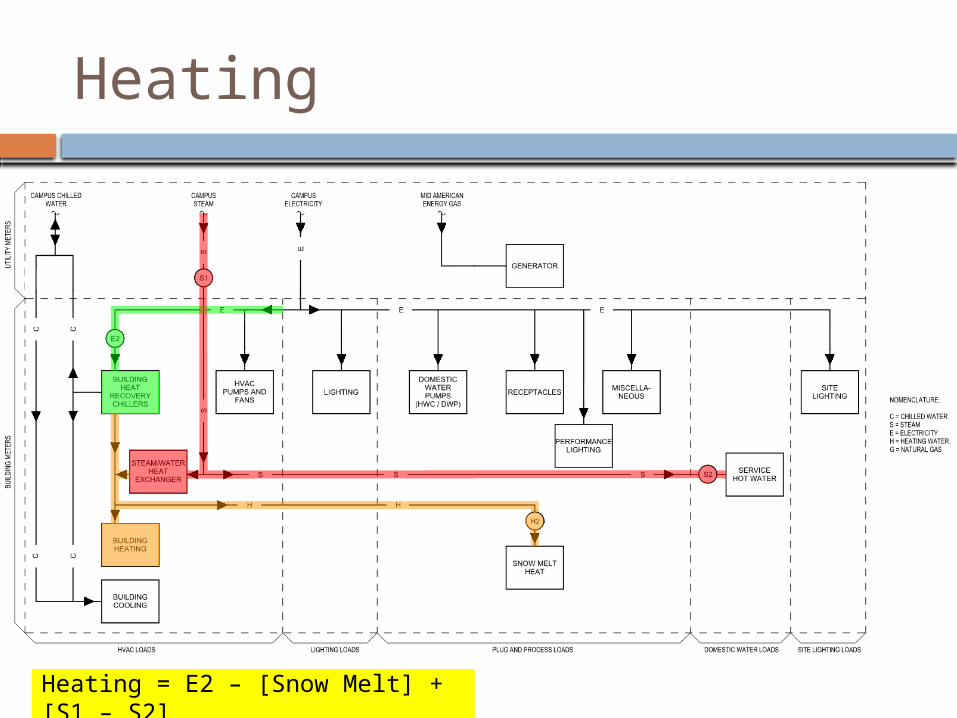
Heating
Heating = E2 – [Snow Melt] + [S1 – S2]
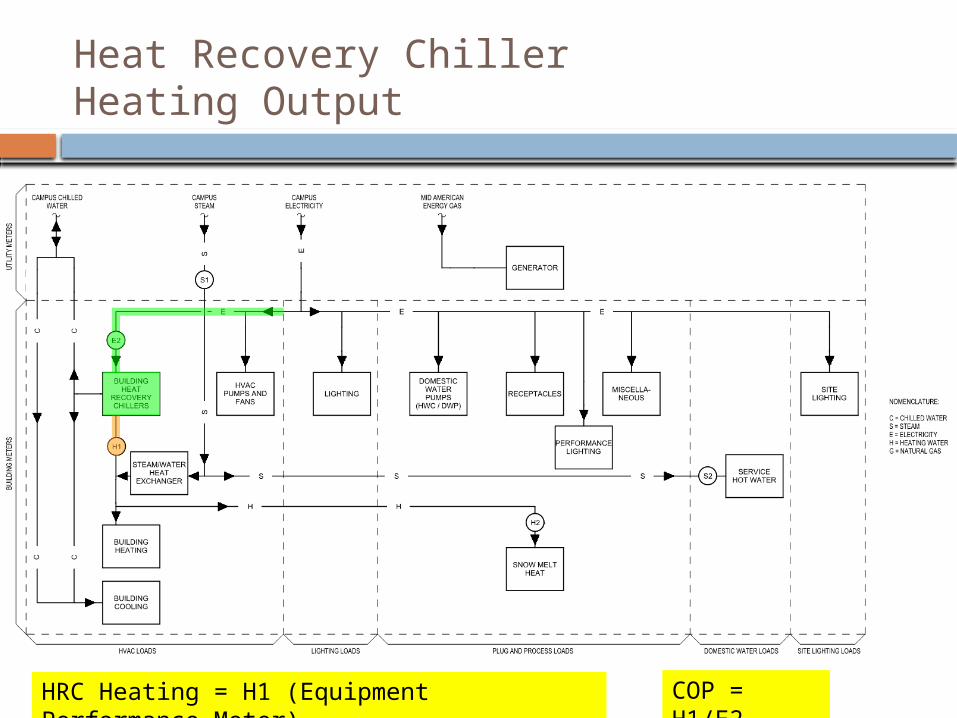
Heat Recovery Chiller Heating Output
HRC Heating = H1 (Equipment Performance Meter)
COP = H1/E2
Building Energy Use Categories (“Buckets”)
HVAC Heating Cooling Fans & Pumps
Interior Lighting Domestic Hot
Water Exterior Lighting
Plug/Process Performance
Lighting Snow Melt Emergency Power Receptacles &
Miscellaneous
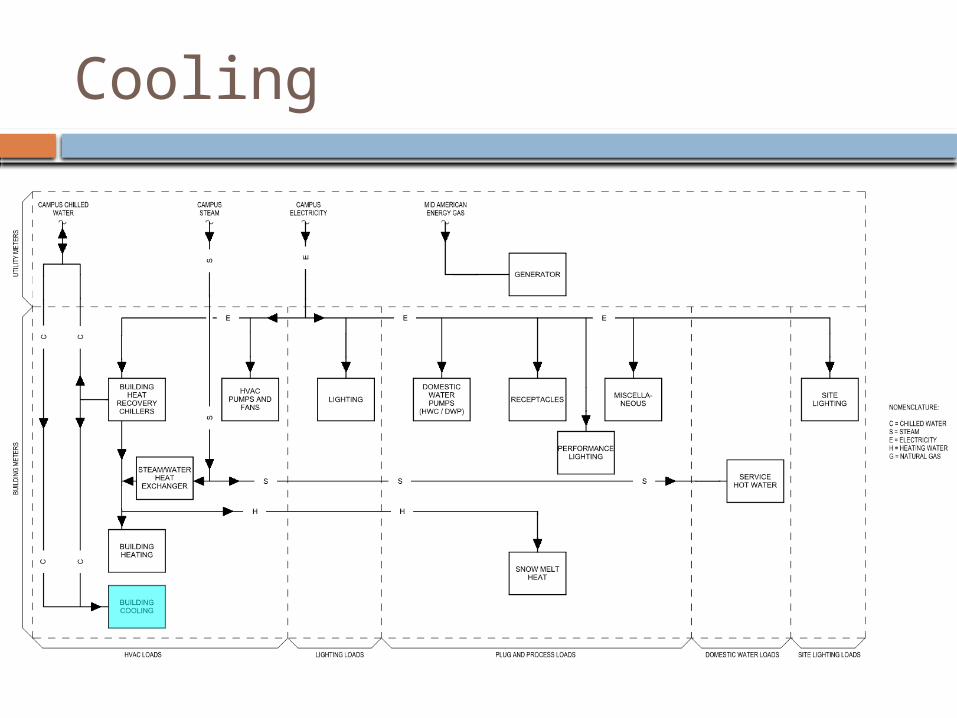
Cooling
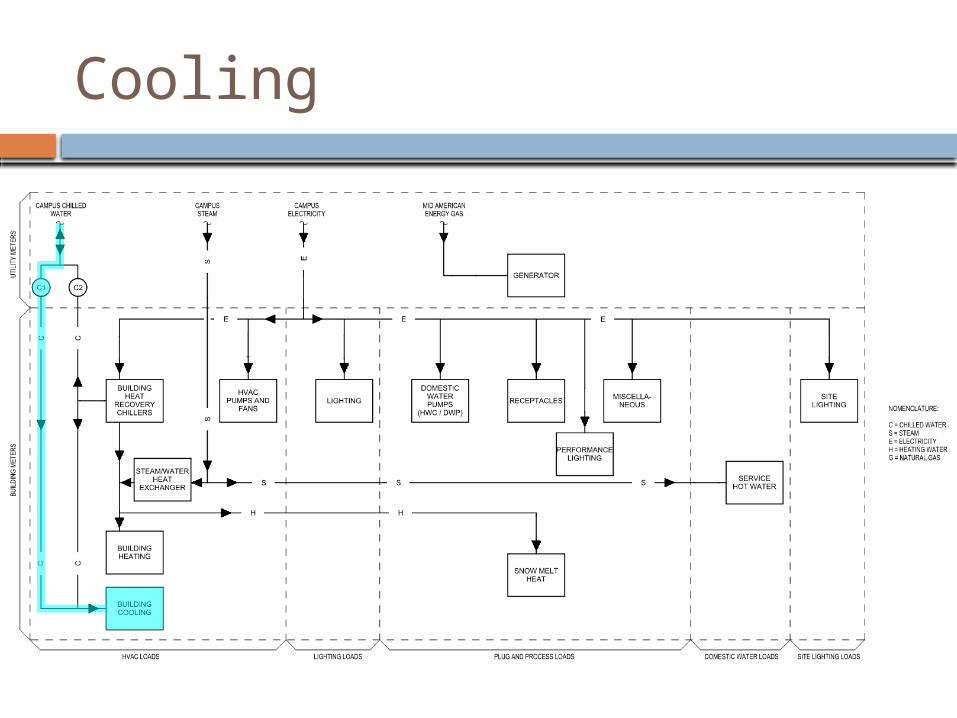
Cooling
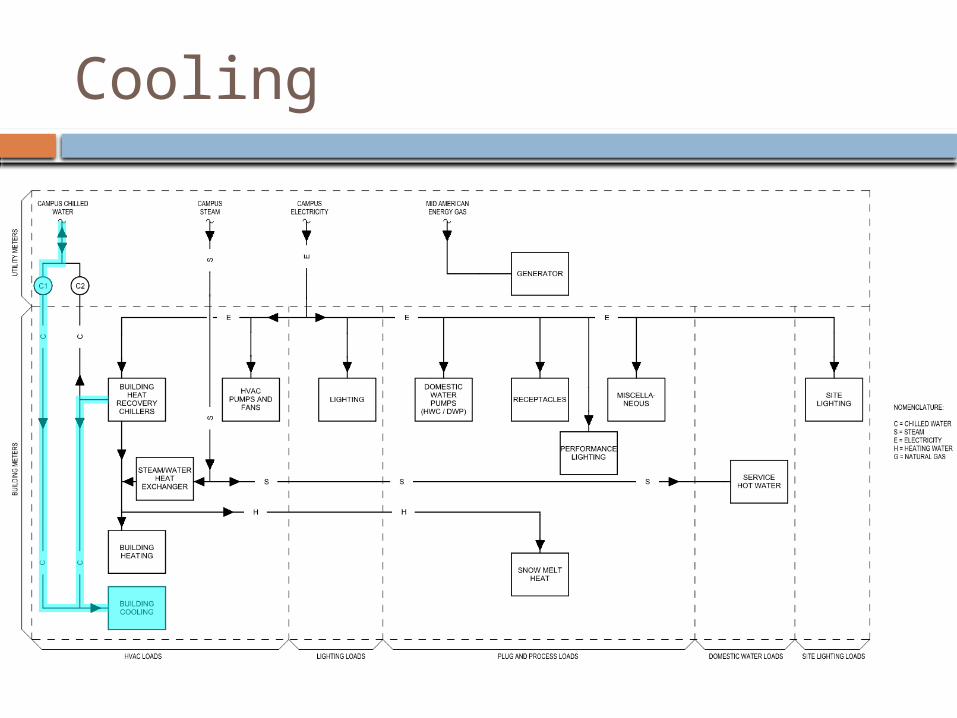
Cooling

Cooling
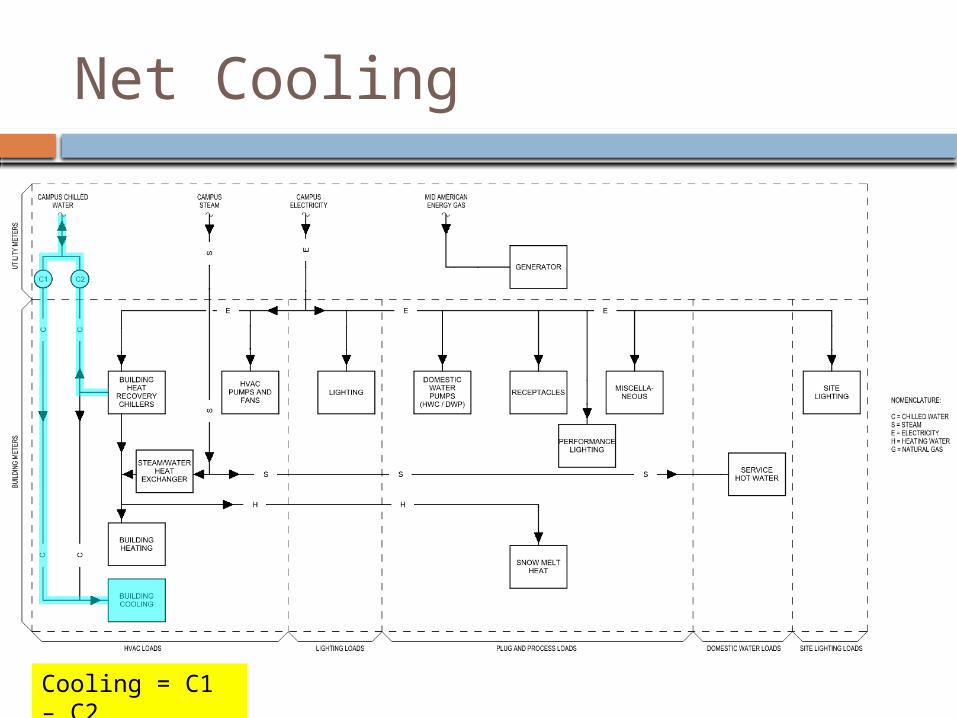
Net Cooling
Cooling = C1 – C2
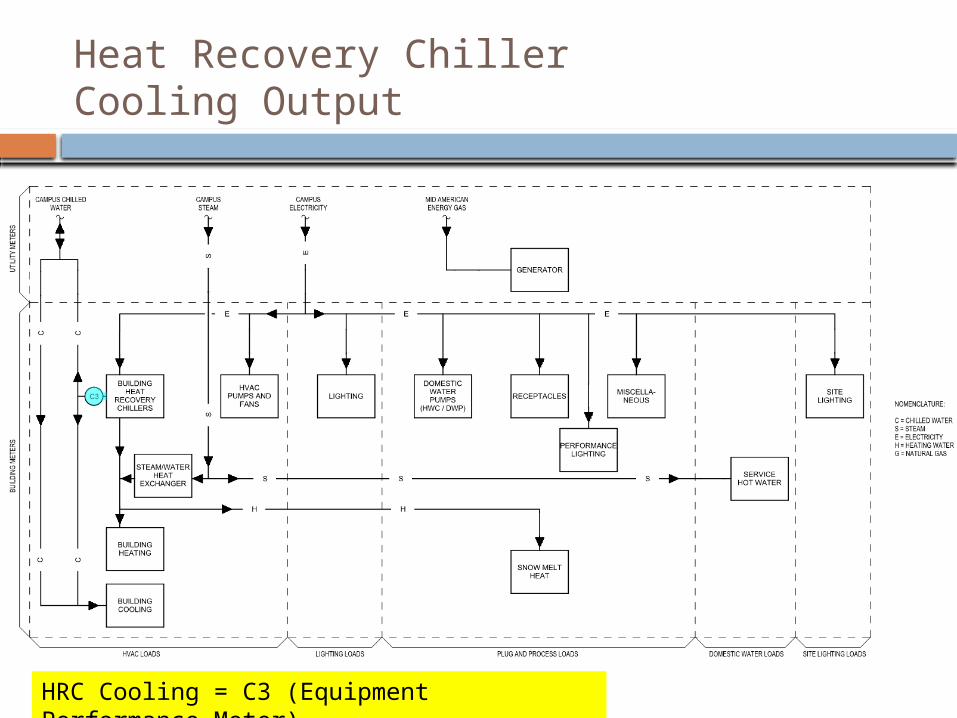
Heat Recovery ChillerCooling Output
HRC Cooling = C3 (Equipment Performance Meter)
Building Energy Use Categories (“Buckets”)
HVAC Heating Cooling Fans & Pumps
Interior Lighting Domestic Hot
Water Exterior Lighting
Plug/Process Performance
Lighting Snow Melt Emergency Power Receptacles &
Miscellaneous
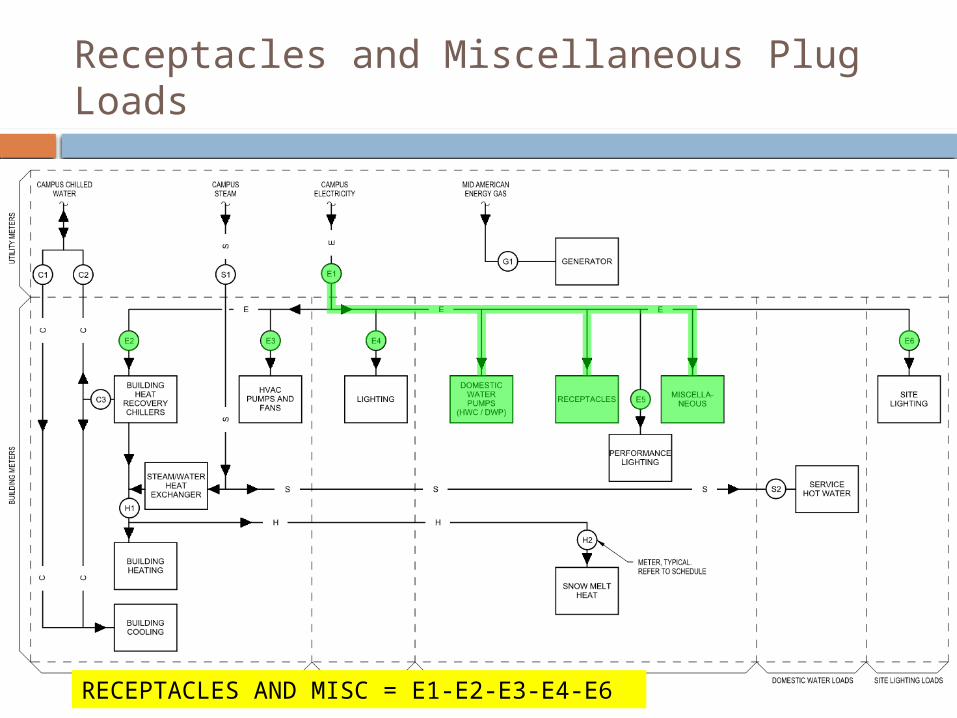
Receptacles and Miscellaneous Plug Loads
RECEPTACLES AND MISC = E1-E2-E3-E4-E6
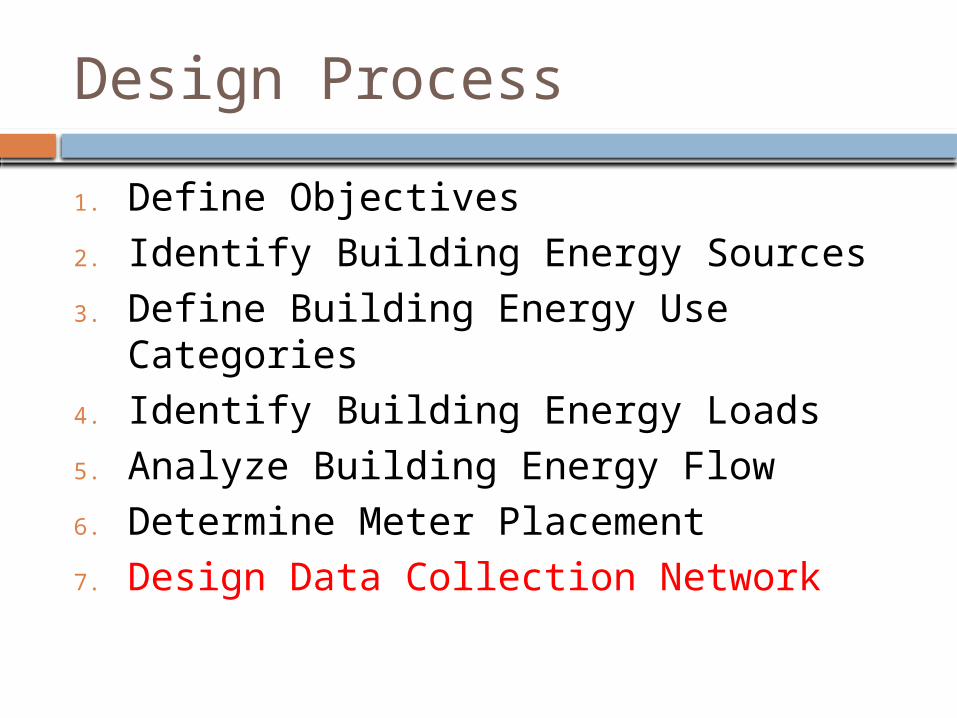
Design Process
1. Define Objectives2. Identify Building Energy Sources3. Define Building Energy Use Categories4. Identify Building Energy Loads5. Analyze Building Energy Flow6. Determine Meter Placement7. Design Data Collection Network
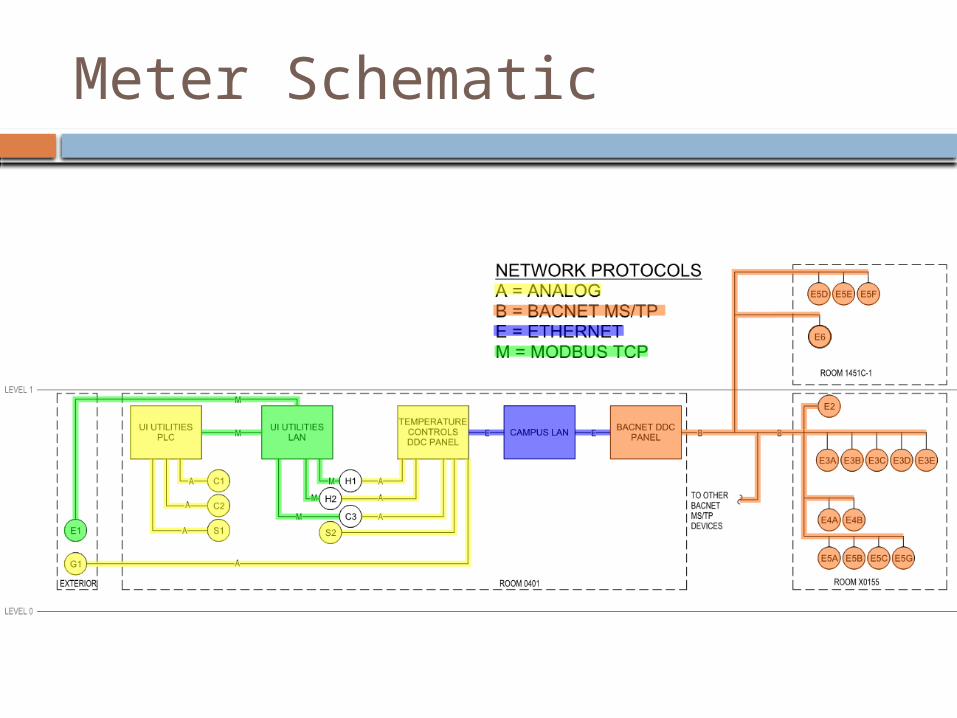
Meter Schematic
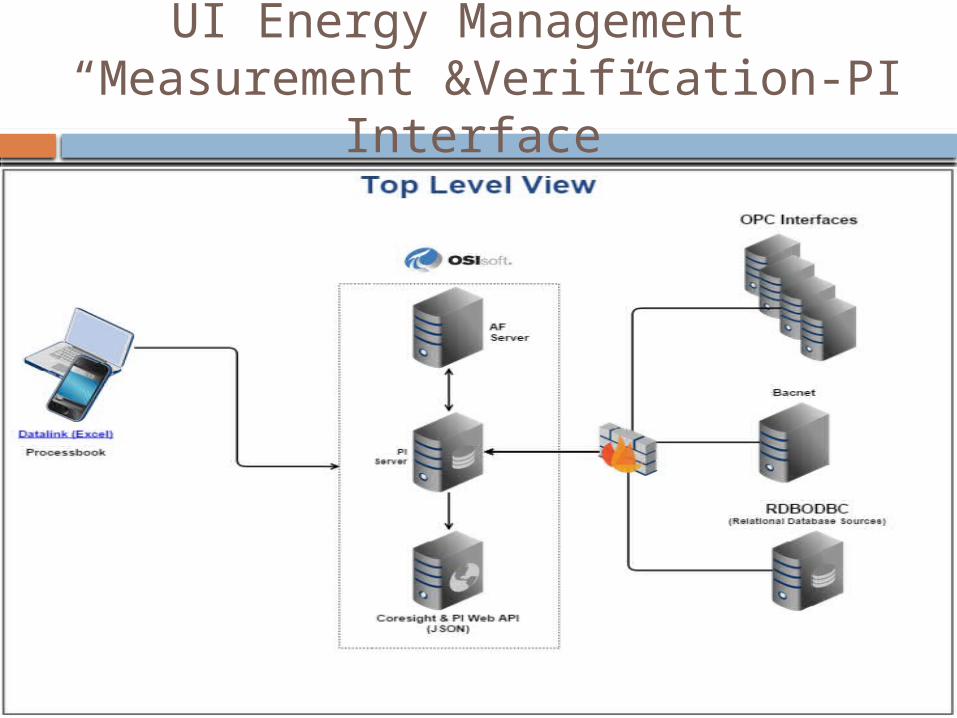
UI Energy Management “Measurement &Verification-PI
Interface”
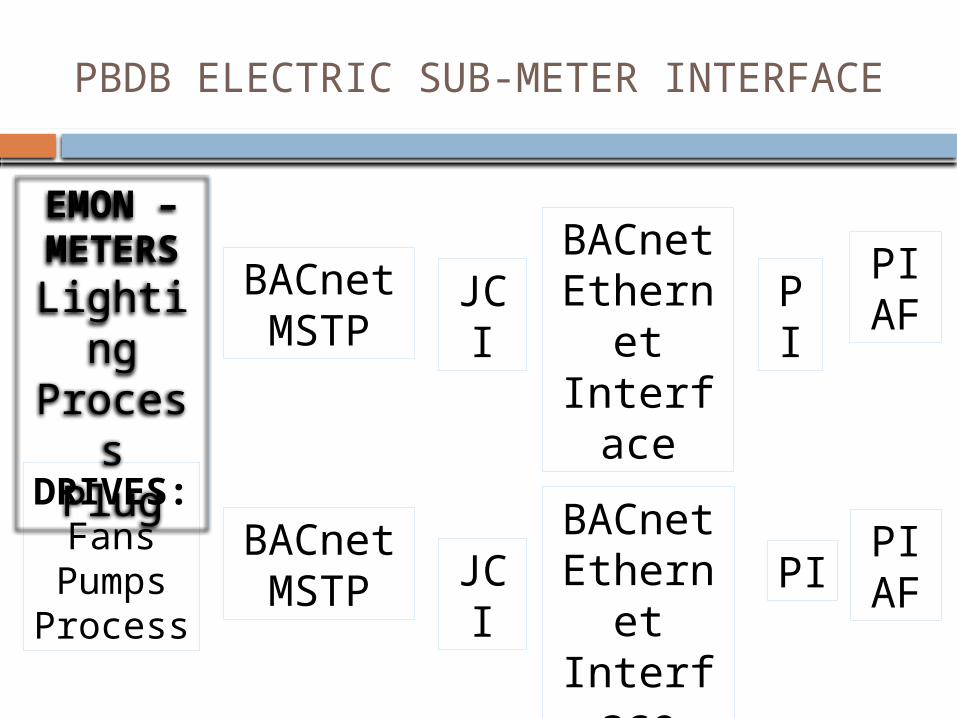
PBDB ELECTRIC SUB-METER INTERFACE
EMON –METERSLightingProcess
Plug
DRIVES: FansPumpsProcess
PI AF
BACnet Etherne
tInterfac
e
JCI
JCIBACnet Etherne
tInterfac
e
BACnet MSTP
BACnet MSTP
PI AF
PI
PI
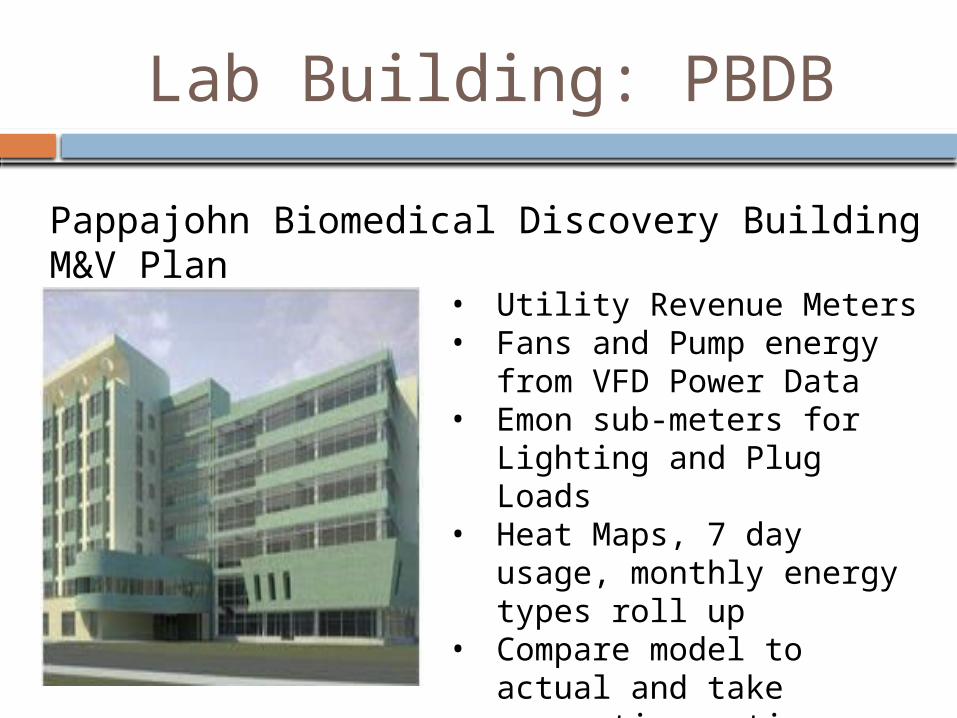
Lab Building: PBDB
Pappajohn Biomedical Discovery Building M&V Plan
• Utility Revenue Meters• Fans and Pump energy
from VFD Power Data• Emon sub-meters for
Lighting and Plug Loads• Heat Maps, 7 day usage,
monthly energy types roll up
• Compare model to actual and take corrective action as needed
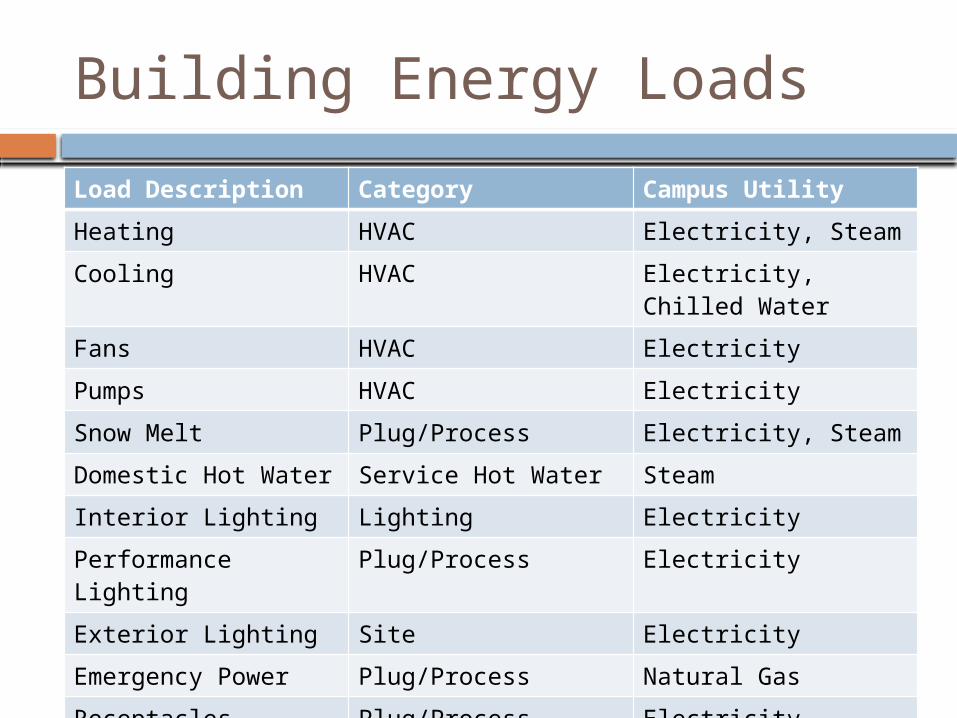
Building Energy Loads
Load Description Category Campus Utility
Heating HVAC Electricity, Steam
Cooling HVAC Electricity, Chilled Water
Fans HVAC Electricity
Pumps HVAC Electricity
Snow Melt Plug/Process Electricity, Steam
Domestic Hot Water Service Hot Water Steam
Interior Lighting Lighting Electricity
Performance Lighting Plug/Process Electricity
Exterior Lighting Site Electricity
Emergency Power Plug/Process Natural Gas
Receptacles Plug/Process Electricity
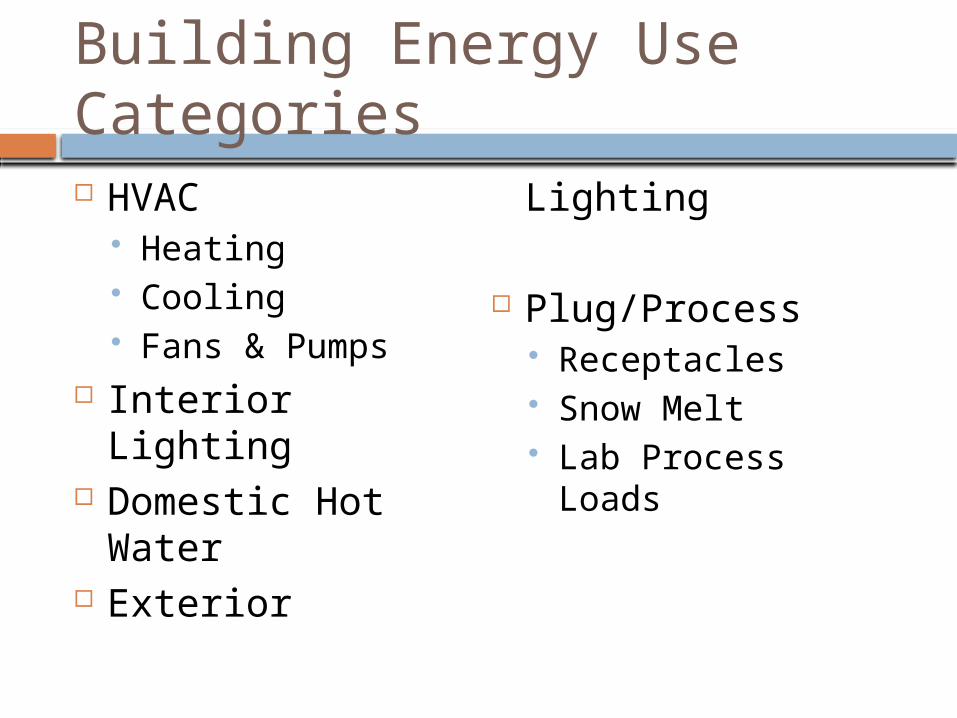
Building Energy Use Categories HVAC
Heating Cooling Fans & Pumps
Interior Lighting Domestic Hot
Water Exterior Lighting
Plug/Process Receptacles Snow Melt Lab Process Loads
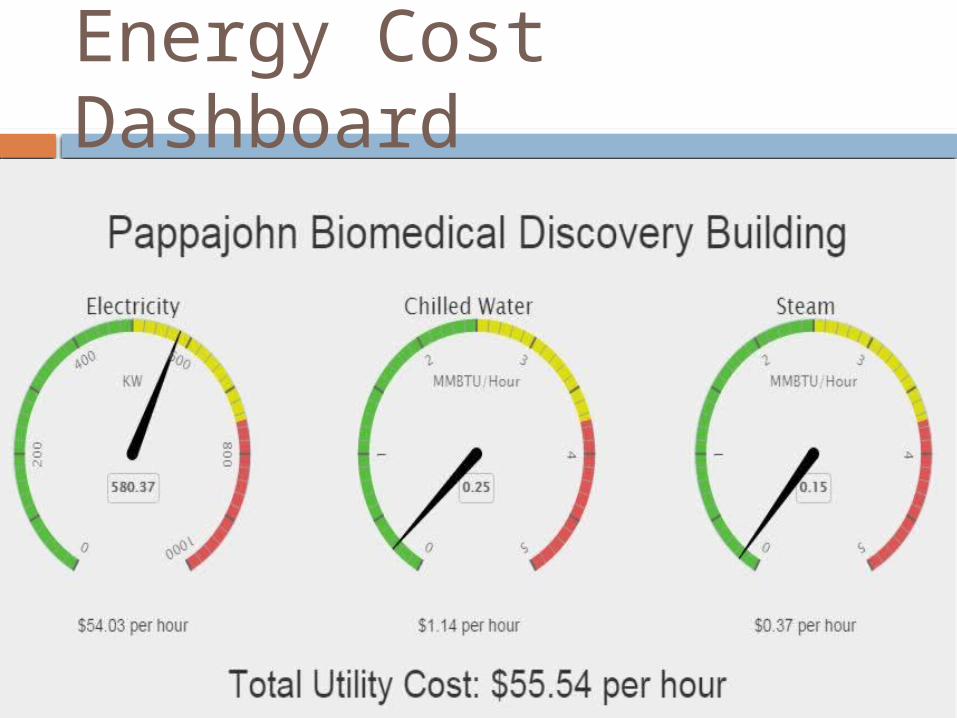
Energy Cost Dashboard
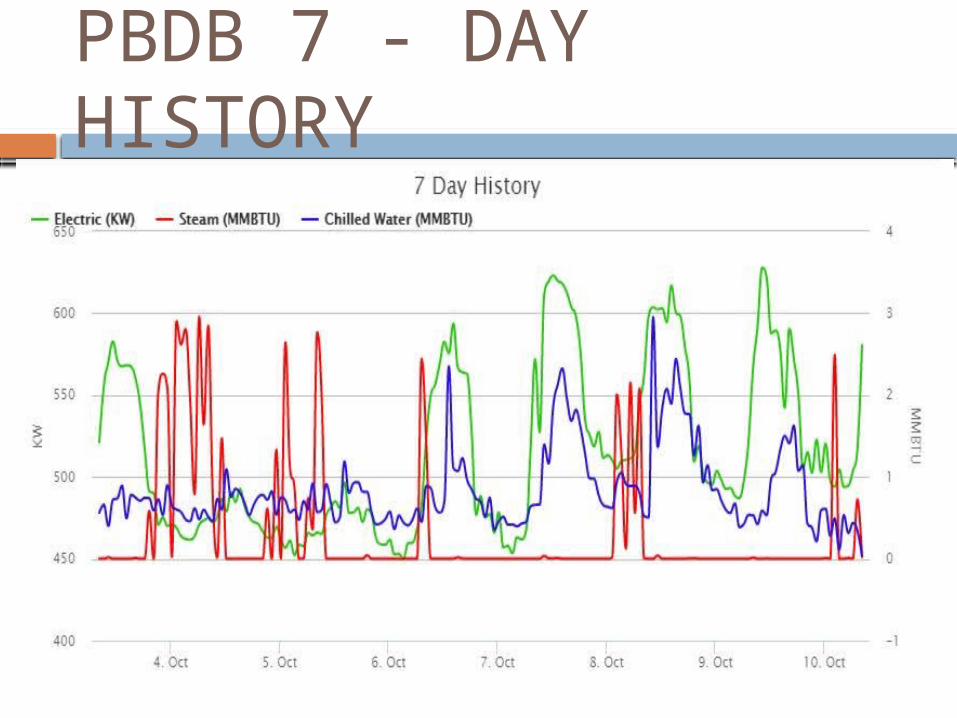
PBDB 7 - DAY HISTORY
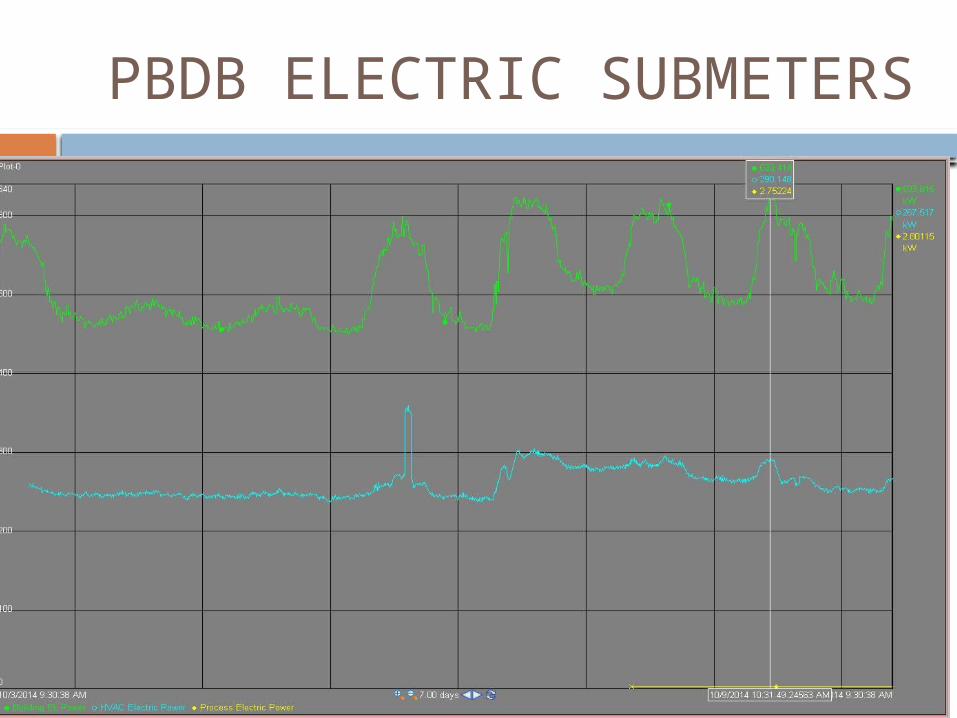
PBDB ELECTRIC SUBMETERS
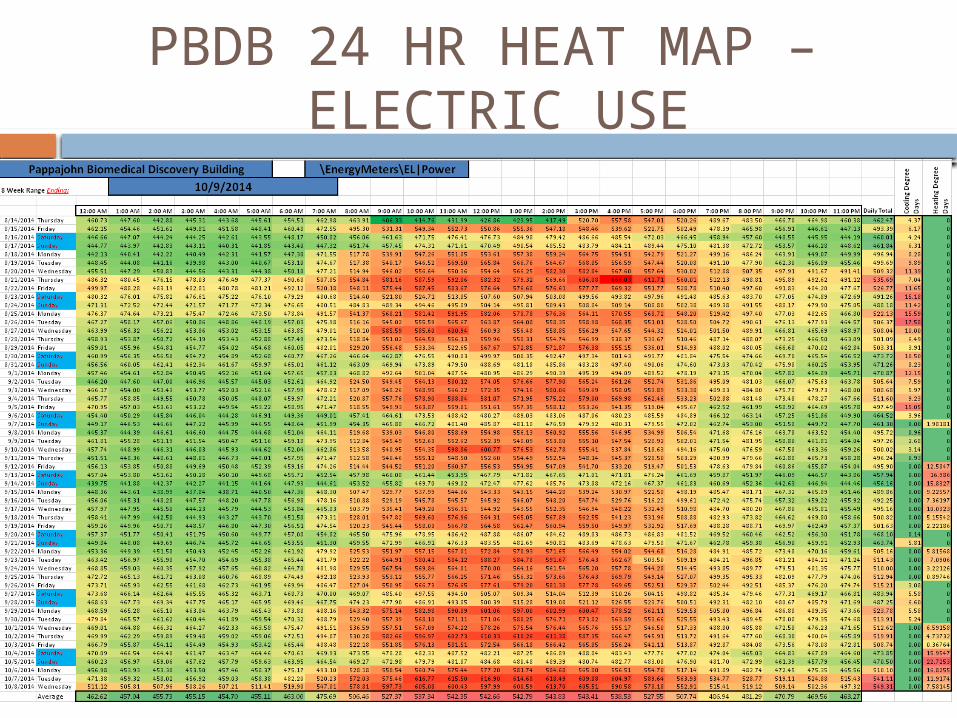
PBDB 24 HR HEAT MAP – ELECTRIC USE
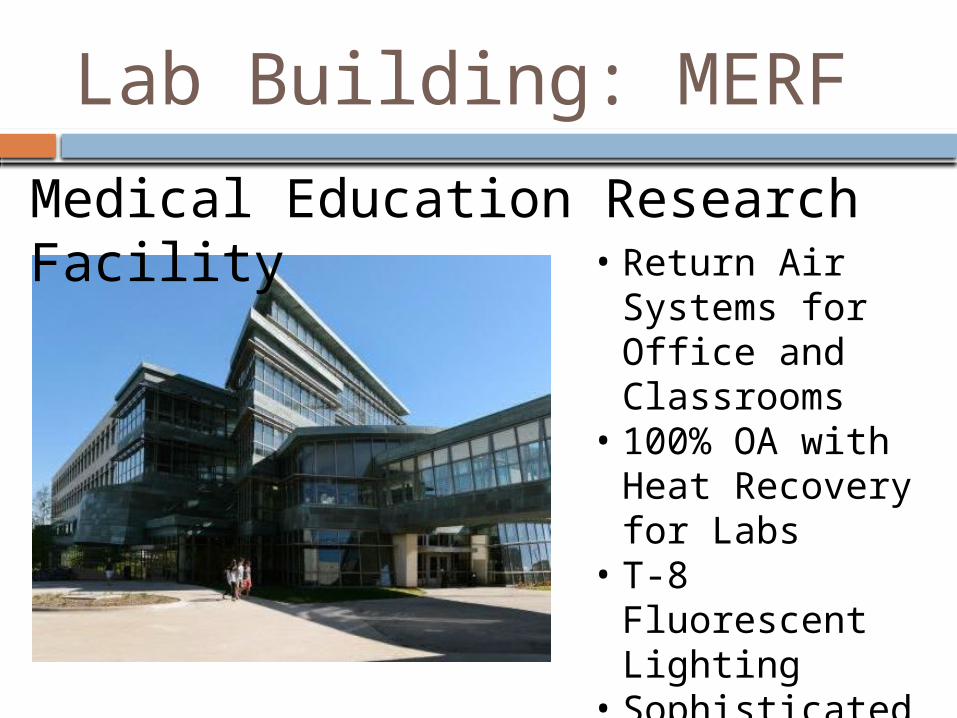
Lab Building: MERF
Medical Education Research Facility • Return Air
Systems for Office and Classrooms
• 100% OA with Heat Recovery for Labs
• T-8 Fluorescent Lighting
• Sophisticated BAS System
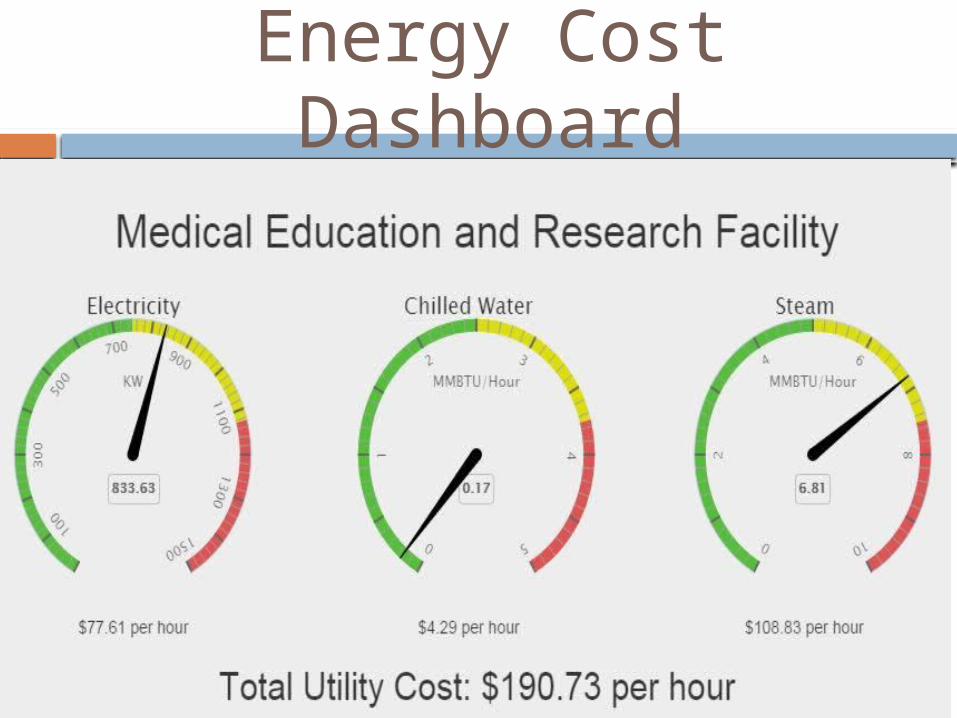
Energy Cost Dashboard
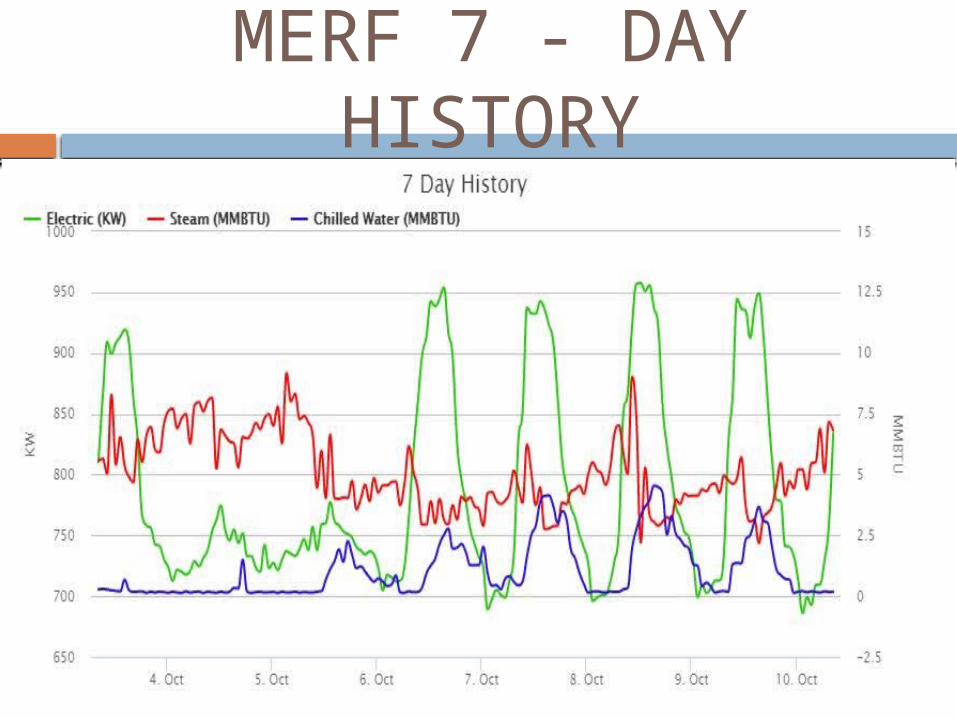
MERF 7 - DAY HISTORY
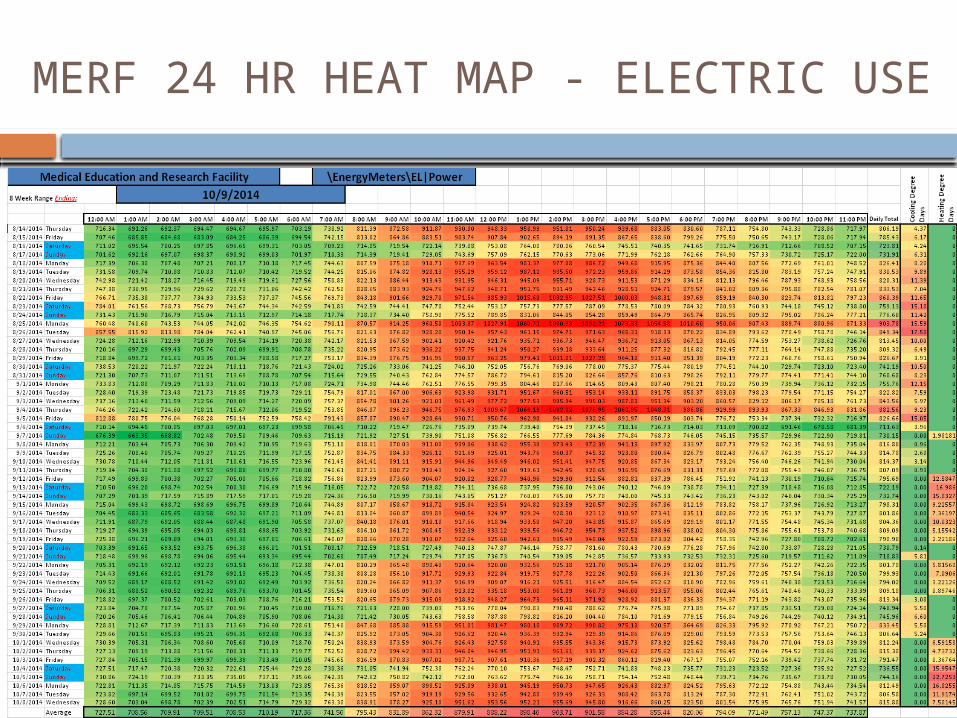
MERF 24 HR HEAT MAP - ELECTRIC USE

Questions
Dwight SchummManaging Principal
Design [email protected]
Janet RazbadouskiEnergy Engineer
University of IowaFacilities [email protected]


