Endemic Selenium Intoxication of Humans in China
10
872 Special Article Endemic selenium intoxication of humans in China1 Guangqi Yang,2 Shuzhen Wang,3 Ruihua Zhou,3 and Shuzhuang Sun3 ABSTRACT An endemic disease was discovered in 1961 in parts of the population of Enshi County, Hubei Province of the People’s Republic of China. During the years of the highest prevalence, from 1961 to 1964, the morbidity was almost 50% in the 248 inhabitants of the five most heavily affected villages; its cause was determined to be selenium intoxication. The most common sign of the poisoning was loss of hair and nails. In areas of high incidence, lesions of the skin, nervous system, and possibly teeth may have been involved. A case is reported of a middle- aged, female hemiplegic, whose illness and death apparently were related to selenosis. Daily dietary intakes of selenium, estimated after the peak prevalence had subsided, averaged 4.99 (range 3.20 to 6.69) mg and hair and blood selenium levels averaged 32.2 and 3.2 pg/ml, respectively. Up to l000x differences occurred when selenium contents of vegetables, cereals, scalp hair, blcod, and urine from the selenosis areas were compared with those from Keshan disease (selenium deficiency) areas. The ultimate environmental source of selenium was a stony coal of very high selenium content (average more than 300 xg/g; one sample exceeded 80,000 j.tg/g). Selenium from the coal entered the soil by weathering and was available for uptake by crops because of the traditional use oflime as fertilizer in that region. This particular outbreak of human selenosis was due to a drought that caused failure of the rice crop, forcing the villagers to eat more high-selenium vegetables and maize and fewer protein foods. Am J Cliii Nutr 1983;37:872-881. KEY WORDS Selenium toxicity in man, human selenosis, seleniferous foods, endemic sele- nium poisoning Introduction The first description of an animal disease now known to be selenium poisoning was that of Marco Polo during his travels in West China in 1295, but subsequent reports of selenosis in China have not appeared. In Enshi County of Hubei Province (Fig 1) an endemic human disease of unknown origin, characterized by loss of hair and nails, ap- peared more than 20 yr ago (1) and reached a peak prevalence during the years 1961 to 1964. The average incidence in five heavy prevalence villages with 248 inhabitants was 49.2%. In the most severely affected village, incidence reached 82.5%, and only one el- derly man of 82 yr and three breast-fed in- fants were unaffected. All residents were evacuated from their homes to nearby places of safety; they recovered as soon as their diets were changed, except those with symptoms of the nervous system who needed a longer time. Research showed that the corn from this area was toxic. Because of a pink coloration in the tip of the corn embryo and of fungus spores in the seed, fungal intoxication was I From the Department of Nutrition and Food Hy- giene, Institute of Health, Chinese Academy of Medical Sciences, Beijing, People’s Republic of China. 2 Professor of Nutrition, Institute of Health Chinese Academy of Medical Science. 3 Present address: Institute of Health, Chinese Acad- emy of Medical Science 29 Han Wei Road, Beijing, China. Received August 27, 1982. Accepted for publication December 14, 1982. The American Journal ofClinical Nutrition 37: MAY 1983, pp 872-881. Printed in USA © 1983 American Society for Clinical Nutrition by on November 23, 2009 www.ajcn.org Downloaded from
Transcript of Endemic Selenium Intoxication of Humans in China
872
Special Article
Endemic selenium intoxication of humans inChina1
Guangqi Yang,2 Shuzhen Wang,3 Ruihua Zhou,3 and Shuzhuang Sun3
ABSTRACT An endemic disease was discovered in 1961 in parts of the population of Enshi
County, Hubei Province of the People’s Republic of China. During the years of the highest
prevalence, from 1961 to 1964, the morbidity was almost 50% in the 248 inhabitants of the five
most heavily affected villages; its cause was determined to be selenium intoxication. The most
common sign of the poisoning was loss of hair and nails. In areas of high incidence, lesions of the
skin, nervous system, and possibly teeth may have been involved. A case is reported of a middle-
aged, female hemiplegic, whose illness and death apparently were related to selenosis. Daily dietary
intakes of selenium, estimated after the peak prevalence had subsided, averaged 4.99 (range 3.20
to 6.69) mg and hair and blood selenium levels averaged 32.2 and 3.2 pg/ml, respectively. Up to
l000x differences occurred when selenium contents of vegetables, cereals, scalp hair, blcod, and
urine from the selenosis areas were compared with those from Keshan disease (selenium deficiency)
areas. The ultimate environmental source of selenium was a stony coal of very high selenium
content (average more than 300 xg/g; one sample exceeded 80,000 j.tg/g). Selenium from the coal
entered the soil by weathering and was available for uptake by crops because of the traditional use
oflime as fertilizer in that region. This particular outbreak of human selenosis was due to a drought
that caused failure of the rice crop, forcing the villagers to eat more high-selenium vegetables and
maize and fewer protein foods. Am J Cliii Nutr 1983;37:872-881.
KEY WORDS Selenium toxicity in man, human selenosis, seleniferous foods, endemic sele-
nium poisoning
Introduction
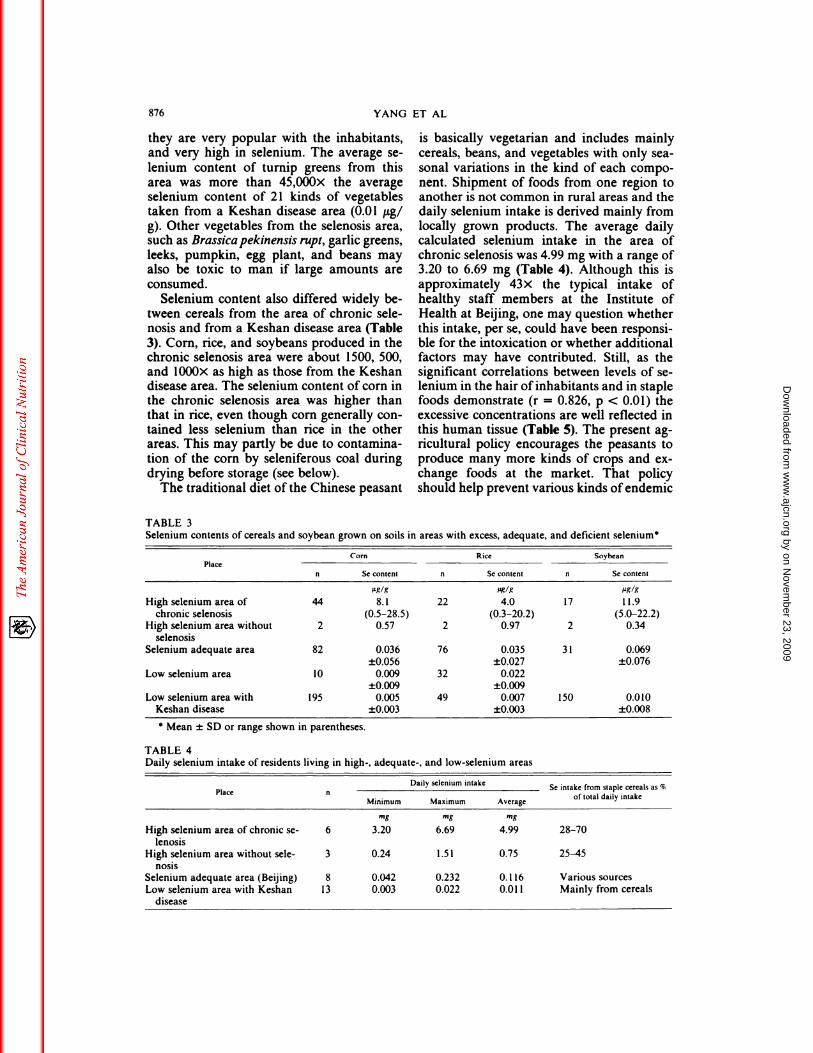
The first description of an animal diseasenow known to be selenium poisoning was
that of Marco Polo during his travels in WestChina in 1295, but subsequent reports ofselenosis in China have not appeared. InEnshi County of Hubei Province (Fig 1) anendemic human disease of unknown origin,characterized by loss of hair and nails, ap-peared more than 20 yr ago (1) and reacheda peak prevalence during the years 1961 to1964. The average incidence in five heavyprevalence villages with 248 inhabitants was49.2%. In the most severely affected village,incidence reached 82.5%, and only one el-derly man of 82 yr and three breast-fed in-fants were unaffected. All residents were
evacuated from their homes to nearby placesof safety; they recovered as soon as their dietswere changed, except those with symptoms ofthe nervous system who needed a longer time.
Research showed that the corn from this
area was toxic. Because of a pink colorationin the tip of the corn embryo and of fungusspores in the seed, fungal intoxication was
I From the Department of Nutrition and Food Hy-
giene, Institute of Health, Chinese Academy of Medical
Sciences, Beijing, People’s Republic of China.2 Professor of Nutrition, Institute of Health Chinese
Academy of Medical Science.
3 Present address: Institute of Health, Chinese Acad-
emy of Medical Science 29 Han Wei Road, Beijing,
China.Received August 27, 1982.
Accepted for publication December 14, 1982.
The American Journal ofClinical Nutrition 37: MAY 1983, pp 872-881. Printed in USA
© 1983 American Society for Clinical Nutrition
by on Novem
ber 23, 2009 w
ww
.ajcn.orgD
ownloaded from

FIG 1. Distribution of Keshan Disease (KD) and location of endemic selenosis (Enshi county) in China. (The
distribution of KD is after Tan Jianan, et al Acta Geograph Sinica 1979;34:85.)
SELENIUM INTOXICATION IN CHINA 873
Humus in soil was extracted with pyrophosphate
buffer in a boiling water bath and the amount was
suggested as the cause of the disease (Collab-orative Group of Enshi Region, unpublishedobservations). Later work from our labora-tory, however, demonstrated that the toxicant
in the corn was selenium (1). The pink colorindicated the presence of elemental selenium.Since it had not been established whether
humans living in this seleniferous area devel-oped a toxicosis of defmed signs, a collabo-rative field study was carried out with the
Antiepidemic Station and People’s Hospitalof the Enshi Region (Beijing Enshi Collabo-rative Survey Group, unpublished observa-tions). This survey enabled us to obtain moreinformation about the selenium status of res-idents in this area and the circumstances con-tributing to the outbreak of this intoxication.
It thus appears that two endemic humandiseases associated with selenium occur inChina. The first, described elsewhere, is acardiomyopathy known as Keshan diseaseand is associated with selenium deficiency (2,3). The second, described here, is associatedwith selenium intoxication and forms the
basis of this report.
Experimental
Selenium analysis
Samples obtained in 1966 were analyzed by the
method of distillation and titration (4). The rest of the
samples were analyzed by the microfluorometric tech-
nique of Watkinson (5) with some modifications. Blood,
hair, urine, water, and soil were digested in a mixture of
sulfuric acid, perchloric acid, and sodium molybdate.Grains and vegetables were digested in a mixture of
sulfuric, perchloric, and nitric acids. After digestion, 10%
hydrochloric acid was added to samples from the sele-
niferous area to reduce all hexavalent selenium to tetra-
valent; however, results for grain and most vegetable
samples from nonseleniferous areas were comparablewhether hydrochloric acid was added or not. For water
samples, hydrochloric acid must be added after digestion
for complete reduction before determination of total
selenium content. When 2,3-diaminonaphthalene was
used in the reaction Se�4 as well as Se� content in
ordinary water samples containing small amounts of
organic matter could be measured differentially, depend-ing on the addition or omission of hydrochloric acid. In
soil samples, water-soluble selenium was extracted with
deionized water on a boiling water bath.
Estimation of humus content
by on Novem
ber 23, 2009 w
ww
.ajcn.orgD
ownloaded from

874 YANG ET AL
calculated from the quantity of potassium dichromate
reduced (6).
Dietary selenium intake
Two kinds of sites in the seleniferous area were sur-
veyed. One was a high-selenium area where selenosis
was common in livestock and signs of selenosis in partic-
ular deformation of nails sometimes occurred in humans.
The other was a high selenium area in which selenosis
has never appeared in either humans or livestock. After
information was obtained regarding the dietary habits of
the subjects observed, typical staple cereals and vegeta-
bles were collected from each family for selenium anal-
ysis and the daily dietary selenium intake was calculated.
Results
Human selenium intoxication during peak
prevalence
The tissues most affected during the time
of heavy prevalence were hair, fmger and toenails, skin, possibly teeth, and the nervoussystem. Selenosis was diagnosed by loss ofhair and nails.
Loss of hair and nails. The hair becomesdry and brittle and is easily broken off at the
scalp. The appearance of a rash on the scalpis associated with intolerable itching. Usually
hair can be removed by hard scratching.When hair is broken off, the radicles remainintact so that the hair continues to grow. Hairmay also be lost from the brow, beard, armpit, and pubic area. New hair is always de-pigmented and loses its luster; sometimes theends are forked.
The nails (Fig 2) become brittle, and white
spots and longitudinal streaks appear on thesurface, followed by a break on the wall of
the nail. Thumbs are always affected first. As
FIG 2. Loss of nails of patients during peak preva-
lence.
new growth continues, the broken nail is
pushed forward and finally drops off. Thisprocess may require 1 month to complete. In
many cases, fluid effuses from the skinaround the nail. In those cases, a much longerperiod is needed to finish the whole process.The new nail is fragile and thickened, and its
surface is rough and stripped. Repeated at-tacks may result in acropachia (clubbing of
the fingers).Skin lesions. Skin lesions occur mainly on
the four limbs, ie, the back of hands and feet,the outer side oflegs and thighs, the forearms
and the back of the neck. Affected skin be-comes red and swollen and then blistered anderuptive. In some cases ulcerations follow
that take a long time to heal. Reddish pig-
mentation of the skin usually remains andgooseflesh may be left on the neck and thighs.
Tooth decay. Nearly one-third of 66 caseshad mottled teeth and in a few cases the teethwere erosive or had pits. Since there was some
fluorosis reported in this area, it could not bedecided whether the tooth damage was
caused by the fluoride or selenium alone orby a combination of the two. However, there
is some evidence (7) from a number of studiesthat excessive exposure to selenium increasesdental caries in men and animals.
Nervous system. Abnormalities of the ner-
vous system were observed only in one heav-ily affected village with 18 cases of selenosisamong 22 inhabitants. Initially the patientsmay complain of peripheral anesthesia, “pins
and needles,” acroparaesthesia, and pain inthe extremities. Hyperreflexia of the tendon
is common, and then numbness, convulsions,paralysis, motor disturbance, and even hemi-plegia may develop. It is likely that all clinicalneurological signs are due to polyneuritiscaused by intoxication. Among those 18 pa-tients, three had paresthesia and one hemi-plegic died. Disturbances of the digestivetract usually accompanied this type of intox-ication.
Case report. The hemiplegic was a female
in her 40s. The hemiplegia progressed slowlyand involved both motor and sensory abnor-malities. Initially she had a sour taste, loss of
appetite, bad headaches, dizziness, vertigo,peripheral anesthesia, and numbness in ad-dition to pain in her scalp and fmgers. Gen-eral muscle weakness and an increased ten-don reflex were present early. Her mental
by on Novem
ber 23, 2009 w
ww
.ajcn.orgD
ownloaded from

SELENIUM INTOXICATION IN CHINA 875
TABLE 1Selenium levels of hair, blood, and urine of residents living in high-, adequate- and low-selenium areas*
Place
Hair Blood Urine
n Se content n Se content n Se content
i-ig/g �tg/ml �zg/ml
High selenium area of 65 32.2 72 3.2 17 2.68
chronic selenosis (4. 1-100) (I .3-7.5) (0.88-6.63)
High selenium area without 14 3.7 14 0.44 14 0.14
selenosis (1 .9-8.2) (0.35-0.58) (0.04-0.33)
Selenium adequate area 1745 0.36
±0.17
1 1 1 0.095
±0.091
19 0.026
±0.012
Low selenium area 40 0. 16
±0.04
40 0.027
±0.009Low selenium area with Kes- 1478 0.074 173 0.021 43 0.007
han disease ±0.050 ±0.010 ±0.001
* Mean ± SD or range shown in parentheses.
status was diminished. No autopsy was per-
formed so the actual cause of the hemiplegiacould not be determined. No clinical historyof her previous background of illness wasavailable.
Selenium status of residents in areas ofchronic selenosis during sampling in 1966,
1978, and 1979 after the peak prevalence had
subsided
Selenium levels in hair, blood, and urine.The average hair selenium content of resi-dents in the high selenium area with chronicselenosis was about eight times that in thehigh selenium area without selenosis, lOOxthat in the selenium adequate area, and 400xthat in the Keshan disease area. The samples
from the last area were collected from 1972to 1981 (Table 1). One hair sample from the
chronic selenosis area that reached a value of100 �.tg/g was thought to be contaminated bycoal smoke (see below).
The blood selenium levels in the high se-lenium area of chronic selenosis were mark-edly elevated, even after the peak prevalenceof the disease. The average concentration was
about 30x that in the selenium adequate areaand l6Ox that in the Keshan disease area.The highest value, 7.5 ig/ml, exceeds thecritical level our experimental animals cantolerate and is about l000x as high as theaverage value, 0.008 �tg/ml, in a certain Kes-
han disease area (Shanxi province). Such ex-tremely high values suggest the possibility ofan adaptive mechanism in humans exposedto high selenium intakes. Adaptation of mi-
croorganisms and rats to higher levels of se-
TABLE 2
Selenium content of vegetables from the high selenium
area of chronic selenosis*
Vegetable Selenium content
i.�g/g
Brassica pekinensis rupt 36.4 (5.8-72.2)Turnip 12.0
Turnip, green 457 (24, 891)
Red pepper 22.8 (5.8-40.6)
Garlic, green 44.8 (8.3, 81.4)
Chinese onion 22.9 (12.4-29.8)
Leeks 63.0
Colza, large 3.7
Carrot 11.8
Carrot, green 24.2
Egg plant 38.3
Pumpkin 33.2 (6.3, 60.0)
Ginger, foreign 7.8 (3.4-13.2)
Flat bean 37.2
Cow pea, fresh 23.8 (2.0-47.5)
String bean 28.2
Sweet potato 9.2 (3.2-15.1)
Potato 2.0 (0.3-5.0)
* Dry basis; values of two samples or range shown in
parentheses.
lenium has already been reviewed by Lev-
ander (8).As was the case for hair and blood, the
urinary selenium content tended to reflect thedegree of selenium exposure in differentareas.
Selenium levels infoods and total diet. Veg-etables taken from the area of chronic sele-nosis contained large amounts of selenium
(Table 2). The selenium level in a given spe-cies of vegetable sampled from different lo-cations varied greatly. Turnip greens weresuspected as especially important in this par-ticular episode of human selenosis, because
by on Novem
ber 23, 2009 w
ww
.ajcn.orgD
ownloaded from
876
they are very popular with the inhabitants,
and very high in selenium. The average se-lenium content of turnip greens from this
area was more than 45,000x the averageselenium content of 2 1 kinds of vegetablestaken from a Keshan disease area (0.01 �tg/g). Other vegetables from the selenosis area,such as Brassicapekinensis rupt, garlic greens,leeks, pumpkin, egg plant, and beans mayalso be toxic to man if large amounts areconsumed.
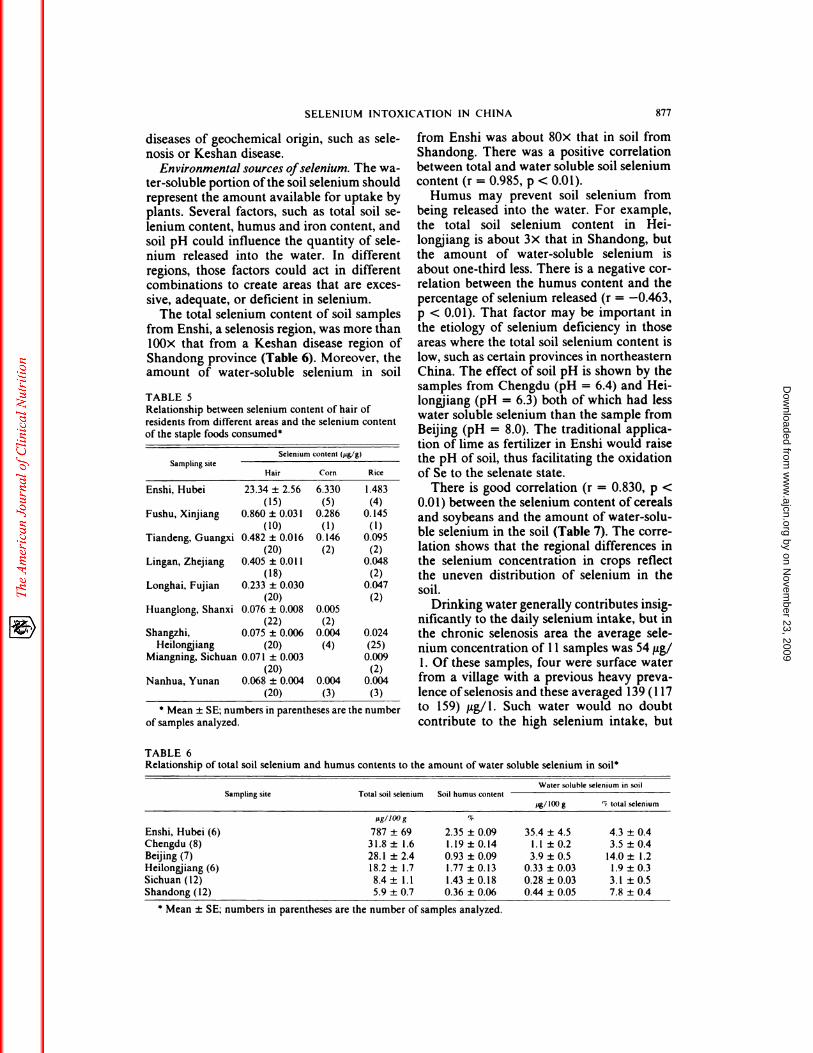
Selenium content also differed widely be-tween cereals from the area of chronic sele-nosis and from a Keshan disease area (Table
3). Corn, rice, and soybeans produced in thechronic selenosis area were about 1500, 500,and l000x as high as those from the Keshandisease area. The selenium content of corn inthe chronic selenosis area was higher thanthat in rice, even though corn generally con-tamed less selenium than rice in the otherareas. This may partly be due to contamina-
tion of the corn by seleniferous coal duringdrying before storage (see below).
The traditional diet of the Chinese peasant
TABLE 3
YANG ET AL
is basically vegetarian and includes mainly
cereals, beans, and vegetables with only sea-
sonal variations in the kind of each compo-nent. Shipment of foods from one region toanother is not common in rural areas and thedaily selenium intake is derived mainly fromlocally grown products. The average daily
calculated selenium intake in the area ofchronic selenosis was 4.99 mg with a range of3.20 to 6.69 mg (Table 4). Although this is
approximately 43x the typical intake ofhealthy staff members at the Institute ofHealth at Beijing, one may question whether
this intake, per se, could have been responsi-
ble for the intoxication or whether additionalfactors may have contributed. Still, as thesignificant correlations between levels of se-lenium in the hair of inhabitants and in staplefoods demonstrate (r = 0.826, p < 0.01) the
excessive concentrations are well reflected inthis human tissue (Table 5). The present ag-ricultural policy encourages the peasants toproduce many more kinds of crops and ex-
change foods at the market. That policy
should help prevent various kinds of endemic
Selenium contents of cereals and soybean grown on soils in areas with excess, adequate, and deficient selenium*
Corn Rice
Placen Se content n Se content
Soybean
n Se content
,Lg/g p�/g ;Lg/g
High selenium area of 44 8.1 22 4.0
chronic selenosis (0.5-28.5) (0.3-20.2)
High selenium area without 2 0.57 2 0.97
selenosis
17 11.9
(5.0-22.2)
2 0.34
Selenium adequate area 82 0.036 76 0.035
±0.056 ±0.027
3 1 0.069
±0.076
Low selenium area 10 0.009 32 0.022
±0.009 ±0.009
Low selenium area with 195 0.005 49 0.007 150 0.010Keshan disease ±0.003 ±0.003 ±0.008
S Mean ± SD or range shown in parentheses.
TABLE 4Daily selenium intake of residents living in high-, adequate-, and low-selenium areas
Daily selenium intake
Place n � � .Minimum Maximum Average
.Se intake from staple cereals as %
.of total daily intake
“ig mg mg
High selenium area of chronic se- 6 3.20 6.69 4.99
lenosis
28-70
High selenium area without sele- 3 0.24 1.51 0.75
nosis
25-45
Selenium adequate area (Beijing) 8 0.042 0.232 0.1 16
Low selenium area with Keshan 13 0.003 0.022 0.01 1
disease
Various sources
Mainly from cereals
by on Novem
ber 23, 2009 w
ww
.ajcn.orgD
ownloaded from
SELENIUM INTOXICATION IN CHINA 877
* Mean ± SE; numbers in parentheses are the number of samples analyzed.
diseases of geochemical origin, such as sele-nosis or Keshan disease.
Environmental sources ofselenium. The wa-ter-soluble portion ofthe soil selenium shouldrepresent the amount available for uptake byplants. Several factors, such as total soil se-
lenium content, humus and iron content, and
soil pH could influence the quantity of sele-nium released into the water. In different
regions, those factors could act in differentcombinations to create areas that are exces-sive, adequate, or deficient in selenium.
The total selenium content of soil samples
from Enshi, a selenosis region, was more thanlOOx that from a Keshan disease region ofShandong province (Table 6). Moreover, theamount of water-soluble selenium in soil
TABLE 5Relationship between selenium content of hair of
residents from different areas and the selenium content
of the staple foods consumed
Selenium
Sampling site
Hair
content (i&Jg)
Corn Rice
Enshi, Hubei 23.34 ± 2.56 6.330 1.483
(15) (5) (4)
Fushu, Xinjiang 0.860 ± 0.03 1 0.286 0.145
(10) (1) (1)
Tiandeng, Guangxi 0.482 ± 0.016 0.146 0.095
(20) (2) (2)
Lingan, Zhejiang 0.405 ± 0.01 1 0.048
(18) (2)
Longhai, Fujian 0.233 ± 0.030 0.047
(20) (2)
Huanglong, Shanxi 0.076 ± 0.008 0.005
(22) (2)
Shangzhi, 0.075 ± 0.006 0.004 0.024
Heilongjiang (20) (4) (25)
Miangning, Sichuan 0.071 ± 0.003 0.009
(20) (2)
Nanhua, Yunan 0.068 ± 0.004 0.004 0.004
(20) (3) (3)
* Mean ± SE; numbers in parentheses are the number
of samples analyzed.
from Enshi was about 80x that in soil fromShandong. There was a positive correlationbetween total and water soluble soil seleniumcontent (r = 0.985, p < 0.01).
Humus may prevent soil selenium frombeing released into the water. For example,
the total soil selenium content in Hei-longjiang is about 3x that in Shandong, butthe amount of water-soluble selenium is
about one-third less. There is a negative cor-relation between the humus content and thepercentage of selenium released (r = -0.463,p < 0.01). That factor may be important inthe etiology of selenium deficiency in thoseareas where the total soil selenium content islow, such as certain provinces in northeastern
China. The effect of soil pH is shown by thesamples from Chengdu (pH = 6.4) and Hei-longjiang (pH = 6.3) both of which had lesswater soluble selenium than the sample fromBeijing (pH = 8.0). The traditional applica-
tion of lime as fertilizer in Enshi would raisethe pH of soil, thus facilitating the oxidation
of Se to the selenate state.There is good correlation (r = 0.830, p <
0.01) between the selenium content of cereals
and soybeans and the amount of water-solu-ble selenium in the soil (Table 7). The corre-lation shows that the regional differences inthe selenium concentration in crops reflectthe uneven distribution of selenium in thesoil.
Drinking water generally contributes insig-nificantly to the daily selenium intake, but inthe chronic selenosis area the average sele-
nium concentration of 1 1 samples was 54 .tg/1 . Of these samples, four were surface waterfrom a village with a previous heavy preva-
lence ofselenosis and these averaged 139 (1 17to 159) �tg/l. Such water would no doubt
contribute to the high selenium intake, but
TABLE 6Relationship of total soil selenium and humus contents to the amount of water soluble selenium in soil
Sampling site Total soil selenium Soil humus content
Water soluble selenium in soil
pg./lOOg ‘� total selenium
;�g/Ioog %
Enshi, Hubei (6) 787 ± 69 2.35 ± 0.09 35.4 ± 4.5 4.3 ± 0.4Chengdu (8) 31.8 ± 1.6 1.19 ± 0.14 1.1 ± 0.2 3.5 ± 0.4
Beijing (7) 28.1 ± 2.4 0.93 ± 0.09 3.9 ± 0.5 14.0 ± 1.2Heilongjiang (6) 18.2 ± 1.7 1.77 ± 0.13 0.33 ± 0.03 1.9 ± 0.3
Sichuan (12) 8.4 ± 1.1 1.43 ± 0.18 0.28 ± 0.03 3.1 ± 0.5Shandong (12) 5.9 ± 0.7 0.36 ± 0.06 0.44 ± 0.05 7.8 ± 0.4
by on Novem
ber 23, 2009 w
ww
.ajcn.orgD
ownloaded from

TABLE 7
Relationship between amount of water soluble selenium in soil and selenium content of crops grown thereon*
Sampling site
Selenium content in soil Selenium content of crops
Total Water soluble Corn Wheat Rice Soybean
i.ig/IOOg iig/IO(ig
Enshi 787 35.4 633
(5)148
(4)Chengdu 31.8 1.1 1.36 6.06 ± 1.01 2.99 ± 0.24 3.48
Beinjing
Heilongjiang
Sichuan
28.1 3.9
18.2 0.33
8.4 0.28
(2)
2.26 ± 0.21
(7)0.36 ± 0.02
(76)
0.32 ± 0.04
(16)
(4) (4)
3.82 ± 0.66 4.12 ± 0.31
(7) (11)0.61 ± 0.06 2.26 ± 0.19
(21) (26)
0.59 ± 0.07 0.57 ± 0.05
(20) (18)
(2)
7.58 ± 1.37
(6)
0.77 ± 0.06
(54)
0.61 ± 0.04
(24)Shandong
* Mean ± SE;
5.9 0.44
numbers in parentheses are
0.98 ± 0.03
(19)
the number of
1.30 ± 0.09
(21)
samples analyzed.
2.60 ± 0.15
(25)
878 YANG ET AL
drinking water is still far less important asource than the diet. The other seven drinkingwater samples came from a variety of sources
and they averaged only 5 �tg/l. Speciationstudies indicated that selenium in the water
from this region was almost totally in thehexavalent state.
The average selenium content of 10 coalsamples collected from the selenosis area of
China in 1966 was 29 1 �tg/g (range 128 to834; one sample of 3632 was excluded). The
selenium content of another 9 samples col-lected from the same area in 1978 was 367;Lg/g (range 13 to 1332). A tenth sample fromthe 1978 survey assayed 84, 123 �tg/g. In ajoint China-USA collaborative seleniumanalysis, that sample was sent to Prof OscarE Olson’s laboratory in South Dakotathrough the help of Dr OA Levander inBeltsville, MD and assayed 92,800 j�g/g. Toour knowledge, such a high content of sele-nium in coal has never previously been re-ported. The selenium content of coal samplesin the USA generally runs between 1 and 2;zg/g (9). The seleniferous coals from Enshiclearly have great potential for contaminatingthe environment. The distribution of sele-nium in coal beds in that area is never uni-form and varies not only from place to placebut also from bed to bed. In this region theselenium usually is concentrated in the lowerstony bed of the coal.
Selenosis in livestock
Alkali disease of cattle was not uncommonin the affected area. Pigs frequently showedinflammation of the feet or sloughing of the
TABLE 8Selenium content of animal feedstuffs from the high
selenium area of suspected selenosis*
Feedstuff Selenium content
i-ig/g
Sweet potato leaf 23.3 (7.8, 38.8)
Arstemisia spp 19.9 (2.9, 36.9)
Aster indicus L. 74.4 (20.6, 128.2)Cirsium segetum Bge 86.6Astragalus sunicus L 108 (64.3, 151.6)
Lichen 738
a Dry basis; range shown in parentheses.
hoofs accompanied by loss of body hair. The
selenium content of the hair of an intoxicatedpig was 21.5 �tg/g. Piglets usually wanderedrestlessly in circles, seeming to seek sheltersuch as a cave, and fmally died.
Eggs produced in this area had very lowhatchability. Even if the eggs hatched, theembryos were often deformed with ropyfeathers and without beaks. One sample ofeggs of low hatchability contained 3.6 �ig/gofselenium (wet basis). Poor hatchability andinability to raise piglets seemed to be the mostsensitive parameters for the detection of sel-enosis in this area.
Many of the feedstuffs analyzed containedvery high levels of selenium (Table 8). It isno wonder that selenosis oflivestock occurredfrequently in this area. Lichen had a veryhigh selenium content which supports thesuggestion that this plant tends to concentrateselenium (10).
Selenosis in plants
Although it was suggested that plant injurydue to selenium overexposure would proba-
by on Novem
ber 23, 2009 w
ww
.ajcn.orgD
ownloaded from

SELENIUM INTOXICATION IN CHINA 879
bly not occur under natural conditions (9),
injuries to plants did in fact occur in ourseleniferous area, especially during the heavy
prevalence years. Some leaves of injured soy-beans and tomatoes were mottled with brownspots, and some became chlorotic. Althoughtobacco leaves showed yellow areas on thesurface, the selenium concentration in theblade was not high, one sample containing
5.6 �.tg/g (dry basis). “White seedlings” mightoccur among corn plants. Leaf edges of in-
jured corn usually became discolored andsurfaces showed white streaks and the cornkernels stuck firmly to the cob.
Discussion
This report describes an outbreak of hu-
man selenium poisoning in Enshi County ofHubei Province in the People’s Republic of
China. The signs of human selenosis that weobserved closely resembled those reported by
Smith and coworkers (1 1, 12) in their earliersurveys of rural populations in seleniferousareas of Wyoming, South Dakota, and Ne-
braska in the USA in 1936. Those authorscould not establish a direct relation betweenthe signs they observed in humans and theingestion of large amoungs of selenium be-cause they could not show a defmite associ-ation between clinical signs of individualsand the level of selenium in the urine. The
urinary selenium concentrations reported bySmith and Westfall (11) in South Dakota andNebraska ranged between 0.2 and 1.98 �ig/ml. Even their maximum individual value islower than our mean value of 2.68 �tg/ml.The highest individual urinary selenium levelreported by Jaffe et al ( 13) in a seleniferousarea in Venezuela was 3.9 �.tg/ml which is stillless than the maximum value of 6.63 �ig/mlseen in our high selenium area with chronicselenosis. In our opinion, however, the uri-
nary selenium level varies too much for useas a reliable criterion of selenium exposure.
In previous work we were successful inusing hair and blood selenium levels to dis-
tinguish between populations that were defi-cient or adequate in selenium (see Table 1).
It now seems likely that hair selenium levelcould also be used to test a given population-
for selenium intoxication in seleniferousareas, since the average hair selenium contentdecreased from 32.2 to 3.7 �ig/g as the sam-pling site shifted from a high selenium area
with selenosis to a nearby high selenium area
without selenosis. Blood selenium levels alsoare useful for monitoring endemic selenium
overexposure since they averaged 3.2 and0.44 �tg/ml in high selenium areas with andwithout selenosis, respectively.
Jaffe et al (13) concluded that selenium
excess did not pose a serious health hazardwhen blood and urinary selenium levels of
children in seleniferous areas did not exceed0.813 and 0.636 .tg/ml, respectively. Corre-sponding values in our high-selenium areawithout selenosis were 0.44 (0.35 to 0.58) �tg/
ml for blood and 0. 14 (0.04 to 0.33) �g/ml
for urine. Therefore, we believe that the se-lenium levels in samples of hair, blood, and
urine collected in our high selenium areawithout selenosis were below the upper limit
of safety. Howe (14) recently reported thatthe mean blood selenium levels in 34 different
locations in South Dakota ranged from 0.22
to 0.32 �.tg/ml, which would also fall below
the upper safe limit suggested by Jaffe et al(13).
Previous work by us indicated that theminimum safe hair and blood selenium levelscharacteristic of populations protectedagainst selenium deficiency (Keshan disease)were 0. 16 i.tg/g and 0.027 �.tg/rnl, respectively
(see Table 1). Ifwe assume that the maximumtolerable levels of selenium in hair and blood
were 3.75 ;.tg/g and 0.44 �tg/ml, respectively,
then the ratio of maximum selenium leveltolerated versus minimum selenium level re-quired would be 23 for hair and 16 for blood.Apparently the margin of safety is adequatebetween potentially toxic and nutritionallyrequired levels of selenium.
The average daily selenium intake of adultsin the high selenium area without selenosiswas estimated as 750 � which is about 70xthat in a selenium-deficient area with Keshandisease and more than double the intake
reported in Caracas, Venezuela (15). Undernormal conditions, human selenium poison-
ing caused by ingestion of locally produced,high selenium foods would be rare. The pos-
sibility of selenium deficiency seems morelikely, particularly in those regions where the
amount of available selenium in the soil islow. The data presented here suggest that themargin of safety is adequate for the supple-mentation of deficient diets with moderateamounts of selenium.
To determine the critical intake at which
by on Novem
ber 23, 2009 w
ww
.ajcn.orgD
ownloaded from

880 YANG ET AL
intoxication occurs is more difficult. In our
institute, a male worker, 62 yr old, believingthat selenium would benefit his health, took
one tablet of 2 mg sodium selenite per dayfor more than 2 yr, until he was warned thathe had been intoxicated. He did not have anysymptoms ofindisposition but presented with
thickened, fragile nails, and garlic odor indermat excretions. After he stopped his oral
sodium selenite, the surface of new nailgrowth became smooth and gradually re-
covered. Evidently, an intake of 1 mg Se dailyfrom sodium selenite for a long time is defi-nitely chronically toxic to humans. His bloodand hair selenium concentrations were 0.179and 0.828 ppm on the day he stopped hisselenium intake. Therefore, determination oftissue selenium level alone is not adequate
for the diagnosis of selenosis without differ-
entiation of the forms of selenium ingested.These observations and those of others sug-gest that the behavior of organic selenium isdifferent from inorganic. In our endemicselenosis area deformation of the nail may
appear, and it is reasonable to assume thatthe daily dietary selenium intake of 4.99 mgis chronically toxic. This is five times the
critical level of which selenite-selenium pro-duced familiar types on the case reportedabove. The relation ofthe external signs (hair
and nail loss) in selenosis to pathologicalchanges of other tissues remains to be clari-
fled. Also, potential influences from adapta-tion of the subjects to a high selenium envi-ronment and interactions of the latter withother nutritional and toxic agents require fur-ther study.
The ultimate environmental source of se-lenium in this high selenium area was coal.Weathering, leaching, and possibly biological
action would mobilize selenium from the coalto the soil and thus make it available to thecrops. The traditional use of lime fertilizerwould also render the selenium accumulated
in the soil more readily available to plants.Moreover, the unusually high selenium con-tent of the coal might heavily contaminatethe air or foodstuffs by its smoke and thuscontribute additionally to the selenium intakeof the residents. All of these conditions wereresponsible for the high selenium intakes of
the residents in this seleniferous area, butadditional factors were believed necessary to
account for this particular outbreak of sele-
nosis. For example, the drought at that timeled to a failure of the rice crop which forcedthe villagers to consume more vegetables andmaize instead. The vegetables usually con-tained very high levels of selenium as com-pared with rice (up to 70% of the seleniumintake could have come from vegetables, see
Table 3). Furthermore, maize grown on driedout paddy fields accumulated substantiallymore selenium than the rice crop normallygrown (Table 3). Local peasants used largeamounts of plant ash to increase the yield offarm products during those years; thus it ispossible that considerable amounts of sele-nium could have been returned to and con-centrated in the soil. Finally, the residentsconsumed fewer protein foods because of thecrop failure and therefore would likely bemore sensitive to the toxic action of excessiveselenium intake (16).
The exact extent of this seleniferous region
in China is unknown. During the heavy prey-alence years intoxicated residents were foundonly in six communes. However, anotherseleniferous area north of Enshi was recentlyreported in Ziyang County, Shanxi Province(17). The reported selenium content of somecoal samples in that county was more than30 �.tg/g and the highest hair selenium contentof commune members was 58 �ig/g. The dis-tribution pattern ofisolated seleniferous areasin this region most likely follows the patternofthe coal bed. Do many isolated seleniferousareas exist in this region? If so, why are highselenium foods produced only in a very lim-ited area in Ziyang county in contrast withits more widespread distribution of high se-lenium stony coal? These interesting ques-tions are worthy of study by geologists. a
References
1. Yang GQ. Research on the etiology of an endemic
disease characterized by loss of nails and hair in
Enshi county. A preliminary report to the research
office of the Chinese Academy of Medical Sciences,
March, 1966.
2. Keshan Disease Research Group. Observations on
effect of sodium selenite in prevention of Keshan
disease. Chin Med J 1979;92:47l-6.3. Keshan Disease Research Group. Epidemiologic
studies on the etiologic relationship of selenium and
Keshan disease. Chin Med J 1979;92:477-82.4. Rosenfeld I, Beath OA. Selenium: geobotany, bio-
chemistry, toxicity and nutrition. New York, NY:
Academic Press, 1980.
by on Novem
ber 23, 2009 w
ww
.ajcn.orgD
ownloaded from

SELENIUM INTOXICATION IN CHINA 881
5. Watkinson JH. Fluorometric determination of sele-
nium in biological material with 2,3-diamino-
naphthalene. Anal Chem 1966;38:92-7.
6. Physico-chemical analysis of soil. Nanjing Institute
of Soil, 1978.7. Hadjimarkos DM. Selenium in relation to dental
caries. Food Cosmet Toxicol 1973;ll:1083.
8. Levander OA. Metabolic interrelationships and
adaptations in selenium toxicity. Ann NY Acad Sci1972; 192: 181.
9. Committee on Medical and Biologic Effects of En-
vironmental Pollutants. Selenium. Washington, DC:
National Academy of Sciences, 1976.
10. Reimers E, Gaare E, Skjenneberg S. Selenium con-
tent in lichen in Lapland and South Finland and its
effect on the selenium values in reindeer. Rros,Norway: Proc 2nd Int Reindeer/Caribou Symp,
1979.
11. Smith MI, Westfall BB. Further field studies on theselenium problem in relation to public health. US
Public Health Service Public Health Rep
l937;52: 1375-84.
12. Smith MI, Franke KW, Westfall BB. The selenium
problem in relation to public health. US Public
Health Service Public Health Rep 1936;5 1:1496-505.
13. Jaffe WG, Ruphael MD, Mondragon MC, Cuevas
MA. Biochemical and clinical studies on school chil-
dren in a seleniferous zone. Arch Latinoamer Nutr
1972;22:595-61 1.
14. Howe M. Selenium in the blood of South Dakotans.
Arch Environ Health 1979;36:444-8.
15. Mondragon MC de, Jaffe WG. Ingestion of selenium
in Caracas, compared with some other cities. Arch
Latinoam Nutr 1976;26:341-52.
16. Rosenfeld I, Beath OA. The influence of protein
diets on selenium poisoning I. Am J Vet Res1946;7:52.
17. Chen JE, Mci QJ. A preliminary report of a selenif-
erous area in Ziyang County, Shanxi. Nongye Kexue
1980;6: 17.
by on Novem
ber 23, 2009 w
ww
.ajcn.orgD
ownloaded from