Employer-Sponsored Health Insurance Coverage: · PDF filemedicaid kaiser commission on and...
53
medicaid kaiser commission on uninsured andthe Employer-Sponsored Health Insurance Coverage: Sponsorship, Eligibility, and Participation Patterns in 2001 Prepared by Bowen Garrett, Ph.D. The Urban Institute July 2004
Transcript of Employer-Sponsored Health Insurance Coverage: · PDF filemedicaid kaiser commission on and...
medicaid
kaiser commiss ion o n
uninsureda n d t h e
Employer-Sponsored Health Insurance Coverage: Sponsorship, Eligibility, and Participation Patterns in 2001 Prepared by Bowen Garrett, Ph.D. The Urban Institute July 2004
medicaiduninsureda n d t h e
kaiser commission
The Kaiser Commiss ion on Medicaid and the
Uninsured prov ides in format ion and analys is
on heal th care coverage and access for the
low- income popula t ion , wi th a specia l focus
on Medicaid ’s ro le and coverage o f the
uninsured. Begun in 1991 and based in the
Kaiser Fami ly Foundat ion ’s Washington, DC
of f ice , the Commiss ion is the larges t
opera t ing program of the Foundat ion . The
Commiss ion ’s work is conducted by
Foundat ion s ta f f under the guidance o f a b i -
par t isan group o f na t ional leaders and
exper ts in heal th care and publ ic po l icy.
J a m e s R . T a l l o n
C h a i r m a n
D i a n e R o w l a n d , S c . D .
E x e c u t i v e D i r e c t o r
medicaid
kaiser commiss ion o n
uninsureda n d t h e
Employer-Sponsored Health Insurance Coverage: Sponsorship, Eligibility, and Participation Patterns in 2001 Prepared by Bowen Garrett, Ph.D. The Urban Institute July 2004
This project was funded by the Kaiser Commission on Medicaid and the Uninsured. I owe much gratitude to Cathy Hoffman of the Kaiser Commission for making substantial contributions to the development of this report. I thank Linda Blumberg and John Holahan for many helpful comments and Len Nichols and Emily Greenman, my coauthors on a prior report, for allowing me to draw in various ways from our earlier work. I thank Emerald Adams, Stacey McMorrow, and Marie Wang for expert research assistance. I am solely responsible for any remaining errors. The views expressed are my own and should not be attributed to the Urban Institute, its trustees, or its funders.
Contents
Executive Summary...............................................................................................................1
Introduction............................................................................................................................6
About the Estimates...............................................................................................................6
Findings .................................................................................................................................7
Demographic Characteristics of Uninsured Workers ......................................................7
Employment Characteristics of Uninsured Workers .......................................................11
Characteristics of Uninsured Self-Employed Workers....................................................13
ESI Sponsorship, Eligibility, Take-Up, and Coverage Rates ..........................................14
ESI Sponsorship, Eligibility, Take-Up, and Coverage Rates by Worker Demographic
Characteristics .................................................................................................................14
ESI Sponsorship, Eligibility, Take-Up, and Coverage Rates by Employment
Characteristics .................................................................................................................17
Reasons Why Some Workers Are Uninsured..................................................................19
Access to ESI Coverage Within Families........................................................................22
Workers Who Would Face High Financial Risks or Burdens Without ESI Coverage....23
Discussion and Conclusion....................................................................................................27
References..............................................................................................................................30
Tables.....................................................................................................................................32
Notes to Tables ......................................................................................................................40
Appendix: Data and Methods ...............................................................................................41
List of Figures and Tables
Figure 1. Non-Elderly Adult Working Population, 2001
Figure 2. Distribution of Workers by Family Income as Percentage of FPL, 2001
Figure 3. Distribution of Workers by Age, 2001
Figure 4. Distribution of Workers by Gender, 2001
Figure 5. Distribution of Workers by Race/Ethnicity, 2001
Figure 6. Distribution of Workers by Education, 2001
Figure 7. Distribution of Workers by Health Status, 2001
Figure 8. Distribution of Workers by Firm Size, 2001
Figure 9. Distribution of Workers by Hourly Wage, 2001
Figure 10. Distribution of Workers by Hours Worked Per Week, 2001
Figure 11. Distribution of Workers by Months of Job Tenure, 2001
Figure 12. ESI Sponsorship, Eligibility, and Take-up by Workers’ Family Income, 2001
Figure 13. ESI Sponsorship, Eligibility, and Take-up by Workers’ Age, 2001
Figure 14. ESI Sponsorship, Eligibility, and Take-up by Race/Ethnicity for Moderate Income Workers, 2001
Figure 15. ESI Sponsorship, Eligibility, and Take-up by Size of Employer, 2001
Figure 16. Reasons Why Uninsured Workers Lack ESI, 2001
Figure 17. Reasons Why Uninsured Workers Lack ESI by Employer Size, 2001
Figure 18. Reasons Given by Ineligible Uninsured Workers for Not Being Eligible for Employer’s Plan, 2001
Figure 19. Reasons Given by Eligible Uninsured Workers for Not Participating in Employer’s Plan, 2001
Figure 20. Access to ESI in Working Families by Family Income, 2001
Figure 21. Low-Income Workers with ESI by Age and Health Status, 2001
Table 1. Distribution of Workers by Family Status, 2001
Table 2. Distribution of Workers by Occupation, 2001
Table 3. Demographic Characteristics of Uninsured Self-Employed vs. All Self-Employed, 2001
Table 4. Employment Characteristics of Uninsured Self-Employed vs. All Self-Employed, 2001
Table 5. Insurance Coverage Rates of Workers by Demographic Characteristics, 2001
Table 6. Insurance Coverage Rates of Workers by Race/Ethnicity and Family Income as a Percentage of the FPL, 2001
Table 7. Insurance Coverage Rates of Workers by Employment Characteristics, 2001
Table 8. Reasons Why Uninsured Workers Lack ESI Coverage by Selected Characteristics, 2001
Table 9. Access To ESI Coverage in Working Families by Selected Characteristics, 2001
Table 10. Workers Who Would be at High Financial Risk if They Lost ESI Coverage, 2001
Executive Summary
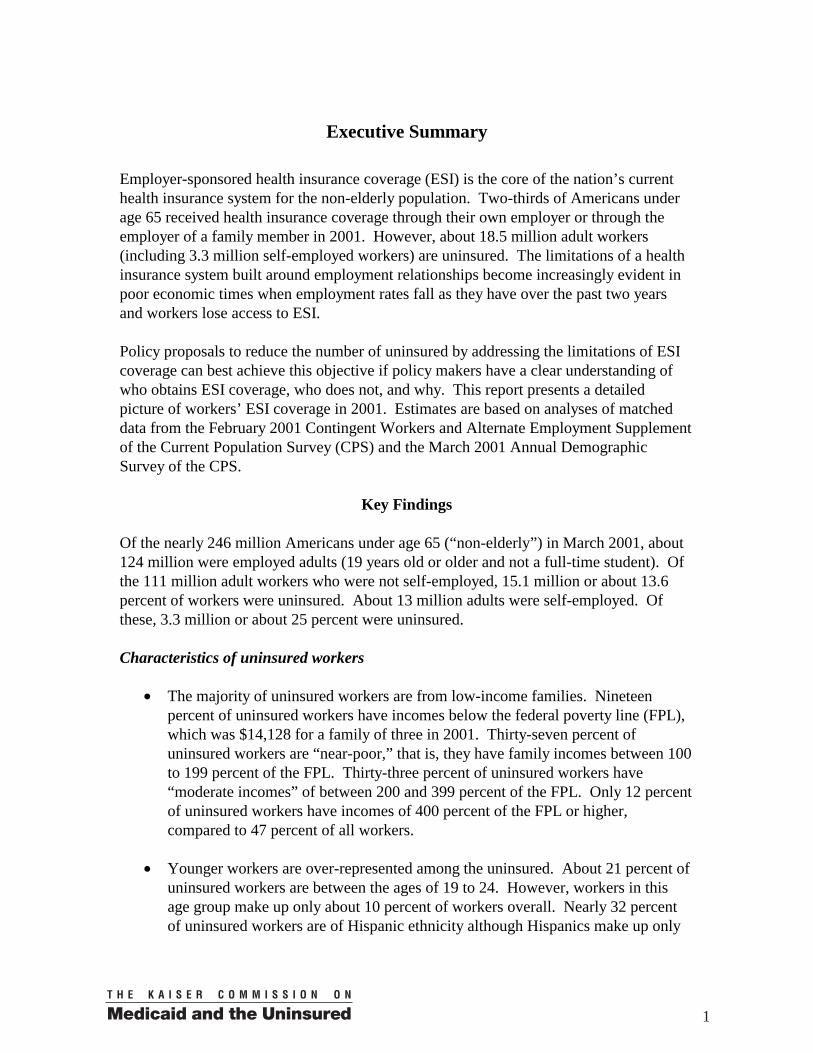
Employer-sponsored health insurance coverage (ESI) is the core of the nation’s current health insurance system for the non-elderly population. Two-thirds of Americans under age 65 received health insurance coverage through their own employer or through the employer of a family member in 2001. However, about 18.5 million adult workers (including 3.3 million self-employed workers) are uninsured. The limitations of a health insurance system built around employment relationships become increasingly evident in poor economic times when employment rates fall as they have over the past two years and workers lose access to ESI.
Policy proposals to reduce the number of uninsured by addressing the limitations of ESI coverage can best achieve this objective if policy makers have a clear understanding of who obtains ESI coverage, who does not, and why. This report presents a detailed picture of workers’ ESI coverage in 2001. Estimates are based on analyses of matched data from the February 2001 Contingent Workers and Alternate Employment Supplement of the Current Population Survey (CPS) and the March 2001 Annual Demographic Survey of the CPS.
Key Findings
Of the nearly 246 million Americans under age 65 (“non-elderly”) in March 2001, about 124 million were employed adults (19 years old or older and not a full-time student). Of the 111 million adult workers who were not self-employed, 15.1 million or about 13.6 percent of workers were uninsured. About 13 million adults were self-employed. Of these, 3.3 million or about 25 percent were uninsured.
Characteristics of uninsured workers
• The majority of uninsured workers are from low-income families. Nineteen percent of uninsured workers have incomes below the federal poverty line (FPL), which was $14,128 for a family of three in 2001. Thirty-seven percent of uninsured workers are “near-poor,” that is, they have family incomes between 100 to 199 percent of the FPL. Thirty-three percent of uninsured workers have “moderate incomes” of between 200 and 399 percent of the FPL. Only 12 percent of uninsured workers have incomes of 400 percent of the FPL or higher, compared to 47 percent of all workers.
• Younger workers are over-represented among the uninsured. About 21 percent of uninsured workers are between the ages of 19 to 24. However, workers in this age group make up only about 10 percent of workers overall. Nearly 32 percent of uninsured workers are of Hispanic ethnicity although Hispanics make up only
1
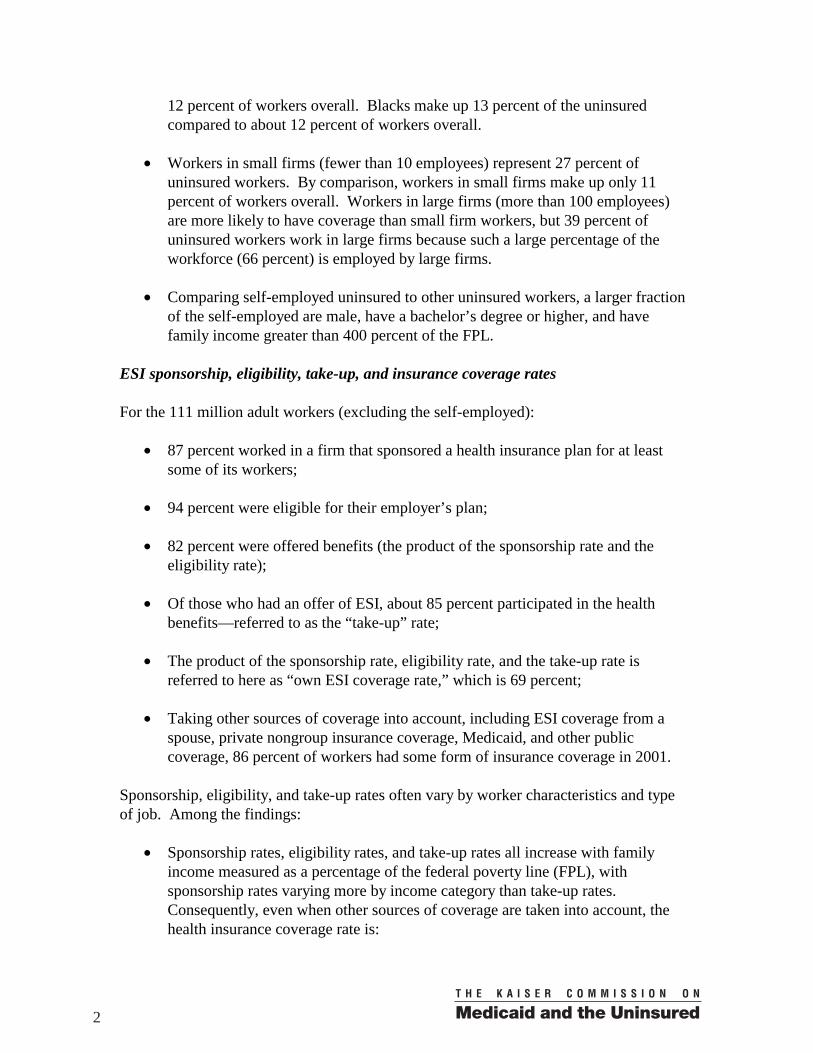
12 percent of workers overall. Blacks make up 13 percent of the uninsured compared to about 12 percent of workers overall.
• Workers in small firms (fewer than 10 employees) represent 27 percent of uninsured workers. By comparison, workers in small firms make up only 11 percent of workers overall. Workers in large firms (more than 100 employees) are more likely to have coverage than small firm workers, but 39 percent of uninsured workers work in large firms because such a large percentage of the workforce (66 percent) is employed by large firms.
• Comparing self-employed uninsured to other uninsured workers, a larger fraction of the self-employed are male, have a bachelor’s degree or higher, and have family income greater than 400 percent of the FPL.
ESI sponsorship, eligibility, take-up, and insurance coverage rates
For the 111 million adult workers (excluding the self-employed):
• 87 percent worked in a firm that sponsored a health insurance plan for at least some of its workers;
• 94 percent were eligible for their employer’s plan;
• 82 percent were offered benefits (the product of the sponsorship rate and the eligibility rate);
• Of those who had an offer of ESI, about 85 percent participated in the health benefits—referred to as the “take-up” rate;
• The product of the sponsorship rate, eligibility rate, and the take-up rate is referred to here as “own ESI coverage rate,” which is 69 percent;
• Taking other sources of coverage into account, including ESI coverage from a spouse, private nongroup insurance coverage, Medicaid, and other public coverage, 86 percent of workers had some form of insurance coverage in 2001.
Sponsorship, eligibility, and take-up rates often vary by worker characteristics and type of job. Among the findings:
• Sponsorship rates, eligibility rates, and take-up rates all increase with family income measured as a percentage of the federal poverty line (FPL), with sponsorship rates varying more by income category than take-up rates. Consequently, even when other sources of coverage are taken into account, the health insurance coverage rate is:
2
- 53 percent for workers in the poorest families with incomes below poverty;
- 66 percent for near-poor families;
- 87 percent for moderate-income families with incomes from 200 to 399 percent of poverty;
- 97 percent for the highest income category of 400 percent of the poverty level or higher.
• Older workers are more likely to work for an employer who sponsors a health plan. Take-up rates are lowest for the youngest workers (aged 19 to 24) although they are still around 80 percent.
• Men and women work in firms that sponsor coverage at nearly identical rates, but women are less likely to be eligible for their employer’s coverage. Women are also less likely to participate in health benefits. While men are more likely to have coverage from their own employers, they are less likely than women to have some form of coverage (85 vs. 88 percent).
• Hispanics work in firms that are less likely to sponsor health coverage than Blacks or Whites. Only 70 percent of Hispanics worked in a sponsoring firm, compared to 87 percent of Blacks and 90 percent of Whites. The eligibility and take-up rates of Hispanics, however, are not that different from other race/ethnicity groups.
• Only 54 percent of workers in firms with fewer than 10 employees work in a firm that sponsors a health plan, compared to 95 percent for workers in firms with 100 or more workers.
Why uninsured workers lack ESI
For the 15.1 million uninsured workers employed by a firm, about 64 percent worked for an employer that did not sponsor a health plan, 17 percent were not eligible for the employer’s plan, and 20 percent did not take-up their employer’s offer of coverage. Uninsured workers were asked directly why they were not eligible for their employer’s health plan (if their employer sponsors) and why they declined an offer of ESI (if eligible). The most frequent reason given for not being eligible (43 percent) is not having worked for the employer long enough to be covered by the health plan. The most frequent reason given for not participating in an employers’ health plan (52 percent) is that it was too expensive.
3
Access to ESI coverage within families Health benefits are often extended to employees’ dependents, increasing the likelihood of having coverage in families with more than one adult worker. Access to ESI is defined as having an offer from at least one worker in the family (specifically, a health insurance unit includes members of a nuclear family who can be covered under one health insurance policy—policyholder, spouse, children under 19, and full time students under 23). Access to ESI coverage in working families varies greatly by family income. Half of workers in poor working families and 29 percent of workers in near-poor working families have no ESI offer in the family. In contrast, only 3 percent of families with income more than four times the FPL have no ESI offer in the family. For workers in poor and near-poor families, only 13 percent decline an ESI offer within the family. Workers in higher and moderate-income families are less likely to decline an ESI offer.
Workers who would face high financial risks or burdens without ESI coverage
For many workers, the cost of ESI coverage is much less than what they would have to pay for comparable coverage purchased in the individual (nongroup) market—if such individual coverage is available at all. Unlike ESI coverage, premiums for individual coverage in most states are determined by an applicant’s expected health care costs, which increase with age and poorer health, for example. Thus premiums for nongroup coverage tend to be higher for older and less healthy individuals. Workers in less than perfect health who lost their ESI coverage would likely face higher premiums or have difficulty obtaining comparable coverage in the nongroup market. Losing ESI would also be especially burdensome for people in low-income families.
There are about two million workers age 19 to 34, who are poor or near-poor, who have ESI, and have less than very good health (good, fair, or poor health). Despite their relative youth, these workers would have difficulty affording individual coverage if they were to lose their jobs or their access to ESI. There are another 2.5 million low-income workers age 35-64 who are also in less than very good health, who depend on ESI for coverage, and who would likely be far worse off without it.
The ability of these workers to continue to benefit from ESI is tied to their maintaining the capacity to work (despite possible health problems), not losing their job during bad economic conditions, and their employer continuing to offer coverage. Since 1999 ESI offer rates have fallen in small firms. But even if this trend improves, ESI can be an unstable form of coverage for subsets of workers for which there presently is no viable public or private alternative.
Discussion and Conclusion
Encouraging more employers to sponsor ESI coverage would do much to cover uninsured workers, assuming that workers would participate at rates similar to workers who already have access to ESI. Low-income workers, when offered, are less likely to participate in
4
employer health benefits and many cite affordability as the reason. Addressing the affordability of premiums, therefore, is also a critical component for policies that would reduce the number of uninsured workers. In addition to expanding ESI sponsorship, it is important that current workers with health problems have greater access to coverage options that are not attached to a particular employer.
Proposals to expand coverage hinge on determining who is eligible for the benefits. Eligibility criteria might be based on family income as a percentage of the poverty level, a worker’s wages, or employment in a small firm. Basing eligibility on working in a small firm means that some low-income workers who do not work in small firms will not be eligible. Basing eligibility on being a low-wage worker means that some low-wage workers with high family incomes will be made eligible. Thus choosing eligibility rules presents important trade-offs.
Two measures by which eligibility criteria can be compared are the percentage of uninsured individuals who would be made eligible (target effectiveness) and the percentage of people eligible under the proposal who are uninsured (target efficiency). Prior research found that targeting subsidies to low-income workers would be more effective and more efficient than targeting subsidies to low-wage workers or to workers in small firms. This result stems from the especially strong relationship between family income and the likelihood of having coverage.
Broad premium subsidies for low-income workers that would allow choice over what type of coverage to buy (ESI, individual/nongroup coverage, or a publicly-sponsored insurance product) would tend to expand coverage of all types. Allowing workers to apply subsidies to ESI would be much more expensive, however, than more narrowly-tailored proposals such as subsidizing workers who are not offered health benefits to purchase health insurance coverage in the nongroup market using tax-credits. Tax-credits that can only be used for nongroup coverage risk creating an incentive for some firms to stop offering ESI. In addition, as younger and healthier workers opt for nongroup coverage, the current risk-pooling function of ESI is undermined.
Having a better understanding of the gaps in the current employment-based health insurance system provides the context necessary to address the more difficult questions raised by proposals to expand coverage. Policies that seek to expand coverage of a particular type or for particular groups are likely to have consequences on the whole system of health insurance coverage, both favorable and unfavorable, that are difficult to predict. They also require value judgments about what is affordable, which segments of the uninsured population have the greatest need, and whether we should be concerned that some subsidy dollars go to individuals who already have or can afford coverage. As policies, employment patterns, and health insurance markets shift, it will be important to monitor the gaps in health insurance coverage among workers.
5
Introduction Employer-sponsored health insurance coverage (ESI) is the core of the nation’s current health insurance system for the non-elderly population. Two-thirds of Americans under age 65 received health insurance coverage through their own employer or through the employer of a family member in 2001.1 This system of coverage conveys several benefits to employees and their employers such as the pooling of health risks and the ability to spread out the fixed costs of arranging health insurance coverage. Employer premium payments are excluded from employees’ taxable income, which provides employers a strong incentive to offer coverage. However, about 18.5 million adult workers (including 3.3 million self-employed workers) are uninsured.2 Many of these workers have dependents who are also uninsured.3 The limitations of a health insurance system built around employment relationships become increasingly evident in poor economic times when employment rates fall as they have over the past two years and workers lose access to ESI. Policy proposals to reduce the number of uninsured by addressing the limitations of ESI coverage can do so most effectively and efficiently if policy makers and analysts have a clear understanding of who obtains ESI coverage, who does not, and why. This report presents a detailed picture of workers’ ESI coverage using national data from 2001 by describing the demographic and employment characteristics of uninsured workers compared to workers overall, including some analyses that focus on self-employed workers. It presents data on which workers work for a firm that sponsors ESI coverage, which workers are eligible for that coverage, which workers take-up that coverage, and which workers obtain any health insurance coverage at all. The report also examines the reasons why uninsured workers fail to obtain ESI coverage and access to ESI coverage within families. Some workers would face a high financial risk or burden if they were to lose their ESI coverage. Older and sicker workers have higher medical expenses on average and may face much higher premiums for coverage in the individual market or have trouble getting coverage in that market. Paying more for premiums or facing high out-of-pocket medical costs while uninsured would be particularly burdensome for low-income workers. The last section of the report examines those workers with ESI who would face particularly high levels of risk or burden if they lost their ESI coverage. About the Estimates The estimates in this report are based on analyses of matched data from the February 2001 Contingent Workers and Alternate Employment Supplement of the Current
1 U.S. Census Bureau. Health Insurance Coverage: 2001. September 2002. 2 Author’s estimates for adults age 19-64, excluding full-time students, based on data sources described in this report. 3 In 1996, 87 percent of the uninsured population lived in households with a working adult (Monheit and Vistnes 2002).
6
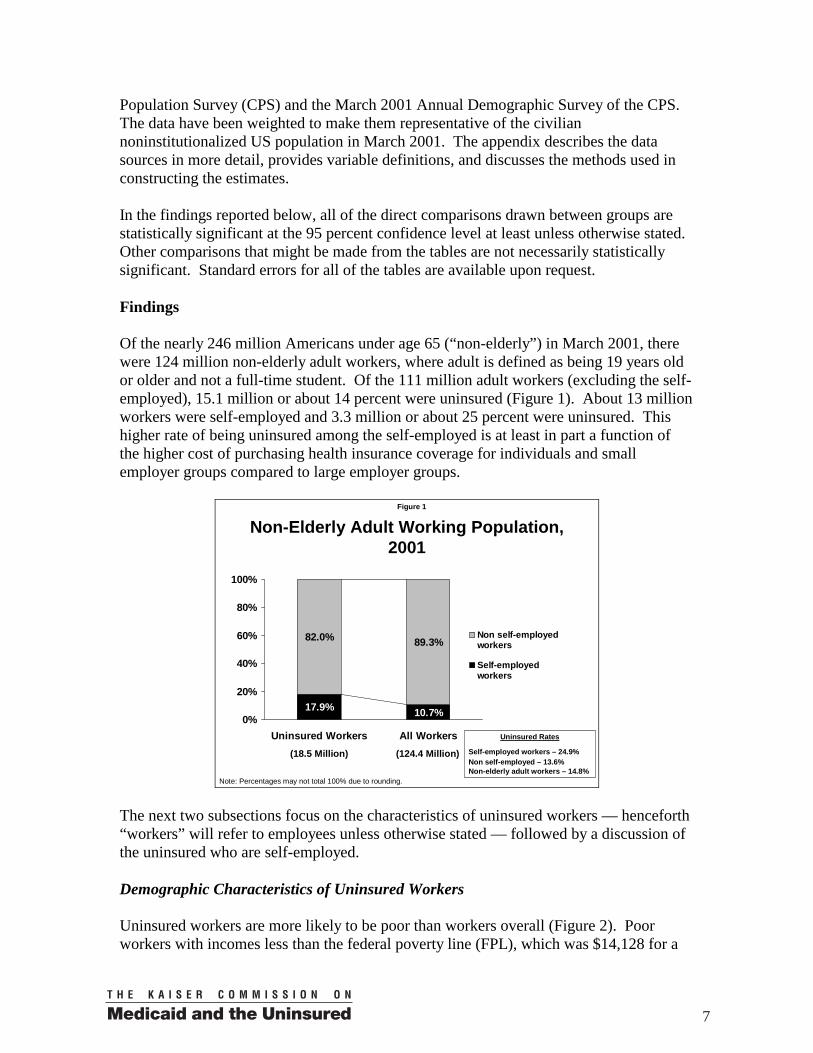
Population Survey (CPS) and the March 2001 Annual Demographic Survey of the CPS. The data have been weighted to make them representative of the civilian noninstitutionalized US population in March 2001. The appendix describes the data sources in more detail, provides variable definitions, and discusses the methods used in constructing the estimates. In the findings reported below, all of the direct comparisons drawn between groups are statistically significant at the 95 percent confidence level at least unless otherwise stated. Other comparisons that might be made from the tables are not necessarily statistically significant. Standard errors for all of the tables are available upon request. Findings Of the nearly 246 million Americans under age 65 (“non-elderly”) in March 2001, there were 124 million non-elderly adult workers, where adult is defined as being 19 years old or older and not a full-time student. Of the 111 million adult workers (excluding the self-employed), 15.1 million or about 14 percent were uninsured (Figure 1). About 13 million workers were self-employed and 3.3 million or about 25 percent were uninsured. This higher rate of being uninsured among the self-employed is at least in part a function of the higher cost of purchasing health insurance coverage for individuals and small employer groups compared to large employer groups.
Figure 1
Non-Elderly Adult Working Population, 2001
82.0% 89.3%
17.9% 10.7%0%
20%
40%
60%
80%
100%
Uninsured Workers All Workers
Non self-employedworkers
Self-employedworkers
Uninsured Rates
Self-employed workers – 24.9%Non self-employed – 13.6%Non-elderly adult workers – 14.8%
(18.5 Million) (124.4 Million)
Note: Percentages may not total 100% due to rounding. The next two subsections focus on the characteristics of uninsured workers — henceforth “workers” will refer to employees unless otherwise stated — followed by a discussion of the uninsured who are self-employed. Demographic Characteristics of Uninsured Workers Uninsured workers are more likely to be poor than workers overall (Figure 2). Poor workers with incomes less than the federal poverty line (FPL), which was $14,128 for a
7
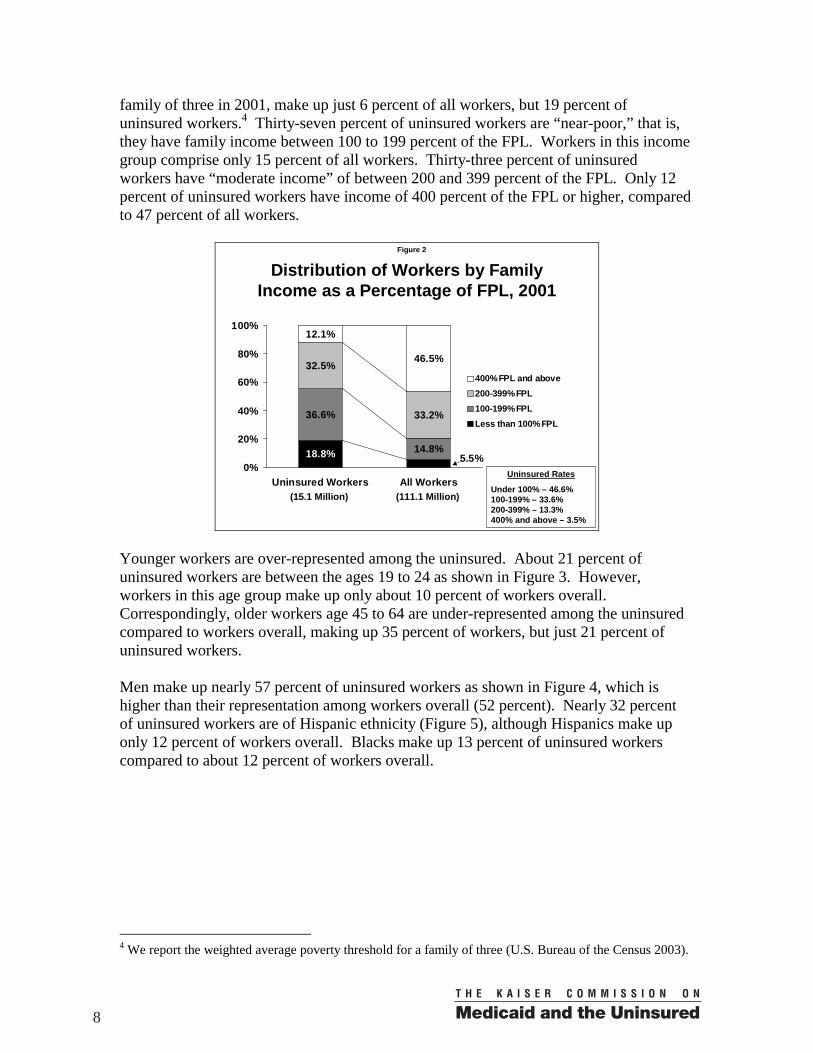
family of three in 2001, make up just 6 percent of all workers, but 19 percent of uninsured workers.4 Thirty-seven percent of uninsured workers are “near-poor,” that is, they have family income between 100 to 199 percent of the FPL. Workers in this income group comprise only 15 percent of all workers. Thirty-three percent of uninsured workers have “moderate income” of between 200 and 399 percent of the FPL. Only 12 percent of uninsured workers have income of 400 percent of the FPL or higher, compared to 47 percent of all workers.
Figure 2
Distribution of Workers by Family Income as a Percentage of FPL, 2001
36.6%
14.8%
32.5%
33.2%
12.1%
18.8% 5.5%
46.5%
0%
20%
40%
60%
80%
100%
Uninsured Workers All Workers
400% FPL and above200-399% FPL100-199% FPLLess than 100% FPL
Uninsured Rates
Under 100% – 46.6% 100-199% – 33.6% 200-399% – 13.3% 400% and above – 3.5%
(15.1 Million) (111.1 Million)
Younger workers are over-represented among the uninsured. About 21 percent of uninsured workers are between the ages 19 to 24 as shown in Figure 3. However, workers in this age group make up only about 10 percent of workers overall. Correspondingly, older workers age 45 to 64 are under-represented among the uninsured compared to workers overall, making up 35 percent of workers, but just 21 percent of uninsured workers. Men make up nearly 57 percent of uninsured workers as shown in Figure 4, which is higher than their representation among workers overall (52 percent). Nearly 32 percent of uninsured workers are of Hispanic ethnicity (Figure 5), although Hispanics make up only 12 percent of workers overall. Blacks make up 13 percent of uninsured workers compared to about 12 percent of workers overall.
4 We report the weighted average poverty threshold for a family of three (U.S. Bureau of the Census 2003).
8
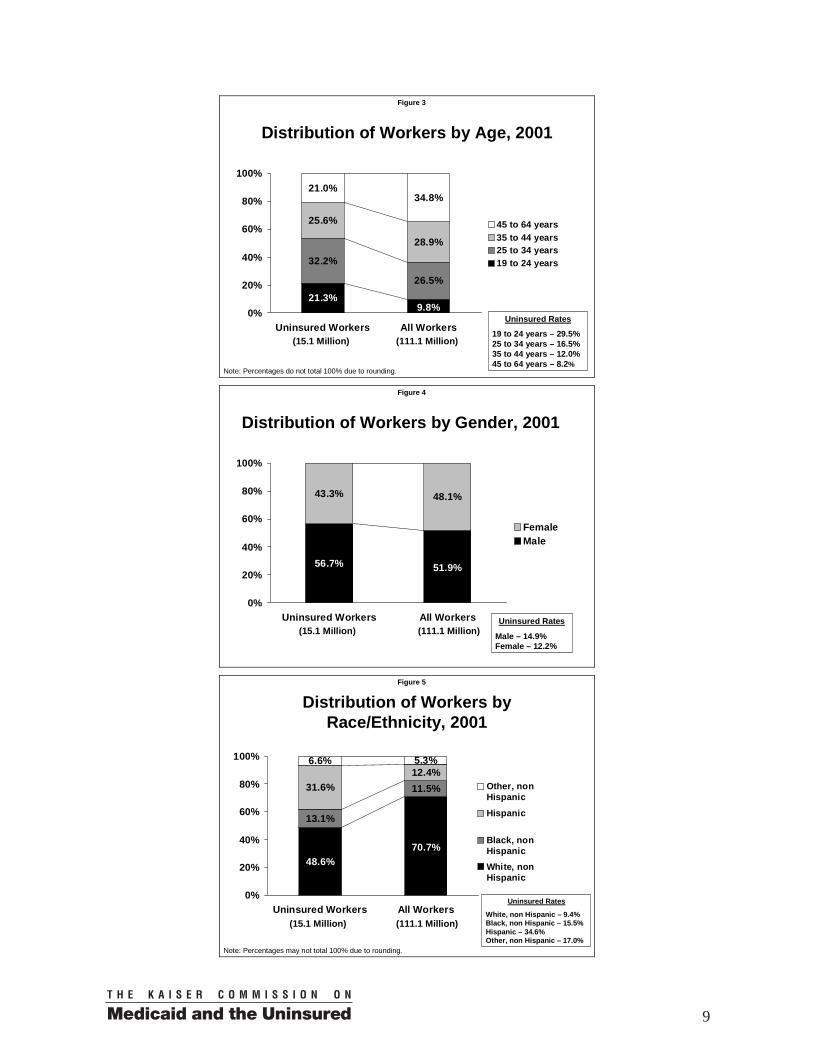
Figure 3
Distribution of Workers by Age, 2001
32.2%
26.5%
25.6%
28.9%
21.0%
21.3%9.8%
34.8%
0%
20%
40%
60%
80%
100%
Uninsured Workers All Workers
45 to 64 years35 to 44 years25 to 34 years19 to 24 years
Note: Percentages do not total 100% due to rounding.
Uninsured Rates
19 to 24 years – 29.5% 25 to 34 years – 16.5% 35 to 44 years – 12.0% 45 to 64 years – 8.2%
(15.1 Million) (111.1 Million)
Figure 4
Distribution of Workers by Gender, 2001
43.3% 48.1%
56.7% 51.9%
0%
20%
40%
60%
80%
100%
Uninsured Workers All Workers
FemaleMale
Uninsured Rates
Male – 14.9% Female – 12.2%
(15.1 Million) (111.1 Million)
Figure 5
Distribution of Workers by Race/Ethnicity, 2001
13.1%
11.5%31.6%12.4%
6.6%
48.6%70.7%
5.3%
0%
20%
40%
60%
80%
100%
Uninsured Workers All Workers
Other, nonHispanic
Hispanic
Black, nonHispanicWhite, nonHispanic
Note: Percentages may not total 100% due to rounding.
Uninsured Rates
White, non Hispanic – 9.4% Black, non Hispanic – 15.5% Hispanic – 34.6% Other, non Hispanic – 17.0%
(15.1 Million) (111.1 Million)
9

Twenty-nine percent of uninsured workers have less than a high school education (Figure 6). Thirty-eight percent are high school graduates with no college experience. Only 9 percent of uninsured workers have a bachelor’s degree or higher. By contrast, about 29 percent of workers overall have a bachelor’s degree or higher.
Figure 6
Distribution of Workers by Education, 2001
38.5%
31.9%
23.5%
28.9%
8.7%
29.3%10.0%
29.3%
0%
20%
40%
60%
80%
100%
Uninsured Workers All Workers
Bachelor's degree orhigherSome college
High school graduate
Less than high school
Uninsured Rates Less than high school – 39.8% High school graduate – 16.4% Some college – 11.1% Bachelor’s degree or higher – 4.0%
(15.1 Million) (111.1 Million)
Note: Percentages may not total 100% due to rounding. Single workers without children make up 51 percent of uninsured workers (Table 1), while they make up only 34 percent of workers overall. The three groups without children make up 63 percent of uninsured workers — due in part to the fact that in general, they are only eligible for Medicaid if they are pregnant or disabled.
Lacking health insurance is not a problem limited to the healthiest workers. Uninsured workers tend to have poorer health than workers overall (Figure 7). Nine percent of uninsured workers report being in fair or poor health and 31 percent report being in good health. Being in only “good health” may be an indication of higher health care needs relative to those in very good or excellent health.
Percentage of Uninsured Workers
Percentage of All Workers
Uninsured Rates
Married to worker, no children 8.2% 19.5% 5.7%Married to worker, with children 15.2% 26.6% 7.8%Married to nonworker, no children 4.3% 5.4% 10.9%Married to nonworker, with children 9.7% 7.4% 17.8%Single, no children 50.9% 33.5% 20.7%Single, with children 11.7% 7.7% 20.9%
100.0% 100.0%(15.1 Million) (111.1 Million)
Distribution of Workers by Family Status, 2001
Table 1
10
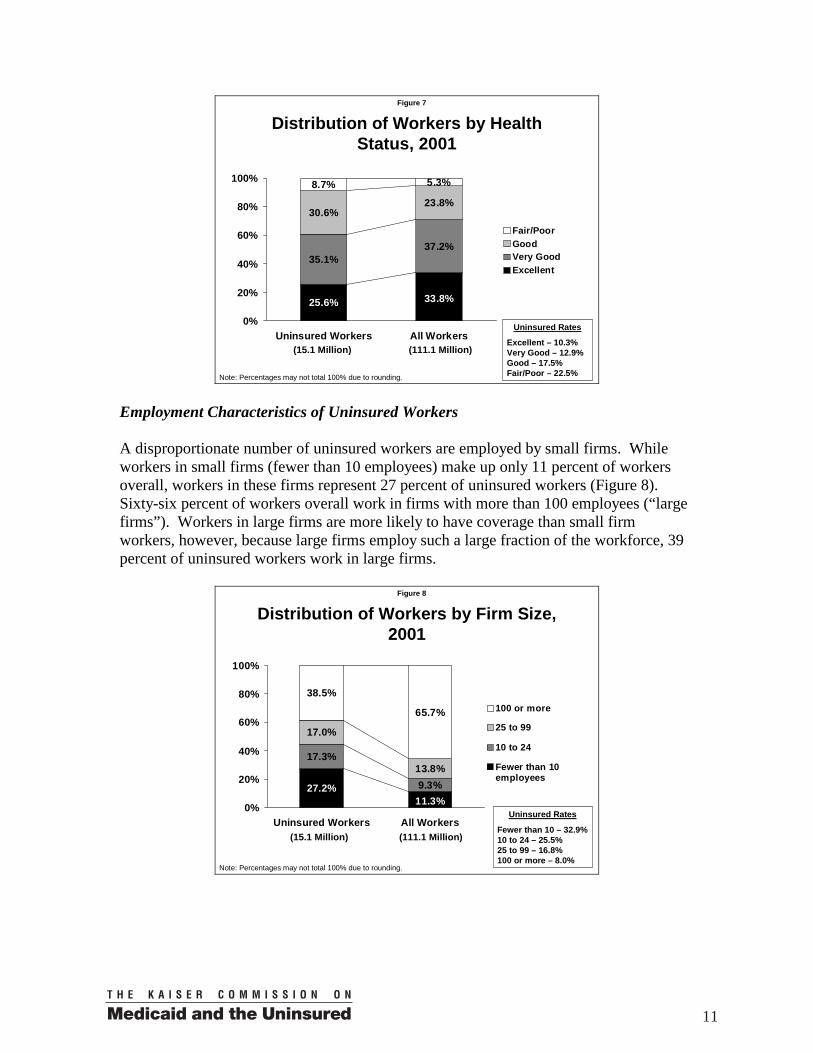
Figure 7
Distribution of Workers by Health Status, 2001
35.1%
30.6%23.8%
33.8%25.6%
37.2%
8.7% 5.3%
0%
20%
40%
60%
80%
100%
Uninsured Workers All Workers
Fair/PoorGoodVery GoodExcellent
Uninsured Rates
Excellent – 10.3% Very Good – 12.9% Good – 17.5% Fair/Poor – 22.5%
(15.1 Million) (111.1 Million)
Note: Percentages may not total 100% due to rounding.
Employment Characteristics of Uninsured Workers A disproportionate number of uninsured workers are employed by small firms. While workers in small firms (fewer than 10 employees) make up only 11 percent of workers overall, workers in these firms represent 27 percent of uninsured workers (Figure 8). Sixty-six percent of workers overall work in firms with more than 100 employees (“large firms”). Workers in large firms are more likely to have coverage than small firm workers, however, because large firms employ such a large fraction of the workforce, 39 percent of uninsured workers work in large firms.
Figure 8
Distribution of Workers by Firm Size, 2001
17.3%
9.3%
17.0%
13.8%
27.2%11.3%
65.7%
38.5%
0%
20%
40%
60%
80%
100%
Uninsured Workers All Workers
100 or more
25 to 99
10 to 24
Fewer than 10employees
Note: Percentages may not total 100% due to rounding.
Uninsured Rates
Fewer than 10 – 32.9% 10 to 24 – 25.5% 25 to 99 – 16.8% 100 or more – 8.0%
(15.1 Million) (111.1 Million)
11
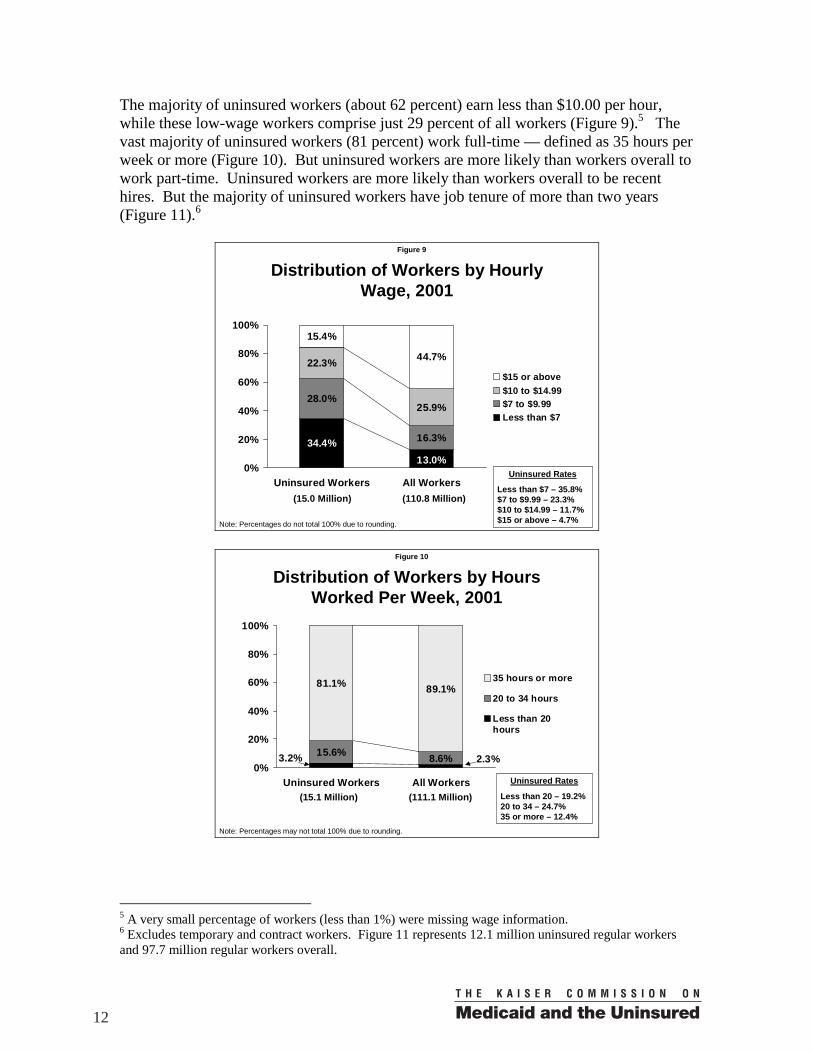
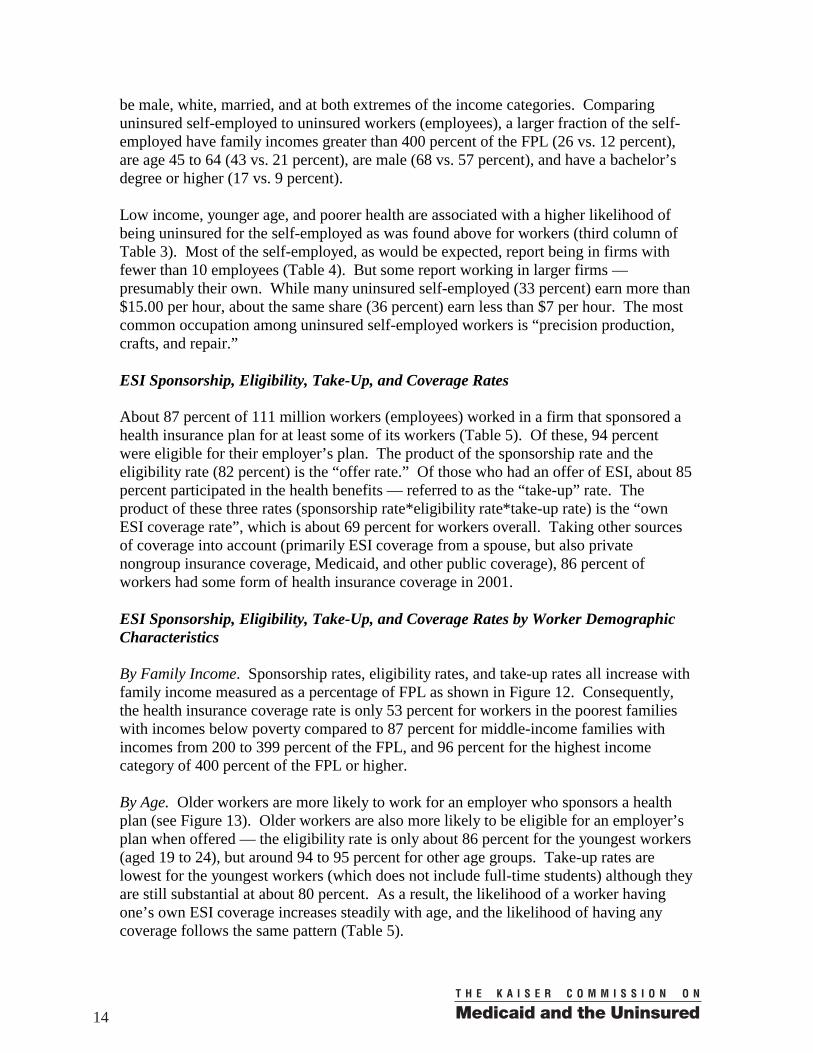
The majority of uninsured workers (about 62 percent) earn less than $10.00 per hour, while these low-wage workers comprise just 29 percent of all workers (Figure 9).5 The vast majority of uninsured workers (81 percent) work full-time — defined as 35 hours per week or more (Figure 10). But uninsured workers are more likely than workers overall to work part-time. Uninsured workers are more likely than workers overall to be recent hires. But the majority of uninsured workers have job tenure of more than two years (Figure 11).6
Figure 9
Distribution of Workers by Hourly Wage, 2001
28.0%
16.3%
22.3%
25.9%
13.0%34.4%
15.4%
44.7%
0%
20%
40%
60%
80%
100%
Uninsured Workers All Workers
$15 or above$10 to $14.99$7 to $9.99Less than $7
Uninsured Rates
Less than $7 – 35.8% $7 to $9.99 – 23.3% $10 to $14.99 – 11.7% $15 or above – 4.7%Note: Percentages do not total 100% due to rounding.
(15.0 Million) (110.8 Million)
Figure 10
Distribution of Workers by Hours Worked Per Week, 2001
15.6% 8.6%
81.1% 89.1%
3.2% 2.3%0%
20%
40%
60%
80%
100%
Uninsured Workers All Workers
35 hours or more
20 to 34 hours
Less than 20hours
Uninsured Rates
Less than 20 – 19.2% 20 to 34 – 24.7% 35 or more – 12.4%
Note: Percentages may not total 100% due to rounding.
(15.1 Million) (111.1 Million)
5 A very small percentage of workers (less than 1%) were missing wage information. 6 Excludes temporary and contract workers. Figure 11 represents 12.1 million uninsured regular workers and 97.7 million regular workers overall.
12

Figure 11
Distribution of Workers by Months of Job Tenure, 2001
10.6%8.3%
5.5%
53.5%75.9%
12.6% 3.9%4.5%
10.3%
15.0%
0%
20%
40%
60%
80%
100%
Uninsured Workers All Workers
24 or more
12 to 23
6 to 11
3 to 5
Less than 3months
Note: Percentages may not total 100% due to rounding.
Uninsured Rates
Less than 3 – 40.2% 3 to 5 – 29.2% 6 to 11 – 18.6% 12 to 23 – 18.1% 24 or more – 8.7%
(12.1 Million) (97.7 Million)
Uninsured workers are disproportionately employed in service occupations. Twenty-three percent of uninsured workers are in service occupations, including household services but excluding protective services (Table 2). Workers in these service occupations make up only 10 percent of workers overall. Seventeen percent of uninsured workers are in “precision product, craft, and repair” occupations and 11 percent are in sales occupations.
Characteristics of Uninsured Self-Employed Workers Before describing the characteristics of uninsured self-employed workers, it is useful to note a few differences between the self-employed (Table 3) and employees (described in the prior section, Figures 1-11 and Tables 1-2). The self-employed are older and more highly educated on average than employees. The self-employed are also more likely to
Percentage of Uninsured Workers
Percentage of All Workers
Uninsured Rates
Executive, admin., & managerial 5.2% 15.2% 4.7%Professional specialty 5.4% 17.1% 4.3%Technicians and related support 1.9% 3.8% 6.8%Sales 11.2% 10.0% 15.2%Admin. support, incl. clerical 9.2% 15.1% 8.2%Protective service occs. 0.9% 2.1% 6.1%Service, excl. protective, incl. hhold 23.5% 9.8% 32.5%Precision prod., craft & repair 16.6% 11.4% 19.8%Machine ops., assmb., inspectors 6.6% 6.1% 14.7%Transportation and material moving 6.6% 4.5% 20.2%Handlers, helpers, laborers 8.6% 3.6% 32.5%Farming, forestry and fishing 4.2% 1.3% 43.8%
100.0% 100.0%(15.1 Million) (111.1 Million)
Distribution of Workers by Occupation, 2001
Table 2
13
be male, white, married, and at both extremes of the income categories. Comparing uninsured self-employed to uninsured workers (employees), a larger fraction of the self-employed have family incomes greater than 400 percent of the FPL (26 vs. 12 percent), are age 45 to 64 (43 vs. 21 percent), are male (68 vs. 57 percent), and have a bachelor’s degree or higher (17 vs. 9 percent). Low income, younger age, and poorer health are associated with a higher likelihood of being uninsured for the self-employed as was found above for workers (third column of Table 3). Most of the self-employed, as would be expected, report being in firms with fewer than 10 employees (Table 4). But some report working in larger firms — presumably their own. While many uninsured self-employed (33 percent) earn more than $15.00 per hour, about the same share (36 percent) earn less than $7 per hour. The most common occupation among uninsured self-employed workers is “precision production, crafts, and repair.” ESI Sponsorship, Eligibility, Take-Up, and Coverage Rates About 87 percent of 111 million workers (employees) worked in a firm that sponsored a health insurance plan for at least some of its workers (Table 5). Of these, 94 percent were eligible for their employer’s plan. The product of the sponsorship rate and the eligibility rate (82 percent) is the “offer rate.” Of those who had an offer of ESI, about 85 percent participated in the health benefits — referred to as the “take-up” rate. The product of these three rates (sponsorship rate*eligibility rate*take-up rate) is the “own ESI coverage rate”, which is about 69 percent for workers overall. Taking other sources of coverage into account (primarily ESI coverage from a spouse, but also private nongroup insurance coverage, Medicaid, and other public coverage), 86 percent of workers had some form of health insurance coverage in 2001. ESI Sponsorship, Eligibility, Take-Up, and Coverage Rates by Worker Demographic Characteristics By Family Income. Sponsorship rates, eligibility rates, and take-up rates all increase with family income measured as a percentage of FPL as shown in Figure 12. Consequently, the health insurance coverage rate is only 53 percent for workers in the poorest families with incomes below poverty compared to 87 percent for middle-income families with incomes from 200 to 399 percent of the FPL, and 96 percent for the highest income category of 400 percent of the FPL or higher. By Age. Older workers are more likely to work for an employer who sponsors a health plan (see Figure 13). Older workers are also more likely to be eligible for an employer’s plan when offered — the eligibility rate is only about 86 percent for the youngest workers (aged 19 to 24), but around 94 to 95 percent for other age groups. Take-up rates are lowest for the youngest workers (which does not include full-time students) although they are still substantial at about 80 percent. As a result, the likelihood of a worker having one’s own ESI coverage increases steadily with age, and the likelihood of having any coverage follows the same pattern (Table 5).
14

Figure 12
ESI Sponsorship, Eligibility, and Take-Up by Workers’ Family Income, 2001
61%72% 71%74%
89%81%87%
95%88%94% 97%
84%
0%
20%
40%
60%
80%
100%
Firm SponsorsHealth Plan
Eligible for ESI Takes Up Offer
Under 100% FPL 100-199% FPL 200-399% FPL 400% FPL and above
(Conditional on sponsor) (Conditional on eligibility)
Figure 13
ESI Sponsorship, Eligibility, and Take-Up by Workers’ Age, 2001
78%86% 80%85%
94%85%87%
95%84%90% 96%
87%
0%
20%
40%
60%
80%
100%
Firm SponsorsHealth Plan
Eligible for ESI Takes Up Offer
19 to 24 years 25 to 34 years 35 to 44 years 45 to 64 years
(Conditional on sponsor) (Conditional on eligibility)
By Gender. Sponsorship rates are nearly identical for men and women, but women are less likely than men to be eligible for their employer’s coverage. Much of this difference can be explained by women being more likely to work in part-time jobs that limit eligibility. Women are also less likely than men to take-up the coverage. While men are more likely to have coverage from their own employers, they are less likely than women to have some form of coverage (85 vs. 88 percent). Medicaid covers many low-income pregnant women and people in low-income families, made up predominantly of women and children, which likely explains the higher overall coverage rate of women and may partly explain womens’ lower take-up rate.1
1 The take-up rate difference by gender could not be easily explained by controlling for income, age, and family status in a multivariate regression.
15

By Race/Ethnicity. Hispanics have a particularly low sponsorship rate (70 percent) relative to non-Hispanics. The eligibility and take-up rates of Hispanics, however, are not that different from those of the other race/ethnicity groups we examine. But because Hispanics’ sponsorship rate is low, they are less likely than Blacks and Whites to have any coverage at all (65 vs. 85 and 91 percent, respectively). Blacks are about equally likely to have ESI coverage from their own employer as Whites, but Blacks are less likely than Whites to have insurance coverage, indicating Blacks are less likely to obtain coverage from a spouse or other source than Whites. Clearly, group income differences explain part of the patterns just described. Analyses by race/ethnicity and income jointly are presented at the end of this subsection. By Worker’s Level of Education. Sponsorship rates, own ESI coverage rates, and overall coverage rates increase steeply with worker education levels. Eligibility and take-up rates also tend to increase with education, but these differences are less dramatic. Workers with less than a high school diploma stand apart from the other more educated groups of workers in having a lower take-up rate (79 percent vs. 84 to 87 percent). By Family Status. Sponsorship rates vary by family status from 84 percent for single workers without children to 91 percent for married workers without children. Eligibility rates range from 94 to 96 percent for most of the family types, but the single worker with children group stands out as having a relatively low eligibility rate of 91 percent. Take-up rates are lower for workers married to workers, reflecting the ability of many two-worker families to decline one employer’s offer of coverage in favor of obtaining family coverage through the other. By Health Status. Sponsorship rates are lower for workers in poorer self-reported health. Despite their likely higher need for medical care, the 5.8 million workers reporting fair or poor health had a sponsorship rate of 79 percent compared to 87 percent for workers overall. Those workers also have lower eligibility and take-up rates. The workers in fair or poor health were less likely than workers in better health to have ESI coverage in their own name or any coverage at all. Part, but not all of the differences in coverage by health status can be accounted for by income differences. Workers in fair or poor health are more likely to have low incomes, and low income is associated with lower sponsorship rates as shown above. After using a regression to adjust for income as a percentage of poverty, workers in poor health were still about 5 percentage points less likely to work in a sponsoring firm compared to workers in excellent health, and about 6 percentage points less likely to have any form of coverage. By Race/Ethnicity and Family Income. The large differences in sponsorship and overall coverage rates by race and ethnic group shown in Table 5 may reflect, in part, differences in average incomes by race and ethnicity that are also strongly related to coverage. After limiting to middle-income workers, however, it is still the case that the sponsorship rate is particularly low for Hispanics (75 percent) relative to the other race/ethnicity groups (89 to 84 percent) as shown in Figure 14. Middle-income Hispanic workers have a lower
16
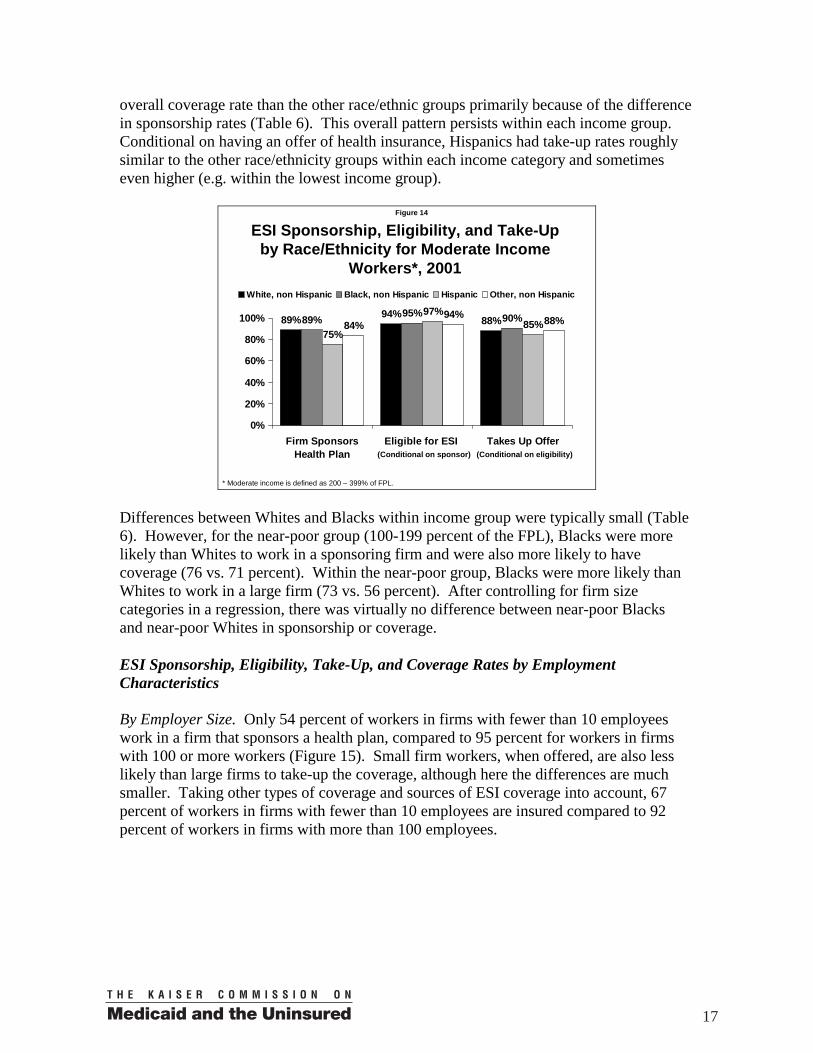
overall coverage rate than the other race/ethnic groups primarily because of the difference in sponsorship rates (Table 6). This overall pattern persists within each income group. Conditional on having an offer of health insurance, Hispanics had take-up rates roughly similar to the other race/ethnicity groups within each income category and sometimes even higher (e.g. within the lowest income group).
Figure 14
ESI Sponsorship, Eligibility, and Take-Up by Race/Ethnicity for Moderate Income
Workers*, 2001
89% 94% 88%89% 95% 90%75%
97%85%84%
94% 88%
0%
20%
40%
60%
80%
100%
Firm SponsorsHealth Plan
Eligible for ESI Takes Up Offer
White, non Hispanic Black, non Hispanic Hispanic Other, non Hispanic
(Conditional on sponsor) (Conditional on eligibility)
* Moderate income is defined as 200 – 399% of FPL. Differences between Whites and Blacks within income group were typically small (Table 6). However, for the near-poor group (100-199 percent of the FPL), Blacks were more likely than Whites to work in a sponsoring firm and were also more likely to have coverage (76 vs. 71 percent). Within the near-poor group, Blacks were more likely than Whites to work in a large firm (73 vs. 56 percent). After controlling for firm size categories in a regression, there was virtually no difference between near-poor Blacks and near-poor Whites in sponsorship or coverage. ESI Sponsorship, Eligibility, Take-Up, and Coverage Rates by Employment Characteristics By Employer Size. Only 54 percent of workers in firms with fewer than 10 employees work in a firm that sponsors a health plan, compared to 95 percent for workers in firms with 100 or more workers (Figure 15). Small firm workers, when offered, are also less likely than large firms to take-up the coverage, although here the differences are much smaller. Taking other types of coverage and sources of ESI coverage into account, 67 percent of workers in firms with fewer than 10 employees are insured compared to 92 percent of workers in firms with more than 100 employees.
17
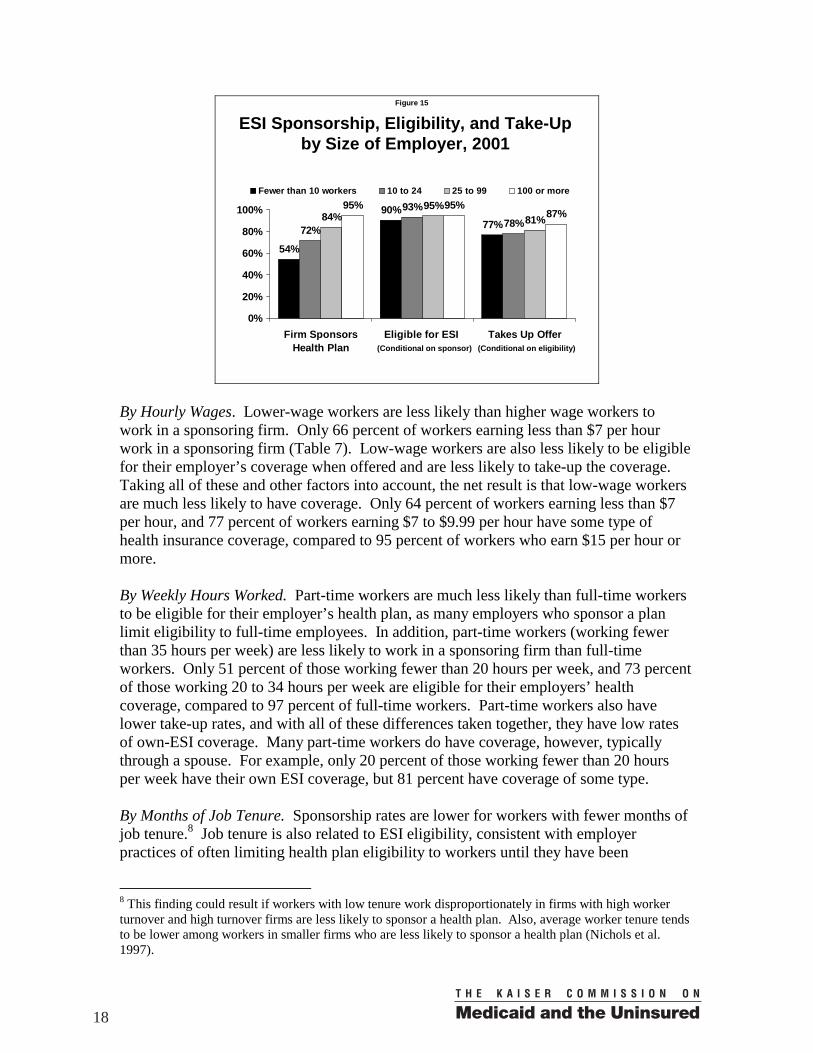
Figure 15
ESI Sponsorship, Eligibility, and Take-Up by Size of Employer, 2001
54%
90%77%72%
93%78%84%
95%81%
95% 95%87%
0%
20%
40%
60%
80%
100%
Firm SponsorsHealth Plan
Eligible for ESI Takes Up Offer
Fewer than 10 workers 10 to 24 25 to 99 100 or more
(Conditional on sponsor) (Conditional on eligibility)
By Hourly Wages. Lower-wage workers are less likely than higher wage workers to work in a sponsoring firm. Only 66 percent of workers earning less than $7 per hour work in a sponsoring firm (Table 7). Low-wage workers are also less likely to be eligible for their employer’s coverage when offered and are less likely to take-up the coverage. Taking all of these and other factors into account, the net result is that low-wage workers are much less likely to have coverage. Only 64 percent of workers earning less than $7 per hour, and 77 percent of workers earning $7 to $9.99 per hour have some type of health insurance coverage, compared to 95 percent of workers who earn $15 per hour or more. By Weekly Hours Worked. Part-time workers are much less likely than full-time workers to be eligible for their employer’s health plan, as many employers who sponsor a plan limit eligibility to full-time employees. In addition, part-time workers (working fewer than 35 hours per week) are less likely to work in a sponsoring firm than full-time workers. Only 51 percent of those working fewer than 20 hours per week, and 73 percent of those working 20 to 34 hours per week are eligible for their employers’ health coverage, compared to 97 percent of full-time workers. Part-time workers also have lower take-up rates, and with all of these differences taken together, they have low rates of own-ESI coverage. Many part-time workers do have coverage, however, typically through a spouse. For example, only 20 percent of those working fewer than 20 hours per week have their own ESI coverage, but 81 percent have coverage of some type. By Months of Job Tenure. Sponsorship rates are lower for workers with fewer months of job tenure.8 Job tenure is also related to ESI eligibility, consistent with employer practices of often limiting health plan eligibility to workers until they have been
8 This finding could result if workers with low tenure work disproportionately in firms with high worker turnover and high turnover firms are less likely to sponsor a health plan. Also, average worker tenure tends to be lower among workers in smaller firms who are less likely to sponsor a health plan (Nichols et al. 1997).
18
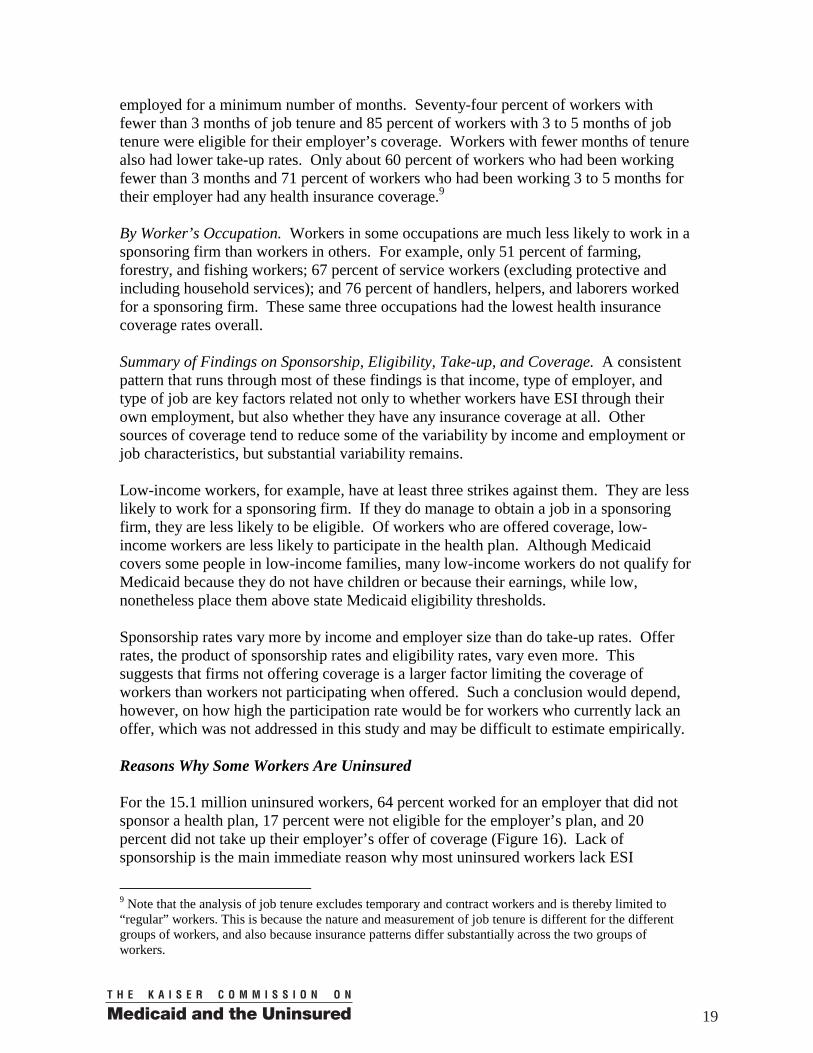
employed for a minimum number of months. Seventy-four percent of workers with fewer than 3 months of job tenure and 85 percent of workers with 3 to 5 months of job tenure were eligible for their employer’s coverage. Workers with fewer months of tenure also had lower take-up rates. Only about 60 percent of workers who had been working fewer than 3 months and 71 percent of workers who had been working 3 to 5 months for their employer had any health insurance coverage.9 By Worker’s Occupation. Workers in some occupations are much less likely to work in a sponsoring firm than workers in others. For example, only 51 percent of farming, forestry, and fishing workers; 67 percent of service workers (excluding protective and including household services); and 76 percent of handlers, helpers, and laborers worked for a sponsoring firm. These same three occupations had the lowest health insurance coverage rates overall. Summary of Findings on Sponsorship, Eligibility, Take-up, and Coverage. A consistent pattern that runs through most of these findings is that income, type of employer, and type of job are key factors related not only to whether workers have ESI through their own employment, but also whether they have any insurance coverage at all. Other sources of coverage tend to reduce some of the variability by income and employment or job characteristics, but substantial variability remains. Low-income workers, for example, have at least three strikes against them. They are less likely to work for a sponsoring firm. If they do manage to obtain a job in a sponsoring firm, they are less likely to be eligible. Of workers who are offered coverage, low-income workers are less likely to participate in the health plan. Although Medicaid covers some people in low-income families, many low-income workers do not qualify for Medicaid because they do not have children or because their earnings, while low, nonetheless place them above state Medicaid eligibility thresholds. Sponsorship rates vary more by income and employer size than do take-up rates. Offer rates, the product of sponsorship rates and eligibility rates, vary even more. This suggests that firms not offering coverage is a larger factor limiting the coverage of workers than workers not participating when offered. Such a conclusion would depend, however, on how high the participation rate would be for workers who currently lack an offer, which was not addressed in this study and may be difficult to estimate empirically. Reasons Why Some Workers Are Uninsured For the 15.1 million uninsured workers, 64 percent worked for an employer that did not sponsor a health plan, 17 percent were not eligible for the employer’s plan, and 20 percent did not take up their employer’s offer of coverage (Figure 16). Lack of sponsorship is the main immediate reason why most uninsured workers lack ESI
9 Note that the analysis of job tenure excludes temporary and contract workers and is thereby limited to “regular” workers. This is because the nature and measurement of job tenure is different for the different groups of workers, and also because insurance patterns differ substantially across the two groups of workers.
19
coverage. Saying “immediate reason” highlights the possibility that there are more fundamental reasons at work. For example, a business may not sponsor a health plan if it thinks a large percentage of its workers would not participate because they already receive coverage through a spouse or because low-income workers would not be able to afford the coverage even if it was offered.
Figure 16
Reasons Why Uninsured Workers Lack ESI, 2001
20%
17%64%
Employer does not sponsor a
health plan
Worker is eligible, but not enrolled in
employer’s plan
Worker is not eligible for
employer’s plan
Note: Percentages do not total 100% due to rounding.
Total = 15.1 million uninsured workers(excluding self-employed)
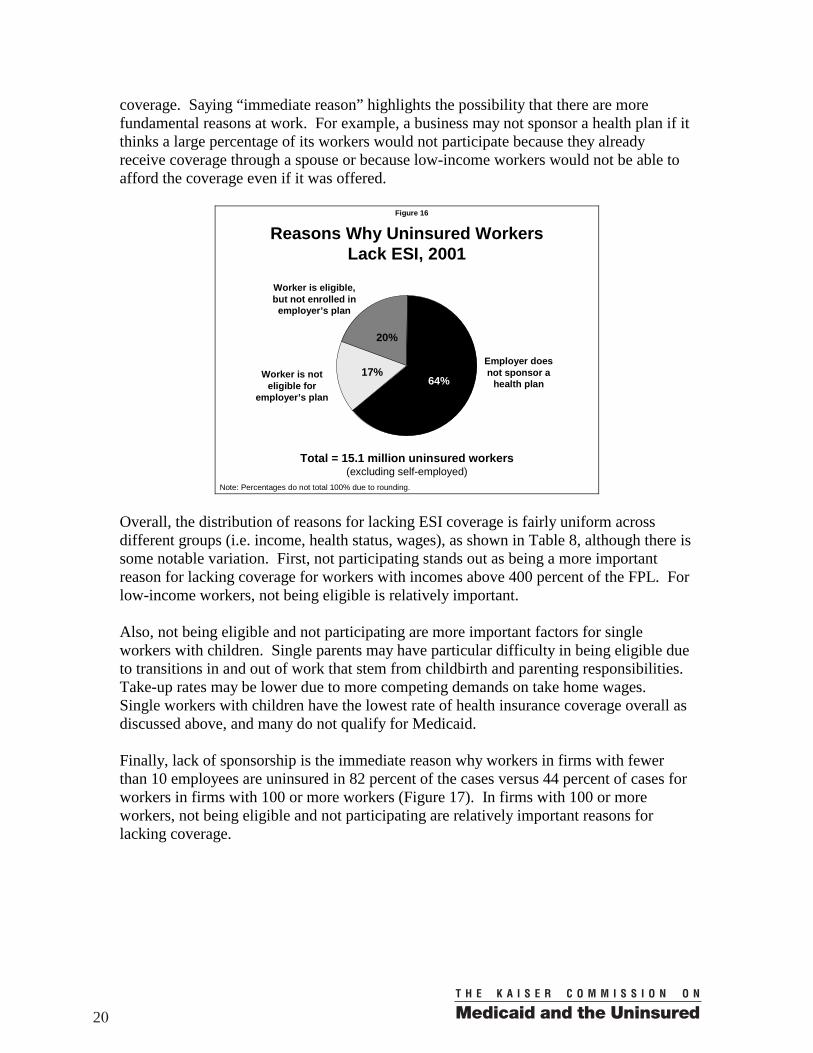
Overall, the distribution of reasons for lacking ESI coverage is fairly uniform across different groups (i.e. income, health status, wages), as shown in Table 8, although there is some notable variation. First, not participating stands out as being a more important reason for lacking coverage for workers with incomes above 400 percent of the FPL. For low-income workers, not being eligible is relatively important. Also, not being eligible and not participating are more important factors for single workers with children. Single parents may have particular difficulty in being eligible due to transitions in and out of work that stem from childbirth and parenting responsibilities. Take-up rates may be lower due to more competing demands on take home wages. Single workers with children have the lowest rate of health insurance coverage overall as discussed above, and many do not qualify for Medicaid. Finally, lack of sponsorship is the immediate reason why workers in firms with fewer than 10 employees are uninsured in 82 percent of the cases versus 44 percent of cases for workers in firms with 100 or more workers (Figure 17). In firms with 100 or more workers, not being eligible and not participating are relatively important reasons for lacking coverage.
20
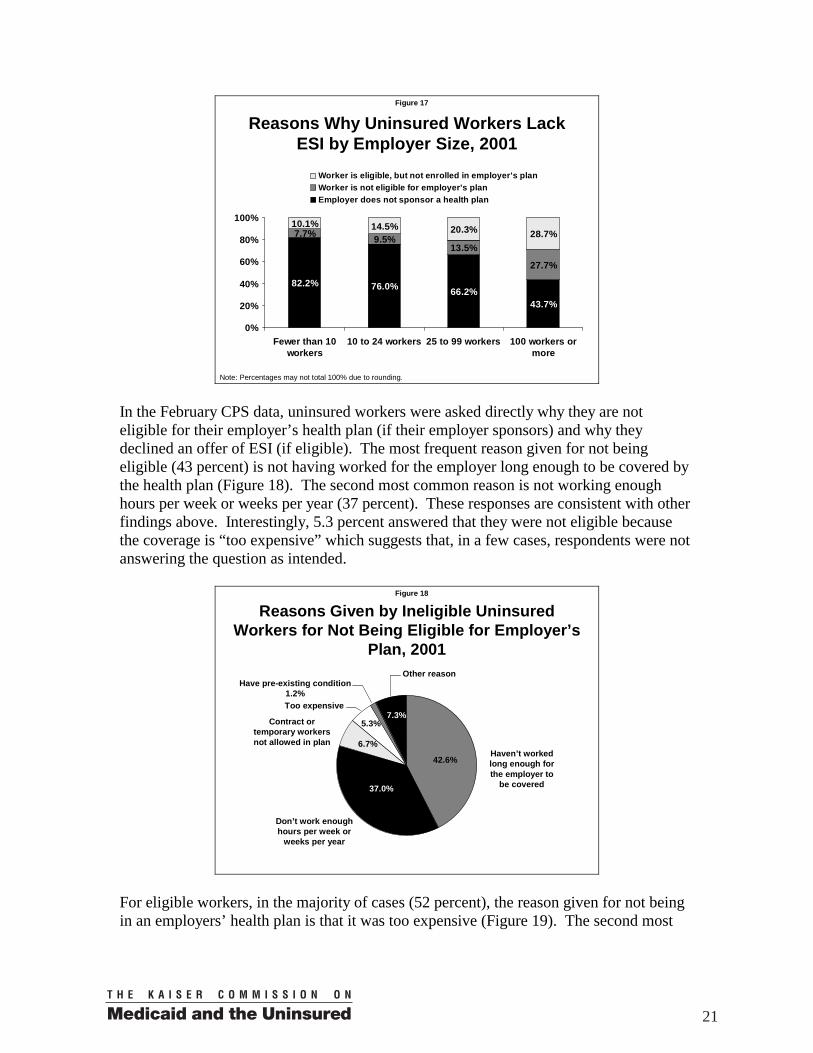
Figure 17
Reasons Why Uninsured Workers Lack ESI by Employer Size, 2001
82.2% 76.0% 66.2%43.7%
7.7% 9.5%13.5%
27.7%
10.1% 14.5% 20.3% 28.7%
0%
20%
40%
60%
80%
100%
Fewer than 10workers
10 to 24 workers 25 to 99 workers 100 workers ormore
Worker is eligible, but not enrolled in employer's planWorker is not eligible for employer's planEmployer does not sponsor a health plan
Note: Percentages may not total 100% due to rounding. In the February CPS data, uninsured workers were asked directly why they are not eligible for their employer’s health plan (if their employer sponsors) and why they declined an offer of ESI (if eligible). The most frequent reason given for not being eligible (43 percent) is not having worked for the employer long enough to be covered by the health plan (Figure 18). The second most common reason is not working enough hours per week or weeks per year (37 percent). These responses are consistent with other findings above. Interestingly, 5.3 percent answered that they were not eligible because the coverage is “too expensive” which suggests that, in a few cases, respondents were not answering the question as intended.
Figure 18
Reasons Given by Ineligible Uninsured Workers for Not Being Eligible for Employer’s
Plan, 2001
Haven’t worked long enough for the employer to
be covered
Contract or temporary workers not allowed in plan
Don’t work enough hours per week or
weeks per year
Too expensive
Have pre-existing condition 1.2%
Other reason
42.6%
37.0%
6.7%
7.3%5.3%
For eligible workers, in the majority of cases (52 percent), the reason given for not being in an employers’ health plan is that it was too expensive (Figure 19). The second most
21
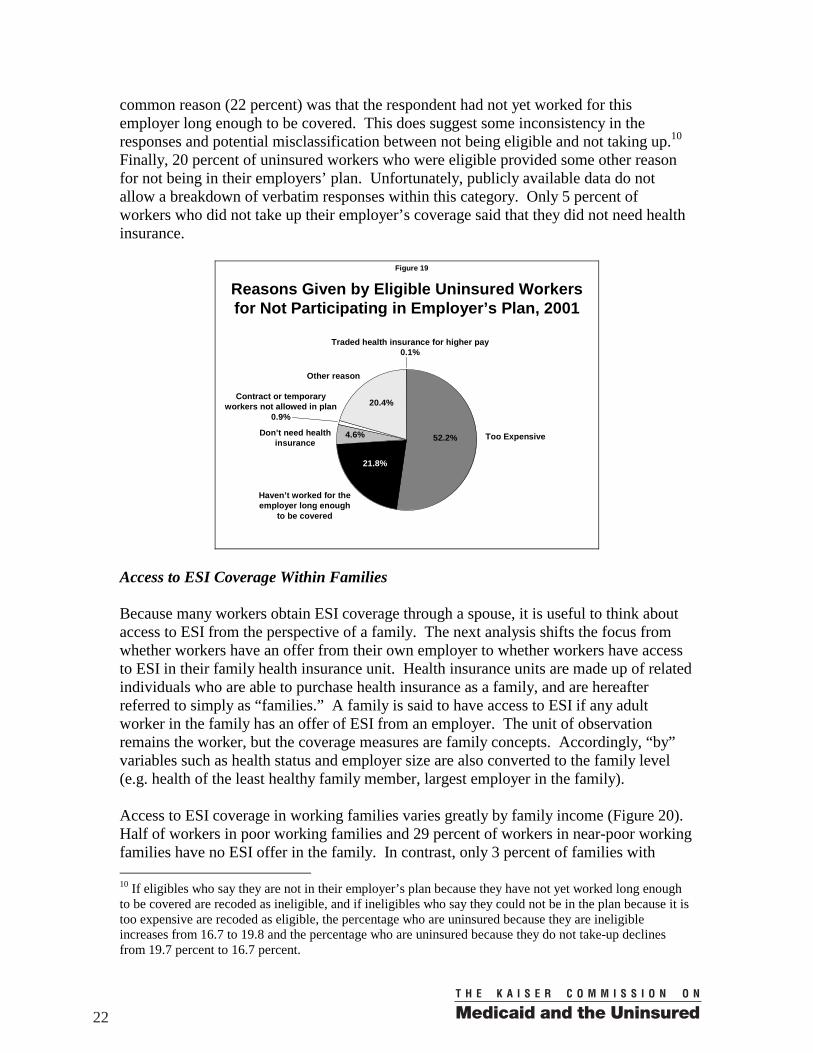
common reason (22 percent) was that the respondent had not yet worked for this employer long enough to be covered. This does suggest some inconsistency in the responses and potential misclassification between not being eligible and not taking up.10 Finally, 20 percent of uninsured workers who were eligible provided some other reason for not being in their employers’ plan. Unfortunately, publicly available data do not allow a breakdown of verbatim responses within this category. Only 5 percent of workers who did not take up their employer’s coverage said that they did not need health insurance.
Figure 19
Reasons Given by Eligible Uninsured Workers for Not Participating in Employer’s Plan, 2001
Too Expensive
Contract or temporary workers not allowed in plan
0.9%
Haven’t worked for the employer long enough
to be covered
Don’t need health insurance
Traded health insurance for higher pay 0.1%
Other reason
52.2%
21.8%
4.6%
20.4%
Access to ESI Coverage Within Families Because many workers obtain ESI coverage through a spouse, it is useful to think about access to ESI from the perspective of a family. The next analysis shifts the focus from whether workers have an offer from their own employer to whether workers have access to ESI in their family health insurance unit. Health insurance units are made up of related individuals who are able to purchase health insurance as a family, and are hereafter referred to simply as “families.” A family is said to have access to ESI if any adult worker in the family has an offer of ESI from an employer. The unit of observation remains the worker, but the coverage measures are family concepts. Accordingly, “by” variables such as health status and employer size are also converted to the family level (e.g. health of the least healthy family member, largest employer in the family). Access to ESI coverage in working families varies greatly by family income (Figure 20). Half of workers in poor working families and 29 percent of workers in near-poor working families have no ESI offer in the family. In contrast, only 3 percent of families with 10 If eligibles who say they are not in their employer’s plan because they have not yet worked long enough to be covered are recoded as ineligible, and if ineligibles who say they could not be in the plan because it is too expensive are recoded as eligible, the percentage who are uninsured because they are ineligible increases from 16.7 to 19.8 and the percentage who are uninsured because they do not take-up declines from 19.7 percent to 16.7 percent.
22
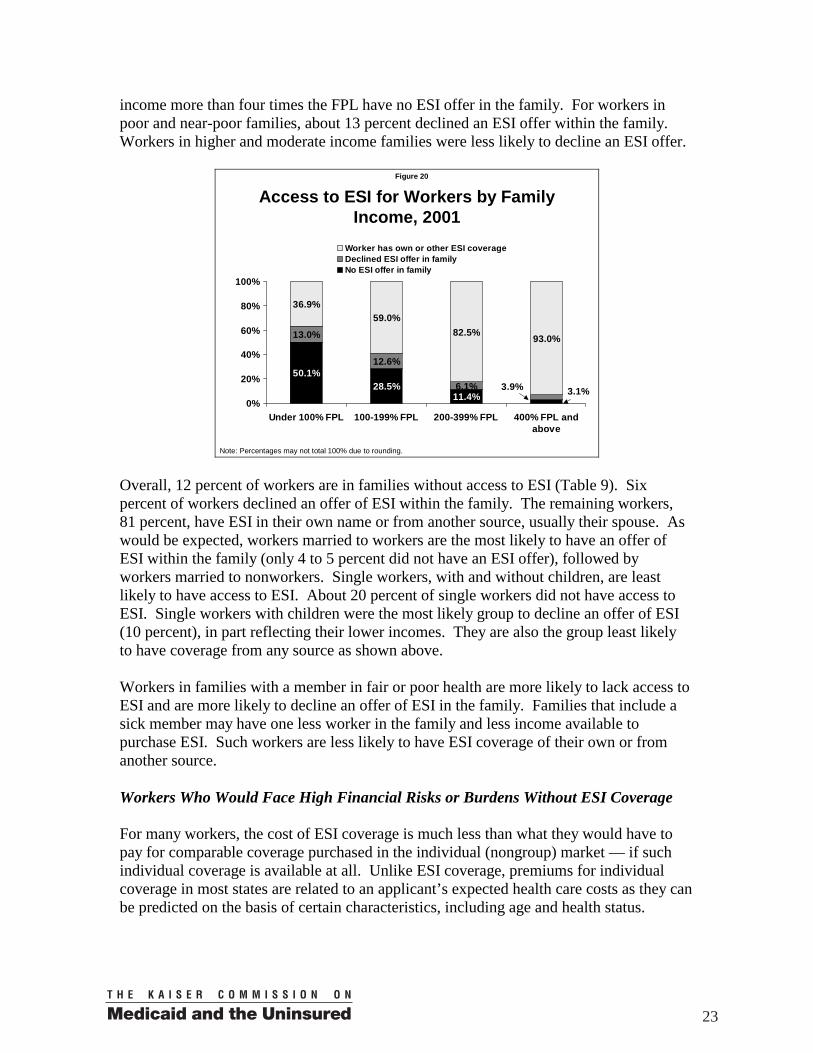
income more than four times the FPL have no ESI offer in the family. For workers in poor and near-poor families, about 13 percent declined an ESI offer within the family. Workers in higher and moderate income families were less likely to decline an ESI offer.
Figure 20
Access to ESI for Workers by Family Income, 2001
50.1%28.5%
11.4%
13.0%
12.6%
6.1%
36.9%59.0%
82.5% 93.0%
3.1%3.9%
0%
20%
40%
60%
80%
100%
Under 100% FPL 100-199% FPL 200-399% FPL 400% FPL andabove
Worker has own or other ESI coverageDeclined ESI offer in familyNo ESI offer in family
Note: Percentages may not total 100% due to rounding. Overall, 12 percent of workers are in families without access to ESI (Table 9). Six percent of workers declined an offer of ESI within the family. The remaining workers, 81 percent, have ESI in their own name or from another source, usually their spouse. As would be expected, workers married to workers are the most likely to have an offer of ESI within the family (only 4 to 5 percent did not have an ESI offer), followed by workers married to nonworkers. Single workers, with and without children, are least likely to have access to ESI. About 20 percent of single workers did not have access to ESI. Single workers with children were the most likely group to decline an offer of ESI (10 percent), in part reflecting their lower incomes. They are also the group least likely to have coverage from any source as shown above. Workers in families with a member in fair or poor health are more likely to lack access to ESI and are more likely to decline an offer of ESI in the family. Families that include a sick member may have one less worker in the family and less income available to purchase ESI. Such workers are less likely to have ESI coverage of their own or from another source. Workers Who Would Face High Financial Risks or Burdens Without ESI Coverage For many workers, the cost of ESI coverage is much less than what they would have to pay for comparable coverage purchased in the individual (nongroup) market — if such individual coverage is available at all. Unlike ESI coverage, premiums for individual coverage in most states are related to an applicant’s expected health care costs as they can be predicted on the basis of certain characteristics, including age and health status.
23
How Health Insurance Costs Vary with Age and Health Status. Health care expenditures tend to increase with age. Data from the 1999 Medical Expenditure Panel Survey (MEPS), for example, show that average medical expenditures for people age 45 to 64 is about $2,778 compared to $1,464 for people age 18 to 44 (Agency for Healthcare Research and Quality [AHRQ] 2003).11 Reflecting the higher expected costs of older people and the common practice of adjusting premiums accordingly, premiums for nongroup coverage tend to be higher for older individuals. Health care expenditures also tend to be higher for people with poorer self-perceived health status. Medical expenditures in 1999 were $988 for people who report being in excellent health, $1,557 for people in very good health, $2,287 for people in good health, $5,860 for people in fair health, and $11,971 for people in poor health (AHRQ 2003). Individual (Nongroup) Coverage as an Alternative to ESI. Workers in less than perfect health who lose their ESI coverage, because they lose their job or their employer stopped offering coverage, would likely face higher premiums or have difficulties obtaining comparable coverage in the individual market. A study by Pollitz, Sorian, and Thomas (2001) examined the process by which insurers decide who is offered coverage and the premium and other terms of the coverage, i.e. underwriting practices, in the individual coverage market. Several insurers in individual coverage markets that are not heavily regulated were asked to consider the applications of several hypothetical applicants as if they were real. Hypothetical applicants in less than perfect health were often not able to obtain coverage, were offered coverage at higher than standard rates, or were offered policies that excluded care related to particular conditions, body systems, or body parts. In a study of quoted premiums for individual health insurance plans across several cities in 1999, the median annual premium for a single policy with a $1,000 deductible (in-network) was $2,568 for someone age 50 and $4,032 for someone age 60, unadjusted for health history (Simantov, Schoen, and Brugman 2001).12 Health history would be an important consideration, however, since the likelihood of having a chronic health condition and the number of chronic conditions increases with age. Only about 42 percent of people age 45 to 64 do not have a chronic condition, while 13 percent have three or more chronic conditions (Hwang et al. 2001). Older or sicker workers, therefore, would likely be substantially worse off if they were to lose access to ESI coverage and face the choice of purchasing coverage in the individual market (most likely with a higher deductible) or being uninsured. In contrast to the individual coverage market, the workplace brings together people with varying needs for health care. Consequently, premiums are based largely on the expected cost of providing health care coverage to the group. Higher than average users of health care benefit substantially by having their expenses averaged over an employment group that usually includes more healthy than sick individuals. At the same time, risk-averse workers with lower than average expected health care costs still generally find it
11 Computed as the fraction with any expense times the average expenditure of those persons with an expense. 12 These premium figures reflect the lowest-cost plan in the deductible group.
24
worthwhile to participate in their employers’ health plans.1 In contrast to the 1999 estimates of nongroup premiums cited above, the average annual total ESI premium (worker and employer share combined) was $2,270 for single coverage in 1999 (Kaiser Family Foundation and Health Research and Educational Trust 2000). Affordability of Premiums. Losing ESI would be especially burdensome for people in low-income families. In 2001, the federal poverty line for a non-elderly two person family in the continental U.S. was $11,920. It would be quite difficult for a family earning twice that amount with an older worker to afford an individual coverage premium of $2,500, and then possibly to face a $1,000 deductible. It is not surprising, therefore, that very few low-income families purchase nongroup coverage. Only about 11 percent of non-elderly people without access to ESI or public coverage in families with income from 100 to 199 percent of poverty, and with a family member with at least one chronic condition, purchased nongroup coverage according to a recent study (Pauly and Nichols 2002). In comparison, the study showed that about 60 percent of otherwise similar people with incomes of four times the FPL or higher purchased nongroup coverage. Because the potential financial risk associated with losing ESI increases with age and illness and the burden of that risk is higher for those with lower incomes, it is useful to understand the size of worker populations who, if they were to lose ESI, would face substantial difficulties by being exposed to various combinations of these factors. Number of Workers by Selected Income, Age, and Health Status Categories. About 12.7 million workers age 19 to 34 are in families with income below 200 percent of the FPL (see Table 10) and about 6.4 million of these workers have ESI as shown in Figure 21. Two million of these poor or near-poor workers with ESI say that they have less than very good health (good, fair, or poor health). Despite their relative youth, these workers would have difficulty affording individual coverage if they were to lose their jobs or their access to ESI. There are about 1.2 million workers age 35 to 44, 900,000 workers age 45 to 54, and 400,000 workers age 55 to 64 who are in less than very good health, who are poor or near-poor, and who depend on ESI for coverage and who would likely be far worse off without it. Another group of workers who would face a substantial financial risk or burden if they lose ESI coverage are workers with higher but still moderate incomes who are sicker (bottom, Table 10). There are about 500,000 workers age 45 to 54 and 400,000 workers age 55 to 64 with incomes from 200 to 399 percent of poverty who are in fair or poor health and who rely on ESI for health insurance coverage. It is doubtful that many of these workers would be able to obtain similar coverage in the individual market at an affordable price.
1 Because of the low administrative load of ESI relative to individual nongroup coverage and the favorable tax treatment of employer payments for ESI premiums, ESI coverage is typically a good deal relative to nongroup coverage even for workers with low expected health care costs. Custer et al. (1995) discuss this point.
25
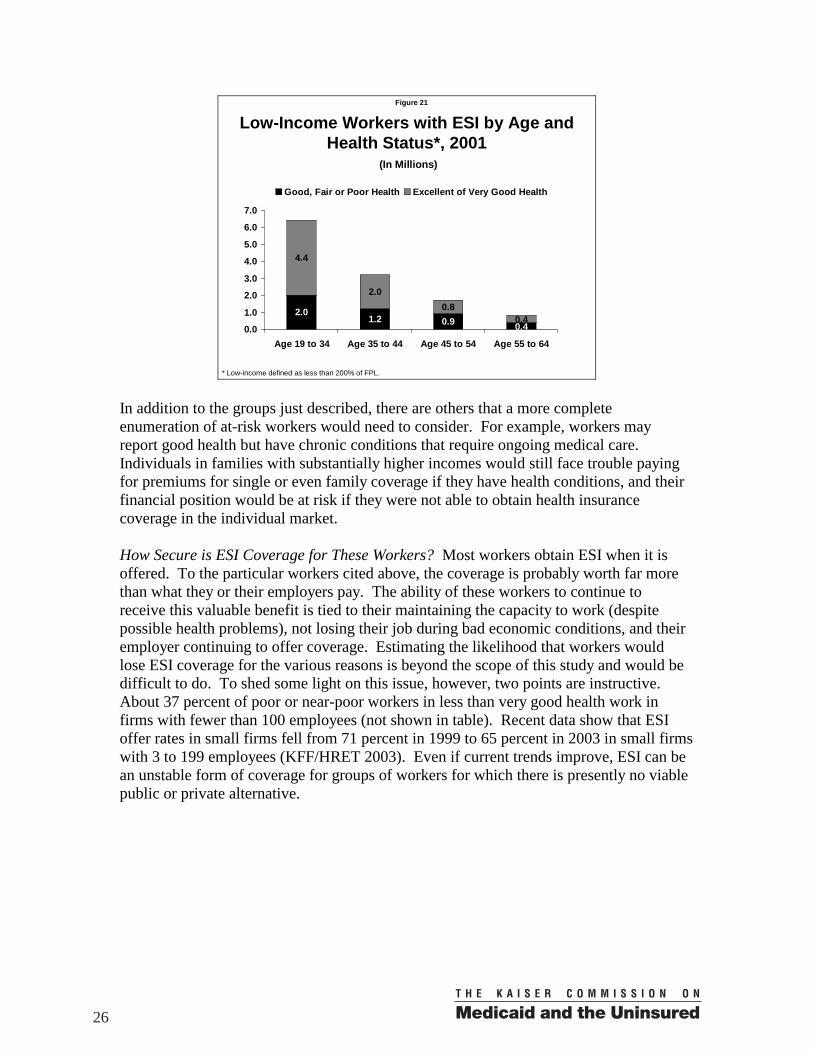
Figure 21
Low-Income Workers with ESI by Age and Health Status*, 2001
2.01.2 0.9
4.4
2.00.8
0.40.4
0.0
1.0
2.0
3.0
4.0
5.0
6.0
7.0
Age 19 to 34 Age 35 to 44 Age 45 to 54 Age 55 to 64
Good, Fair or Poor Health Excellent of Very Good Health
(In Millions)
* Low-income defined as less than 200% of FPL.
In addition to the groups just described, there are others that a more complete enumeration of at-risk workers would need to consider. For example, workers may report good health but have chronic conditions that require ongoing medical care. Individuals in families with substantially higher incomes would still face trouble paying for premiums for single or even family coverage if they have health conditions, and their financial position would be at risk if they were not able to obtain health insurance coverage in the individual market. How Secure is ESI Coverage for These Workers? Most workers obtain ESI when it is offered. To the particular workers cited above, the coverage is probably worth far more than what they or their employers pay. The ability of these workers to continue to receive this valuable benefit is tied to their maintaining the capacity to work (despite possible health problems), not losing their job during bad economic conditions, and their employer continuing to offer coverage. Estimating the likelihood that workers would lose ESI coverage for the various reasons is beyond the scope of this study and would be difficult to do. To shed some light on this issue, however, two points are instructive. About 37 percent of poor or near-poor workers in less than very good health work in firms with fewer than 100 employees (not shown in table). Recent data show that ESI offer rates in small firms fell from 71 percent in 1999 to 65 percent in 2003 in small firms with 3 to 199 employees (KFF/HRET 2003). Even if current trends improve, ESI can be an unstable form of coverage for groups of workers for which there is presently no viable public or private alternative.
26
Discussion and Conclusion Many of the findings above, in concert with the findings of other studies, have important implications for policies that would expand health insurance coverage to more workers. Encouraging more employers to sponsor ESI coverage would go a long way in covering uninsured workers, assuming that workers would participate at rates similar to (or not far below) workers who already have access to ESI. Employers not sponsoring health benefits is the most commonly observed reason why some workers are uninsured. Sixty-four percent of uninsured workers work for a non-sponsoring firm. The rate is even higher (82 percent) for workers in firms with fewer than 10 employees. Expanding the number of employers that sponsor would also make ESI a more stable form of coverage, since workers who lose or leave a job with ESI would then have a better chance of finding another job with ESI. In addition to expanding ESI sponsorship, it is important that current workers who may have health problems have greater access to coverage options that are not attached to a particular employer. As reported above, there are about 1.7 million adult workers with ESI who are in fair or poor health and have only moderate income and about 4.5 million workers who are in less than very good health and are poor or near-poor.14 Should they lose their ESI for any reason, they would face stark choices between paying a large share of their income for nongroup premiums, if they are able to obtain such coverage at all, or being uninsured. Higher income workers with poor health could also face serious difficulties obtaining or paying for nongroup coverage. Nearly 20 percent of uninsured workers were offered coverage but do not participate in their employers’ plans, making non-participation the second most common reason why workers lack coverage, with not being eligible coming in a close third (16 percent of uninsured workers). When workers are offered coverage, take-up rates are typically high, with an overall take-up rate of 85 percent. Take-up rates are notably higher than offer rates for poor, near-poor, and moderate-income workers, but take-up rates fall substantially with income. Slightly more than half of uninsured workers who were offered ESI said that the coverage was too expensive. About 55 percent of the 15.1 million uninsured workers (excluding the self-employed) are in poor or near-poor families with income less than two times the poverty level. These findings all suggest that the affordability of health insurance premiums is a key determinant of why workers lack ESI coverage and are uninsured. There is room for debate about what affordable means, but there is little doubt that take-up rates are the lowest for workers with the least purchasing power. This is true even in analyses that control for other worker characteristics in order to better isolate the effect of income (e.g., Cunningham 1999). There is also a strong positive relationship between income and purchase of nongroup coverage (Pauly and Nichols 2002). Accordingly, addressing the affordability of premiums is a key component of many policy proposals to reduce the number of uninsured workers. 14 Reported in Table 10, summing over all age groups.
27
Policy proposals to expand coverage vary both in their benefits and who is eligible for the benefits. They include creating new health insurance purchasing pools and providing premium subsidies to individuals or employers. State-administered health insurance purchasing pools, such as those described by Holahan, Nichols, and Blumberg (2001), could ensure the availability of affordable insurance products to older and sicker workers who are likely to have high medical expenses. Such products could be made available both individually and through an employer. Premium subsidies (using a tax-credit, payment to workers or employers, or another mechanism) could expand coverage by reducing the price that individuals or employers effectively pay for coverage. Premium subsidy policies would need to specify what type of insurance products qualify for a subsidy. One possibility is a broad-based individual subsidy that could be applied to any type of coverage (ESI, nongroup, or a publicly-sponsored product). Alternatively, a narrowly-tailored subsidy might be applicable only to certain types of coverage, such as proposals for a tax-credit that can only be used to purchase nongroup coverage. All proposals to expand coverage must establish who is eligible for the benefits. Eligibility criteria might be based on family income (e.g., as a percentage of the poverty level), worker wages, or employment in a small firm, for example. Low income, low wages, and working in a small firm are all related to a lower likelihood of having health coverage, as shown above. Basing eligibility solely on working in a small firm means that low-income workers in larger firms will not be eligible. Basing eligibility on being a low-wage worker means that some low-wage workers with high family incomes will be made eligible. Since the choice of any eligibility criterion involves important trade-offs, it is important to consider ways of comparing them. Two measures by which eligibility criteria can be compared are the percentage of uninsured individuals who will be made eligible (target effectiveness) and the percentage of people eligible under the proposal who are uninsured (target efficiency). A more effective targeting strategy would cover a larger share of uninsured workers. A more efficient targeting strategy would provide fewer subsidy dollars to people who already have coverage than would a less efficient strategy. Prior research found that targeting subsidies to low-income workers is both more effective and more efficient than targeting subsidies to low-wage workers or to workers in small firms (Ferry et al. 2002). This result stems from the especially strong relationship between family income and the likelihood of having coverage. By boosting low-income workers’ purchasing power for health insurance, such subsidies would likely increase participation among workers who already have an offer and could provide additional incentives for more employers to offer health benefits.15 Economists generally think that employer decisions to offer health insurance coverage are largely driven by workers’ demands for coverage at the available premiums. To the extent an employer’s decision not to offer ESI does indeed stem from low demand for ESI among 15 To the extent that low-income workers who already have coverage receive a new subsidy, the limited family resources that had been directed to health insurance coverage could be devoted to other needs.
28
its workers, subsidizing workers’ purchase of ESI directly or through their employers would likely increase the number of employers that offer coverage. In the absence of some form of premium subsidy, simply mandating non-offering employers to offer coverage would likely harm workers if low demand for ESI on the part of workers is the root cause of employers not offering. One way workers might be harmed is if employers shifted the cost of the coverage onto workers by reducing their wages. Or, if labor costs increased, employers could respond by hiring fewer workers. Broad subsidies for low-income workers that would allow choice over what type of coverage to buy (ESI, individual/nongroup coverage, or a publicly-sponsored insurance product) would tend to expand coverage of all types. It would also, of course, be more costly than more narrowly-tailored proposals such as subsidizing workers to purchase health insurance coverage in the nongroup market using tax-credits. There is substantial debate and uncertainty over what the effects of tax-credits for nongroup coverage would be (Blumberg et al. 2003, Council of Economic Advisors 2002, Gruber 2002, Institute for Health Policy Solutions 2002, Pauly and Nichols 2002). Some have raised the concern that many workers, particularly young and healthy workers, would over time substitute nongroup coverage for ESI, and provide incentives for some employers to drop ESI coverage.16 While there is disagreement over the magnitude of such an effect, any erosion of the system of ESI coverage, which currently serves the useful function of pooling workers with different risks, may have particularly important adverse consequences for older and sicker workers. Having a better understanding of the gaps in the current employment-based health insurance system provides the context necessary to address some of the difficult questions raised by proposals to expand coverage. Policies that seek to expand coverage of a particular type or for particular groups are likely to have consequences on the whole system of health insurance coverage, both favorable and unfavorable, that are difficult to predict. They also require value judgments about what is affordable, which segments of the uninsured population have the greatest need, and whether we should be concerned that some subsidy dollars go to individuals who already have or can afford coverage. As policies, employment patterns, and health insurance markets shift, it will be important to monitor the gaps in health insurance coverage among workers.
16 Institute for Health Policy Solutions (2002) provides a detailed discussion of the potential that some employers, small firms in particular, would drop ESI coverage under a nongroup tax credit. Gruber (2002) estimated that 1.4 million would become uninsured due to employers dropping ESI, while the Council of Economic Advisors (2002) estimated that there would be little effect.
29
References
Agency for Healthcare Research and Quality (2003). 1999 Medical Expenditure Panel Survey - Table Compendium. Rockville, MD: AHRQ. Available at http://www.meps.ahrq.gov/CompendiumTables/TC_TOC.HTM.
Blumberg, Linda, Yu-Chu Shen, Len Nichols, Matthew Buettgens, Lisa Dubay, and Stacey McMorrow (2003). The Health Insurance Reform Simulation Model (HIRSM): Methodological Detail and Prototypical Simulation Results. Washington: The Urban Institute. Available at http://www.urban.org/url.cfm?ID=410867.
Council of Economic Advisors (2002). Health Insurance Tax Credits. February 14.
Cunningham, Peter (1999). Choosing To Be Uninsured: Determinants and Consequences of the Decision to Decline Employer-Sponsored Health Insurance. Working Paper. Washington DC: Center for Studying Health Systems Change. Available at http://www.hschange.org/CONTENT/266/.
Custer, William, Charles Khan, and Thomas Wildsmith. (2003). “Why We Should Keep the Employment-Based Health Insurance System.” Health Affairs. November/December. 18(6): 115-123.
Ferry, Daniel, Bowen Garrett, Sherry Glied, Emily Greenman, and Len Nichols (2002). “Health Insurance Expansions for Working Families: A Comparison of Targeting Strategies.” Health Affairs. July/August. 21(4): 246-254.
Garrett, Bowen, Len Nichols, and Emily Greenman (2001). Workers Without Health Insurance: Who Are They and How Can Policy Reach Them. Washington DC: The Urban Institute and W.K. Kellogg Foundation. Available at http://www.communityvoices.org/PolicyBriefs.aspx.
Gruber, Jon (2002). Testimony before the House Ways and Means Committee, Subcommitee on Health, Hearing on Health Insurance Tax Credits, February 13.
Holahan, John, Len Nichols, and Linda Blumberg (2001). “Expanding Health Insurance Coverage: A New Federal/State Approach” in Covering America: Real Remedies for the Uninsured. Washington DC: Economic and Social Research Institute.
Hwang, Wenke, Wendy Weller, Henry Ireys, and Gerard Anderson (2001). “Out-of-Pocket Medical Spending for Care of Chronic Conditions” Health Affairs. November/December. 20(6):267-278.
30
Institute for Health Policy Solutions (2002). Individual Tax Credits and Employer Coverage: Assessing and Reducing the Downside Risks. Washington DC: Author. January. Available at http://ihps.org/ihpsapril19final.PDF.
Kaiser Family Foundation and Health Research and Educational Trust. Employer Health Benefits: 2000 Summary of Findings. Menlo Park, CA and Chicago. Available at http://www.kff.org/content/2000/20000907a/SOF.pdf.
Monheit, Alan and Jessica Vistness (2002). Research Findings #2: Health Insurance Status of Workers and Their Families: 1996. Agency for Healthcare Research and Quality, Rockville, MD. January. Available at http://www.meps.ahrq.gov/papers/rf2_97-0065/rf2.htm.
Nichols, Len, Linda Blumberg, Gregory Acs, Cori Uccello, and Jill Marsteller (1997). Small Employers: Their Diversity and Health Insurance. Washington DC: The Urban Institute.
Pauly, Mark and Len Nichols (2002). “The Nongroup Health Insurance Market: Short on Facts, Long on Opinions and Policy Disputes” Health Affairs-Web Exclusive. Available at http://healthaffairs.org/WebExclusives/2106Pauly.pdf.
Pollitz, Karen, Richard Sorian, and Kathy Thomas (2001). How Accessible Is Individual Health Insurance for Consumers in Less than Perfect Health? Washington DC: Henry J. Kaiser Family Foundation. Available at http://www.kff.org/content/2001/20010620a/report.pdf.
Simantov, Elisabeth, Cathy Schoen, Stephanie Bruegman (2001). “Market Failure? Individual Insurance Markets for Older Americans” Health Affairs. July/August. 20(4): 139-149.
U.S. Bureau of the Census (2002). Health Insurance Coverage 2001. Current Population Reports #P60-220. Washington DC: Author. Available at http://www.census.gov/prod/2002pubs/p60-220.pdf.
U.S. Bureau of the Census (2003). Current Population Survey, Annual Social and Economic Supplements. Washington DC: Poverty and Health Statistics Branch/HHES Division. Available at http://www.census.gov/hhes/poverty/histpov/hstpov1.html.
31
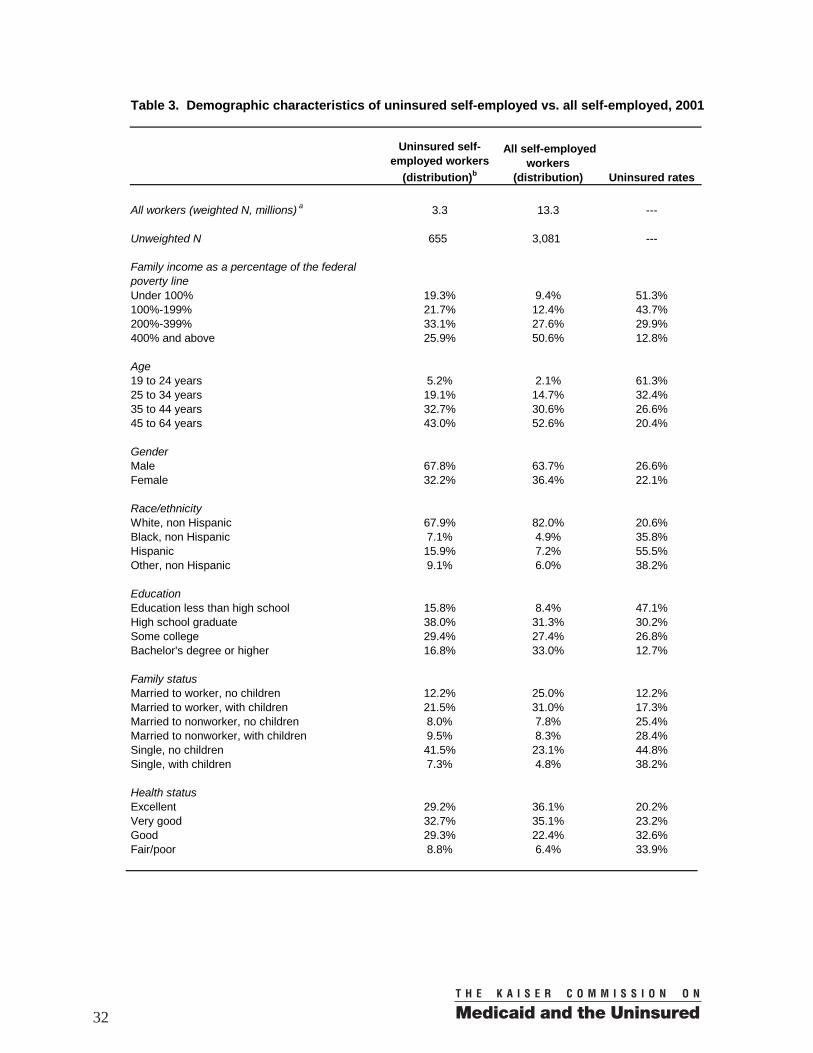
Uninsured self-employed workers
(distribution)b
All self-employed workers
(distribution) Uninsured rates
All workers (weighted N, millions) a 3.3 13.3 ---
Unweighted N 655 3,081 ---
Family income as a percentage of the federal poverty lineUnder 100% 19.3% 9.4% 51.3%100%-199% 21.7% 12.4% 43.7%200%-399% 33.1% 27.6% 29.9%400% and above 25.9% 50.6% 12.8%
Age19 to 24 years 5.2% 2.1% 61.3%25 to 34 years 19.1% 14.7% 32.4%35 to 44 years 32.7% 30.6% 26.6%45 to 64 years 43.0% 52.6% 20.4%
GenderMale 67.8% 63.7% 26.6%Female 32.2% 36.4% 22.1%
Race/ethnicityWhite, non Hispanic 67.9% 82.0% 20.6%Black, non Hispanic 7.1% 4.9% 35.8%Hispanic 15.9% 7.2% 55.5%Other, non Hispanic 9.1% 6.0% 38.2%
EducationEducation less than high school 15.8% 8.4% 47.1%High school graduate 38.0% 31.3% 30.2%Some college 29.4% 27.4% 26.8%Bachelor's degree or higher 16.8% 33.0% 12.7%
Family statusMarried to worker, no children 12.2% 25.0% 12.2%Married to worker, with children 21.5% 31.0% 17.3%Married to nonworker, no children 8.0% 7.8% 25.4%Married to nonworker, with children 9.5% 8.3% 28.4%Single, no children 41.5% 23.1% 44.8%Single, with children 7.3% 4.8% 38.2%
Health statusExcellent 29.2% 36.1% 20.2%Very good 32.7% 35.1% 23.2%Good 29.3% 22.4% 32.6%Fair/poor 8.8% 6.4% 33.9%
Table 3. Demographic characteristics of uninsured self-employed vs. all self-employed, 2001
32
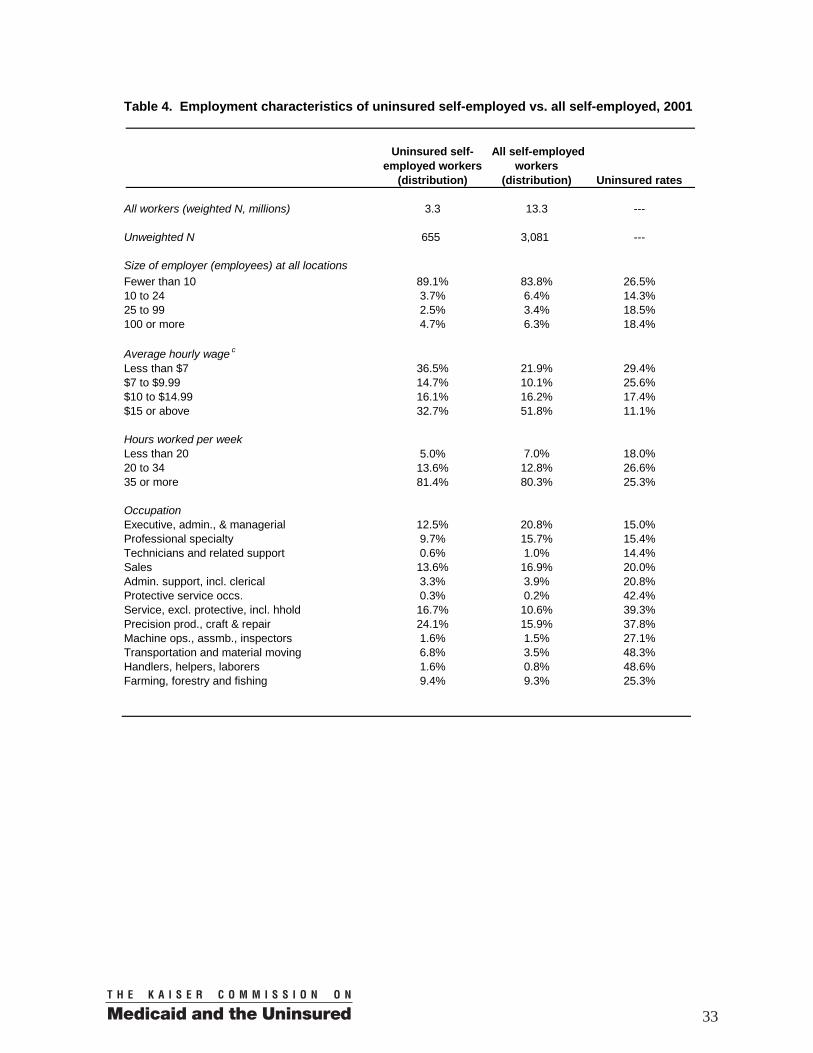
Uninsured self-employed workers
(distribution)
All self-employed workers
(distribution) Uninsured rates
All workers (weighted N, millions) 3.3 13.3 ---
Unweighted N 655 3,081 ---
Size of employer (employees) at all locationsFewer than 10 89.1% 83.8% 26.5%10 to 24 3.7% 6.4% 14.3%25 to 99 2.5% 3.4% 18.5%100 or more 4.7% 6.3% 18.4%
Average hourly wage c
Less than $7 36.5% 21.9% 29.4%$7 to $9.99 14.7% 10.1% 25.6%$10 to $14.99 16.1% 16.2% 17.4%$15 or above 32.7% 51.8% 11.1%
Hours worked per weekLess than 20 5.0% 7.0% 18.0%20 to 34 13.6% 12.8% 26.6%35 or more 81.4% 80.3% 25.3%
OccupationExecutive, admin., & managerial 12.5% 20.8% 15.0%Professional specialty 9.7% 15.7% 15.4%Technicians and related support 0.6% 1.0% 14.4%Sales 13.6% 16.9% 20.0%Admin. support, incl. clerical 3.3% 3.9% 20.8%Protective service occs. 0.3% 0.2% 42.4%Service, excl. protective, incl. hhold 16.7% 10.6% 39.3%Precision prod., craft & repair 24.1% 15.9% 37.8%Machine ops., assmb., inspectors 1.6% 1.5% 27.1%Transportation and material moving 6.8% 3.5% 48.3%Handlers, helpers, laborers 1.6% 0.8% 48.6%Farming, forestry and fishing 9.4% 9.3% 25.3%
Table 4. Employment characteristics of uninsured self-employed vs. all self-employed, 2001
33
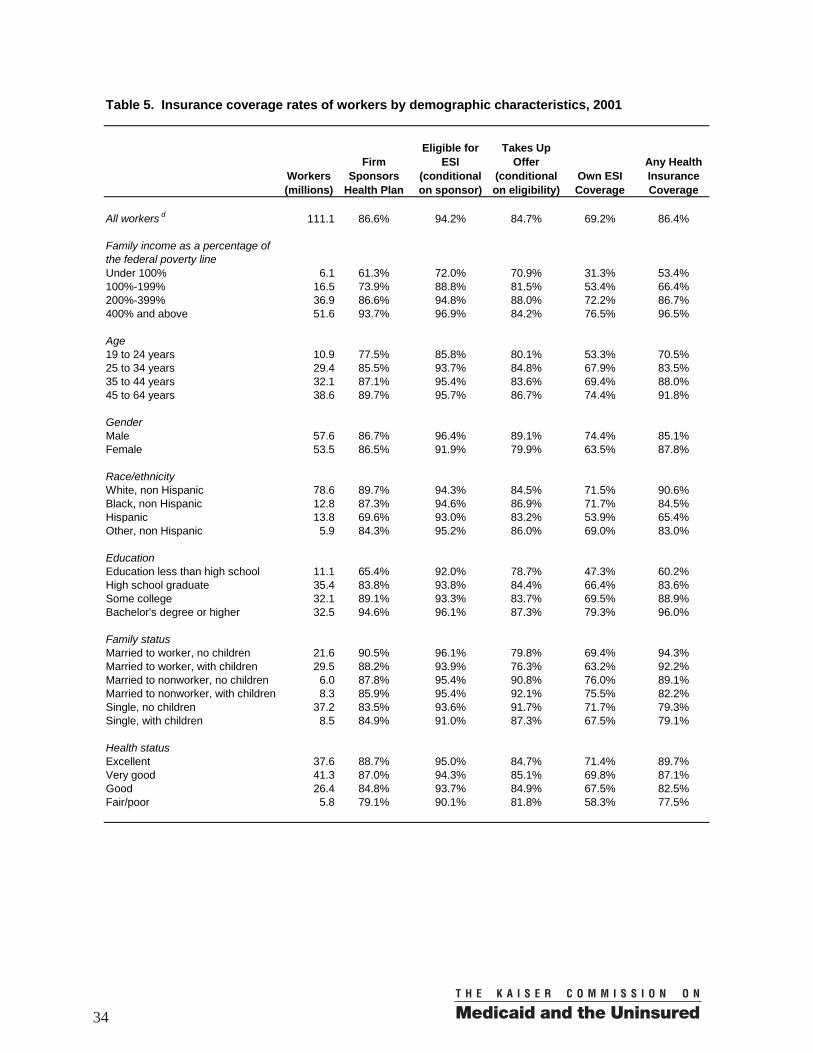
Workers(millions)
Firm Sponsors
Health Plan
Eligible for ESI
(conditional on sponsor)
Takes Up Offer
(conditional on eligibility)
Own ESI Coverage
Any Health Insurance Coverage
All workers d 111.1 86.6% 94.2% 84.7% 69.2% 86.4%
Family income as a percentage of the federal poverty lineUnder 100% 6.1 61.3% 72.0% 70.9% 31.3% 53.4%100%-199% 16.5 73.9% 88.8% 81.5% 53.4% 66.4%200%-399% 36.9 86.6% 94.8% 88.0% 72.2% 86.7%400% and above 51.6 93.7% 96.9% 84.2% 76.5% 96.5%
Age19 to 24 years 10.9 77.5% 85.8% 80.1% 53.3% 70.5%25 to 34 years 29.4 85.5% 93.7% 84.8% 67.9% 83.5%35 to 44 years 32.1 87.1% 95.4% 83.6% 69.4% 88.0%45 to 64 years 38.6 89.7% 95.7% 86.7% 74.4% 91.8%
GenderMale 57.6 86.7% 96.4% 89.1% 74.4% 85.1%Female 53.5 86.5% 91.9% 79.9% 63.5% 87.8%
Race/ethnicityWhite, non Hispanic 78.6 89.7% 94.3% 84.5% 71.5% 90.6%Black, non Hispanic 12.8 87.3% 94.6% 86.9% 71.7% 84.5%Hispanic 13.8 69.6% 93.0% 83.2% 53.9% 65.4%Other, non Hispanic 5.9 84.3% 95.2% 86.0% 69.0% 83.0%
EducationEducation less than high school 11.1 65.4% 92.0% 78.7% 47.3% 60.2%High school graduate 35.4 83.8% 93.8% 84.4% 66.4% 83.6%Some college 32.1 89.1% 93.3% 83.7% 69.5% 88.9%Bachelor's degree or higher 32.5 94.6% 96.1% 87.3% 79.3% 96.0%
Family statusMarried to worker, no children 21.6 90.5% 96.1% 79.8% 69.4% 94.3%Married to worker, with children 29.5 88.2% 93.9% 76.3% 63.2% 92.2%Married to nonworker, no children 6.0 87.8% 95.4% 90.8% 76.0% 89.1%Married to nonworker, with children 8.3 85.9% 95.4% 92.1% 75.5% 82.2%Single, no children 37.2 83.5% 93.6% 91.7% 71.7% 79.3%Single, with children 8.5 84.9% 91.0% 87.3% 67.5% 79.1%
Health statusExcellent 37.6 88.7% 95.0% 84.7% 71.4% 89.7%Very good 41.3 87.0% 94.3% 85.1% 69.8% 87.1%Good 26.4 84.8% 93.7% 84.9% 67.5% 82.5%Fair/poor 5.8 79.1% 90.1% 81.8% 58.3% 77.5%
Table 5. Insurance coverage rates of workers by demographic characteristics, 2001
34
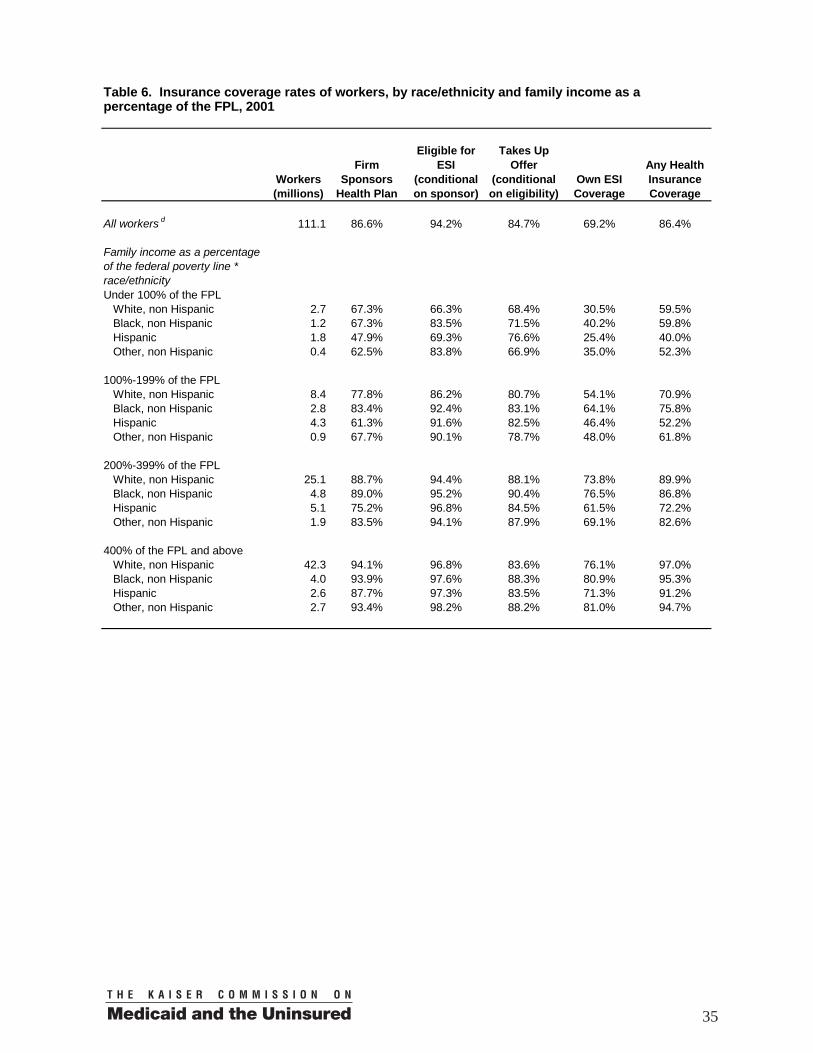
Workers(millions)
Firm Sponsors
Health Plan
Eligible for ESI
(conditional on sponsor)
Takes Up Offer
(conditional on eligibility)
Own ESI Coverage
Any Health Insurance Coverage
All workers d 111.1 86.6% 94.2% 84.7% 69.2% 86.4%
Family income as a percentage of the federal poverty line * race/ethnicityUnder 100% of the FPL
White, non Hispanic 2.7 67.3% 66.3% 68.4% 30.5% 59.5%Black, non Hispanic 1.2 67.3% 83.5% 71.5% 40.2% 59.8%Hispanic 1.8 47.9% 69.3% 76.6% 25.4% 40.0%Other, non Hispanic 0.4 62.5% 83.8% 66.9% 35.0% 52.3%
100%-199% of the FPLWhite, non Hispanic 8.4 77.8% 86.2% 80.7% 54.1% 70.9%Black, non Hispanic 2.8 83.4% 92.4% 83.1% 64.1% 75.8%Hispanic 4.3 61.3% 91.6% 82.5% 46.4% 52.2%Other, non Hispanic 0.9 67.7% 90.1% 78.7% 48.0% 61.8%
200%-399% of the FPLWhite, non Hispanic 25.1 88.7% 94.4% 88.1% 73.8% 89.9%Black, non Hispanic 4.8 89.0% 95.2% 90.4% 76.5% 86.8%Hispanic 5.1 75.2% 96.8% 84.5% 61.5% 72.2%Other, non Hispanic 1.9 83.5% 94.1% 87.9% 69.1% 82.6%
400% of the FPL and aboveWhite, non Hispanic 42.3 94.1% 96.8% 83.6% 76.1% 97.0%Black, non Hispanic 4.0 93.9% 97.6% 88.3% 80.9% 95.3%Hispanic 2.6 87.7% 97.3% 83.5% 71.3% 91.2%Other, non Hispanic 2.7 93.4% 98.2% 88.2% 81.0% 94.7%
Table 6. Insurance coverage rates of workers, by race/ethnicity and family income as a percentage of the FPL, 2001
35
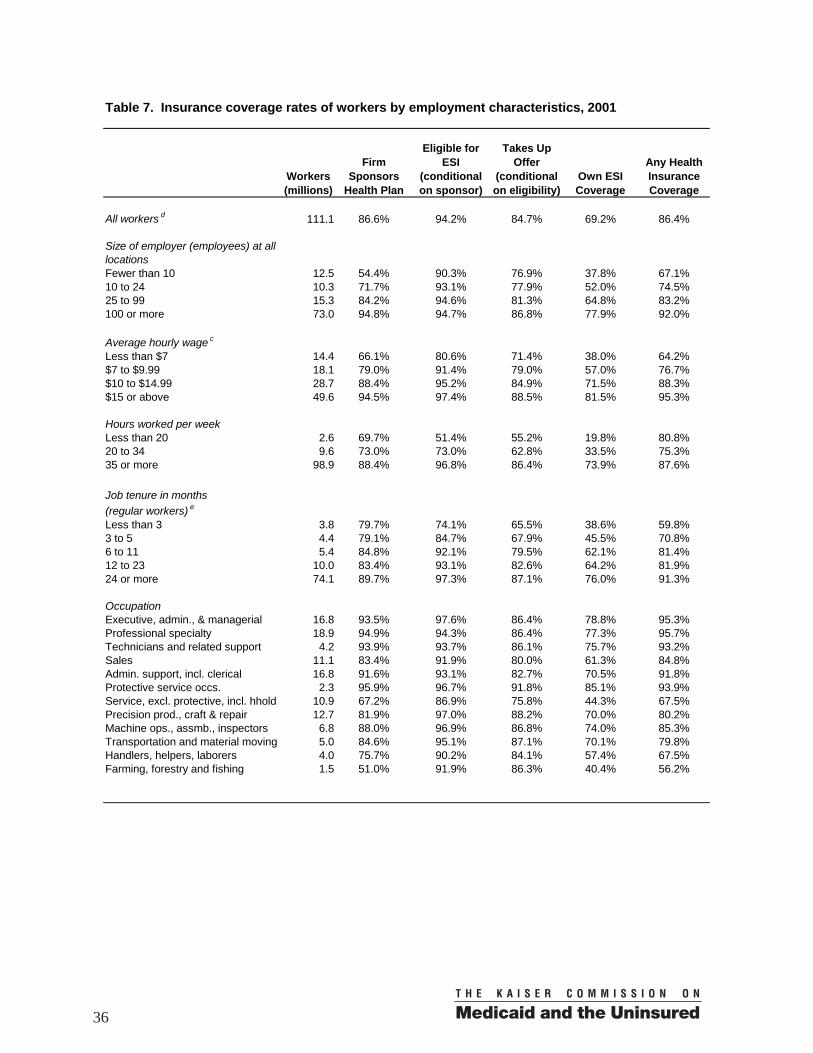
Workers(millions)
Firm Sponsors
Health Plan
Eligible for ESI
(conditional on sponsor)
Takes Up Offer
(conditional on eligibility)
Own ESI Coverage
Any Health Insurance Coverage
All workers d 111.1 86.6% 94.2% 84.7% 69.2% 86.4%
Size of employer (employees) at all locationsFewer than 10 12.5 54.4% 90.3% 76.9% 37.8% 67.1%10 to 24 10.3 71.7% 93.1% 77.9% 52.0% 74.5%25 to 99 15.3 84.2% 94.6% 81.3% 64.8% 83.2%100 or more 73.0 94.8% 94.7% 86.8% 77.9% 92.0%
Average hourly wage c
Less than $7 14.4 66.1% 80.6% 71.4% 38.0% 64.2%$7 to $9.99 18.1 79.0% 91.4% 79.0% 57.0% 76.7%$10 to $14.99 28.7 88.4% 95.2% 84.9% 71.5% 88.3%$15 or above 49.6 94.5% 97.4% 88.5% 81.5% 95.3%
Hours worked per weekLess than 20 2.6 69.7% 51.4% 55.2% 19.8% 80.8%20 to 34 9.6 73.0% 73.0% 62.8% 33.5% 75.3%35 or more 98.9 88.4% 96.8% 86.4% 73.9% 87.6%
Job tenure in months (regular workers) e
Less than 3 3.8 79.7% 74.1% 65.5% 38.6% 59.8%3 to 5 4.4 79.1% 84.7% 67.9% 45.5% 70.8%6 to 11 5.4 84.8% 92.1% 79.5% 62.1% 81.4%12 to 23 10.0 83.4% 93.1% 82.6% 64.2% 81.9%24 or more 74.1 89.7% 97.3% 87.1% 76.0% 91.3%
OccupationExecutive, admin., & managerial 16.8 93.5% 97.6% 86.4% 78.8% 95.3%Professional specialty 18.9 94.9% 94.3% 86.4% 77.3% 95.7%Technicians and related support 4.2 93.9% 93.7% 86.1% 75.7% 93.2%Sales 11.1 83.4% 91.9% 80.0% 61.3% 84.8%Admin. support, incl. clerical 16.8 91.6% 93.1% 82.7% 70.5% 91.8%Protective service occs. 2.3 95.9% 96.7% 91.8% 85.1% 93.9%Service, excl. protective, incl. hhold 10.9 67.2% 86.9% 75.8% 44.3% 67.5%Precision prod., craft & repair 12.7 81.9% 97.0% 88.2% 70.0% 80.2%Machine ops., assmb., inspectors 6.8 88.0% 96.9% 86.8% 74.0% 85.3%Transportation and material moving 5.0 84.6% 95.1% 87.1% 70.1% 79.8%Handlers, helpers, laborers 4.0 75.7% 90.2% 84.1% 57.4% 67.5%Farming, forestry and fishing 1.5 51.0% 91.9% 86.3% 40.4% 56.2%
Table 7. Insurance coverage rates of workers by employment characteristics, 2001
36
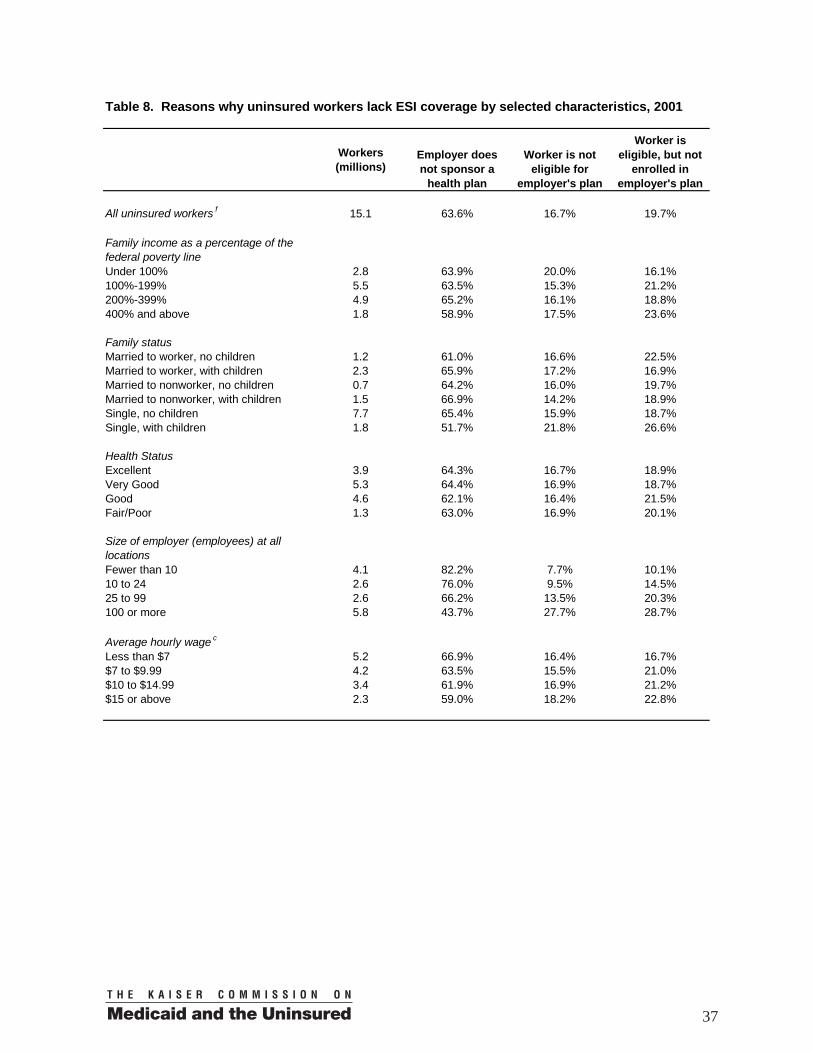
Workers(millions)
Employer does not sponsor a
health plan
Worker is not eligible for
employer's plan
Worker is eligible, but not
enrolled in employer's plan
All uninsured workers f 15.1 63.6% 16.7% 19.7%
Family income as a percentage of the federal poverty lineUnder 100% 2.8 63.9% 20.0% 16.1%100%-199% 5.5 63.5% 15.3% 21.2%200%-399% 4.9 65.2% 16.1% 18.8%400% and above 1.8 58.9% 17.5% 23.6%
Family statusMarried to worker, no children 1.2 61.0% 16.6% 22.5%Married to worker, with children 2.3 65.9% 17.2% 16.9%Married to nonworker, no children 0.7 64.2% 16.0% 19.7%Married to nonworker, with children 1.5 66.9% 14.2% 18.9%Single, no children 7.7 65.4% 15.9% 18.7%Single, with children 1.8 51.7% 21.8% 26.6%
Health StatusExcellent 3.9 64.3% 16.7% 18.9%Very Good 5.3 64.4% 16.9% 18.7%Good 4.6 62.1% 16.4% 21.5%Fair/Poor 1.3 63.0% 16.9% 20.1%
Size of employer (employees) at all locationsFewer than 10 4.1 82.2% 7.7% 10.1%10 to 24 2.6 76.0% 9.5% 14.5%25 to 99 2.6 66.2% 13.5% 20.3%100 or more 5.8 43.7% 27.7% 28.7%
Average hourly wage c
Less than $7 5.2 66.9% 16.4% 16.7%$7 to $9.99 4.2 63.5% 15.5% 21.0%$10 to $14.99 3.4 61.9% 16.9% 21.2%$15 or above 2.3 59.0% 18.2% 22.8%
Table 8. Reasons why uninsured workers lack ESI coverage by selected characteristics, 2001
37
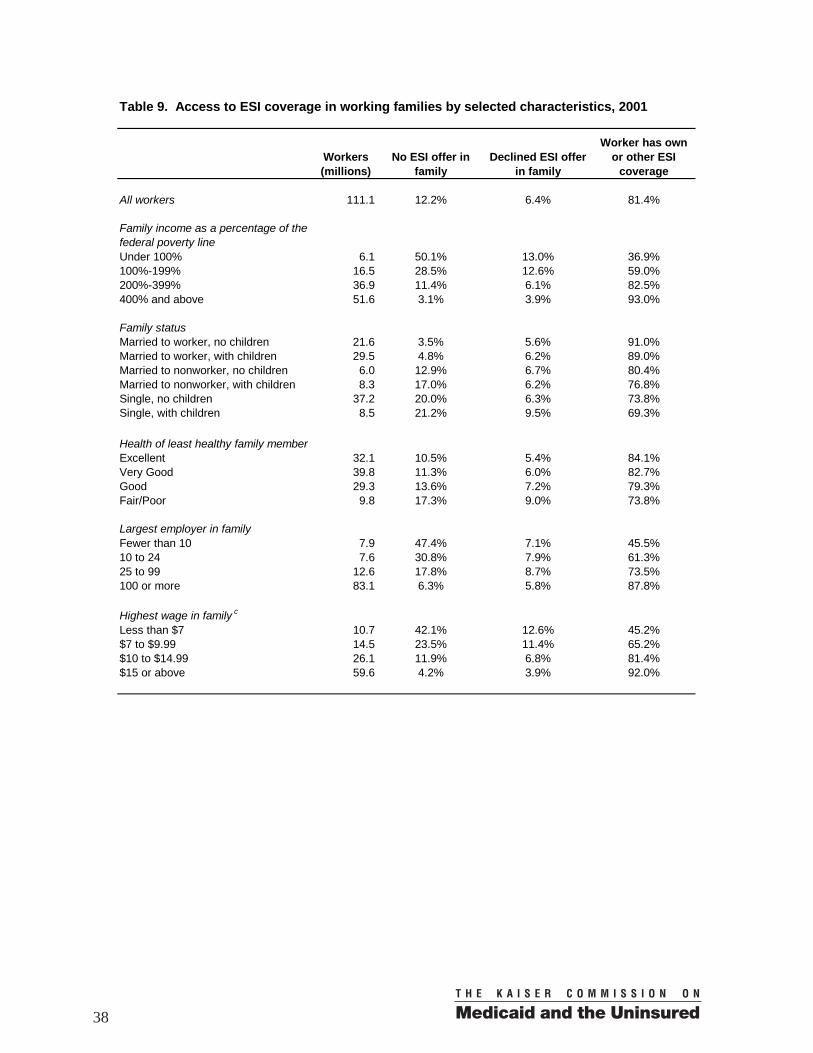
Workers(millions)
No ESI offer in family
Declined ESI offer in family
Worker has own or other ESI
coverage
All workers 111.1 12.2% 6.4% 81.4%
Family income as a percentage of the federal poverty lineUnder 100% 6.1 50.1% 13.0% 36.9%100%-199% 16.5 28.5% 12.6% 59.0%200%-399% 36.9 11.4% 6.1% 82.5%400% and above 51.6 3.1% 3.9% 93.0%
Family statusMarried to worker, no children 21.6 3.5% 5.6% 91.0%Married to worker, with children 29.5 4.8% 6.2% 89.0%Married to nonworker, no children 6.0 12.9% 6.7% 80.4%Married to nonworker, with children 8.3 17.0% 6.2% 76.8%Single, no children 37.2 20.0% 6.3% 73.8%Single, with children 8.5 21.2% 9.5% 69.3%
Health of least healthy family memberExcellent 32.1 10.5% 5.4% 84.1%Very Good 39.8 11.3% 6.0% 82.7%Good 29.3 13.6% 7.2% 79.3%Fair/Poor 9.8 17.3% 9.0% 73.8%
Largest employer in familyFewer than 10 7.9 47.4% 7.1% 45.5%10 to 24 7.6 30.8% 7.9% 61.3%25 to 99 12.6 17.8% 8.7% 73.5%100 or more 83.1 6.3% 5.8% 87.8%
Highest wage in family c
Less than $7 10.7 42.1% 12.6% 45.2%$7 to $9.99 14.5 23.5% 11.4% 65.2%$10 to $14.99 26.1 11.9% 6.8% 81.4%$15 or above 59.6 4.2% 3.9% 92.0%
Table 9. Access to ESI coverage in working families by selected characteristics, 2001
38
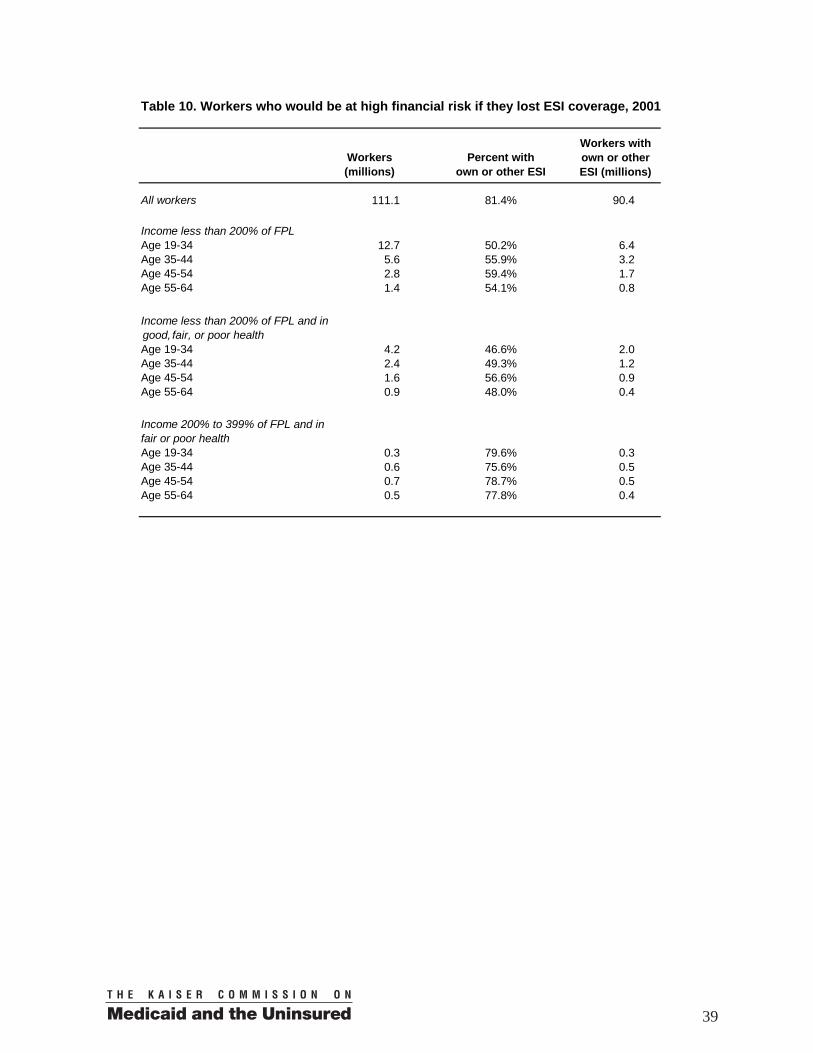
Workers(millions)
Percent with own or other ESI
All workers 111.1 81.4% 90.4
Income less than 200% of FPLAge 19-34 12.7 50.2% 6.4Age 35-44 5.6 55.9% 3.2Age 45-54 2.8 59.4% 1.7Age 55-64 1.4 54.1% 0.8
Income less than 200% of FPL and in good, fair, or poor healthAge 19-34 4.2 46.6% 2.0Age 35-44 2.4 49.3% 1.2Age 45-54 1.6 56.6% 0.9Age 55-64 0.9 48.0% 0.4
Income 200% to 399% of FPL and in fair or poor healthAge 19-34 0.3 79.6% 0.3Age 35-44 0.6 75.6% 0.5Age 45-54 0.7 78.7% 0.5Age 55-64 0.5 77.8% 0.4
Table 10. Workers who would be at high financial risk if they lost ESI coverage, 2001
Workers with own or other ESI (millions)
39
Notes to Tables
a “Adult workers” for this study refer to working adults age 19 to 64, excluding full-time students.
b For all tables, coverage reflects current health insurance coverage for workers as measured in the February CPS.
c Represents slightly fewer than the specified number of workers due to missing values for wages last year. Weighted N = 110.8 million workers.
d Unweighted N=26,792.
e Excludes temporary and contract workers. Weighted N = 97.7 million regular workers.
f Unweighted N=2,987.
40
Appendix: Data and Methods
The data used in this report are from a match of the February 2001 Contingent
Workers and Alternate Employment Supplement of the Current Population Survey (CPS)
and the March 2001 Annual Demographic Survey of the CPS. The February supplement
provides information, not available from the March survey, on employer sponsorship of
ESI coverage, worker eligibility for the coverage, and whether the worker takes-up an
offer of coverage. The March supplement contains demographic information and other
information, such as firm size and health status, that is not available from the February
survey. Matching workers across the two surveys allows a more detailed analysis of the
patterns of ESI coverage across different types of workers and jobs.
Using household identifier codes and unique individual identifier codes within
households, about 63 percent of workers in the March survey could be correctly matched
to the same worker in the February survey.17 I grouped individual records into family
units (health insurance units, or HIUs) that are able to obtain health insurance coverage
through an employer as a family (e.g. adults age 19 or over, who are not full-time
students, with their spouses and dependent children), referred to simply as “families”.18 I
excluded from the analysis sample observations that had any missing values for several
key variables including health insurance coverage or firm size information. Also, I
required that this information be complete for all workers within each family. The
17 Matches were confirmed using age (plus or minus 1 year) and gender. 18 I am grateful to Marie Wang for providing the HIU definitions.
41
original March survey weights for matched workers were adjusted to limit the effect of
these exclusions on the estimates (as described below).
Health insurance coverage of workers in this study is based on the measures of
current health insurance coverage in the February supplement. Respondents are first
asked if they have ESI from their own employer and only if they do not are they asked
about other types of health insurance, creating an automatic hierarchy that places ESI
ahead of other types of coverage. For the other types of coverage, respondents can only
answer one type from the list so it does not allow identification of workers with multiple
sources of coverage.
Hourly wages are measured as wage earnings in the prior calendar year divided
by the product of the number of weeks worked last year and the usual number of hours
worked per week during the weeks worked. For current workers who did not have
earnings in the prior calendar year, hourly wages is treated as missing. Some cases had
unusual values for hourly wages (e.g. less than $1 per hour). Because the analyses
categorize wages in groups with the lowest wage category being less than $7 per hour, it
is assumed that observations with extremely low wages do indeed have wages of less
than $7 per hour.
Job tenure was measured differently for temporary, contract, on-call workers, etc.,
than for the large majority of “regular” workers. To assure better comparability, the
analyses below that use job tenure are restricted to regular workers. Occupations reflect
CPS major occupation codes, with the exception that the study combines personal
household services with other (non-protective) services.
42
The analyses are designed to be representative of the noninstitutionalized
population of adult workers in 2001 as would be the case if either CPS survey were being
used by itself with the sample weights provided by the Census Bureau (for the respective
month). The observations that were able to be matched and that had non-missing data for
the key variables for all adult workers in a family do not appear to be a purely random
sample of candidate workers from the March survey. For example, workers in the
matched sample were significantly less likely to be from minority groups, tended to be
older, and tended to have more years of schooling and higher earnings than analogous
workers in the full March survey. The original March CPS sample weights were adjusted
to account for such observed differences between the candidate sample and the study
sample.19 This weighting adjustment reduces any biases that might result from
nonrandom selection into the study sample and brings the weighted worker totals for the
study sample back up to the March CPS national estimates. Thus, the reweighted sample
produces national estimates for the 2001 civilian non-institutional U.S. population.
The figures in this report are not directly comparable to the figures from similar
analyses in an earlier report using data from 1999 (Garrett, Nichols, and Greenman
2001), and should not therefore be used to identify trends over time. Although the
numbers are usually quite similar in magnitude, they differ in three respects. First, the
19 To implement the reweighting I estimated a logit model of the probability of being in the study sample over the full set of observations in working families in the March CPS. The adjusted weight for each individual was computed as the original person weight divided by the predicted probability of being in the study sample. Explanatory variables in the logit model included age, race/ethnicity categories, gender, family earnings (and interactions with the race/ethnicity categories), categories for the highest education level obtained in the family, marital status, geographical region, being an “adult worker” as defined in the study, the number of adult workers in the family, and dummy variables for last year’s insurance coverage based on the March CPS health insurance coverage questions (with the following hierarchy applied: ESI, nongroup, Medicare, Medicaid, other coverage, and uninsured).
43
present report excludes 18 year-olds and full-time students, but the earlier report included
these individuals. Second, the CPS weights used in this study are based on the 2000
Census whereas the weights in the earlier study were based on the 1990 Census. The
new weights show a higher percentage of Hispanics among uninsured workers compared
to the old weights. Finally, the current study uses a more detailed regression model in the
reweighting adjustment, which tends to boost the weighted percentage of low-education
and minority workers in the matched sample.
44

T h e K a i s e r F a m i l y F o u n d a t i o n i s a n o n - p r o f i t , p r i v a t e o p e r a t i n g f o u n d a t i o n d e d i c a t e d t o p r o v i d i n gi n f o r m a t i o n a n d a n a l y s i s o n h e a l t h c a r e i s s u e s t o p o l i c y m a k e r s , t h e m e d i a , t h e h e a l t h c a r e c o m m u n i t y ,a n d t h e g e n e r a l p u b l i c . T h e F o u n d a t i o n i s n o t a s s o c i a t e d w i t h K a i s e r P e r m a n e n t e o r K a i s e r I n d u s t r i e s .

1 3 3 0 G S T R E E T N W , W A S H I N G T O N , D C 2 0 0 0 5
P H O N E : ( 2 0 2 ) 3 4 7 - 5 2 7 0 , F A X : ( 2 0 2 ) 3 4 7 - 5 2 7 4
W E B S I T E : W W W . K F F . O R G / K C M U
A d d i t i o n a l c o p i e s o f t h i s r e p o r t ( # 7116 ) a r e a v a i l a b l e o n t h e K a i s e r F a m i l y F o u n d a t i o n ’ s w e b s i t e a t w w w . k f f . o r g .