Employer-Sponsored Health Coverage Release Slides Tuesday, September 11, 2012 March 15, 2013.
20
Employer-Sponsored Health Coverage Release Slides Tuesday, September 11, 2012 March 15, 2013
-
Upload
janis-johnson -
Category
Documents
-
view
214 -
download
0
Transcript of Employer-Sponsored Health Coverage Release Slides Tuesday, September 11, 2012 March 15, 2013.
Employer-Sponsored Health CoverageRelease SlidesTuesday, September 11, 2012
March 15, 2013
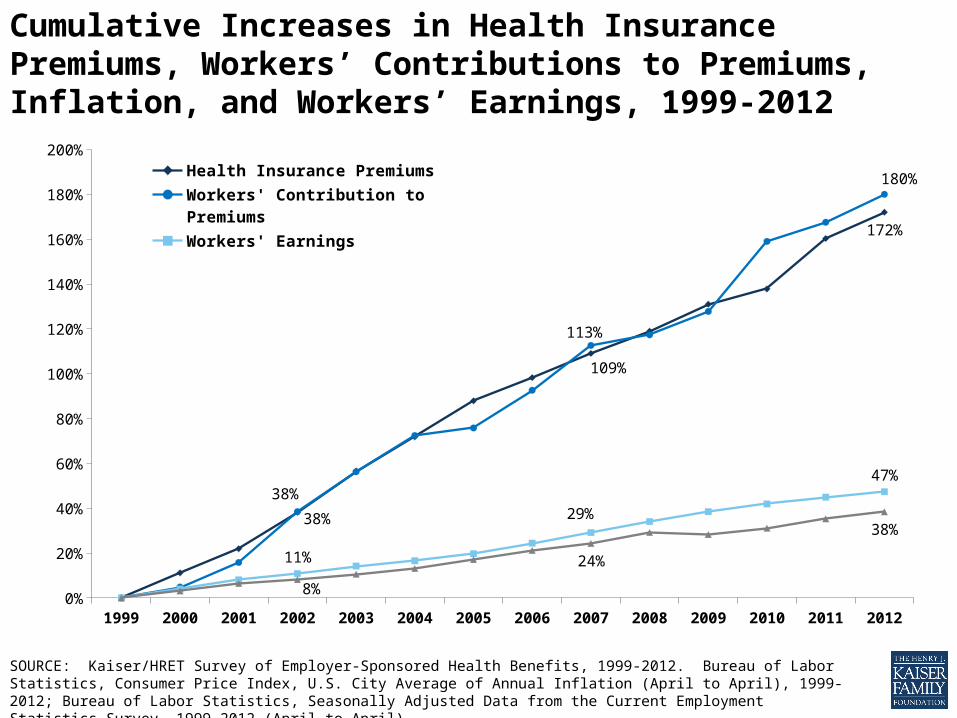
Cumulative Increases in Health Insurance Premiums, Workers’ Contributions to Premiums, Inflation, and Workers’ Earnings, 1999-2012
1999 2000 2001 2002 2003 2004 2005 2006 2007 2008 2009 2010 2011 20120%
20%
40%
60%
80%
100%
120%
140%
160%
180%
200%
38%
109%
172%
38%
113%
180%
11%
29%
47%
8%
24%
38%
Health Insurance PremiumsWorkers' Contribution to Pre-miumsWorkers' EarningsOverall Inflation
SOURCE: Kaiser/HRET Survey of Employer-Sponsored Health Benefits, 1999-2012. Bureau of Labor Statistics, Consumer Price Index, U.S. City Average of Annual Inflation (April to April), 1999-2012; Bureau of Labor Statistics, Seasonally Adjusted Data from the Current Employment Statistics Survey, 1999-2012 (April to April).
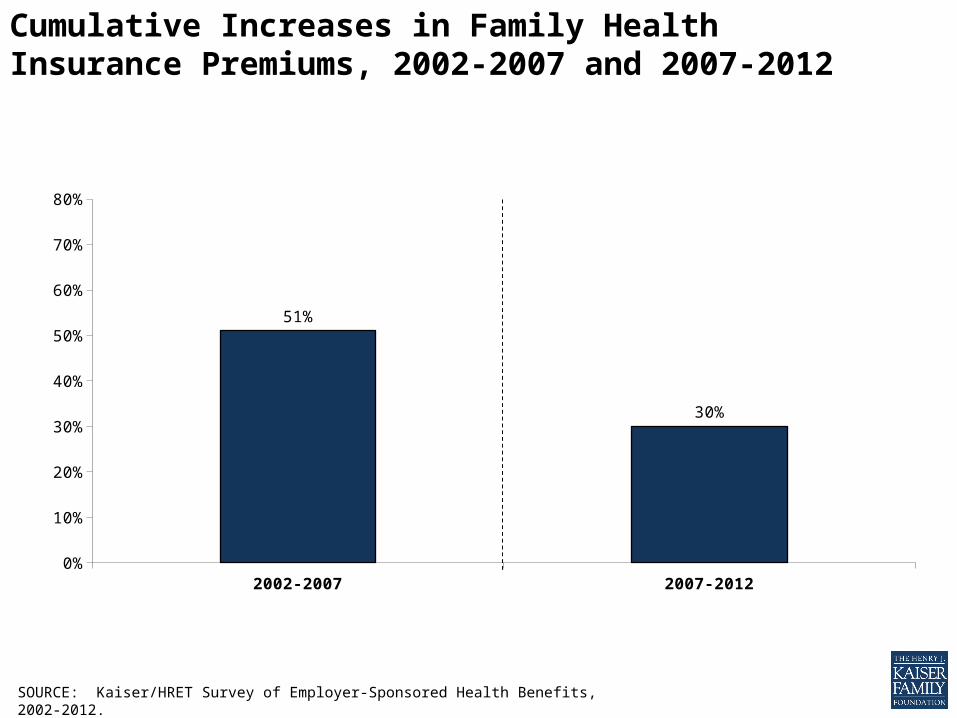
Cumulative Increases in Family Health Insurance Premiums, 2002-2007 and 2007-2012
2002-2007 2007-20120%
10%
20%
30%
40%
50%
60%
70%
80%
51%
30%
SOURCE: Kaiser/HRET Survey of Employer-Sponsored Health Benefits, 2002-2012.
* Estimate is statistically different from estimate for the previous year shown (p<.05).
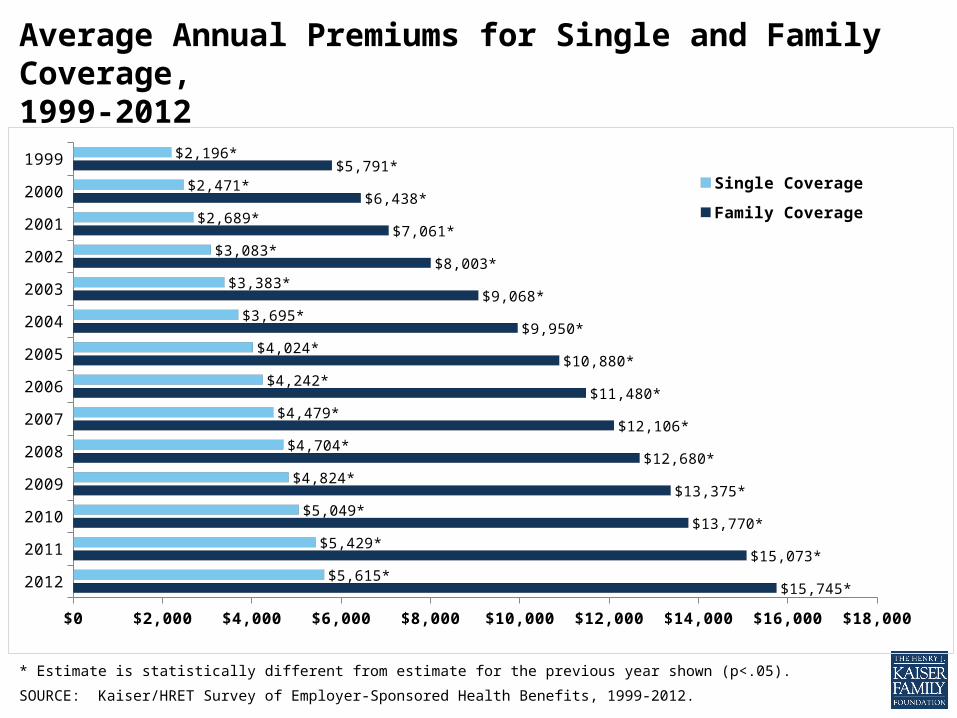
SOURCE: Kaiser/HRET Survey of Employer-Sponsored Health Benefits, 1999-2012.
Average Annual Premiums for Single and Family Coverage, 1999-2012
2012
2011
2010
2009
2008
2007
2006
2005
2004
2003
2002
2001
2000
1999
$0 $2,000 $4,000 $6,000 $8,000 $10,000 $12,000 $14,000 $16,000 $18,000
$15,745*
$15,073*
$13,770*
$13,375*
$12,680*
$12,106*
$11,480*
$10,880*
$9,950*
$9,068*
$8,003*
$7,061*
$6,438*
$5,791*
$5,615*
$5,429*
$5,049*
$4,824*
$4,704*
$4,479*
$4,242*
$4,024*
$3,695*
$3,383*
$3,083*
$2,689*
$2,471*
$2,196*
Single Coverage
Family Coverage
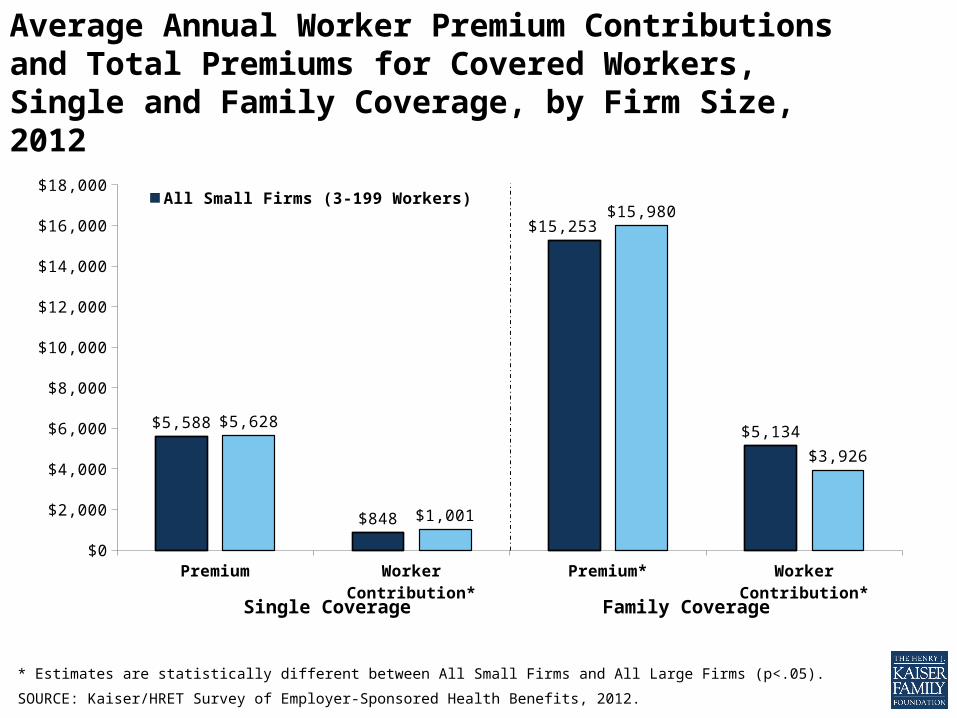
Premium Worker Contri-bution*
Premium* Worker Contri-bution*
$0
$2,000
$4,000
$6,000
$8,000
$10,000
$12,000
$14,000
$16,000
$18,000
$5,588
$848
$15,253
$5,134$5,628
$1,001
$15,980
$3,926
All Small Firms (3-199 Workers)
Single Coverage Family Coverage
Average Annual Worker Premium Contributions and Total Premiums for Covered Workers, Single and Family Coverage, by Firm Size, 2012
* Estimates are statistically different between All Small Firms and All Large Firms (p<.05).
SOURCE: Kaiser/HRET Survey of Employer-Sponsored Health Benefits, 2012.
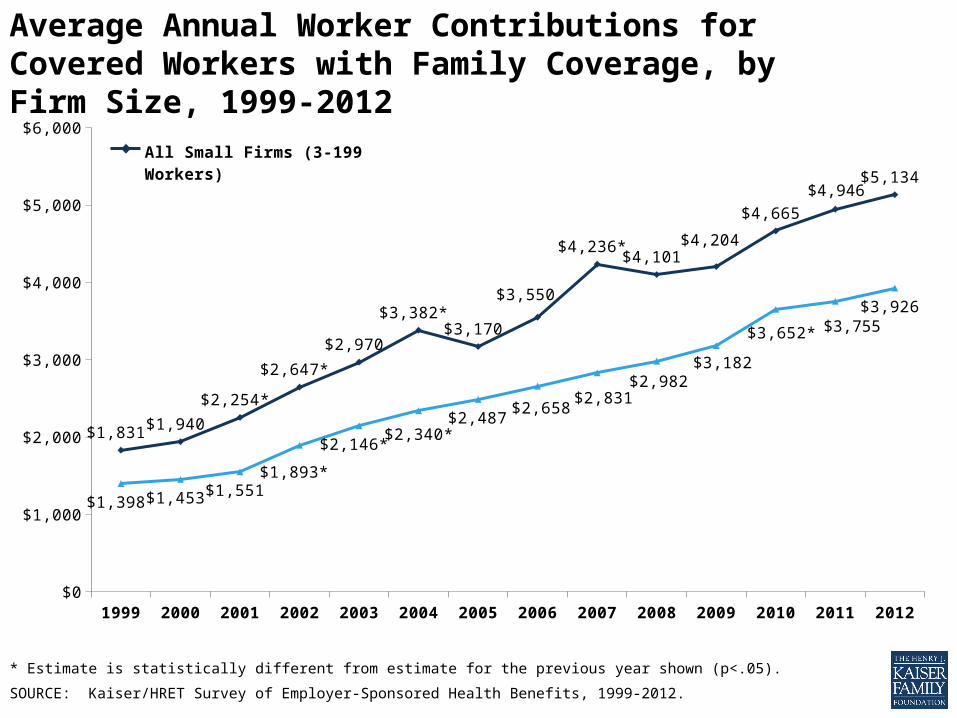
Average Annual Worker Contributions for Covered Workers with Family Coverage, by Firm Size, 1999-2012
* Estimate is statistically different from estimate for the previous year shown (p<.05).
SOURCE: Kaiser/HRET Survey of Employer-Sponsored Health Benefits, 1999-2012.
1999 2000 2001 2002 2003 2004 2005 2006 2007 2008 2009 2010 2011 2012$0
$1,000
$2,000
$3,000
$4,000
$5,000
$6,000
$1,831 $1,940
$2,254*
$2,647*
$2,970
$3,382* $3,170
$3,550
$4,236* $4,101
$4,204
$4,665
$5,134
$1,398 $1,453 $1,551 $1,893*
$2,146* $2,340* $2,487
$2,658 $2,831
$2,982 $3,182
$3,652*
$3,926
All Small Firms (3-199 Workers)
$4,946
$3,755

Many Workers are Lower-Wage
Many Workers are Higher-Wage
Family Coverage
$0
$2,000
$4,000
$6,000
$8,000
$10,000
$12,000
$14,000
$16,000
$18,000
$4,977* $3,968*
$9,716 * $12,459 *
$14,694*
$16,427*
Average Worker and Employer Premium Contributions For Covered Workers at Higher- and Lower-Wage Firms, 2012
*Estimate for many workers are lower-wage is statistically different from estimate for many workers are higher-wage, within coverage type (p<.05).
NOTE: Firms with many lower-wage workers are ones where 35% or more of employees earn $24,000 or less. Firms with many higher-wage workers are ones where 35% or more of employees earn $55,000 or more. Wage cutoffs are the inflation adjusted- 25th and 75th percentile of national wages according to the National Compensation Survey: Occupational Earnings in the United States, 2010. 1% of covered workers are in firms which are both high income and low income, excluding these firms does not change the estimates or significance testing.
SOURCE: Kaiser/HRET Survey of Employer-Sponsored Health Benefits, 2012. National Compensation Survey: Occupational Earnings in theUnited States, 2010. http://www.bls.gov/ncs/ocs/sp/nctb1489.pdf
Many Workers are Lower-Wage
Many Workers are Higher-Wage
Single Coverage
$0
$1,000
$2,000
$3,000
$4,000
$5,000
$6,000
$7,000
$1,069 $964
$4,066* $4,825*
$5,135*
$5,789*
Worker Premium Contribution
Employer Premium Contribution

Percentage of Workers Eligible For Health Benefits Offered By Their
Employer*
Percentage of Eligible Workers Who Participate
in Their Employers’ Plan (Take-Up Rate)*
Percentage of Workers Covered by Their
Employers’ Health Benefits*
0% 20% 40% 60% 80% 100%
0.66
0.71
0.47
0.82
0.84
0.69
Many Workers are Higher-Wage
Many Workers are Lower-Wage
Eligibility, Take-Up Rate, and Coverage in Firms Offering Health Benefits, by Firm Wage Level, 2012
*Estimate for many workers are lower-wage is statistically different from estimate for many workers are higher-wage (p<.05).
NOTE: Firms with many lower-wage workers are ones where 35% or more of employees earn $24,000 or less. Firms with many higher-wage workers are ones where 35% or more of employees earn $55,000 or more. Wage cutoffs are the inflation adjusted- 25th and 75th percentile of national wages according to the National Compensation Survey: Occupational Earnings in the United States, 2010. 1% of covered workers are in firms which are both high income and low income.
SOURCE: Kaiser/HRET Survey of Employer-Sponsored Health Benefits, 2012. National Compensation Survey: Occupational Earnings in the United States, 2010. http://www.bls.gov/ncs/ocs/sp/nctb1489.pdf.
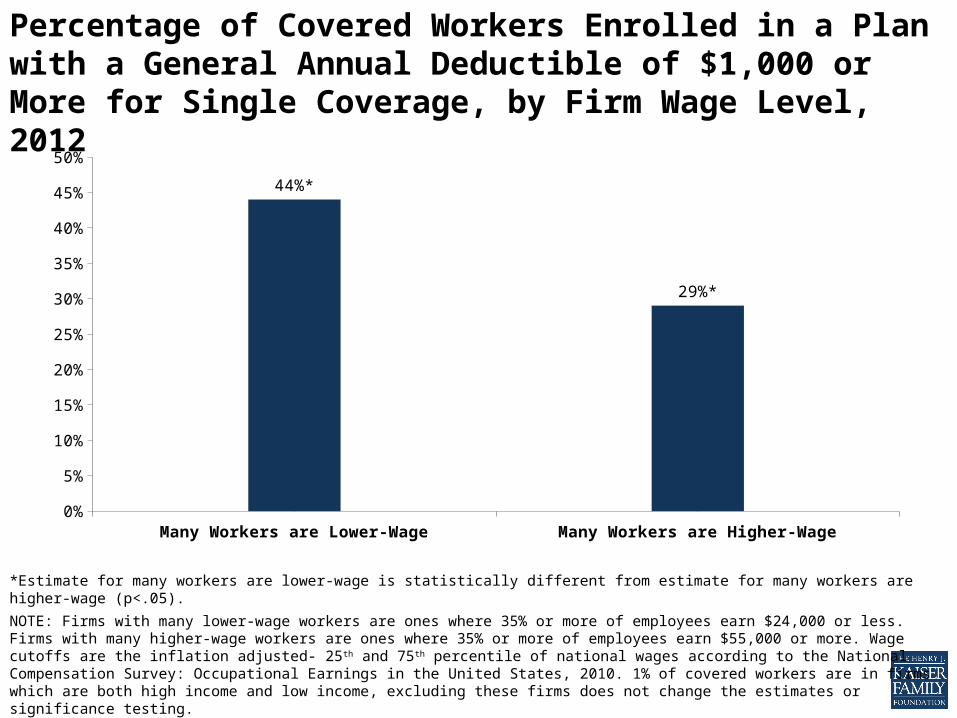
Many Workers are Lower-Wage Many Workers are Higher-Wage0%
5%
10%
15%
20%
25%
30%
35%
40%
45%
50%
44%*
29%*
Percentage of Covered Workers Enrolled in a Plan with a General Annual Deductible of $1,000 or More for Single Coverage, by Firm Wage Level, 2012
*Estimate for many workers are lower-wage is statistically different from estimate for many workers are higher-wage (p<.05).
NOTE: Firms with many lower-wage workers are ones where 35% or more of employees earn $24,000 or less. Firms with many higher-wage workers are ones where 35% or more of employees earn $55,000 or more. Wage cutoffs are the inflation adjusted- 25th and 75th percentile of national wages according to the National Compensation Survey: Occupational Earnings in the United States, 2010. 1% of covered workers are in firms which are both high income and low income, excluding these firms does not change the estimates or significance testing.
SOURCE: Kaiser/HRET Survey of Employer-Sponsored Health Benefits, 2012. National Compensation Survey: Occupational Earnings in the United States, 2010. http://www.bls.gov/ncs/ocs/sp/nctb1489.pdf.
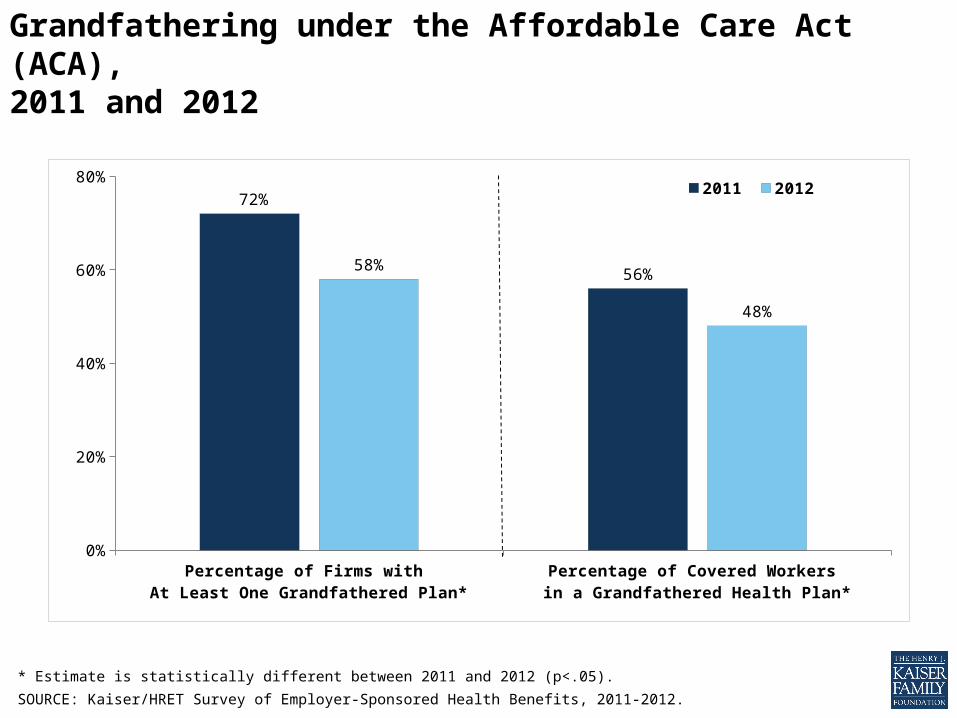
Grandfathering under the Affordable Care Act (ACA), 2011 and 2012
* Estimate is statistically different between 2011 and 2012 (p<.05).
SOURCE: Kaiser/HRET Survey of Employer-Sponsored Health Benefits, 2011-2012.
Percentage of Firms with At Least One Grandfathered Plan*
Percentage of Covered Workers in a Grandfathered Health Plan*
0%
20%
40%
60%
80%
72%
56%58%
48%
2011 2012
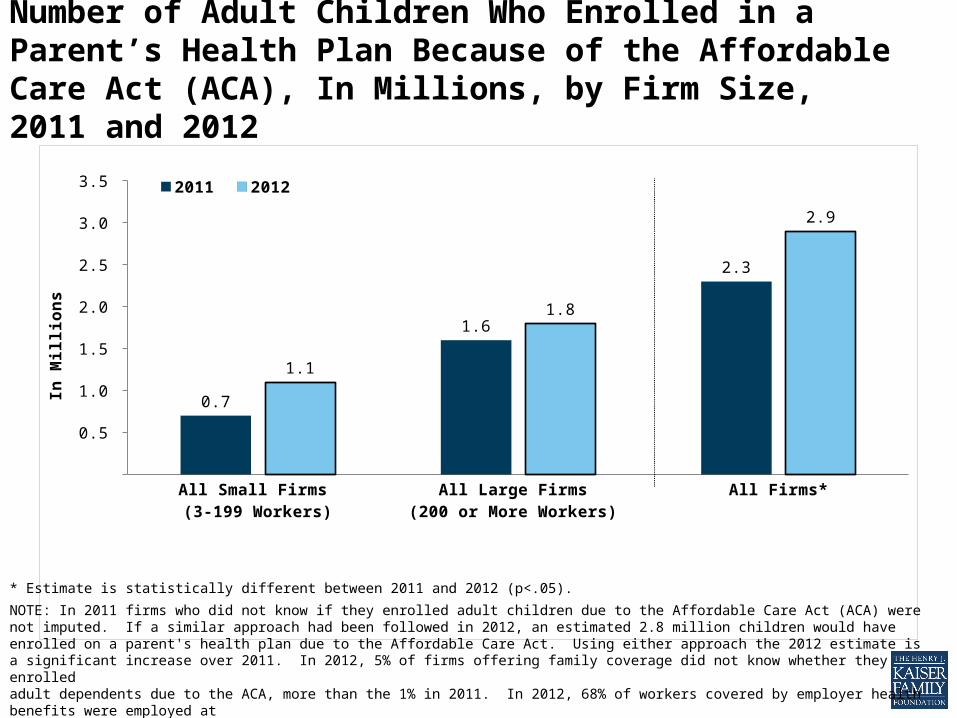
Number of Adult Children Who Enrolled in a Parent’s Health Plan Because of the Affordable Care Act (ACA), In Millions, by Firm Size, 2011 and 2012
All Small Firms (3-199 Workers)
All Large Firms (200 or More Workers)
All Firms* -
0.5
1.0
1.5
2.0
2.5
3.0
3.5
0.7
1.6
2.3
1.1
1.8
2.9
2011 2012
In M
illions
* Estimate is statistically different between 2011 and 2012 (p<.05).
NOTE: In 2011 firms who did not know if they enrolled adult children due to the Affordable Care Act (ACA) were not imputed. If a similar approach had been followed in 2012, an estimated 2.8 million children would have enrolled on a parent's health plan due to the Affordable Care Act. Using either approach the 2012 estimate is a significant increase over 2011. In 2012, 5% of firms offering family coverage did not know whether they enrolled adult dependents due to the ACA, more than the 1% in 2011. In 2012, 68% of workers covered by employer health benefits were employed at large firms.
SOURCE: Kaiser/HRET Survey of Employer-Sponsored Health Benefits, 2011-2012.
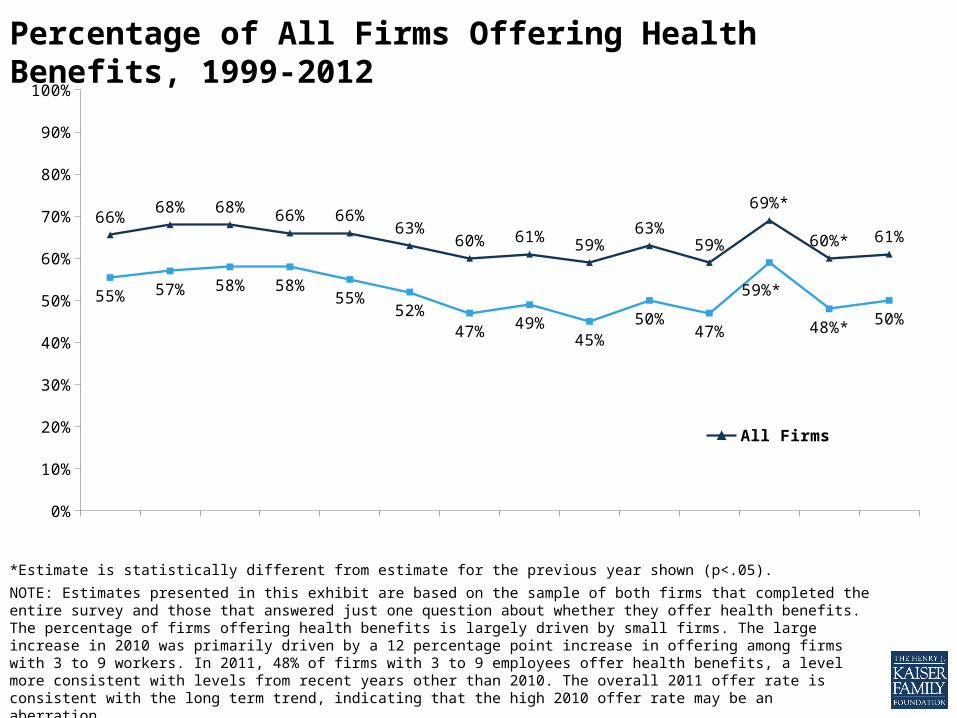
1999 2000 2001 2002 2003 2004 2005 2006 2007 2008 2009 2010 2011 20120%
10%
20%
30%
40%
50%
60%
70%
80%
90%
100%
66%68% 68% 66% 66%
63%60% 61% 59%
63%59%
69%*
60%* 61%
55% 57% 58% 58%55%
52%47% 49%
45%50%
47%
59%*
48%* 50%
All FirmsFirms with 3-9 Workers
Percentage of All Firms Offering Health Benefits, 1999-2012
*Estimate is statistically different from estimate for the previous year shown (p<.05).
NOTE: Estimates presented in this exhibit are based on the sample of both firms that completed the entire survey and those that answered just one question about whether they offer health benefits. The percentage of firms offering health benefits is largely driven by small firms. The large increase in 2010 was primarily driven by a 12 percentage point increase in offering among firms with 3 to 9 workers. In 2011, 48% of firms with 3 to 9 employees offer health benefits, a level more consistent with levels from recent years other than 2010. The overall 2011 offer rate is consistent with the long term trend, indicating that the high 2010 offer rate may be an aberration.
SOURCE: Kaiser/HRET Survey of Employer-Sponsored Health Benefits, 1999-2012.
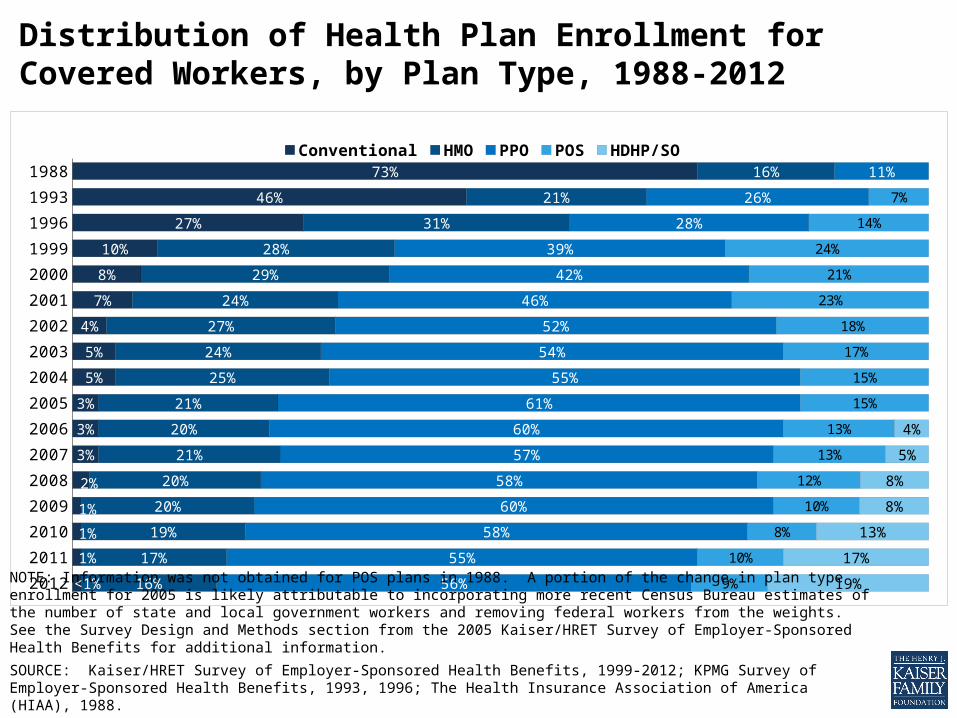
2012
2011
2010
2009
2008
2007
2006
2005
2004
2003
2002
2001
2000
1999
1996
1993
1988
<1%
1%
1%
1%
2%
3%
3%
3%
5%
5%
4%
7%
8%
10%
27%
46%
73%
16%
17%
19%
20%
20%
21%
20%
21%
25%
24%
27%
24%
29%
28%
31%
21%
16%
56%
55%
58%
60%
58%
57%
60%
61%
55%
54%
52%
46%
42%
39%
28%
26%
11%
9%
10%
8%
10%
12%
13%
13%
15%
15%
17%
18%
23%
21%
24%
14%
7%
19%
17%
13%
8%
8%
5%
4%
Conventional HMO PPO POS HDHP/SO
NOTE: Information was not obtained for POS plans in 1988. A portion of the change in plan type enrollment for 2005 is likely attributable to incorporating more recent Census Bureau estimates of the number of state and local government workers and removing federal workers from the weights. See the Survey Design and Methods section from the 2005 Kaiser/HRET Survey of Employer-Sponsored Health Benefits for additional information.
SOURCE: Kaiser/HRET Survey of Employer-Sponsored Health Benefits, 1999-2012; KPMG Survey of Employer-Sponsored Health Benefits, 1993, 1996; The Health Insurance Association of America (HIAA), 1988.
Distribution of Health Plan Enrollment for Covered Workers, by Plan Type, 1988-2012
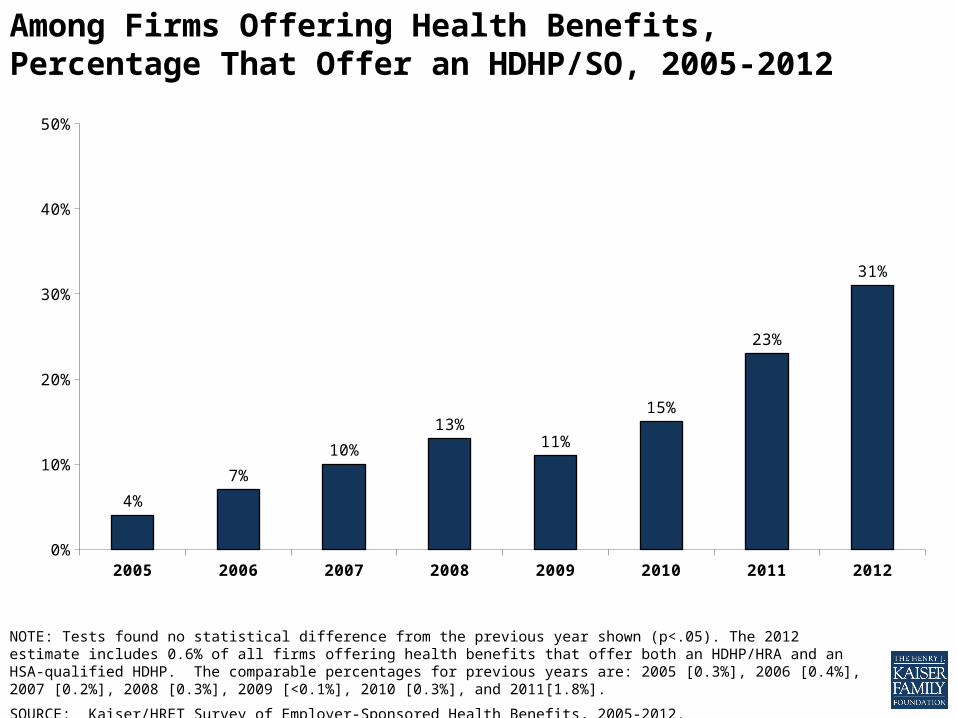
Among Firms Offering Health Benefits, Percentage That Offer an HDHP/SO, 2005-2012
2005 2006 2007 2008 2009 2010 2011 20120%
10%
20%
30%
40%
50%
4%
7%
10%
13%11%
15%
23%
31%
NOTE: Tests found no statistical difference from the previous year shown (p<.05). The 2012 estimate includes 0.6% of all firms offering health benefits that offer both an HDHP/HRA and an HSA-qualified HDHP. The comparable percentages for previous years are: 2005 [0.3%], 2006 [0.4%], 2007 [0.2%], 2008 [0.3%], 2009 [<0.1%], 2010 [0.3%], and 2011[1.8%].
SOURCE: Kaiser/HRET Survey of Employer-Sponsored Health Benefits, 2005-2012.
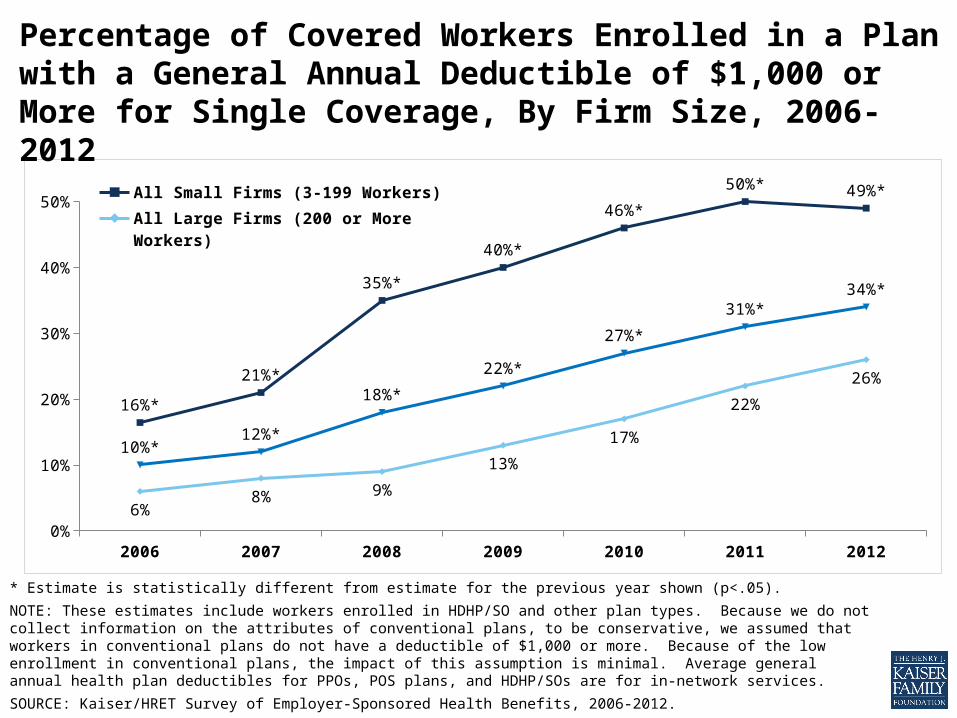
2006 2007 2008 2009 2010 2011 20120%
10%
20%
30%
40%
50%
16%*
21%*
35%*
40%*
46%*
50%* 49%*
6%8% 9%
13%
17%
22%
26%
10%*12%*
18%*
22%*
27%*
31%*34%*
All Small Firms (3-199 Workers)
All Large Firms (200 or More Workers)
All Firms
* Estimate is statistically different from estimate for the previous year shown (p<.05).
NOTE: These estimates include workers enrolled in HDHP/SO and other plan types. Because we do not collect information on the attributes of conventional plans, to be conservative, we assumed that workers in conventional plans do not have a deductible of $1,000 or more. Because of the low enrollment in conventional plans, the impact of this assumption is minimal. Average general annual health plan deductibles for PPOs, POS plans, and HDHP/SOs are for in-network services.
SOURCE: Kaiser/HRET Survey of Employer-Sponsored Health Benefits, 2006-2012.
Percentage of Covered Workers Enrolled in a Plan with a General Annual Deductible of $1,000 or More for Single Coverage, By Firm Size, 2006-2012
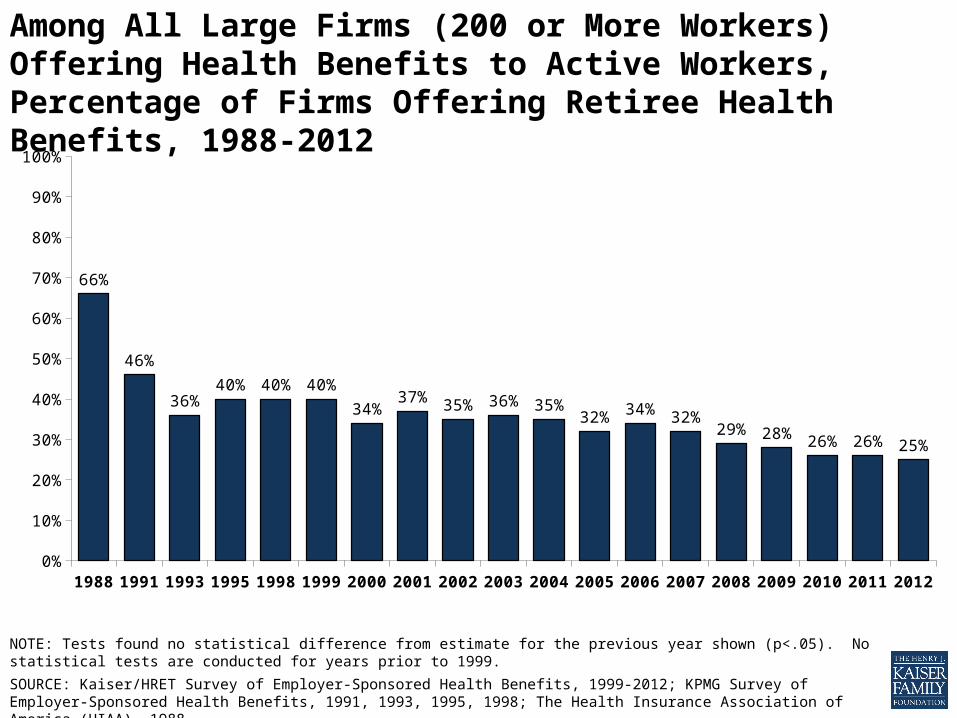
Among All Large Firms (200 or More Workers) Offering Health Benefits to Active Workers, Percentage of Firms Offering Retiree Health Benefits, 1988-2012
1988
1991
1993
1995
1998
1999
2000
2001
2002
2003
2004
2005
2006
2007
2008
2009
2010
2011
2012
0%
10%
20%
30%
40%
50%
60%
70%
80%
90%
100%
66%
46%
36%40% 40% 40%
34%37% 35% 36% 35%
32% 34% 32%29% 28% 26% 26% 25%
NOTE: Tests found no statistical difference from estimate for the previous year shown (p<.05). No statistical tests are conducted for years prior to 1999.
SOURCE: Kaiser/HRET Survey of Employer-Sponsored Health Benefits, 1999-2012; KPMG Survey of Employer-Sponsored Health Benefits, 1991, 1993, 1995, 1998; The Health Insurance Association of America (HIAA), 1988.
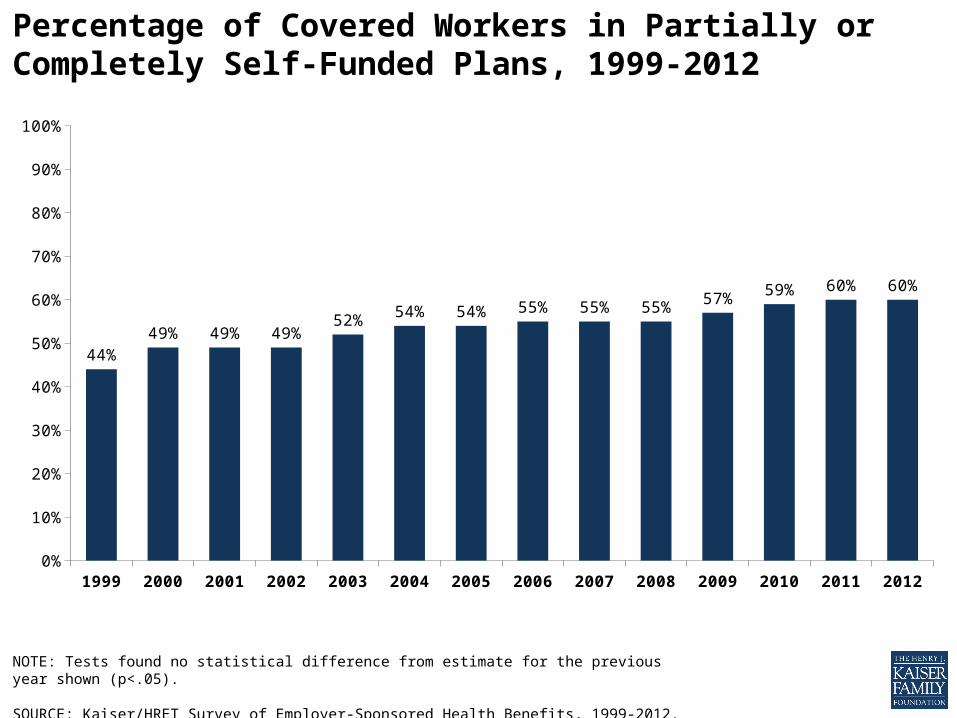
Percentage of Covered Workers in Partially or Completely Self-Funded Plans, 1999-2012
1999 2000 2001 2002 2003 2004 2005 2006 2007 2008 2009 2010 2011 20120%
10%
20%
30%
40%
50%
60%
70%
80%
90%
100%
44%49% 49% 49%
52% 54% 54% 55% 55% 55% 57% 59% 60% 60%
NOTE: Tests found no statistical difference from estimate for the previous year shown (p<.05).
SOURCE: Kaiser/HRET Survey of Employer-Sponsored Health Benefits, 1999-2012.
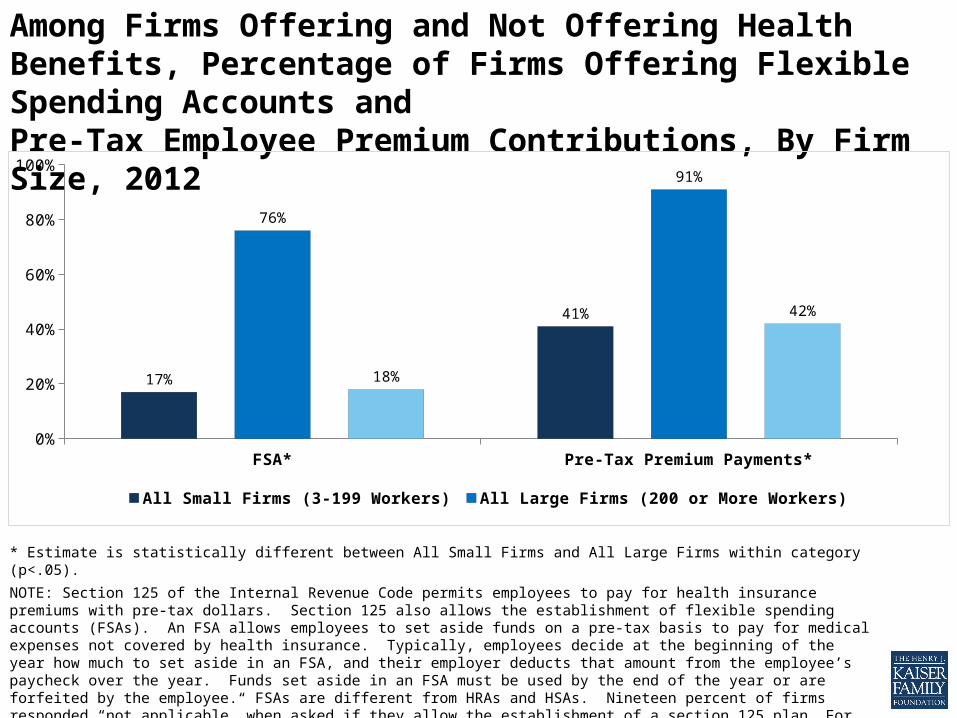
Among Firms Offering and Not Offering Health Benefits, Percentage of Firms Offering Flexible Spending Accounts and Pre-Tax Employee Premium Contributions, By Firm Size, 2012
* Estimate is statistically different between All Small Firms and All Large Firms within category (p<.05).
NOTE: Section 125 of the Internal Revenue Code permits employees to pay for health insurance premiums with pre-tax dollars. Section 125 also allows the establishment of flexible spending accounts (FSAs). An FSA allows employees to set aside funds on a pre-tax basis to pay for medical expenses not covered by health insurance. Typically, employees decide at the beginning of the year how much to set aside in an FSA, and their employer deducts that amount from the employee’s paycheck over the year. Funds set aside in an FSA must be used by the end of the year or are forfeited by the employee. FSAs are different from HRAs and HSAs. Nineteen percent of firms responded “not applicable” when asked if they allow the establishment of a section 125 plan. For example, some firms may pay for 100 percent of the cost of coverage.
SOURCE: Kaiser/HRET Survey of Employer-Sponsored Health Benefits, 2012.
FSA* Pre-Tax Premium Payments*0%
20%
40%
60%
80%
100%
17%
41%
76%
91%
18%
42%
All Small Firms (3-199 Workers) All Large Firms (200 or More Workers)
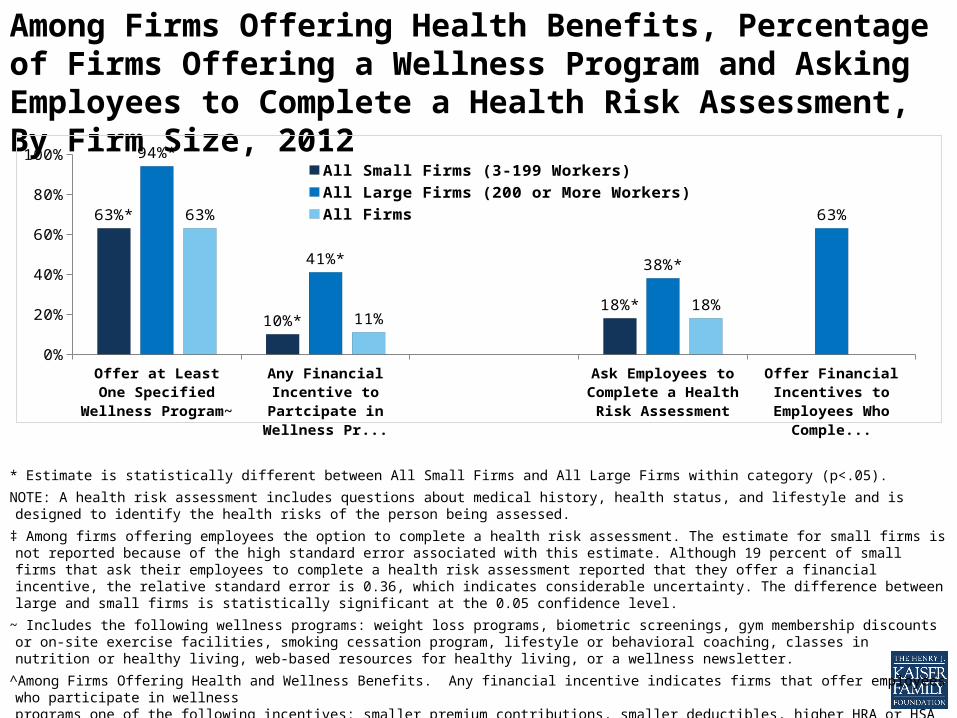
Among Firms Offering Health Benefits, Percentage of Firms Offering a Wellness Program and Asking Employees to Complete a Health Risk Assessment, By Firm Size, 2012
* Estimate is statistically different between All Small Firms and All Large Firms within category (p<.05).
NOTE: A health risk assessment includes questions about medical history, health status, and lifestyle and is designed to identify the health risks of the person being assessed.
‡ Among firms offering employees the option to complete a health risk assessment. The estimate for small firms is not reported because of the high standard error associated with this estimate. Although 19 percent of small firms that ask their employees to complete a health risk assessment reported that they offer a financial incentive, the relative standard error is 0.36, which indicates considerable uncertainty. The difference between large and small firms is statistically significant at the 0.05 confidence level.
~ Includes the following wellness programs: weight loss programs, biometric screenings, gym membership discounts or on-site exercise facilities, smoking cessation program, lifestyle or behavioral coaching, classes in nutrition or healthy living, web-based resources for healthy living, or a wellness newsletter.
^Among Firms Offering Health and Wellness Benefits. Any financial incentive indicates firms that offer employees who participate in wellness programs one of the following incentives: smaller premium contributions, smaller deductibles, higher HRA or HSA contributions, or gift cards, travel, merchandise, or cash.
SOURCE: Kaiser/HRET Survey of Employer-Sponsored Health Benefits, 2012.
0%
20%
40%
60%
80%
100%
63%*
10%*18%*
94%*
41%* 38%*
63%63%
11%18%
All Small Firms (3-199 Workers)All Large Firms (200 or More Workers) All Firms