Elevated Chicago - CNT
83
September 10, 2018 Strategies for Community Control and Affordability Preservation Elevated Chicago
Transcript of Elevated Chicago - CNT
September 10, 2018
Strategies for Community Control and Affordability Preservation
Elevated Chicago

SB Friedman Development Advisors 2
Acknowledgements
This effort was generously funded by Enterprise Community Partners and in partnership with Elevated Chicago.
Thank you to the following organizations for their time and insights:
Dos Pinos Housing Cooperative
Cook County Land Bank Authority
Fulton County/City of Atlanta Land Bank Authority
Garfield Park Community Council
Genesee County Land Bank
Greater Southwest Development Corporation
Hermitage Manor
Latin United Community Housing Association
Proud Ground

1. Overview
2. Strategies for Community Control and Affordability Preservation
3. Key Issues and Strategies by eHub
Implementation Steps and Policy Recommendations
4. Appendix | Case Studies

SB Friedman Development Advisors
1. Overview
Purpose: Identify relevant strategies and mechanisms for community control and affordability
preservation within the communities identified by Elevated Chicago. This document includes:
Research findings
Applicable strategies by eHub
Implementation steps
Policy recommendations
Case studies
This document references information provided in the companion report: the Elevated Chicago EcoDistrictFeasibility Scan, prepared by the Center for Neighborhood Technology (CNT).
4
SB Friedman Development Advisors
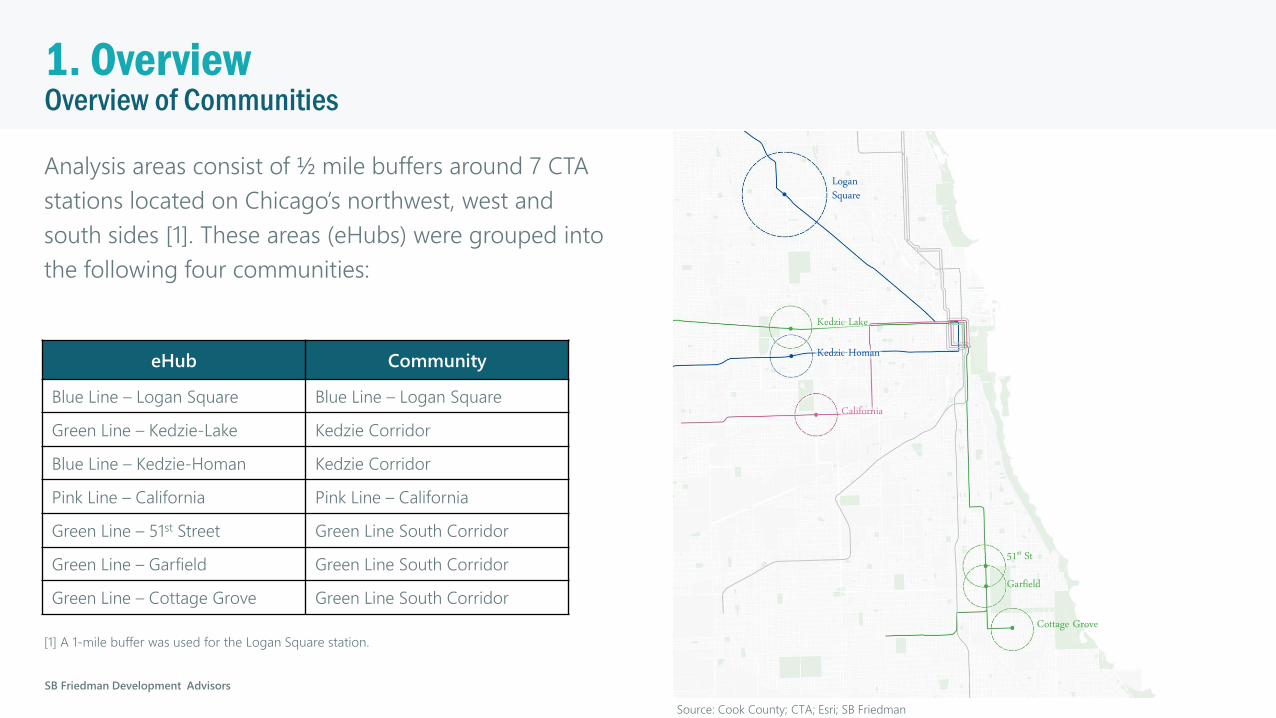
Overview of Communities1. Overview
Analysis areas consist of ½ mile buffers around 7 CTA
stations located on Chicago’s northwest, west and
south sides [1]. These areas (eHubs) were grouped into
the following four communities:
eHub Community
Blue Line – Logan Square Blue Line – Logan Square
Green Line – Kedzie-Lake Kedzie Corridor
Blue Line – Kedzie-Homan Kedzie Corridor
Pink Line – California Pink Line – California
Green Line – 51st Street Green Line South Corridor
Green Line – Garfield Green Line South Corridor
Green Line – Cottage Grove Green Line South Corridor
[1] A 1-mile buffer was used for the Logan Square station.
Logan Square
Kedzie-Lake
Kedzie-Homan
California
51st St
Garfield
Cottage Grove
Source: Cook County; CTA; Esri; SB Friedman

2. Strategies for Community Control and
Affordability Preservation

SB Friedman Development Advisors
Inclusionary Zoning (IZ)
2. Strategies for Community Control and Affordability Preservation
IZ programs link the production of affordable housing to private
market-rate residential development through mandatory or
voluntary inclusion of units affordable to low- and moderate-
income households. In exchange, developers generally receive
offsetting benefits, such as density bonuses, zoning variances,
financial incentives or expedited permitting.
Types of Projects: single and multi-family housing,
homeownership, rental
Legal Mechanism: adopt ordinance at the city or county level
Governance: typically administered by a municipality
Inclusionary Zoning
Opportunities
In markets with strong residential development and rents, IZ can
provide affordability protections:
Leverage private residential development to expand the supply of
affordable housing
Potential to evaluate ARO pilot programs in gentrifying areas and
consider making permanent
Challenges
Community Dynamics
Limited efficacy in communities with little residential
development
Reliance on Private Market
IZ can impact financial feasibility of development
Programs must be carefully calibrated to avoid halting
development
7

SB Friedman Development Advisors
Affordable Requirements Ordinance (ARO)
2. Strategies for Community Control and Affordability Preservation
The City of Chicago adopted the Affordable Requirements
Ordinance (ARO) in 2003. The program has been amended
twice since its inception, and currently requires residential
developments that receive financial assistance or involve City-
owned land to provide affordable housing units or pay in-lieu
fees. In 2017, two 3-year pilot programs in gentrifying areas
were created.
Year Founded: 2003
Geography: Chicago, IL
Governance: City of Chicago Planning and Development
Department
Type of Development: Homeownership, rental
Projects: 330+ affordable rental units
Total units committed [1]: 596 units
Total rental units produced [2]: 330+ rental units
Income affordability:
For-sale units: < 100% of AMI
Rental units: < 60% of AMI
[1] Total ARO units committed (whose projects have received a permit) from 2007 to
2018 Q1. Sourced from City of Chicago presentation on June 27, 2018 regarding
Chicago’s Five-Year Housing Plan.
[2] Total rental units produced by ARO program according to City of Chicago
Department of Planning and Development Affordable Rental Resource List,
downloaded on 7/20/18.
Inclusionary ZoningExisting Local Program
8

SB Friedman Development Advisors
Affordable Requirement Ordinance (ARO)
2. Strategies for Community Control and Affordability Preservation
Following a 2015 amendment, compliance requirements for the ARO program vary
by designated zones. Elevated Chicago communities fall within Higher Income and
Low-Moderate Income zones.
Inclusionary Zoning
ARO Triggers
Developments with 10+ residential units are
subject to the ARO if they meet any of the
following criteria:
Involve City-owned land
Receive financial assistance from the City
Are granted a zoning change [1]
Are planned developments within the
downtown area
[1] A zoning change may be granted to allow for
increased density or a residential use not previously
allowed.
ARO Zones for Communities
Higher Income
Blue Line - Logan Square
Low-Moderate Income
Kedzie Corridor
Pink Line – California
Green Line – South
ARO Zones by community area
Source: City of Chicago
Existing Local Program
9

SB Friedman Development Advisors
Affordable Requirement Ordinance (ARO)
2. Strategies for Community Control and Affordability Preservation
To comply with the ARO, developers must meet requirements regarding affordability percentages, on-site units, and in-lieu
fees. Two Elevated Chicago communities fall within the ARO pilot programs, which require developers to provide a greater
percentage of affordable units and remove the option of in-lieu payments.
Inclusionary Zoning
ARO Zone ARO Pilot Areas
Low-Moderate
Income
Higher Income Downtown Milwaukee
Corridor [1]
Near North/ Near
West [2]
AR
O P
rog
ram
Req
uir
em
en
ts
Percent of
Units that must
be Affordable
10% [3] 10% [3] 10% [3] On-site units [3]:
15%
Off-site units, within
pilot area: 20%
Near North: 20%
Near West: 15%
On-site
Construction
25% required on-site 25% required on-site
[4]
25% required on-site
[5]
First 10% required
on-site or within 2
miles in pilot area
Fee In-lieu $50,000 $125,000 $175,000 No fee in-lieu option No fee in-lieu option
Income
Affordability
Rental: priced at 60%
AMI
For sale: priced at
100% AMI; can be
sold to 120% AMI
Rental: priced at 60%
AMI
For sale: priced at 100%
AMI; can be sold to
120% AMI
Rental: priced at
60% AMI
For sale: priced at
100% AMI; can be
sold to 120% AMI
Rental: priced at
60% AMI; can be
leased to 80% of
AMI
[1] Blue Line – Logan
Square community falls
within the Milwaukee
Corridor Pilot Area.
[2] Kedzie Corridor
community falls within the
Near North Pilot Area.
[3] Affordability
percentage is 20% if the
project receives financial
assistance.
[4] Developers in Higher
Income areas have an
option to build units off-
site.
[5] Developers in
Downtown areas have an
option to build units off-
site, or pay a $225,000 in –
lieu fee per required unit.
Source: City of Chicago Department Planning and Development
Existing Local Program
10

SB Friedman Development Advisors
Affordable Requirement Ordinance (ARO)
2. Strategies for Community Control and Affordability Preservation
Developers subject to the ARO have two methods of compliance: construction of units and/or payment of in-lieu fees. Rental
units generated by the ARO to date are primarily located in Higher Income zones on the north side of the City.
Inclusionary Zoning
Outcomes
Approx. 600 units have been committed as a result of the ARO [1]
Current ARO requirements are projected to generate 1,200 new
units and $90 million over the next 5 years
Distribution of In-Lieu Fees and Units
Fees in lieu of developing units are deposited into the Affordable
Housing Opportunity Fund (AHOF)
50% are contributed to the Chicago Low Income Housing
Trust Fund
Developers receive a $25,000 in-lieu fee reduction if they sell or
lease units to the Chicago Housing Authority [2]
ARO units whose market value at least $25,000 greater than the
affordable price are included in the Chicago Community Land Trust
(CCLT)
Rental units are monitored by the City of Chicago’s Department of
Planning and Development
[1] Total ARO units committed is sourced from City of Chicago presentation on June 27, 2018 regarding
Chicago’s Five-Year Housing Plan.
[1] In-lieu fee reduction option is only available for developments located in Higher Income and Downtown
zones.
Location of ARO Rental Units
Affordable housing units produced under the ARO are located in
the following community areas that coincide with communities:
Blue Line – Logan Square
Logan Square: 61
Kedzie Corridor
East Garfield Park: 0
Pink Line – California
North Lawndale: 0
South Lawndale: 0
Green Line South
Grand Boulevard: 0
Washington Park: 0
Woodlawn: 0
Source: City of Chicago Department Planning and Development, Affordable Rental Housing Resource List, downloaded on 7/20/18.
Existing Local Program
11

SB Friedman Development Advisors
Deed Restricted Housing (DRH)
2. Strategies for Community Control and Affordability Preservation
Deed restrictions are often included for affordable housing units
receiving public subsidies to enhance affordability for
homebuyers. New homeowners execute a deed covenant
stipulating that the home will be sold to a low-income
household in the future under an established formula or
evaluation. In some cases, use and resale restrictions are instead
appended to a homeowner’s mortgage. DRHs are often the
result of inclusionary mandates and affordable housing
incentives.
Types of Projects: single and multi-family housing,
homeownership, rental
Legal Mechanism: deed covenant, in accordance with state-
enabling legislation
Governance: implemented by local governments or non-profits;
enforcement can be overseen by a non-profit or a public agency
Deed-Restricted Housing
Opportunities
In growing communities, DRH can provide affordability protections:
Leverage new residential construction to increase supply of DRH
through inclusionary zoning and incentives
Challenges
Potential Limited Permanence
Restrictive covenants often lapse after a specified period of time
Shared Equity Tradeoff
Offer homeowners a limited return on investment
Organizational Capacity
May need to partner with nonprofit or public agency to ensure
restriction enforcement
12

SB Friedman Development Advisors
Community Land Trust (CLT)
2. Strategies for Community Control and Affordability Preservation
CLTs acquire land for community use and maintain permanent
ownership of the land. Residents purchase and own the building
and enter into a long-term (usually 99-year) lease with the CLT.
By separating the ownership of land and housing, CLTs provide
low- and moderate-income households with an opportunity to
build equity through homeownership.
CLTs employ resale formulas to give homeowners a moderate
return on their investment and maintain affordable pricing for
future homeowners. CLTs can also lease multifamily or
commercial properties, in which tenants/leaseholders are
subject to the same resale restrictions. Types of Projects: single and multi-family housing,
homeownership, rental, commercial properties
Legal Mechanism: ground lease or deed covenant, in
accordance with state-enabling legislation
Governance: elected Board of Directors, comprised of
leaseholders and/or residents, community residents, and
representatives of broader public interest
Community Land Trust
Proud Ground home in North Portland, OR
Source: Solving the Affordable Homeownership Gap (2016)
13

SB Friedman Development Advisors
Community Land Trust (CLT)
2. Strategies for Community Control and Affordability Preservation
Opportunities
In growing communities, CLTs can provide affordability
protections:
Limit rising homeownership costs
Guarantee housing remains affordable for future
residents
Provide low- and moderate-income residents with the
opportunity to build equity through homeownership
In disinvested communities, CLTs can build community
control:
Reduce absentee ownership and deterioration
Sustain owner-occupancy
Provide flexible community development options
Challenges
Community Dynamics
CLT will compete with market-rate buyers to purchase
land in strong housing markets
Land acquisition may be difficult in communities with
few publicly-owned properties
Shared Equity Tradeoff
Homeowners receive a limited return on investment
e.g., 25% of market appreciation
Organizational Capacity
Require significant financial and technical assistance
May need to partner with other community
organizations, and nonprofit and commercial developers
to acquire and develop/rehabilitate properties
Community Land Trust
14

SB Friedman Development Advisors
Chicago Community Land Trust
2. Strategies for Community Control and Affordability Preservation
The Chicago Community Land Trust (CCLT) was created in 2006 to preserve the long-term affordability of homeownership units
created through the City of Chicago’s affordable housing programs, including the Affordable Requirement Ordinance (ARO). CCLT
utilizes deed covenants to preserve the affordability of for-sale units.
Year Founded: 2006
Geography: City of Chicago, IL
Entity: Non-profit corporation, quasi-governmental entity
Type of Development: Homeownership
Governance:
18-member Board of Directors, appointed by the Mayor with consent of Chicago City Council
Administration and staff – Chicago Department of Planning and Development
Projects: 69+ homeownership units
Community Land Trust
Income affordability [1]: 120% of AMI
[1] For units subject to program requirements prior to the 2015 ARO amendment, income affordability is 100% of AMI.
Existing Local Program
15

SB Friedman Development Advisors
Chicago Community Land Trust
2. Strategies for Community Control and Affordability Preservation
Resale Restrictions following 2015 ARO amendment
Units must be resold to another income-qualified buyer [1]
Minimum income: Housing payments < 38% of income
Maximum income: 120% of AMI
Units must be resold for less than the maximum resale price, which is the
lower of:
Current fair market value
Amount affordable to households earning 120% of AMI
Original price + share of appreciation (ranges from 12-25%)
Deed restrictions at not renewed after each resale [2]
Deed restrictions expire after a 30-year period [3]
[1] CCLT has the right of first refusal to repurchase units, but budgetary constraints have
prevented CCLT from ever exercising this right.
[2] Prior the 2015 ARO amendment, deed restrictions were renewed after every resale.
[3] Prior to the 2015 ARO amendment, unit affordability lasted for the duration of a 99-year
deed covenant. Following the 2015 ARO amendment, the deed restriction can be removed after
a 30-year period, subject to certain conditions.
Methods for Acquisition
Units managed by CCLT are developed through the City’s
affordable housing programs:
Downtown Affordable Housing Zoning Bonus
Affordable Requirements Ordinance (ARO)
ARO units are placed in the CCLT if the affordable
price is at least $25,000 below market value
CCLT was granted the ability to acquire, develop, and transfer land in order to preserve the supply of affordable homeownership
units. However, due to budgetary constraints, CCLT has never acquired or developed housing units, but has focused on
employing deed covenants to ensure the affordability of units for a certain time period. The price control period was shortened
through the 2015 amendment to the City’s Affordable Requirements Ordinance.
Community Land Trust
Operations
In 2015, operational revenues were approx. $290,000
Primarily funded through a City of Chicago grant
In 2015, operational costs were approx. $280,000
2 employees - Department of Planning and Development
Source: Report of the Office of Inspector General: Affordable Requirements Ordinance Administration Audit (2017)
Existing Local Program
16

SB Friedman Development Advisors
Community Land Bank (CLB)
2. Strategies for Community Control and Affordability Preservation
CLBs typically acquire title to vacant, abandoned and tax
delinquent properties, stabilize and potentially remediate the
properties, and then transfer title to a new owner. CLBs often
partner with local community and/or governmental entities and
ensure that redevelopment plans are consistent with local land
use goals.
Types of Projects: acquisition and transfer; single and multi-
family housing, homeownership, rental, vacant lots, commercial
properties
Legal Mechanism: legal authority, in accordance with state-
enabling legislation
Governance: determined by state-enabling legislation
Legal corporations – Board of Directors, typically made up of private
citizens, elected officials, and local government employees
Community Land Bank
Opportunities
In disinvested communities, CLBs can build community control:
Convert problem/blighted properties into productive use
Prevent cycle of abandonment and deterioration
Stabilize or increase property values
Advance plans that require significant land acquisition (e.g.,
green infrastructure expansion, brownfield restoration program)
Challenges
Limited Permanence
CLBs have no control over property affordability after transfer
Organizational Capacity
CLBs are typically governmental or quasi-governmental entities
Organizations with technical capacity and funding can acquire
properties, clear titles and stabilized properties
17

SB Friedman Development Advisors
Cook County Land Bank Authority
2. Strategies for Community Control and Affordability Preservation
The Cook County Land Bank Authority (CCLBA) was established in 2013 following
the adoption of an enabling ordinance by Cook County. By returning abandoned
and tax-delinquent properties to productive uses, CCLBA aims to stabilize
neighborhoods and stimulate development. CCLBA administers a Tax Certificate
Program throughout Cook County, with a particular emphasis on 13 focus
communities.
Portfolio Size [1]:
Acquired parcels: 100+
Tax Certificate parcels: 4,800+
[1] Portfolio size as of July 2018. Sourced from
Cook County Land Bank Authority Interactive
Property Viewer.
Community Land Bank
Year Founded: 2013
Geography: Cook County, IL
Governance: 11-member Board of Directors;
appointed by Cook County President and
Cook County Board of Commissioners
Entity: Cook County government agency
Projects: land acquisition and transfer,
demolition, rehab, lease; residential,
commercial, and industrial properties
Communities within CCLBA Focus
Communities:
Kedzie Corridor
Green Line South
CCLBA focus communities
Source: Cook County Land Bank Authority
Existing Local Program

SB Friedman Development Advisors
Cook County Land Bank Authority
2. Strategies for Community Control and Affordability Preservation
The CCLBA has established transparent polices and procedures for land acquisition and disposition that prioritize neighborhood
stabilization and aim to stimulate residential, commercial, and industrial development.
Sources of Land Acquisition
Tax delinquent properties via Cook County Scavenger Sale
Transfers from the State of Illinois, local governmental units,
intergovernmental entities
Market purchases
Private donations from individuals
Priorities for Disposition
CCLBA has the following priorities for use of CCLBA properties:
Neighborhood revitalization – return to productive status, land
assemblage for economic development
Affordable housing – preservation of long term affordability through
community land trusts, non-profits, or public entities
Economic development – promotes job creation
Conservation – preservation and re-use of land for environmental
conservation or other greening purposes
When evaluating disposition options, CCLBA considers whether the
intended use of a property is consistent with neighborhood plans.
Properties are transferred to:
Non-profits
Community developers
Faith-based organizations
Homebuyers via Homebuyer Direct Program
Municipalities
Community Land Bank
Sources of Operational Funding
Grants [1] Illinois Housing Development Authority (IDHA) – Hardest Hit Fund
Revenues from transactions [2]
[1] Grants currently provide approximately 15% of operational funds.
[2] Transactional revenues provide approximately 85% of operational funds.
Operations
11 employees
Existing Local Program
19
SB Friedman Development Advisors
Cook County Land Bank Authority
2. Strategies for Community Control and Affordability Preservation
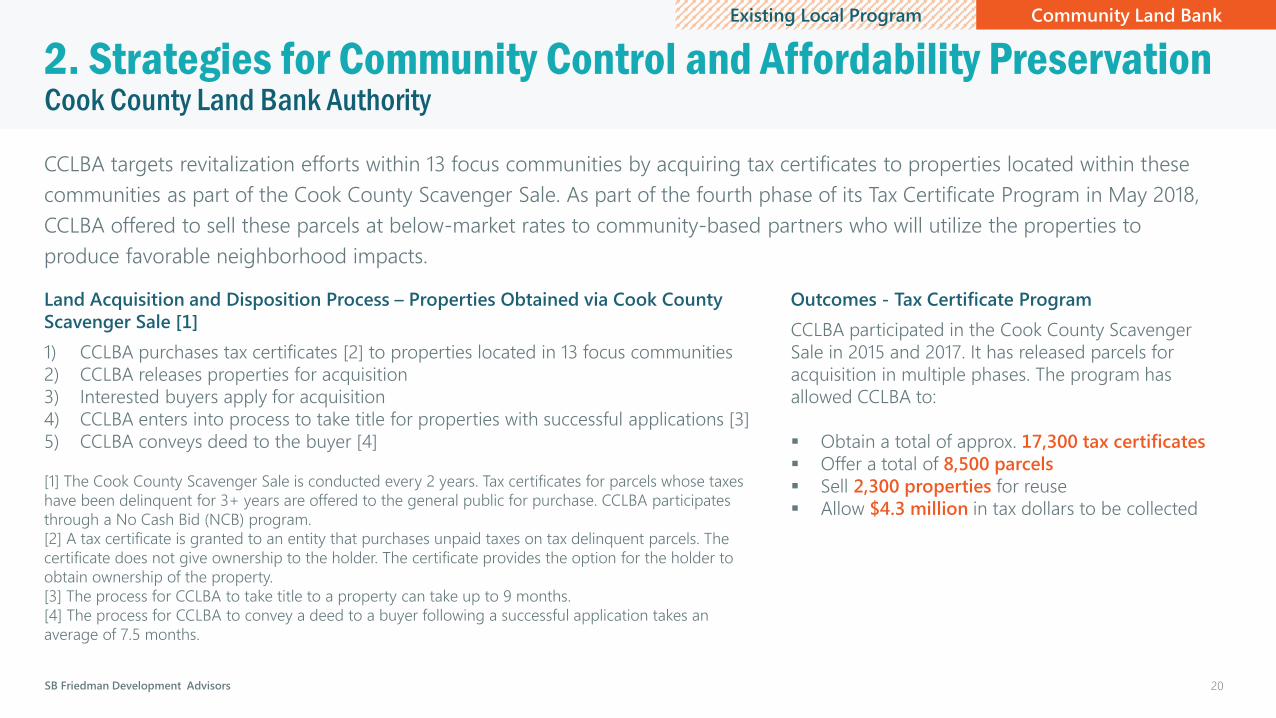
CCLBA targets revitalization efforts within 13 focus communities by acquiring tax certificates to properties located within these
communities as part of the Cook County Scavenger Sale. As part of the fourth phase of its Tax Certificate Program in May 2018,
CCLBA offered to sell these parcels at below-market rates to community-based partners who will utilize the properties to
produce favorable neighborhood impacts.
Land Acquisition and Disposition Process – Properties Obtained via Cook County
Scavenger Sale [1]
1) CCLBA purchases tax certificates [2] to properties located in 13 focus communities
2) CCLBA releases properties for acquisition
3) Interested buyers apply for acquisition
4) CCLBA enters into process to take title for properties with successful applications [3]
5) CCLBA conveys deed to the buyer [4]
[1] The Cook County Scavenger Sale is conducted every 2 years. Tax certificates for parcels whose taxes
have been delinquent for 3+ years are offered to the general public for purchase. CCLBA participates
through a No Cash Bid (NCB) program.
[2] A tax certificate is granted to an entity that purchases unpaid taxes on tax delinquent parcels. The
certificate does not give ownership to the holder. The certificate provides the option for the holder to
obtain ownership of the property.
[3] The process for CCLBA to take title to a property can take up to 9 months.
[4] The process for CCLBA to convey a deed to a buyer following a successful application takes an
average of 7.5 months.
Community Land Bank
Outcomes - Tax Certificate Program
CCLBA participated in the Cook County Scavenger
Sale in 2015 and 2017. It has released parcels for
acquisition in multiple phases. The program has
allowed CCLBA to:
Obtain a total of approx. 17,300 tax certificates
Offer a total of 8,500 parcels
Sell 2,300 properties for reuse
Allow $4.3 million in tax dollars to be collected
Existing Local Program
20

SB Friedman Development Advisors
Cook County Land Bank Authority
2. Strategies for Community Control and Affordability Preservation
CCLBA can enter into flexible land banking agreements with non-profits, developers, and community-based organizations to
advance redevelopment strategies that require land acquisition and assembly.
CCLBA Land Banking Agreement Process
1) Partner entity develops site-specific redevelopment strategy
2) CCLBA strategically acquires and bank parcels in accordance with
strategy
3) CCLBA removes parcels from for-sale listings and does not entertain
bids for duration of land banking agreement [1]
4) CCLBA clears delinquent taxes on parcels
5) Partner entity conducts community engagement and secures project
financing
6) CCLBA transfers land to partner entity
7) Partner entity executes redevelopment strategy
[1] Typically three years
Community Land Bank
Benefits to Land Banking Agreement
Eliminates delinquent taxes on strategic parcels
Prevents purchase of parcels by other parties,
allowing partner entity to assemble site and conduct
due diligence outside of market forces
Extends period for due diligence and securing
project financing
Existing Local Program
21

SB Friedman Development Advisors
Limited Equity Housing Cooperative (LEHC)
2. Strategies for Community Control and Affordability Preservation
LEHCs are business corporations that own a multitenant
development. Residents are the sole shareholders and enter
into long-term proprietary leases that secure occupancy rights
to their units. LEHCs employ resale restrictions on member
shares to ensure share values remain affordable to low-income
households over time.
Types of Projects: multi-family housing, conversion of tenant-
occupied buildings [1], new building construction
Legal Mechanism: shareholder agreement, in accordance with
state-enabling legislation
Governance: elected Board of Directors
[1] Conversion to an LEHC appears most feasible for: (1) government-owned
and/or subsidized buildings; and (2) rental buildings whose occupants have
the right of first refusal.
Limited Equity Housing Cooperative
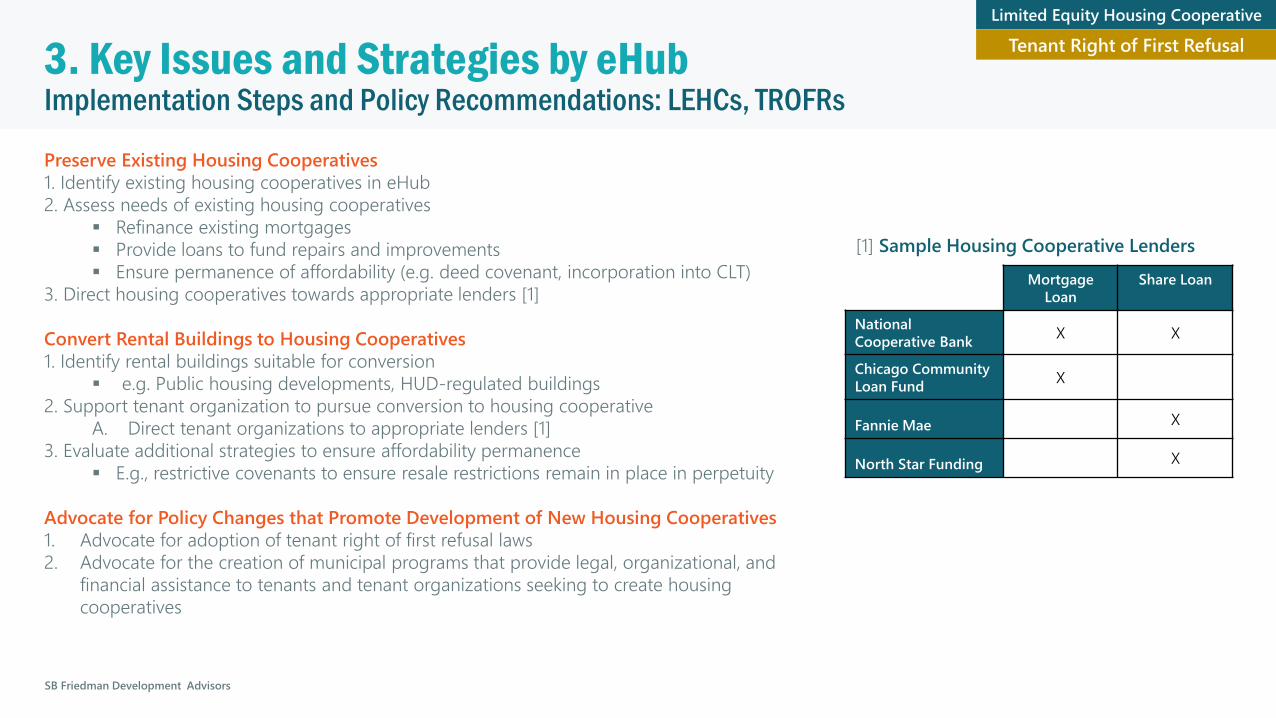
Financing
Housing cooperatives can obtain blanket mortgages to purchase
or construct a development, refinance an existing loan, or fund
repairs and improvements. Members can utilize share loans to
purchase their cooperative shares. Lenders include:
National Cooperative Bank – National lender
Cooperative housing loans – 3,000 loans totaling $5 billion
Share loans - 8,200 loans totaling $1 billion
Chicago Community Loan fund – Chicago metro area lender
Housing cooperative loans
Fannie Mae – National lender
Share loans
North Star Funding – Lends in several states, including IL
Share loans
22

SB Friedman Development Advisors
Limited Equity Housing Cooperative (LEHC)
2. Strategies for Community Control and Affordability Preservation
Opportunities
In growing communities, LEHCs can provide affordability
protections:
Allow low- and moderate-income residents who are sensitive to
rent increases to remain in their apartments
Convert large, multi-unit buildings (likely to qualify for share
loans) into LEHCs
Convert government subsidized buildings and public housing
into LEHCs
Provide new housing options in built-out neighborhoods
through conversion, instead of new development
Members receive a return on investment while maintaining unit
affordability
Challenges
Community Dynamics
May exacerbate housing shortage options by removing available
affordable rental housing from local rental market
LEHCs compete with market-rate buyers in strong housing
markets, so purchase strategies may be challenged once
gentrification pressures begin
Potential Limited Permanence
In areas with high market-rate housing demands, LEHCs may
face pressure to convert to market-rate units, though LEHC
structure typically limits financial incentives to sell
Type of Development
Requires significant collective participation
Share loans often have specific minimum building requirements
(e.g., >12-20 units)
Organizational Capacity
Require significant collective participation by residents
Require significant financial and technical assistance
May need a government or non-profit sponsor, such as a CLT, to
ensure LEHCs remain affordable
Limited Equity Housing Cooperative
23
SB Friedman Development Advisors
Tenant Right of First Refusal (TROFR)
2. Strategies for Community Control and Affordability Preservation
Tenant right of first refusal laws provide tenants or tenant
associations with the right to purchase rental units or
buildings before an owner sells the building on the open
market. Owners are required to give residents advanced
notification of their intent to sell, and residents enter into
a process to identify partners, secure capital, and
assemble a purchase offer. Some laws allow residents to
assign their right of first refusal to other entities, such as
nonprofits or affordable housing providers, that assist
residents in forming a LEHC or maintain the property as
affordable rental housing.
Tenant Right of First Refusal
Types of Projects: rental, single and multi-family housing,
manufactured housing parks
Legal Mechanism: enabling legislation at the state level
Governance: administered by municipal departments
Opportunities
TROFRs can provide affordability protections and community control:
Allow low- and moderate-income tenants to avoid displacement
due to rental conversion
Convert multi-unit buildings into LEHCs
Preserve rental housing options in built-out neighborhoods
Challenges
Community Dynamics
Tenants/tenant associations compete with market-rate buyers in
strong housing markets, so purchase strategies may be challenged
once gentrification pressures begin
Organizational Capacity
Require significant financial and technical assistance
Require significant collective participation by tenants
May need to partner with a non-profit sponsor or affordable
housing developer to convert to LEHC or maintain rental housing 24

SB Friedman Development Advisors
Solar Credit Trading
2. Strategies for Community Control and Affordability Preservation
Illinois has a Solar Renewable Energy Certificates (SREC) market,
wherein electricity suppliers are required to secure a portion of
their electricity from solar generators to meet the state’s
Renewable Portfolio Standard (RPS). Community solar projects
can be issued SRECs based on the units of electricity created.
The Illinois Power Agency (IPA) developed a Long-Term
Renewable Resources Procurement Plan, which was approved
April 2018 and aims to stimulate new investments in renewable
energy. The Illinois Solar For All Program (ISFA), which is
currently under development, aims to expand access to solar
energy and increases job opportunities for low-income
communities, and thus may have favorable implications for
community solar projects implemented in Elevated Chicago
community areas.
Resources:
Long-Term Renewable Resources Procurement Plan (LTRRPP),
December 2017
Includes Illinois Solar for All Program (ISFA) overview
Illinois Solar Energy Association’s (ISEA) webinar on Illinois
Solar for All, April 2018
Illinois Power Agency REC prices, June 2018
Renewable Energy Credit TradingExisting Local Program
25

SB Friedman Development Advisors
Solar Credit Trading
2. Strategies for Community Control and Affordability Preservation
Opportunities
Solar credit trading programs in Illinois can build community control:
Incentivize development of community solar projects
Provide energy cost reductions to new communities
Provide SREC payments to hosts of community solar projects
Provide opportunity for workforce development to support
installation of community solar projects
Challenges
Organizational Capacity
Require significant capacity to understand program
requirements
Require significant financial and technical assistance to
implement community solar projects
May need to partner with developers, non-profits, community
organizations, anchor institutions, business owners to plan,
install, and manage community solar projects
Renewable Energy Credit TradingExisting Local Program
26

SB Friedman Development Advisors
Impact Investing
2. Strategies for Community Control and Affordability Preservation
Philanthropic foundations and anchor institutions typically utilize diverse investment portfolios to generate funds needed to
pursue their missions. Entities that engage in impact investing can allocate a portion of their investment funds towards
community-based organization or projects that generate positive social outcomes, including job creation and economic
redevelopment, in addition to financial returns.
Key Approaches
Mission-Related Investments
Employed by foundations and anchor institutions
Program-related investments (PRIs) build wealth in low-income communities by supporting Community Development Corporations (CDCs)
and Community Development Finance Institutions (CDFIs)
Investments can be made in for-profit business that generate positive financial and social returns
Community Financing
Employed by for-profit enterprises and non-profit corporations
Offer investment opportunities to community members via established crowdfunding tools (e.g. direct public offerings (DPOs) to community
members)
Impact Investing
27
SB Friedman Development Advisors
Impact Investing
2. Strategies for Community Control and Affordability Preservation
Opportunities
Impact investments can build community control:
Provide opportunity to collaborate with philanthropic
foundations and anchor institutions to align investment
deployment with community goals
Provide opportunity for community engagement in approval
process for deployment of impact investment funds
Positive rate of return allow funds to be re-invested in future
community-focused projects
Community financing can provide direct financial returns to local
investors
Challenges
Organizational Capacity
Require significant effort and capacity to engage philanthropic
foundations and anchor institutions and advocate for creation of
impact investment
May need to partner with other community-based organizations
to advocate for strategic and targeted investments
Community financing requires organizational support and
financing entity to manage and structure investments
Financing Structure
Requires relationships with local developers willing to accept an
equity partner in deal
Foundations may seek or require return of capital before other
equity partners/developer, potentially challenging structure of
deal
Impact Investing
28

SB Friedman Development Advisors
Neighborhood Opportunity Fund
2. Strategies for Community Control and Affordability Preservation
NOF is a grant program run by the City of Chicago that uses
funds generated by development fees on downtown projects to
finance commercial and cultural projects on Chicago’s South,
Southwest, and West Sides. NOF grants reimburse applicants
for costs related to new construction or the rehabilitation of
existing buildings. In 2017, approximately $3.2 million in NOF
funding was deployed to 32 grantees. As of May 2018, NOF has
collected $25 million.
Types of Projects: new construction, rehabilitation,
commercial spaces and cultural establishments,
located in NOF-eligible corridors
Legal Mechanism: City of Chicago adopted the
Neighborhood Opportunity Bonus ordinance
(amendment to Zoning Code) in 2016, which allocates
developer payments to NOF
Governance: administered by the City of Chicago
Eligible Communities [1]:
Kedzie Corridor
Pink Line-California
Green Line South
[1] Eligible projects are located
within or adjacent to NOF-eligible
corridors.
Project Funding Source
NOF Investment Areas
Source: City of Chicago
Existing Local Program
29

SB Friedman Development Advisors
Neighborhood Opportunity Fund
2. Strategies for Community Control and Affordability Preservation
Opportunities
In disinvested and growing communities, NOF can build
community control:
Fund project costs for commercial projects and cultural
establishments that advance community goals and provide
needed services
Challenges
Grant Limitations
NOF grants cannot be applied towards residential units or
the residential portion of a mixed-use building
NOF grants cannot be applied towards repairs or
improvements that are required to bring a building into
compliance with the City of Chicago’s Building Code
Project Funding Source
Grant Requirements
Type of Projects
Commercial and cultural projects [1]
E.g., grocery stores, restaurants, retail, theaters, music venues, art
galleries, community centers
Project Location
NOF-eligible commercial corridors
Project Costs Eligible for Reimbursement
New construction: Up to 30% of total project costs
Rehabilitation: Up to 50% of total project costs
E.g., land acquisition and assembly, building acquisition, building
demolition, environmental remediation, architectural and engineering
fees, financing fees
[1] Commercial projects are defined as those that engage in the sale of commercial
goods and services. Cultural projects are defined as those that provide cultural
experiences to the general public.
Existing Local Program
30

SB Friedman Development Advisors
Opportunity Investment Fund
2. Strategies for Community Control and Affordability Preservation
OIF is a pilot program developed by the Community Investment Corporation
(CIC) that preserves affordable housing units in strong markets. OIF funds
provide low-cost mezzanine debt to developers who purchase and
rehabilitate rental buildings in strong markets. In return, developers maintain
20% of units at affordable rents for at least 15 years. OIF identifies target
community areas and census tracts for project eligibility. As July 2018, OIF
totals $30 million. Financial supporters include the City of Chicago, the Capital
Magnate Fund, and the JP Morgan Chase Foundation.
Eligible Communities:
Blue Line – Logan Square [1]
Pink Line – California [2]
Green South Line [2]
[1] Community is located within an OIF-targeted
community area.
[2] Communities are adjacent to or partially
located within OIF-targeted community areas.
Projects located within eHubs may be eligible.
Types of Projects: purchase of existing,
naturally occurring affordable rental
housing in OIF-targeted community areas
Governance: administered by the
Community Investment Corporation
Project Funding Source
OIF target community areas
Source: Community Investment Corporation
Existing Local Program
31
SB Friedman Development Advisors
Opportunity Investment Fund
2. Strategies for Community Control and Affordability Preservation
Opportunities
OIF funds can provide affordability protections and build
community control:
Guarantee naturally-occurring affordable rental housing remains
affordable for a particular period of time
Can partner with Chicago Housing Authority to encourage
building owners to enter into Housing Choice Voucher and
project-based voucher contracts
Allow mission-based non-profit developers to compete with
private developers in strong housing markets
Challenges
Fund Limitations
OIF funds cannot be used for the purchase of existing
homeownership units
Pilot program would need to be expanded to additional
geographies in the future
Affordability provisions are not permanent
Project Funding SourceExisting Local Program
32

3. Key Issues and Strategies by eHub

SB Friedman Development Advisors
Key Issues and Opportunities by eHub
3. Key Issues and Strategies by eHub
Concentration of Vacant Land Potential for Green InfrastructureLimited Availability
of Public FundingOverall Conclusions
eH
ub
Blue Line –
Logan Square
Limited vacant land, almost none of which is
publicly-owned
Limited green infrastructure opportunities:
Logan Square Park, Palmer Square Park, Boulevards
TIF districts overlay
commercial corridors,
not residential areas
High development activity
Limited vacant land for new construction
High concentration of long-term and low-income senior
homeownership
Displacement vulnerability [1]
Green Line –
Kedzie-Lake
80 acres (26% of land area)
Majority located along W Lake St
37 acres City owned/CCLBA controlled
School buildings may be suitable for solar
Vacant parcels adjacent to CTA station may be
suitable for stormwater infrastructure
Garfield Park
Substantial fund
balances in TIF districts
Limited development activity
High availability of affordable housing
Moderate long-term and senior homeownership
Blue Line –
Kedzie-Homan
76 acres (21% of land area)
Majority located along W 5th Ave
33 acres City owned/CCLBA controlled
School and CTA-owned buildings may be suitable
for solar
Relatively limited development activity
Moderate availability of affordable units
Moderate long-term and senior homeownership
Pink Line –
California
Institutional and industrial buildings may be
suitable for solar
Douglas Park
TIF districts overlay
industrial and park
areas, not residential
areas
Displacement vulnerability [1]
Large non-residential land uses
Concentrated long-term and low-income senior
homeownership
Green Line –
51st Street
75 acres (17% of land area)
Concentrated along commercial and CTA
corridor
36 acres City-owned
School buildings may be suitable for solar
Vacant parcels along CTA line may be suitable for
stormwater infrastructure
Washington Park
Smaller geography
eligible for NMTC,
Opportunity Zone
Displacement vulnerability [1]
Lower value parcels and vacant land concentrated along
Green Line ROW
High availability of affordable housing
Concentrated long-term homeownership
Green Line –
Garfield
80 acres (15% of land area)
Majority located along CTA corridor
42 acres City-owned
Vacant parcels along CTA line may be suitable for
stormwater infrastructure
Washington Park
Lower value parcels and vacant land concentrated along
Green Line ROW
Limited development activity
High availability of affordable housing
Green Line –
Cottage Grove
76 acres (22% of land area)
Concentrated along commercial corridors and
east of CTA station
>40 acres City owned/CCLBA controlled
UChicago buildings may be suitable for solar
Vacant parcel cluster east of CTA station may be
suitable for stormwater infrastructure
High development activity
Displacement vulnerability [1]
High availability of affordable housing
Concentrated long-term homeownership
[1] Displacement Vulnerability sourced from DePaul University Institute for Housing Studies, as presented in the Center for Neighborhood Technology’s (CNT) EcoDistrict Feasibility Scan

SB Friedman Development Advisors 35
Strategies by eHub
3. Key Issues and Strategies by eHub
Key Strategies
Community
Land Trust
Community
Land Bank
Limited Equity
Housing
Cooperative
Neighborhood
Opportunity
Fund
Opportunity
Investment
Fund
Renewable
Energy Credit
Trading
Impact
Investment
Long-term
Homeowner
Assistance
eH
ub
Blue Line – Logan Square X X X X
Green Line – Kedzie-Lake X X X X X
Blue Line – Kedzie-Homan X X X X X
Pink Line – California X X X X
Green Line – 51st Street X X X X X X
Green Line – Garfield X X X X X
Green Line – Cottage Grove X X X X X X X
SB Friedman Development Advisors
Implementation Steps and Policy Recommendations: CLTs
3. Key Issues and Strategies by eHub
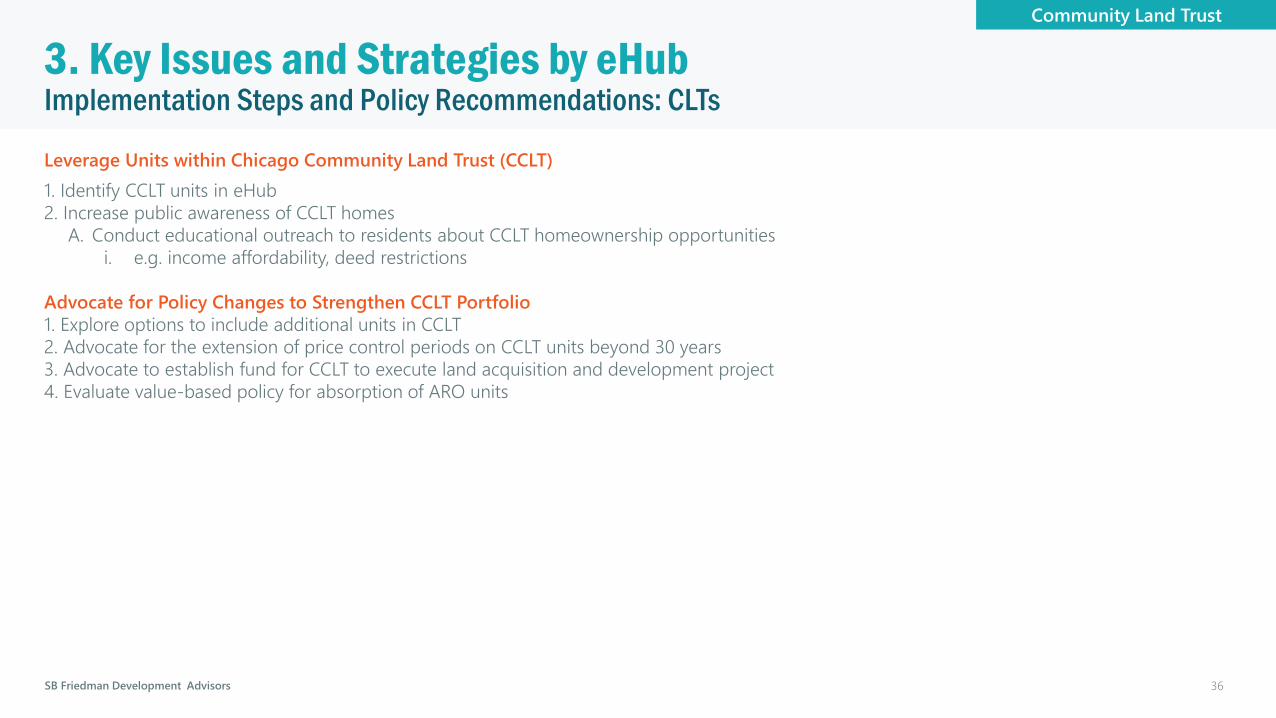
Leverage Units within Chicago Community Land Trust (CCLT)
1. Identify CCLT units in eHub
2. Increase public awareness of CCLT homes
A. Conduct educational outreach to residents about CCLT homeownership opportunities
i. e.g. income affordability, deed restrictions
Advocate for Policy Changes to Strengthen CCLT Portfolio
1. Explore options to include additional units in CCLT
2. Advocate for the extension of price control periods on CCLT units beyond 30 years
3. Advocate to establish fund for CCLT to execute land acquisition and development project
4. Evaluate value-based policy for absorption of ARO units
Community Land Trust
36

SB Friedman Development Advisors
Implementation Steps and Policy Recommendations: CLTs
3. Key Issues and Strategies by eHub
Pursue Independent Neighborhood-Scale Community Land Trust
1. Identify high-capacity community organization to undertake CLT feasibility evaluation, planning, and program management
2. Obtain start-up assistance from national CLT leaders (e.g. Grounded Solutions Network)
Legal support: incorporation, documents
Organization: Board of Directors, membership structure
Operational strategy: acquisition methods, use priorities, resale restrictions
Funds: e.g. CLT Accelerator and Accelerator Fund
3. Determine operational strategy
A. Identify goals (e.g. type of development, affordability, geographic scope, etc.)
B. Determine entity status (e.g. non-profit, affiliate of existing organization)
C. Determine methods for land acquisition and development
Purchase market-rate land
Accept donations from affordable housing developers and private owners
Purchase properties available through the CCLBA Tax Certificate program
Advocate for transfers from local government entities and affordable housing programs (e.g. City of Chicago ARO)
D. Determine and obtain funding sources
Funds for acquisition, renovation, and development - Community Development Block Grant (CDBG), HOME, TIF, private lenders
Funds for program management – State and local housing funds, program revenues
4. Create a pipeline of potential CLT homeowners
A. Conduct educational outreach to potential homeowners about CLT
B. Conduct homebuyer education and funding assistance programs
Community Land Trust
37
SB Friedman Development Advisors
Implementation Steps and Policy Recommendations: LEHCs, TROFRs
3. Key Issues and Strategies by eHub
Preserve Existing Housing Cooperatives
1. Identify existing housing cooperatives in eHub
2. Assess needs of existing housing cooperatives
Refinance existing mortgages
Provide loans to fund repairs and improvements
Ensure permanence of affordability (e.g. deed covenant, incorporation into CLT)
3. Direct housing cooperatives towards appropriate lenders [1]
Convert Rental Buildings to Housing Cooperatives
1. Identify rental buildings suitable for conversion
e.g. Public housing developments, HUD-regulated buildings
2. Support tenant organization to pursue conversion to housing cooperative
A. Direct tenant organizations to appropriate lenders [1]
3. Evaluate additional strategies to ensure affordability permanence
E.g., restrictive covenants to ensure resale restrictions remain in place in perpetuity
Advocate for Policy Changes that Promote Development of New Housing Cooperatives
1. Advocate for adoption of tenant right of first refusal laws
2. Advocate for the creation of municipal programs that provide legal, organizational, and
financial assistance to tenants and tenant organizations seeking to create housing
cooperatives
Limited Equity Housing Cooperative
[1] Sample Housing Cooperative Lenders
Mortgage
Loan
Share Loan
National
Cooperative BankX X
Chicago Community
Loan FundX
Fannie Mae X
North Star Funding X
Tenant Right of First Refusal

SB Friedman Development Advisors
Implementation Steps and Policy Recommendations: Community Land Bank
3. Key Issues and Strategies by eHub
Leverage Existing Cook County Land Bank Authority (CCLBA) Operations
1. Integrate redevelopment goals and priorities within local plans to ensure consideration in CCLBA disposition process
e.g. quality of life plans, neighborhood plans
2. Identify particular CCLBA-controlled parcels that would aid in achieving discrete community goals
3. Engage with CCLBA to understand process, timeline, and discuss goals
4. Increase public awareness of CCLBA-owned land in eHub
A. Conduct educational outreach to homebuyers, community development organizations, and local developers
4. Increase public awareness of CCLBA-controlled land (through Tax Certificate program)
A. Conduct educational outreach about purchase of land through CCLBA’s Tax Certificate Program
B. Engage community development organizations and mission-based developers to purchase and redevelop or reuse CCLBA land
Develop Land Banking Agreements with CCLBA to Meet Community Goals
1. Design redevelopment strategy focused around land banking agreement with CCLBA
E.g., land acquisition and assembly for community solar, stormwater infrastructure, housing development projects, etc.
A. Determine program, timeline, and funding sources for land acquisition and assembly
B. Ensure redevelopment strategy is reflective of community plans
2. Coordinate and negotiate land banking agreement with CCLBA
Collaborate with CCLBA to Strengthen Existing Programs
1. Collaborate with CCLBA to strengthen Tax Certificate program in existing focus communities
2. Work with CCLBA regarding acquisition of properties outside of focus communities
A. Identify potential priority sites for redevelopment to be purchased through Cook County Scavenger Sale
Community Land Bank
39
SB Friedman Development Advisors
Implementation Steps and Policy Recommendations
3. Key Issues and Strategies by eHub
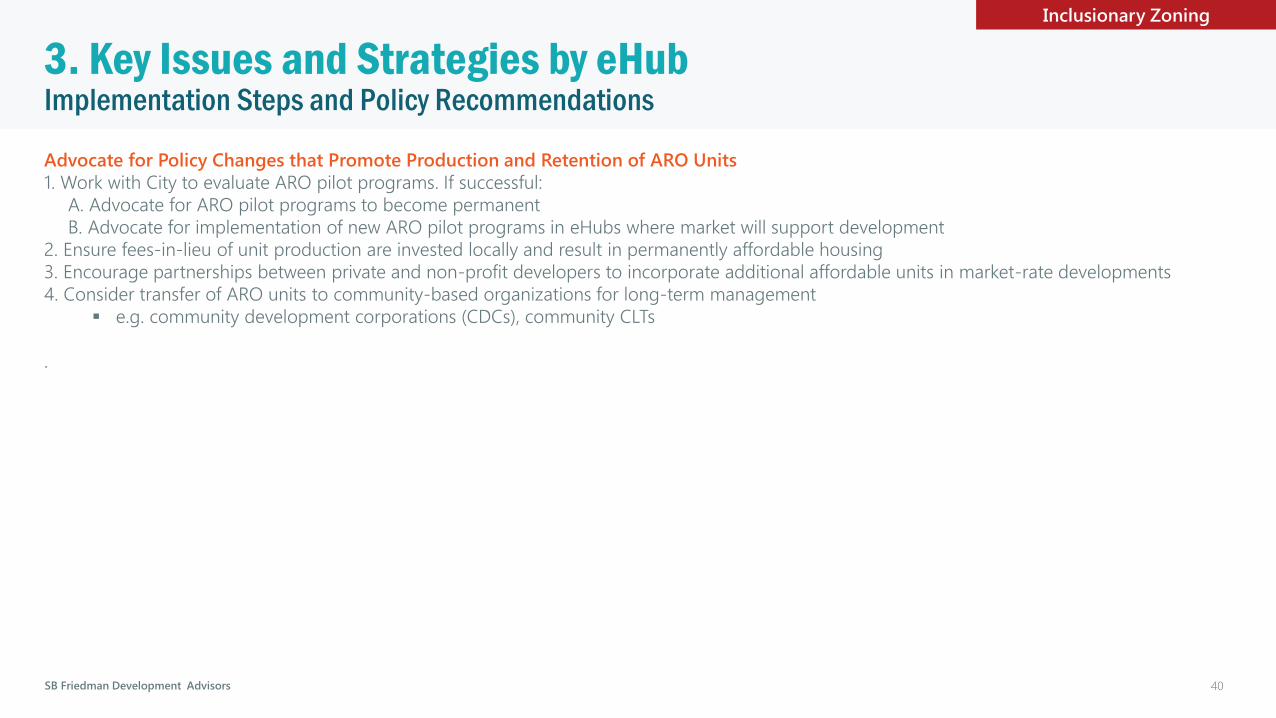
Advocate for Policy Changes that Promote Production and Retention of ARO Units
1. Work with City to evaluate ARO pilot programs. If successful:
A. Advocate for ARO pilot programs to become permanent
B. Advocate for implementation of new ARO pilot programs in eHubs where market will support development
2. Ensure fees-in-lieu of unit production are invested locally and result in permanently affordable housing
3. Encourage partnerships between private and non-profit developers to incorporate additional affordable units in market-rate developments
4. Consider transfer of ARO units to community-based organizations for long-term management
e.g. community development corporations (CDCs), community CLTs
.
Inclusionary Zoning
40

SB Friedman Development Advisors
Implementation Steps and Policy Recommendations
3. Key Issues and Strategies by eHub
Leverage Existing Opportunity Investment Fund
1. Increase awareness of Opportunity Investment Fund
A. Conduct educational outreach to mission-based developers about OIF funding
2. Engage mission-based developers to purchase and rehabilitate rental buildings
A. Identify potential partner developers
B. Evaluate options to extend affordability of rehabilitated affordable units beyond 15-year period mandated by OIF
e.g. deed-restrictions, incorporation into CLT, conversion to housing cooperative
Advocate for Permanence and Expansion of the Opportunity Investment Fund
1. Advocate for the OIF pilot program to become a permanent fund source
A. Publicize projects in eHub that successfully utilized OIF
2. Advocate for the expansion of OIF target areas
3. Identify additional funding partners (public and private)
3. Evaluate whether the affordability control period can feasible be extended
Project Funding Source
Leverage Existing Neighborhood Opportunity Fund
1. Increase awareness of Neighborhood Opportunity Fund
A. Identify and publicize NOF-funded projects in eHub
B. Conduct educational outreach to business owners, community development organizations, and mission-based developers about NOF
2. Engage partners to acquire, construct, and/or rehab commercial development or cultural assets
A. Identify potential partners
B. Identify priority sites for redevelopment
C. Evaluate options to extend affordability of newly acquired land and/or buildings
e.g. deed-restrictions, incorporation into CLT, conversion to housing cooperative
41

SB Friedman Development Advisors
Implementation Steps and Policy Recommendations
3. Key Issues and Strategies by eHub
Leverage the Illinois Solar for All Program (ISFA) [1]
1. Understand incentives offered for community solar projects through ISFA once finalized
Sub-programs, project eligibility, project incentives, payment structure
2. Increase public awareness of ISFA
Conduct educational outreach to business owners and community development organizations
3. Engage partners to develop community solar projects
A. Identify priority sites for development of community solar projects in eHub (see reference maps)
B. Coordinate with landowners to discuss possibility of partnership (for rooftop solar) or acquisition
C. Identify funding sources for installation
D. Engage with high-capacity partner(s) to undertake community solar project feasibility, planning, and management
[1] ISFA is still under development. It is part of the Illinois Power Agency’s a Long-Term Renewable Resources Procurement Plan, which was approved in April 2018.
Renewable Energy Credit Trading
42

SB Friedman Development Advisors
Implementation Steps and Policy Recommendations
3. Key Issues and Strategies by eHub
Collaborate with Organizations to Allocate Investment Funds Towards Impact Investment
1. Identify community-based foundations/institutions with investment portfolios
Anchor institutions (e.g. hospitals, universities)
Philanthropic foundations
2. Increase awareness of impact investment
A. Conduct educational outreach to potential partner organizations
3. Engage partners to develop impact investment funds
A. Design and create impact investment fund
i. Determine size of fund
ii. Determine priorities for fund disposition
Desired social outcomes (e.g. job creation, local hiring, provision of community services, development in priority area)
Minimum return on investment
Investment risk
iii. Establish approval procedure for fund disposition (e.g. board approval, approval by community members)
iv. Identify and evaluate potential fund recipients in eHub
For-profit enterprises
Community Development Finance Institutions (CDFIs)
Community Development Corporations (CDCs)
v. Deploy impact investments
vi. Evaluate impact investments according to desired social outcomes
Impact Investing
43
SB Friedman Development Advisors
Implementation Steps and Policy Recommendations
3. Key Issues and Strategies by eHub
Conduct Outreach to Long-Term Homeowners
1. Identify long-term homeowners in eHub
2. Assess needs of existing homeowners
Home repair or improvement
Financial assistance for property taxes
Mortgage refinancing
Foreclosure intervention
3. Identify homeowner assistance programs that can meet homeowners’
needs
4. Direct homeowners toward relevant homeowner resources
City of Chicago Neighborhood Improvement Program
Neighborhood Housing Services of Chicago (NHS Chicago) [1]
Evaluate Eligibility of Homeowner Assistance Programs for Federal
Funds
1. Identify high-impact homeowner assistance programs in eHubs
2. Evaluate suitability of federal funding sources
A. Community Development Block Grants (CDBG) – homeownership
assistance, energy efficiency improvements, residential rehabilitation
B. HOME program – housing rehabilitation, site improvements
3. Work with City to allocate federal funding sources to homeowner
assistance programs
Homeowner Assistance
[1] NHS Chicago - Services
Fixed-rate home improvement loans
Refinance loans
Foreclosure intervention counseling [1]
Target Block Program [2] – grants for exterior home repairs
Guidance from construction specialists
[1] Foreclosure prevention options include Home Affordable Refinance
Program (HARP), Illinois Hardest Hit Fund Program, I-Refi Program, and a
Loan Modification Program.
[2] Pink Line – California eHub is located in a Target Block eligible area.
44

4. Appendix | Case Studies
SB Friedman Development Advisors
OverviewCase Study: Proud Ground
Proud Ground was founded by the City of Portland in 1999 with
technical and funding assistance from the Institute of Community
Economics. Proud Ground is a community land trust offering
homeownership opportunities to lower-income, first-time buyers in
the Portland, OR region. Proud Ground provides first-time
homebuyer grants, develops affordable units and works with public
and private entities to add additional homes to the CLT.
Year Founded: 1999
Geography: Clackamas, Clark, Multnomah, Lincoln and Washington
Counties, OR (including Portland)
Entity: Non-profit
Type of Development: Homeownership units: SFH, TH, Condos
Governance: 14-member Board of Directors
Projects: 280+ homes under control of CLT
Median sales price [1]: $152,750
Median monthly costs [2]: $600-1,300
[1] Median sales price as of 2015.
[2] Median monthly payments as of 2015. Monthly payments include taxes and
insurance.
Community Land Trust
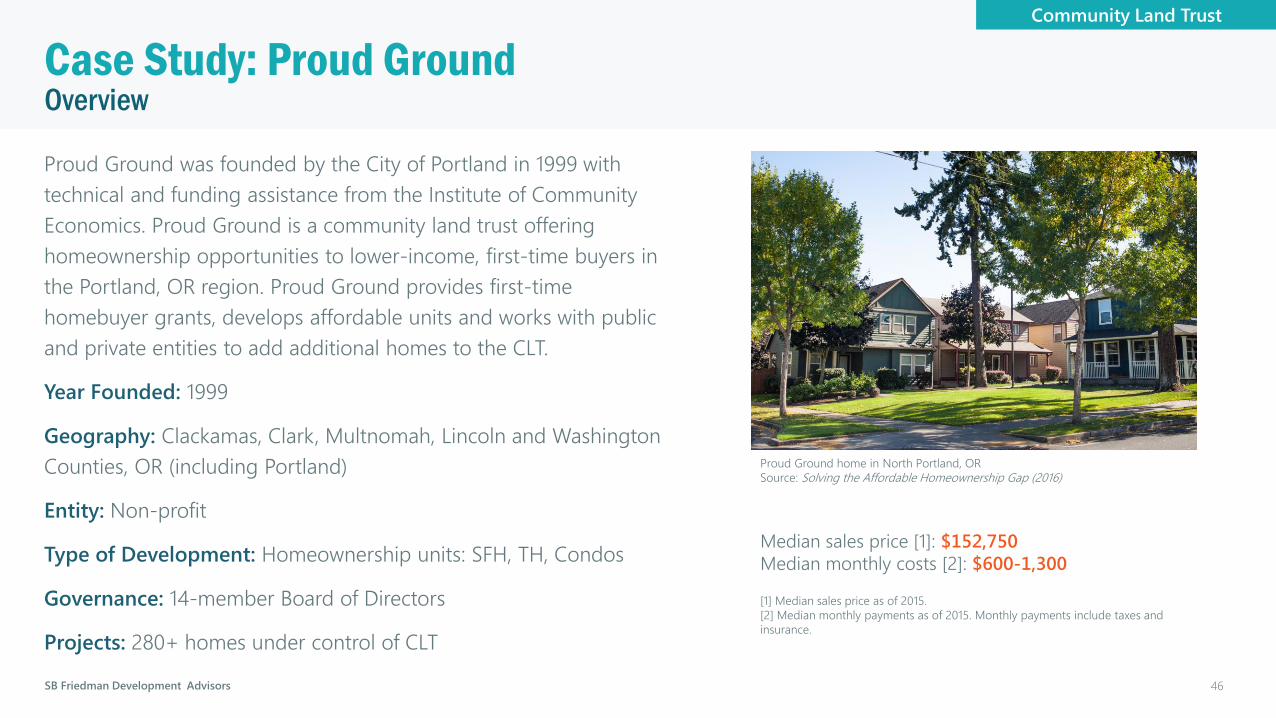
Proud Ground home in North Portland, OR
Source: Solving the Affordable Homeownership Gap (2016)
46

SB Friedman Development Advisors
Shared Appreciation ModelCase Study: Proud Ground
Proud Ground utilizes a shared appreciation model to ensure homes remain affordable over the long term, while allowing
homeowners to gain equity in their homes. Proud Ground employs income eligibility requirements and resale restrictions to
provide affordable homeownership options for lower-income households.
Source: Solving the Affordable Homeownership Gap (2016)
Resale Price Restrictions
Homeowners receive 25% of their
home’s appreciation
Serving Lower-Income Households
In 2015, the median annual
household income of homebuyers
was 62% of AMI
Eligibility Requirements
Buyers cannot earn more than 80%
of AMI
Buyers must have a household
income greater than $30,000
Shared Appreciation Model: Purchase of Proud Ground Home vs. Renting Apartment
Community Land Trust
47

SB Friedman Development Advisors 48
Sources for Funding Operations and Portfolio GrowthCase Study: Proud Ground
Proud Ground utilizes a diverse set of federal, state, and local programs to fund its operations. It also utilizes several channels to add new homes to its portfolio.
Sources of Operational Funding
Federal
Home Investment Partnership Program (HOME)
Community Development Block Grants (CDBG)
State
Oregon Workforce Housing Initiative
Oregon Housing and Community Services - LIFT
Local
TIF
Urban Renewal Area (URA) programs
Program
Annual revenues from existing units
Developer fees for new construction
Broker fees for home sales
Operations
Operational budget is approx. $800,000
7 FTE employees
Methods for Acquisition
Uses in-house capabilities to develop housing units
itself
Partners with private developers who opt in or are
mandated by inclusionary zoning to provide affordable
housing units
Partners with community organizations and non-profit
developers, including Habitat for Humanity, to include
new affordable units in CLT
Absorbs market-rate homes through its down payment
assistance grant program, wherein approved homebuyers
purchase market-rate homes that are then added to
Proud Ground’s portfolio
All properties are added to CLT depending on unit type
Land lease
Deed restriction
Community Land Trust

SB Friedman Development Advisors
OverviewCase Study: Champlain Housing Trust
The Champlain Housing Trust provides affordable housing in three
counties in northwest Vermont through shared equity ownership,
housing cooperatives, and rental programs. It was founded with
financial support from the City of Burlington and continues to receive
financial and policy support from several public entities.
Year Founded: 1984
Geography: Chittenden, Grand Isle, and Franklin Counties, VT
Entity: Non-profit corporation
Type of Development: Homeownership, cooperative, rental
Governance: 15-member Board of Directors
Projects:
570 homes in shared equity portfolio
6 cooperatives with a total of 123 apartments/townhomes
2,250 rental units
Median sales price [1]: $120,000
[1] Median sales price as of 2008.
Community Land Trust
Champlain Housing Trust home in Fairfax, VT
Source: Champlain Housing Trust
49

SB Friedman Development Advisors
Sources for Funding Operations and Portfolio GrowthCase Study: Champlain Housing Trust
The Champlain Housing Trust has assembled and manages a portfolio of nearly 600 owner-occupied units through a
combination of grants, financing, and acquisition from local, state, and federal entities.
Evaluation metrics are based on case records for 410 units of resale-restricted, owner-occupied housing in CHT’s portfolio from 1984-2008.
Source: Lands in Trust, Homes that Last: A Performance Evaluation of the Champlain Housing Trust (2009)
Community Land Trust
Operations [1]
In 2017, grant revenues were approx. 16% of total revenue
($3.4 million)
Operational costs - approx. $16 million Operational
revenues - approx. $22 million
90 employees
[1] A majority of CHT’s operational costs and revenues correspond to property management and
rents received from rental properties.
Methods for Acquisition
Executes development projects
Acquisition of units from private developers through
inclusionary zoning
Partners with HUD to enable families to apply Section 8
vouchers towards mortgage payments and buy HUD’s
foreclosed house to rehab and sell
Sources of Funding
Start-up
City of Burlington - $20,000 seed grant
Operational Funding
Federal Community Development Block Grants (CDBG)
Low Income Housing Tax Credits (LIHTC)
Home Investment Partnership Program (HOME)
Federal Home Loan Bank
NeighborWorks America
State Vermont Housing and Conservation Trust Fund
Vermont Housing Financing Agency
50
SB Friedman Development Advisors
Retaining Subsidies to Expand HomeownershipCase Study: Champlain Housing Trust
Successful attraction of public subsidies and retention through resale restrictions have allowed CHT to provide affordable
housing options for lower-income households over time.
Retaining Subsidies to Serve Lower Income Households
Homebuyers who purchased a CHT home through an initial
sale earned an average of 69% of AMI
Resale controls remained in place for 97% of owner-
occupied housing developed by CHT
Homebuyers who purchased a CHT home through a resale
earned an average of 67% of AMI
Reducing Initial Sale Price
Publicly provided assistance and mandatory concessions from
private developers though the inclusionary zoning ordinance
allow CHT to reduce the initial purchase price of its homes by an
average of $14,300 per unit
Evaluation metrics are based on case records for 410 units of resale-restricted, owner-occupied housing in CHT’s portfolio from 1984-2008.
Source: Lands in Trust, Homes that Last: A Performance Evaluation of the Champlain Housing Trust (2009)
Community Land Trust
51

SB Friedman Development Advisors
Preserving Affordability with Resale Price RestrictionsCase Study: Champlain Housing Trust
Champlain Housing Trust’s resale restrictions have ensured that homeownership units were able to resist upward pressures on
sale prices throughout the Burlington/South Burlington MSA.
Median Price of Market-Rate Sales vs. Median Price of CHT Resales, 1998-2008
Source: Lands in Trust, Homes that Last: A Performance Evaluation of the Champlain Housing Trust (2009)
Resale Price Restrictions
CHT has the right of first refusal to re-purchase
owner-occupied housing
Homeowners receive 25% of their home’s
appreciation
Alternative to Sales Price Increases
During 1996-2006 real estate boom, the rate of
increase in sales price for CHT homes was 50%
less than for comparable market-rate homes
In 2008, the median resale price of a CHT home
was approx. $120,000 less than the median sales
price for comparable market-rate homes
Community Land Trust
52

SB Friedman Development Advisors
OverviewCase Study: Dudley Neighbors Incorporated
Dudley Neighbors Incorporated (DNI) was established as a CLT in
1988 as part of a larger community-led initiative to maintain control
and avoid displacement amid revitalization efforts in the Roxbury
neighborhood in Boston. DNI utilized the power of eminent domain
to acquire and assemble vacant lots for redevelopment.
Year Founded: 1988
Geography: Boston, MA
Governance: 11-member Board of Directors
Entity: Urban redevelopment corporation (121A under MA law)
Type of Development: Homeownership, cooperative, rental, open
space, commercial, urban agriculture
Projects:
Office space
Orchard and community garden
Playground
95+ homeownership units
75+ cooperative housing units
50+ rental units
Home sale price: $90,000-280,000
Community Land Trust
Dudley Greenhouse in Roxbury neighborhood in Boston, MA
Source: Dudley Neighbors Incorporated
53
SB Friedman Development Advisors
Acquisition of Vacant Lots to Provide Community ServicesCase Study: Dudley Neighbors Incorporated
As a 121A corporation approved by the Boston Redevelopment Authority, DNI is authorized to use eminent domain to acquire
vacant parcels. DNI has partnered with developers and non-profits to create and lease development on DNI land that provides an
array of community services and amenities, and will perpetually remain under community control.
Conversion to Productive Uses
Affordable Housing
Homeownership: 95+ units
Cooperative: 75+ units, 2 buildings
Rental: 50+ units, 2 buildings
Open Space
Park (2004)
Street garden (2005)
Orchard (2005)
Commercial
Commercial building (1994)
2 planned commercial buildings
Urban Agriculture
10,000 SF greenhouse (2005)
1.5-acre urban farm (2013)
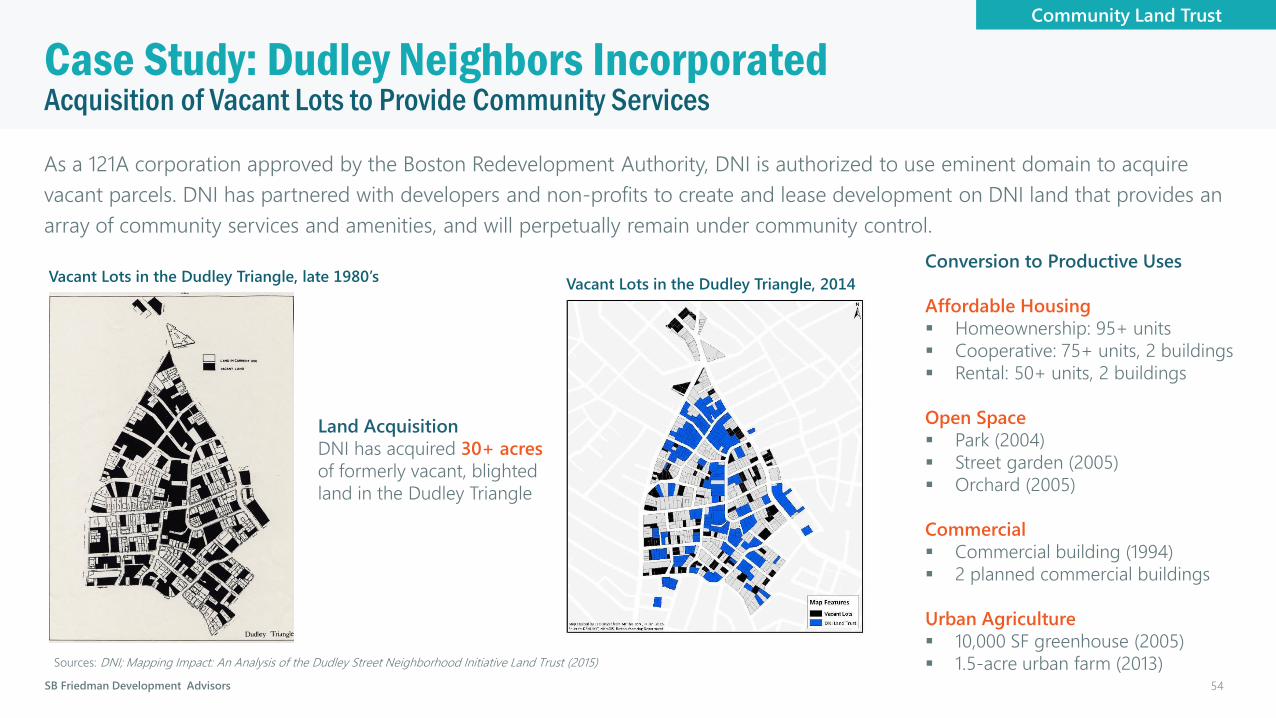
Land Acquisition
DNI has acquired 30+ acres
of formerly vacant, blighted
land in the Dudley Triangle
Vacant Lots in the Dudley Triangle, late 1980’sVacant Lots in the Dudley Triangle, 2014
Sources: DNI; Mapping Impact: An Analysis of the Dudley Street Neighborhood Initiative Land Trust (2015)
Community Land Trust
54

SB Friedman Development Advisors
Redevelopment Project DetailsCase Study: Dudley Neighbors Incorporated
Community Land Trust
Affordable Housing
Dudley Village North and South (2008)
50 rental units
5,000 SF
Development Cost: $17 million
Developer: Dorchester Bay EDC
Stafford Heights Cooperative (1998)
41 units
Developer: Nuestra Comunidad
Development Corporation
Brook Avenue Cooperative (1999)
36 units
Developer: Veteran Benefits
Clearinghouse Development Corporation
Open Space
Dennis/Huckins Street Garden (2005)
Development Cost: $150,000
Developer: Dudley Neighbors Inc.
Trina Persad Park (2002)
Development Cost: $100,000
Developer: Dudley Neighbors Inc.
Lewis Place Orchard (2005)
Development Cost: $150,000
Developer: Dudley Neighbors Inc.
Urban Agriculture
Dudley Greenhouse (2005)
10,000 SF greenhouse
Development Cost: $1.5 million
Developer: Mass Highway
Formerly abandoned automotive garage
Leased to the Food Project
West Cottage Farm (2013)
• 1.5-acre urban farm
• Acquired from the City of Boston
• Leased to The Food Project
55

SB Friedman Development Advisors
OverviewCase Study: Dos Pinos Housing Cooperative
Dos Pinos Housing Cooperative was constructed as part of an
agreement between the City of Davis and private developers in order
to satisfy lower income requirements for a larger proposed mixed-use
development. The cooperative is one of the longest operating LEHCs
without government subsidies in California.
Year Founded: 1985
Geography: 4 acres; Davis, CA
Governance: 7-member Board of Directors
Entity: Non-profit public benefit corporation
Type of Development: Cooperative
Projects: 60 cooperative units (1, 2, and 3 bedrooms)
Cost of member share [1]: $21,007-35,344
Monthly assessments [2]: $679-1,188
Turnover: about 2 units per year
[1] Maximum value of member shares as of January 2018. Maximum share values
vary according to unit sizes.
[2] Monthly assessments as of January 2018. Assessments vary according to unit
sizes. Assessments include mortgage payments, ground maintenance, and
payments to the management company.
Limited Equity Housing Cooperative
Dos Pinos Housing Cooperative in Davis, CA
Source: Dos Pinos Housing Cooperative
56
SB Friedman Development Advisors
Balancing Self-Financing Operations and Affordability Case Study: Dos Pinos Housing Cooperative
Because the development does not receive ongoing subsidies, Dos Pinos Housing Cooperative requires members to meet
minimum income eligibility requirements. Although the cooperative does not set maximum income limitations for its members,
it has historically served lower-income households.
Eligibility Requirements
There are no maximum income limits. Prospective
members must earn at least 2.5x the monthly
assessments, which is equivalent to an annual income of
$20,400-35,600.
Purchase of Share
Most residents purchase shares using personal savings or
proceeds from home sales. Some residents bought their
cooperative share through a matched savings program
with the Federal Home Loan Bank. Under that program
savings are matched 3:1 and 20% of the match is forgiven
annually for 5 years
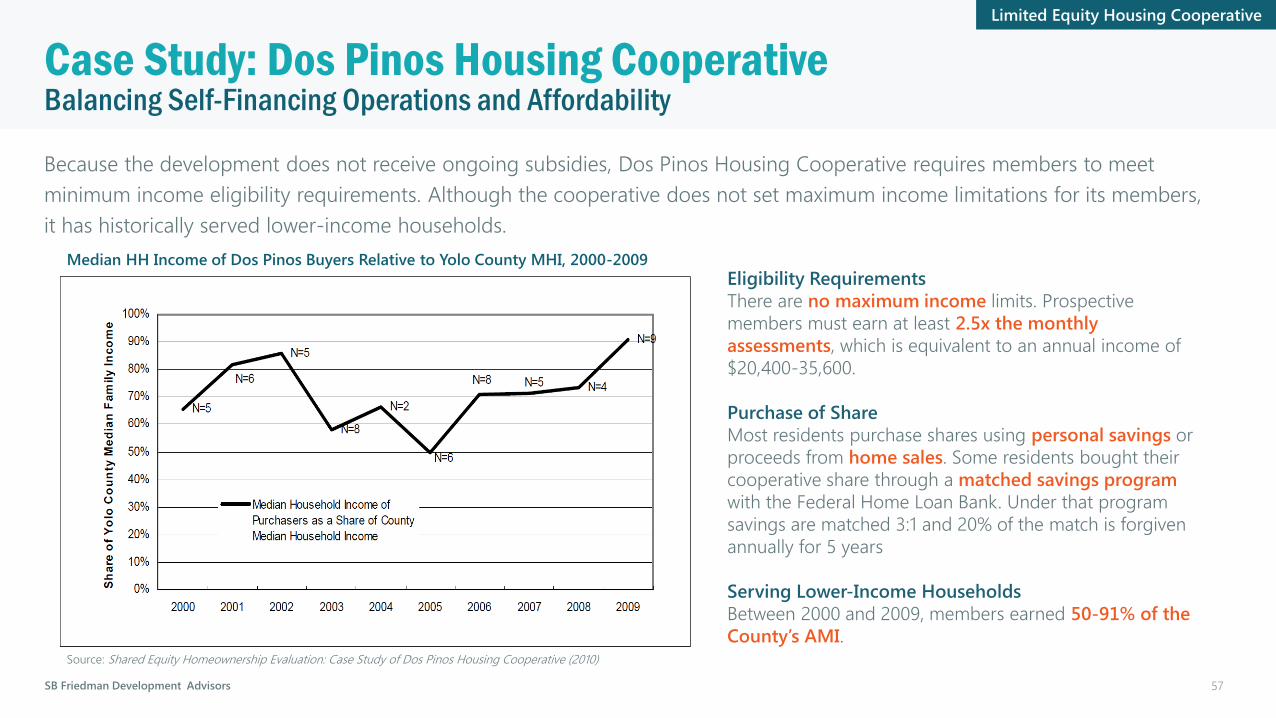
Serving Lower-Income Households
Between 2000 and 2009, members earned 50-91% of the
County’s AMI.
Median HH Income of Dos Pinos Buyers Relative to Yolo County MHI, 2000-2009
Source: Shared Equity Homeownership Evaluation: Case Study of Dos Pinos Housing Cooperative (2010)
Limited Equity Housing Cooperative
57

SB Friedman Development Advisors
Monthly Payments of Dos Pinos Buyers and Average Rents in City of Davis, 1985-2009
Source: Shared Equity Homeownership Evaluation: Case Study of Dos Pinos Housing Cooperative (2010)
Maintaining AffordabilityCase Study: Dos Pinos Housing Cooperative
To maintain the affordability of Dos Pinos, the cooperative adopted Articles and Bylaws that place restrictions on the resale of
member shares. The co-op has therefore been able to resisted upward pressures on rent.
Alternative to Rent Increases
In 2009, monthly charges for Dos Pinos units were
$360 less than comparable market-rate rents
Share Resale Restrictions
Dos Pinos has the right of first refusal to re-
purchase all shares when members seek to sell
Individual shares cannot sold for more than the unit’s
maximum transfer value (MTV) [1]
Annual increases in the share’s value are determined
by the prime interest rate, and cannot exceed 10%
[1] MTV is the sum of the value of the share at the time of
purchase, annual increases in the share’s value over the span of a
member’s residency, and the depreciated value of improvements.
Limited Equity Housing Cooperative
58
SB Friedman Development Advisors
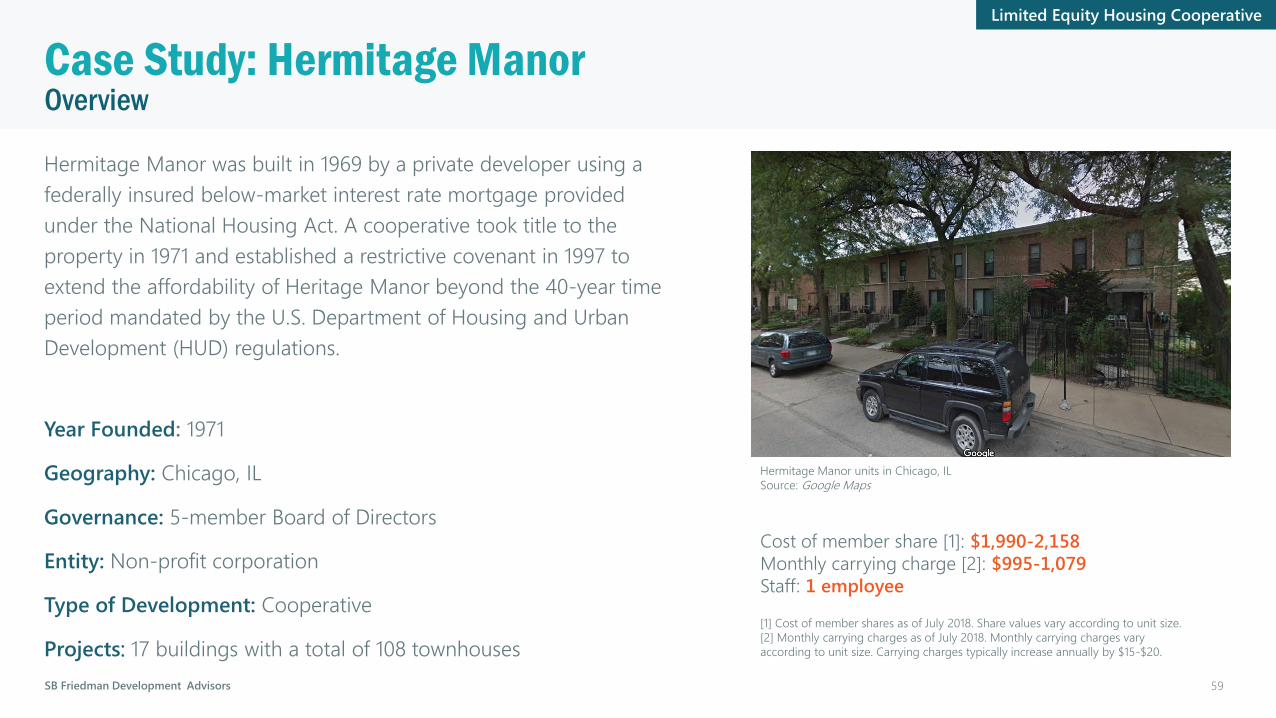
OverviewCase Study: Hermitage Manor
Hermitage Manor was built in 1969 by a private developer using a
federally insured below-market interest rate mortgage provided
under the National Housing Act. A cooperative took title to the
property in 1971 and established a restrictive covenant in 1997 to
extend the affordability of Heritage Manor beyond the 40-year time
period mandated by the U.S. Department of Housing and Urban
Development (HUD) regulations.
Year Founded: 1971
Geography: Chicago, IL
Governance: 5-member Board of Directors
Entity: Non-profit corporation
Type of Development: Cooperative
Projects: 17 buildings with a total of 108 townhouses
Cost of member share [1]: $1,990-2,158
Monthly carrying charge [2]: $995-1,079
Staff: 1 employee
[1] Cost of member shares as of July 2018. Share values vary according to unit size.
[2] Monthly carrying charges as of July 2018. Monthly carrying charges vary
according to unit size. Carrying charges typically increase annually by $15-$20.
Limited Equity Housing Cooperative
Hermitage Manor units in Chicago, IL
Source: Google Maps
59
SB Friedman Development Advisors
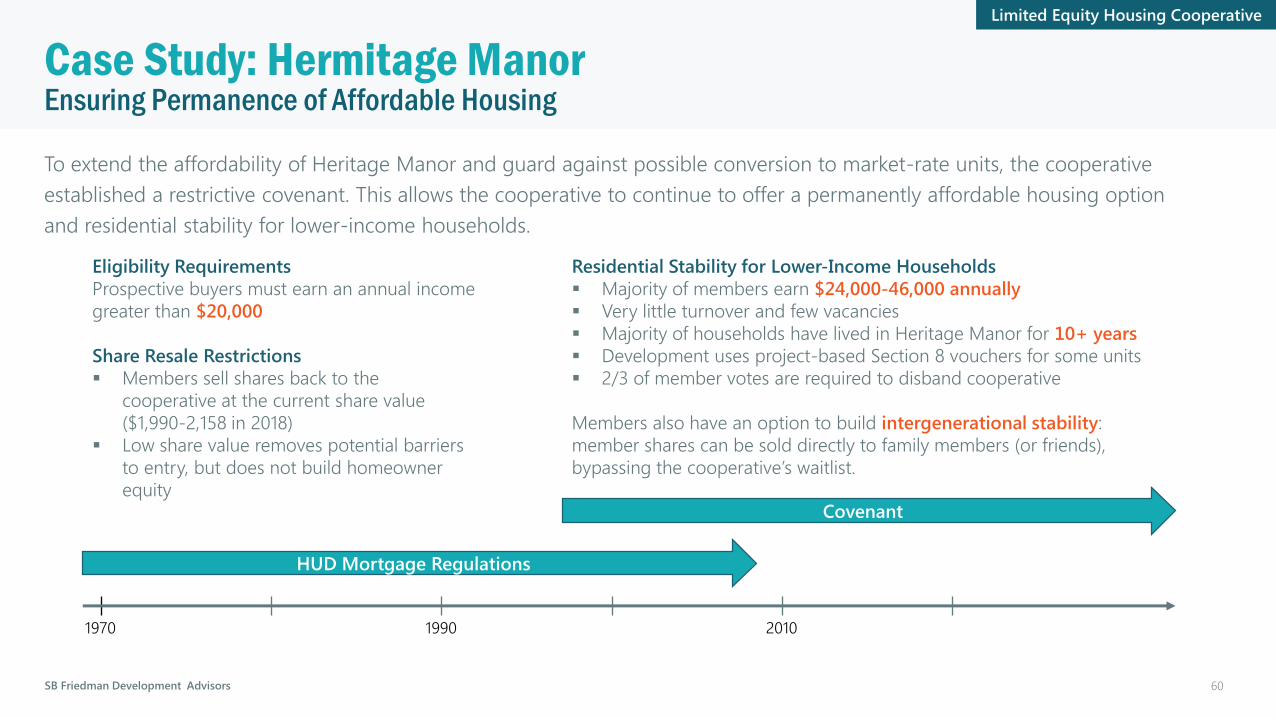
1970 1990 2010
Ensuring Permanence of Affordable HousingCase Study: Hermitage Manor
To extend the affordability of Heritage Manor and guard against possible conversion to market-rate units, the cooperative
established a restrictive covenant. This allows the cooperative to continue to offer a permanently affordable housing option
and residential stability for lower-income households.
Eligibility Requirements
Prospective buyers must earn an annual income
greater than $20,000
Share Resale Restrictions
Members sell shares back to the
cooperative at the current share value
($1,990-2,158 in 2018)
Low share value removes potential barriers
to entry, but does not build homeowner
equity
HUD Mortgage Regulations
Covenant
Residential Stability for Lower-Income Households
Majority of members earn $24,000-46,000 annually
Very little turnover and few vacancies
Majority of households have lived in Heritage Manor for 10+ years
Development uses project-based Section 8 vouchers for some units
2/3 of member votes are required to disband cooperative
Members also have an option to build intergenerational stability:
member shares can be sold directly to family members (or friends),
bypassing the cooperative’s waitlist.
Limited Equity Housing Cooperative
60

SB Friedman Development Advisors
OverviewCase Study: Beecher Cooperative
Beecher Cooperative was formed in 1977 when tenants of a 96-unit
complex organized to resist eviction by owners who wanted to
convert existing rental properties to condominiums. The cooperative
succeeded in buying 63 units through a limited partnership in 1979,
and utilized share loans to buy out the limited partnership in 1986,
thereby gaining complete ownership of those units.
Year Founded: 1979
Geography: Glover Park neighborhood, Washington DC
Governance: 7-member Board of Directors
Entity: Corporation
Type of Development: Cooperative
Projects: 6 buildings with a total of 63 apartments
Limited Equity Housing Cooperative
Beecher Cooperative units in Washington, DC
Source: Google Maps
61

SB Friedman Development Advisors
Piecewise Conversion to LEHCCase Study: Beecher Cooperative
With the support of district and city staff, the Beecher Cooperative bought 6 buildings through a limited partnership in 1979
and entered into a lease-to-purchase agreement. The Cooperative utilized individual share loans from the National
Cooperative Bank (NCB) to raise the $2.5 million needed to buy out the limited partnership and gain complete control over
the buildings.
1979: Cooperative Enters Limited Partnership
Residents paid $1,000 to buy a share in
cooperative. Cooperative negotiates 7-year
lease-to-purchase agreement totaling
$2.5 million.
1986: Cooperative Gains Full
Control
Cooperative members obtain
individual share loans ranging from
$27,900-$32,000 from NCB. Monthly
costs for servicing loans and carrying
charges total $575-$635.
1977: Tenants Form Association
Limited Equity Housing Cooperative
62

SB Friedman Development Advisors
Ensuring Permanence of Affordable HousingCase Study: Beecher Cooperative
To maintain the affordability of Beecher Cooperative, the cooperative adopted Articles and Bylaws that place restrictions on
the resale of member shares. A super-majority vote is required to remove these price limitations. This allows the cooperative
to continue to offer residential stability for lower-income households and even extend opportunities to households who
wouldn’t otherwise be able to afford residence at the cooperative.
Share Resale Restrictions
The resale price of individual shares
cannot exceed the rate of increase in
the Consumer Price Index (CPI).
Residential Stability for Lower-Income Households
Only 2-3 member shares are resold within a typical
year
6 units are occupied by original tenants from 1977
18 project-based Section 8 subsidies are
available for households earning less than 60% of
AMI
Limited Equity Housing Cooperative
63
SB Friedman Development Advisors
OverviewCase Study: Deed-Restricted Homes in Boulder, CO
In 2000, the City of Boulder adopted an inclusionary zoning
ordinance which mandated 20% of units in new constructed
residential projects be made and kept affordable. The City utilizes
deed restrictions to ensure owner-occupied housing created through
the City’s inclusionary housing program remains permanently
affordable to low-income families.
Year Founded: 2000
Geography: City of Boulder, CO
Governance: City of Boulder
Type of Development: Homeownership
Projects: 470+ units of owner-occupied housing (homes and
condominiums)
Portfolio size [1]: 470 units
Portfolio growth rate [2]: 50 units per year
[1] Portfolio size as of December 2005.
[2] Portfolio growth rate as of December 2005.
Deed-Restricted Housing
Permanently affordable home in Boulder, CO
Source: City of Boulder, Colorado
64

SB Friedman Development Advisors
Ensuring Permanent AffordabilityCase Study: Deed-Restricted Homes in Boulder, CO
Before 2000, housing units set aside to meet affordable housing regulations were only required to remain affordable for 5 or
10 years. After 2000, all owner-occupied housing created through the City’s inclusionary housing program have covenants
and deeds which permanently place resale restrictions on those properties.
Affordable Housing Regulation, 2000+
20% of units in any newly constructed residential project
of 5+ units must be made and kept permanently
affordable to households earning less than HUD’s low-
income limit for the Boulder MSA (<80% AMI or 100% of
national median income).
Every homeownership unit contains:
1) Permanently Affordable Housing Covenant
Gives City the right of first refusal
Restricts the resale price wherein appreciation is
the percent change in AMI or CPI, whichever is
less (both are capped at 3.5% a year)
2) Deed of Trust
Names City as mortgagee
Homeowners need City approval to transfer
their properties
Affordable Housing Regulations, 1973-2000
New residential development on land annexed
by the City was required to set aside a portion
of units as affordable:
15% of units would be made affordable
for moderate income households
Resale restrictions lasted 10 years
OR
7.5% of units would be made affordable
for low-income households. Resale
restrictions lasted 5 years
Maintaining Permanence
As of 2005, the City oversaw
470 units of permanently
affordable housing
No homeownership units have
converted to market-rate units
Deed-Restricted Housing
65
SB Friedman Development Advisors
OverviewCase Study: Cuyahoga Land Bank
The Cuyahoga Land Bank (CLB) was formed in 2009 following Ohio
state legislation which streamlined the acquisition of vacant or
abandoned property and authorized an increase in delinquent taxes
to serve as core operational funding for the land bank. The CLB is one
of the largest land banks in the country, in terms of annual revenues
and properties acquired and conveyed.
Year Founded: 2009
Geography: Cuyahoga County, OH
Governance: 9-member Board of Directors
Entity: Non-profit, quasi-governmental corporation
Projects: Land acquisition and transfer, demolition, home renovation
Portfolio size [1]: 3,800+ properties
Portfolio growth rate [2]: 1,200 properties per year
[1] Portfolio size as of July 2018.
[2] Portfolio growth rate as of 2013.
Community Land Bank
Cuyahoga Land Bank property in Cleveland, OH
Source: Cuyahoga Land Bank
66
SB Friedman Development Advisors
Strategic Land Acquisition and DeploymentCase Study: Cuyahoga Land Bank
The Cuyahoga Land Bank acquires a majority of properties through the tax foreclosure process, and has also pioneered direct
property transfers of foreclosed properties from federal mortgage entities and private national mortgage lenders. The CLB
utilizes several programs to return these properties to productive use.
Sources of Land Acquisition
CLB primarily obtains vacant and abandoned tax foreclosed
properties, typically for $1
Innovative partnerships with banks and HUD allow CLB
obtain homes at a low cost:
Per a 2009 agreement, CLB can buy foreclosed
homes from Fannie Mae for $1 and receive $3,500
towards the cost of demolition
Following a 2011 agreement, CLB received low-asset
homes as donations from Wells Fargo and Bank of
America, and received $3,500-7,500 towards
demolition
Following a 2010 agreement, CLB can purchase
qualifying low-value HUD homes for $100 per home
or at a discount of 30-50%
Land Acquisition and Transfer
CLB acquires about 100 properties a month
Following assessment, properties are dedicated towards
certain uses or programs:
Demolition
Renovation
Vacant lot reuse
Purchase of homes by owner-occupiers
BRAIN – provides homeownership
opportunities to recent college graduates
Side Yard Program – allows adjacent homeowners to
purchase property for nominal cost
Community Land Bank
67

SB Friedman Development Advisors
Funding Sources and OperationsCase Study: Cuyahoga Land Bank
The Cuyahoga Land Bank is funded by a variety of sources, with primary funding coming from penalties and interest on
delinquent real estate taxes and assessments in Cuyahoga County. Thus, no additional tax levies are directly levied to fund the
CLB’s operations.
Sources of Funding
Portion of penalties and interest that accrue on
delinquent real estate taxes and assessments in
Cuyahoga County ($7-$8 million annually)
Grants from Cuyahoga Land Bank partners
Sales of acquired properties
Community Land Bank
Operations
2016 revenues were approx. $21 million
2016 costs were approx. $4.8 million
68

SB Friedman Development Advisors
OverviewCase Study: Fulton County/City of Atlanta Land Bank Authority
The Fulton County/City of Atlanta Land Bank was created in 1990
following the passage of state-enabling legislation. It was restructured
in 2012 following the passage of the Georgia Land Bank Act, which
increased opportunities for regional collaboration and authorized a
self-financing tax mechanism for Georgia land banks. The Atlanta
Land Bank is utilizing the tax recapture mechanism for the first time
this year, but it anticipates it will be a limited revenue source.
Year Founded: 1990
Geography: Fulton County, GA
Governance: 6-member Board of Directors
Entity: Non-profit corporation
Projects: Land acquisition and transfer
Portfolio size: 119 properties
Community Land Bank
Former Fulton County/City of Atlanta home in Atlanta, GA
Source: Sustainable Neighborhood Development Strategies (SNDSI)
69

SB Friedman Development Advisors
Limited Impact of New Financing MechanismCase Study: Fulton County/City of Atlanta Land Bank Authority
Most noticeably, the 2012 Georgia Land Bank Act authorized a self-financing mechanism for Georgia land banks: an optional
5 year/75% tax recapture program. This mechanism could potentially allow land banks in Georgia to self-finance at no cost to
local governmental budget. However, due to its limited inventory size and the nature of its portfolio, the Atlanta Land Bank
expects the tax recapture tool will only generate minimal revenue in the near term.
Sources of Funding
City of Atlanta General Fund
Fulton County General Fund
Community Development Block Grants (CDBG)
Proceeds from land sales
Philanthropic funds
5 year/75% tax recapture program, wherein 75% of
newly generated tax revenue on properties disposed by
the land bank are returned to the land bank for 5 years [1]
[1] The tax recapture program is not expected to a significant source of funding.
This is because the Atlanta Land Bank does not have a large portfolio and it does
not dispose a high proportion of land to high tax-generating uses, such as high-
density residential or commercial.
Community Land Bank
Operations
Annual costs are approx. $650,000
Annual revenues are approx. $800,000 [2]
6 employees
[2] The primary sources of annual operating revenue are General Fund
allocations from the City of Atlanta and Fulton County.
Methods for Acquisition and Disposition
Primarily obtains properties through market purchases
and donations
Does not receive properties through the tax foreclosure
process
Transfers land to land trusts, CDCs, non-profit
organizations, for-profit developers
Does not transfer land directly to homeowners
70

SB Friedman Development Advisors
OverviewCase Study: Genesee County Land Bank
The Genesee County Land Bank (GCLB) was created in 2004 following
the passage of Michigan land banking legislation. GCLB serves
communities with substantial population loss and insolvent
government entities, and has amassed a large inventory of vacant,
abandoned, and tax-foreclosed properties.
Year Founded: 2004
Geography: Genesee County, MI
Governance: 7-member Board of Directors
Entity: Corporation
Projects: Land acquisition and transfer, demolition, home renovation,
brownfield clean-up
Portfolio size [1]: 12,900 properties
Acquisition rate [2]: 1,200 per year
[1] Portfolio size as of September 2017.
[2] Acquisition rate as of 2016.
Community Land Bank
Genesee County Land Bank home in Flint, MI
Source: Genesee County Land Bank
71
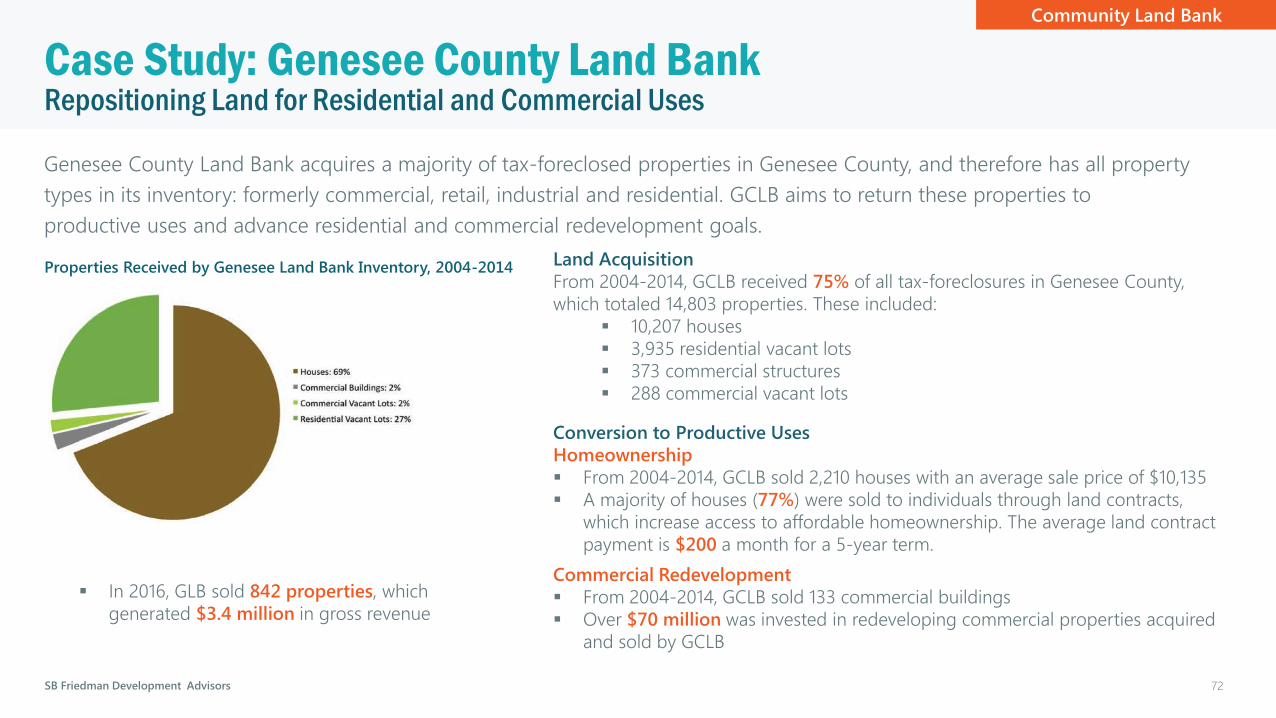
SB Friedman Development Advisors
Repositioning Land for Residential and Commercial UsesCase Study: Genesee County Land Bank
Genesee County Land Bank acquires a majority of tax-foreclosed properties in Genesee County, and therefore has all property
types in its inventory: formerly commercial, retail, industrial and residential. GCLB aims to return these properties to
productive uses and advance residential and commercial redevelopment goals.
Land Acquisition
From 2004-2014, GCLB received 75% of all tax-foreclosures in Genesee County,
which totaled 14,803 properties. These included:
10,207 houses
3,935 residential vacant lots
373 commercial structures
288 commercial vacant lots
Properties Received by Genesee Land Bank Inventory, 2004-2014
Conversion to Productive Uses
Homeownership
From 2004-2014, GCLB sold 2,210 houses with an average sale price of $10,135
A majority of houses (77%) were sold to individuals through land contracts,
which increase access to affordable homeownership. The average land contract
payment is $200 a month for a 5-year term.
Commercial Redevelopment
From 2004-2014, GCLB sold 133 commercial buildings
Over $70 million was invested in redeveloping commercial properties acquired
and sold by GCLB
In 2016, GLB sold 842 properties, which
generated $3.4 million in gross revenue
Community Land Bank
72

SB Friedman Development Advisors
Repositioning Land for Residential and Commercial UsesCase Study: Genesee County Land Bank
Genesee County Land Bank prioritizes responsible ownership of vacant and improved properties in its disposition strategy.
Priority Transferees for Disposition
Vacant Land
Adjacent homeowners
Non-occupant landowners
Non-profits and community based organizations
Improved Land
Owner-occupants
Proximate buyers (to avoid speculation)
Buyers with plans consistent with community plans
Buyers who can pay competitive sales price
Community Land Bank
Promoting Stable Homeownership
Requires buyers to participate in homebuyer education
programs
Connects cost-burdened residents [1] and those facing
medical or health hardships to social services
Uses land contracts to sell homes back to former owners who
foreclosed
[1] Residents are considered to be cost burdened if housing costs exceed
30% of their income.
Operations
$5 million operating budget
30 full time employees
50 seasonal employees – property maintenance
[1] Residents are considered to be cost burdened if housing costs exceed
30% of their income.
73

SB Friedman Development Advisors
OverviewCase Study: IZ in Montgomery County, MD
Montgomery County first adopted an inclusionary zoning ordinance
in 1974. The program has since undergone multiple revisions, but has
always been mandatory and applicable to all residential development
above a certain threshold. Montgomery County currently requires
12.5-15% of units in qualifying developments to be affordable to low-
income households.
Year Founded: 1974
Geography: Montgomery County, MD
Governance:
Department of Housing and Community Affairs – administration and staff
Type of Development: Homeownership, rental
Projects: 13,000+ housing units
Total units produced [1]: 13,000+
Income affordability [2]: 54-106% of AMI
[1] Total units produced by program from 1976-2011.
[2] Income limits for affordability vary by household size and tenure.
Inclusionary Zoning
Moderately Priced Dwelling Unit (MPDU) in Clarksburg, MD
Source: Montgomery County
74

SB Friedman Development Advisors
Utilizing Price-Control Periods to Preserve Affordable HousingCase Study: IZ in Montgomery County, MD
Efforts to Maintain Permanence
From 1976-2011, the program
produced 13,000+ affordable
housing units
~9,300 for-sale units
~4,000 rental units
By 2011, less than one-fifth of
MPDUs (~2,300) remained under
price controls
Montgomery County’s inclusionary zoning (IZ) program, the Moderately Priced Dwelling Unit (MPDU) program, has produced
more 13,000 affordable housing units. Most recently, the MPDU program underwent an amendment in 2005 that extended
price-control periods with the goal of preserving the County’s supply of affordable housing units.
MPDU Program, After 2005 amendment
12.5-15% of units in new residential projects of
20+ units must be affordable [1]
Developers are granted density bonuses if
development has set-aside percentage greater
than minimum requirements (max. density bonus
is 22%)
Price-control periods are 99 years for rental units
and 30 years for homeownership units, and renew
if the unit is sold during the price-control period
40% of MPDU’s must be offered for sale to the
Housing Opportunities Commission or other non-
profit housing agencies to sell or lease to low-
income households
[1] Income limits for affordability vary by household size and
tenure. Maximum incomes range from 60-106% of AMI and
54%-106% of AMI for for-sale and rental MPDUs, respectively.
MPDU Program, 1974
15% of units in new developments of
50+ units must be affordable to
households that earn less than 70% of
AMI for a 5-year period
The Housing Opportunities
Commission, the County’s housing
authority, could purchase or lease up to
33% of available MPDUs
The first MPDUs came on the market in
1976
Inclusionary Zoning
75
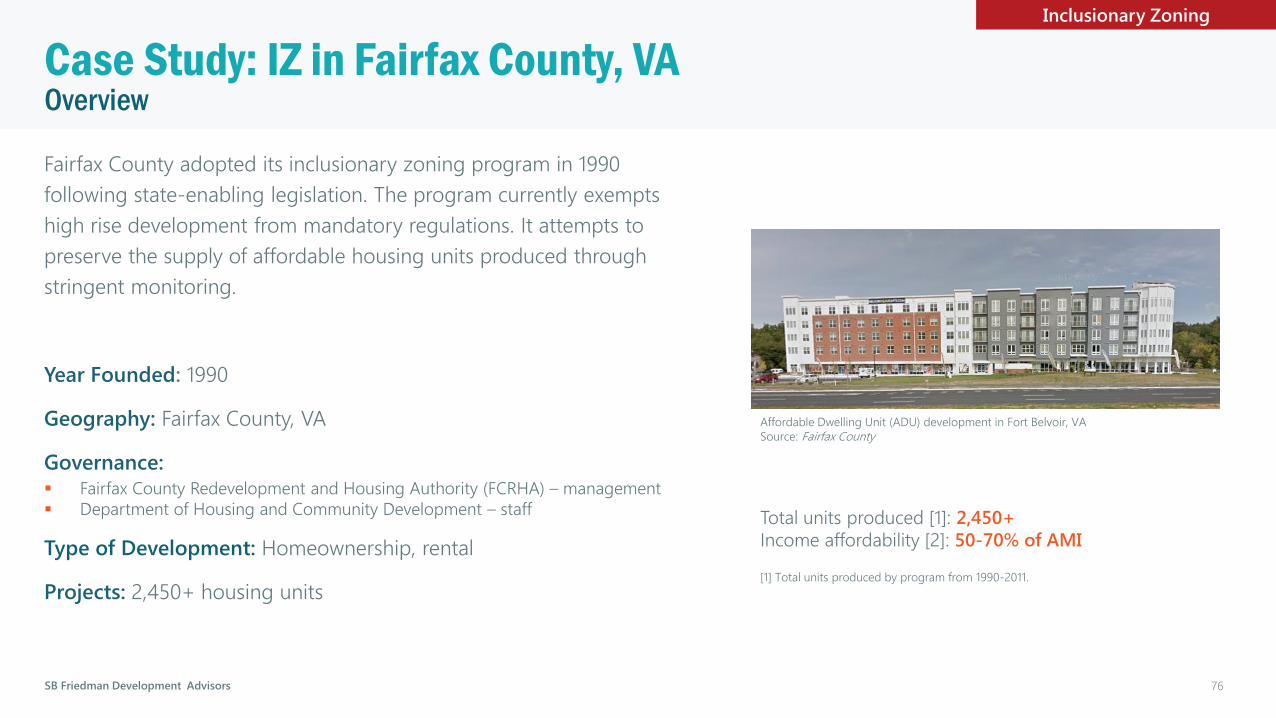
SB Friedman Development Advisors
OverviewCase Study: IZ in Fairfax County, VA
Fairfax County adopted its inclusionary zoning program in 1990
following state-enabling legislation. The program currently exempts
high rise development from mandatory regulations. It attempts to
preserve the supply of affordable housing units produced through
stringent monitoring.
Year Founded: 1990
Geography: Fairfax County, VA
Governance: Fairfax County Redevelopment and Housing Authority (FCRHA) – management
Department of Housing and Community Development – staff
Type of Development: Homeownership, rental
Projects: 2,450+ housing units
Inclusionary Zoning
Total units produced [1]: 2,450+
Income affordability [2]: 50-70% of AMI
[1] Total units produced by program from 1990-2011.
Affordable Dwelling Unit (ADU) development in Fort Belvoir, VA
Source: Fairfax County
76
SB Friedman Development Advisors
Case Study: IZ in Fairfax County, VA
Efforts to Maintain Permanence
From 1990-2011, the program has
produced ~2,450 ADUs:
~1,300 for-sale units
~1,100 rental units
Due to monitoring, ADUs are rarely lost
before the end of the affordability period
Most losses of ADUs before the end of
their affordability period were due to
foreclosures
Fairfax County’s inclusionary zoning (IZ) program, the Affordable Dwelling Unit (ADU) program has produced more than 2,400
affordable housing units. The ADU program employs control periods and a stringent monitoring process with the goal of
preserving the County’s supply of affordable housing units.
ADU Program, After 2005 Amendment
5-12.5% of units in new residential
projects of 50+ units [1] must be
affordable to households that earn
50-70% of AMI
Developers under ADU program are
granted automatic density bonuses
Both for-sale and rental units are
required to remain affordable for
30 years [2]
[1] Program is voluntary, not mandatory for buildings with
more than four floors and an elevator.
[2] When a for-sale unit is resold before the end of its
initial 30-year affordability term, the price-control period is
reset to 30 years from the date of the transaction. Price-
control periods cannot be extended for rental ADUs.
Monitoring
Rental ADUs
Owners of developments with rental ADUs are
required to submit monthly reports on the
status of affordable units and compliance with
income requirements
For-sale ADUs
County staff conduct annual compliance
checks to ensure compliance with residency
requirements
Violations
Violations of the ADU program are
considered zoning ordinance violations
No penalties have been imposed for
violations, as compliance is preferred over
imposing fines
Utilizing Price-Control Periods and Monitoring to Preserve Affordable Housing
Inclusionary Zoning
77

SB Friedman Development Advisors
OverviewCase Study: Our Katahdin Investments
Impact Investing
Our Katahdin Investments, a non-profit corporation founded in 2015, allows the public to invest in revitalization and
development in the Katahdin region of Maine. The corporation operates a Property Fund, which is used for two purposes:
(1) acquisition and redevelopment of real estate, and (2) lending to developers and business owners. Our Katahdin conducted a
direct public offering (DPO) in March of 2016, wherein eligible residents had the opportunity to purchase Katahdin Corridor
Revitalization Notes that provide capital for the Property Fund.
Year Founded: 2015
Geography: Katahdin region, ME
Governance: Our Katahdin [1]
Entity: non-profit corporation
Type of Activity: land acquisition, redevelopment, loan fund
Projects:
Millinocket Mill Site – 1,400 acre former paper mill
230 Penobscot Avenue – commercial building
[1] Our Katahdin is a non-profit organization whose mission is to promote community and economic development in the Katahdin region in Maine.
78
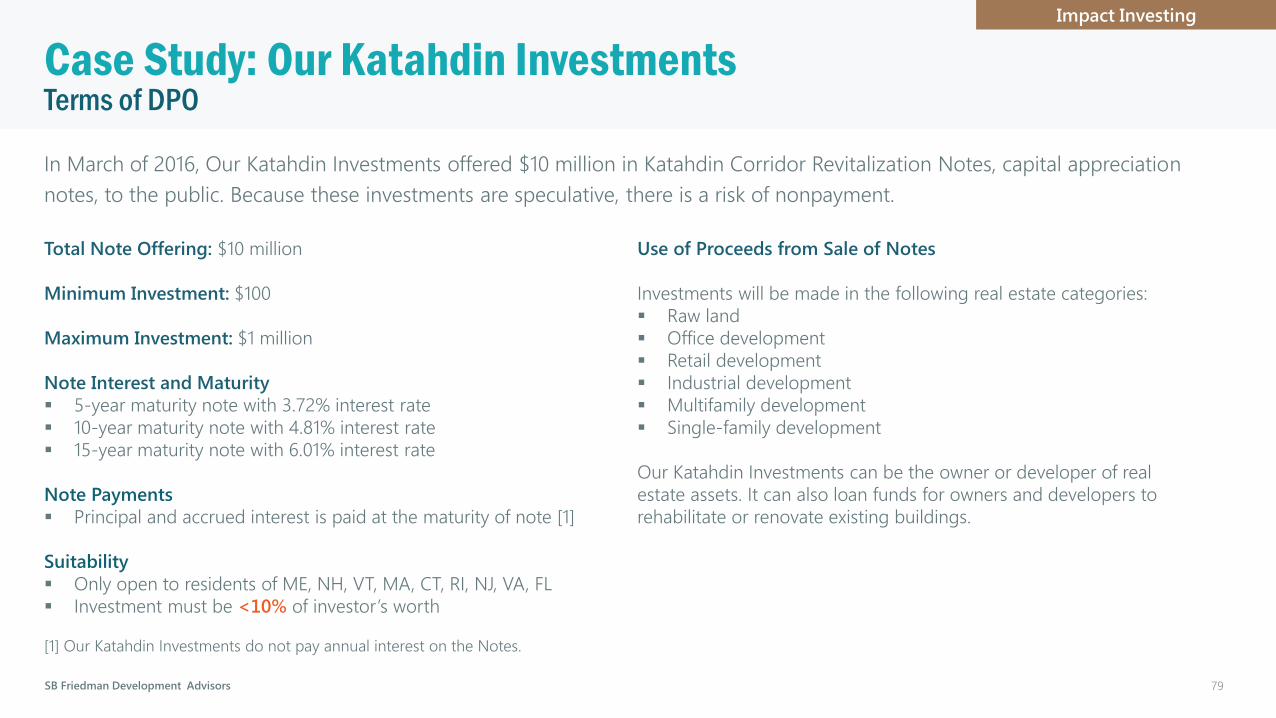
SB Friedman Development Advisors
Terms of DPOCase Study: Our Katahdin Investments
Impact Investing
In March of 2016, Our Katahdin Investments offered $10 million in Katahdin Corridor Revitalization Notes, capital appreciation
notes, to the public. Because these investments are speculative, there is a risk of nonpayment.
Total Note Offering: $10 million
Minimum Investment: $100
Maximum Investment: $1 million
Note Interest and Maturity
5-year maturity note with 3.72% interest rate
10-year maturity note with 4.81% interest rate
15-year maturity note with 6.01% interest rate
Note Payments
Principal and accrued interest is paid at the maturity of note [1]
Suitability
Only open to residents of ME, NH, VT, MA, CT, RI, NJ, VA, FL
Investment must be <10% of investor’s worth
[1] Our Katahdin Investments do not pay annual interest on the Notes.
Use of Proceeds from Sale of Notes
Investments will be made in the following real estate categories:
Raw land
Office development
Retail development
Industrial development
Multifamily development
Single-family development
Our Katahdin Investments can be the owner or developer of real
estate assets. It can also loan funds for owners and developers to
rehabilitate or renovate existing buildings.
79
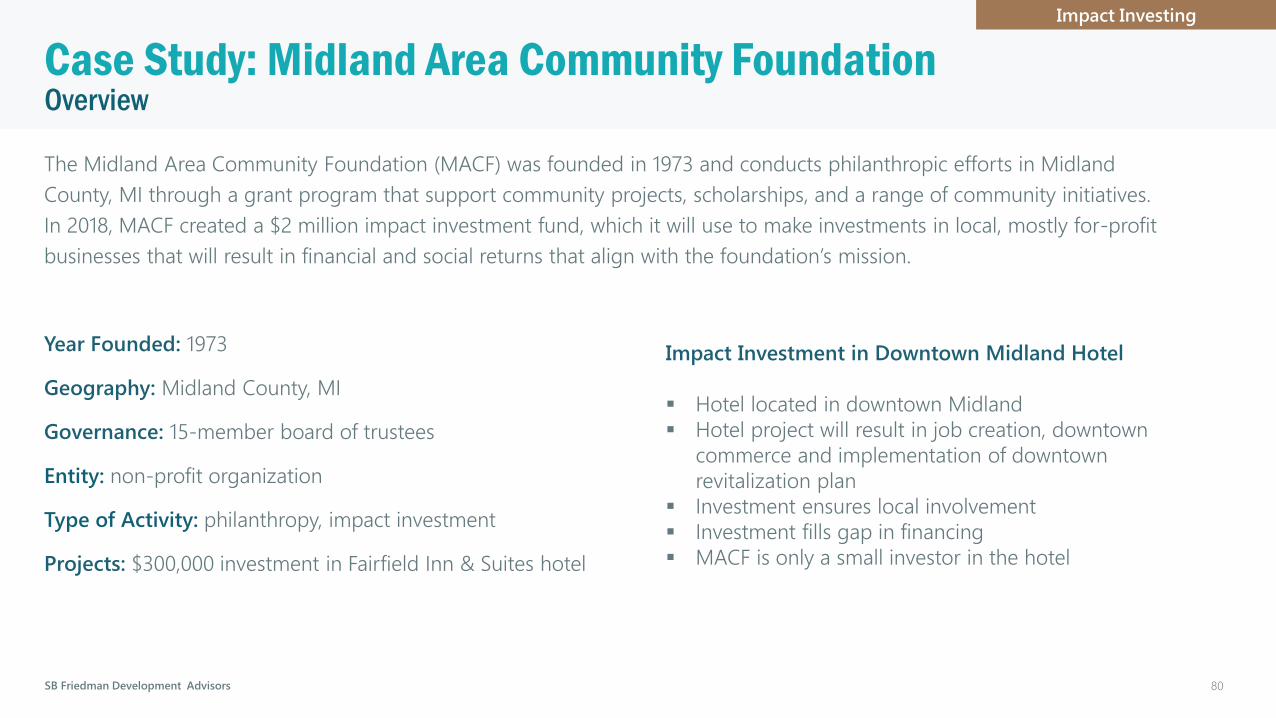
SB Friedman Development Advisors
OverviewCase Study: Midland Area Community Foundation
Impact Investing
The Midland Area Community Foundation (MACF) was founded in 1973 and conducts philanthropic efforts in Midland
County, MI through a grant program that support community projects, scholarships, and a range of community initiatives.
In 2018, MACF created a $2 million impact investment fund, which it will use to make investments in local, mostly for-profit
businesses that will result in financial and social returns that align with the foundation’s mission.
Year Founded: 1973
Geography: Midland County, MI
Governance: 15-member board of trustees
Entity: non-profit organization
Type of Activity: philanthropy, impact investment
Projects: $300,000 investment in Fairfield Inn & Suites hotel
Impact Investment in Downtown Midland Hotel
Hotel located in downtown Midland
Hotel project will result in job creation, downtown
commerce and implementation of downtown
revitalization plan
Investment ensures local involvement
Investment fills gap in financing
MACF is only a small investor in the hotel
80

SB Friedman Development Advisors
OverviewCase Study: Tenant Opportunity to Purchase Act (TOPA)
Tenant Right of First Refusal
Washington D.C.’s Tenant Opportunity to Purchase (TOPA) was adopted in 1980, and granted tenants the opportunity to
purchase their building if the owner intends to discontinue rental housing. The Department of Housing and Community
Development (DHCD) offers two programs that assist low-to-moderate income residents who may be displaced due to the
sale of their building:
1) First Right Purchase Assistance, and
2) Tenant Purchase Technical Assistance.
Year Adopted: 1980
Geography: Washington, D.C.
Governance: Washington DC Department of Housing and Community Development
Type of Activity: loans to purchase, technical assistance
Rental unit preservation [1]: 1,400 units
[1] Units preserved as of 2013.
81

SB Friedman Development Advisors
OverviewCase Study: Tenant Opportunity to Purchase Act (TOPA)
Tenant Right of First Refusal
When asserting their TOPA rights, tenants follow a general process and timeline that differs according to the number of units
in their building. THE DHCD encourages District residents to exercise their right to purchase through two programs.
Process of Asserting TOPA Rights
1) Landlord makes an offer of sale to the tenant
2) Tenant may request information from the landlord
3) Incorporation of tenant organization (if applicable) [1]
4) Tenant(s) or tenant organization submits statement of interest
5) Tenant(s) or tenant organization negotiates with landlord [3]
6) Tenant(s) or tenant organization and landlord reach settlement [4]
7) Start-over period [5]
[1] Tenants must form and incorporate a tenant organization to exercise the right to
purchase an accommodation with 5+ units.
[2] Submission must occur a given number of days after offer of sale.
[3] Law allows a minimum negotiation period after the landlord receives the tenant’s
statement of interest. Tenants have the right to match a third-party contract. Tenants
can also assign their rights to other groups.
[4] Tenants have at least a given number of days from the date of contracting to
secure financing and financial assistance.
[5] If the landlord has not entered into a sales contract within a given number of days
after the offer of sale, the TOPA process must start over with a new offer of sale.
First Right Purchase Assistance
Offers low-interest loans to persons and tenants groups
Loans can be used for down payments, purchases, and soft costs
Applicants must meet income limits and head a low- to
moderate-households
Tenant Purchase Technical Assistance
Provides free, specialized development services to tenant groups
pursuing building purchase as cooperatives or condominiums
Services include assistance with group organization and structure,
preparation of legal documents, and loan application assistance
Tenant associations can apply if 50% + of tenant are interesting in
purchasing a unit and 50%+ of association qualify as low- to
moderate-income households
82

221 N. LaSalle St, Suite 820
Chicago, IL 60601
312-424-4250 | sbfriedman.com
VISION | ECONOM ICS
MARKET AN ALYSIS AND REAL ES TATE ECONOMICS
S T RAT EGY
DEVELOPMENT S TRATEGY AND PLANNING
FIN ANCE | IMPLEMENTATION
PUBLIC-PRIVATE PARTNERSHIPS AND IMPLEMENTATION