Electrospinning preparation and luminescence properties of one-dimensional SrWO4: Sm3+ nanofibers
8
Electrospinning preparation and luminescence properties of one-dimensional SrWO 4 : Sm 3+ nanofibers Xuetao Xu • Suqing Zhao • Kanyi Liang • Jiaying Zeng Received: 21 April 2014 / Accepted: 16 May 2014 Ó Springer Science+Business Media New York 2014 Abstract One-dimensional Sm 3? doped SrWO 4 with or without different charge compensation approaches (co- doping Li ? , Na ? and K ? ) nanofibers were prepared by electrospinning. The structure, morphology and lumines- cence properties of the obtained nanofiber phosphors were investigated. The X-ray diffraction, Fourier transformation infrared and thermogravimetric results show that the Sr (1-x) WO 4 : Sm x 3? samples crystallize at 700 °C. Scanning electron microscope results indicate that as prepared nanofibers before/after calcination present uniform fiber- like morphology. The luminescence results show that Sr (1-x) WO 4 : Sm x 3? phosphors can be excited efficiently by ultraviolet (UV) and near-UV light. The emission spectrum consists of three emission peaks at 561, 596 and 643 nm, corresponding to 4 G 5/2 ? 6 H 5/2 , 4 G 5/2 ? 6 H 7/2 and 4 G 5/2 ? 6 H 9/2 transitions of Sm 3? , respectively. The optimal doping concentration of Sm 3? in SrWO 4 is experimentally ascertained to be 4 mol%. The introduction of charge compensator R ? (R = Li, Na and K) can enhance the emission intensity of phosphors significantly. The co-dop- ing of Li ? has the best compensation effect. The present investigation indicates that Sm 3? doped SrWO 4 is a promising orange phosphor for light-emitting diode based on UV chip technology. 1 Introduction One dimensional (1D) nanomaterials (nanofibers, nano- wires, nanorods, nanotubes, etc.), due to their transverse nanoscale and large length to diameter ratio, are endowed with unique optical, electrical, mechanical and magnetic properties [1]. Many methods have been used to prepare 1D nanostructured materials, including chemical or phys- ical vapor deposition, laser ablation, solution, template- based method and electrospinning method [2]. In these methods, electrospinning method is an effective and simple technique [3–6]. 1D materials prepared by electrospinning have many excellent properties, such as exceptionally long length, uniform diameter, diverse composition and large surface, which can be applied in biomedical fields, rein- forced composites, catalyst supports, sensors, electronic and optical devices, as well as sacrificial templates [7–10]. As far, many 1D luminescent materials are synthesized by electrospinning, such as SrAl 2 O 4 : (Eu 2? , Dy 3? ), CaWO 4 : Tb 3? , SrMoO 4 : Sm 3? ,Y 3 Al 5 O 12 : Ce 3? , YBO 3 : Eu 3? , etc., [1, 2, 11–14]. All reported 1D nanomaterial phosphors prepared by electrospinning have high uniformity nano- particles within single nanofibers. As a kind of scheelite structure, the alkaline-earth metal tungstates MWO 4 (M = Ca 2? , Sr 2? , Ba 2? ) have been investigated extensively as a self-activating phosphor emitting blue or green light under ultraviolet (UV) or X-ray excitation [15–17]. At present, MWO 4 were reported to be efficient luminescent hosts for rare earth ions [12, 18–23]. SrWO 4 is an important optical material used in Raman converters which has an intrinsic strong blue emission X. Xu (&) S. Zhao Faculty of Chemical Engineering and Light Industry, Guangdong University of Technology, Guangzhou 511458, People’s Republic of China e-mail: [email protected] K. Liang Faculte ´ des Sciences et Techniques, Universite ´ du Maine Avenue Olivier Messiaen, 972085 Le Mans Cedex, France J. Zeng School of Materials Science and Engineering, South China University of Technology, Guangzhou 510000, People’s Republic of China 123 J Mater Sci: Mater Electron DOI 10.1007/s10854-014-2021-0
Transcript of Electrospinning preparation and luminescence properties of one-dimensional SrWO4: Sm3+ nanofibers

Electrospinning preparation and luminescence propertiesof one-dimensional SrWO4: Sm3+ nanofibers
Xuetao Xu • Suqing Zhao • Kanyi Liang •
Jiaying Zeng
Received: 21 April 2014 / Accepted: 16 May 2014
� Springer Science+Business Media New York 2014
Abstract One-dimensional Sm3? doped SrWO4 with or
without different charge compensation approaches (co-
doping Li?, Na? and K?) nanofibers were prepared by
electrospinning. The structure, morphology and lumines-
cence properties of the obtained nanofiber phosphors were
investigated. The X-ray diffraction, Fourier transformation
infrared and thermogravimetric results show that the
Sr(1-x)WO4: Smx3? samples crystallize at 700 �C. Scanning
electron microscope results indicate that as prepared
nanofibers before/after calcination present uniform fiber-
like morphology. The luminescence results show that
Sr(1-x)WO4: Smx3? phosphors can be excited efficiently by
ultraviolet (UV) and near-UV light. The emission spectrum
consists of three emission peaks at 561, 596 and 643 nm,
corresponding to 4G5/2 ? 6H5/2, 4G5/2 ? 6H7/2 and 4G5/2
? 6H9/2 transitions of Sm3?, respectively. The optimal
doping concentration of Sm3? in SrWO4 is experimentally
ascertained to be 4 mol%. The introduction of charge
compensator R? (R = Li, Na and K) can enhance the
emission intensity of phosphors significantly. The co-dop-
ing of Li? has the best compensation effect. The present
investigation indicates that Sm3? doped SrWO4 is a
promising orange phosphor for light-emitting diode based
on UV chip technology.
1 Introduction
One dimensional (1D) nanomaterials (nanofibers, nano-
wires, nanorods, nanotubes, etc.), due to their transverse
nanoscale and large length to diameter ratio, are endowed
with unique optical, electrical, mechanical and magnetic
properties [1]. Many methods have been used to prepare
1D nanostructured materials, including chemical or phys-
ical vapor deposition, laser ablation, solution, template-
based method and electrospinning method [2]. In these
methods, electrospinning method is an effective and simple
technique [3–6]. 1D materials prepared by electrospinning
have many excellent properties, such as exceptionally long
length, uniform diameter, diverse composition and large
surface, which can be applied in biomedical fields, rein-
forced composites, catalyst supports, sensors, electronic
and optical devices, as well as sacrificial templates [7–10].
As far, many 1D luminescent materials are synthesized by
electrospinning, such as SrAl2O4: (Eu2?, Dy3?), CaWO4:
Tb3?, SrMoO4: Sm3?, Y3Al5O12: Ce3?, YBO3: Eu3?, etc.,
[1, 2, 11–14]. All reported 1D nanomaterial phosphors
prepared by electrospinning have high uniformity nano-
particles within single nanofibers.
As a kind of scheelite structure, the alkaline-earth metal
tungstates MWO4 (M = Ca2?, Sr2?, Ba2?) have been
investigated extensively as a self-activating phosphor
emitting blue or green light under ultraviolet (UV) or X-ray
excitation [15–17]. At present, MWO4 were reported to be
efficient luminescent hosts for rare earth ions [12, 18–23].
SrWO4 is an important optical material used in Raman
converters which has an intrinsic strong blue emission
X. Xu (&) � S. Zhao
Faculty of Chemical Engineering and Light Industry,
Guangdong University of Technology, Guangzhou 511458,
People’s Republic of China
e-mail: [email protected]
K. Liang
Faculte des Sciences et Techniques, Universite du Maine
Avenue Olivier Messiaen, 972085 Le Mans Cedex, France
J. Zeng
School of Materials Science and Engineering, South China
University of Technology, Guangzhou 510000,
People’s Republic of China
123
J Mater Sci: Mater Electron
DOI 10.1007/s10854-014-2021-0

band. However, its luminescence covers a broad range of
wavelengths that are insensitive to external changes. It is
known that the emission spectral profile of lanthanide ions
includes a series of well-defined and narrow bands. In
recent decades, some rare earth ions activated tungstates
have been well researched due to the special properties of
WO42- group. These phosphors provide excellent thermal
and hydrolytic stability, as well as strong absorption within
the near-UV region. Hence, tungstates are good choice as
host materials for white LEDs.
Sm3? is one of the most frequently used activator ions in
luminescent materials. The reddish orange emission of
Sm3? due to its 4G5/2 ? 6HJ (J = 5/2, 7/2, 9/2, 11/2)
transitions is the most suitable source for lighting and
display from a practical viewpoint [15, 23–27]. Moreover,
Sm3? can act as a spectroscopic probe of local structure
around rare-earth ions in condensed matter.
To the best of our knowledge, SrWO4: Sm3? 1D phos-
phors via electrospinning have not been reported. In this
paper, SrWO4: Sm3? fibers were prepared via electros-
pinning process. The structure, morphology and lumines-
cence properties were investigated in detail. The charge
compensation effect of alkaline metal ions on the structure
and luminescence intensity of prepared phosphors was also
discussed.
2 Experimental
Sr(NO3)2, (NH4)6W7O24�6H2O and Sm2O3 were used as
the starting materials for the synthesis of Sr(1-x)WO4:
Smx3? (x = 2–6 %) nanofibers. Polyvinylpyrrolidone
(PVP) (MW = 1,300,000) was used to control the viscos-
ity of the solution. Firstly, Sm2O3 was dissolved in nitric
acid and the excess acid was removed by slow evaporation.
The stoichiometric amounts of Sr(NO3)2 and (NH4)6-
W7O24�6H2O were added, then were dissolved in water–
ethanol solution (final mass ratio of water to ethanol is 1:1).
A certain amount of PVP (the weight percentage of PVP is
8 % in the water–ethanol solution) was added and the
solution was stirred for 4 h to obtain a homogeneous hybrid
sol for further electrospinning. The mixture was then loa-
ded in 20 ml plastic syringe of 25 gauges with stainless
steel needle. The distance between the spinneret and col-
lector was fixed at 10 cm and the high voltage supply was
maintained at 15 kV. The spinning rate was controlled at
1 mL h-1. The composite nanofibers were annealed at
700 �C for 3 h in air with a heating rate of 2�C/min. The
Sr0.92WO4: Sm0.043? , R0.04
? (R = Li, Na and K) nanofibers
were synthesized by similar method.
X-ray diffraction (XRD) patterns were recorded using
Rigaku Geiger flux instrument equipped with Cu-Ka(k = 0.15406 nm) radiation. The size and morphology of
SrWO4: Sm3? fibers were characterized by JEOL JSM-
6390 scanning electron microscope (SEM). Energy dis-
persive X-ray (EDX) spectrograph was recorded for the
elemental analysis to investigate the phase purity of
SrWO4: Sm3? nanofibers using INCA 200 EDS, attached
with SEM. Thermogravimetric analysis and Fourier trans-
formation infrared (FT-IR) spectroscopy were performed
on a TA-Q50 and Thermo Nicolet 6,700 spectrometer,
respectively. The photoluminescence measurement was
carried out by Hitachi F-4500 spectrophotometer equipped
with a 150 W xenon lamp as the excitation source at room
temperature.
3 Results and discussions
In order to determine the crystal structure of the phosphors,
all phosphors were characterized by XRD. Figure 1 shows
the XRD pattern of phosphor with maximum doping
(Sr0.92WO4: Sm0.043? , K0.04
? ) and the standard pattern JCPDS
Card No. 08-0490. The results show that all phosphors are
purity phases. Sm3? and R? ions can dissolve effectively
into the SrWO4 host lattice after annealed at 700 �C for
3 h. Due to the slight radius difference between doped ions
and replaced ions (Sm83? (0.1079 nm), Li8
? (0.092 nm),
Na8? (0.118 nm), K8
? (0.151 nm) and Sr82? (0.126 nm).
The subscript here indicates the coordination number of
Sr2? in SrWO4 host lattice, and the main diffraction peaks
may shift slightly [28]. However, due to the low doping
concentration of incorporation ions (Sm3?, Li?, Na? and
K?), the shift of diffraction peaks has not been detected in
our experiments.
Fig. 1 The XRD pattern of Sr0.92WO4: Sm0.043? , K0.04
? and JCPDS card
No. 08-0490 of scheelite phase SrWO4
J Mater Sci: Mater Electron
123
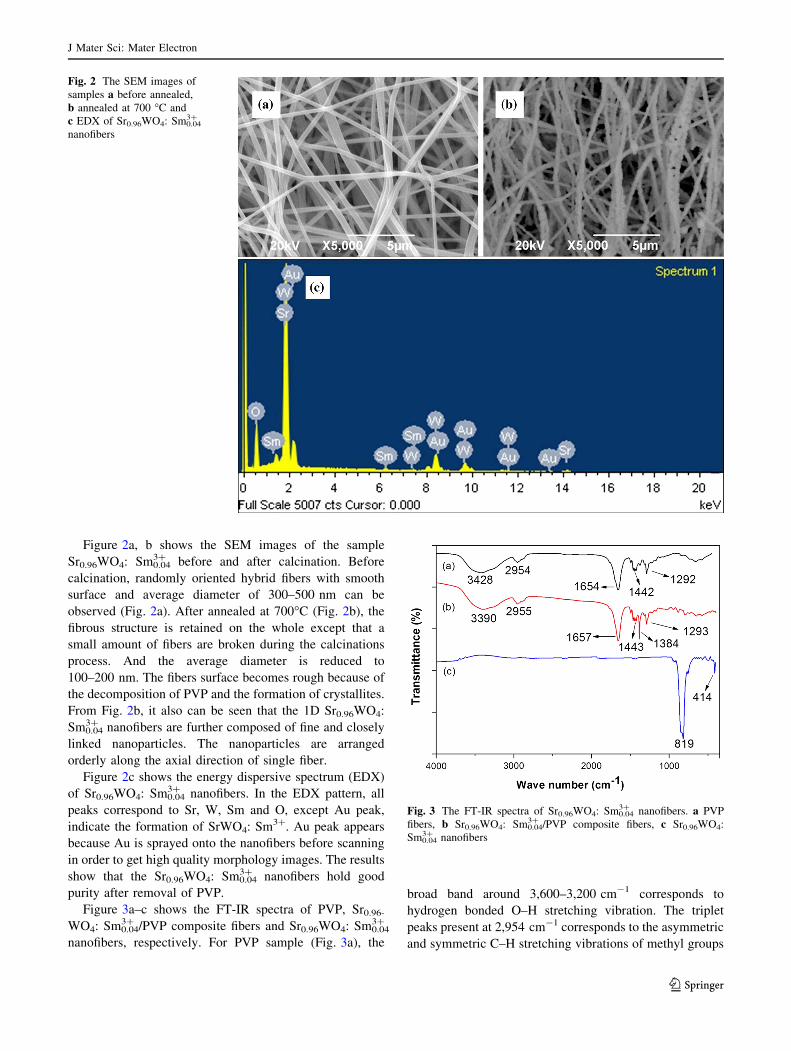
Figure 2a, b shows the SEM images of the sample
Sr0.96WO4: Sm0.043? before and after calcination. Before
calcination, randomly oriented hybrid fibers with smooth
surface and average diameter of 300–500 nm can be
observed (Fig. 2a). After annealed at 700�C (Fig. 2b), the
fibrous structure is retained on the whole except that a
small amount of fibers are broken during the calcinations
process. And the average diameter is reduced to
100–200 nm. The fibers surface becomes rough because of
the decomposition of PVP and the formation of crystallites.
From Fig. 2b, it also can be seen that the 1D Sr0.96WO4:
Sm0.043? nanofibers are further composed of fine and closely
linked nanoparticles. The nanoparticles are arranged
orderly along the axial direction of single fiber.
Figure 2c shows the energy dispersive spectrum (EDX)
of Sr0.96WO4: Sm0.043? nanofibers. In the EDX pattern, all
peaks correspond to Sr, W, Sm and O, except Au peak,
indicate the formation of SrWO4: Sm3?. Au peak appears
because Au is sprayed onto the nanofibers before scanning
in order to get high quality morphology images. The results
show that the Sr0.96WO4: Sm0.043? nanofibers hold good
purity after removal of PVP.
Figure 3a–c shows the FT-IR spectra of PVP, Sr0.96-
WO4: Sm0.043? /PVP composite fibers and Sr0.96WO4: Sm0.04
3?
nanofibers, respectively. For PVP sample (Fig. 3a), the
broad band around 3,600–3,200 cm-1 corresponds to
hydrogen bonded O–H stretching vibration. The triplet
peaks present at 2,954 cm-1 corresponds to the asymmetric
and symmetric C–H stretching vibrations of methyl groups
Fig. 2 The SEM images of
samples a before annealed,
b annealed at 700 �C and
c EDX of Sr0.96WO4: Sm0.043?
nanofibers
Fig. 3 The FT-IR spectra of Sr0.96WO4: Sm0.043? nanofibers. a PVP
fibers, b Sr0.96WO4: Sm0.043? /PVP composite fibers, c Sr0.96WO4:
Sm0.043? nanofibers
J Mater Sci: Mater Electron
123

(from acetate) [29, 30]. While the other three dominant
peaks at about 1,654, 1,442 and 1,292 cm-1 are due to the
stretching vibration of C=O, C–H and C–N bond, respec-
tively [31]. For composite fibers shown in Fig. 3b, the C=O
stretching vibration characteristic peak red-shifts to
1,657 cm-1 in the composite fibers. The C–H stretching
vibration peaks red-shift to 2,955 and 1,443 cm-1 respec-
tively. The C–N stretching vibration peaks red-shift to
1,293 cm-1. A new peak appears at 1,384 cm-1, which
corresponds to N–O (from the NO3- group) stretching
vibration. After Sr0.96WO4: Sm0.043? /PVP fibers are annealed
at 700 �C, all the PVP peaks vanish (Fig. 3c), indicating
the full decomposition of PVP from the sample. And a
strong absorption peak at 819 cm-1 and a weak peak at
414 cm-1 appeared, which can be attributed to the
adsorption of W–O (from the WO42- group) [32–34].
Figure 4 shows the TG curve of Sr0.96WO4: Sm0.043? /PVP
composite nanofibers with a heating rate of 5 �C/min in
nitrogen atmosphere. The TG curve shows three stages of
weight loss. The first weight loss (8.1 %) below 150 �C is
due to the removal of water and organic solvents. The
second weight loss (15.3 %) from 150 to 350 �C is caused
by the decomposition of PVP. The third weight loss step
(52.5 %) between 350 and 600 �C may be due to the fur-
ther combustion of the organic groups in PVP, nitrates and
tungstates. The weight loss is completed below 600 �C and
total weight loss is about 75.9 %. No weight loss has been
observed beyond the temperature value of 600 �C as the
TG curve becomes horizontal. The TG curve confirms the
formation temperature of the sample to be around 600 �C.
The typical excitation spectra of SrWO4: Sm3? is shown
in Fig. 5. The excitation spectra of SrWO4: Sm3? moni-
tored at 595 nm consists of a series of peaks at 318, 345,
362, 375,403, 419 and 443 nm, which can be ascribed to
the transitions from the ground state to the excited states of
Sm3?. The relatively strongest peak at 403 nm is assigned
to the 6H5/2–4L13/2 transition of Sm3? [35]. It also can be
seen from Fig. 5, the peaks of Sr(1-x)WO4: Smx3?
(x = 2–6 %) are similar expect the fluorescence intensity.
The fluorescent intensity increases (from 300 to 450 nm)
with the content increase of Sm3?, and reaches the highest
intensity with content of Sm3? of 0.04. After that, the
fluorescent intensity begins to decrease.
Figure 6 shows the typical emission spectra of SrWO4:
Sm3? excited by 403 nm at room temperature. Lumines-
cence (PL) spectra of phosphors exhibited three sharp
emission peaks corresponding to 4G5/2 ? 6H5/2 (561 nm),4G5/2 ? 6H7/2 (596 nm) and 4G5/2 ? 6H9/2 (643 nm)
transitions of Sm3? [36]. The peak at 596 nm is the
strongest one. And two secondary peaks exist at 561 and
643 nm, respectively. From the emission spectra of
Sr(1-x)WO4: Smx3? (x = 2–6 %) excited by 403 nm, we
can find that the fluorescent intensity of phosphors depends
on the concentrations of Sm3?. As shown in the inset of
Fig. 6, the fluorescent intensity (from 500 to 700 nm)
increases with the increasing concentration of Sm3? ion up
to x = 4 %, then decreases above the concentration due to
concentration quenching. This quenching process is usually
attributed to energy migration among Sm3? ions, which
bring the excitation energy to killer sites such as surface
defects in powders (as shown in Fig. 7) [37]. This is
dependent on the critical distance Rc as the shortest aver-
age distance between the nearest activator Sm3? ions at a
critical concentration xc. As calculated by Blasse and
Grabmaier [38], Rc can be obtained using the following
equation [39, 40]:
Fig. 4 The TG curve of Sr0.96WO4: Sm0.043? /PVP composite
nanofibers
Fig. 5 The typical excitation spectra of Sr(1-x)WO4: Smx3? phosphors
(x = 2–6%) (kem = 595 nm)
J Mater Sci: Mater Electron
123

Rc ¼ 23V
4pxcN
� �13
ð1Þ
where V is the unit cell volume, xc is the critical concen-
tration of the activator ions, and N is the number of host
cations per unit cell. According to JCPDS card No.
08-0490 and the crystal structure, V, N and xc are
0.351 nm3, 1 and 0.04, respectively. The critical transfer
distance is calculated to be about 2.375 nm.
Comparing the spectral properties of SrWO4: Sm3?
nanofibers with the reported SrWO4: Sm3? spherical
nanoparticles [24], it is shown that the excitation and
emission spectra for the phosphor samples have the similar
profiles, but the maximum spectral positions are different
to some extent. For SrWO4: Sm3? nanofibers and nano-
particles, the strongest excitation peaks are at 403 and
405 nm, respectively. They are assigned to the 6H5/2–4L13/2
transition of Sm3?. The three emission peaks of SrWO4:
Sm3? nanofibers are at 561, 596 and 643 nm, while the
three emission peaks of SrWO4: Sm3? spherical nanopar-
ticles are at 562, 596 and 642 nm. The three emission
peaks also correspond to 4G5/2 ? 6H5/2, 4G5/2 ? 6H7/2 and4G5/2 ? 6H9/2 transitions of Sm3?. It is believed that the
morphology of Sm3? activated phosphors has a slight
influence on the luminescence properties of Sm3? because
the 4f–4f transitions of Sm3? are shielded by the outside 5s
and 5p orbitals. But due to the one-dimensional orientation
and confinement effect of SrWO4 single crystalline
nanofibers, it can be inferred that the emission of individual
SrWO4 single crystal nanofibers containing an emission
activator of Sm3? is polarized linearly, which can be
potentially used as linearly polarized light resource, pho-
todetectors, sensors etc. [41].
According to Huang’s rule [42, 43], the relationship
between the integral luminescent intensity I and doping
concentration x can be expressed as follows:
I1a 1�sdð ÞC 1þ s
d
� �ð2Þ
a ¼ xC 1� d
s
� �X0
ð1þ AÞc
� �ds
ð3Þ
where c is the intrinsic transition probability of the sensi-
tizer, s is index of electric multipole, which is 6, 8 and 10
for electric dipole–dipole, electric dipole-quadrupole, and
electric quadrupole–quadrupole interactions, respectively.
If s = 3, the interaction type is an exchange interaction.
Fig. 6 The typical emission spectra of SrWO4: Sm3? (kex = 403 nm).
The inset shows the relation between the relative fluorescent intensity
and the concentration of Sm3? for the Sr(1-x)WO4: Smx3? (x = 2–6 %)
phosphors
Fig. 7 Energy level diagrams,
visible emission transitions for
Sm3?, and the resonance energy
transfer among Sm3? ions
J Mater Sci: Mater Electron
123

The dimension of the sample is d, which was accounted as
3 in this case. A and X0 are the constants and C(1 ? s/d) is
a C function. From Eqs. (2) and (3), it can be derived that
logI
x
� �¼ s
dlog xþ log f ð4Þ
where f is independent of the doping concentration.
Figure 8 shows the Log (I/x)-Logx plot for the 4G5/2
? 6H7/2 transitions of Sm3? ions in Sr(1-x)WO4: Smx3?
phosphors. According to Eq. (4), using linear fitting to deal
with the experimental data in the region of high concen-
trations, the value of the slope parameter -s/d is obtained
to be -1.783 for the 4F9/2 ? 6H15/2 transition. The slope
was determined to be -2. Therefore, the index of the
electric multipole energy transfer is 6. The results indicate
that the electric dipole–dipole interaction mechanisms are
dominant by the energy transfer of the Sm3? ions in the
network of the investigated phosphors.
In this paper, three charge compensators were employed
to offset the net positive charge involved by the substitu-
tion of Sm3? for Sr2?, namely, Li?, Na?, K? at strontium
sites. The doping concentration of Sm3? was selected to be
0.04 according to the above analysis about the concentra-
tion quenching of Sm3? luminescence.
Figure 9 shows the emission spectra of three samples
with charge compensation under the excitation at 403 nm.
It is observed that all three samples with charge compen-
sation present a better luminescence performance than the
one without charge compensation. This indicates that
charge compensation is a powerful method to enhance the
luminescent intensity of phosphors when necessary. From
Fig. 9, the sequence according to the effect on luminescent
intensity is Li?, Na?, and K?. The integrated emission
intensity (from 500 to 700 nm) of phosphors with Li?,
Na?, and K? as charge compensators are enhanced by 1.9,
1.6, and 1.3 times, respectively.
When Sm3? is incorporated into SrWO4 host, it sub-
stitutes for a Sr2? ion, which may induce structural defect.
According to the principle of charge balance, the intro-
duction of Sm3? in SrWO4 should lead to the appearance
of calcium ion vacancy. Generally, this negative vacancy is
deleterious to the luminescence intensity of the Sm3? ions
because the energy transfer from the luminescence centers
to the vacancy defects becomes more effective. As a charge
compensator, alkali metals such as Li?, Na?, and K? can
sometimes be added to the host lattice. Thus, the intro-
duction of R? ions leads to the decrease of non-radiative
transitions probability and increases significantly the
emission efficiency of Sm3?-doped SrWO4 phosphors.
For R?, it is found that Li? anion can exhibit the
strongest charge compensation abilities, Na? anion being
the second, and K? anion is the weakest. The evident
change of the emission intensity is due to differences of the
ionic radii of alkali metal ions. The alkali metal ions of
Li?, Na?, and K? have the valence electronic configura-
tions. The ionic radii increase in the order of Li?
(0.092 nm) \ Na? (0.118 nm) \ K? (0.151 nm) [28]. The
difference of ionic radii would give rise to the diversity of
sub-lattice structure around the luminescent center ions,
which influences the spin–orbit couplings and crystal field
of Sm3? ions. Among them, the emission intensity of as-
prepared phosphor with Li? as the charge compensator is
higher than that of phosphors co-doped by Na?, and K?.
The reason may be that Li? ions are easy to enter into
SrWO4 crystal lattice than the others due to its smaller
ionic radius.
The commission International de I’Eclairage (CIE)
chromaticity coordinates of Sm3? and R? (R = Li, Na and
K)) doped phosphors excited at 403 nm were calculated
Fig. 8 The relation of the concentration of Sm3? ions Log(x) and the
Log (I/x) for the 4G5/2 ? 6H7/2 (596 nm) transition by 403 nm light
Fig. 9 Influence of charge compensation ions on the emission
intensity of Sr0.92WO4: Sm0.043? , R0.04
? phosphors (R = Li, Na, K)
J Mater Sci: Mater Electron
123

using the CIE system. All phosphors own the approximate
coordinates for their similar spectral shape. As shown in
Fig. 10, the CIE chromaticity coordinates of typical chro-
maticity coordinates of Sr0.92WO4: Sm0.043? , Li0.04
? is located
in the orange region (x = 0.537 and y = 0.444).
4 Conclusions
In summary, one-dimensional Sm3? doped SrWO4 without
or with different charge compensation approaches (co-
doping Li?, Na? and K?) nanofibers are prepared by
electrospinning. As-prepared precursor composite fibers
present uniform fiberlike morphology and smooth surface
with diameters ranging from 300 to 500 nm. After calci-
nation at 700 �C for 3 h, well-crystallized Sr(1-x)WO4:
Smx3? (x = 2–6 %) nanofibers consist of linked nanopar-
ticles with the diameters ranging from 100 to 200 nm. Its
excitation spectra show broad absorption from 300 to
450 nm suggesting that the phosphors can be excited
effectively by UV and near-UV light. The PL spectra of
SrWO4: Sm3? phosphors exhibits a strong orange light
emission with emission peaks at 561, 596 and 643 nm and
the optimal doping concentration of Sm3? in SrWO4 is
ascertained experimentally to be 4 mol%. The introduction
of R? (R = Li, Na and K) as charge compensators for
SrWO4 host can enhance the luminescence intensity. The
Li?, Na? and K? increase the luminescence intensity by
1.9, 1.6, and 1.3 times, respectively. It because that the
ionic radius of Li? is smaller than that of Na? or K?, which
makes Li? ions enter into SrWO4 crystal lattice easily. The
results indicate that Sr0.92WO4: Sm0.043? , Li0.04 with maxi-
mum excitation around 403 nm is expected to be a
potential candidate for the orange component used for
light-emitting diode based on UV chip technology.
References
1. G.P. Dong, X.D. Xiao, L.L. Zhang, Z.J. Ma, X. Bao, M.Y. Peng,
Q.Y. Zhang, J.R. Qiu, J. Mater. Chem. 21, 2194 (2011)
2. C. Peng, G. Li, X. Kang, C. Li, J. Lin, J. Colloid Interface Sci.
355, 89 (2011)
3. Y. Ner, J.G. Grote, J.A. Stuart, G.A. Sotzing, Angew. Chem. Int.
Ed. 121, 5234 (2009)
4. H. Wu, Y. Sun, D.D. Lin, R. Zhang, C. Zhang, W. Pan, Adv.
Mater. 21, 227 (2009)
5. Z.Y. Zhang, C.L. Shao, F. Gao, X.H. Li, Y.C. Liu, J. Colloid
Interface Sci. 347, 215 (2010)
6. Y.L. Cheng, Y. Zhao, Y.F. Zhang, X.Q. Cao, J. Colloid Interface
Sci. 344, 321 (2009)
7. C. Peng, M.M. Shang, G.G. Li, Z.Y. Hou, D.L. Geng, J. Lin,
Dalton Trans. 41, 4780 (2012)
8. W.Y. Liu, Y.C. Yeh, J. Lipner, J.W. Xie, H.W. Sung, S. Thom-
opoulos, Y.N. Xia, Langmuir 27, 9088 (2011)
9. A.B. Suryamas, M.M. Munir, T.O. Khairurrijal, K. Kuyama, J
Mater Chem 21, 12629 (2011)
10. G.P. Dong, Y.Z. Chi, X.D. Xiao, X.F. Liu, B. Qian, Z.J. Ma, E.
Wu, H.P. Zneg, D.P. Chen, J.R. Qiu, Opt. Express 17, 22514
(2009)
11. Y.L. Cheng, Y. Zhao, Y.F. Zhang, X.Q. Cao, J. Colloid Interface
Sci. 344, 321 (2010)
12. Z.Y. Hou, C.X. Li, J. Yang, H.Z. Lian, P.P. Yang, R.T. Chai,
Z.Y. Cheng, J. Lin, J. Mater. Chem. 19, 2737 (2009)
13. Z.Y. Hou, G.G. Li, H.Z. Lian, J. Lin, J. Mater. Chem. 22, 5254
(2012)
14. P.F. Du, L.X. Song, J. Xiong, H.B. Cao, Z.Q. Xi, S.Y. Guo, N.Y.
Wang, J.J. Chen, J. Alloys Compd. 540, 179 (2012)
15. J.M. Liao, L.B. Liu, H.Y. You, H.P. Huang, W.X. You, Optik
123, 901 (2012)
16. T. Thongtem, A. Phuruangrat, S. Thongtem, Appl. Surf. Sci. 254,
7581 (2008)
17. L.S. Cavalcante, J.C. Sczancoski, J.W.M. Espinosa, J.A. Varala,
P.S. Pizani, E. Longo, J. Alloys Compd. 474, 195 (2009)
18. X.Y. Sun, X.D. Sun, X.G. Li, J. He, B.S. Wang, J. Mater. Sci.:
Mater. Electron. 25, 2320 (2014)
19. Y.G. Su, L.P. Li, G.S. Li, Chem. Mater. 20, 6060 (2008)
20. P.P. Yang, Z.W. Quan, C.X. Li, H.Z. Lian, S.S. Huang, J. Lin,
Mesoporous Mater. 116, 524 (2008)
21. J.S. Liao, B. Qiu, H. Wen, W. You, Opt. Mater. 31, 1513 (2009)
22. J.S. Liao, B. Qiu, H.R. Wen, J.L. Chen, W.X. You, L.B. Liu, J.
Alloys Compd. 487, 758 (2009)
23. Z.H. Ju, R.P. Wei, J.X. Ma, C.R. Pang, W.S. Liu, J. Alloys
Compd. 507, 133 (2010)
24. Y.H. Zheng, J.T. Lina, Q.M. Wang, Photochem. Photobiol. Sci.
11, 1567 (2012)
25. J. Mu, L. Liu, S. Kang, Nanoscale Res. Lett. 2, 100 (2007)
26. Y. Zhou, J. Lin, S. Wang, J. Solid State Chem. 171, 391 (2003)
27. E. De la Rosa, L. Diaz-Torres, P. Salas, R. Rodriguez, Opt.
Mater. 27, 1320 (2005)
Fig. 10 The CIE chromaticity coordinates of Sr0.92WO4: Sm0.043? ,
Li0.04? phosphor
J Mater Sci: Mater Electron
123

28. R.D. Shannon, Acta Cryst. A 32, 751 (1976)
29. H.Y. Tian, W.G. Luo, X.H. Pu, P.S. Qiu, X.Y. He, A.L. Ding,
Thermochim. Acta 360, 57 (2000)
30. J. Coates, (USA, 2000), pp. 10815–10837
31. Q.Z. Cui, X.T. Dong, J.X. Wang, M. Li, J. Rare Earths 26, 664
(2008)
32. S. Wannapop, T. Thongtem, S. Thongtem, Ceram. Int. 37, 3499
(2011)
33. G.M. Clark, W.P. Doyle, Spectrochim. Acta 22, 1441 (1966)
34. R.L. Frost, L. Duong, M. Weier, Spectrochim. Acta Part A 60,
1853 (2004)
35. X. Lin, X.S. Qiao, X.P. Fan, Solid State Sci. 13, 579 (2011)
36. P.L. Li, Z.J. Wang, Z.P. Yang, Q.L. Guo, X. Li, J. Lumin. 130,
222 (2010)
37. H.M. Yang, J.X. Shi, H.B. Liang, M.L. Gong, Mater. Sci. Eng. B
127, 276 (2006)
38. G. Blasse, B.C. Grabmaier, Luminescent Materials, 1st edn.
(Springer, Germany, 1994), pp. 91–107
39. J.C. Zhang, Y.H. Wang, Z.Y. Zhang, Z.L. Wang, B. Liu, Mater.
Lett. 62, 202 (2008)
40. P.L. Li, Z.J. Wang, Z.P. Yang, Q.L. Guo, X. Li, Mater. Lett. 63,
751 (2009)
41. G.P. Dong, X.D. Xiao, Y.Z. Chi, B. Qian, X.F. Liu, Z.J. Ma, H.P.
Zeng, D.P. Chen, J.R. Qiu, J. Mater. Chem. 20, 1587 (2010)
42. Y. Tian, X.H. Qi, X.W. Wu, R.N. Hua, B.J. Chen, J. Phys. Chem.
C 113, 10767 (2009)
43. X.Y. Sun, L.W. Lin, W.F. Wang, J.C. Zhang, Appl. Phys. A 104,
83 (2011)
J Mater Sci: Mater Electron
123


![Hierarchical porous carbon nanofibers via electrospinningcarbonlett.org/Upload/files/CARBONLETT/[01-14]-01.pdf · Hierarchical porous carbon nanofibers via electrospinning ... major](https://static.fdocuments.in/doc/165x107/5b2cbfa67f8b9ae16e8b6d56/hierarchical-porous-carbon-nanofibers-via-elect-01-14-01pdf-hierarchical-porous.jpg)