Electrospinning of Polymeric and Ceramic Fibers ... · Electrospinning of Polymeric and Ceramic...
136
Electrospinning of Polymeric and Ceramic Fibers: Understanding of the Morphological Control and Its Application by Qing Du Submitted in Partial Fulfillment of the Requirements for the Degree Doctor of Philosophy Supervised by Professor Hong Yang Department of Chemical Engineering Arts, Science and Engineering Edmund A. Hajim School of Engineering and Applied Sciences University of Rochester Rochester, New York 2013
-
Upload
truongnguyet -
Category
Documents
-
view
221 -
download
2
Transcript of Electrospinning of Polymeric and Ceramic Fibers ... · Electrospinning of Polymeric and Ceramic...

Electrospinning of Polymeric and Ceramic
Fibers: Understanding of the Morphological
Control and Its Application
by
Qing Du
Submitted in Partial Fulfillment of the
Requirements for the Degree
Doctor of Philosophy
Supervised by
Professor Hong Yang
Department of Chemical Engineering
Arts, Science and Engineering
Edmund A. Hajim School of Engineering and Applied
Sciences
University of Rochester
Rochester, New York
2013

ii
Biographical Sketch
The author was born and grew up in her beloved hometown of Wuhan, Hubei
Province, China. In the fall of 2001, she joined the Class of National Base of Chemistry,
Wuhan University and earned her Bachelor of Science degree in Chemistry in 2005. In
the same year, she joined Changchun Institute of Applied Chemistry, Chinese Academy
of Sciences to study Polymer Chemistry and Physics and obtained her Master of Science
degree in 2008. Immediately after that, she came to the United States and began her
doctoral studies in the Department of Chemical Engineering at the University of
Rochester. Following a period of study on copper indium gallium selenium solar cells,
she started her research in the area of electrospinning of polymeric and ceramic fibers -
understanding of the morphological control and its application, under the direction of
Professor Hong Yang. She was awarded Horton Fellowships in 2010, 2011 and 2012. She
received her second Master of Science degree in Chemical Engineering from the
University of Rochester in 2012.
Part of Qing’s research work during doctoral study is reflected from the following
publication list:
1. Qing Du, Hong Yang, David Harding, “Magnetic-Field-Assisted Electrospinning
of Twisted Peanut-shaped Poly (Vinyl Pyrrolidone) Ribbons.” Polymer, under
review.

iii
2. Qing Du, Jianbo Wu, Hong Yang, “Pt@Nb-TiO2 Catalyst Membranes Fabricated
by Electrospinning and Atomic Layer Deposition.” ACS Catalysis, to be
submitted.
3. Qing Du, Hong Yang, David Harding, Fabrication of SiC Fibers by
Electrospinning and UV Cure.” In preparation.
4. Hao Lin, Qing Du, Wei Xia, Hsiang Ning Wu, Ching W. Tang, “MoOx as a metal
diffusion barrier to stabilize CdS/CdTe thin film solar cells.” In preparation.
iv
Acknowledgements
First, I would like to express my deepest and sincerest gratitude to my thesis
advisor, Professor Hong Yang for his consistent guidance and help in the past five years
of my Ph.D. research. He created many opportunities to support my thesis work. He
helped me to broaden my horizon and patiently guided me throughout the whole research
project. Without his supervision and support, this thesis would not have been
accomplished.
Second, I would like to thank Professor David R. Harding and Professor Ching W.
Tang for their great comments and suggestions. I sincerely appreciate their willingness to
share the facilities in their labs, which facilitated the progress of my research. In addition,
they provided a lot of guidance on my research shown and not shown in this dissertation.
I would also like to thank another committee member, Professor James C.M. Li, for his
tremendous help.
Third, I sincerely appreciate the friendship and assistance from all the fellow
students in my lab. Hopefully I can cover all the names here: Dr. Jianbo Wu, Dr.
Zhenmeng Peng, Miao Shi, Xi Yin, Samantha S. Lyu, Elliot Yu, Steven A. Warren and
Yung-Tin Pan. My sincere gratitude is also extended to Joe Madathil, Dr. Wei Xia,
Sunny Wu and Felipe Angel in Professor Ching W. Tang’s group for their help and
friendship.

v
Forth, I would like to thank Mr. Brian McIntyre for sharing the electron
microscopes and atomic layer deposition system, and thank Ms. Christine Pratt for
providing help with the X-ray diffractometer. I would like to acknowledge the kind
assistance from our department staff, especially from Ms. Sandra Willison, Ms. Gina
Eagan and Mr. Larry Kuntz.
Last but not the least, my gratefulness goes to my family. No words can express
my love and thanks for the unconditional supports and encouragement from my beloved
parents in China. I especially thank my husband, Hao Lin, for his wholehearted support
not only in life but also in my research study. He always encourages me and helps me to
head out again when I feel depressed. He is the morning star in my life.

vi
Abstract
In this dissertation, polymeric fibers, poly(vinyl pyrrolidone) (PVP), and two
kinds of ceramic fibers, silicon carbide (SiC) and niobium-doped titania (Nb-TiO2), were
successfully fabricated by the electrospinning technique. The morphology of electrospun
fibers was studied by adjusting the parameters during the electrospinning process,
especially the humidity. The application of Nb-TiO2 fibers was explored.
Firstly, helical peanut-shaped ribbons of poly(vinyl pyrrolidone) were prepared by
a magnetic field-assisted electrospinning method. The formation mechanism of helical
ribbons was attributed to the synergistic interaction of bending instability and rigidity of
the polymers during the electrospinning process. The relative humidity was found to
significantly influence the morphology of PVP fibers. When the relative humidity of the
environment decreased, the morphology changed from straight rods to helical ribbons,
and the percentage of helical ribbons increased dramatically. At the same time, the cross-
section of electrospun fibers changed from circle, to ellipse, and to peanut shape. These
fibers had different mechanical properties, and the helical ribbons were shown to have the
largest ultimate elongation.
Secondly, SiC fibers were synthesized by electrospinning from preceramic
polymer without the help of guiding polymer, UV Cure and pyrolysis processes. The
morphology and diameter of the electrospun preceramic fibers is controlled by varying
mixtures of solvents. UV cure was used to crosslink and strengthen the preceramic fibers.
As a result, the morphology of SiC fibers remained intact during the pyrolysis process.

vii
Lastly, a facile method to fabricate niobium-doped titania supported platinum
(Pt@Nb-TiO2) catalyst membrane for oxygen-reduction reaction (ORR) in polymer
electrolyte membrane fuel cell (PEMFC) was developed by a new two-step approach,
electrospinning and atomic layer deposition (ALD). The 30000-cycle accelerated-
stability test on the Pt@Nb-TiO2 catalyst membrane showed that it had high stability. The
effect of fiber morphology, doping amount of niobium, number of ALD cycle, post-
treatment temperature and crystal phase of Nb-TiO2 support on the catalytic activity of
Pt@Nb-TiO2 membrane were discussed. The area-specific ORR activity of Pt@Nb-TiO2
catalyst membrane was increased by about 20 folds over the Pt@TiO2 fiber membrane, if
10 at% of Nb was incorporated into the ceramic fibers. The area-specific activity also
increased with the number of ALD cycles. The ORR activity further increased to 0.28
mA/cm2
Pt at 0.9 V after post-treatment of the catalyst membrane at high temperature in
H2–containing atmosphere, due to conductivity improvement of Nb-TiO2 fiber membrane
and better crystalinity of Pt NPs. The area-specific activity of Pt@Nb-TiO2 catalyst with
rutile phase of support was higher than the one with anatase phase of support due to the
improvement of support conductivity.

viii
Contributors and Funding Sources
This work was supervised by a dissertation committee consisting of Professor
Hong Yang (advisor) and Professor Ching W. Tang of the Department of Chemical
Engineering, Professor David R. Harding of the Laboratory for Laser Energetics,
Professor James C.M. Li and Professor John Lambropoulos (chair) of the Department of
Materials Science. XRD spectra were recorded by Christine Pratt of Mechanical
Engineering. Dr. Jianbo Wu of the Department of Chemical Engineering provided some
suggestions on the analysis in Chapter 4. All the other work conducted for the
dissertation was completed by the author independently. Graduate study was sponsored
by a Horton Fellowship from the Laboratory of Laser Energetics, University of Rochester.

ix
Table of Contents
Chapter 1 Introduction ........................................................................................................ 1
1.1 History of Electrospinning .........................................................................1
1.2 Theory of Electrospinning ..........................................................................4
1.2.1 Apparatus of Electrospinning ..................................................................4
1.2.2 Electrospinning Process ..........................................................................4
1.2.3 Mechanism of Electrospinning ...............................................................5
1.2.4 Important Parameters of Electrospinning................................................7
1.3 Applications of Electrospinning .................................................................9
1.4 Objective and Overview of Thesis ...........................................................10
1.5 References ................................................................................................12
Chapter 2 Helical Peanut-Shaped Poly(Vinyl Pyrrolidone) Ribbons Generated by
Electrospinning ................................................................................................................. 18
2.1 Introduction ..............................................................................................18
2.2 Experimental Section ...............................................................................19
2.3 Results and Discussion .............................................................................20
2.3.1 Formation of Helical Ribbons ...............................................................20
2.3.2 Effect of the Relative Humidity on the Fiber Morphology ...................24
2.3.3 Effect of the Relative Humidity on the Cross-section Shape ................27
2.3.4 Effect of Solvents on the Fiber Morphology.........................................33
2.3.5 Effect of Concentration on the Fiber Morphology ................................35

x
2.3.6 Ultimate Elongation of Fibers Electrospun at Different Relative
Humidity ...............................................................................................36
2.4 Conclusion ................................................................................................39
2.5 References ................................................................................................40
Chapter 3 Fabrication of SiC Fibers by Electrospinning and UV Cure ............................ 43
3.1 Introduction ..............................................................................................43
3.2 Experimental Section ...............................................................................44
3.3 Results and Discussion .............................................................................46
3.3.1 Morphology and Diameter Control of Preceramic Fibers.....................46
3.3.2 Characterization of Preceramic Polymer ..............................................49
3.3.3 Influence of UV Cure on Morphology of SiC Fibers ...........................53
3.4 Conclusion ................................................................................................60
3.5 References ................................................................................................60
Chapter 4 Catalyst Membrane of Pt@Nb-TiO2 Fabricated by Electrospinning and Atomic
Layer Deposition ............................................................................................................... 63
4.1 Introduction ..............................................................................................63
4.2 Experimental Section ...............................................................................65
4.3 Results and Discussion .............................................................................68
4.3.1 Experimental Process ............................................................................68
4.3.2 Effect of Fiber Morphology on Electrocatalytic Activity .....................72
4.3.3 Effect of Nb-doped Percentage on Electrocatalytic Activity ................75

xi
4.3.4 Effect of ALD Cycles and Post-treatment on Electrocatalytic Activity81
4.3.5 Accelerated-stability Test......................................................................85
4.4 Conclusion ................................................................................................89
4.5 References ................................................................................................90
Chapter 5 Synthesis of Rutile TiO2 by Electrospinning and Its Supported Pt
Electrocatalysts for the Oxygen Reduction Reaction ....................................................... 95
5.1 Introduction ..............................................................................................95
5.2 Experimental Section ...............................................................................96
5.3 Results and Discussion .............................................................................99
5.3.1 Synthesis and Characterization of r-TiO2 Fibers ..................................99
5.3.2 Synthesis and Characterization of r-Nb-TiO2 Fibers ..........................102
5.3.3 ORR Activity of Pt@r-Nb-TiO2 Catalysts ..........................................106
5.4 Conclusion ..............................................................................................109
5.5 References ..............................................................................................109
Chapter 6 Conclusions and Future Research .................................................................. 112
6.1 Conclusions ............................................................................................112
6.2 Future Research ......................................................................................115
6.2.1 Future Research of Helical Ribbons ...................................................115
6.2.2 Future Research of Electrospun Nb-TiO2 Fibers ................................115
6.3 References ..............................................................................................116

xii
Appendices ...................................................................................................................... 119

xiii
List of Figures
Figure 1.1. The number of publications searched in Web of Science by the topic of
“electrospinning” or “electrospraying”. .............................................................................. 3
Figure 2.1. (A, B) SEM images and (C, D) TEM micrographs of PVP fibers made at a
relative humidity of 16%. ................................................................................................. 21
Figure 2.2. SEM images of helical fibers collected on the top of magnets. .................... 23
Figure 2.3. SEM images of PVP fibers made at different relative humidity of the
environment: (A) 31-32%, (B) 28-29%, (C) 26-27%, (D) 23-24%, (E) 22%, (F) 21%, (G)
18%, and (H) 16%, respectively. ...................................................................................... 25
Figure 2.4. Dependence of the percentage of helical ribbons on the relative humidity.
The electrospinning was carried out with an 18-Gauge and 20-Gauge needle. ................ 27
Figure 2.5. SEM images of the cross-section or side-view of PVP fibers generated at
different relative humidity of the environment: (A) 28%, (B) 23%, (C) 22%, and (D) 16%,
respectively. ...................................................................................................................... 29
Figure 2.6. SEM images of PVP fibers generated at the EtOH/H2O volumetric ratio of (A)
3:1, (B) 2:1, (C) 1:1, and (D) 1:2, respectively. The relative humidity of the environment
was 16%. ........................................................................................................................... 35
Figure 2.7. SEM images of PVP fibers generated at the concentration of electrospun
solution of (A) 11%, (B) 9% and (C) 7% (w/v), respectively. The relative humidity of the
environment was 16%. ...................................................................................................... 36
Figure 2.8. Dependence of ultimate elongation of PVP fibers and percentage of helical
ribbons on the relative humidity. ...................................................................................... 37
Figure 3.1. SEM images of preceramic fibers using mixture of toluene and
dichloromethane as solvent. The weight percentage of toluene was (A) 30%, (B) 20%, (C)
10% and (D) 0%, respectively. ......................................................................................... 47
Figure 3.2. SEM images of preceramic fibers using mixture of NMP and
dichloromethane as solvent. The weight percentage of NMP was (A) 20% and (B) 10%.
........................................................................................................................................... 48
Figure 3.3. 1H NMR spectra of RD material. The structural formula of RD was sketched
on the top........................................................................................................................... 50
Figure 3.4. ATR-IR spectrum of RD material. ................................................................ 51

xiv
Figure 3.5. TGA curve of RD material. ........................................................................... 52
Figure 3.6. XRD patterns of RD pyrolyzed in Ar atmosphere at 1350 °C. XRD patterns
of β-SiC are shown by the red lines as a reference based on the JCPDS database (No. 74-
2307). ................................................................................................................................ 53
Figure 3.7. SEM images of SiC fibers which were cured by UV light at different
durations and then pyrolyzed in Ar atmosphere at 1100°C. The periods of UV cure were
(A) 15min, (B) 30 min, (C) 1 hr, and (D) 2 hr, respectively............................................. 54
Figure 3.8. ATR-IR spectra of as-spun preceramic fibers which were cured by UV light
at different durations. ........................................................................................................ 56
Figure 3.9. Solution of RD in dichloromethane after RD was cured by UV light for
different durations. ............................................................................................................ 59
Figure 4.1. (A) TEM and (B) STEM micrographs of Pt@Nb-TiO2 catalyst. (C) HAADF-
STEM study showing the distribution of Pt (blue), Ti (red) and Nb (green) elements. The
area for HAADF-STEM study is the marked region in (B).............................................. 71
Figure 4.2. SEM images of (A1 and B1) as-spun polymeric fibers, (A2 and B2) ceramic
fibers of Nb-TiO2 with 10 at% of Nb after hydrolysis and (A3 and B3) sintering and
catalysts of Pt@Nb-TiO2 with 10 at% of Nb after 40-cycle ALD of Pt NPs. The
morphologies of the fibers were: (A) straight fiber and (B) beaded fiber. ....................... 73
Figure 4.3. SEM images of (A1, B1, C1 and D1) as-spun polymeric fibers, (A2, B2, C2
and D2) Nb-TiO2 fibers after hydrolysis and sintering and (A3, B3, C3 and D3) Pt@Nb-
TiO2 catalysts after 40-cycle ALD of Pt NPs. The amount of Nb was (A) 0 at%, (B) 5
at%, (C) 10 at%, and (D) 25 at%, respectively. ................................................................ 77
Figure 4.4. TEM micrograph of TiO2 fiber. ..................................................................... 78
Figure 4.5. XRD patterns of Nb-TiO2 fibers with different amount of Nb. XRD patterns
of anatase TiO2 are shown by the black lines as a reference based on the JCPDS database
(No. 84-1286). ................................................................................................................... 79
Figure 4.6. Plot showing the dependence of area-specific ORR activities of Pt@Nb-TiO2
catalyst membrane at 0.9 V (versus RHE) on Nb-doped percentage in the ceramic fibers.
........................................................................................................................................... 81
Figure 4.7. SEM images of Pt@Nb-TiO2 catalysts with 10 at% of Nb obtained by
different numbers of ALD cycle and different temperature of post-treatment in 5% H2 w/
Ar atmosphere. (A-D) were treated at 200 °C. (E-H) were treated at 500 °C. The numbers
of ALD cycle were as following: (A, E) 10, (B, F) 20, (C, G) 40, and (D, H) 80. ........... 83

xv
Figure 4.8. Plot showing the dependence of area-specific ORR activities of Pt@Nb-TiO2
with 10 at% of Nb at 0.9 V (versus RHE) on the number of ALD cycle for making Pt NPs,
and the temperature of post-treatment in 5% H2 w/ Ar atmosphere. ................................ 84
Figure 4.9. Accelerated-stability test of Pt@Nb-TiO2 catalyst with 10 at% Nb: (A) CV
curves and (B) ORR polarization curves measured at 1600 rpm...................................... 86
Figure 4.10. TEM micrographs of Pt@Nb-TiO2 catalyst with 10 at% of Nb (A) before
and (B) after the accelerated-stability test. ....................................................................... 88
Figure 5.1. SEM images of (A) as-spun preceramic fibers and (B) TiO2 fibers after
hydrolysis and sintering. ................................................................................................. 100
Figure 5.2. TEM micrograph of TiO2 fibers sintered at 900 °C. ................................... 101
Figure 5.3. XRD patterns of TiO2 fibers sintered at 900 °C. XRD patterns of bulk rutile
TiO2 are shown by the red lines as a reference based on the JCPDS database (No. 86-
0147). .............................................................................................................................. 102
Figure 5.4. SEM images of (A) as-spun polymeric fibers and (B) Nb-TiO2 fibers after
hydrolysis and sintering at 900 °C. ................................................................................. 103
Figure 5.5. TEM micrograph of Nb-TiO2 fibers sintered at 900 °C. ............................. 104
Figure 5.6. XRD patterns of Nb-TiO2 fibers sintered at 900 °C. XRD patterns of rutile
TiO2 are shown by the red lines (No. 86-0147), anatase TiO2 by the blue lines (No. 84-
1286), and TiNb2O7 by the green lines (No. 77-1374) as references based on the JCPDS
database. .......................................................................................................................... 105
Figure 5.7. SEM image of Pt@ r-Nb-TiO2 catalysts. .................................................... 107
Figure 5.8. Electrocatalytic property of Pt@r-Nb-TiO2 catalyst: (A) CV curves and (B)
ORR polarization curves measured at 1600 rpm. ........................................................... 108

xvi
List of Schemes
Scheme 1.1. Schematic illustration of formation of spiral coils. ........................................ 7
Scheme 2.1. Schematic illustration of formation process of helical ribbons. .................. 23
Scheme 2.2. Schematic illustration of the formation of electrospun polymeric fibers with
different shapes in cross-section. ...................................................................................... 31
Scheme 2.3. Schematic illustration of the deformation of (A) a helical ribbon and (B) a
straight round fiber under extension forces F. .................................................................. 38
Scheme 3.1. Schematic illustration of crosslinking reactions of as-spun preceramic fibers
during the treatment of UV cure. ...................................................................................... 59
Scheme 4.1. Schematic illustration of the process for the production of Pt@Nb-TiO2
catalyst membrane. (A) Step 1: preparation of Nb-TiO2 support membrane by
electrospinning technique and sintering. (B) Step 2: preparation of catalyst membrane of
Pt@Nb-TiO2 by the ALD technique. The SEM image shows a final membrane made of
Pt@Nb-TiO2 fibers. ........................................................................................................... 70

xvii
List of Tables
Table 2.1. Summary of morphology and diameter (nm) of electrospun PVP fibers made
using 18-G and 20-G needles under different relative humidity. ..................................... 25
Table 4.1. Summary of the diameter of fibers and size of beads of as-spun polymeric and
Nb-TiO2 fibers at different Nb-doped amount (at%). ....................................................... 77
Table 4.2. Electrochemically active surface area (ECSA), kinetic current density (ik) and
area-specific current density (is) at 0.9 V (versus RHE) of Pt@Nb-TiO2 catalyst
membranes with 10 at% of Nb after a given number of potential cycles during
accelerated-stability test; relative percentages are given in parentheses. ......................... 87
Table A1. Physical properties of solvents. ..................................................................... 119

1
Chapter 1
Chapter 1 Introduction
One-dimensional (1D) nanostructures have gained tremendous attention in recent
years because of their unique chemical and physical properties and wide applications.1-6
A number of methods have been demonstrated to fabricate 1D nanostructures, especially
fibers. These methods include vapor-liquid-solid (VLS) growth,7-10
template synthesis,11-
13 conventional fiber spinning (wet spinning,
14, 15 dry spinning,
16-18 melt spinning
19-21 and
gel spinning5, 22
), and electrospinning.23-34
Electrospinning has obvious advantages
superior to other methods because it is a cost-effective, simple and direct method with
universality. Compared to conventional spinning, it can generate fibers with much
smaller diameter. Overall, electrospinning is a versatile method which can process almost
any soluble or fusible polymers or preceramic polymers into polymeric or ceramic fibers
with diameters ranging from nanometers to micrometers.
1.1 History of Electrospinning
Just as Newton discovered the laws of universal gravitation, the first observation
of electrospinning, at that time it was called electrospraying, is full of occasionlity. In the
late 1500s, William Gilbert found when a suitably charged piece of amber was brought
near a droplet of water, it would form a cone shape and small droplets would be ejected
from the tip of the cone.35
It is the beginning of the story of eletrospinning.

2
Chapter 1
Later, the development of electrospinning went into a long quiet period. The
process of electrospinning was patented by J.F. Cooley in May 190036
and February
190237
and by W.J. Morton in July 1902.38
In these patents, the conditions to form fibers
rather than droplets by electrospinning are pointed out. (i) Solution must have sufficient
viscosity. (ii) Solvent is volatile enough to allow generation of the solid polymer. (iii)
The intensity of the electric field must be within a certain range.
After that, the development of electrospinning accelerated. In 1914 John Zeleny
began the attempt to mathematically model the behavior of fluids under electrostatic
forces.39-41
In 1934, the electrospinning of polymeric materials was first patented by
Anton Formhals.42
Later, he filed several other patents to produce continuous fine fibers
for use on standard textile machinery.43-46
In 1936, electrospinning from a melt rather
than a solution was patented by C.L. Norton.47
In 1938 Nathalie D. Rozenblum and Igor
V. Petryanov-Sokolov generated electrospun fibers, which were developed into filter
materials known as "Petryanov filters".48
By 1939, this work had led to the establishment
of a factory in Tver' for the manufacture of electrospun smoke filter elements for gas
masks.
Between 1964 and 1969, Geoffrey I. Taylor worked on electrostatics and
contributed to electrospinning by mathematically modeling the shape of the cone formed
by the fluid droplet under the effect of an electric field.49-51
He concluded that the conical
interface between air and the fluid was stable at the semi-angle conical angle of 49.3°,
which is a universal value for conductive fluids. This characteristic droplet shape is now
3
Chapter 1
known as the Taylor cone, which is important as it defines the onset of the
electrospinning process.
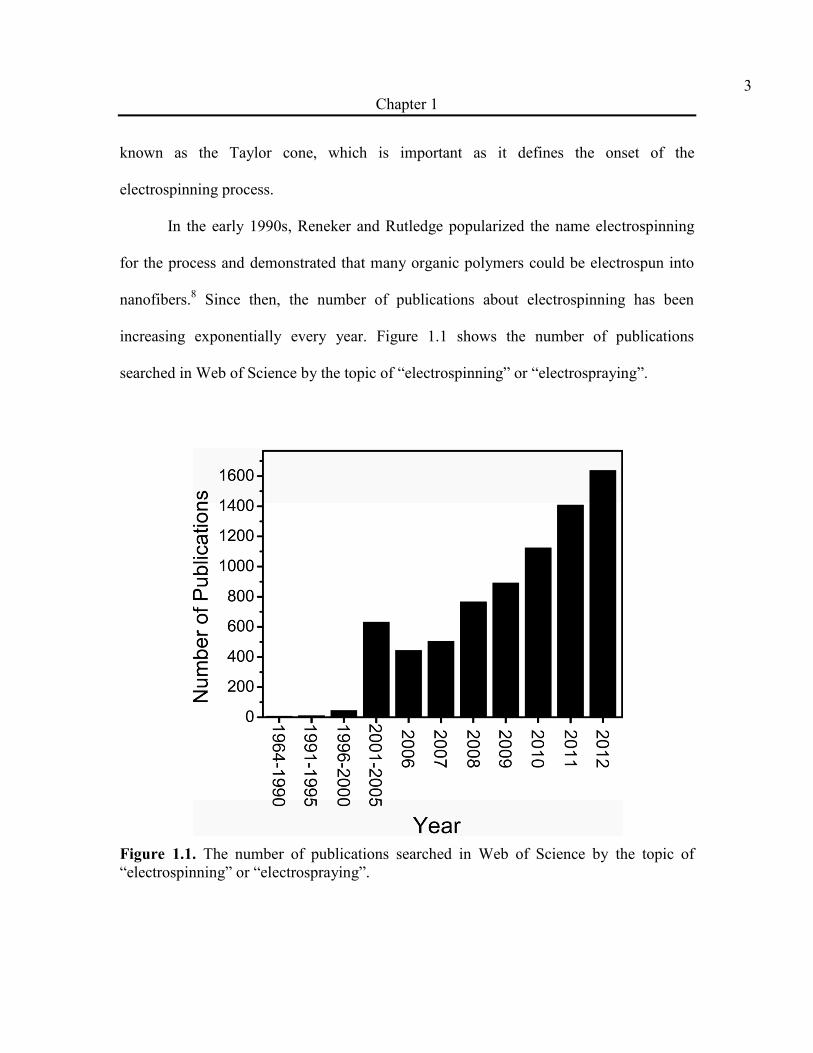
In the early 1990s, Reneker and Rutledge popularized the name electrospinning
for the process and demonstrated that many organic polymers could be electrospun into
nanofibers.8 Since then, the number of publications about electrospinning has been
increasing exponentially every year. Figure 1.1 shows the number of publications
searched in Web of Science by the topic of “electrospinning” or “electrospraying”.
Figure 1.1. The number of publications searched in Web of Science by the topic of
“electrospinning” or “electrospraying”.

4
Chapter 1
The theoretical mechanism of the electrospinning process has also been developed
since 1995. Yarin described the shape of the Taylor cone and the subsequent ejection of a
fluid jet.52, 53
Reneker visualized the real jet trajectory with the help of a high speed
camera resulting in a major breakthrough in the development of the electrospinning
process.54, 55
It offered direct evidence of the mechanisms of electrospinning. Hohman
described the most important instability to the electrospinning process, the bending
(whipping) instability.56
1.2 Theory of Electrospinning
1.2.1 Apparatus of Electrospinning
The standard setup of electrospinning consists of a spinneret, a high-voltage DC
power supply and a grounded collector. Two bar magnets are introduced at the collector
region to obtain aligned fibers by an additional radial Lorenz force in our group, which is
called Magnetic-Field-Assisted Electrospinning.57
1.2.2 Electrospinning Process
When the solution or the melt is injected by the syringe pump at a constant rate,
sessile and pendant droplets would hang on the end of spinneret due to surface tension. If
an electric field is added between the spinneret and the collector, the shape of droplet will
be deformed according to the equilibrium of electric forces and surface tension. When the
5
Chapter 1
intensity of electric field is increased, a conical shape, the so-called Taylor cone, will
form at a critical potential.58
Then a charged fluid jet will be ejected from the tip of the
Taylor cone towards the collector if the electric field continues to be increased. During
the travel process in the air between the spinneret and the collector, the fluid jet is
elongated by electrostatic forces and dried as the solvent is evaporated. Finally, solidified
fibers are obtained at the collector.
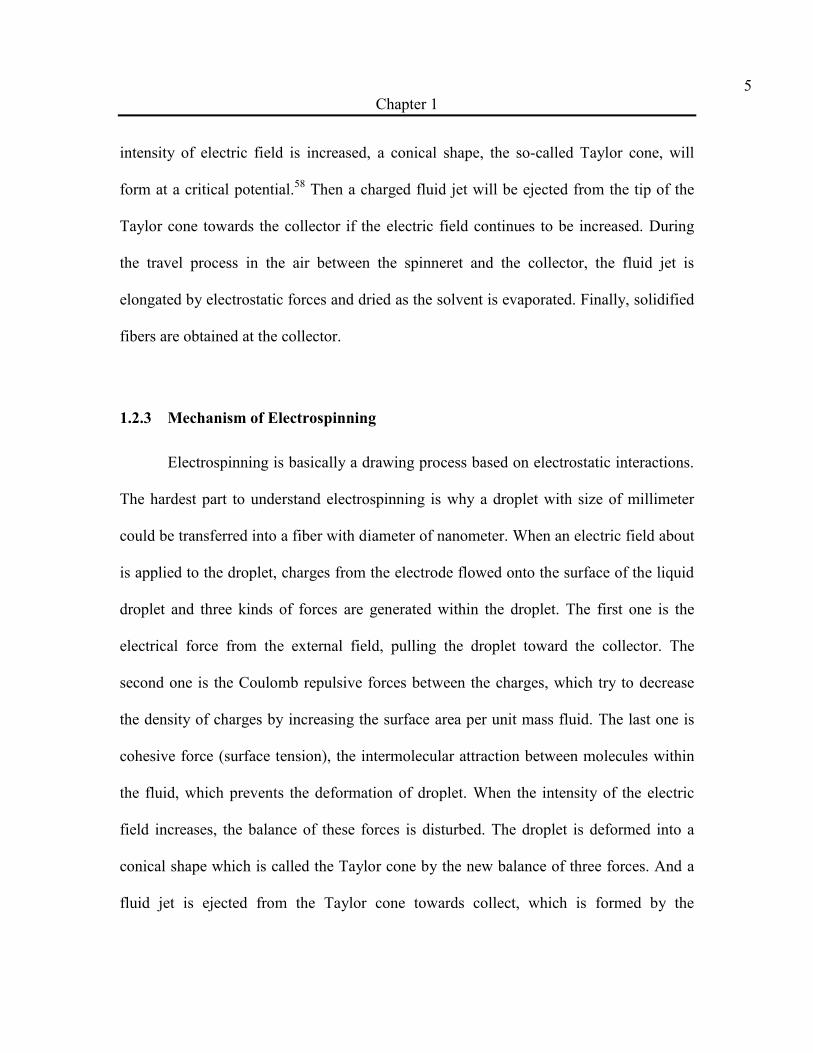
1.2.3 Mechanism of Electrospinning
Electrospinning is basically a drawing process based on electrostatic interactions.
The hardest part to understand electrospinning is why a droplet with size of millimeter
could be transferred into a fiber with diameter of nanometer. When an electric field about
is applied to the droplet, charges from the electrode flowed onto the surface of the liquid
droplet and three kinds of forces are generated within the droplet. The first one is the
electrical force from the external field, pulling the droplet toward the collector. The
second one is the Coulomb repulsive forces between the charges, which try to decrease
the density of charges by increasing the surface area per unit mass fluid. The last one is
cohesive force (surface tension), the intermolecular attraction between molecules within
the fluid, which prevents the deformation of droplet. When the intensity of the electric
field increases, the balance of these forces is disturbed. The droplet is deformed into a
conical shape which is called the Taylor cone by the new balance of three forces. And a
fluid jet is ejected from the Taylor cone towards collect, which is formed by the

6
Chapter 1
combination of the first and second forces. The surface area is increased and electrical
charges are carried away from the droplet by the flowing jet. As long as there are enough
fluid and charges supplied to the droplet, the fluid jet is maintained.
The real jet trajectory offered by a high speed camera shows that the fluid jet is a
straight path at first, but after a short distance, around several millimeters, the straight
path grows into a spiral coil.54, 55
It is called bending instability. And after several turns, a
new electrical bending instability (second bending instability) formed a smaller coil on
the basis of the larger coil. The coils are formed due to the balance of these forces. As the
intensity of charges on the surface of the fluid jet are so high that the coulomb repulsive
force is very large. Take the charge on Scheme 1.1 as an example, the charge on the top
will pull it downward (Fd) heavily and the charge on the bottom will push it upward (Fu)
heavily. It is not a stable status. As a result, the fluid jet bends. Then the force from the
above charge becomes downward and outward (Fdo); and the force from the below charge
becomes upward and outward (Fuo). The direction of result force (Fout) is outward.
Cohesive force prevents the deformation due to the high viscosity of solution and
generates an inward force (Fin). External electrical force pulls it downward, resulting a
downward force (Fdown). The combination of Fout, Fin and Fdown generates a centrifugal
force. So the bend part grows into a three-dimensional coil (Scheme 1.1). The shape
occupied by the spiral path is an envelope cone. As diameter of fluid jet becomes smaller
and smaller due to coulomb repulsive force. Cohesive force decreases and the centrifugal
force increases. So the radius of coils grows larger. The size of the fluid jet shrinks

7
Chapter 1
continuously from the spinneret to the collector until it solidifies. The fiber may be
elongated by 10,000 times from the initial length of the fluid segment.
Scheme 1.1. Schematic illustration of formation of spiral coils.
1.2.4 Important Parameters of Electrospinning
Electrospinning appears to be straightforward, but it is a rather complicated
process which depends on material, technical, and ambient parameters. Only a proper
combination of these parameters would successfully result in uniform fibers.59, 60
Otherwise, a range of other morphologies such as dots,61, 62
break-up, beads63, 64
and
branching65, 66
will show up.

8
Chapter 1
Material parameters include physical properties of target polymer or preceramic
polymer (molecular weight, melting point and glass transition temperature), physical
properties of solvents (boiling point, vapor pressure, surface tension and dielectric
constant), concentration of electrospun materials, surfactant usage and so on. At first, a
target polymer or preceramic polymer with high molecular weight needs to be chosen to
enable enough chain entanglements. If the material is electrospun in the form of melt, its
melting temperature and glass transition temperature will be optimized to obtain uniform
fibers.67, 68
If it is electrospun in the form of solution, a good solvent, either single or
mixed, should be carefully selected.69-71
The solvent should have suitable surface tension
and dielectric constant so that enough ions could be generated on the surface of fluid jet.
In addition, the volatility of solvent should be high to dry the fluid jet during the travel
path, which means the solution should have a low boiling point and a high vapor pressure
at room temperature. The concentration of solution is related to the viscosity of the fluid
jet. The influences of these parameters on the morphology and diameter of electrospun
fibers vary greatly according to the target material. However, some common rules exit.
Usually, the diameter of electrospun fibers would increase if the molecular weight of
target material is enlarged, or if the concentration of the electrospun solution increases.
Adding surfactants or salts to the electrospun solution would eliminate beads and shrink
the size of fibers.72
Technical parameters are consisted of the intensity of the electric field, the
distance between the spinneret and the collector, feeding rate and size of the spinneret.
The most important factor is the intensity of the electric field. Only when it is larger than

9
Chapter 1
the critical potential, fiber can be electrospun. Further increasing the intensity decreases
the diameter of the fiber. In some case, the critical potential is so large that the
conductivity of the electrospun melt or the solution needs to be increased by adding
surfactants or using solvents with high dielectric constant.73, 74
The distance between the
spinneret and the collector should be long enough to dry the fluid jet in the air. Otherwise
wet fibers may fuse together on the collector. In a suitable range, increasing feeding rate
will increase the diameter of the electrospun fiber but the influence is trivial. Excessively
increasing the feeding rate may destroy the equilibrium of electrospinning, leading to
beaded fibers.75-77
Increasing the size of spinneret slightly increase the diameter of
fibers.78, 79
Ambient parameters include temperature, humidity and air velocity. All these
parameters can affect the drying rate of fluid jet, affecting the morphology and size of the
electrospun fibers. Humidity is especially important when water is used as the solvent.
But the influence of humidity is rarely studied. Besides drying rate, temperature may also
affect the crystallinity of fibers.
1.3 Applications of Electrospinning
Electrospun fibers (also called nonwovens) have various applications, such as
template, filler and textile, catalysis, nanofiber reinforcement and medical application.
Electrospun polymeric fibers can be used as templates for the preparation of hollow
fibers.80, 81
Pore structure of nonwovens controls its properties and functions in filter and

10
Chapter 1
textile applications. Nonwovens composed of nanofibers can greatly enhance airflow
resistance of textile.82
As electrospun fibers have high surface area, it is applied to load
monometallic or bimetallic nanoparticles to increase catalyst activity.83, 84
Electrospun
glass fibers, carbon fibers, and poly(p-phenylene terephthalamide) fibers are used for the
reinforcement of synthetic materials in many technical products.85, 86
Electrospun fibers
have also been extensively studied in the medical applications including tissue
engineering,87, 88
transport and release of drugs.89, 90
1.4 Objective and Overview of Thesis
The objective of this dissertation is to fabricate polymeric fiber (poly(vinyl
pyrrolidone)) and ceramic fibers (silicon carbide and niobium-doped titania) by
electrospinning technique. It will study the effect of parameters during electrospinning
process, especially the humidity, on the morphology of electrospun fibers. Some
applications of the electrospun polymeric and ceramic fibers are explored.
Chapter 2 is focused on the preparation of helical peanut-shaped ribbons of
poly(vinyl pyrrolidone) (PVP) and understanding their formation mechanism. The
influences of the relative humidity on the morphology, shape of cross-section and the
ultimate elongation of the electrospun fibers are studied.
Chapter 3 is concentrated on the fabrication of silicon carbide (SiC) fibers by
electrospinning from preceramic polymer without the help of guiding polymer. The
importance of UV Cure on morphology preservation is pointed out.

11
Chapter 1
Chapter 4 and 5 describe a facile method to fabricate niobium-doped titania
supported platinum (Pt@Nb-TiO2) catalyst membrane for oxygen reducing reaction by a
new two-step approach, including electrospinning and atomic layer deposition. Chapter 4
is focus on electrospinning of anatase Nb-TiO2 fiber support and discussing the effect of
fiber morphology, doping amount of niobium, number of ALD cycle and the temperature
of post-treatment on the catalyst activity of Pt@Nb-TiO2. Chapter 5 is focused on the
formation of rutile phase Nb-TiO2 fibers by electrospinning.

12
Chapter 1
1.5 References
1. Vakifahmetoglu, C.;Colombo, P.;Carturan, S. M.;Pippel, E.;Woltersdorf, J.
Growth of One-Dimensional Nanostructures in Porous Polymer-Derived Ceramics by
Catalyst-Assisted Pyrolysis. Part II: Cobalt Catalyst. J. Am. Ceram. Soc. 2010, 93, 3709-
3719.
2. Sreeja, R.;Swaminathan, B.;Painuly, A.;Sebastian, T. V.;Packirisamy, S.
Allylhydridopolycarbosilane (AHPCS) as matrix resin for C/SiC ceramic matrix
composites. Mater. Sci. Eng. B-Adv. Funct. Solid-State Mater. 2010, 168, 204-207.
3. Berbon, M.;Calabrese, M. Effect of 1600 degrees C heat treatment on C/SiC
composites fabricated by polymer infiltration and pyrolysis with
allylhydridopolycarbosilane. J. Am. Ceram. Soc. 2002, 85, 1891-1893.
4. Interrante, L. V.;Jacobs, J. M.;Sherwood, W.;Whitmarsh, C. W., Fuentes,
M.,MartinezEsnaola, J. M.,Daniel, A. M., Eds. Trans Tech Publications: Clausthal
Zellerfe, 1997; Vol. 127-3, pp 271-278.
5. Eick, B.;Youngblood, J. SiC nanofibers by pyrolysis of electrospun preceramic
polymers. J. Mater. Sci. 2009, 44, 160-165.
6. Shanmuganathan, K.;Sankhagowit, R. K.;Iyer, P.;Ellison, C. J. Thiol-Ene
Chemistry: A Greener Approach to Making Chemically and Thermally Stable Fibers.
Chem. Mat. 2011, 23, 4726-4732.
7. Huang, Z. M.;Zhang, Y. Z.;Kotaki, M.;Ramakrishna, S. A review on polymer
nanofibers by electrospinning and their applications in nanocomposites. Compos. Sci.
Technol. 2003, 63, 2223-2253.
8. Doshi, J.;Reneker, D. H. ELECTROSPINNING PROCESS AND
APPLICATIONS OF ELECTROSPUN FIBERS. J. Electrost. 1995, 35, 151-160.
9. Pham, Q. P.;Sharma, U.;Mikos, A. G. Electrospinning of polymeric nanofibers for
tissue engineering applications: A review. Tissue Eng. 2006, 12, 1197-1211.
10. CRC Handbook of Chemistry and Physics. In Fluid Properties [Online];93rd
Edition (Internet Version 2013); Haynes, W. M., Eds.; CRC Press / Taylor and Francis:
Boca Raton, USA, 2013; Section 6. https://z.rochester.edu/zimbra/#3 (accessed January 1,
2013).
11. Zhang, C. L.;Lv, K. P.;Hu, N. Y.;Yu, L.;Ren, X. F.;Liu, S. L.;Yu, S. H.
Macroscopic-Scale Alignment of Ultralong Ag Nanowires in Polymer Nanofiber Mat and
Their Hierarchical Structures by Magnetic-Field-Assisted Electrospinning. Small 2012, 8,
2936-2940.
12. Campostrini, R.;Ischia, M.;Palmisano, L. Pyrolysis study of sol-gel derived TiO2
powders - Part III. TiO2-anatase prepared by reacting titanium(IV) isopropoxide with
acetic acid. J. Therm. Anal. Calorim. 2004, 75, 13-24.

13
Chapter 1
13. Campostrini, R.;Ischia, M.;Palmisano, L. Pyrolysis study of sol-gel derived TiO2
powders - Part I. TiO2-anatase prepared by reacting titanium(IV) isopropoxide with
formic acid. J. Therm. Anal. Calorim. 2003, 71, 997-1009.
14. Yang, W. Y.;Gao, F. M.;Fan, Y.;An, L. N. Al-Doped Single-Crystalline SiC
Nanowires Synthesized by Pyrolysis of Polymer Precursors. J. Nanosci. Nanotechnol.
2010, 10, 4729-4732.
15. Vakifahmetoglu, C.;Pippel, E.;Woltersdorf, J.;Colombo, P. Growth of One-
Dimensional Nanostructures in Porous Polymer-Derived Ceramics by Catalyst-Assisted
Pyrolysis. Part I: Iron Catalyst. J. Am. Ceram. Soc. 2010, 93, 959-968.
16. Delavari, H.;Kokabi, M. SILICON CARBIDE NANOWIRES FROM
POLYVINYL ALCOHOL/SILICA ELECTROSPUN NANOFIBERS. Nano 2011, 6, 41-
45.
17. Choi, S. H.;Youn, D. Y.;Jo, S. M.;Oh, S. G.;Kim, I. D. Micelle-Mediated
Synthesis of Single-Crystalline beta(3C)-SiC Fibers via Emulsion Electrospinning. ACS
Appl. Mater. Interfaces 2011, 3, 1385-1389.
18. Liu, H. A.;Balkus, K. J. Electrospinning of beta silicon carbide nanofibers. Mater.
Lett. 2009, 63, 2361-2364.
19. Vakifahmetoglu, C. Fabrication and properties of ceramic 1D nanostructures from
preceramic polymers: a review. Adv. Appl. Ceram. 2011, 110, 188-204.
20. Kim, B. H.;Kim, C. H.;Yang, K. S.;Kim, K. Y.;Lee, Y. J. SiC/SiO2 coating for
improving the oxidation resistive property of carbon nanofiber. Appl. Surf. Sci. 2010, 257,
1607-1611.
21. Li, J. Y.;Zhang, Y. F.;Zhong, X. H.;Yang, K. Y.;Meng, J.;Cao, X. Q. Single-
crystalline nanowires of SiC synthesized by carbothermal reduction of electrospun
PVP/TEOS composite fibres. Nanotechnology 2007, 18.
22. Takeda, M.;Imai, Y.;Ichikawa, H.;Kasai, N.;Seguchi, T.;Okamura, K. Thermal
stability of SiC fiber prepared by an irradiation-curing process. Compos. Sci. Technol.
1999, 59, 793-799.
23. Lu, X. F.;Wang, C.;Wei, Y. One-Dimensional Composite Nanomaterials:
Synthesis by Electrospinning and Their Applications. Small 2009, 5, 2349-2370.
24. Bhardwaj, N.;Kundu, S. C. Electrospinning: A fascinating fiber fabrication
technique. Biotechnol. Adv. 2010, 28, 325-347.
25. Min, B. M.;Lee, G.;Kim, S. H.;Nam, Y. S.;Lee, T. S.;Park, W. H. Electrospinning
of silk fibroin nanofibers and its effect on the adhesion and spreading of normal human
keratinocytes and fibroblasts in vitro. Biomaterials 2004, 25, 1289-1297.
26. Zhang, Y. Z.;Venugopal, J.;Huang, Z. M.;Lim, C. T.;Ramakrishna, S.
Characterization of the surface biocompatibility of the electrospun PCL-collagen
nanofibers using fibroblasts. Biomacromolecules 2005, 6, 2583-2589.
27. Megelski, S.;Stephens, J. S.;Chase, D. B.;Rabolt, J. F. Micro- and nanostructured
surface morphology on electrospun polymer fibers. Macromolecules 2002, 35, 8456-8466.
28. Badami, A. S.;Kreke, M. R.;Thompson, M. S.;Riffle, J. S.;Goldstein, A. S. Effect
of fiber diameter on spreading, proliferation, and differentiation of osteoblastic cells on
electrospun poly(lactic acid) substrates. Biomaterials 2006, 27, 596-606.

14
Chapter 1
29. Goldberg, M.;Langer, R.;Jia, X. Q. Nanostructured materials for applications in
drug delivery and tissue engineering. J. Biomater. Sci.-Polym. Ed. 2007, 18, 241-268.
30. Agarwal, S.;Wendorff, J. H.;Greiner, A. Use of electrospinning technique for
biomedical applications. Polymer 2008, 49, 5603-5621.
31. Xie, J. W.;Liu, W. Y.;MacEwan, M. R.;Yeh, Y. C.;Thomopoulos, S.;Xia, Y. N.
Nanofiber Membranes with Controllable Microwells and Structural Cues and Their Use
in Forming Cell Microarrays and Neuronal Networks. Small 2011, 7, 293-297.
32. Liu, Y. Y.;Sun, Y.;Yan, H.;Liu, X. Y.;Zhang, W.;Wang, Z.;Jiang, X. Y.
Electrospun Fiber Template for Replica Molding of Microtopographical Neural Growth
Guidance. Small 2012, 8, 676-681.
33. Yang, F.;Murugan, R.;Wang, S.;Ramakrishna, S. Electrospinning of nano/micro
scale poly(L-lactic acid) aligned fibers and their potential in neural tissue engineering.
Biomaterials 2005, 26, 2603-2610.
34. Bhaskar, S.;Pollock, K. M.;Yoshida, M.;Lahann, J. Towards Designer
Microparticles: Simultaneous Control of Anisotropy, Shape, and Size. Small 2010, 6,
404-411.
35. Gilbert, W. De Magnete Magnetcisque Corporibus, et de Magno Magnete Tellure
(On the Magnet, Magnetick Bodies also, and on the Great Magnet the Earth; a new
Physiology, demonstrated by many arguments & Experiments). In Price, D., Eds.; The
Chiswick Press: London, 1600.
36. Cooley, J. F. Improved methods of and apparatus for electrically separating the
relatively volatile liquid component from the component of relatively fixed substances of
composite fluids. GB 06385, 1900.
37. Cooley, J. F. Apparatus for electrically dispersing fluids. US 692631, 1902.
38. Morton, W. J. Method of dispersing fluids. US 0705691, 1902.
39. Zeleny, J. The electrical discharge from liquid points, and a hydrostatic method of
measuring the electric intensity at their surfaces. Phys. Rev. 1914, 3, 69-91.
40. Zeleny, J. Electrical discharges from pointed conductors. Phys. Rev. 1920, 16,
102-125.
41. Zeleny, J. The role of surface instability in electrical discharges from drops of
alcohol and water in air at atmospheric pressure. J. Frankl. Inst. 1935, 219, 659-675.
42. Formhals, A. Process and Apparatus for Preparing Artificial Threads. US
1975504, 1934.
43. Formhals, A. Artificial Fibre Construction. US 2109333, 1938.
44. Formhals, A. Method of Producing Artificial Fibres. US 2158415, 1939.
45. Formhals, A. Production of Artificial Fibres From Fiber Forming Liquids. US
2323025, 1943.
46. Formhals, A. Method and Apparatus for Spinning. US 2349950, 1944.
47. Norton, C. L. Method and apparatus for producing fibrous or filamentary material.
US 2048651, 1936.
48. Ogorodnikov, B. I. On the 100th anniversary of the birth of Igor' Vasil'evich
Petryanov-Sokolov. Colloid J. 2007, 69, 396-398.

15
Chapter 1
49. Taylor, G. DISINTEGRATION OF WATER DROPS IN ELECTRIC FIELD.
Proceedings of the Royal Society of London Series a-Mathematical and Physical
Sciences 1964, 280, 383-397.
50. Taylor, G. FORCE EXERTED BY AN ELECTRIC FIELD ON A LONG
CYLINDRICAL CONDUCTOR. Proceedings of the Royal Society of London Series a-
Mathematical and Physical Sciences 1966, 291, 145-158.
51. Taylor, G. ELECTRICALLY DRIVEN JETS. Proceedings of the Royal Society
of London Series a-Mathematical and Physical Sciences 1969, 313, 453-475.
52. Reznik, S. N.;Yarin, A. L.;Theron, A.;Zussman, E. Transient and steady shapes of
droplets attached to a surface in a strong electric field. J. Fluid Mech. 2004, 516, 349-377.
53. Yarin, A. L.;Koombhongse, S.;Reneker, D. H. Taylor cone and jetting from liquid
droplets in electrospinning of nanofibers. J. Appl. Phys. 2001, 90, 4836-4846.
54. Reneker, D. H.;Yarin, A. L. Electrospinning jets and polymer nanofibers.
Polymer 2008, 49, 2387-2425.
55. Reneker, D. H.;Yarin, A. L.;Fong, H.;Koombhongse, S. Bending instability of
electrically charged liquid jets of polymer solutions in electrospinning. J. Appl. Phys.
2000, 87, 4531-4547.
56. Hohman, M. M.;Shin, M.;Rutledge, G.;Brenner, M. P. Electrospinning and
electrically forced jets. I. Stability theory. Phys. Fluids 2001, 13, 2201-2220.
57. Liu, Y. Q.;Zhang, X. P.;Xia, Y. N.;Yang, H. Magnetic-Field-Assisted
Electrospinning of Aligned Straight and Wavy Polymeric Nanofibers. Adv. Mater. 2010,
22, 2454-2457.
58. Kim, C. H.;Jung, Y. H.;Kim, H. Y.;Lee, D. R.;Dharmaraj, N.;Choi, K. E. Effect
of collector temperature on the porous structure of electrospun fibers. Macromol. Res.
2006, 14, 59-65.
59. Tan, M.;Wang, G. Z.;Zhang, L. Thermal desorption in nanocrystalline TiO2. J.
Appl. Phys. 1996, 80, 1186-1189.
60. Chrysicopoulou, P.;Davazoglou, D.;Trapalis, C.;Kordas, G. Optical properties of
very thin (< 100nm) sol-gel TiO2 films. Thin Solid Films 1998, 323, 188-193.
61. Aarik, J.;Aidla, A.;Sammelselg, V.;Uustare, T. Effect of growth conditions on
formation of TiO2-II thin films in atomic layer deposition process. J. Cryst. Growth 1997,
181, 259-264.
62. Murugavel, P.;Kalaiselvam, M.;Raju, A. R.;Rao, C. N. R. Sub-micrometre
spherical particles of TiO2, ZrO2, and PZT by nebulized spray pyrolysis of metal-organic
precursors. J. Mater. Chem. 1997, 7, 1433-1438.
63. Fujishima, A.;Honda, K. ELECTROCHEMICAL PHOTOLYSIS OF WATER
AT A SEMICONDUCTOR ELECTRODE. Nature 1972, 238, 37-+.
64. Huang, S. Y.;Ganesan, P.;Popov, B. N. Electrocatalytic activity and stability of
niobium-doped titanium oxide supported platinum catalyst for polymer electrolyte
membrane fuel cells. Appl. Catal. B-Environ. 2010, 96, 224-231.
65. Guerin, D.;Shah, S. I. Reactive-sputtering of titanium oxide thin films. J. Vac. Sci.
Technol. A-Vac. Surf. Films 1997, 15, 712-715.
16
Chapter 1
66. Gao, Y.;Liang, Y.;Chambers, S. A. Thermal stability and the role of oxygen
vacancy defects in strong metal support interaction - Pt on Nb-doped TiO2(100). Surf. Sci.
1996, 365, 638-648.
67. Ding, B.;Kim, C. K.;Kim, H. Y.;Se, M. K.;Park, S. J. Titanium dioxide nanoribers
prepared by using electrospinning method. Fiber. Polym. 2004, 5, 105-109.
68. Leroux, F.;Dewar, P. J.;Intissar, M.;Ouvrard, G.;Nazar, L. F. Study of the
formation of mesoporous titania via a template approach and of subsequent Li insertion. J.
Mater. Chem. 2002, 12, 3245-3253.
69. Chhina, H.;Susac, D.;Campbell, S.;Kesler, O. Transmission Electron Microscope
Observation of Pt Deposited on Nb-Doped Titania. Electrochem. Solid State Lett. 2009,
12, B97-B100.
70. Gratzel, M. Photoelectrochemical cells. Nature 2001, 414, 338-344.
71. Lee, Y. H.;Chan, K. K.;Brady, M. J. PLASMA-ENHANCED CHEMICAL-
VAPOR-DEPOSITION OF TIO2 IN MICROWAVE-RADIO FREQUENCY HYBRID
PLASMA REACTOR. J. Vac. Sci. Technol. A-Vac. Surf. Films 1995, 13, 596-601.
72. Aarik, J.;Aidla, A.;Uustare, T. Atomic-layer growth of TiO2-II thin films. Philos.
Mag. Lett. 1996, 73, 115-119.
73. Samatham, R.;Kim, K. J. Electric current as a control variable in the
electrospinning process. Polym. Eng. Sci. 2006, 46, 954-959.
74. Thompson, C. J.;Chase, G. G.;Yarin, A. L.;Reneker, D. H. Effects of parameters
on nanofiber diameter determined from electrospinning model. Polymer 2007, 48, 6913-
6922.
75. Detta, N.;Brown, T. D.;Edin, F. K.;Albrecht, K.;Chiellini, F.;Chiellini, E.;Dalton,
P. D.;Hutmacher, D. W. Melt electrospinning of polycaprolactone and its blends with
poly(ethylene glycol). Polym. Int. 2010, 59, 1558-1562.
76. Fallahi, D.;Rafizadeh, M.;Mohammadi, N.;Vahidi, B. Effect of applied voltage on
jet electric current and flow rate in electrospinning of polyacrylonitrile solutions. Polym.
Int. 2008, 57, 1363-1368.
77. Tong, H. W.;Wang, M. Electrospinning of Poly(Hydroxybutyrate-co-
hydroxyvalerate) Fibrous Scaffolds for Tissue Engineering Applications: Effects of
Electrospinning Parameters and Solution Properties. J. Macromol. Sci. Part B-Phys. 2011,
50, 1535-1558.
78. Chang, J. J.;Lee, Y. H.;Wu, M. H.;Yang, M. C.;Chien, C. T. Preparation of
electrospun alginate fibers with chitosan sheath. Carbohydr. Polym. 2012, 87, 2357-2361.
79. Zhou, F. L.;Gong, R. H.;Porat, I. Three-jet electrospinning using a flat spinneret.
J. Mater. Sci. 2009, 44, 5501-5508.
80. Rao, K. N.;Mohan, S. OPTICAL-PROPERTIES OF ELECTRON-BEAM
EVAPORATED TIO2 FILMS DEPOSITED IN AN IONIZED OXYGEN MEDIUM. J.
Vac. Sci. Technol. A-Vac. Surf. Films 1990, 8, 3260-3264.
81. Georgson, M.;Roos, A.;Ribbing, C. G. THE INFLUENCE OF PREPARATION
CONDITIONS ON THE OPTICAL-PROPERTIES OF TITANIUM NITRIDE BASED
SOLAR CONTROL FILMS. J. Vac. Sci. Technol. A-Vac. Surf. Films 1991, 9, 2191-2195.

17
Chapter 1
82. Jin, Y. S.;Choi, H. W. Properties of Dye-Sensitized Solar Cells with TiO2
Passivating Layers Prepared by Electron-Beam Evaporation. J. Nanosci. Nanotechnol.
2012, 12, 662-667.
83. Hajkova, P.;Spatenka, P.;Krumeich, J.;Exnar, P.;Kolouch, A.;Matousek, J.;Koci,
P. Antibacterial effect of silver modified TiO2/PECVD films. Eur. Phys. J. D 2009, 54,
189-193.
84. Sirghi, L.;Nakamura, M.;Hatanaka, Y.;Takai, O. Atomic force microscopy study
of the hydrophilicity of TiO2 thin films obtained by radio frequency magnetron
sputtering and plasma enhanced chemical vapor depositions. Langmuir 2001, 17, 8199-
8203.
85. Li, X. Y.;Xiao, J. R.;Wang, Z. Y.;Li, S. W. Structural and magnetic properties of
Mn:TiO2 films grown by plasma-assisted molecular beam epitaxy. Mater. Sci. Eng. B-
Adv. Funct. Solid-State Mater. 2012, 177, 869-872.
86. Weng, X.;Fisher, P.;Skowronski, M.;Salvador, P. A.;Maksimovc, O. Structural
characterization of TiO2 films grown on LaAlO3 and SrTiO3 substrates using reactive
molecular beam epitaxy. J. Cryst. Growth 2008, 310, 545-550.
87. Son, W. K.;Cho, D.;Park, W. H. Direct electrospinning of ultrafine titania fibres
in the absence of polymer additives and formation of pure anatase titania fibres at low
temperature. Nanotechnology 2006, 17, 439-443.
88. Ahmad, A.;Buzby, S.;Ni, C.;Shah, S. I. Effect of Nb and Sc doping on the phase
transformation of sol-gel processed TiO2 nanoparticles. J. Nanosci. Nanotechnol. 2008, 8,
2410-2418.
89. Park, J. Y.;Lee, I. H. Characterization and Morphology of Prepared Titanium
Dioxide Nanofibers by Electrospinning. J. Nanosci. Nanotechnol. 2010, 10, 3402-3405.
90. Zhao, B. T.;Cai, R.;Jiang, S. M.;Sha, Y. J.;Shao, Z. P. Highly flexible self-
standing film electrode composed of mesoporous rutile TiO2/C nanofibers for lithium-ion
batteries. Electrochim. Acta 2012, 85, 636-643.

18
Chapter 2
Chapter 2 Helical Peanut-Shaped Poly(Vinyl Pyrrolidone)
Ribbons Generated by Electrospinning
2.1 Introduction
Electrospinning is a facile and versatile method to fabricate nanometer (nm)- and
submicron-sized fibers for a range of applications.1-5
Electrospun fibers have been shown
to be useful for tissue engineering, especially in those areas where guided growth of cells
is important.6-10
The morphology may play important roles in determining the function of
materials made of electrospun fibers.11-16
Straight round-shaped fibers are the most
commonly observed, with a few exception that helical fibers with different shapes in
cross-section are made, although detailed studies on the factors that affect fiber
morphologies have hardly been reported.
A rare example for the formation of fibers with non-circular cross-section is based
on thin polymer skins.17
Circular tube made of thin polymer layers collapsed under
atmospheric pressure to form elliptical or flat shape as the solvent evaporated. For helical
ribbons, however, there are even fewer examples and no clear understanding on the mode
of formation to date. It was observed that this morphology was the result of particular
types of polymers and solvents;18-19
or formed in a narrow range of polymer
concentration.20
The spirals were attributed to the difference in the azimuthal angles of
those planes of collapsing segments.17
Different solvent evaporation rates in the mixture
were also important to the formation of spirals observed in poly(4-methyl-1-pentene)

19
Chapter 2
fibers.21-23
The lack of a convincing mechanism for the formation of helical ribbons in
part is due to the fact that there is no reliable method to control the degree of spirals in
the spun fibers. In this article, we describe the preparation of helical peanut-shaped PVP
ribbons by magnetic-field-assisted electrospinning (MFAE) method. We show that extent
of the spiral and shape of the fiber cross-section can be well controlled through adjusting
the relative humidity of the environments. We offer our understanding on the effect of
relative humidity on the fiber morphology, which is an important but often overlooked
factor in the electrospinning process.
2.2 Experimental Section
Electrospinning of Poly(Vinyl Pyrrolidone) (PVP) Fibers. The magnetic-field-
assisted electrospinning (MFAE) method was used to prepare PVP fibers.24
Typically,
PVP (molecular weight: 1300 kg mol-1
, Sigma-Aldrich) was dissolved in a mixture of
anhydrous ethyl alcohol and de-ionized (DI) water to form a polymer solution at various
concentration. Normally the concentration of 13% (w/v) was used. The volumetric ratio
of ethyl alcohol to water was kept at 4:1 unless indicated otherwise. The polymer solution
was loaded into a plastic syringe with an 18-Gauge (inner diameter: 0.033 inch) stainless-
steel needle if not indicated specifically. The sharp tip of the needle was cut and sanded
into smooth circular, flat opening to ensure the proper direction of fluid jets. The needle
was connected to a high-voltage power supply and the collector was grounded and 8 cm
below the needle tip. The voltage between the needle and the collector was maintained at

20
Chapter 2
15 kV. The feeding rate was controlled by a syringe pump at a constant rate of 1 mL/h.
The humidity of the environment was adjusted by a humidifier in an enclosed space and
monitored by a digital hygrometer during the electrospinning process.
Characterization. The morphology of the fibers was studied by Field Emission
Scanning Electron Microscopy (FE-SEM, Zeiss-Leo DSM982) and Field Emission
Transmission Electron Microscopy (FE-TEM, FEI TECNAI F-20). Average diameter
was measured by Image J (National Institutes of Health, USA). Thermal Mechanical
Analyzer (TMA, Pyris Diamond, Perkin Elmer) was used to study the mechanical
property of PVP fibers made under different relative humidity. A bundle of aligned PVP
fibers were fixed by two small chucks and then loaded onto TMA. An extension force
was exerted on the two chucks at a constant rate of 15 mN/min until the fibers were
fractured. Load and fiber extension were recorded and used to calculate the ultimate
elongation.
2.3 Results and Discussion
2.3.1 Formation of Helical Ribbons
Morphology of electrospun polymer fibers was observed to be depended heavily
on humidity of the environment. When the relative humidity of the environment was
~16%, helical ribbons were obtained (Figure 2.1). These fibers were made of PVP from
its ethyl alcohol and de-ionized (DI) water solution. The fibers were uniform; and their
cross-section had a peanut shape with a typical width of 1.4 µm and a height of 430 nm

21
Chapter 2
(Figure 2.1B). Noticeably, such fiber had a thin skin layer of 30 - 100 nm in thickness.
Because of this unique morphology, the fiber formed spirals along its longitude direction
(Figure 2.1C). Overall, the surface of these helical ribbons was fairly smooth.
Figure 2.1. (A, B) SEM images and (C, D) TEM micrographs of PVP fibers made at a
relative humidity of 16%.
The formation of helical ribbons should be closely related to the electrospinning
process (Scheme 2.1). When an electric field is applied between a spinneret and a

22
Chapter 2
collector, charges are generated on the surface of the polymer solution droplet, which
hang on the tip of the spinneret due to surface tension. If the static force surpasses the
surface tension, a Taylor cone forms and a fluid jet is ejected and travels to the collector.
The longitudinal stress caused by the external electric field stabilizes the straight jet to a
certain distance. Then the internal repulsive forces between the adjacent segments, which
carry the same charges, generate the bending instability and turn the straight path into a
spiral caused by the Coulomb repulsive forces.25-28
The subsequent bending instability
generates new and size-reduced spirals on the existing ones until the fluid jet reaches the
collector and dries.25, 29
Previously, buckled fibers were made based on this principle.30
Similar helical fibers were observed in this polymer system (Figure 2.2), suggesting small
spirals were formed due to the second or third bending instability during the
electrospinning process. With the MFAES method, aligned fibers could be formed and
suspended over the gap between two magnets under Lorentz force.24, 31
This additional
force could alter the direction of the fluid jet and pull the two ends of small spirals to
align them over the gap. If the polymer has enough rigidity, the jet cannot fully relax but
retain the spiral feature while being pulled by the Lorentz force, leading to the formation
of helical ribbons (Scheme 2.1). In another word, the uniformity of helical ribbons is
attributed to such interaction. In the followings, we further discuss the effect of humidity
on the morphology of helical ribbons, which could not completely be explained based on
the existing theory.17

23
Chapter 2
Scheme 2.1. Schematic illustration of formation process of helical ribbons.
Figure 2.2. SEM images of helical fibers collected on the top of magnets.

24
Chapter 2
2.3.2 Effect of the Relative Humidity on the Fiber Morphology
The humidity played an important role in controlling the morphology of the
electrospun PVP fibers. When the relative humidity of the environment changed from
32% to 16%, the morphology of spun PVP fibers changed from straight round fibers to
helical ribbons, and the percentage of helical ribbons also increased (Figure 2.3). The
electrospun jets of PVP solution formed straight round fibers or flat ribbons when the
relative humidity of the environment was in the range between 26% and 32% (Figure
2.3.A-C). At the relative humidity of 23-24%, helical ribbons began to show up in the
samples made using an 18-Gauge needle (inner diameter: 0.033 inch) (Figure 2.3.D).
When relative humidity further decreased, percentage of helical ribbons increased (Figure
2.3.E-H). The observed changes of fiber morphology at different humidity and the size of
fibers were summarized in Table 2.1. The same trend of morphological transformation
was observed even when the inner diameter of the needle decreased from 0.033 to 0.024
inch (20-Gauge). However, the transition from one kind of morphology to another tended
to be at lower relative humidity for 20-G needle (Table 2.1).

25
Chapter 2
Figure 2.3. SEM images of PVP fibers made at different relative humidity of the
environment: (A) 31-32%, (B) 28-29%, (C) 26-27%, (D) 23-24%, (E) 22%, (F) 21%, (G)
18%, and (H) 16%, respectively.
Table 2.1. Summary of morphology and diameter (nm) of electrospun PVP fibers made
using 18-G and 20-G needles under different relative humidity.
Humidity
Needle
Size
31-32% 28-29% 26-27% 23-24% 22% 21% 18% 16%
18 Gauge □/○
887
□/○
1322
□/○
1387 ※□ ※ ※※ ※※※ ※※※
20 Gauge □/○
768
□/○
933
□/○
1266
□
1495 ※□ ※ ※※※ ※※※
※※※: strongly helical peanut-shaped ribbons, the percentage of helical ribbons > 90%
※※: mildly helical peanut-shaped ribbons, the percentage of helical ribbons ~60%
※: weakly helical peanut-shaped ribbons, the percentage of helical ribbons ~30%
※□: helical peanut-shaped ribbons and flat ribbons, the percentage of helical ribbons ~10%
□/○: flat ribbons or straight round fibers
□: flat ribbons
○: straight round fibers

26
Chapter 2
There were two possible reasons for this observed trend. First, small spirals
formed due to the existence of higher order bending instability, when the relative
humidity decreased. When the relative humidity decreased, fibers dried relatively faster.
The characteristic charge relaxation time, that is the period required for the excess
charged toward to the equilibrium position on the surface of a fluid jet, increased because
charges travelled at a reduced rate in solid than in liquid.29
If the characteristic charge
relaxation time increased, there should be additional charges on the surface of a fluid jet.
Therefore, the bending instability occurred readily. In the case where the distance
between the spinneret and the collector was kept constant, characteristic charge relaxation
time increased, resulting in a shortened straight path and increased subsequent bending
instability. Hence, small spirals formed easily when the relative humidity was low.
Second, a fluid jet became rigid if the relative humidity was lowered. Under fast drying
rate of the fluid jet, fibers turned rigid and resisted to further relaxation. As a result, fibers
tent to maintain the spiral morphology under the influence of Lorentz force. Collectively,
these factors caused the ribbons to spiral when the relative humidity was low. Thus, the
percentage of the helical ribbons increased from 0% to 99%, when the relative humidity
decreased from 32% to 16% (Figure 2.4). When the size of spinneret decreased from
0.033 (18-G) to 0.024 inch (20-G), the size of the droplet hang on the tip of spinneret
decreased, which was exposed to the environment, resulting in a slower drying rate of the

27
Chapter 2
fluid jet. As a result, the transition from straight round fiber to helical ribbon became
slower.
Figure 2.4. Dependence of the percentage of helical ribbons on the relative humidity.
The electrospinning was carried out with an 18-Gauge and 20-Gauge needle.
2.3.3 Effect of the Relative Humidity on the Cross-section Shape
The cross-section of the fibers changed continuously from circle, to ellipse, and to
peanut shape when relative humidity of the environment decreased from 32% to 16%
(Figure 2.5). At the relative humidity between 23% and 32%, the cross-section had a
round or elliptical shape. When the relative humidity decreased to 22%, rectangular and

28
Chapter 2
peanut-shaped cross-sections formed. PVP fibers obtained at a relative humidity of 28%
had an elliptical cross-section with the transverse diameter of around 570 nm and the
conjugate diameter of around 315 nm (Figure 2.5A). PVP fibers with a circular cross-
section could still be observed at a relative humidity of 23%, but their diameters were
relatively large and ~2 µm (Figure 2.5B). A rectangular cross-section appeared at a
relative humidity of 22% as shown in the SEM image of the side view of a fiber (Figure
2.5C). The width of rectangle for this particular fiber was ~460 nm. Peanut-shaped cross-
section could be observed for fibers made at a relative humidity of 16% (Figure 2.5D).
29
Chapter 2
Figure 2.5. SEM images of the cross-section or side-view of PVP fibers generated at
different relative humidity of the environment: (A) 28%, (B) 23%, (C) 22%, and (D) 16%,
respectively.
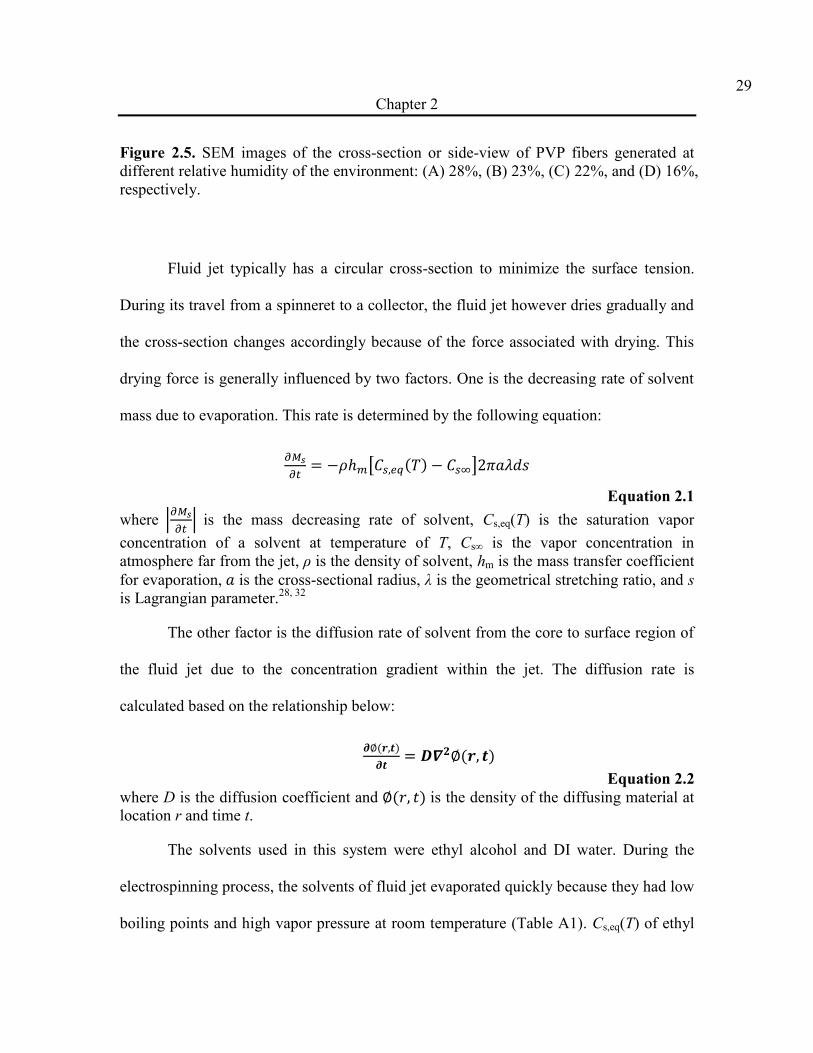
Fluid jet typically has a circular cross-section to minimize the surface tension.
During its travel from a spinneret to a collector, the fluid jet however dries gradually and
the cross-section changes accordingly because of the force associated with drying. This
drying force is generally influenced by two factors. One is the decreasing rate of solvent
mass due to evaporation. This rate is determined by the following equation:
Equation 2.1
where
is the mass decreasing rate of solvent, Cs,eq(T) is the saturation vapor
concentration of a solvent at temperature of T, Cs∞ is the vapor concentration in
atmosphere far from the jet, ρ is the density of solvent, hm is the mass transfer coefficient
for evaporation, is the cross-sectional radius, λ is the geometrical stretching ratio, and s
is Lagrangian parameter.28, 32
The other factor is the diffusion rate of solvent from the core to surface region of
the fluid jet due to the concentration gradient within the jet. The diffusion rate is
calculated based on the relationship below:
Equation 2.2
where D is the diffusion coefficient and is the density of the diffusing material at
location r and time t.
The solvents used in this system were ethyl alcohol and DI water. During the
electrospinning process, the solvents of fluid jet evaporated quickly because they had low
boiling points and high vapor pressure at room temperature (Table A1). Cs,eq(T) of ethyl

30
Chapter 2
alcohol and water remained unchanged because all the experiments were carried out at
the same temperature. Cs∞ of water was proportional to the relative humidity of the
environment. Its value decreased as relative humidity decreased. As a result, the mass
decreasing rate of water,
, increased according to the Equation 2.1 when the relative
humidity decreased. Assuming the diffusion rates of the solvents were the same, the
decreasing rate of solvent mass should be smaller than or almost the same as the diffusion
rate when relative humidity was high, as illustrated in Scheme 2.2. Thus, solvent in the
fluid jet evaporated in all directions to the environment evenly and the circular cross-
section maintained upon the drying of the fluid jet (Scheme 2.2A). If the relative
humidity was low, the decreasing rate of solvent mass was larger than the diffusion rate.
The outer shell of the fluid jet was dried firstly to form a thin polymer skin (Scheme
2.2B).17
As the solvent continuously evaporated and diffused outwards, the inner pressure
inside the polymer shell decreased and could not be balanced by the outward one. As a
result, the pressure was imposed on the polymer skin in all directions. If the round fluid
jet collapsed along any given direction, the charges were no longer distributed evenly but
flowed to the surface regions with high curvature due to the point effect.17
The pressure
from the environment continued to push the polymer skin until the fluid jet was
completely dried. Under such situation, an elliptical or rectangular cross-section was
obtained (Scheme 2.2B).

31
Chapter 2
Scheme 2.2. Schematic illustration of the formation of electrospun polymeric fibers with
different shapes in cross-section.

32
Chapter 2
If the relative humidity dropped below 22%, the decreasing rate of solvent mass
became fast, resulting in various pores in the wall of the semi-dried fluid jet due to rapid
drying, which generated a capillary force. When a liquid is transported in a porous media,
the cumulative volume V of absorbed liquid after a time t is , where A is cross-
sectional area of the pores and S is the sorptivity of the medium. The transportation rate is
related to the sorptivity of the porous media, which is a constant. When the humidity
decreased, the density of pores increased due to the quick shrinking of polymers, which
caused by the increase of the mass decreasing rate. Then the diffusion rate increased due
to the capillary force, and it increased with the density of pores. As a consequence, the
overall drying rate of the fluid jet greatly increased with the decrease of the relative
humidity. Once the fluid jet was dried, the fibers became rigid and could no longer be
deformed by the atmospheric pressure. Since the charges on the surface of fluid jet
concentrated at the two side regions with high curvature, two circular shapes formed
around those regions due to the charge repulsion. As a result, a peanut-shaped cross-
section formed (Scheme 2.2C).
The diameter of the polymeric fibers or width of the ribbons could be controlled
by changing the relative humidity. As the relative humidity decreased, the diameter or
width increased (data are summarized in Table 2.1). Two main factors could attribute to
this observed trend. Firstly, when the relative humidity was high (in the situation of
Scheme 2.2A), the fluid jet dried uniformly and slowly. If the relative humidity increased,
33
Chapter 2
fluid jet dried slower. Coulomb repulsive force could cause the elongation of the fibers
during a relative longer period, thus reduced the size in fiber diameter. Secondly, when
the relative humidity was low (in the situation of Scheme 2.2B), the size of fibers were
controlled by the synergistic interaction between the mass decreasing rate and diffusion
rate of the solvents. If the mass decreasing rate was slightly larger than the diffusion rate
and the fluid jet collapsed slightly before it was dried completely, resulting in narrow
width. If the humidity was further decreased, the decreasing rate was much larger than
the diffusion rate. The fluid jet spread outwards further before it was totally dried. As a
result, the width increased.
2.3.4 Effect of Solvents on the Fiber Morphology
To further explore this concept, the volumetric ratio of ethyl alcohol (EtOH) to DI
water (H2O) was varied from 3:1, 2:1, 1:1, to 1:2, while keeping the relative humidity at
16%. When EtOH/H2O volumetric ratio was at 4:1 or 3:1, the morphology of electrospun
PVP fibers was helical peanut-shaped ribbon (Figure 2.6A). Percentage of the helical
ribbons decreased from 98% to 85% when EtOH/H2O ratio changed from 4:1 (v/v) to 3:1
(v/v). At the volumetric ratio of 2:1 or 1:1, the morphology changed to flat ribbon or
straight round fiber (Figure 2.6B and 2.6C). The width of flat ribbons or diameter of
straight round fibers decreased from 1.2 µm to 770 nm when EtOH/H2O ratio changed
from 2:1 (v/v) to 1:1 (v/v). Thin round fibers with beads formed when the ratio reached
1:2 (v/v) (Figure 2.6D).

34
Chapter 2
As shown in Table A1, Boiling point of DI water is higher than ethyl alcohol,
while the vapor pressure is lower at room temperature. Thus the mass decreasing rate of
water is smaller than that of ethyl alcohol under the experimental conditions. As
volumetric percentage of water increases, decreasing rate of solvent mass should decrease.
This effect should hold the same as relative humidity of the environment increases. As a
result, the morphology of electrospun PVP fibers changed from helical peanut-shaped
ribbons to flat ribbons and eventually to straight round fibers while the volumetric
percentage of water increased. Meanwhile, percentage of helical ribbons and the width of
flat ribbons decreased. In additional, the surface tension and dielectric constant of water
are much higher than those of ethyl alcohol. Coulomb forces and the surface tension
could not be balanced in the fluid jet if other conditions retain the same. The fluid jet
became unstable and beads began to form (Figure 2.6C and D).33

35
Chapter 2
Figure 2.6. SEM images of PVP fibers generated at the EtOH/H2O volumetric ratio of
(A) 3:1, (B) 2:1, (C) 1:1, and (D) 1:2, respectively. The relative humidity of the
environment was 16%.
2.3.5 Effect of Concentration on the Fiber Morphology
When the concentration of electrospun solution was varied from 11%, 9% to 7%
(w/v) while other conditions were maintained the same, the morphology of PVP fibers
changed from helical peanut-shaped ribbon to flat ribbon or straight round fiber, and at
last to thin fiber with beads (Figure 2.7). The percentage of helical ribbon decreased from
83% to 26% and at last to 0%. The width of flat ribbons or diameter of straight round

36
Chapter 2
fibers decreased from 489 nm to 346 nm when the concentration of solution changed
from 9% (w/v) to 7% (w/v). Thin round fibers with beads formed when the concentration
decreased to 7% (w/v).
Figure 2.7. SEM images of PVP fibers generated at the concentration of electrospun
solution of (A) 11%, (B) 9% and (C) 7% (w/v), respectively. The relative humidity of the
environment was 16%.
Concentration of polymer solution affects on morphology of the electrospun fiber,
the bead formation, bead density and diameter of the fiber.34-35
As the concentration of
polymer solution decreased, the viscosity of fluid jet decreased accordingly, leading to a
lower drying rate. So the same trend was observed just as the volume percentage of DI-
water increased or as the humidity of environment increased. While the concentration
was as low as 7%, the viscosity was so lower that cohesive force decreased. The surface
tension was dominant which tended to form beads. Then the fluid jet became unstable
and beads formed.
2.3.6 Ultimate Elongation of Fibers Electrospun at Different Relative Humidity

37
Chapter 2
Thermal mechanical analyzer was used to characterize the elasticity of the
electrospun fibers. Figure 2.8 shows the ultimate elongation of PVP fibers with different
morphologies and percentage of helical ribbons electrospun at a range of relative
humidity. The ultimate elongation decreased when the relative humidity increased.
Figure 2.8. Dependence of ultimate elongation of PVP fibers and percentage of helical
ribbons on the relative humidity.
It is because the ultimate elongation of helical ribbons is larger than that of
straight round fibers. As illustrated in Scheme 2.3, if the extension force is applied on the
two ends of helical ribbons, the degree of spiral decreases continuously until almost no
spiral exists. Subsequently, the width of the ribbons decreases until the ribbons breaks.

38
Chapter 2
However, if the extension force is exerted on the two ends of the straight round fibers, the
diameter of the fibers decreases until the fibers are fractured. The percentage of helical
ribbons decreased when the relative humidity increased as mentioned in Section 2.3.2.
Therefore, if the relative humidity increases, the ultimate elongation decreases.
Scheme 2.3. Schematic illustration of the deformation of (A) a helical ribbon and (B) a
straight round fiber under extension forces F.

39
Chapter 2
2.4 Conclusion
This chapter describes the preparation and understanding of helical peanut-shaped
ribbons of poly(vinyl pyrrolidone) (PVP) by a magnetic field-assisted electrospinning
method. The relative humidity was found to significantly influence the morphology of
PVP fibers. When the relative humidity of the environment decreased from 32% to 16%,
the morphology of the electrospun PVP fibers changed from straight fiber to helical
ribbon, and the percentage of helical ribbons increased to 99%. The cross-section of
electrospun fibers changed from circle, to ellipse, and to peanut shape. The ultimate
elongation was 33% for straight round fibers made at relative humidity of 32% and 43%
for helical ribbons made at relative humidity of 16%. The formation of helical ribbons
was explained based on the synergistic interaction of bending instability of electrospun
jet, and the rigidity of the polymer materials during the MFAE process, involving the
mass decreasing rate and the diffusion rate of the solvents. This work provides insights
on the effect of relative humidity on the extent of spirals and the shape of the cross-
section of the electrospun polymer fibers. Additionally, the influence of solvent property
and concentration on the morphology of electrospun fibers were also discussed.
Controllable morphology of electrospun fibers may be applied to guide the growth of
cells, thus the technique described in this work is potentially useful for making
biomaterials in tissue engineering. This technique also offers a way to control the
mechanical property of electrospun fiber scaffolds.

40
Chapter 2
2.5 References
1. Agarwal, S.;Wendorff, J. H.;Greiner, A. Use of electrospinning technique for
biomedical applications. Polymer 2008, 49, 5603-5621.
2. Bhardwaj, N.;Kundu, S. C. Electrospinning: A fascinating fiber fabrication
technique. Biotechnol. Adv. 2010, 28, 325-347.
3. Doshi, J.;Reneker, D. H. ELECTROSPINNING PROCESS AND
APPLICATIONS OF ELECTROSPUN FIBERS. J. Electrost. 1995, 35, 151-160.
4. Huang, Z. M.;Zhang, Y. Z.;Kotaki, M.;Ramakrishna, S. A review on polymer
nanofibers by electrospinning and their applications in nanocomposites. Compos. Sci.
Technol. 2003, 63, 2223-2253.
5. Lu, X. F.;Wang, C.;Wei, Y. One-Dimensional Composite Nanomaterials:
Synthesis by Electrospinning and Their Applications. Small 2009, 5, 2349-2370.
6. Pham, Q. P.;Sharma, U.;Mikos, A. G. Electrospinning of polymeric nanofibers for
tissue engineering applications: A review. Tissue Eng. 2006, 12, 1197-1211.
7. Sill, T. J.;von Recum, H. A. Electro spinning: Applications in drug delivery and
tissue engineering. Biomaterials 2008, 29, 1989-2006.
8. Goldberg, M.;Langer, R.;Jia, X. Q. Nanostructured materials for applications in
drug delivery and tissue engineering. J. Biomater. Sci.-Polym. Ed. 2007, 18, 241-268.
9. Zhang, Y. Z.;Venugopal, J.;Huang, Z. M.;Lim, C. T.;Ramakrishna, S.
Characterization of the surface biocompatibility of the electrospun PCL-collagen
nanofibers using fibroblasts. Biomacromolecules 2005, 6, 2583-2589.
10. Tay, C. Y.;Irvine, S. A.;Boey, F. Y. C.;Tan, L. P.;Venkatraman, S. Micro-/Nano-
engineered Cellular Responses for Soft Tissue Engineering and Biomedical Applications.
Small 2011, 7, 1361-1378.
11. Badami, A. S.;Kreke, M. R.;Thompson, M. S.;Riffle, J. S.;Goldstein, A. S. Effect
of fiber diameter on spreading, proliferation, and differentiation of osteoblastic cells on
electrospun poly(lactic acid) substrates. Biomaterials 2006, 27, 596-606.
12. Min, B. M.;Lee, G.;Kim, S. H.;Nam, Y. S.;Lee, T. S.;Park, W. H. Electrospinning
of silk fibroin nanofibers and its effect on the adhesion and spreading of normal human
keratinocytes and fibroblasts in vitro. Biomaterials 2004, 25, 1289-1297.
13. Yang, F.;Murugan, R.;Wang, S.;Ramakrishna, S. Electrospinning of nano/micro
scale poly(L-lactic acid) aligned fibers and their potential in neural tissue engineering.
Biomaterials 2005, 26, 2603-2610.
14. Xie, J. W.;Liu, W. Y.;MacEwan, M. R.;Yeh, Y. C.;Thomopoulos, S.;Xia, Y. N.
Nanofiber Membranes with Controllable Microwells and Structural Cues and Their Use
in Forming Cell Microarrays and Neuronal Networks. Small 2011, 7, 293-297.
15. Liu, Y. Y.;Sun, Y.;Yan, H.;Liu, X. Y.;Zhang, W.;Wang, Z.;Jiang, X. Y.
Electrospun Fiber Template for Replica Molding of Microtopographical Neural Growth
Guidance. Small 2012, 8, 676-681.
16. Nain, A. S.;Phillippi, J. A.;Sitti, M.;MacKrell, J.;Campbell, P. G.;Amon, C.
Control of cell behavior by aligned micro/nanofibrous biomaterial scaffolds fabricated by

41
Chapter 2
spinneret-based tunable engineered parameters (STEP) technique. Small 2008, 4, 1153-
1159.
17. Koombhongse, S.;Liu, W. X.;Reneker, D. H. Flat polymer ribbons and other
shapes by electrospinning. J. Polym. Sci. Pt. B-Polym. Phys. 2001, 39, 2598-2606.
18. Rojas, O. J.;Montero, G. A.;Habibi, Y. Electrospun Nanocomposites from
Polystyrene Loaded with Cellulose Nanowhiskers. J. Appl. Polym. Sci. 2009, 113, 927-
935.
19. Duan, H. W.;Wang, Y.;Zhang, Y. J.;Geng, L. Characterization of ODPA-ODA
polyimide non-woven membranes prepared by electrospinning. J. Polym. Eng. 2008, 28,
33-42.
20. Holzmelster, A.;Rudisile, M.;Greiner, A.;Wendorff, J. H. Structurally and
chemically heterogeneous nanofibrous nonwovens via electrospinning. Eur. Polym. J.
2007, 43, 4859-4867.
21. Lee, K. H.;Givens, S. R.;Snively, C. M.;Chase, B.;Rabolt, J. F. Crystallization
behavior of electrospun PB/PMP blend fibrous membranes. Macromolecules 2008, 41,
3144-3148.
22. Lee, K. H.;Snively, C. M.;Givens, S.;Chase, D. B.;Rabolt, J. F. Time-dependent
transformation of an electrospun isotactic poly(1-butene) fibrous membrane.
Macromolecules 2007, 40, 2590-2595.
23. Lee, K. H.;Givens, S.;Chase, D. B.;Rabolt, J. F. Electrostatic polymer processing
of isotactic poly(4-methyl-1-pentene) fibrous membrane. Polymer 2006, 47, 8013-8018.
24. Liu, Y. Q.;Zhang, X. P.;Xia, Y. N.;Yang, H. Magnetic-Field-Assisted
Electrospinning of Aligned Straight and Wavy Polymeric Nanofibers. Adv. Mater. 2010,
22, 2454-2457.
25. Reneker, D. H.;Yarin, A. L.;Fong, H.;Koombhongse, S. Bending instability of
electrically charged liquid jets of polymer solutions in electrospinning. J. Appl. Phys.
2000, 87, 4531-4547.
26. Hohman, M. M.;Shin, M.;Rutledge, G.;Brenner, M. P. Electrospinning and
electrically forced jets. I. Stability theory. Phys. Fluids 2001, 13, 2201-2220.
27. Hohman, M. M.;Shin, M.;Rutledge, G.;Brenner, M. P. Electrospinning and
electrically forced jets. II. Applications. Phys. Fluids 2001, 13, 2221-2236.
28. Yarin, A. L.;Koombhongse, S.;Reneker, D. H. Bending instability in
electrospinning of nanofibers. J. Appl. Phys. 2001, 89, 3018-3026.
29. Reneker, D. H.;Yarin, A. L. Electrospinning jets and polymer nanofibers.
Polymer 2008, 49, 2387-2425.
30. Han, T.;Reneker, D. H.;Yarin, A. L. Buckling of jets in electrospinning. Polymer
2007, 48, 6064-6076.
31. Zhang, C. L.;Lv, K. P.;Hu, N. Y.;Yu, L.;Ren, X. F.;Liu, S. L.;Yu, S. H.
Macroscopic-Scale Alignment of Ultralong Ag Nanowires in Polymer Nanofiber Mat and
Their Hierarchical Structures by Magnetic-Field-Assisted Electrospinning. Small 2012, 8,
2936-2940.

42
Chapter 2
32. Reneker, D. H.;Yarin, A. L.;Zussman, E.;Xu, H. Advances in Applied Mechanics.
In Electrospinning of Nanofibers from Polymer Solutions and Melts; Aref, H.,van der
Giessen, E., Eds.; Elsevier Academic Press: San Diego, USA, 2007; Vol. 41, pp 43-195.
33. CRC Handbook of Chemistry and Physics. In Fluid Properties [Online];93rd
Edition (Internet Version 2013); Haynes, W. M., Eds.; CRC Press / Taylor and Francis:
Boca Raton, USA, 2013; Section 6. https://z.rochester.edu/zimbra/#3 (accessed January 1,
2013).
34. Bhaskar, S.;Pollock, K. M.;Yoshida, M.;Lahann, J. Towards Designer
Microparticles: Simultaneous Control of Anisotropy, Shape, and Size. Small 2010, 6,
404-411.
35. Ding, B.;Kim, C. K.;Kim, H. Y.;Se, M. K.;Park, S. J. Titanium dioxide nanoribers
prepared by using electrospinning method. Fiber. Polym. 2004, 5, 105-109.
36. Kim, C. H.;Jung, Y. H.;Kim, H. Y.;Lee, D. R.;Dharmaraj, N.;Choi, K. E. Effect
of collector temperature on the porous structure of electrospun fibers. Macromol. Res.
2006, 14, 59-65.

43
Chapter 3
Chapter 3 Fabrication of SiC Fibers by Electrospinning and
UV Cure
3.1 Introduction
Silicon carbide (SiC) has various desirable properties including high tensile
strength, high elastic modulus, excellent thermal stability, outstanding oxidation
resistance and remarkable electronic properties.1-4
As a result, it is a good reinforcement
material and a good candidate for high-speed electronics.
Fabrication of one dimensional (1D) SiC catches a lot of attentions. Catalyst
assisted pyrolysis method is cheap and fast.5-8
But the low yield and the involvement of
metallic elements limit the practical utilization of final 1D materials. Template modulated
method necessitates the use of template and etchant, which increases the fabrication cost
and increases the chance to impair the fibers.9-10
Additionally, the length of 1D materials
fabricated by catalyst assisted and template modulated methods is limited. Conventional
spinning method, although good for producing SiC fibers with large aspect ratio, is only
useful for making SiC with the diameter of larger than 10µm.10-11
Compared to these
methods, electrospinning is a much superior method, because it can fabricate 1D fibers
with the size ranging from nanometer to micrometer facilely. For example, SiO2 fibers
are fabricated by electrospinning from preceramic precursor tetraethoxysilane (TEOS)
with the help of guiding polymer polyvinyl alcohol (PVA) or polyacrylonitrile (PAN) at
first; then they are carbonized by graphite to obtain SiC fibers.12-14
SiC fibers were also

44
Chapter 3
obtained from preceramic polymer, polycarbosilane, with the help of guiding polymer by
emulsion electrospinning15
and concentric electrospinning.16
In addition, to maintain the
morphology of preceramic fibers when converting it to SiC fibers by pyrolysis, electron
beam (e-beam) irradiation up to 10 MGy in an inert gas atmosphere was used.17-19
In this chapter, preceramic fibers could be obtained directly by magnetic-field-
assisted electrospinning (MFAE) method from the preceramic polymer without any
guiding polymer. Later, SiC fibers were produced by UV Cure and post-pyrolysis
treatment of the preceramic fibers. Compared to e-beam irradiation, the UV Cure method
is a much energy-conserving technique and easy to handle.
3.2 Experimental Section
Materials. Allylhydridophenylpolycarbosilane (RD, Mn=1340, Mw=10300) was
purchased from Starfire System. Toluene (anhydrous, 99.8%), dichloromethane
(anhydrous, ≥99.8%), n-methyl-2-pyrrolidone (NMP, anhydrous, 99.5%) were purchased
from Aldrich. All chemicals were used as received without further purification.
Electrospinning of Preceramic Fibers. Aligned preceramic fibers was fabricated
by magnetic-field-assisted electrospinning method from preceramic polymer RD directly.
RD was dissolved into various mixtures of solvents while the concentration of solution
was kept at 50 wt%. The polymer solution was loaded into a plastic syringe with a 22-
Gauge (inner diameter: 0.028 inch) stainless-steel needle. The sharp tip of the needle was
cut and sanded into smooth circular, flat opening to ensure the proper direction of fluid

45
Chapter 3
jets. The needle was connected to a high-voltage power supply and a collector was
grounded and 15 cm below the needle tip. The voltage between the spinneret and the
collector was maintained at 23 kV. The collector was a U-type bracket wrapped by foil
and placed on the top of the two magnets. The space between the two arms of the U-type
bracket was the same as the distance between two magnets. So the electrospun
preceramic fibers could hang on the arms of the bracket. The feeding rate was controlled
by a syringe pump at a constant rate of 1.5 mL/h.
Fabrication of SiC Fibers. The as-spun preceramic fibers fixed by U-type
bracket were cured by a UV lamp (254nm, PSD-UVT, Novascan Technologies Inc.) in
Ar atmosphere at room temperature under various durations. After UV Cure, the fibers
became robust and could be cut from the bracket integrally. Later, the fibers were
pyrolyzed at 1100 °C in Ar atmosphere to form SiC fibers.
Characterization. The morphology of the preceramic fibers and SiC fibers were
studied by Field Emission Scanning Electron Microscope (FE-SEM, Zeiss-Leo DSM982).
Average diameter was measured by Image J (National Institutes of Health, USA). 1H
NMR spectra were recorded in CDCl3 on Brucker Avance 400-2 NMR Spectrometer at
400 MHz. Attenuated total reflectance infrared spectra (ATR-IR) were collected on a
Shimadzu FTIR-8400S spectrophotometer with a MIRacle ATR accessory. Powder X-ray
diffraction (PXRD) patterns were recorded using a Philips MPD diffractometer with a Cu
Kα X-ray source (λ = 1.5405 Å). The thermal gravimetric analysis (TGA) was conducted
on an SDT-Q600 TA instrument. In a standard procedure, ~5 mg samples were
transferred into a platinum pan, which was subsequently placed onto the dual beam

46
Chapter 3
sample holder. The samples were heated from room temperature to 1000 °C with a
heating rate of 2 °C/min. The flow rate of N2 was set at 50 mL/min.
3.3 Results and Discussion
3.3.1 Morphology and Diameter Control of Preceramic Fibers
The morphology and diameter of the electrospun preceramic fibers can be
adjusted by varying mixtures of solvents. When the mixture of toluene and
dichloromethane was used as solvent, the morphology of preceramic fibers changed
continuously from beaded fiber to straight fiber by varying the weight percentage of
toluene (
) from 30%, to 20%, to 10%, and to 0% (Figure 3.1). The
density of beads dwindled and the diameter of fibers increased from 1.5µm with 30% of
toluene in solvent mixture, to 2.1µm with 20%, to 2.3µm with 10%, and to 3.4µm with
no toluene.

47
Chapter 3
Figure 3.1. SEM images of preceramic fibers using mixture of toluene and
dichloromethane as solvent. The weight percentage of toluene was (A) 30%, (B) 20%,
(C) 10% and (D) 0%, respectively.
The diameter of preceramic fibers could be tuned by using mixture of n-methyl-
2-pyrrolidone (NMP) and dichloromethane as solvent (Figure 3.2). The diameter was 600
nm when the weight percentage of NMP (
) in solvent was 20% and 1
µm when it was 10%. The morphology of the fibers was flat ribbon.

48
Chapter 3
Figure 3.2. SEM images of preceramic fibers using mixture of NMP and
dichloromethane as solvent. The weight percentage of NMP was (A) 20% and (B) 10%.
Physical properties of solvent are vital to the morphology of electrospun fibers,
including boiling point, vapor pressure at room temperature, surface tension and
dielectric constant.20-23
Boiling point and vapor pressure at room temperature determine
the drying rate and viscosity of the fluid jet, which influence the viscoelastic stress.
Dielectric constant determines the density of the charge generated in the fluid jet and
therefore affect the Coulomb repulsive force.23
As a result, different mixtures of solvents
lead to different balances of Coulomb force and surface tension, which would yield fibers
with various morphologies and diameters.
The morphology and the size of electrospun fibers could be modified by changing
the physical properties of solvent through mixing different solvents. Fluid jet with high
surface tension and low charge density per unit area (low dielectric constant) tends to
form beads. The dielectric constant of toluene is much lower than that of
dichloromethane, though they have similar surface tension (Table A1). As a result, by
49
Chapter 3
using mixture of toluene and dichloromethane as solvent, fiber with beads was obtained.
By decreasing the weight percentage of toluene, the density of beads decreased until the
straight fibers were obtained. Normally higher bead density would generate thinner fibers,
and lower bead density would generate thicker fibers. So the diameter of fibers also
increased.
Although the surface tension of NMP is higher than that of dichloromethane, its
dielectric constant is much higher. As a result, Coulomb repulsive force became stronger
by mixing NMP into dichloromethane. In addition, the boiling point of NMP is higher
and vapor pressure at room temperature is lower than that of dichloromethane. The
drying rate of fluid jet is much slower when NMP is used as the solvent. Therefore the
fiber could be elongated further before it solidified. So by increasing the weight
percentage of NMP, fiber diameter decreased. In the following sections, pure
dichloromethane was chosen as the solvent.
3.3.2 Characterization of Preceramic Polymer
Silicon carbide (SiC) fibers could be obtained by pyrolysis of as-spun preceramic
fibers in Ar atmosphere at elevated temperature. But RD materials melt above 100 °C. It
is a great problem to maintain the morphology of fibers while pyrolyzing. To solve this
problem, the properties of RD are characterized at first.
RD was characterized by 1H NMR and ATR-IR to determine its structural
formula. In the 1H NMR spectrum (Figure 3.3), resonances corresponding to benzene,

50
Chapter 3
CH2=CH, SiH, SiCH2 and SiCH3 are observed in the regions of 7.1-7.7 (peak a), 4.8-5.7
(peak b), 3.1-4.4 (peak c), 1-1.6 (peak d) and 0-0.6 (peak e) ppm respectively. Peak f is
the resonances of solution CDCl3. Based on these data; the structural formula of RD is
deducted and sketched on the top of 1H NMR spectrum. ATR-IR spectrum (Figure 3.4)
further confirms its structure. Characteristic vibrations of SiH, C=C, Si-C (phenyl) and
Si-C (alkyl) are observed at 2112, 1589, 1430 and 1110, and 1250 cm−1
respectively.
Figure 3.3. 1H NMR spectra of RD material. The structural formula of RD was sketched
on the top.

51
Chapter 3
Figure 3.4. ATR-IR spectrum of RD material.
Figure 3.5 shows the TGA curve of RD material. From the TGA curve, it is
noticed that the weight loss took place in three stages. A weight loss of 10% observed
below 250 °C is due to the loss of low molecular weight oligomers. During this stage, RD
melted and formed a gel. The major weight loss occurs in the region 250 – 550 °C (17
wt% loss), which can be attributed to the loss of phenyl and hydrogen from the polymeric
chain resulting in onset of cross-linking. The third stage of weight loss (∼6%) noticed in
the region 550 – 700 °C is attributed to the loss of the CH4.25-27
During the second and
third stage, the color of RD materials darkened; the gel solidified gradually and finally
formed a black solid. The weight loss of RD finishes at 750 °C, but higher temperature

52
Chapter 3
treatment (larger than 1200 °C) is needed to transfer amorphous SiC to crystalline SiC.
The net ceramic residue of the RD is found to be 65 wt% at 1350 °C in argon atmosphere.
Figure 3.5. TGA curve of RD material.
XRD pattern of RD pyrolyzed at 1350 °C is given in Figure 3.6. Diffraction lines
corresponding to (111), (200), (220) and (311) planes of β-SiC are detected. It verifies
that SiC could be obtained by pyrolysis of preceramic polymer RD.

53
Chapter 3
Figure 3.6. XRD patterns of RD pyrolyzed in Ar atmosphere at 1350 °C. XRD patterns
of β-SiC are shown by the red lines as a reference based on the JCPDS database (No. 74-
2307).
3.3.3 Influence of UV Cure on Morphology of SiC Fibers
According to the result of TGA, RD material melted and formed a gel at first
when the temperature of pyrolysis was elevated from room temperature due to its low
molecular weight and glass transition point. Subsequently, cross-linking reaction
happened at high temperature and the gel solidified gradually due to the growth of
molecular weight. To solve the problem of morphology deformation of preceramic fibers
during the pyrolysis process, as-spun fibers need to be pre-cured to improve its molecular
weight and glass transition point. In this study, UV cure is chosen, whose wavelength is
254 nm.

54
Chapter 3
SEM images of SiC fibers, which were cured by UV light at different durations
followed by pyrolyzing in Ar atmosphere at 1100 °C, are shown in Figure 3.7. Fibers
cured by UV light for only 15 min totally fused together after the pyrolysis treatment.
Fibers cured for 30 min also fused together but the outline of the fibers could be seen. For
the batches which were cured for 1 hr, only a few fibers fused together. For the batches
which were cured for 2 hr, the morphology of as-spun fibers was integrally maintained.
Figure 3.7. SEM images of SiC fibers which were cured by UV light at different
durations and then pyrolyzed in Ar atmosphere at 1100°C. The periods of UV cure were
(A) 15min, (B) 30 min, (C) 1 hr, and (D) 2 hr, respectively.

55
Chapter 3
UV light can break and reunite some bonds of polymer.19, 28
So UV cure
crosslinks the precursor polymer RD, resulting in the increase of its molecular weight and
glass transition point. Therefore, as-spun preceramic fibers after UV cure become stable
enough for the post-pyrolysis treatment. ATR-IR spectra of as-spun preceramic fibers
cured by UV light at different durations are shown in Figure 3.8. The progress of the
crosslinking reaction is monitored by the absorbance of Si-H stretching vibration (2112
cm-1
), Si-Phenyl group (1430 and 1110 cm-1
) and Si-CH3 group (1250 cm-1
) in the IR
spectra. Overall, all the intensity of these absorbance decreased as the period of UV Cure
increased, indicating that the amount of these groups decreased with progress of cross-
linking reaction. Particularly, in the region of characteristic absorbance of Si-H stretching
vibration (red square in Figure 3.8), the intensity of the peak at 2112 cm-1
decreased
while the ones at 2025 and 1974 cm-1
increased when the duration of UV cure was
prolonged. It is due to the differences of the adjoining group to Si-H, such as R group in
R-Si-H. According to the book of Aldrich Library of FT-IR, the peak of Si-H shifts from
2120 to 2090 cm-1
if R group changes from methyl, ethyl, to isopropyl group; and it also
shifts from 2120 to 2110 cm-1
if R group varies from phenyl group to hexane group.29
In
the region of the characteristic absorbance of Si-phenyl group (green square in Figure
3.8), the intensity of peak at 1430 cm-1
decreased while the one at 1408 cm-1
increased
when the duration was extended. Indeed the absorbance peak at 1430 cm-1
is C-H (in Si-
phenyl) bending vibration peak, and the one at 1408 cm-1
is C-H (in Si-CH=CH2) )

56
Chapter 3
bending vibration peak.29
It indicates that the benzene ring of phenyl group in Si-phenyl
was broken into ethylene group gradually by UV exposure.
Figure 3.8. ATR-IR spectra of as-spun preceramic fibers which were cured by UV light
at different durations.
According to the results of ATR-IR spectra, crosslinking reactions are proposed
(Scheme 3.1). When RD material is irradiated by UV light, double bonds break and free
radicals are generated. The free radicals may attack CH2 or Si-H group as illustrated in
the proposed reaction. Then the amount of Si-H, Si-phenyl and Si-CH3 group decrease

57
Chapter 3
with progress of crosslinking reaction. R group in R-Si-H changes from methyl to
isopropyl group, resulting in the variation of peaks of Si-H stretching vibration in ATR-
IR spectra. Si-phenyl group is transferred to Si-vinyl group leading to the change of
peaks of Si-phenyl group in ATR-IR spectra. All these are consistent with the results of
IR spectra. It supports our proposition that UV cure can crosslink the precursor polymer
RD and increase its molecular weight. Therefore, as-spun preceramic fibers after UV cure
become stable and the morphology could be maintained during the post-pyrolysis
treatment.

58
Chapter 3

59
Chapter 3
Scheme 3.1. Schematic illustration of crosslinking reactions of as-spun preceramic fibers
during the treatment of UV cure.
Additional evidence of crosslinking reaction is that the solubility of RD material
in dichloromethane decreases when the duration of UV cure is increased. As shown in
Figure 3.9, RD material without UV cure could be dissolved completely in
dichloromethane. A few part of the material could not be dissolved when it was cured by
UV light for 1 hr. And the amount of insoluble part increased when the duration was
extended to 2 hr.
Figure 3.9. Solution of RD in dichloromethane after RD was cured by UV light for
different durations.

60
Chapter 3
3.4 Conclusion
In this chapter, SiC fibers were synthesized by electrospinning from preceramic
polymer, UV Cure and pyrolysis processes. The morphology and diameter of the
electrospun preceramic fibers could be adjusted by using various mixtures of solvents.
UV cure can crosslink and strengthen the preceramic fibers, leading to the preservation of
morphology during pyrolysis process at high temperature. The morphology of preceramic
fibers could be maintained if they were cured by UV light for duration of longer than 2 hr.
The mechanism of UV cure was proposed. UV light could break double bonds of RD
material and generate free radicals. The free radicals attacked CH2 or Si-H group, leading
to the crosslink reaction and stability of preceramic fibers.
3.5 References
1. Yajima, S.;Hayashi, J.;Omori, M.;Okamura, K. DEVELOPMENT OF A
SILICON-CARBIDE FIBER WITH HIGH-TENSILE STRENGTH. Nature 1976, 261,
683-685.
2. Bourenane, K.;Keffous, A.;Nezzal, G.;Bourenane, A.;Boukennous,
Y.;Boukezzata, A. Influence of thickness and porous structure of SiC layers on the
electrical properties of Pt/SiC-pSi and Pd/SiC-pSi Schottky diodes for gas sensing
purposes. Sens. Actuator B-Chem. 2008, 129, 612-620.
3. Eddy, C. R.;Gaskill, D. K. Silicon Carbide as a Platform for Power Electronics.
Science 2009, 324, 1398-1400.
4. Vanhaecke, E.;Ivanova, S.;Deneuve, A.;Ersen, O.;Edouard, D.;Wine, G.;Nguyen,
P.;Pham, C.;Pham-Huu, C. 1D SiC decoration of SiC macroscopic shapes for filtration
devices. J. Mater. Chem. 2008, 18, 4654-4662.
5. Zhou, J. Y.;Chen, Z. Y.;Zhou, M.;Gao, X. P.;Xie, E. Q. SiC Nanorods Grown on
Electrospun Nanofibers Using Tb as Catalyst: Fabrication, Characterization, and
Photoluminescence Properties. Nanoscale Res. Lett. 2009, 4, 814-819.
6. Vakifahmetoglu, C.;Colombo, P.;Carturan, S. M.;Pippel, E.;Woltersdorf, J.
Growth of One-Dimensional Nanostructures in Porous Polymer-Derived Ceramics by

61
Chapter 3
Catalyst-Assisted Pyrolysis. Part II: Cobalt Catalyst. J. Am. Ceram. Soc. 2010, 93, 3709-
3719.
7. Vakifahmetoglu, C.;Pippel, E.;Woltersdorf, J.;Colombo, P. Growth of One-
Dimensional Nanostructures in Porous Polymer-Derived Ceramics by Catalyst-Assisted
Pyrolysis. Part I: Iron Catalyst. J. Am. Ceram. Soc. 2010, 93, 959-968.
8. Yang, W. Y.;Gao, F. M.;Fan, Y.;An, L. N. Al-Doped Single-Crystalline SiC
Nanowires Synthesized by Pyrolysis of Polymer Precursors. J. Nanosci. Nanotechnol.
2010, 10, 4729-4732.
9. Elyassi, B.;Kim, T. W.;Sahimi, M.;Tsotsis, T. T. Effect of polystyrene on the
morphology and physical properties of silicon carbide nanofibers. Mater. Chem. Phys.
2009, 118, 259-263.
10. Vakifahmetoglu, C. Fabrication and properties of ceramic 1D nanostructures from
preceramic polymers: a review. Adv. Appl. Ceram. 2011, 110, 188-204.
11. Colombo, P.;Mera, G.;Riedel, R.;Sorarù, G. D. Polymer-Derived Ceramics: 40
Years of Research and Innovation in Advanced Ceramics. Journal of the American
Ceramic Society 2010, 93, 1805-1837.
12. Li, J. Y.;Zhang, Y. F.;Zhong, X. H.;Yang, K. Y.;Meng, J.;Cao, X. Q. Single-
crystalline nanowires of SiC synthesized by carbothermal reduction of electrospun
PVP/TEOS composite fibres. Nanotechnology 2007, 18, 1-4.
13. Delavari, H.;Kokabi, M. SILICON CARBIDE NANOWIRES FROM
POLYVINYL ALCOHOL/SILICA ELECTROSPUN NANOFIBERS. Nano 2011, 6, 41-
45.
14. Kim, B. H.;Kim, C. H.;Yang, K. S.;Kim, K. Y.;Lee, Y. J. SiC/SiO2 coating for
improving the oxidation resistive property of carbon nanofiber. Appl. Surf. Sci. 2010, 257,
1607-1611.
15. Choi, S. H.;Youn, D. Y.;Jo, S. M.;Oh, S. G.;Kim, I. D. Micelle-Mediated
Synthesis of Single-Crystalline beta(3C)-SiC Fibers via Emulsion Electrospinning. ACS
Appl. Mater. Interfaces 2011, 3, 1385-1389.
16. Liu, H. A.;Balkus, K. J. Electrospinning of beta silicon carbide nanofibers. Mater.
Lett. 2009, 63, 2361-2364.
17. Kang, P. H.;Jeun, J. P.;Seo, D. K.;Nho, Y. C. Fabrication of SiC mat by radiation
processing. Radiat. Phys. Chem. 2009, 78, 493-495.
18. Takeda, M.;Imai, Y.;Ichikawa, H.;Kasai, N.;Seguchi, T.;Okamura, K. Thermal
stability of SiC fiber prepared by an irradiation-curing process. Compos. Sci. Technol.
1999, 59, 793-799.
19. Eick, B.;Youngblood, J. SiC nanofibers by pyrolysis of electrospun preceramic
polymers. J. Mater. Sci. 2009, 44, 160-165.
20. Tungprapa, S.;Puangparn, T.;Weerasombut, M.;Jangchud, I.;Fakum,
P.;Semongkhol, S.;Meechaisue, C.;Supaphol, P. Electrospun cellulose acetate fibers:
effect of solvent system on morphology and fiber diameter. Cellulose 2007, 14, 563-575.
21. Zhao, J. H.;Xu, A. H.;Yuan, W. Z.;Gao, J. B.;Tang, J. K.;Wang, L.;Ai, F.;Zhang,
Y. M. Evaluation of electrospun nanofiber formation of perfluorosulfonic acid and poly
(N-vinylpyrrolidone) through solution rheology. J. Mater. Sci. 2011, 46, 7501-7510.

62
Chapter 3
22. Luo, C. J.;Nangrejo, M.;Edirisinghe, M. A novel method of selecting solvents for
polymer electrospinning. Polymer 2010, 51, 1654-1662.
23. Uyar, T.;Besenbacher, F. Electrospinning of uniform polystyrene fibers: The
effect of solvent conductivity. Polymer 2008, 49, 5336-5343.
24. CRC Handbook of Chemistry & Physics. In Eds.; 92 ed.; CRC net Base Product:
2011-2012.
25. Berbon, M.;Calabrese, M. Effect of 1600 degrees C heat treatment on C/SiC
composites fabricated by polymer infiltration and pyrolysis with
allylhydridopolycarbosilane. J. Am. Ceram. Soc. 2002, 85, 1891-1893.
26. Interrante, L. V.;Jacobs, J. M.;Sherwood, W.;Whitmarsh, C. W., Fuentes,
M.,MartinezEsnaola, J. M.,Daniel, A. M., Eds. Trans Tech Publications: Clausthal
Zellerfe, 1997; Vol. 127-3, pp 271-278.
27. Sreeja, R.;Swaminathan, B.;Painuly, A.;Sebastian, T. V.;Packirisamy, S.
Allylhydridopolycarbosilane (AHPCS) as matrix resin for C/SiC ceramic matrix
composites. Mater. Sci. Eng. B-Adv. Funct. Solid-State Mater. 2010, 168, 204-207.
28. Shanmuganathan, K.;Sankhagowit, R. K.;Iyer, P.;Ellison, C. J. Thiol-Ene
Chemistry: A Greener Approach to Making Chemically and Thermally Stable Fibers.
Chem. Mat. 2011, 23, 4726-4732.
29. Aldrich Library of FT-IR Spectra. In Eds.; Second ed.; Sigma-Aldrich Co.: 1997;
Vol. 3.

63
Chapter 4
Chapter 4 Catalyst Membrane of Pt@Nb-TiO2 Fabricated by
Electrospinning and Atomic Layer Deposition
4.1 Introduction
Polymer electrolyte membrane fuel cell (PEMFC) is considered to be a green
energy conversion technology for the future.1-5
Among the PEMFCs, supported Pt and Pt
alloys have been extensively explored as electrocatalysts in oxygen-reduction reaction
(ORR), which is the major challenge in the system.6-9
Carbon black is the typical support
material for catalysts because of its large surface area, high electrical conductivity, and
well-developed pore structure.10
However, during the ORR cycles, carbon tends to be
corroded under the harsh electrochemical reaction conditions.11-14
The corrosion of
carbon support causes the agglomeration and sintering of Pt catalyst particles, resulting in
a decreased electrochemical surface area (ECSA) and activity of the catalysts. Carbon
corrosion also leads isolated Pt particles to detach from the support. Moreover, it has
been found that Pt can accelerate the corrosion rate of carbon support.15-16
These effects
strongly affect the durability of PEMFCs. Therefore, non-carbon supports increasingly
attract a great deal of attention.17-23
TiO2 becomes an alternative candidate for the support
material, because it has excellent stability in both acidic and oxidative environments.24
To use TiO2 as the electrocatalyst support, one has to develop novel approach to
the deposition of highly active catalysts on TiO2. The support also has to be conductive,

64
Chapter 4
because the conductivity of TiO2 is several orders of magnitude lower than that of carbon
black (Vulcan XC-72). In this context, electrospinning and atomic layer deposition
(ALD) are both simple and controllable techniques and the combination of these two may
be suitable for production of TiO2-supported Pt catalysts. Mats consisted of one-
dimensional TiO2 fibers with high surface area are made before by electrospinning.17, 25-28
ALD technique is able to deposit uniform nanoparticles (NPs) without capping ligands on
granular and porous materials, thus avoiding surface contaminations by organic capping
molecules. In addition, high degree of control over size of NPs is possible using ALD
technique due to its ability to precisely control the delivery of chemical reagents and to
the self-limiting nature of the surface-saturated reactions mechanism.29-32
Compared with
normal Pt/C catalysts, Pt NPs are anchored on the surface of supports by ALD technique
instead of simple mixing, which hinders the agglomeration and surface diffusion of NPs
and increases the stability of catalysts.
A typical method for improving the conductivity of TiO2 is through the
incorporation of n-type dopants, such as vanadium (V),33-34
niobium (Nb),20, 35
and
tantalum (Ta).36-37
Another approach is heat treatment at high temperatures under
reducing atmosphere in order to create oxygen vacancies in TiO2.38
When dopant method
is used, Nb is often preferred, because Nb5+
(r = 0.70 Å) has similar ionic radii as Ti4+
(r
= 0.68 Å), there exists negligible lattice mismatch between TiO2 and Nb2O5. Thus, Nb2O5
forms a complete range of solid solutions with TiO2.35, 39-40
In this work, we present an innovative approach for making catalyst membranes
of Pt NPs on Nb-doped titania (Pt@Nb-TiO2) fiber membranes. This approach is

65
Chapter 4
developed based upon the recent success in two independent areas, namely, the
fabrication of TiO2 fibers by electrospinning25-28
and the deposition of Pt NPs on supports,
such as WC,30
Al2O3,41
SrTiO331, 42
and carbon nanotube by ALD.43-44
These catalyst
membranes could potentially be directly integrated in membrane electrode assembly
(MEA) as the catalyst layer, avoiding complicated process of making catalyst inks and
then spaying or painting them onto a gas diffusion layer, because the catalyst layer is
already in a membrane form. The effects of Nb amount, conditions for ALD and post-
treatment on electrocatalytic activity and stability of the membranes are studied.
4.2 Experimental Section
Materials. Polyvinyl acetate (PVAc, Mw 500,000), titanium (IV) isopropoxide
(Ti(OiPr)4, 99.999%) and niobium ethoxide (Nb(OEt)5, 99.95%) were purchased from
Sigma Aldrich. N,N-dimethyl formamide (DMF, anhydrous) was obtained from
Honeywell Burdick and Jackson. Acetic acid (glacial, 99.7%) was from Alfa Aesar.
Nafion 117 solution was from Fluka. All chemicals were used as received without further
purification.
Synthesis of Membrane Supports Made of Nb-TiO2 Support. Typically, 0.123
g PVAc was dissolved in 1 mL of DMF in glove box.35
After complete dissolution,
Ti(OiPr)4, Nb(OEt)5 and 0.119 g acetic acid were added into the solution in glove box.
The atomic ratio of Ti(OiPr)4 and Nb(OEt)5 was varied according to the predetermined
Nb percentage, while the total amount of Ti and Nb was kept at 1.67 mmol. The resulting

66
Chapter 4
solution was mixed well and electrospun at an accelerating voltage of 20 kV and at a flow
rate of 1 mL/h. The membrane of polymeric fibers was collected on a grounded
aluminum foil placed 15 cm below the spinneret. The relative humidity of environment
was kept at above 40% if not mentioned particularly. The membrane was then peeled off
from foil using tweezers and left in the air for ~10 h to let the hydrolysis reaction go to
completion. Then the membrane was sintered in air at 500 °C for 24 h to remove PVAc
and allow nucleation and growth of niobium-doped titania (Nb-TiO2) particles in the fiber
structure.
Synthesis of Membrane of Pt@Nb-TiO2 Catalysts. Atomic layer deposition
(ALD) is utilized to deposit Pt NPs onto the membrane of Nb-TiO2 fibers. The membrane
of Nb-TiO2 fibers was fixed in a chuck and hung in the air inside the chamber of ALD
system (Savannah 100 & 200, Cambridge Nano Tech Inc.) to ensure both side of the
membrane to be exposed to the reactants. The chamber was kept at 270 °C. Platinum
precursor, Trimethyl(methylcyclopentadienyl) platinum(IV) ((MeCp)Pt(CH3)3), was kept
at 70 °C and gas lines were held at 150 °C to avoid precursor condensation. High-purity
O2 was used as the co-reactant, and high-purity N2 was used as both the carrier and purge
gas. The flow rate of N2 was maintained at 5 sccm. A typical ALD cycle was as follows:
2 s of Pt precursor pulse, 5 s of N2 purge, 2 s of O2 pulse and 28 s of N2 purge. Pt NPs
with different sizes were obtained by changing the total number of ALD growth cycle.
For electrochemical measurement, catalyst membrane of Pt@Nb-TiO2 was treated at
either 200 °C or 500 °C in 5% H2 in Ar atmosphere for 2 h.

67
Chapter 4
Electrochemical Measurement. A three-electrode cell was used to perform the
electrochemical measurements. The working electrode was a glassy-carbon rotating-disk
electrode (RDE; area: 0.196 cm2). Pt foil (1 cm × 1 cm) was used as the counter electrode.
A reversible hydrogen electrode (RHE) was used as the reference electrode, which was
placed in a separate compartment. The electrolyte for all of the measurements was 0.1 M
perchloric acid, which was diluted with de-ionized water from a 70% doubly distilled
stock solution (GFS Chemicals, USA). To prepare the working electrode, the Pt@Nb-
TiO2 catalyst was first dispersed in ethanol and the mixture was sonicated for 30 min. 5
µL of suspension was added onto RDE by a pipette and dried under air. It was repeated
until the surface of RDE was covered by a thin-uniform layer of the catalysts. Then 10
µL of 0.0125% (wt%) Nafion-ethanol solution was dropped on the surface of the thin
film to prevent the catalysts from detaching by the flow of testing solution. The
measurements of the total electrochemically active surface area (ECSA) were performed
by integrating the hydrogen adsorption from the cyclic voltammetry (CV) data, which
was recorded at room temperature in argon saturated solution of 0.1 M HClO4. The
potential scan rate was 50 mVs-1
for the CV measurements. The ORR measurements
were conducted at a rotation rate of 1600 rpm in 0.1 M HClO4, which was purged with
oxygen for 30 min prior to and during the measurements. The scan rate for the ORR
measurements was 10 mVs-1
in the positive direction. The accelerated-stability test was
conducted at ambient temperature in an Ar-protected 0.1 M solution of aqueous HClO4.
The potential was cycled 30000 times between 0.6 and 1.0 V (versus RHE) at a scan rate
of 100 mVs-1
and the polarization curves were recorded after every 10000 cycles. The

68
Chapter 4
area-specific activity was obtained by normalizing the kinetic current density against the
ECSA values, and the kinetic current density was obtained from the Koutecky-Levich
plot.
Characterization. The morphology of the fibers and Pt@Nb-TiO2 catalyst
membrane were studied by field emission scanning electron microscope (FE-SEM, Zeiss-
Leo DSM982) and field emission transmission electron microscopy (FE-TEM, FEI
TECNAI F-20). Scanning transmission electron microscopy (STEM) and elemental maps
were carried out using the high-angle annular dark field (HAADF) mode on FE-TEM.
Energy dispersive X-ray (EDX) analysis of catalysts was carried out on FE-SEM
equipped with an EDAX detector. Average diameter was measured by Image J (National
Institutes of Health, USA). Powder X-ray diffraction (PXRD) patterns were recorded on a
Philips MPD diffractometer with a Cu Kα X-ray source (λ = 1.5405 Å).
4.3 Results and Discussion
4.3.1 Experimental Process
Scheme 1 illustrates the two-step process for the fabrication of catalyst membrane
by combining the electrospinning and ALD techniques. In the first step, support
membrane of Nb-TiO2 was produced by electrospinning technique and sintering. At first,
membrane of polymeric fibers was obtained by electrospinning from ceramic precursors
(Ti(OiPr)4 and Nb(OEt)5) and guiding polymer PVAc. The Nb-doped percentage was
varied by controlling the atomic ratio between Ti(OiPr)4 and Nb(OEt)5. Then the

69
Chapter 4
membrane of Nb-TiO2 was obtained by hydrolysis and sintering of the as-spun membrane
in the air. In the second step, Pt NPs were deposited onto the support membrane by ALD
technique to form catalyst membrane of Pt@Nb-TiO2. Typically, an ALD cycle began
with a organometallic precursor ((MeCp)Pt(CH3)3) pulse. (MeCp)Pt(CH3)3 reacted with
oxygen atoms on the surface of Nb-TiO2 membranes, generating PtCxHy-containing
compounds and byproducts of CH4, CO2 and H2O. The excess (MeCp)Pt(CH3)3 and
byproducts were cleared by N2 purging gas, followed by the O2 pulse. O2 reacted with
PtCxHy segment to form Pt–O and byproduct, CO2 and H2O. The O atom generated could
be used to react with (MeCp)Pt(CH3)3 in the subsequent ALD cycle. The ALD cycle was
finished by another N2 purge to eliminate excess O2 and byproducts. By repeating the
ALD growth cycle, different size of Pt NPs could be deposited onto the Nb-TiO2
membrane. Because the reaction streams of (MeCp)Pt(CH3)3 and O2 were separated by a
purge gas of N2. During each reactant pulse, only one reactant reacted with substrate
surface, through a self-limiting process that was capable of precisely controlling the
growth of Pt NPs.

70
Chapter 4
Scheme 4.1. Schematic illustration of the process for the production of Pt@Nb-TiO2
catalyst membrane. (A) Step 1: preparation of Nb-TiO2 support membrane by
electrospinning technique and sintering. (B) Step 2: preparation of catalyst membrane of
Pt@Nb-TiO2 by the ALD technique. The SEM image shows a final membrane made of
Pt@Nb-TiO2 fibers.
Figure 4.1 shows the TEM, STEM and HAADF-STEM micrographs of Pt NPs
dispersed on a Nb-TiO2 fiber made after 40 ALD cycles. The patchy, uneven contrast
shown in the TEM micrograph indicates the surface of Nb-TiO2 fiber was not smooth.
Both TEM and STEM micrographs show that the Pt NPs were uniformly dispersed on the

71
Chapter 4
ceramic fibers with an average diameter of 14 nm. Several studies previously show the
dispersion of Pt particles increased with increasing the number of oxygen-containing
surface species in the support.45-47
In this system, Nb-TiO2 fibers contained abundant
oxygen surface groups. As a result, the deposition of Pt NPs was uniform. The HAADF-
STEM micrograph indicates that Pt, Ti and Nb elements were distributed homogeneously
throughout the Nb-TiO2 fiber. These results indicate metal nanoparticles with high
uniformity in size could be deposited onto metal oxide fiber membranes by
electrospinning and ALD techniques. This two-step process is easy to operate and
scalable, because the size of the membrane generated by electrospinning and ALD could
be very large depending on the scale of the equipment. In our experiment, the size of a
typical membrane was 1.5 cm × 2.2 cm and limited by the operating area of the ALD
system and the tube furnace (inserted photo in Scheme 4.1B).
Figure 4.1. (A) TEM and (B) STEM micrographs of Pt@Nb-TiO2 catalyst. (C) HAADF-
STEM study showing the distribution of Pt (blue), Ti (red) and Nb (green) elements. The
area for HAADF-STEM study is the marked region in (B).
72
Chapter 4
4.3.2 Effect of Fiber Morphology on Electrocatalytic Activity
Two kinds of morphology of Nb-TiO2 fibers can be produced by electrospinning.
Figure 4.2 shows SEM images of as-spun polymeric fibers (left column), ceramic fibers
of Nb-TiO2 with 10 at% of Nb (middle column) and catalysts of Pt@Nb-TiO2 with 10
at% of Nb (right column) with these two kinds of morphology. One was straight fiber
which could be obtained when the relative humidity was lower than 40% during
electrospinning process (Figure 4.2A). The diameters of as-spun polymeric fibers and
Nb-TiO2 fibers after hydrolysis and sintering with morphology of straight fiber were 181
nm and 164 nm, respectively. The other was beaded fiber which could be obtained when
the relative humidity was kept higher than 40% (Figure 4.2B). The diameters of fibers
before and after sintering were 183 nm and 170 nm, respectively. The sizes of the beads
were 368 nm and 343 nm, respectively.

73
Chapter 4
Figure 4.2. SEM images of (A1 and B1) as-spun polymeric fibers, (A2 and B2) ceramic
fibers of Nb-TiO2 with 10 at% of Nb after hydrolysis and (A3 and B3) sintering and
catalysts of Pt@Nb-TiO2 with 10 at% of Nb after 40-cycle ALD of Pt NPs. The
morphologies of the fibers were: (A) straight fiber and (B) beaded fiber.
During the electrospinning process, ceramic precursors contacted with the
moisture in the air and were hydrolyzed partially. Meanwhile, the condensation reaction
happened.48-49
The rate of hydrolysis and condensation reactions increased when the
relative humidity of the environment increased. The molecular weight of ceramic
precursors grew as the hydrolysis and condensation reactions continued, leading the
increase of the viscosity of electrospun solution. In summary, the viscosity increased with
the relative humidity. Then the balance of the Coulomb repulsive force and the surface
74
Chapter 4
tension, which had close relationship with viscosity, was destroyed. As a result,
electrospun jet became unstable and beads began to form when the relative humidity was
higher than 40%.50
In the following, Pt NPs were deposited onto the support membrane of Nb-TiO2
with 10 at% of Nb with these two kinds of morphology by 40-cycle ALD respectively.
Although the morphology and size of the Nb-TiO2 supports were different, the diameter
of Pt NPs were all around 14 nm (Figure 4.2.A3 and B3). Thus, the size of Pt NPs
apparently depended only on the operating temperatures of the Pt precursors and ALD
chamber, and the number of ALD growth cycles.51-52
Then electrochemical measurement
was carried out to study the area-specific ORR activity (is) of the catalyst membranes
with these morphologies. The area-specific activity of catalyst membrane with
morphology of straight fiber was 0.079 ± 0.008 mA/cm2
Pt at 0.9 V (versus RHE), and the
one with beaded fiber was 0.16 ± 0.059 mA/cm2
Pt. The activity of the catalyst membrane
with the morphology of straight fiber was much lower than the one with beaded fiber due
to the difference of porosity. The porosity of the support membrane with morphology of
beaded fiber was supposed to be higher due to the existence of beads, leading facilely
deposition of Pt NPs into the inner holes of membrane during ALD process. So the
activity of catalyst membrane with morphology of straight fibers was lower.
75
Chapter 4
4.3.3 Effect of Nb-doped Percentage on Electrocatalytic Activity
Different amount of niobium (5 at%, 10 at% and 25 at%) were doped into TiO2 to
form Nb-TiO2 support membranes by varying the Nb(OEt)5/Ti(OiPr)4 atomic ratio from
5 : 95, to 10 : 90 and to 25 : 75 in the electrospun solution to improve the conductivity of
the supports while other parameters were maintained the same. Pt NPs were loaded onto
these membranes by 40-cycle ALD. Figure 4.3 shows SEM images of as-spun polymeric
fibers (left column), Nb-TiO2 fibers (middle column) and Pt@Nb-TiO2 catalysts (right
column). Table 4.1 summarizes the diameter of the fibers and size of the beads of as-spun
polymeric and ceramic Nb-TiO2 fibers with different doping amount of Nb. The diameter
of Nb-TiO2 fibers did not change much, when compared with the as-spun polymeric
fibers. Void spaces were generated after the pyrolysis in air due to the removal of PVAc
and to the homogeneous nature of the preceramic mixture of PVAc and metal alkoxide
precursors (Figure 4.3, middle column). The ceramic fibers were continuous and made of
small, crystal domains without preferred orientation (Figure 4.4). Although the
morphology of fibers were different at the different compositions of Nb-TiO2 ceramic,
the diameter of Pt NPs deposited by 40-cycle ALD were all around 14 nm as mentioned
in Section 4.3.2.

76
Chapter 4
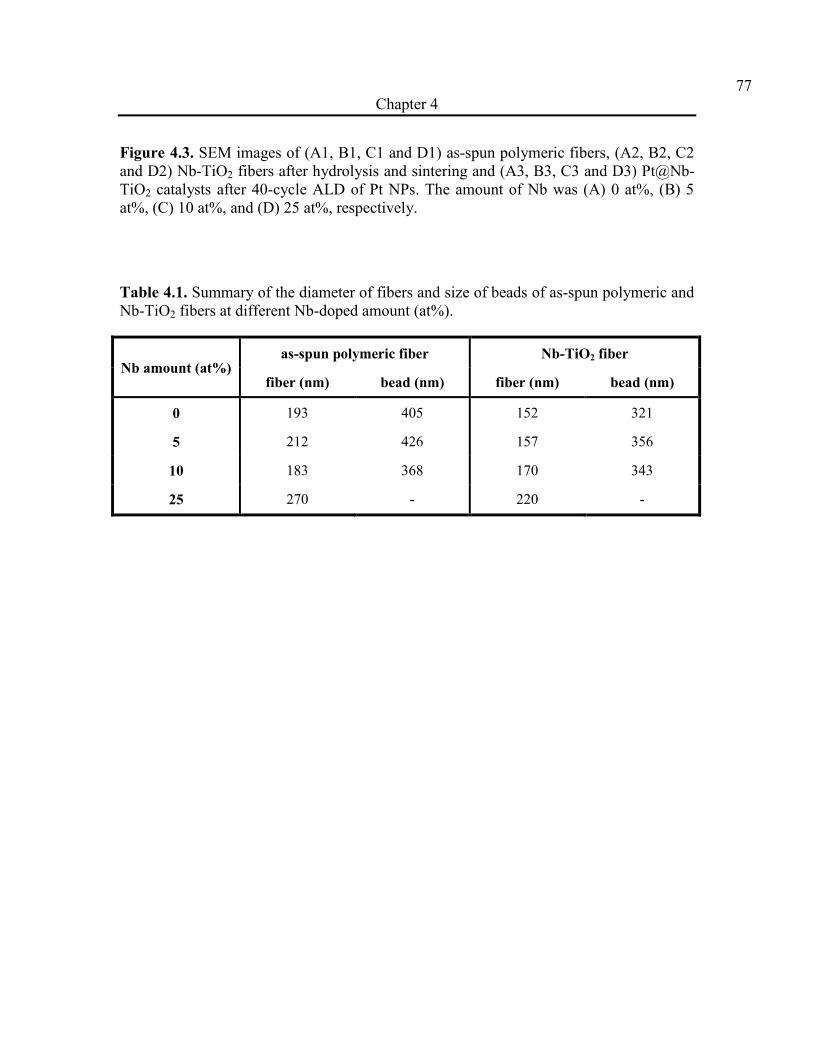
77
Chapter 4
Figure 4.3. SEM images of (A1, B1, C1 and D1) as-spun polymeric fibers, (A2, B2, C2
and D2) Nb-TiO2 fibers after hydrolysis and sintering and (A3, B3, C3 and D3) Pt@Nb-
TiO2 catalysts after 40-cycle ALD of Pt NPs. The amount of Nb was (A) 0 at%, (B) 5
at%, (C) 10 at%, and (D) 25 at%, respectively.
Table 4.1. Summary of the diameter of fibers and size of beads of as-spun polymeric and
Nb-TiO2 fibers at different Nb-doped amount (at%).
Nb amount (at%) as-spun polymeric fiber Nb-TiO2 fiber
fiber (nm) bead (nm) fiber (nm) bead (nm)
0 193 405 152 321
5 212 426 157 356
10 183 368 170 343
25 270 - 220 -

78
Chapter 4
Figure 4.4. TEM micrograph of TiO2 fiber.
XRD patterns of the support membranes only show the diffraction peaks, which
could be assigned to anatase phase of TiO2 (Figure 4.5). No diffraction peaks from
niobium oxide were observed, which indicates that Nb was incorporated into the TiO2
crystal structure. The formation of mixed oxide ceramic could be attributed to the similar
ionic radii between the two metal ions. Increased Nb amount in the ceramic resulted in
large lattice strain and the shift in the lattice parameters.53-54
The XRD peaks of Nb-TiO2
shifted to the low 2θ angles gradually when the amount of Nb increased, primarily
because of relative large radius of Nb.

79
Chapter 4
Figure 4.5. XRD patterns of Nb-TiO2 fibers with different amount of Nb. XRD patterns
of anatase TiO2 are shown by the black lines as a reference based on the JCPDS database
(No. 84-1286).
Figure 4.6 shows the dependence of area-specific ORR activities (is) of Pt@Nb-
TiO2 catalyst membranes on the amount of Nb. The area-specific activity changed from
0.0084 mA/cm2
Pt for Pt@TiO2, to 0.086 mA/cm2
Pt for Pt@Nb-TiO2 with 5 at% of Nb,
and to 0.16 mA/cm2
Pt for Pt@Nb-TiO2 with 10 at% of Nb at 0.9 V (versus RHE). The
catalyst membrane of Pt@Nb-TiO2 with 10 at% of Nb showed a ~20-fold enhancement
in ORR activity over the Pt@TiO2 membrane. Increasing the Nb amount further to 25%
did not result in further increase in ORR activity. Since there was no major difference in
size and shape of the Pt NPs, the change in catalytic activity could largely attributed to

80
Chapter 4
the Nb-TiO2 fiber membranes. It is known that the conductivity of Nb-doped TiO2
increases with the relative amount of Nb in thin film55
and powders.56-57
Wang et al.
reported that the conductivity of Nb-doped titania powders changed from 4.9 × 10⁻⁸
S·cm-
1, to
9.6 × 10
-7 S·cm
-1, to 7.9 × 10
-5 S·cm
-1 and to 1.2 × 10
-3 S·cm
-1 when the amount of
Nb increased from 0 at%, to 5 at%, to 10 at% and to 20 at%.57
Thus, the area-specific
ORR activities of Pt@Nb-TiO2 catalyst membrane increased when the percentage of Nb
increased from 0 at% to 10 at% due to improvement of conductivity of the ceramic
support. However, when the Nb-doped amount increased to 25 at%, the morphology of
support was straight fiber while others were beaded fiber (Figure 4.3). According to
Section 4.3.2, the area-specific activity of Pt@Nb-TiO2 catalysts would be higher if the
morphology of support was beaded fiber. This kind of morphology could be obtained if
the relative humidity of environment was maintained higher than 40% when Nb-doped
percentage was between 0 at% and 10 at%. If the Nb amount increased to 25 at%, only
straight fibers were obtained. Due to the differences of morphology, the activity of Pt@
Pt@Nb-TiO2 with 25 at% of Nb decreased.

81
Chapter 4
Figure 4.6. Plot showing the dependence of area-specific ORR activities of Pt@Nb-TiO2
catalyst membrane at 0.9 V (versus RHE) on Nb-doped percentage in the ceramic fibers.
4.3.4 Effect of ALD Cycles and Post-treatment on Electrocatalytic Activity
ALD is typically used to deposit thin films of oxides on flat substrate through a
self-limiting process. When ALD was used to grow Pt on substrates, however, discrete Pt
NPs formed and dispersed uniformly over the supports (Figure 4.7). As the number of
ALD cycles increased, the size of Pt NPs grew up and the distance between isolated Pt
NPs decreased (Figure 4.7A-C) until the Pt nanocrystals became to connect with each
other (Figure 4.7D). Normally the reactivity difference between substrate and Pt active
sites led to a preference for Pt NPs to grow up rather than to nucleate new particles on the
substrate. But sometimes, new particles also nucleated with the growth of large Pt NPs
showing obvious small particles (Figure 4.7C). The average size of Pt NPs on Nb-TiO2

82
Chapter 4
with 10 at% of Nb was 4.5 nm after the growth of 10 ALD cycles, 9.2 nm after 20 cycles
and 14 nm after 40 cycles at the post-treatment temperature of 200 °C. If the number of
ALD cycles increased to 80, Pt particles became to connect with each other.
As the ALD process of Pt ended with an oxygen pulse, the outer layer of Pt NPs
was covered with PtO (Scheme 4.1B).52
Thus the catalyst membranes of Pt@Nb-TiO2
were post-treated at 200 °C in 5% H2 w/ Ar atmosphere to reduce PtO to Pt. This
procedure did not affect the size and morphology of Pt NPs. To check the effect of
temperature on ORR activity, the membranes were treated at 500 °C in 5% H2 w/ Ar. At
this temperature, the size and morphology of Pt NPs changed. Pt NPs would migrate and
coalesce on the surface of support at high temperature according to Smoluchowski
model; and atoms from small Pt NPs can evaporate and condense on larger ones in a
process similar to the Ostwald ripening of dispersed precipitates in solution.58-59
So Pt
NPs grew up when post-treated at 500 °C.60
The sizes of Pt NPs increased to 7.5 nm for
sample made after 10 ALD cycles, 12.6 nm after 20 cycles, and 18.7 nm after 40 cycles
(Figure 4.7 E-G). The Pt particles also became connected if the number of ALD cycle
increased to 80 (Figure 4.7H). In addition, the surface of Pt NPs was not smooth; edges
and faces were noticed obviously because of the crystallite growth of Pt NPs at high
temperature (Figure 4.7G and H).

83
Chapter 4
Figure 4.7. SEM images of Pt@Nb-TiO2 catalysts with 10 at% of Nb obtained by
different numbers of ALD cycle and different temperature of post-treatment in 5% H2 w/
Ar atmosphere. (A-D) were treated at 200 °C. (E-H) were treated at 500 °C. The numbers
of ALD cycle were as following: (A, E) 10, (B, F) 20, (C, G) 40, and (D, H) 80.
The area-specific ORR activities of catalyst membrane of Pt@Nb-TiO2 with 10
at% of Nb increased with the number of ALD cycle (Figure 4.8). Weight percentage of Pt
in the catalyst increased from 49% for catalyst membrane with 10 ALD cycles, to 65%
with 20 cycles, to 80% with 40 cycles, and to 87% with 80 cycles, based on the energy
dispersive X-ray analysis. The increase in weight percentage of Pt NPs could also help to
improve the conductivity of catalyst membrane.

84
Chapter 4
Figure 4.8. Plot showing the dependence of area-specific ORR activities of Pt@Nb-TiO2
with 10 at% of Nb at 0.9 V (versus RHE) on the number of ALD cycle for making Pt NPs,
and the temperature of post-treatment in 5% H2 w/ Ar atmosphere.
Comparing area-specific activities of the Pt@Nb-TiO2 catalyst membranes with
the Pt NPs deposited by the same number of ALD cycle, the one post-treated at 500 °C
had higher activities. One reason was the increase of crystallinity of Pt NPs, which was
improved after the post-treatment at high temperature. In addition, hydrogen treatment at
high temperature could result in hydrogen doping into Nb-TiO2 support.38
The n-type
TiO2 formed by introducing hydrogen interstitial or substitution sites.61
Thus the
conductivity of the support was further increased. As a result, the area-specific activity of
catalyst membrane treated at 500 °C in H2 atmosphere was higher than those treated at
200 °C.

85
Chapter 4
4.3.5 Accelerated-stability Test
Accelerated-stability test was conducted to examine the electrochemical stability
of the Pt@Nb-TiO2 catalyst with 10 at% of Nb. The sample was pretreated by 40 cycles
of cyclic voltammetry (CV) measurement between 0.05 and 1.0 V (versus RHE) before
the test to active the catalyst. Subsequently, the first (1st) cycle of ORR and CV
measurements were tested. For the stability test, the potential was cycled 30000 times
between 0.6 and 1.0 V (versus RHE), while the ORR and CV measurements were
performed every 10000 cycles (Figure 4.9). Table 4.2 summarizes the electrochemically
active surface area (ECSA), kinetic-current density (ik) and area-specific activity (is) at
0.9 V (versus RHE). The ORR polarization curves barely changed after the 30000-cycle
accelerated-stability test, indicating that the catalyst membranes were very stable. Kinetic
current density decreased only within 10% after 30000 cycle accelerated-stability test
although area-specific activity decreased 25% (Table 4.2). The big differences between
kinetic current density and area-specific activity were due to the problem of ECSA
measurement.

86
Chapter 4
Figure 4.9. Accelerated-stability test of Pt@Nb-TiO2 catalyst with 10 at% Nb: (A) CV
curves and (B) ORR polarization curves measured at 1600 rpm.

87
Chapter 4
Table 4.2. Electrochemically active surface area (ECSA), kinetic current density (ik) and
area-specific current density (is) at 0.9 V (versus RHE) of Pt@Nb-TiO2 catalyst
membranes with 10 at% of Nb after a given number of potential cycles during
accelerated-stability test; relative percentages are given in parentheses.
# of Cycle ECA (cm2) ik (mA/cm
2) is (mA/cm
2Pt)
1st 14.74 (100%) 15.87 (100%) 0.21 (100%)
10000th
15.80 (107%) 16.25 (102%) 0.20 (96%)
20000th
16.61 (113%) 15.13 (95%) 0.18 (85%)
30000th
17.44 (118%) 14.15 (89%) 0.16 (75%)
The total ECSA increased slightly after the stability study. This result is
uncommon, because the ECSA value of the catalysts typically decreased after the
accelerated-stability test because of the corrosion of catalyst support, agglomeration and
sintering of Pt particles, and the detachment of Pt particles from the supports.11-12, 14
It
indicated that the catalyst membranes were very stable. The increase was attributed to
activation of the tiny holes in the fibers, which might only allow small H2 molecules to
get in and adsorb on the surface but not O2. So these types of H2 adsorbed sites could not
contribute the ORR. TEM micrographs of Pt@Nb-TiO2 catalyst with 10 at% of Nb before
and after 30000-cycle accelerated-stability test shows that the catalysts were kept largely
intact and the size of the Pt NPs did not have obvious change (Figure 4.10).

88
Chapter 4
Figure 4.10. TEM micrographs of Pt@Nb-TiO2 catalyst with 10 at% of Nb (A) before
and (B) after the accelerated-stability test.

89
Chapter 4
4.4 Conclusion
A facile method to fabricate niobium-doped titania supported platinum (Pt@Nb-
TiO2) catalyst membrane for oxygen-reduction reaction in polymer electrolyte membrane
fuel cell was developed by a new two-step approach, electrospinning and atomic layer
deposition. The process started with making niobium-doped titania fiber membrane by
electrospinning, followed by the deposition of Pt NPs using atomic layer deposition
technique. The area-specific activity of the catalyst membrane with support morphology
of beaded fiber was higher than the one with morphology of straight fiber. The area-
specific ORR activity of Pt@Nb-TiO2 catalyst membrane was increased by about 20
folds over the Pt@TiO2 fiber membrane, if 10 at% of Nb was incorporated into the
ceramic fibers. The area-specific activity also increased with the number of ALD cycles.
The ORR activity further increased to 0.28 mA/cm2
Pt at 0.9 V after post-treatment of the
catalyst membrane at high temperature in H2–containing atmosphere, due to conductivity
improvement of Nb-TiO2 fiber membrane and better crystalinity of Pt NPs. The results of
accelerated-stability test showed that the Pt@Nb-TiO2 catalyst membrane was highly
stable and lost only 10% of its initial activity after 30000 potential cycles (0.6 to 1.0 V vs.
RHE) under a strong acidic condition. This method has the advantages of simplicity in
making uniform ORR catalysts on new types of oxide supports with tunable conductivity
and without the need for surface organic ligand through a controllable two-step approach.

90
Chapter 4
4.5 References
1. Baxter, J.;Bian, Z. X.;Chen, G.;Danielson, D.;Dresselhaus, M. S.;Fedorov, A.
G.;Fisher, T. S.;Jones, C. W.;Maginn, E.;Kortshagen, U., et al. Nanoscale design to
enable the revolution in renewable energy. Energy Environ. Sci. 2009, 2, 559-588.
2. Carrette, L.;Friedrich, K. A.;Stimming, U. Fuel cells: Principles, types, fuels, and
applications. ChemPhysChem 2000, 1, 162-193.
3. Ogden, J. M. Prospects for building a hydrogen energy infrastructure. Annu. Rev.
Energ. Environ. 1999, 24, 227-279.
4. Sopian, K.;Daud, W. R. W. Challenges and future developments in proton
exchange membrane fuel cells. Renew. Energy 2006, 31, 719-727.
5. Wagner, F. T.;Lakshmanan, B.;Mathias, M. F. Electrochemistry and the Future of
the Automobile. J. Phys. Chem. Lett. 2010, 1, 2204-2219.
6. Debe, M. K. Electrocatalyst approaches and challenges for automotive fuel cells.
Nature 2012, 486, 43-51.
7. Peng, Z. M.;Yang, H. Designer platinum nanoparticles: Control of shape,
composition in alloy, nanostructure and electrocatalytic property. Nano Today 2009, 4,
143-164.
8. Xia, Y. N.;Xiong, Y. J.;Lim, B.;Skrabalak, S. E. Shape-Controlled Synthesis of
Metal Nanocrystals: Simple Chemistry Meets Complex Physics? Angew. Chem.-Int. Edit.
2009, 48, 60-103.
9. Wu, J.;Yang, H. Platinum-Based Oxygen Reduction Electrocatalysts. Accounts of
Chemical Research 2013, ASAP.
10. Dicks, A. L. The role of carbon in fuel cells. J. Power Sources 2006, 156, 128-
141.
11. Hasche, F.;Oezaslan, M.;Strasser, P. Activity, stability and degradation of multi
walled carbon nanotube (MWCNT) supported Pt fuel cell electrocatalysts. Phys. Chem.
Chem. Phys. 2010, 12, 15251-15258.
12. Koh, S.;Leisch, J.;Toney, M. F.;Strasser, P. Structure-activity-stability
relationships of Pt-Co alloy electrocatalysts in gas-diffusion electrode layers. J. Phys.
Chem. C 2007, 111, 3744-3752.
13. Li, W.;Lane, A. M. Investigation of Pt catalytic effects on carbon support
corrosion of the cathode catalyst in PEM fuel cells using DEMS spectra. Electrochem.
Commun. 2009, 11, 1187-1190.
14. von Deak, D.;Biddinger, E. J.;Ozkan, U. S. Carbon corrosion characteristics of
CNx nanostructures in acidic media and implications for ORR performance. J. Appl.
Electrochem. 2011, 41, 757-763.
15. Ferreira, P. J.;la O, G. J.;Shao-Horn, Y.;Morgan, D.;Makharia, R.;Kocha,
S.;Gasteiger, H. A. Instability of Pt/C electrocatalysts in proton exchange membrane fuel
cells - A mechanistic investigation. J. Electrochem. Soc. 2005, 152, A2256-A2271.

91
Chapter 4
16. Shao, Y. Y.;Yin, G. P.;Gao, Y. Z. Understanding and approaches for the
durability issues of Pt-based catalysts for PEM fuel cell. J. Power Sources 2007, 171,
558-566.
17. Formo, E.;Lee, E.;Campbell, D.;Xia, Y. N. Functionalization of electrospun TiO2
nanofibers with Pt nanoparticles and nanowires for catalytic applications. Nano Lett.
2008, 8, 668-672.
18. Gojkovic, S. L.;Babic, B. M.;Radmilovic, V. R.;Krstajic, N. V. Nb-doped TiO2 as
a support of Pt and Pt-Ru anode catalyst for PEMFCs. J. Electroanal. Chem. 2010, 639,
161-166.
19. Huang, S. Y.;Ganesan, P.;Park, S.;Popov, B. N. Development of a Titanium
Dioxide-Supported Platinum Catalyst with Ultrahigh Stability for Polymer Electrolyte
Membrane Fuel Cell Applications. J. Am. Chem. Soc. 2009, 131, 13898-13899.
20. Huang, S. Y.;Ganesan, P.;Popov, B. N. Electrocatalytic activity and stability of
niobium-doped titanium oxide supported platinum catalyst for polymer electrolyte
membrane fuel cells. Appl. Catal. B-Environ. 2010, 96, 224-231.
21. Lim, D. H.;Lee, W. J.;Macy, N. L.;Smyrl, W. H. Electrochemical Durability
Investigation of Pt/TiO2 Nanotube Catalysts for Polymer Electrolyte Membrane Fuel
Cells. Electrochem. Solid State Lett. 2009, 12, B123-B125.
22. Park, K. W.;Seol, K. S. Nb-TiO2 supported Pt cathode catalyst for polymer
electrolyte membrane fuel cells. Electrochem. Commun. 2007, 9, 2256-2260.
23. von Kraemer, S.;Wikander, J.;Lindbergh, G.;Lundblad, A.;Palmqvist, A. E. C.
Evaluation of TiO2 as catalyst support in Pt-TiO2/C composite cathodes for the proton
exchange membrane fuel cell. J. Power Sources 2008, 180, 185-190.
24. Liu, Z. M.;Zhang, J. L.;Han, B. X.;Du, J. M.;Mu, T. C.;Wang, Y.;Sun, Z. Y.
Solvothermal synthesis of mesoporous EU2O3-TiO2 composites. Microporous
Mesoporous Mat. 2005, 81, 169-174.
25. Ding, B.;Kim, H.;Kim, C.;Khil, M.;Park, S. Morphology and crystalline phase
study of electrospun TiO2-SiO2 nanofibres. Nanotechnology 2003, 14, 532-537.
26. Li, D.;Xia, Y. N. Fabrication of titania nanofibers by electrospinning. Nano Lett.
2003, 3, 555-560.
27. Madhugiri, S.;Sun, B.;Smirniotis, P. G.;Ferraris, J. P.;Balkus, K. J. Electrospun
mesoporous titanium dioxide fibers. Microporous Mesoporous Mat. 2004, 69, 77-83.
28. Onozuka, K.;Ding, B.;Tsuge, Y.;Naka, T.;Yamazaki, M.;Sugi, S.;Ohno,
S.;Yoshikawa, M.;Shiratori, S. Electrospinning processed nanofibrous TiO2 membranes
for photovoltaic applications. Nanotechnology 2006, 17, 1026-1031.
29. Farmer, D. B.;Gordon, R. G. High density Ru nanocrystal deposition for
nonvolatile memory applications. J. Appl. Phys. 2007, 101.
30. Hsu, I. J.;Hansgen, D. A.;McCandless, B. E.;Willis, B. G.;Chen, J. G. Atomic
Layer Deposition of Pt on Tungsten Monocarbide (WC) for the Oxygen Reduction
Reaction. J. Phys. Chem. C 2011, 115, 3709-3715.
31. Christensen, S. T.;Elam, J. W.;Rabuffetti, F. A.;Ma, Q.;Weigand, S. J.;Lee,
B.;Seifert, S.;Stair, P. C.;Poeppelmeier, K. R.;Hersam, M. C., et al. Controlled Growth of

92
Chapter 4
Platinum Nanoparticles on Strontium Titanate Nanocubes by Atomic Layer Deposition.
Small 2009, 5, 750-757.
32. Park, H.;Kim, A.;Lee, C.;Lee, J. S.;Lee, J. Formation of Cu nanocrystals on 3-
mercaptopropyltrimethoxysilane monolayer by pulsed iodine-assisted chemical vapor
deposition for nonvolatile memory applications. Appl. Phys. Lett. 2009, 94.
33. Choi, J.;Park, H.;Hoffmann, M. R. Effects of Single Metal-Ion Doping on the
Visible-Light Photoreactivity of TiO2. J. Phys. Chem. C 2010, 114, 783-792.
34. Klosek, S.;Raftery, D. Visible light driven V-doped TiO2 photocatalyst and its
photooxidation of ethanol. J. Phys. Chem. B 2001, 105, 2815-2819.
35. Archana, P. S.;Jose, R.;Jin, T. M.;Vijila, C.;Yusoff, M. M.;Ramakrishna, S.
Structural and Electrical Properties of Nb-Doped Anatase TiO2 Nanowires by
Electrospinning. J. Am. Ceram. Soc. 2010, 93, 4096-4102.
36. Liu, J.;Yang, H. T.;Tan, W. W.;Zhou, X. W.;Lin, Y. A. Photovoltaic performance
improvement of dye-sensitized solar cells based on tantalum-doped TiO2 thin films.
Electrochim. Acta 2010, 56, 396-400.
37. Niishiro, R.;Kato, H.;Kudo, A. Nickel and either tantalum or niobium-codoped
TiO2 and SrTiO3 photocatalysts with visible-light response for H-2 or O-2 evolution
from aqueous solutions. Phys. Chem. Chem. Phys. 2005, 7, 2241-2245.
38. Sheppard, L. R.;Bak, T.;Nowotny, J.;Nowotny, M. K. Titanium dioxide for solar-
hydrogen V. Metallic-type conduction of Nb-doped TiO2. Int. J. Hydrog. Energy 2007,
32, 2660-2663.
39. Arbiol, J.;Cerda, J.;Dezanneau, G.;Cirera, A.;Peiro, F.;Cornet, A.;Morante, J. R.
Effects of Nb doping on the TiO2 anatase-to-rutile phase transition. J. Appl. Phys. 2002,
92, 853-861.
40. Bernasik, A.;Radecka, M.;Rekas, M.;Sloma, M. ELECTRICAL-PROPERTIES
OF CR-DOPED AND NB-DOPED TIO2 THIN-FILMS. Appl. Surf. Sci. 1993, 65-6,
240-245.
41. Paredis, K.;Ono, L. K.;Mostafa, S.;Li, L.;Zhang, Z. F.;Yang, J. C.;Barrio,
L.;Frenkel, A. I.;Cuenya, B. R. Structure, Chemical Composition, And Reactivity
Correlations during the In Situ Oxidation of 2-Propanol. J. Am. Chem. Soc. 2011, 133,
6728-6735.
42. Feng, Z. X.;Christensen, S. T.;Elam, J. W.;Lee, B.;Hersam, M. C.;Bedzyk, M. J.
Thermally induced nanoscale structural and morphological changes for atomic-layer-
deposited Pt on SrTiO3(001). J. Appl. Phys. 2011, 110.
43. Dameron, A. A.;Pylypenko, S.;Bult, J. B.;Neyerlin, K. C.;Engtrakul, C.;Bochert,
C.;Leong, G. J.;Frisco, S. L.;Simpson, L.;Dinh, H. N., et al. Aligned carbon nanotube
array functionalization for enhanced atomic layer deposition of platinum electrocatalysts.
Appl. Surf. Sci. 2012, 258, 5212-5221.
44. Liu, C.;Wang, C. C.;Kei, C. C.;Hsueh, Y. C.;Perng, T. P. Atomic Layer
Deposition of Platinum Nanoparticles on Carbon Nanotubes for Application in Proton-
Exchange Membrane Fuel Cells. Small 2009, 5, 1535-1538.

93
Chapter 4
45. de Miguel, S. R.;Scelza, O. A.;Roman-Martinez, M. C.;de Lecea, C. S.
M.;Cazorla-Amoros, D.;Linares-Solano, A. States of Pt in Pt/C catalyst precursors after
impregnation, drying and reduction steps. Appl. Catal. A-Gen. 1998, 170, 93-103.
46. Suh, D. J.;Park, T. J.;Ihm, S. K. EFFECT OF SURFACE OXYGEN GROUPS
OF CARBON SUPPORTS ON THE CHARACTERISTICS OF PD/C CATALYSTS.
Carbon 1993, 31, 427-435.
47. Torres, G. C.;Jablonski, E. L.;Baronetti, G. T.;Castro, A. A.;deMiguel, S.
R.;Scelza, O. A.;Blanco, M. D.;Jimenez, M. A. P.;Fierro, J. L. G. Effect of the carbon
pre-treatment on the properties and performance for nitrobenzene hydrogenation of Pt/C
catalysts. Appl. Catal. A-Gen. 1997, 161, 213-226.
48. Campostrini, R.;Ischia, M.;Palmisano, L. Pyrolysis study of sol-gel derived TiO2
powders - Part I. TiO2-anatase prepared by reacting titanium(IV) isopropoxide with
formic acid. J. Therm. Anal. Calorim. 2003, 71, 997-1009.
49. Campostrini, R.;Ischia, M.;Palmisano, L. Pyrolysis study of sol-gel derived TiO2
powders - Part III. TiO2-anatase prepared by reacting titanium(IV) isopropoxide with
acetic acid. J. Therm. Anal. Calorim. 2004, 75, 13-24.
50. Bhaskar, S.;Pollock, K. M.;Yoshida, M.;Lahann, J. Towards Designer
Microparticles: Simultaneous Control of Anisotropy, Shape, and Size. Small 2010, 6,
404-411.
51. Gu, D. F.;Baumgart, H.;Tapily, K.;Shrestha, P.;Namkoong, G.;Ao, X. Y.;Muller,
F. Precise Control of Highly Ordered Arrays of Nested Semiconductor/Metal Nanotubes.
Nano Res. 2011, 4, 164-170.
52. Setthapun, W.;Williams, W. D.;Kim, S. M.;Feng, H.;Elam, J. W.;Rabuffetti, F.
A.;Poeppelmeier, K. R.;Stair, P. C.;Stach, E. A.;Ribeiro, F. H., et al. Genesis and
Evolution of Surface Species during Pt Atomic Layer Deposition on Oxide Supports
Characterized by in Situ XAFS Analysis and Water-Gas Shift Reaction. J. Phys. Chem. C
2010, 114, 9758-9771.
53. Huang, Z. C.;Feng, J.;Pan, W. Electronic Structure and Optical Properties of N-
Doped Anatase TiO2 by First-Principles Calculations. Rare Metal Mat. Eng. 2011, 40,
475-477.
54. Liu, X. D.;Jiang, E. Y.;Li, Z. Q.;Song, Q. G. Electronic structure and optical
properties of Nb-doped anatase TiO(2). Appl. Phys. Lett. 2008, 92, 1-3.
55. Tasaki, C.;Oka, N.;Yagi, T.;Taketoshi, N.;Baba, T.;Kamiyama, T.;Nakamura,
S.;Shigesato, Y. Thermophysical Properties of Transparent Conductive Nb-Doped TiO2
Films. Jpn. J. Appl. Phys. 2012, 51.
56. Jung, S. Y.;Ha, T. J.;Seo, W. S.;Lim, Y. S.;Shin, S.;Cho, H. H.;Park, H. H.
Thermoelectric Properties of Nb-Doped Ordered Mesoporous TiO2. J. Electron. Mater.
2011, 40, 652-656.
57. Nguyen, S. T.;Yang, Y. H.;Wang, X. Ethanol electro-oxidation activity of Nb-
doped-TiO2 supported PdAg catalysts in alkaline media. Appl. Catal. B-Environ. 2012,
113, 261-270.
58. Bezerra, C. W. B.;Zhang, L.;Liu, H. S.;Lee, K. C.;Marques, A. L. B.;Marques, E.
P.;Wang, H. J.;Zhang, J. J. A review of heat-treatment effects on activity and stability of

94
Chapter 4
PEM fuel cell catalysts for oxygen reduction reaction. J. Power Sources 2007, 173, 891-
908.
59. Antolini, E.;Cardellini, F.;Giacometti, E.;Squadrito, G. Study on the formation of
Pt/C catalysts by non-oxidized active carbon support and a sulfur-based reducing agent.
J. Mater. Sci. 2002, 37, 133-139.
60. Han, K. S.;Moon, Y. S.;Han, O. H.;Hwang, K. J.;Kim, I.;Kim, H. Heat treatment
and potential cycling effects on surface morphology, particle size, and catalytic activity
of Pt/C catalysts studied by C-13 NMR, TEM, XRD and CV. Electrochem. Commun.
2007, 9, 317-324.
61. Pan, H.;Zhang, Y. W.;Shenoy, V. B.;Gao, H. J. Effects of H-, N-, and (H, N)-
Doping on the Photocatalytic Activity of TiO2. J. Phys. Chem. C 2011, 115, 12224-
12231.

95
Chapter 5
Chapter 5 Synthesis of Rutile TiO2 by Electrospinning and Its
Supported Pt Electrocatalysts for the Oxygen Reduction
Reaction
5.1 Introduction
Titanium dioxide (TiO2) is a good candidate as catalyst support because of its
large surface area, high mechanical resistance and excellent stability in acidic and
oxidative environments.1-2
However, the low conductivity of TiO2, which is only eight
orders of magnitude lower than that of carbon black (Vulcan XC-72), is a great deficit to
its application. Normally, there exist two crystal structures of TiO2; one is the anatase
phase, and the other is the rutile phase. At room temperature, the rutile TiO2 has a band
gap of 3.0 eV while the anatase has a band gap of 3.2 eV. Due to this difference in their
band gaps, the conductivity of the rutile TiO2 is higher than that of the anatase phase.3-4
It
was found that the conductivity of the rutile phase (610 µS·cm-1
) was almost three orders
of magnitude higher than that of the anatase phase (0.12 µS·cm-1
).5 The highest reported
conductivity of the rutile phase was 1.11 S·cm-1
by Brank et al., which was comparable
with carbon black.6
TiO2 nanomaterials can be prepared by many techniques including sol-gel
process7-8
, pyrolysis9, reactive sputtering
10-11, electron beam evaporation
12-13, plasma-
enhanced chemical vapor deposition14-16
, atomic-layer deposition17-18
, molecular beam
epitaxy19-21
and hydrothermal technique22
. All these methods only generated titanium

96
Chapter 5
dioxide powders or films. In contrast, electrospinning as a novel and direct technique is
able to make fibers with size ranging from nanometer to micrometer. TiO2 nanofibers
with high surface area could be obtained by electrospinning.23-27
In this work, rutile TiO2 fibers were successfully prepared by electrospinning and
pyrolysis. The morphology and crystal structure were discussed. Pt nanoparticles (NPs)
were deposited on these rutile TiO2 fibers by atomic layer deposition (ALD) technique.
The electrocatalytic activity of rutile-titania supported platinum (Pt@r-TiO2) for oxygen-
reduction reaction was studied.
5.2 Experimental Section
Materials. Polyvinyl acetate (PVAc, Mw 500,000), titanium (IV) isopropoxide
(Ti(OiPr)4, 99.999%) and niobium ethoxide (Nb(OEt)5, 99.95%) were purchased from
Sigma Aldrich. N,N-dimethyl formamide (DMF, anhydrous) was obtained from
Honeywell Burdick and Jackson. Acetic acid (glacial, 99.7%) was from Alfa Aesar.
Nafion 117 solution was from Fluka. All chemicals were used as received without further
purification.
Synthesis of Rutile TiO2 Fibers. Typically, 0.123 g PVAc was dissolved in 1 mL
DMF in glove box.28
After complete dissolution, 0.475 g Ti(OiPr)4 and 0.119 g acetic
acid were added into the solution in glove box. The resulting solution was mixed well and
electrospun at an accelerating voltage of 20 kV and at a flow rate of 1 mL/h. The
membrane of polymeric fibers was collected on a grounded aluminum foil placed 15 cm
below the spinneret. The membrane of polymeric fibers was then peeled off from foil

97
Chapter 5
using tweezers and left in the air for ~10 h to let the hydrolysis reaction go to completion.
Then the membrane was sintered in the air at 900 °C for 24 h to remove PVAc and allow
nucleation and growth of titania (TiO2) particles in the fiber structure. Titania doped with
10 at% niobium (Nb) fibers (Nb-TiO2) were fabricated with similar method as TiO2. In
particular, the mixture of Ti(OiPr)4 and Nb(OEt)5 was used instead of solo Ti(O
iPr)4. The
atomic ratio of Ti(OiPr)4 and Nb(OEt)5 was 9 : 1 and the total amount of Ti and Nb was
kept at 1.67 mmol.
Synthesis of Pt@r-Nb-TiO2 Catalysts. Atomic layer deposition (ALD) is
utilized to deposit Pt NPs onto the membrane of rutile Nb-TiO2 (r-Nb-TiO2) fibers. The
membrane of r-Nb-TiO2 fibers was fixed in a chuck and hung in the air inside the
chamber of ALD system (Savannah 100 & 200, Cambridge Nano Tech Inc.) to ensure
both side of the membrane to be exposed to the reactants. The chamber was kept at
270 °C. Platinum precursor, Trimethyl(methylcyclopentadienyl) platinum(IV)
((MeCp)Pt(CH3)3), was kept at 70 °C and gas lines were held at 150 °C to avoid
precursor condensation. High-purity O2 was used as the co-reactant, and high-purity N2
was used as both the carrier and purge gas. The flow rate of N2 was maintained at 5 sccm.
A typical ALD cycle was as follows: 2 s of Pt precursor pulse, 5 s of N2 purge, 2 s of O2
pulse and 28 s of N2 purge. Pt NPs were deposited by 40 ALD cycles. Before
electrochemical measurement, catalyst membrane of Pt loaded r-Nb-TiO2 (Pt@r-Nb-
TiO2) was treated at 200 °C in 5% H2 w/ Ar atmosphere for 2 hr.
Electrochemical Measurement. A three-electrode cell was used to perform the
electrochemical measurements. The working electrode was a glassy-carbon rotating-disk

98
Chapter 5
electrode (RDE; area: 0.196 cm2). Pt foil (1 cm × 1 cm) was used as the counter electrode.
A reversible hydrogen electrode (RHE) was used as the reference electrode, which was
placed in a separate compartment. The electrolyte for all of the measurements was 0.1 M
perchloric acid, which was diluted with de-ionized water from a 70% doubly distilled
stock solution (GFS Chemicals, USA). To prepare the working electrode, the Pt@Nb-
TiO2 catalyst was first dispersed in ethanol and the mixture was sonicated for 30 min. 5
µL of suspension was added onto RDE by a pipette and dried under air. It was repeated
until the surface of RDE was covered by a thin-uniform layer of the catalysts. Then 10
µL of 0.0125% (wt%) Nafion-ethanol solution was dropped on the surface of the thin
film to prevent the catalysts from detaching by the flow of testing solution. The
measurements of the total electrochemically active surface area (ECSA) were performed
by integrating the hydrogen adsorption from the cyclic voltammetry (CV) data, which
was recorded at room temperature in argon saturated solution of 0.1 M HClO4. The
potential scan rate was 50 mVs-1
for the CV measurements. The ORR measurements
were conducted at a rotation rate of 1600 rpm in 0.1 M HClO4, which was purged with
oxygen for 30 min prior to and during the measurements. The scan rate for the ORR
measurements was 10 mVs-1
in the positive direction. The area-specific activity was
obtained by normalizing the kinetic-current density against the ECSA values, and the
kinetic-current density was obtained from the Koutecky-Levich plot.
Characterization. The morphology of the fibers and Pt@r-Nb-TiO2 catalyst
membrane were studied by field emission scanning electron microscope (FE-SEM, Zeiss-
Leo DSM982) and field emission transmission electron microscopy (FE-TEM, FEI

99
Chapter 5
TECNAI F-20). Average diameter was measured by Image J (National Institutes of
Health, USA). Powder X-ray diffraction (PXRD) patterns were recorded on a Philips
MPD diffractometer with a Cu Kα X-ray source (λ = 1.5405 Å).
5.3 Results and Discussion
5.3.1 Synthesis and Characterization of r-TiO2 Fibers
Figure 5.1 shows the SEM images of as-spun preceramic fibers and TiO2 fibers
after pyrolysis and sintering. The morphology of preceramic fibers was straight fiber with
a diameter of 263 nm. After pyrolysis and sintering at 900 °C, the morphology of TiO2
changed to chains which consisted of pearl-like grains with a smooth grain surface. The
average diameter of the fibers was 191 nm. The size of the grains was not uniform,
ranging from 157 nm to 609 nm.

100
Chapter 5
Figure 5.1. SEM images of (A) as-spun preceramic fibers and (B) TiO2 fibers after
hydrolysis and sintering.
TEM micrograph shows that the chains of TiO2 fibers sintered at 900 °C were
consisted of grains which linked together loosely (Figure 5.2). Most grains only contacted
with two other grains. In other words, the end of one grain connected with the head of the
second grain; and the end of the second grain connected with the head of the third one,
and so on. Some adjacent grains just had edges contacted, and some had a small area
overlapped together. As a result, the chains of TiO2 were very fragile. Compared with
Figure 4.4, TiO2 fibers sintered at 500 °C were consisted with small crystal domains
without preferred orientation. It proved that it was polycrystalline structure. However,
TiO2 fibers sintered at 900 °C were consisted of directive grains, indicating that its
crystallinity was greatly increased. The morphology transformation was related to a
dramatic change in crystalline structure. When titania fibers were calcined at 900 °C, the
crystallite structure of titania changed into rutile phase. During crystallization, the crystal
domains aggregated together, which favored the round shape to minimize the surface
area.29-31

101
Chapter 5
Figure 5.2. TEM micrograph of TiO2 fibers sintered at 900 °C.
XRD pattern of TiO2 fibers sintered at 900 °C is shown in Figure 5.3. Strong
diffraction peaks were appeared, suggesting the formation of well crystalline phases after
the high temperature sintering. The diffraction peaks at 2θ of 27.4°, 36.1°, 39.2°, 41.2°,
44°, 54.3°, 56.6°, 62.8°, 64°, 69.0° and 69.8° could be indexed well to lattice planes of
rutile TiO2 (JCPDS, No.: 86-0147), suggesting rutile TiO2 was successfully formed.

102
Chapter 5
Figure 5.3. XRD patterns of TiO2 fibers sintered at 900 °C. XRD patterns of bulk rutile
TiO2 are shown by the red lines as a reference based on the JCPDS database (No. 86-
0147).
5.3.2 Synthesis and Characterization of r-Nb-TiO2 Fibers
10 at% of Nb(OEt)5 was mixed with Ti(OiPr)4 in the ceramic precursors to obtain
fibers of Nb-doped titania. Figure 5.4 shows the SEM images of as-spun preceramic
fibers and Nb-TiO2 fibers after pyrolysis and sintering at 900 °C. The morphology of
preceramic fibers was straight fiber with a diameter of 207 nm. After pyrolysis and
sintering, the morphology of Nb-TiO2 was chains consisted of stone-like grains with
sharp edge and smooth surface. The average diameter of the fibers was 183 nm.
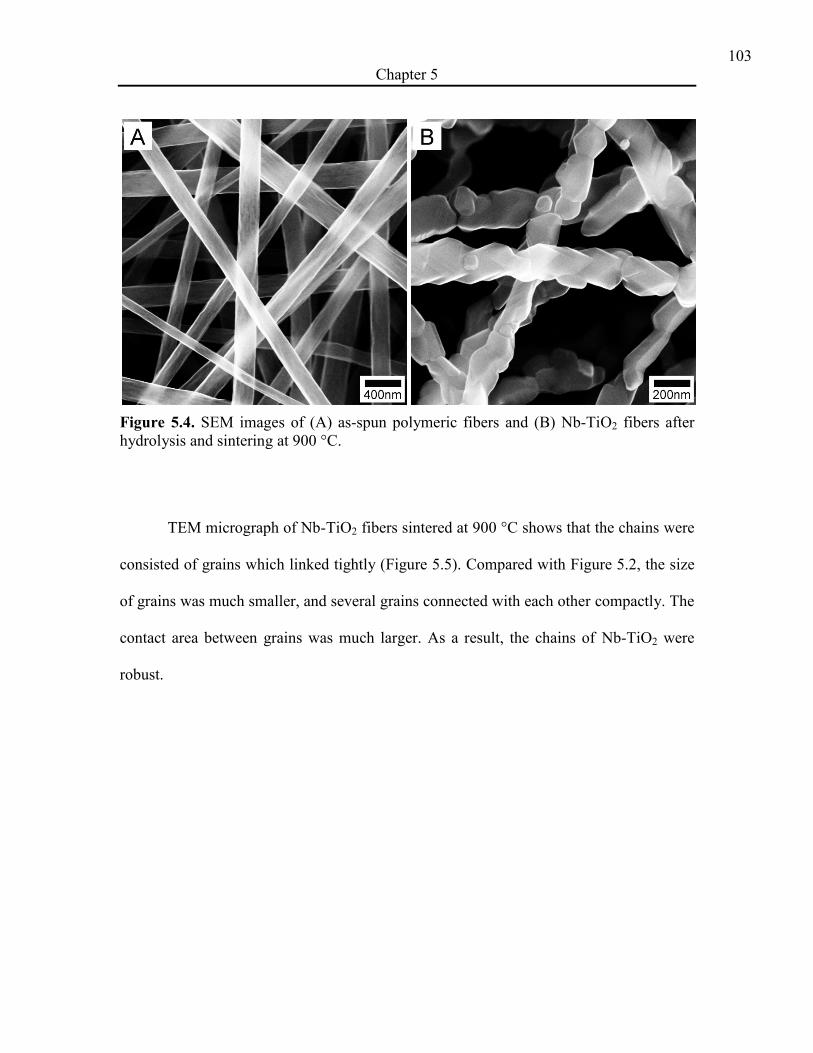
103
Chapter 5
Figure 5.4. SEM images of (A) as-spun polymeric fibers and (B) Nb-TiO2 fibers after
hydrolysis and sintering at 900 °C.
TEM micrograph of Nb-TiO2 fibers sintered at 900 °C shows that the chains were
consisted of grains which linked tightly (Figure 5.5). Compared with Figure 5.2, the size
of grains was much smaller, and several grains connected with each other compactly. The
contact area between grains was much larger. As a result, the chains of Nb-TiO2 were
robust.

104
Chapter 5
Figure 5.5. TEM micrograph of Nb-TiO2 fibers sintered at 900 °C.
Figure 5.6 shows XRD pattern of Nb0.1Ti0.9O2 fibers sintered at 900 °C, which
indicated a mixture of several different phases. The main diffraction peaks at 2θ of 27.4°,
36.1°, 39.2°, 41.2°, 44°, 54.3°, 56.6°, 62.8°, 64° 69.0° and 69.8° were indexed to lattice
planes of rutile TiO2 (JCPDS, No. 86-0147), suggesting rutile TiO2 was formed. The
diffraction peaks at 2θ of 25.3°, 37.8°, 48.1°, 54°, 55.1°, 62.8° and 75.1° were consisted
with the lattice planes of anatase TiO2 (JCPDS, No. 84-1286), indicating the existence of
anatase phase. In addition, the weak diffraction peaks at 2θ of 23.9°, 26°, 26.3°, 32.8°,
44.1°, 47.8°, 51.2°, 55.2° and 62.8° could be indexed to the lattice planes of TiNb2O7
(JCPDS, No. 77-1374), showing that a small amount of TiNb2O7 existed. In conclusion,

105
Chapter 5
the crystal structure of Nb-TiO2 was a mixture of three phases: the majority was rutile
phase of TiO2; minority was anatase phase of TiO2 and a little amount of TiNb2O7 phase.
Figure 5.6. XRD patterns of Nb-TiO2 fibers sintered at 900 °C. XRD patterns of rutile
TiO2 are shown by the red lines (No. 86-0147), anatase TiO2 by the blue lines (No. 84-
1286), and TiNb2O7 by the green lines (No. 77-1374) as references based on the JCPDS
database.
As mentioned in Chapter 4, Nb2O5 and TiO2 can form a complete range of solid
solutions NbxTi(1-x)O2+y due to the similar ionic radii of Nb5+
and Ti4+
.28, 32-33
The
solubility limit of Nb into titania is greater than 0.1 for the anatase phase (x > 0.1) and
0.06 for the rutile phase (x = 0.06).34
If the preceramic fibers were calcinated at 500 °C,
only anantase phase of TiO2 formed as shown in Chapter 4. When they were sintered at
900 °C, once the solubility limit of Nb atoms was surpassed, a ternary phase ascribed to

106
Chapter 5
TiNb2O7 showed up. In addition, high concentration of Nb helps to stabilize the anatase
phase, which prevents grain coarsening and phase transformation.34-35
As a result, mixed
phases of rutile and anatase TiO2 and TiNb2O7 formed. In addition, the size of grains was
smaller than the one of pure rutile phase.
5.3.3 ORR Activity of Pt@r-Nb-TiO2 Catalysts
Because r-TiO2 fibers were very fragile, the membrane of r-TiO2 always broke
when Pt nanoparticles were deposited on it by ALD technique. Then Pt NPs were only
deposited onto the surface of r-Nb-TiO2 fibers by 40-cycle of ALD. Figure 5.7 shows
SEM image of Pt@r-Nb-TiO2 catalysts. The size of Pt NPs was 14 nm.

107
Chapter 5
Figure 5.7. SEM image of Pt@ r-Nb-TiO2 catalysts.
Electrochemical measurement was conducted to examine the electrocatalytic
property of the Pt@r-Nb-TiO2 catalyst (Figure 5.8). The total electrochemically active
surface area (ECSA) was calculated by integrating the hydrogen adsorption from the
cyclic voltammetry data, which was 8.72 cm2. The area-specific activity (is) at 0.9 V
(versus RHE) was 0.25 ± 0.03 mA/cm2
Pt, which was much higher than the one of
Pt@anatase-Nb-TiO2 catalyst (is = 0.16 ± 0.06 mA/cm2
Pt) characterized in Chapter 4.3.3
due to the higher conductivity of rutile phase.

108
Chapter 5
Figure 5.8. Electrocatalytic property of Pt@r-Nb-TiO2 catalyst: (A) CV curves and (B)
ORR polarization curves measured at 1600 rpm.

109
Chapter 5
5.4 Conclusion
Rutile phase titania were successfully fabricated by electrospinning, hydrolysis
and sintering at 900 °C. The morphology of r-TiO2 was chains consisted of pearl-like
grains with a smooth grain surface. Rutile phase titania doped with 10 at% niobium was
also synthesized under the same process. XRD pattern showed that the crystal structure of
r-Nb-TiO2 was actually a mixed phase of rutile and anatase TiO2 and TiNb2O7, although
rutile phase occupied the major part. The morphology of r-Nb0.1Ti0.9O2 was chains
consisted of stone-like grains with sharp edge and smooth surface. The area-specific
activity of Pt@r-Nb-TiO2 catalyst at 0.9 V (versus RHE) increased to 0.25 ± 0.03
mA/cm2
Pt due to the improvement of the conductivity of the support, compared with the
one of anatase r-Nb-TiO2 support.
5.5 References
1. Liu, Z. M.;Zhang, J. L.;Han, B. X.;Du, J. M.;Mu, T. C.;Wang, Y.;Sun, Z. Y.
Solvothermal synthesis of mesoporous EU2O3-TiO2 composites. Microporous
Mesoporous Mat. 2005, 81, 169-174.
2. Leroux, F.;Dewar, P. J.;Intissar, M.;Ouvrard, G.;Nazar, L. F. Study of the
formation of mesoporous titania via a template approach and of subsequent Li insertion. J.
Mater. Chem. 2002, 12, 3245-3253.
3. Fujishima, A.;Honda, K. ELECTROCHEMICAL PHOTOLYSIS OF WATER
AT A SEMICONDUCTOR ELECTRODE. Nature 1972, 238, 37-+.
4. Gratzel, M. Photoelectrochemical cells. Nature 2001, 414, 338-344.
5. Chhina, H.;Susac, D.;Campbell, S.;Kesler, O. Transmission Electron Microscope
Observation of Pt Deposited on Nb-Doped Titania. Electrochem. Solid State Lett. 2009,
12, B97-B100.
110
Chapter 5
6. Huang, S. Y.;Ganesan, P.;Popov, B. N. Electrocatalytic activity and stability of
niobium-doped titanium oxide supported platinum catalyst for polymer electrolyte
membrane fuel cells. Appl. Catal. B-Environ. 2010, 96, 224-231.
7. Chrysicopoulou, P.;Davazoglou, D.;Trapalis, C.;Kordas, G. Optical properties of
very thin (< 100nm) sol-gel TiO2 films. Thin Solid Films 1998, 323, 188-193.
8. Lin, H.;Kozuka, H.;Yoko, T. Preparation of TiO2 films on self-assembled
monolayers by sol-gel method. Thin Solid Films 1998, 315, 111-117.
9. Murugavel, P.;Kalaiselvam, M.;Raju, A. R.;Rao, C. N. R. Sub-micrometre
spherical particles of TiO2, ZrO2, and PZT by nebulized spray pyrolysis of metal-organic
precursors. J. Mater. Chem. 1997, 7, 1433-1438.
10. Georgson, M.;Roos, A.;Ribbing, C. G. THE INFLUENCE OF PREPARATION
CONDITIONS ON THE OPTICAL-PROPERTIES OF TITANIUM NITRIDE BASED
SOLAR CONTROL FILMS. J. Vac. Sci. Technol. A-Vac. Surf. Films 1991, 9, 2191-2195.
11. Guerin, D.;Shah, S. I. Reactive-sputtering of titanium oxide thin films. J. Vac. Sci.
Technol. A-Vac. Surf. Films 1997, 15, 712-715.
12. Jin, Y. S.;Choi, H. W. Properties of Dye-Sensitized Solar Cells with TiO2
Passivating Layers Prepared by Electron-Beam Evaporation. J. Nanosci. Nanotechnol.
2012, 12, 662-667.
13. Rao, K. N.;Mohan, S. OPTICAL-PROPERTIES OF ELECTRON-BEAM
EVAPORATED TIO2 FILMS DEPOSITED IN AN IONIZED OXYGEN MEDIUM. J.
Vac. Sci. Technol. A-Vac. Surf. Films 1990, 8, 3260-3264.
14. Sirghi, L.;Nakamura, M.;Hatanaka, Y.;Takai, O. Atomic force microscopy study
of the hydrophilicity of TiO2 thin films obtained by radio frequency magnetron
sputtering and plasma enhanced chemical vapor depositions. Langmuir 2001, 17, 8199-
8203.
15. Hajkova, P.;Spatenka, P.;Krumeich, J.;Exnar, P.;Kolouch, A.;Matousek, J.;Koci,
P. Antibacterial effect of silver modified TiO2/PECVD films. Eur. Phys. J. D 2009, 54,
189-193.
16. Lee, Y. H.;Chan, K. K.;Brady, M. J. PLASMA-ENHANCED CHEMICAL-
VAPOR-DEPOSITION OF TIO2 IN MICROWAVE-RADIO FREQUENCY HYBRID
PLASMA REACTOR. J. Vac. Sci. Technol. A-Vac. Surf. Films 1995, 13, 596-601.
17. Aarik, J.;Aidla, A.;Uustare, T. Atomic-layer growth of TiO2-II thin films. Philos.
Mag. Lett. 1996, 73, 115-119.
18. Aarik, J.;Aidla, A.;Sammelselg, V.;Uustare, T. Effect of growth conditions on
formation of TiO2-II thin films in atomic layer deposition process. J. Cryst. Growth 1997,
181, 259-264.
19. Weng, X.;Fisher, P.;Skowronski, M.;Salvador, P. A.;Maksimovc, O. Structural
characterization of TiO2 films grown on LaAlO3 and SrTiO3 substrates using reactive
molecular beam epitaxy. J. Cryst. Growth 2008, 310, 545-550.
20. Li, X. Y.;Xiao, J. R.;Wang, Z. Y.;Li, S. W. Structural and magnetic properties of
Mn:TiO2 films grown by plasma-assisted molecular beam epitaxy. Mater. Sci. Eng. B-
Adv. Funct. Solid-State Mater. 2012, 177, 869-872.

111
Chapter 5
21. Gao, Y.;Liang, Y.;Chambers, S. A. Thermal stability and the role of oxygen
vacancy defects in strong metal support interaction - Pt on Nb-doped TiO2(100). Surf. Sci.
1996, 365, 638-648.
22. Tan, M.;Wang, G. Z.;Zhang, L. Thermal desorption in nanocrystalline TiO2. J.
Appl. Phys. 1996, 80, 1186-1189.
23. Ding, B.;Kim, H.;Kim, C.;Khil, M.;Park, S. Morphology and crystalline phase
study of electrospun TiO2-SiO2 nanofibres. Nanotechnology 2003, 14, 532-537.
24. Formo, E.;Lee, E.;Campbell, D.;Xia, Y. N. Functionalization of electrospun TiO2
nanofibers with Pt nanoparticles and nanowires for catalytic applications. Nano Lett.
2008, 8, 668-672.
25. Goldberg, M.;Langer, R.;Jia, X. Q. Nanostructured materials for applications in
drug delivery and tissue engineering. J. Biomater. Sci.-Polym. Ed. 2007, 18, 241-268.
26. Madhugiri, S.;Sun, B.;Smirniotis, P. G.;Ferraris, J. P.;Balkus, K. J. Electrospun
mesoporous titanium dioxide fibers. Microporous Mesoporous Mat. 2004, 69, 77-83.
27. Onozuka, K.;Ding, B.;Tsuge, Y.;Naka, T.;Yamazaki, M.;Sugi, S.;Ohno,
S.;Yoshikawa, M.;Shiratori, S. Electrospinning processed nanofibrous TiO2 membranes
for photovoltaic applications. Nanotechnology 2006, 17, 1026-1031.
28. Archana, P. S.;Jose, R.;Jin, T. M.;Vijila, C.;Yusoff, M. M.;Ramakrishna, S.
Structural and Electrical Properties of Nb-Doped Anatase TiO2 Nanowires by
Electrospinning. J. Am. Ceram. Soc. 2010, 93, 4096-4102.
29. Park, J. Y.;Lee, I. H. Characterization and Morphology of Prepared Titanium
Dioxide Nanofibers by Electrospinning. J. Nanosci. Nanotechnol. 2010, 10, 3402-3405.
30. Son, W. K.;Cho, D.;Park, W. H. Direct electrospinning of ultrafine titania fibres
in the absence of polymer additives and formation of pure anatase titania fibres at low
temperature. Nanotechnology 2006, 17, 439-443.
31. Zhao, B. T.;Cai, R.;Jiang, S. M.;Sha, Y. J.;Shao, Z. P. Highly flexible self-
standing film electrode composed of mesoporous rutile TiO2/C nanofibers for lithium-ion
batteries. Electrochim. Acta 2012, 85, 636-643.
32. Arbiol, J.;Cerda, J.;Dezanneau, G.;Cirera, A.;Peiro, F.;Cornet, A.;Morante, J. R.
Effects of Nb doping on the TiO2 anatase-to-rutile phase transition. J. Appl. Phys. 2002,
92, 853-861.
33. Bernasik, A.;Radecka, M.;Rekas, M.;Sloma, M. ELECTRICAL-PROPERTIES
OF CR-DOPED AND NB-DOPED TIO2 THIN-FILMS. Appl. Surf. Sci. 1993, 65-6,
240-245.
34. Ruiz, A. M.;Dezanneau, G.;Arbiol, J.;Cornet, A.;Morante, J. R. Insights into the
structural and chemical modifications of Nb additive on TiO2 nanoparticles. Chem. Mat.
2004, 16, 862-871.
35. Ahmad, A.;Buzby, S.;Ni, C.;Shah, S. I. Effect of Nb and Sc doping on the phase
transformation of sol-gel processed TiO2 nanoparticles. J. Nanosci. Nanotechnol. 2008, 8,
2410-2418.

112
Chapter 6
Chapter 6 Conclusions and Future Research
6.1 Conclusions
The objective of this dissertation is to fabricate polymeric and ceramic fibers by
electrospinning technique, to control the morphology of fibers by adjusting the
parameters during electrospinning process, especially the humidity, and to explore the
application of the electrospun polymeric and ceramic fibers.
Chapter 2 is focused on preparation of polymeric fibers, poly(vinyl pyrrolidone)
(PVP) and understanding the influence of the relative humidity on the morphology, shape
of cross-section and the ultimate elongation of the electrospun fibers. In this chapter, PVP
fibers were successfully fabricated by a magnetic field-assisted electrospinning method;
especially helical peanut-shaped PVP ribbons were obtained at a particular condition. The
morphology of the electrospun fibers was significantly influenced by the relative
humidity. When the relative humidity of the environment decreased from 32% to 16%,
the morphology of the electrospun PVP fibers changed from straight fiber to helical
ribbon, and the percentage of helical ribbons increased to 99%. At the same time, the
cross-section of electrospun fibers changed from circle, to ellipse, and to peanut shape. In
addition, the ultimate elongation of electrospun PVP fibers was also affected by the
relative humidity. It was 33% for straight round fibers made at a relative humidity of 32%
and 43% for helical ribbons made at a relative humidity of 16%. The formation
mechanism of helical ribbons was discussed. It was explained based on the synergistic
interaction of bending instability of electrospun jet, and the rigidity of the polymer

113
Chapter 6
materials during the MFAE process, involving the mass decreasing rate and the diffusion
rate of the solvents. In addition, the effect of solvent property and concentration on the
morphology of electrospun PVP fibers were also discussed in this chapter.
Chapter 3-5 is concentrated on the fabrication of ceramic fibers by
electrospinning technique. Normally, this process is divided into two steps. At first,
preceramic fibers are electrospun from ceramic precursor with the help of guiding
polymer. Secondly, the preceramic fibers are transformed into ceramic fibers by the
pyrolysis process at high temperature.
In Chapter 3, silicon carbide (SiC) fibers were synthesized by electrospinning
from preceramic polymer without the help of guiding polymer, UV cure and pyrolysis
processes. The morphology and diameter of the electrospun preceramic fibers could be
controlled by varying mixtures of solvents. The importance of UV cure on morphology
preservation of SiC fibers was discussed. UV light could break double bonds of RD
material and generate free radicals. The free radicals attacked CH2 or Si-H group, leading
to the crosslink reaction and stability of preceramic fibers. As a result, the morphology
was preserved when transferring preceramic fiber into SiC fibers during pyrolysis process
at high temperature.
Chapter 4 and 5 describe a facile method to fabricate niobium-doped titania
supported platinum (Pt@Nb-TiO2) catalyst membrane by a new two-step approach,
electrospinning and atomic layer deposition, and explore the application of Pt@Nb-TiO2
catalyst in oxygen reducing reaction (ORR) for polymer electrolyte membrane fuel cell.
Chapter 4 is focus on electrospinning of anatase Nb-TiO2 fiber support and discussing the

114
Chapter 6
effect of fiber morphology, doping amount of niobium, number of ALD cycle and post-
treatment temperature on the catalyst activity of Pt@Nb-TiO2 membrane. The area-
specific activities of the catalysts membrane of Pt@Nb-TiO2 increased from 0.0084
mA/cm2
Pt, to 0.086 mA/cm2
Pt and to 0.16 mA/cm2
Pt at 0.9 V (versus RHE) when the
niobium atomic percentage increased from 0%, to 5% and to 10% due to the
improvement of conductivity. The area-specific activity also increased with the number
of atomic layer deposition cycles due to the increase of Pt weight percentage in the
catalysts. The activity could further increased to 0.28 mA/cm2
Pt at 0.9 V (versus RHE) by
post-treatment of the catalyst membrane at high temperature in H2 atmosphere, which
resulted in conductivity improvement of Nb-TiO2 fiber membrane and significant
crystallite growth of Pt. The 30000-cycle accelerated-stability test on the Pt@Nb-TiO2
catalyst membrane showed that it had high stability.
Chapter 5 is focused on the formation of rutile phase Nb-TiO2 (r-Nb-TiO2) fibers
by electrospinning. Rutile phase of titania (r-TiO2) fibers were successfully fabricated by
electrospinning, hydrolysis and sintering at 900 °C. The morphology of r-TiO2 was
chains consisted of pearl-like grains with a smooth grain surface. Rutile phase titania
doped with 10 at% niobium (r-Nb-TiO2) fibers was also synthesized under the same
process. But the crystal structure was a mixed phase of rutile and anatase TiO2 and
TiNb2O7, while rutile phase TiO2 occupied the major part. The morphology of r-Nb-TiO2
was chains consisted of stone-like grains with sharp edge and smooth surface. The area-
specific activity of Pt@Nb-TiO2 catalyst at 0.9 V (versus RHE) increased to 0.25 ± 0.03

115
Chapter 6
mA/cm2
Pt due to the improvement of the conductivity of the support, compared with the
one of anatase Nb-TiO2 support.
6.2 Future Research
6.2.1 Future Research of Helical Ribbons
Controllable morphology of electrospun fibers has been applied to guide the
growth of cells.1-5
As mentioned in Chapter 2, helical PVP ribbons could be obtained by
controlling the relative humidity of environment. This technique described in this work is
potentially useful for making biomaterials in tissue engineering. In addition, because the
ultimate elongation of helical ribbons is larger, this technique also offers a way to control
the mechanical property of electrospun fiber scaffolds.
6.2.2 Future Research of Electrospun Nb-TiO2 Fibers
(1) Cell-Polarization Studies
Chapter 4 and 5 mentioned the catalyst membranes of Pt@Nb-TiO2 can be
applied in polymer electrolyte membrane fuel cell (PEMFC). Normally, membrane
electrode assembly (MEA) in PEMFC is composed of a backing layer, a gas diffusion
layer and a catalyst layer.6-8
Our catalyst membrane could be used as the catalyst layer
directly to avoid complicated process of making catalyst inks and then spaying or
painting them onto a gas diffusion layer, because the catalyst layer is already in a
membrane form. But in these chapters, we only tested the oxygen-reduction reaction

116
Chapter 6
(ORR) activity of the catalyst membranes. It is just half-cell characterization. In the
future, full-cell characterization will be studied.
(2) Photoluminescence Studies
Reports show that rutile and anatase TiO2 have very different photoluminescence
spectrum.9-10
We have fabricated many different kinds of Nb-TiO2 fibers; for example,
Nb-TiO2 with different morphologies, niobium contents and crystal structures (pure
anatase phase, pure rutile phase and a mixed phase of rutile, anatase TiO2 and TiNb2O7).
The photoluminescence of these fibers will be tested in the future.
(3) Application to Water Gas Shift Reaction
A number of metal catalysts such as Pt,11-13
Au,14-15
Ru,16-17
and Re12, 18
loaded on
oxide and mixed oxide supports have been reported for the application to water gas shift
(WGS) reaction. As mentioned in Chapter 4 and 5, we have developed a facile method to
fabricate niobium-doped titania supported platinum catalyst membrane by a new two-step
approach, electrospinning and atomic layer deposition. These catalyst membranes have
high stability. In the future, we will try to apply it to WGS reaction.
6.3 References
1. Pham, Q. P.;Sharma, U.;Mikos, A. G. Electrospinning of polymeric nanofibers for
tissue engineering applications: A review. Tissue Eng. 2006, 12, 1197-1211.
2. Sill, T. J.;von Recum, H. A. Electro spinning: Applications in drug delivery and
tissue engineering. Biomaterials 2008, 29, 1989-2006.
3. Goldberg, M.;Langer, R.;Jia, X. Q. Nanostructured materials for applications in
drug delivery and tissue engineering. J. Biomater. Sci.-Polym. Ed. 2007, 18, 241-268.
4. Zhang, Y. Z.;Venugopal, J.;Huang, Z. M.;Lim, C. T.;Ramakrishna, S.
Characterization of the surface biocompatibility of the electrospun PCL-collagen
nanofibers using fibroblasts. Biomacromolecules 2005, 6, 2583-2589.

117
Chapter 6
5. Tay, C. Y.;Irvine, S. A.;Boey, F. Y. C.;Tan, L. P.;Venkatraman, S. Micro-/Nano-
engineered Cellular Responses for Soft Tissue Engineering and Biomedical Applications.
Small 2011, 7, 1361-1378.
6. Bauer, A.;Chevallier, L.;Hui, R.;Cavaliere, S.;Zhang, J. J.;Jones, D.;Roziere, J.
Synthesis and characterization of Nb-TiO2 mesoporous microsphere and nanofiber
supported Pt catalysts for high temperature PEM fuel cells. Electrochim. Acta 2012, 77,
1-7.
7. Selvarani, G.;Maheswari, S.;Sridhar, P.;Pitchumani, S.;Shukla, A. K. A PEFC
With Pt-TiO2/C as Oxygen-Reduction Catalyst. J. Fuel Cell Sci. Technol. 2011, 8.
8. Thepkaew, J.;Therdthianwong, A.;Therdthianwong, S. Key parameters of active
layers affecting proton exchange membrane (PEM) fuel cell performance. Energy 2008,
33, 1794-1800.
9. Jia, C. W.;Zhao, J. G.;Duan, H. G.;Xie, E. Q. Visible photoluminescence from
Er3+-doped TiO2 nanofibres by electrospinning. Mater. Lett. 2007, 61, 4389-4392.
10. Zhao, J. G.;Jia, C. W.;Duan, H. G.;Li, H.;Xie, E. Q. Structural properties and
photoluminescence of TiO2 nanofibers were fabricated by electrospinning. J. Alloy.
Compd. 2008, 461, 447-450.
11. Iida, H.;Igarashi, A. Structure characterization of Pt-Re/TiO2 (rutile) and Pt-
Re/ZrO2 catalysts for water gas shift reaction at low-temperature. Appl. Catal. A-Gen.
2006, 303, 192-198.
12. Iida, H.;Igarashi, A. Difference in the reaction behavior between Pt-Re/TiO2
(Rutile) and Pt-Re/ZrO2 catalysts for low-temperature water gas shift reactions. Appl.
Catal. A-Gen. 2006, 303, 48-55.
13. Subramanian, V.;Potdar, H. S.;Jeong, D. W.;Shim, J. O.;Jang, W. J.;Roh, H.
S.;Jung, U. H.;Yoon, W. L. Synthesis of a Novel Nano-Sized Pt/ZnO Catalyst for Water
Gas Shift Reaction in Medium Temperature Application. Catal. Lett. 2012, 142, 1075-
1081.
14. Daly, H.;Goguet, A.;Hardacre, C.;Meunier, F. C.;Pilasombat, R.;Thompsett, D.
The effect of reaction conditions on the stability of Au/CeZrO4 catalysts in the low-
temperature water-gas shift reaction. J. Catal. 2010, 273, 257-265.
15. Zhao, X. E.;Ma, S. G.;Hrbek, J.;Rodriguez, J. A. Reaction of water with Ce-
Au(111) and CeOx/Au(111) surfaces: Photoemission and STM studies. Surf. Sci. 2007,
601, 2445-2452.
16. Utaka, T.;Okanishi, T.;Takeguchi, T.;Kikuchi, R.;Eguchi, K. Water gas shift
reaction of reformed fuel over supported Ru catalysts. Appl. Catal. A-Gen. 2003, 245,
343-351.
17. Xu, W. Q.;Si, R.;Senanayake, S. D.;Llorca, J.;Idriss, H.;Stacchiola, D.;Hanson, J.
C.;Rodriguez, J. A. In situ studies of CeO2-supported Pt, Ru, and Pt-Ru alloy catalysts
for the water-gas shift reaction: Active phases and reaction intermediates. J. Catal. 2012,
291, 117-126.
18. Sato, Y.;Terada, K.;Hasegawa, S.;Miyao, T.;Naito, S. Mechanistic study of water-
gas-shift reaction over TiO2 supported Pt-Re and Pd-Re catalysts. Appl. Catal. A-Gen.
2005, 296, 80-89.

118
Chapter 6

119
Appendices
Appendices
Table A1. Physical properties of solvents.
Boiling Point
(℃)
Vapor Pressure
@ 20 °C
(mmHg)
Surface Tension
@ 25 °C
(Dynes/cm)
Dielectric
Constant
Ethanol 78 44.6 21.97 25.3
Water 100 17.5 71.99 80.1
Toluene 110-111 22 28.4 2.379
NMP 202 0.29 40.79 32.55
Dichloromethane 39.8-40 353 27.2 8.93
Citing from CRC Handbook of Chemistry and Physics. In Fluid Properties [Online]; 93rd
Edition; Haynes, W. M., Eds.; CRC Press / Taylor and Francis: Boca Raton, USA, 2013
(accessed January 1, 2013).