Electrophysiological Predictors of Clinical Response...
36
1 Electrophysiological Predictors of Clinical Response to Antidepressants Gerard E. Bruder, Craig E. Tenke and Jürgen Kayser Department of Psychiatry Columbia University College of Physicians & Surgeons and Division of Cognitive Neuroscience New York State Psychiatric Institute Contact Information: Address: Gerard Bruder, Craig Tenke & Jürgen Kayser New York State Psychiatric Institute Unit 50 1051 Riverside Drive, New York, NY 10032 E-mail: [email protected] ; [email protected] ; [email protected] Phone: 212-543-5468 In: The Clinical Handbook for the Management of Mood Disorders edited by John Mann, Steven Roose and Patrick McGrath, Cambridge University Press, in press.
-
Upload
hoangnguyet -
Category
Documents
-
view
239 -
download
0
Transcript of Electrophysiological Predictors of Clinical Response...

1
Electrophysiological Predictors of Clinical Response to Antidepressants
Gerard E. Bruder, Craig E. Tenke and Jürgen Kayser
Department of Psychiatry
Columbia University College of Physicians & Surgeons
and
Division of Cognitive Neuroscience
New York State Psychiatric Institute
Contact Information:
Address: Gerard Bruder, Craig Tenke & Jürgen Kayser
New York State Psychiatric Institute
Unit 50
1051 Riverside Drive,
New York, NY 10032
E-mail: [email protected]; [email protected];
Phone: 212-543-5468
In: The Clinical Handbook for the Management of Mood Disorders edited by John Mann,
Steven Roose and Patrick McGrath, Cambridge University Press, in press.

2
Introduction
Electrophysiological measures are important tools for assessing brain function,
which have found their main clinical use in Neurology for assessment of epilepsy, coma,
and integrity of neural circuits. They include the electroencephalogram (EEG) and
evoked or event-related potentials (ERPs). Electrophysiological measures have the
advantage of being noninvasive (i.e., no radioactive or magnetic field exposure),
economical, and provide continuous millisecond by millisecond recordings of brain
electrical activity. Although their temporal resolution far exceeds that of fMRI and PET,
electrophysiological measures have more limited spatial resolution. The use of
electrophysiological measures in Psychiatry has largely been in the research domain or to
measure and document seizure activity during electroconvulsive therapy (ECT).
Promising findings reviewed in this chapter point to a potential wider clinical role in
mood disorders and their treatment.
The EEG is typically measured using electrodes placed on the scalp (e.g., using an
elastic electrode cap). Clinical EEG recordings have traditionally been used in Psychiatry
to screen for brain disorders or to monitor cortical activity during ECT or sleep. A
description of the neural basis of the EEG and applications of clinical EEG is available in
the textbook by Niedermeyer and Lopes Da Silva (2004). Digital recording and analysis
of EEG has made possible quantitative measures, which usually involves doing a Fast
Fourier Transform (FFT) to measure the amplitude (power) of the EEG spectrum within
frequency ranges in the classical delta (1-4 Hz), theta (4-8 Hz), alpha (8-13 Hz), and beta
(13-30 Hz) bands. Although quantitative EEG measures may have some value for the
differential diagnosis of dementia and depression (Hughes and John, 1999), their clinical

3
utility as an adjunct for psychiatric diagnosis has not been demonstrated. There is,
however, a growing literature suggesting that quantitative EEG measures in the theta and
alpha bands, obtained prior to treatment of mood disorders or soon after it begins, predict
subsequent clinical response to antidepressants.
Evoked potentials or ERPs, which are averaged EEG epochs time-locked to the
onset of stimuli or other discrete events, have been widely used in clinical and research
settings. For instance, evoked potentials that occur in the first 12 milliseconds after onset
of clicks are used clinically to assess hearing in infants and for assessment of brainstem
lesions and multiple sclerosis. ERPs occurring about 100-200 milliseconds after the onset
of tones (N1 and P2 potentials) are indicative of early sensory or attentional processing,
and later ERPs (most notably the P3 potential) provide neurophysiologic correlates of
cognitive processing. Numerous studies have found a reduction of the P3 potential in
depressed patients, which is consistent with evidence of cognitive deficits in depression
(see Bruder et al., 2012, for a review of ERP studies in depression). This reduction is
greatest in patients having a melancholic or psychotic depression, and clinical
improvement is accompanied by an increase in P3 amplitude. P3 reduction is not,
however, specific to depression, but occurs in other neuropsychiatric disorders, and is
therefore not of value for diagnostic purposes. A more promising finding from a clinical
perspective has been evidence of a relationship between early auditory ERPs (N1, P2)
and response to SSRI antidepressants.
This chapter focuses selectively on EEG and ERP findings that have raised hopes
for the application of electrophysiological measures as clinical aides for selecting the
most appropriate course of treatment for depressed patients.

4
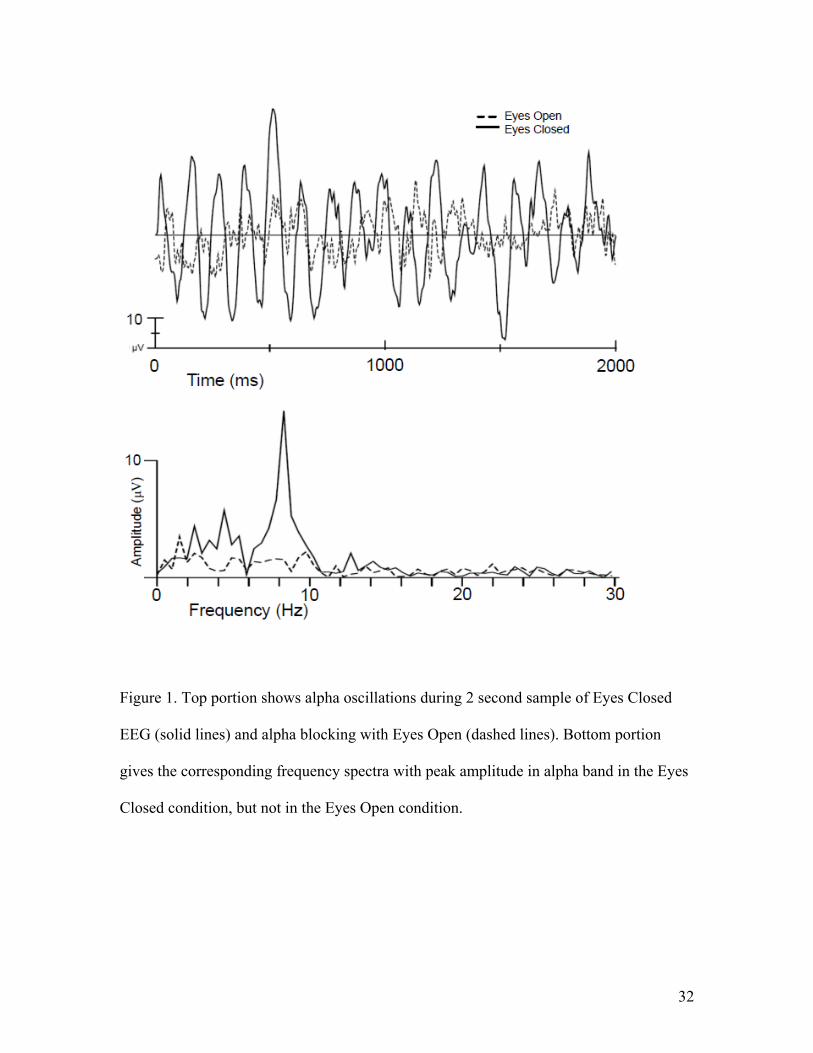
EEG Alpha Power and Asymmetry in Depression The alpha rhythm (8-13 Hz) is an oscillatory EEG pattern that is maximal when
an individual is in a relaxed, wakeful state with eyes closed, but is reduced (blocked)
when the individual becomes alert or when visual processes are engaged by opening the
eyes (see Figure 1). Alpha is thought of as an idling rhythm and is inversely related
cortical activity as indexed by PET measures of cerebral blood flow (Cook et al., 1998)
or fMRI measures of blood-oxygen level dependent (BOLD) signal in posterior regions
where alpha is greatest (Feige et al., 2005). EEG alpha has been used as an index of
relative cortical deactivation, with greater alpha (less activation) being found in depressed
patients than healthy controls (Polack & Schneider, 1990; Debener et al., 2000; Grin-
Yatsenko et al., 2010; Kemp et al., 2010). Studies have also reported abnormal regional
hemispheric asymmetry of alpha, with depressed patients showing relatively less activity
over left frontal (Gotlib et al., 1998; Henriques & Davidson, 1991; Kemp et al., 2010;
Stewart et al., 2010) or right parietal regions (Bruder et al., 1997; Kemp et al., 2010;
Kentgen et al., 2000; Reid et al., 1998; Stewart et al., 2011).
-------------------------------------------
Insert Figure 1 about here
-------------------------------------------
There have, however, been conflicting alpha asymmetry findings for depressed
patients. Thibodeau et al. (2006) reviewed findings of frontal alpha asymmetry in
depression and examined a number of possible moderator variables that could help
account for inconsistent findings. The moderate effect size for frontal alpha asymmetry
differences between depressed patients and controls (Cohen’s d=.54) and low test-retest
5
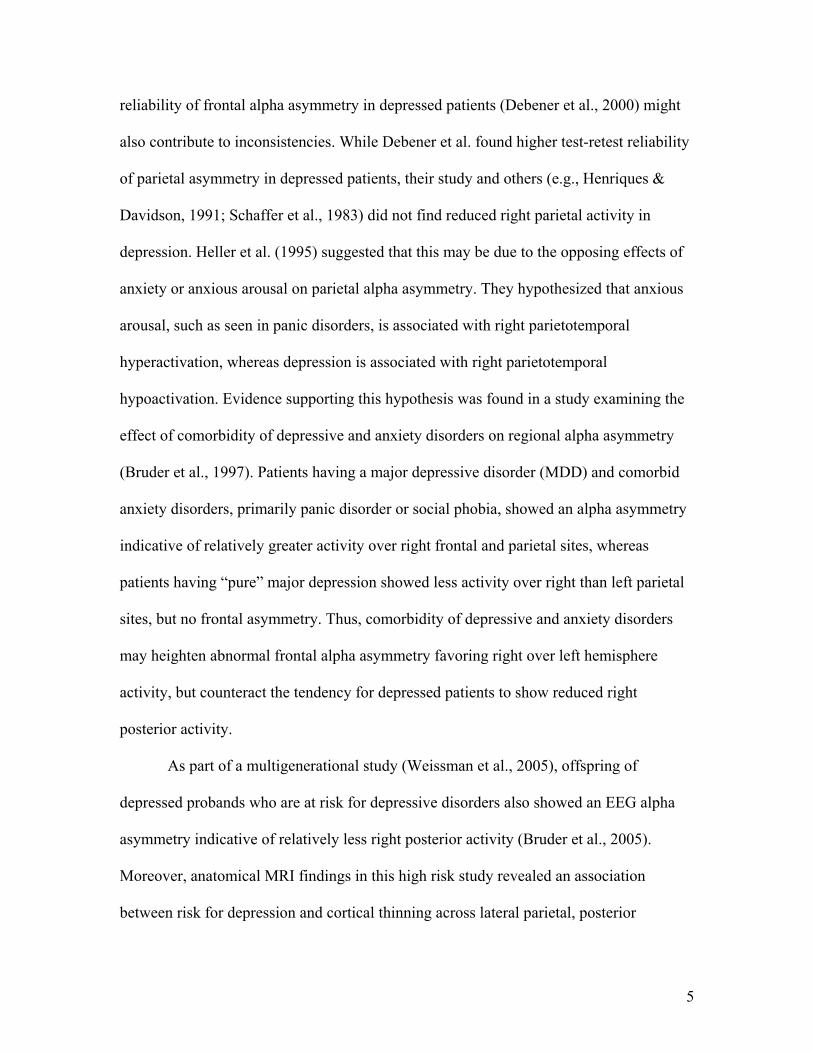
reliability of frontal alpha asymmetry in depressed patients (Debener et al., 2000) might
also contribute to inconsistencies. While Debener et al. found higher test-retest reliability
of parietal asymmetry in depressed patients, their study and others (e.g., Henriques &
Davidson, 1991; Schaffer et al., 1983) did not find reduced right parietal activity in
depression. Heller et al. (1995) suggested that this may be due to the opposing effects of
anxiety or anxious arousal on parietal alpha asymmetry. They hypothesized that anxious
arousal, such as seen in panic disorders, is associated with right parietotemporal
hyperactivation, whereas depression is associated with right parietotemporal
hypoactivation. Evidence supporting this hypothesis was found in a study examining the
effect of comorbidity of depressive and anxiety disorders on regional alpha asymmetry
(Bruder et al., 1997). Patients having a major depressive disorder (MDD) and comorbid
anxiety disorders, primarily panic disorder or social phobia, showed an alpha asymmetry
indicative of relatively greater activity over right frontal and parietal sites, whereas
patients having “pure” major depression showed less activity over right than left parietal
sites, but no frontal asymmetry. Thus, comorbidity of depressive and anxiety disorders
may heighten abnormal frontal alpha asymmetry favoring right over left hemisphere
activity, but counteract the tendency for depressed patients to show reduced right
posterior activity.
As part of a multigenerational study (Weissman et al., 2005), offspring of
depressed probands who are at risk for depressive disorders also showed an EEG alpha
asymmetry indicative of relatively less right posterior activity (Bruder et al., 2005).
Moreover, anatomical MRI findings in this high risk study revealed an association
between risk for depression and cortical thinning across lateral parietal, posterior

6
temporal and frontal cortices of the right hemisphere (Peterson et al., 2009). Alpha power
was found to correlate inversely with cortical thickness among individuals in this study,
particularly over the right posterior region, suggesting that EEG evidence of reduced
cortical activity was associated with increased cortical thinning (Bruder et al., in press).
Self-ratings of depression severity in adults having a MDD also correlated inversely with
PET measures of glucose metabolism in dorsal areas of prefrontal, occipital, temporal
and parietal cortex, predominantly in the right hemisphere (Milak et al., 2010).
In summary, abnormalities of EEG alpha power and asymmetry have been found
in depressed patients. Although there have been conflicting findings, alpha asymmetry
abnormalities may represent biological traits associated with risk for developing a
depressive disorder.
Alpha Power and Asymmetry in Antidepressant Responders and Nonresponders
A likely contributor to inconsistent alpha asymmetry findings is the clinical and
biological heterogeneity of depression. One approach for reducing this heterogeneity is to
divide a sample of unmedicated depressed patients into those who subsequently respond
favorably to a specific antidepressant and those who do not respond. Patients who
respond to an antidepressant with a specific mode of action, e.g., an SSRI, may share a
common biological substrate not present in nonresponders. Findings of pretreatment EEG
differences between responders and nonresponders also have potential clinical utility for
identifying predictors of clinical response, and personalizing treatment for individual
patients.
There is good agreement that pretreatment EEG alpha may differentiate patients
who respond to antidepressants from those who do not. Ulrich et al. (1986) found

7
increased alpha over occipital sites in depressed patients who eventually responded to
amitriptyline and they suggested that there are two subtypes of depression having
different pathophysiology and response to antidepressants. Prichep et al. (1993), using
cluster analysis of neurometric EEG features to identify clusters of patients having
distinctive EEG profiles, similarly found evidence for two subgroups among 27 patients
having an obsessive-compulsive disorder. About 82% of members of a subgroup with
increased relative alpha power in frontal and temporal regions responded well to an SSRI
antidepressant, while only 20% of members of a second cluster with increased relative
theta power were treatment responders. This neurometric technique was also used by
Suffin and Emory (1995) in a study of 54 depressed patients treated with an SSRI or
tricyclic antidepressant and they found 86% of treatment responders to have increased
relative alpha power in frontal and occipital regions. In a study of 29 patients having a
unipolar depressive disorder who were treated with a tricyclic antidepressant, Knott et al.
(1996) found that greater pretreatment relative alpha in responders than nonresponders
did not reach a conventional level of statistical significance. In summary, these early
studies suggest that increased alpha power, which was originally identified in depressed
patients by Polack & Schneider (1990), is particularly likely to be found among
depressed patients who respond to an SSRI or tricyclic antidepressant, although the
predictive value of this measure needs further study to make it clinically useful.
We confirmed the value of alpha power in predicting clinical response to an SSRI
and also found a difference in posterior alpha asymmetry between responders and
nonresponders (Bruder et al., 2008). Resting EEG scalp potentials were measured from
28 electrodes (nose reference) in 18 depressed patients before and after about 12 weeks of

8
treatment with fluoxetine, and 18 matched healthy controls were also tested. Treatment
responders (n=11) showed significantly greater alpha power when compared to
nonresponders (n=7) and controls, with the largest difference at occipital sites where
alpha was greatest. As shown in Figure 2, greater alpha power in responders than
-------------------------------
Insert Figure 2 about here
-------------------------------
nonresponders was present across the pre-treatment and post-treatment sessions and there
was no change in alpha following SSRI treatment. Test-retest reliability of alpha power
was high at both frontal and posterior sites (r ≥ .92), and is comparable to that found for
healthy adults for retest periods over one year (Smit et al., 2005). Elevated alpha has also
been found in depressed patients in a euthymic state (Pollock & Schneider, 1989), which
suggests that it reflects a stable biological trait in patients who respond favorably to
antidepressants. Responders in our study also differed from nonresponders in alpha
asymmetry at occipital sites, with responders having greater alpha (less activation) over
right than left occipital cortex and nonresponders showing the opposite asymmetry. The
difference in alpha asymmetry between SSRI responders and nonresponders is consistent
with our prior findings (Bruder et al., 2001), and did not change following treatment
(Figure 2). Test-retest correlations were, however, lower for alpha asymmetry (r≥ .63 at
frontal and posterior sites), which agrees with the lower test-retest correlations of alpha
asymmetry for healthy adults (Hagemann et al., 2005). To examine the value of alpha
power and asymmetry at occipital sites for predicting clinical response to an SSRI, the
average scores for healthy adults were used as a cutoff for dividing patients into those

9
who were greater or less than normal. Both alpha power and asymmetry showed
reasonable positive predictive value (i.e., response rate ≥ 72% for patients predicted to be
responders), but lower negative predictive value (i.e., nonresponse rate ≥ 56% for those
predicted to be nonresponders).
A recent study (Tenke et al., 2011) was designed to confirm the predictive value
of EEG alpha amplitude and asymmetry in an independent sample of patients. Resting
EEG was recorded with eyes open and eyes closed prior to treatment in a larger sample of
depressed patients (n=41) and in healthy controls (n=41). This study extended our prior
study in several respects. First, the predictive value of alpha was examined not only for
patients receiving an SSRI, but also those receiving dual treatment with an SSRI plus a
noradrenaline/dopamine reuptake inhibitor (NDRI; bupropion) or a
serotonin/noradrenaline reuptake inhibitor (SNRI; duloxetine or venlafaxine). Second, to
improve the spatial resolution of spectral topographies, EEG was recorded from a dense
array of recording electrodes (67 channels) and current source density (CSD) measures
were used to reduce volume conduction from distal sites, and avoid problems associated
with selection of a reference electrode. CSD measures are reference-free and indicate the
strength of underlying radial current generators (Nunez & Srinivasan, 2006; Kayser &
Tenke, 2006; Tenke & Kayser, 2005). Third, CSD measures were quantified using
frequency principal components analysis (fPCA) to derive empirically-based frequency
bands. Two factors corresponding to alpha sub-bands were examined: a high-alpha factor
(10.5 Hz peak) and a low alpha/theta (9.0 Hz peak), which included activity usually
classified as theta (4-8 Hz).

10
Significant differences in alpha were found between treatment responders (n=28)
and nonresponders (n=13), which were particularly evident for the eyes-closed condition
and were seen broadly across the low and high alpha bands. Figure 3A shows the
condition-dependent topographies, averaged across the low and high alpha bands, for
patients who responded to treatment (Clinical Global Improvement rating of “much or
very much improved”), nonresponders and healthy controls. Nonresponders had
significantly less alpha than responders and controls over posterior regions where alpha
was maximal for each group. The marked difference in alpha between responders and
nonresponders was present for patients who received monotherapy with an SSRI or dual
therapy (Figure 3B). It was seen at posterior sites over each hemisphere and there was no
significant difference in alpha asymmetry among groups.
-------------------------------
Insert Figure 3 about here
-------------------------------
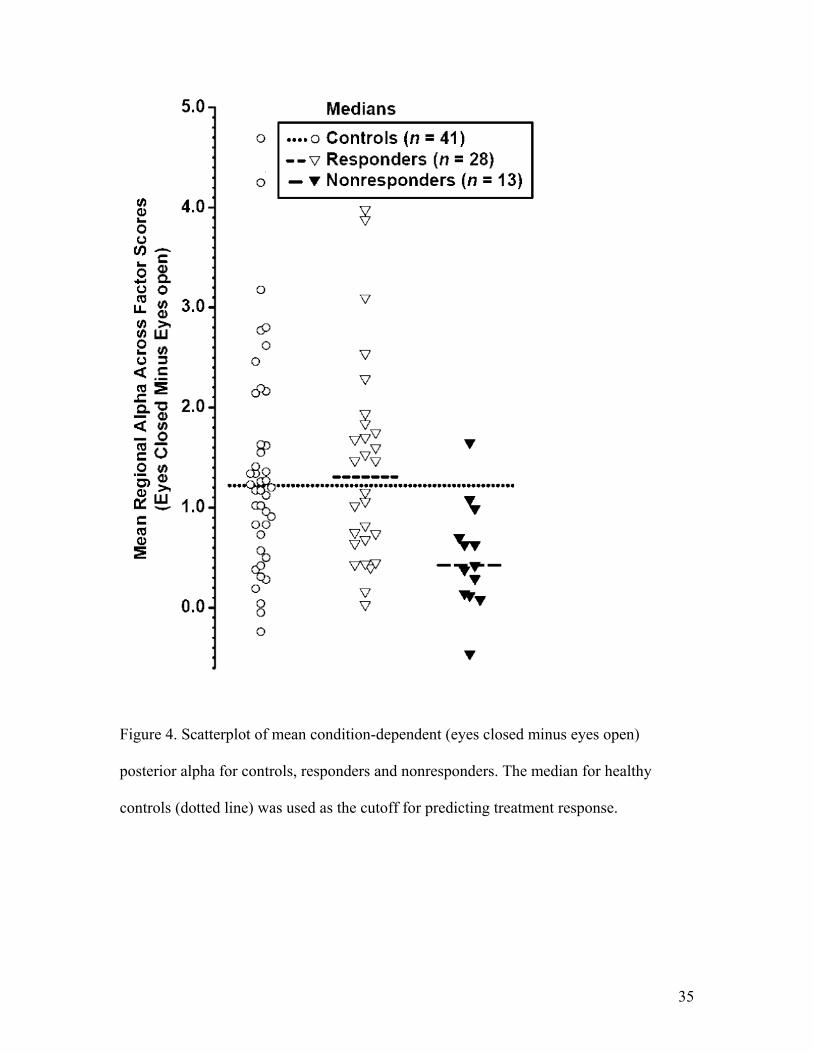
The value of alpha for predicting treatment response was examined by classifying
patients as to whether they had alpha above the median for healthy controls (predicted to
be responders) or less than the median for controls (predicted to be nonresponders). As
shown in Figure 4, alpha had high positive predictive value of 93.3 with 14 of 15 patients
with alpha above median for controls responding to treatment, and high specificity of
92.3 (percent of nonresponders predicted to be nonresponders), but lower sensitivity of
50.0 (percent of responders who were predicted to be responders) and negative predictive
value of 46.1. Thus, depressed patients who have prominent condition-dependent
posterior alpha are predicted to respond to serotonergic antidepressants with a high

11
degree of confidence. However, half of responders had alpha below the median for
controls and were not predicted to be responders. It is possible that a sizable portion of
these responders may be placebo responders or not true drug responders. There was also
no evidence for differential prediction of clinical response to an SSRI as opposed to dual
therapy targeting both serotonergic and nonsertonergic neurotransmitters. Moreover, the
early studies reviewed above suggest that alpha is not be specific for predicting response
to a SSRI but also predicts response to a tricyclic antidepressant. In contrast to our prior
study (Bruder et al., 2008), treatment response was not related to hemispheric asymmetry
of alpha. Although the reason for this lack of replication is unknown, alpha asymmetry is
less reliable than alpha power and may be more influenced by a number of moderator
variables.
-------------------------------
Insert Figure 4 about here
-------------------------------
In summary, EEG alpha power may be useful when it predicts good response
because about 90% of those cases with prominent alpha will indeed be medication
responders, but about half of cases where poor response is predicted will actually turn of
to be medication responders.
Theta Power in Responders and Nonresponders
Several studies have reported EEG differences between antidepressant responders
and nonresponders in the lower frequency theta band (4-8 Hz). Knott et al. (1996)
examined the value of both pretreatment EEG and changes during acute treatment for
predicting response to imipramine. EEG from 16 electrodes was recorded in 29 depressed

12
patients with eyes closed while they pressed a hand-held button. Response to 4 weeks of
treatment with imipramine was defined as greater than 50% reduction in HAM-D ratings.
Relative theta power, i.e., the percentage of theta relative to total absolute power across
the delta, theta, alpha and beta bands, was less in responders than nonresponders prior to
treatment and responders exhibited greater increase in theta 3 hours after the first dose
and after 2 weeks. Thus, both baseline theta and changes during acute treatment may
predict subsequent clinical response. In studies using the neurometric EEG approach
(Prichep et al., 1993; Suffin & Emory, 1995), patients having either a depressive disorder
or OCD with increased relative theta power were nonresponders to antidepressants. More
recently, Iosifescu et al. (2009) measured EEG from fronto-temporal electrodes (F7, F8,
A1, A2 referenced to Fpz) in depressed patients before and 1 week after starting 8 weeks
of open treatment with an SSRI or venlafaxine. EEG was recorded while patients counted
backwards from 1000 to keep them alert. Relative theta power was lower in treatment
responders (HAM-D reduction ≥ 50%) than in nonresponders and predicted response
with an accuracy of 63% (64% sensitivity and 62% specificity). Relative theta after 1
week of treatment showed comparable differences between responders and
nonresponders. The unusual electrode montage used by Iosifescu et al. (2009), however,
makes their findings difficult to interpret and compare with conventional EEG studies. In
contrast to the above studies, Spronk et al. (2011) reported that higher absolute theta
power at a midline frontal site (Fz; linked-mastoids reference) predicted improvement of
depression after 8 weeks of open-label treatment with predominantly SSRI or SNRI
antidepressants. Among 25 patients having a MDD, higher theta power was associated
with greater decrease in HAM-D ratings.

13
In summary, there is conflicting evidence as to whether lower or higher theta
power predicts favorable response to an SSRI or other antidepressants. Differences in
study procedures (e.g., EEG recording site or reference electrode), medication, or EEG
analyses (e.g., use of relative as opposed to absolute theta measures) might account for
the difference in theta findings. The use of low resolution electromagnetic tomography
analysis (LORETA; Pascual-Marqui et al., 1994) to measure theta activity localized to
the region of the anterior cingulate cortex (ACC) has yielded more consistent predictions
of treatment response.
LORETA Measures of Theta and Treatment Response
Mayberg et al. (1997) were first to report that PET measures of glucose
metabolism in the rostral ACC predicted response to antidepressants. Pizzagalli (2011)
recently reviewed studies using neuroimaging (PET, fMRI, SPECT) or EEG measures
supporting the hypothesis that increased activity or metabolism in rostral ACC predicts
response to a wide range of treatments for depression (including various antidepressants,
sleep deprivation and rTMS). EEG evidence comes from three studies using the
LORETA source localization technique to infer the distributed current density
attributable by this model to the region of the rACC. Pizzagalli et al. (2001) recorded
resting EEG from 28 electrodes in 18 patients having a MDD and 18 healthy controls.
Clinical response to 4-6 months of treatment with nortriptyline was assessed using the
Beck Depression Inventory (BDI). Although most patients (n=16) were responders, they
used a median split of BDI ratings to compare patients having better or worse response to
treatment. Patients having a better response showed greater theta (6.5-8.0 Hz; eyes
closed), localized by LORETA to the region of the rACC. There was a significant
14
correlation between pretreatment theta activity and BDI scores, consistent with the
hypothesis that higher rACC activity is associated with greater improvement in
depression. A subsequent study by Mulert et al. (2007) compared resting EEG (eyes
closed) of responders (≥50% reduction in HAM-D) and nonresponders to 4 weeks of
treatment with either citalopram (7 reponders, 4 nonresponders) or reboxetine (3
responders, 6 nonresponders). Responders had greater pretreatment theta activity (6.5-8
Hz), again localized by LORETA to the rACC when compared to nonresponders and
there was a significant correlation of pretreatment theta and improvement in depression
after treatment, which replicates the findings of Pizzagalli et al. (2001). In the first
double-blind, placebo controlled study to examine the relationship of pretreatment EEG
and antidepressant response, Korb et al. (2009) used LORETA to localize theta activity
(4-7 Hz) to the same rACC region as specified by Pizzagalli et al. (2001). Patients who
responded to either fluoxetine or venlafaxine (n=22) had greater theta than nonresponders
(n=15), whereas there was no difference between placebo responders (n=15) and
nonresponders. They report that rACC activity had a sensitivity of 64% and a specificity
of 67% for predicting treatment response. Results for midline frontal theta using
conventional EEG measures were consistent with the above findings, but did not attain
statistical significance.
In summary, EEG measures of resting midline frontal theta, as quantified by
LORETA, predict clinical response to a variety of antidepressants, but the sensitivity and
specificity may be too modest at this stage to be of use to the clinician. Also, the
LORETA technique involves a number of assumptions and localizing generators

15
underlying surface potentials is difficult and subject to problems because an infinite
number of theoretical generators in the brain can yield the same scalp potentials.
Cordance and Antidepressant Response Index
Cook et al. (1999) did not find pretreatment differences in relative theta power
between responders and nonresponders to 8 weeks of treatment with fluoxetine, but did
find differences in “cordance”, a measure that integrates relative and absolute theta
power. Although the biophysical basis of cordance is not clear (Tenke & Kayser, 2005),
it has been reported to be positively correlated with PET scan measures of cortical
perfusion (Leuchter et al., 1999). Based on pretreatment measures of EEG cordance, 24
patients were retrospectively divided into concordant or discordant groups depending on
the type of association of absolute and relative power in theta band. Patients in the
concordant group had a robust response to fluoxetine, while the discordant group did not.
In a subsequent study (Cook et al., 2002), they did not, however, find a significant
difference in the numeral value of cordance at baseline between responders (HAM-D ≤
10 after 8 weeks of treatment) and nonresponders to fluoxetine or venlafaxine. They did
find a difference in the change of prefrontal cordance after 1 week of treatment, with
responders showing a decrease in cordance not seen in nonresponders or placebo
responders. The decreased cordance predicted treatment response with a sensitivity of
69% and a specificity of 75%. Independent studies (Bares et al., 2007, 2008) replicated
this relationship between early change in prefrontal cordance and clinical response in
patients treated with a variety of antidepressants. Also, among 18 treatment-resistant
depressed patients who received 4 weeks of treatment with bupropion, responders (≥50%
reduction of MADRS) differed from nonresponders in showing higher baseline prefrontal

16
cordance and a decrease after one week of treatment (Bares et al., 2010). In summary,
studies indicate that a reduction of cordance after one week of treatment is predictive of
clinical response to SSRI, SNRI, or NDRI antidepressants. However, there is less
agreement as to the value of pretreatment cordance for predicting treatment response, and
the biophysical basis of cordance remains unknown.
Iosifescu et al. (2009) developed an Antidepressant Treatment Response (ATR)
index, which is derived from a weighted combination of theta and alpha power at
baseline and after 1 week of treatment, and is recorded from fronto-temporal sites (Fpz,
FT7, FT8, A1, A2). Initial studies showed promise of the ATR index for predicting
response to an SSRI or venlafaxine, but not placebo (Hunter et al., 2011; Iosifescu et al.,
2009). In a multi-site BRITE-MD study (Leuchter et al., 2009a,b), resting EEG of
patients having a MDD was recorded at baseline and after 1 week of treatment with
escitalopram. Patients were then randomly assigned to continue on escitalopram, switch
to bupropion or a combination of both antidepressants. Responders to escitalopram had
significantly higher ATR index than nonresponders. A threshold value selected to
maximize classification of responders and nonresponders predicted response with 58%
sensitivity and 91% specificity. These values are comparable to those reported by Tenke
et al. (2011) for alpha power, and indicate that about half of escitalopram responders
would not be predicted to be responders. Escitalopram responders differed from
bupropion responders in ATR index. Patients with high ATR values were more likely to
respond to escitalopram than those with low ATR values, whereas patients with low ATR
values who were switched to bupropion were more likely to respond to bupropion alone
than those who remained on escitalopram. While the ATR index may be of value in

17
differential prediction of response to antidepressants, a replication using the same ATR
algorithm and threshold cutoff is needed to independently confirm these findings. Also,
since the ATR index is based on an atypical electrode montage and a complex proprietary
algorithm, it is not clear what high or low ATR scores mean or what their relation is to
standard EEG measures of theta or alpha. While the limited electrode montage may be an
advantage for clinical applications, the frontal sites (Fpz, FT7, FT8) could be problematic
because they are near known sources of artifact from the eyes and facial musculature.
In summary, both cordance and ATR measures, based on baseline EEG and
changes after one week of treatment, show promise as predictors of clinical response to
SSRI, SNRI, or NDRI antidepressants. These are, however, complex proprietary
measures, which makes it difficult to independently replicate findings and limits their
value as biomarkers of treatment response.
Clinical and Theoretical Implications of EEG findings in Depression
Resting EEG measures of alpha and theta have potential for clinical application
because they are relatively easy to measure and have high reliability. Two measures
obtained before treatment appear to have particular potential for predicting response to
antidepressants. Alpha over posterior brain regions and midline frontal theta, localized
using LORETA inverse model to rACC, were found to be greater in antidepressant
responders than nonresponders. Pizzagalli (2011) suggested that the default mode
network may explain the relation between resting rACC activity and treatment response.
Activity in the default network, including rACC, posterior cingulate, lateral parietal and
temporal cortex, and other structures, is greatest during resting states and decreases
during processing of external stimuli. Pizzagalli postulated that increased resting rACC

18
activity in treatment responders may be linked to introspective or adaptive self-referential
processing, which is thought to involve the default network. This hypothesis also
suggests a possible interpretation of increased resting alpha in responders. Greater alpha
in responders is more evident with eyes closed than open and is maximal over lateral
parietal cortex (Tenke et al., 2011), which is a region in the default mode network.
Moreover, Tenke et al. found a trend for the difference between responders and
nonresponders to be greatest for a “low alpha factor” having a bandwidth that overlaps
the theta band typically used in LORETA measures of rACC activity (6.5-8 Hz).
Increased resting alpha and rACC theta activity in treatment responders could therefore
both be related to default network activity. A study is now underway to test this
hypothesis.
A reduction of frontal cordance in theta band after one week of antidepressant
treatment also appears to be predictive of antidepressant response. Most recently, an ATR
index, which uses theta and alpha measures at baseline and after one week of
antidepressant, was developed to maximize predictions. The ATR index shows promise
not only for predicting response to an SSRI or SNRI, but also differential response to an
SSRI versus NDRI antidepressant. A critical problem with the ATR index is that its
algorithm and cutoffs were derived in studies to maximize predictions and it is therefore
in need of independent replications. Further research using multiple EEG measures, i.e.,
resting alpha, theta, LORETA rACC, cordance, ATR index, is needed to evaluate their
relative merits as predictors of treatment response, and to determine how these measures
relate to each other. Of greatest clinical value would be measures that can make

19
differential prediction of response to antidepressants with different mechanisms of action
or to non-pharmacological treatments, e.g., cognitive behavioral therapy.
Auditory Evoked Potentials and Treatment Response
Although there are reports relating amplitude of auditory ERPs (e.g., N1, P2) and
antidepressant response (Bruder et al., 2012; Spronk et al., 2011; Vandoolaeghe et al.,
1998), the most replicated finding has come for loudness dependency of auditory evoked
potentials (LDAEPs). Increases in tone intensity from 60 to 100 dB are known to result in
a monotonic increase in N1 and P2 amplitude. In an ongoing study, we measured ERPs
of 64 healthy adults to 1000 Hz tones (40 ms duration; 1600-2000 ms ISI) while they sat
quietly with eyes fixed on a cross. Figure 5 shows CSD waveforms with peaks
corresponding to N1 and P2 potentials. N1, which was maximal at central electrode sites
(C3/C4), showed the expected monotonic increase in amplitude with increasing tone
intensity from 60 to 100 dB.
Hegerl and Juckel (1993) reviewed evidence suggesting that the slope of the
function relating tone loudness and N1-P2 amplitude provides a noninvasive indicator of
seotonergic activity. They suggest that serotonergic neurons originating in dorsal raphé
modulate activity in auditory cortex by providing a stable, tonic firing rate. Low firing
rate of serotonergic neurons is related to strong loudness dependency, i.e., a steep
increase in N1-P1 amplitude with increasing tone loudness, whereas high firing rate is
related to weak loudness dependency, i.e., only a small increase in N1-P2 with increasing
loudness (Hegerl et al., 2001). Direct evidence of an inverse relationship between
serotonergic activity in dorsal raphé and LDAEP was found in recordings from primary
auditory cortex of cats (Juckel et al., 1999). A recent review did not find strong support

20
for the utility of LDAEP as a marker of central serotonin function, but did conclude that
LDAEP shows promise as a predictor of response to antidepressants (O’Neill et al.,
2008a).
Depressed patients with low serotonergic activity, as evidenced by pronounced
LDAEP prior to treatment, respond better to SSRI antidepressants compared to patients
with high serotonergic activity, as evidenced by weak LDAEP (Gallinat et al., 2000;
Hegerl et al., 2001; Lee et al., 2005; Paige et al., 1994). Although Paige et al. (1995)
found a similar difference in LDAEP between a small sample of responders (n=4) versus
nonresponders (n=4) to an NDRI antidepressant (bupropion), more recent studies suggest
that LDAEP may differentially predict clinical response to serotonergic and
noradrenergic antidepressants. Among 16 patients having a MDD, stronger pretreatment
loudness dependency of N1 was associated with greater reduction in depression
following 3-4 weeks of treatment with the SSRI citalopram (Linka et al., 2004). In
contrast, in 14 patients tested before treatment with a noradrenaline reuptake inhibitor
(NRI) reboxetine, smaller loudness dependency of N1 was associated with greater
improvement in depression (Linka et al., 2005). In the first study in which depressed
patients were randomly assigned to treatment with either the citalopram or reboxetine,
Mulert et al. (2007) measured LDAEP for current source distribution (latency window of
60-240 ms) localized using LORETA to primary auditory cortex. SSRI responders (n=7)
showed significantly stronger LDAEP when compared to SSRI nonresponders (n=4),
whereas NRI responders (n=3) did not differ significantly from NRI nonresponders
(n=6). Stronger LDAEP was associated with greater improvement in depression

21
following citalopram treatment (r=.71), whereas weaker LDAEP tended to be associated
with greater improvement in depression following reboxetine treatment (r= -.54).
LDAEP has not, however, been associated with the clinical state of depressed
patients or levels of central serotonergic neurotransmission. Thus, studies have not found
a change in LDAEP following treatment with SSRI or other antidepressants (Gallinat et
al., 2000; Linka et al., 2009; Paige et al., 1994, 1995). Also, acute enhancement of
serotonin levels by administrating an SSRI to healthy adults has not yielded consistent
findings. A double-blind placebo controlled study in healthy adults found a decrease in
LDAEP during acute administration of a single dose of the SSRI citalopram, which
would be expected given an increase in central serotonin (Nathan et al., 2006). This
change in LDAEP was not replicated in a study in which healthy females received an
intravenous infusion of citalopram or placebo (Uhl et al., 2006) or in a study measuring
LDAEP during administration of sertraline or escitalopram (Guille et al., 2008).
Moreover, acute depletion of serotonin in healthy adults during administration of
tryptophan did not alter LDAEP (Debener et al., 2002; Dierks et al., 1999; O’Neill et al.,
2008b).
In summary, studies have found that LDAEP predicts clinical response to an SSRI
and may be of value for differential prediction of response to an NRI antidepressant.
LDAEP may represent a stable trait that is not readily altered by changes clinical state or
serotonin levels.
Conclusions
The findings reviewed in this chapter indicate that certain electrophysiologic
measures of brain activity are predictive of clinical response to antidepressants. The most

22
promising EEG predictors are resting alpha and theta with eyes closed. Specific measures
derived from the EEG, e.g., current source density, cordance, LORETA, ATR index,
have all shown value as predictors, but further research is needed to compare their
physiological interpretability and relative merits. Auditory evoked potential measures of
loudness dependency (LDAEP) also predict response to antidepressants. A variety of
different measures have been used to assess LDAEP, including scalp potentials,
LORETA, and dipole source analyses of N1, P2 or N1-P2 differences. To the extent that
EEG and LDAEP measures are uncorrelated and separately predictive, their combined
use could lead to models with clinically relevant predictive power.
Several points are important for developing and evaluating electrophysiological
predictors of treatment response. First, measures that are stable indicators with good test-
retest reliability are likely to be of most value for predicting clinical response in
individual patients. Resting EEG alpha and theta potentials have demonstrated high test-
retest reliability (generally ≥ .90) in both healthy adults (Smit et al., 2005) and depressed
patients (Allen et al., 2004; Bruder et al., 2008). Auditory evoked potentials likewise
have high reliability in healthy adults and depressed patients. Hensch et al. (2008), in
reviewing prior studies and their study of 166 healthy adults, reported reliability of the
LDAEP function to generally be in region of .70 to .80. Comparable LDAEP reliabilities
have been found for depressed patients retested after antidepressant treatment (Gallinat et
al., 2000; Linka et al., 2009). Less in known, however, about the test-retest reliability of
EEG cordance, LORETA rACC, or ATR measures, which are derived from alpha and
theta scalp potentials. Assessment of reliability is particularly important for measures,
such as ATR index, that depend on assessing changes in EEG between baseline and one

23
week of treatment. Second, to be of clinical value measures should have high sensitivity
and specificity for predicting treatment response. The EEG measures reviewed in this
chapter generally had only moderate sensitivity (50 to 70% of responders correctly
predicted to be responders) and somewhat higher specificity (60 to 90% of nonresponders
correctly predicted to be nonresponders). Studies of LDAEP have generally reported
average data for small samples with no indication of sensitivity or specificity. Third, the
typical procedure for determining the predictive value of a measure is to choose a cutoff
or threshold value above which patients are predicted to be a responder. There are
quantitative procedures available to aid in choosing a cutoff, e.g., receiver operating
characteristic (ROC) curve, but there is no guarantee that a cutoff established in a given
study will work for a new sample of patients. Another approach is to use the median
value for healthy adults as the cutoff, for example, with the rationale being that
responders have higher than normal values and nonresponders lower values (e.g., Tenke
et al., 2011). Normative data for a large sample of healthy adults could then be developed
for a given population. Fourth, electrophysiologic measures would ideally be predictive
of treatment response to a specific class of antidepressants with known pharmacologic
profile, e.g., SSRI, and be of value for differential prediction of treatment response. Some
EEG measures, e.g., LORETA measures of rACC activity, are clearly not specific, but
predict response to a wide range of treatments. There are, however, preliminary
indications that the ATR index and LDAEP may differentially predict response to SSRI
and NDRI or NARI antidepressants. Fifth, ease of application of predictors in clinical
settings is a critical issue. For instance, it would not be efficient to use a large array of
electrodes in the clinic. It should, however, be possible to record resting EEG or LDAEP

24
with a small number of well targeted electrodes and use computer algorithms to predict
response for individual patients. A multi-site BRITE-MD study (Leuchter et al., 2009b)
using the ATR index was conducted with this in mind, but further studies to replicate
their findings are needed before it could be recommended for clinical use.
Lastly, it may be too optimistic to expect any one electrophysiologic measure to
provide sufficiently accurate predictions of clinical response. A recent review by Alhaj et
al. (2011) referred to evidence that combining various EEG or ERP measures may
improve prediction. For instance, Mulert et al. (2007) suggested that a resting EEG
measure, using LORETA to infer rACC activity, might be useful as a first step to identify
a subgroup of depressed patients who are not likely to respond to standard
antidepressants and, if response is likely, LDAEP could be used for differential prediction
of response to a SSRI or NRI antidepressant. Moreover, neuropsychological tests and
neuroimaging measures (PET or MRI scans) may also contribute to prediction of
treatment response. An ongoing NIMH initiative “Establishing Moderators and
Biosignatures of Antidepressant Response in Clinical Care” (EMBARC; M. Trivedi & P.
McGrath, Principal Investigators) is a multi-site, double-blind study examining the value
of resting EEG, LDAEP, MRI (structural and functional), and neurocognitive tests for
differential prediction of clinical response to an SSRI versus placebo. The aim is to begin
to evaluate whether combined use of the best predictors in these domains could
ultimately serve as biosignatures for personalizing antidepressant treatment.
25
References Alhaj, H., Wisniewski, G., McAllister-Williams, R.H., et al. (2011). The use of the EEG in measuring therapeutic drug action: focus on depression and antidepressants. Journal of Psychopharmacology, 25(9), 1175-1191. Allen, J.J., Urry, H.L., Hitt, S.K., et al. (2004). The stability of resting frontal electroencephalographic asymmetry in depression. Psychophysiology, 41(2), 269-280. Bares, M., Brunosvsky, M., Kopecek, M., et al. (2007). Changes in QEEG prefrontal cordance as a predictor of response to antidepressants in patients with treatment resistant depressive disorder: a pilot study. Journal of Psychiatric Research, 41, 319-325. Bares, M., Brunovsky, M. Novak, T., et al. (2010). The change of prefrontal QEEG theta cordance as a predictor of response to bupropion treatment in patients who had failed to respond to previous antidepressant treatments. European Neuropsychopharmacology, 20, 459-466. Bares, M., Brunovsky, M., Kopeck, M., et al. (2008). Early reduction in prefrontal theta QEEG cordance value predicts response to venlafaxine treatment in patients with resistant depressive disorder. European Psychiatry, 23, 350-355. Bruder, G.E., Bansal, R., Tenke, C.E., Liu, J., Hao, X., Warner, V., Peterson, B.S., Weissman, M.M. (in press). Relationship of resting EEG with anatomical MRI measures in individuals at high and low risk for depression. Human Brain Mapping. Bruder, G.E., Fong, R., Tenke, C.E., et al. (1997). Regional brain asymmetries in major depression with or without an anxiety disorder: a quantitative electroencephalographic study. Biological Psychiatry, 41(9), 939-948. Bruder, G.E., Kayser, J. and Tenke, C.E. (2012). Event-related brain potentials in depression: clinical, cognitive and neurophysiologic implications. In: Luck, S.J. and Kappenman, E.S. (eds.) The Oxford Handbook of Event-Related Potential Components New York: Oxford University Press, 563-592. Bruder, G.E., Sedoruk, J.P., Stewart, J.W., et al. (2008). Electroencephalographic alpha measures predict therapeutic response to a selective serotonin reuptake inhibitor antidepressant: pre- and post-treatment findings. Biological Psychiatry, 63(12), 1171-1177. Bruder, G.E., Stewart, J.W., Tenke, C.E., et al., (2001). Electroencephalographic and perceptual asymmetry differences between responders and nonresponders to an SSRI antidepressant. Biological Psychiatry, 48(5), 416-425. Bruder, G.E., Tenke, C.E., Warner, V., Nomura, Y., Grillon, C., Hille, J., Leite, P., Weissman, M.M. (2005). Electroencephalographic measures of regional hemispheric

26
activity in offspring at risk for depressive disorders. Biological Psychiatry, 57(4), 328-335. Cook, I.A., Leuchter, A.F., Morgan, M., et al. (2002). Early changes in prefrontal activity characterize clinical responders to antidepressants. Neuropsychopharmacology, 27(1), 120-131. Cook, I. A., Leuchter, A. F., Witte, E., et al. (1999). Neurophysiologic predictors of treatment response to fluoxetine in major depression. Psychiatry Research, 85(3), 263-273. Cook, I. A., O'Hara, R., Uijtdehaage, S. H., et al. (1998). Assessing the accuracy of topographic EEG mapping for determining local brain function. Electroencephalography and Clinical Neurophysiology, 107(6), 408-414. Debener, S., Beauducel, A., Nessler, D., et al. (2000). Is resting anterior EEG alpha asymmetry a trait marker for depression? Findings for healthy adults and clinically depressed patients. Neuropsychobiology, 41(1), 31-37. Debener, S., Strobel, A., Kurschner, K., et al. (2002). Is auditory evoked potential augmenting/reducing affected by acute tryptophan depletion? Biological Psychology, 59(2), 121-133. Dierks, T., Barta, S., Demisch, L., et al. (1999). Intensity dependence of auditory evoked potentials (AEPs) as biological marker for cerebral serotonin levels: effects of tryptophan depletion in healthy subjects. Psychopharmacology, 146(1), 101-107. Feige, B., Scheffler, K., Esposito, F., et al. (2005). Cortical and subcortical correlates of electroencephalographic alpha rhythm modulation. Journal of Neurophysiology, 93(5), 2864-2872. Gallinat, J., Bottlender, R., Juckel, G., et al. (2000). The loudness dependency of the auditory evoked N1/P2-component as a predictor of the acute SSRI response in depression. Psychopharmacology, 148(4), 404-411. Gotlib, I.H., Ranganath, C. and Rosenfeld, P. (1998). Frontal EEG alpha asymmetry, depression, and cognitive functioning. Cognition and Emotion, 12, 449-478. Grin-Yatsenko, V.A., Baas, I., Ponomarev, V.A., et al. (2010). Independent component approach to the analysis of EEG recordings at early stages of depressive disorders. Clinical Neurophysiology, 121(3), 281-289. Guille, V., Croft, R.J., O’Neill, B.V., et al. (2008). An examination of acute changes in serotonergic neurotransmission using the loudness dependence measure of auditory cortex evoked activity: effects of citalopram, escitalopram and sertraline. Human Psychopharmacology, 23, 231-241.

27
Hagemann, D., Hewig, J., Seifert, J., et al. (2005). The latent state-trait structure of resting EEG asymmetry: replication and extension. Psychophysiology, 42(6), 740-752. Heller, W., Etienne, M.A. and Miller, G.A. (1995). Patterns of perceptual asymmetry in depression and anxiety: implications for neuropsychological models of emotion and psychopathology. Journal of Abnormal Psychology, 104(2), 327-333. Henriques, J.B., and Davidson, R.J. (1991). Left frontal hypoactivation in depression. Journal of Abnormal Psychology, 100(4), 535-545. Hensch, T., Herold, U., Diers, K., et al. (2008). Reliability of intensity dependence of auditory-evoked potentials. Clinical Neurophysiology, 119(1), 224-236. Hergerl, U. and Juckel, G. (1993). Intensity dependence of auditory evoked potentials as an indicator of central serotonergic neurotransmission: a new hypothesis. Biological Psychiatry, 33, 173-187. Hergerl, U., Gallinat, J. and Juckel, G. (2001). Event-related potentials: do they reflect central serotonergic neurotransmission and do they predict clinical response to serotoin agonists? Journal of Affective Disorders, 62, 93-100. Hughes, J.R. and John, E.R. (1999). Conventional and quantitative electroencephalography in psychiatry. Journal of Neuropsychiatry and Clinical Neurosciences, 11(2), 190-207. Hunter, A.M., Cook, I.A., Greenwald, S.D., et al. (2011). The antidepressant treatment response index and treatment outcomes in a placebo-controlled trial of fluoxetine. Journal of Clinical Neurophysiology, 28(5), 478-482. Iosifescu, D.V., Greenwald, S., Devlin, P., et al. (2009). Frontal EEG predictors of treatment outcome in major depressive disorder. European Neuropsychopharmacology, 19(11), 772-777. Juckel, G., Hegerl, U., Molnar, M., et al. (1999). Auditory evoked potentials reflect serotonergic neuronal activity--a study in behaving cats administered drugs acting on 5-HT1A autoreceptors in the dorsal raphe nucleus. Neuropsychopharmacology, 21(6), 710-716. Kayser, J. and Tenke, C.E. (2006). Principal components analysis of Laplacian waveforms as a generic method for identifying ERP generator patterns: I. Evaluation with auditory oddball tasks. Clinical Neurophysiology, 117(2), 348-368. Kayser, J. and Tenke, C.E. (2010). In search of the Rosetta Stone for scalp EEG: converging on reference free techniques. Clinical Neurophysiology, 121(12), 1973-1975.

28
Kemp, A.H., Griffiths, K., Felmingham, K.L. (2010). Disorder specificity despite comorbidity: resting EEG alpha asymmetry in major depressive disorder and post-traumatic stress disorder. Biological Psychology, 85, 350-354. Kentgen, L.M., Tenke, C.E., Pine, D.S., et al. (2000). Electroencephalographic asymmetries in adolescents with major depression: influence of comorbidity with anxiety disorders. Journal of Abnormal Psychology, 109(4), 797-802. Knott, V.J., Telner, J.I., Lapierre, Y.D., et al. (1996). Quantitative EEG in the prediction of antidepressant response to imipramine. Journal of Affective Disorders, 39(3), 175-184. Korb, A. S., Hunter, A. M., Cook, I. A., et al. (2009). Rostral anterior cingulate cortex theta current density and response to antidepressants and placebo in major depression. Clinical Neurophysiology, 120(7), 1313-1319. Lee, T.W., Yu, Y.W. and Chen, T.J. (2005). Loudness dependence of the auditory evoked potential and response to antidepressants in Chinese patients with major depression. Journal of Psychiatry and Neuroscience, 30(3), 202-205. Leuchter, A.F., Cook, I.A., Gilmer, W.S. et al. (2009a). Effectiveness of a quantitative electroencephalographic biomarker for predicting differential response or remission with escitalopram and bupropion in major depressive disorder. Psychiatry Research, 169(2), 132-138. Leuchter, A.F., Cook, I.A., Marangell, L.B., et al. (2009b). Comparative effectiveness of biomarkers and clinical indicators for predicting outcomes of SSRI treatment in Major Depressive Disorder: results of the BRITE-MD study. Psychiatry Research, 169(2), 124-131. Leuchter, A.F., Uitjdehaage, S.H., Cook, I.A., et al. (1999). Relationship between brain electrical activity and cortical perfusion in normal subjects. Psychiatry Research, 90, 125-140. Linka, T., Müller, B.W., Bender, S., et al. (2004). The intensity dependence of the auditory evoked N1 component as a predictor of response to Citalopram treatment in patients with major depression. Neuroscience Letters, 367(3), 375-378. Linka, T., Müller, B.W., Bender, S., et al. (2005). The intensity dependence of auditory evoked ERP components predicts responsiveness to Reboxetine treatment in major depression. Pharmacopsychiatry, 38(3), 139-143. Linka, T., Sartory, G., Wiltfang, J., et al. (2009). Treatment effects of serotonergic and noradrenergic antidepressants on the intensity dependence of auditory ERP components in major depression. Neuroscience Letters, 463(1), 26-30.

29
Mayberg, H.S., Brannan, S.K., Mahurin, R.K., et al. (1997). Cingulate function in depression: A potential predictor of treatment response. NeuroReport, 8, 1057-1061. Milak, M.S., Keilp, J., Parsey, R.V., et al. (2010). Regional brain metabolic correlates of self-reported depression severity contrasted with clinical ratings. Journal of Affective Disorders, 126, 113-124. Mulert, C., Juckel, G., Brunnmeier, M., et al. (2007). Prediction of treatment response in major depression: integration of concepts. Journal of Affective Disorders, 98(3), 215-225. Nathan, P.J., Segrave, R., Phan, K.L., et al. (2006). Direct evidence that acutely enhancing serotonin with the selective serotonin reuptake inhibitor citalopram modulates the loudness dependence of the auditory evoked potential (LDAEP) marker of central serotonin function. Human Psychopharmacology, 21(1), 47-52. Niedermeyer, E. and Da Silva, F.H.L. (2004). Electroencephalography: Basic Principles, Clinical Applications and Related Fields, 5th ed. Philadelphia: Lippincott, Williams & Wilkins. Nunez, P.L. and Srinivasan, R. (2006). Electric fields of the brain: the neurophysics of EEG. New York: Oxford University Press. O'Neill, B. V., Guille, V., Croft, R. J., et al. (2008b). Effects of selective and combined serotonin and dopamine depletion on the loudness dependence of the auditory evoked potential (LDAEP) in humans. Human Psychopharmacology, 23(4), 301-312. O'Neill, B.V., Croft, R.J., and Nathan, P.J. (2008a). The loudness dependence of the auditory evoked potential (LDAEP) as an in vivo biomarker of central serotonergic function in humans: rationale, evaluation and review of findings. Human Psychopharmacology, 23(5), 355-370. Paige, S.R., Fitzpatrick, D.F., Kline, J.P., et al. (1994). Event-related potential amplitude/intensity slopes predict response to antidepressants. Neuropsychobiology, 30(4), 197-201. Paige, S.R., Hendricks, S.E., Fitzpatrick, D.F., et al. (1995). Amplitude/intensity functions of auditory event-related potentials predict responsiveness to bupropion in major depressive disorder. Psychopharmacology Bulletin, 31, 243-248. Pascual-Marqui, R.D., Michel, C.M. and Lehmann, D. (1994). Low resolution electromagnectic tomography: a new method for localizing electrical activity in the brain. International Journal of Psychophysiololgy, 18, 49-65.

30
Peterson, B.S., Warner, V., Bansal, R., et al. (2009). Cortical thinning in persons at increased familial risk for major depression. Proceedings of the National Academy of Science USA, 106, 6273–6278. Pizzagalli, D., Pascual-Marqui, R.D., Nitschke, J.B., et al. (2001). Anterior cingulate activity as a predictor of degree of treatment response in major depression: Evidence from brain electrical tomography analysis. American Journal of Psychiatry, 158, 405-415. Pizzagalli, D.A. (2011). Frontocingulate dysfunction in depression: toward biomarkers of treatment response. Neuropsychopharmacology, 36(1), 183-206. Pollock, V.E. and Schneider, L.S. (1989). Topographic electroencephalographic alpha in recovered depressed elderly. Journal of Abnormal Psychology, 98(3), 268-273. Pollock, V.E., and Schneider, L.S. (1990). Topographic quantitative EEG in elderly subjects with major depression. Psychophysiology, 27(4), 438-444. Prichep, L.S., Mas, F., Hollander, E., et al. (1993). Quantitative electroencephalographic subtyping of obsessive-compulsive disorder. Psychiatry Research, 50(1), 25-32. Reid, S.A., Duke, L.M., and Allen, J.J.B. (1998). Resting frontal electroencephalographic asymmetry in depression: inconsistencies suggest the need to identify mediating factors. Psychophysiology, 35(4), 389-404. Schaffer, C.E., Davidson, R.J. and Saron, C. (1983). Frontal and parietal electroencephalogram asymmetry in depressed and nondepressed subjects. Biological Psychiatry, 18(7), 753-762. Smit, D.J., Posthuma, D., Boomsma, D.I., et al. (2005). Heritability of background EEG across the power spectrum. Psychophysiology, 42(6), 691-697. Spronk, D., Arns, M., Barnett, K.J., et al. (2011). An investigation of EEG, genetic and cognitive markers of treatment response to antidepressant medication in patients with major depressive disorder: a pilot study. Journal of Affective Disorders, 128(1-2), 41-48. Stewart, J.L., Bismark, A.W., Towers, D.N., et al. (2010). Resting frontal EEG asymmetry as an endophenotype for depression risk: sex-specific patterns of frontal brain asymmetry. Journal of Abnormal Psychology, 119(3), 502-512. Stewart, J.L., Towers, D.N., Coan, J.A., et al. (2011) The oft-neglected role of parietal EEG asymmetry and risk for major depressive disorder. Psychophysiology, 48(1), 82-95. Suffin, S.C., and Emory, W.H. (1995). Neurometric subgroups in attentional and affective disorders and their association with pharmacotherapeutic outcome. Clinical Electroencephalography, 26, 76-83.

31
Tenke, C.E. and Kayser, J. (2005). Reference-free quantification of EEG spectra: combining current source density (CSD) and frequency principal components analysis (fPCA). Clinical Neurophysiology, 116(12), 2826-2846. Tenke, C.E., Kayser, J., Manna, C.G., et al. (2011), Current source density measures of electroencephalographic alpha predict antidepressant treatment response. Biological Psychiatry, 70(4), 388-394. Thibodeau, R., Jorgensen, R.S., and Kim, S. (2006). Depression, anxiety, and resting frontal EEG asymmetry: a meta-analytic review. Journal of Abnormal Psychology, 115, 715-729. Uhl, I., Gorynia, I., Gallinat, J., et al. (2006). Is the loudness dependence of auditory evoked potentials modulated by the selective serotonin reuptake inhibitor citalopram in healthy subjects? Human Psychopharmacology, 21(7), 463-471. Ulrich, G., Renfordt, E. and Frick, K. (1986). The topographical distribution of alpha-activity in the resting EEG of endogenous-depressive inpatients with and without clinical-response to pharmacotherapy. Pharmacopsychiatry, 19, 272-273. Vandoolaeghe, E., van Hunsel, F., Nuyten, D., et al. (1998). Auditory event related potentials in major depression: prolonged P300 latency and increased P200 amplitude. Journal of Affective Disorders, 48(2-3), 105-113. Weissman, M.M., Wickramaratne, P., Nomura, Y., et al. (2005): Families at high and low risk for depression: A 3-generation study. Archives of General Psychiatry, 62, 29–36.
32
Figure 1. Top portion shows alpha oscillations during 2 second sample of Eyes Closed
EEG (solid lines) and alpha blocking with Eyes Open (dashed lines). Bottom portion
gives the corresponding frequency spectra with peak amplitude in alpha band in the Eyes
Closed condition, but not in the Eyes Open condition.

33
Figure 2. Mean log alpha power (± SEM) over right and left posterior sites for responders
and nonresponders before treatment and after 12 weeks of treatment on fluoxetine (nose-
referenced EEG).

34
Figure 3. A. Condition-dependent (eyes closed minus eyes open) topographies of alpha
(average across high and low alpha factors using CSD-transformed EEG) for controls,
responders and nonresponders. Alpha reduction in nonresponders is most marked over
posterior sites (bottom of maps). B. Corresponding condition-dependent alpha
topographies for patients treated with a monotherapy or dual therapy. Both nonresponder
groups showed marked alpha reduction compared to responders.
35
Figure 4. Scatterplot of mean condition-dependent (eyes closed minus eyes open)
posterior alpha for controls, responders and nonresponders. The median for healthy
controls (dotted line) was used as the cutoff for predicting treatment response.

36
Figure 5. A. Average current source density waveforms at C3/C4 sites for 64 healthy
adults showing peaks corresponding to N1 and P2. B. LDAEP function showing increase
in tangential N1 with increasing intensity of tones.