Electrophysiological assessment of neuromuscular transmission
Upload
reshma-peterCategory
view
187download
1
Electrophysiological
tests
Presenter : Dr. Reshma Peter
Moderator : Dr. Prabhakar
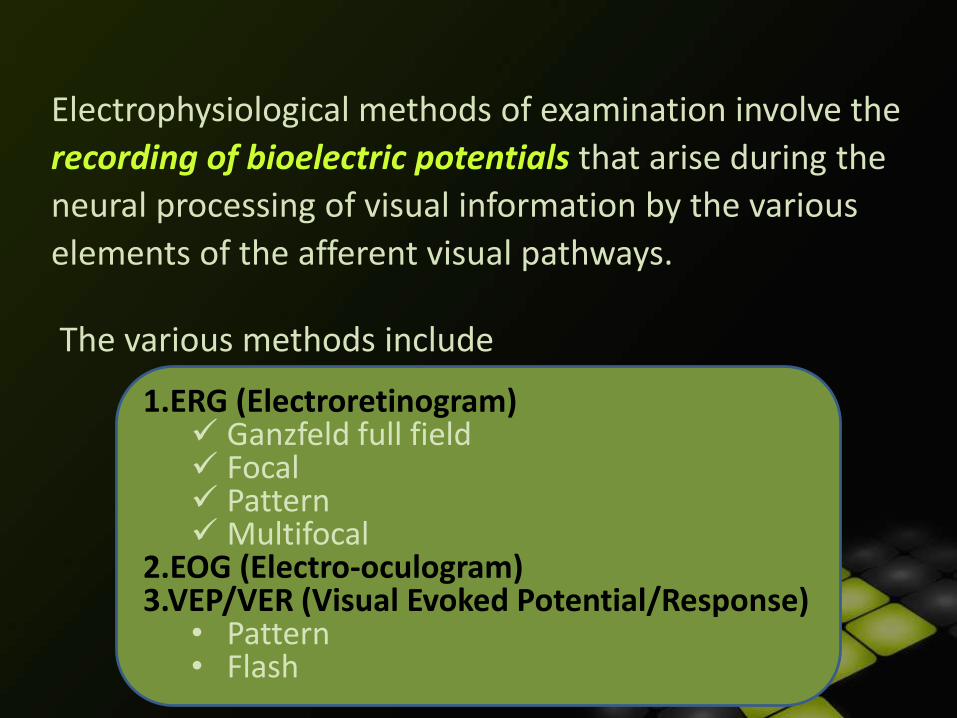
Electrophysiological methods of examination involve the
recording of bioelectric potentials that arise during the
neural processing of visual information by the various
elements of the afferent visual pathways.
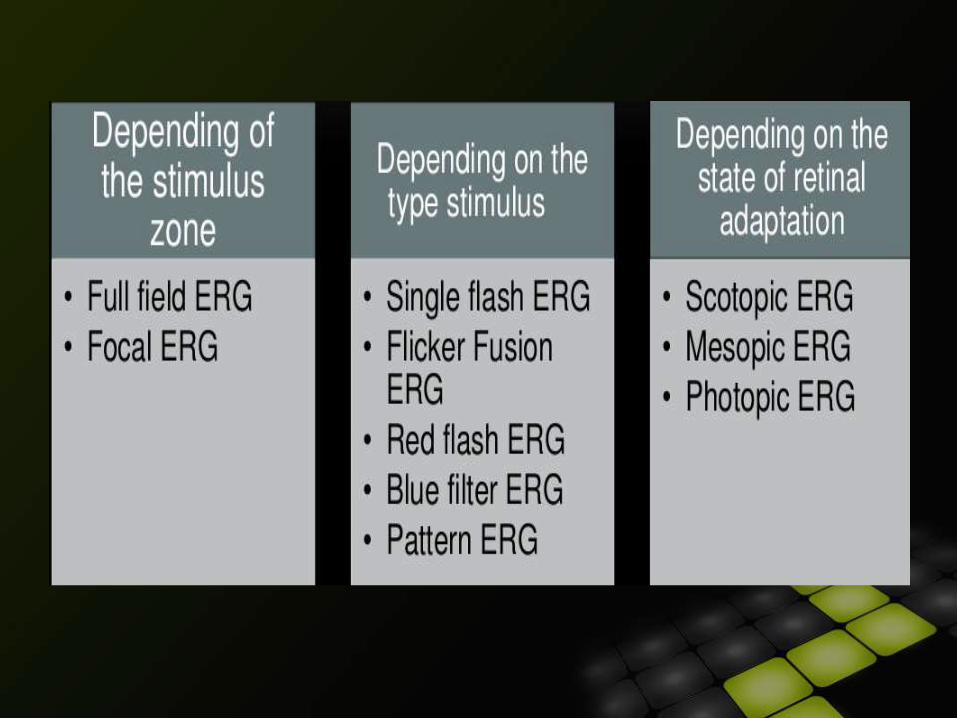
The various methods include
1.ERG (Electroretinogram) Ganzfeld full field Focal Pattern Multifocal
2.EOG (Electro-oculogram)3.VEP/VER (Visual Evoked Potential/Response)
• Pattern• Flash

International Society for Clinical
Electrophysiology of Vision (ISCEV)
Standardised the protocols for performing
electrophysiological tests (1989)
Ensures uniformity and comparability between labs
History
Du Bois-Raymond (1849)-1st discovered EOG
Frithiof Holmgren (1865)-1st recorded that alteration in electric potential occurs when light is thrown on retina
Dewar (1877)- 1st recorded ERG In humans
Einthoven and Jolly (1908)-separated the ERG response into 3 components: a-wave, b-wave and c-wave
Riggs(1941)-introduced practical recording contact lens electrode in humans

Riggs (1954) and Francois (1956)worked extensively and popularized EOG
Arden & Fojas (1962)-discovered importance of ratio
Ragnar Granit (1967) demonstrated the physiology of the receptor potential of each component of the ERG- Nobel prize winner
Sutter and Tran (1992)- developed multifocal ERG
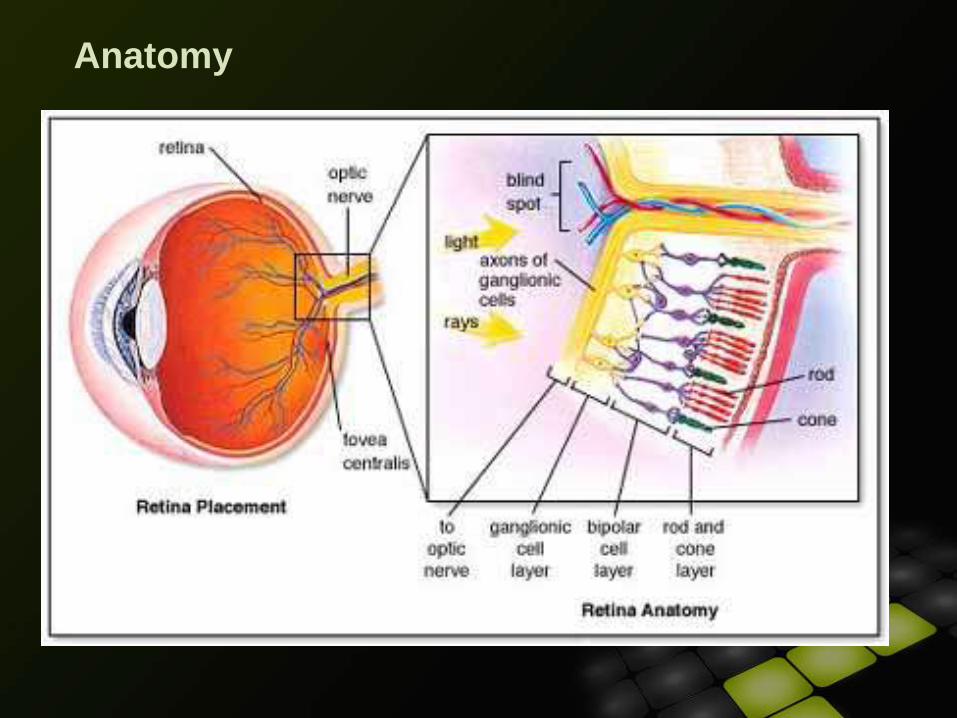
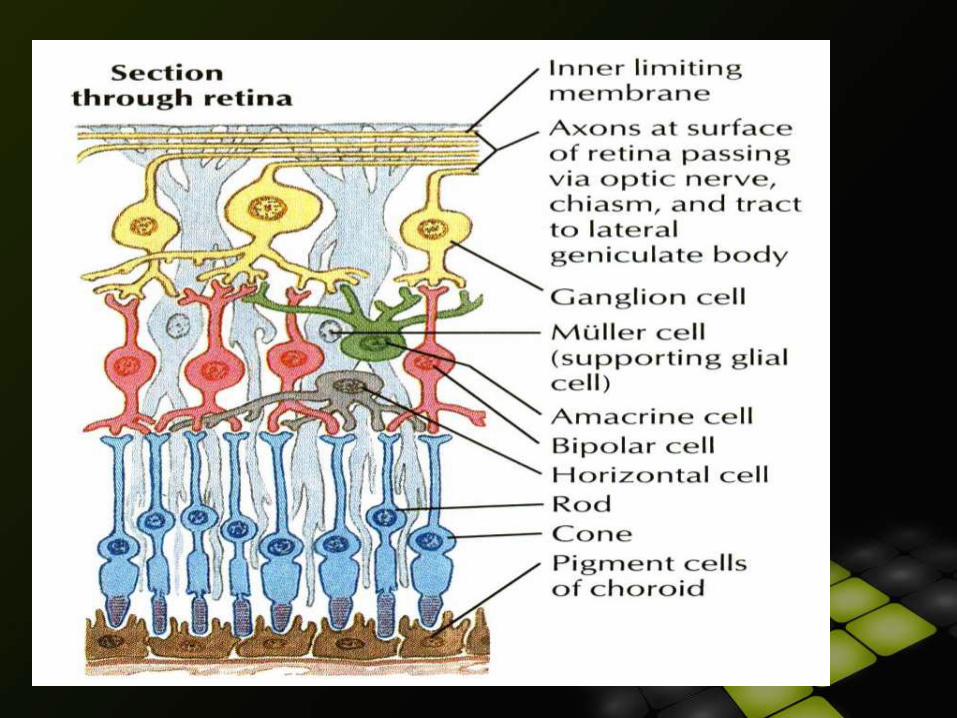
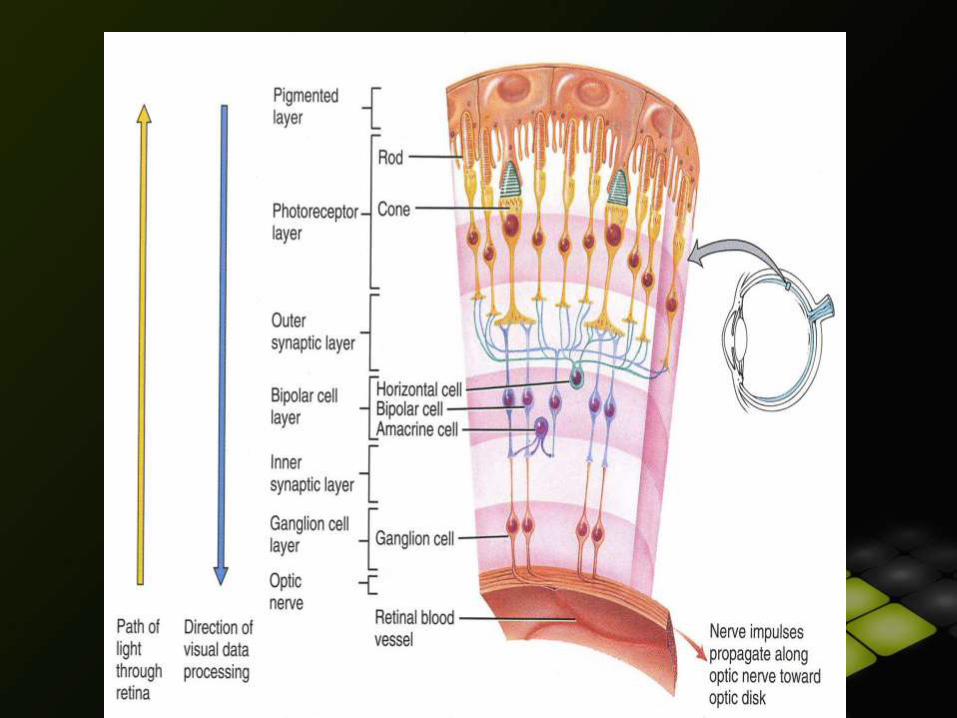
Anatomy
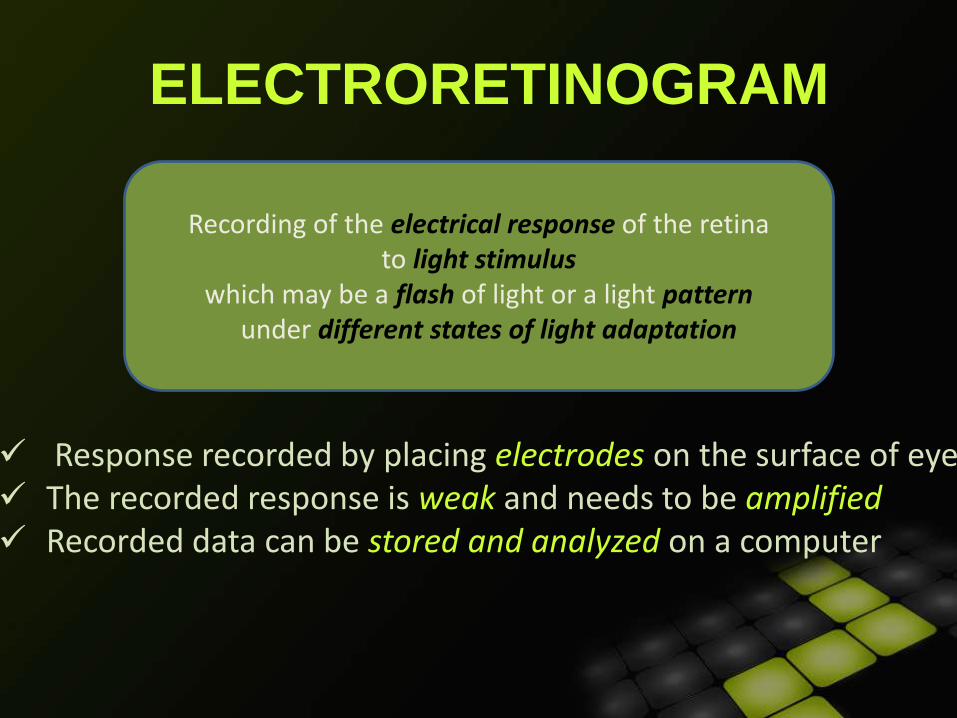
ELECTRORETINOGRAM
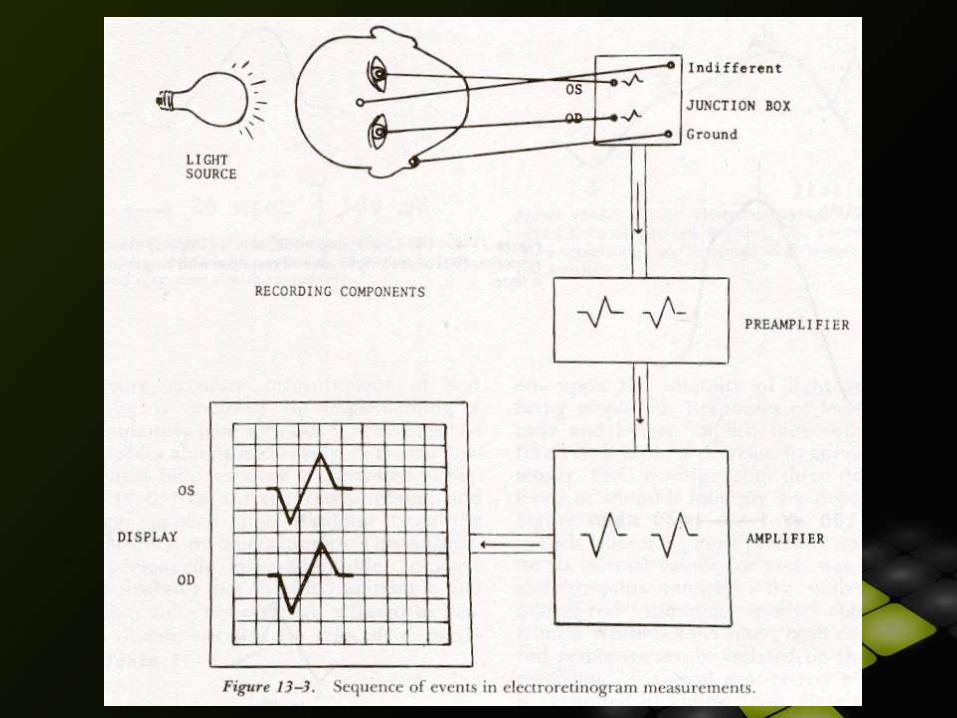
Response recorded by placing electrodes on the surface of eye The recorded response is weak and needs to be amplified Recorded data can be stored and analyzed on a computer
Recording of the electrical response of the retinato light stimulus
which may be a flash of light or a light patternunder different states of light adaptation
useful diagnostically in differentiating certainretinal diseases
It is the composite of electrical activity fromthe photoreceptors, Muller cells & RPE.
BASIC PRINCIPLE OF ERG
Sudden illumination of retina.
Simultaneous activation of all the retinal cells to generate the current
Currents generated by all the retinal cells mix, then pass through
vitreous & extra cellular spaces.
High RPE resistance prevents summated current from passing
posteriorly.
The small portion of the summated current which escapes through
the cornea recorded as------------
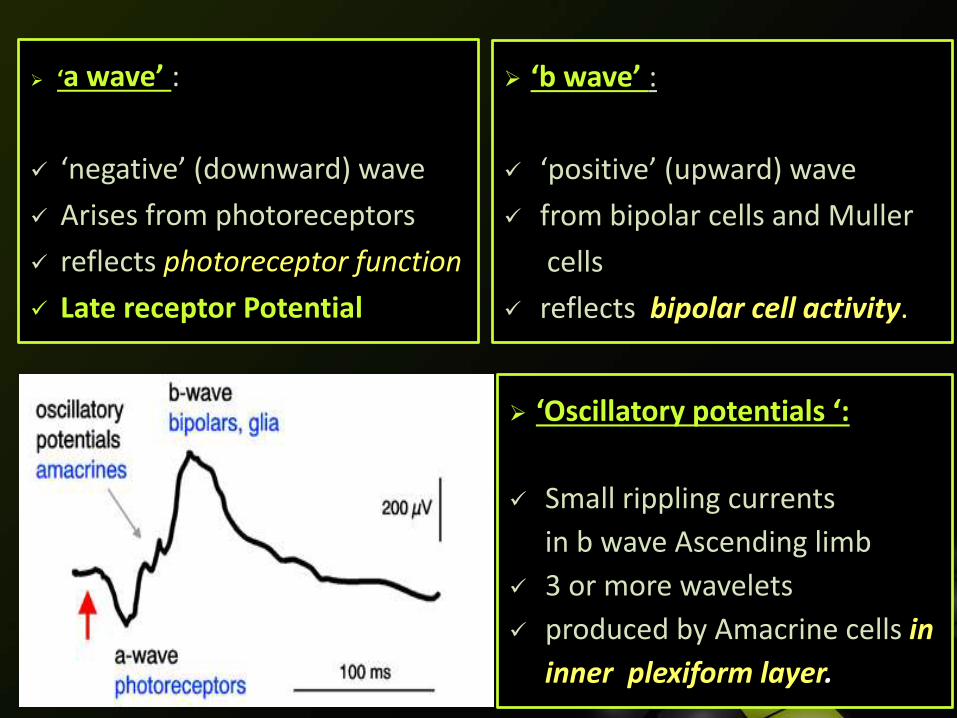
‘b wave’ :
‘positive’ (upward) wave
from bipolar cells and Muller
cells
reflects bipolar cell activity.
‘Oscillatory potentials ‘:
Small rippling currents
in b wave Ascending limb
3 or more wavelets
produced by Amacrine cells in
inner plexiform layer.
‘a wave’ :
‘negative’ (downward) wave
Arises from photoreceptors
reflects photoreceptor function
Late receptor Potential
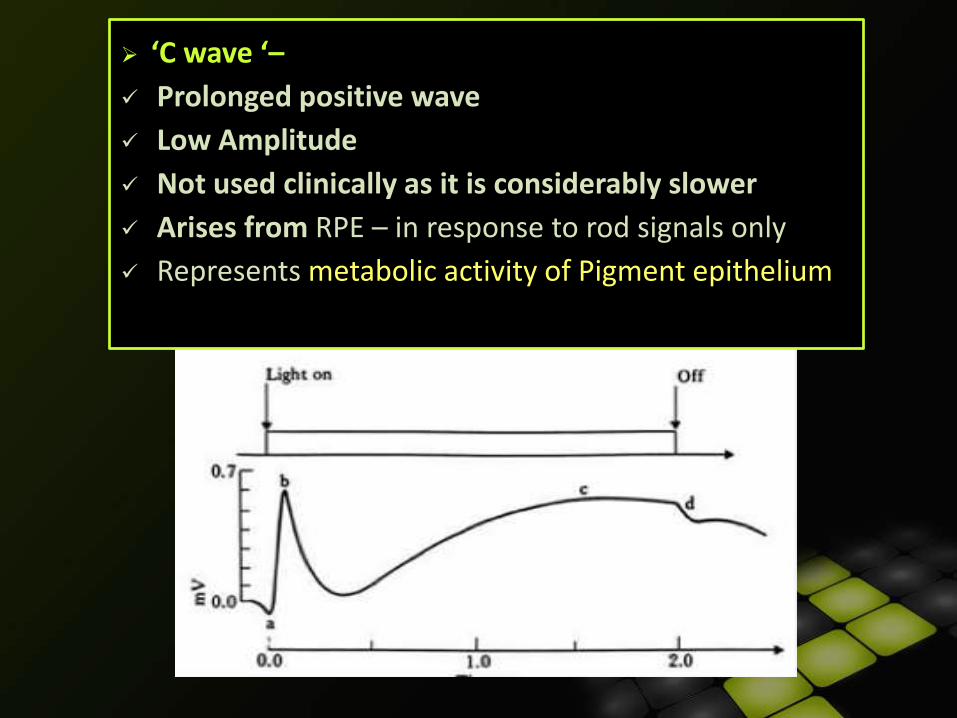
‘C wave ‘–
Prolonged positive wave
Low Amplitude
Not used clinically as it is considerably slower
Arises from RPE – in response to rod signals only
Represents metabolic activity of Pigment epithelium
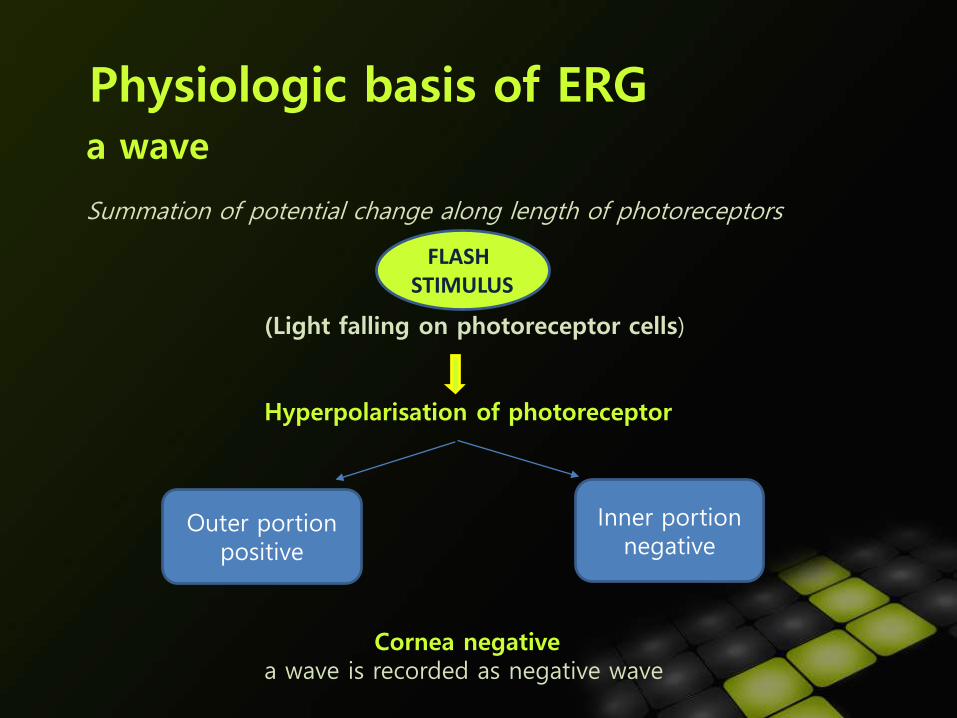
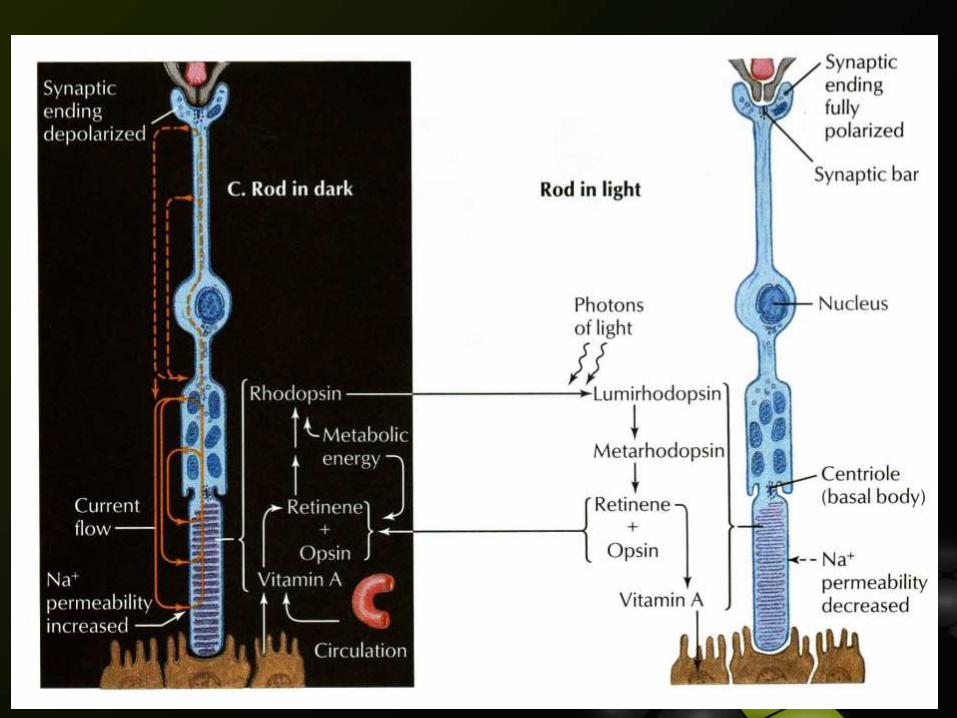
Physiologic basis of ERGa wave
Summation of potential change along length of photoreceptors
(Light falling on photoreceptor cells)
Hyperpolarisation of photoreceptor
Cornea negativea wave is recorded as negative wave
FLASH STIMULUS
Outer portion positive
Inner portion negative
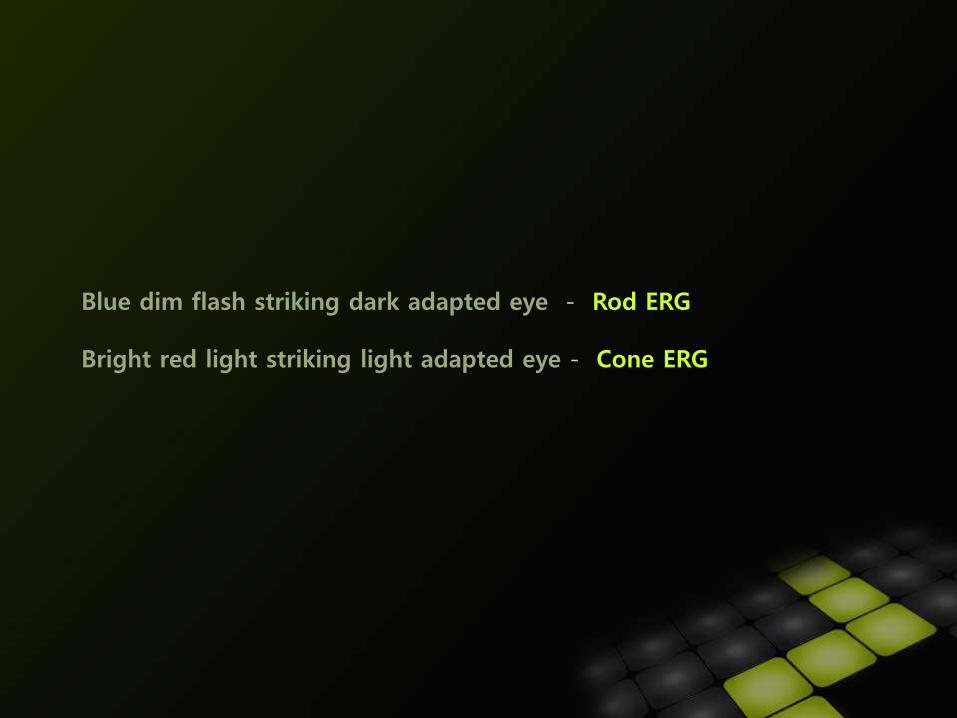
Blue dim flash striking dark adapted eye - Rod ERG
Bright red light striking light adapted eye - Cone ERG
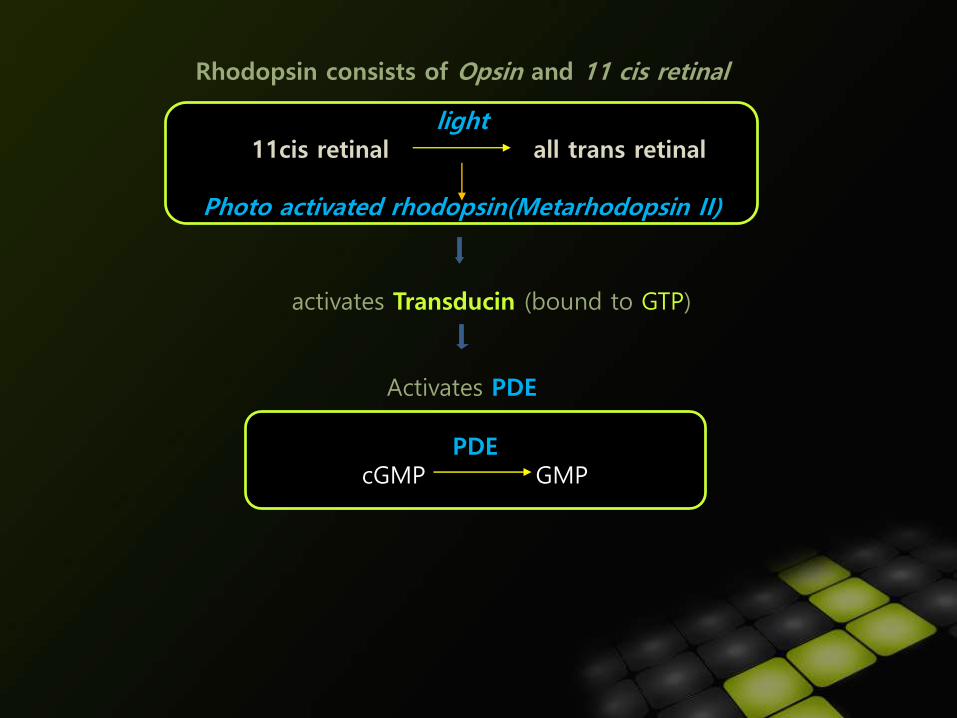
Rhodopsin consists of Opsin and 11 cis retinal
activates Transducin (bound to GTP)
Activates PDE
Reduced cGMP
light11cis retinal all trans retinal
Photo activated rhodopsin(Metarhodopsin II)
PDEcGMP GMP
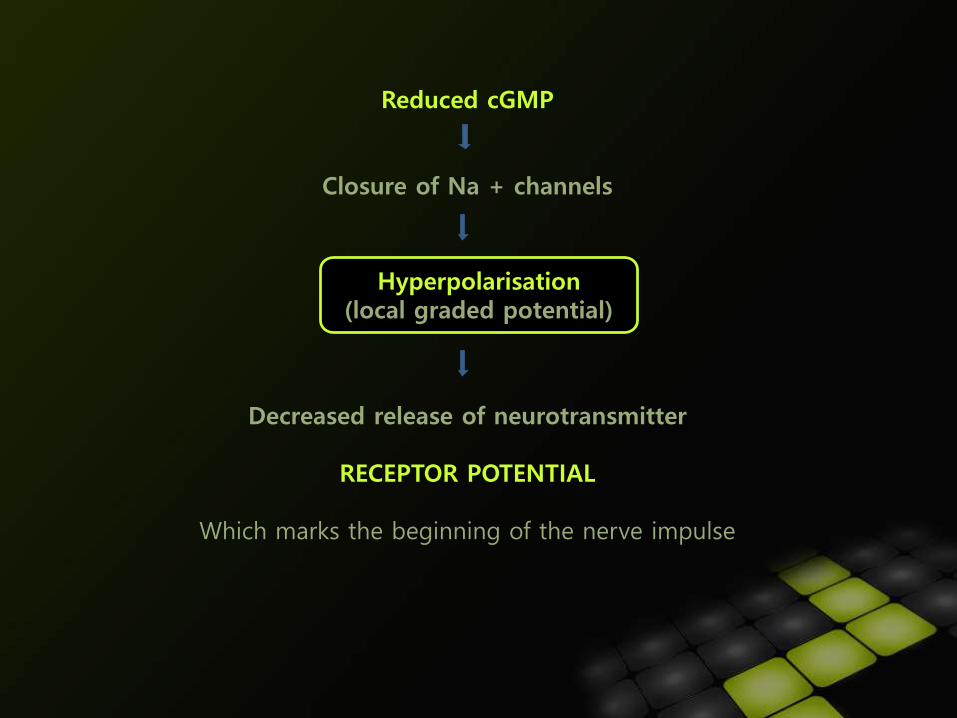
Reduced cGMP
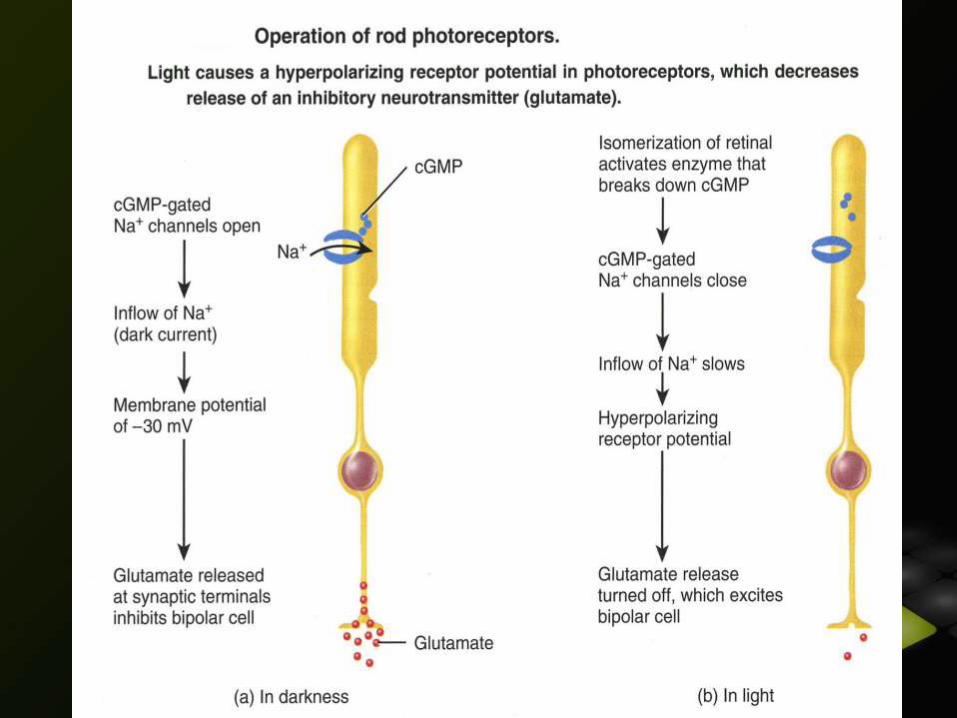
Closure of Na + channels
Decreased release of neurotransmitter
RECEPTOR POTENTIAL
Which marks the beginning of the nerve impulse
Hyperpolarisation (local graded potential)
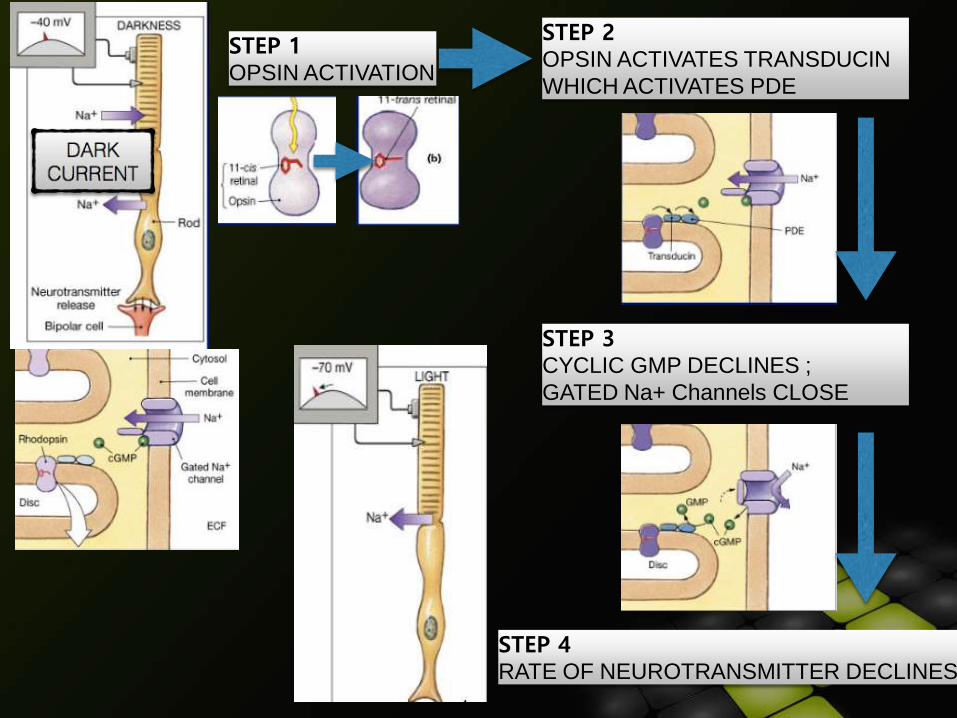
STEP 1OPSIN ACTIVATION
STEP 2OPSIN ACTIVATES TRANSDUCIN
WHICH ACTIVATES PDE
STEP 3CYCLIC GMP DECLINES ;
GATED Na+ Channels CLOSE
STEP 4RATE OF NEUROTRANSMITTER DECLINES
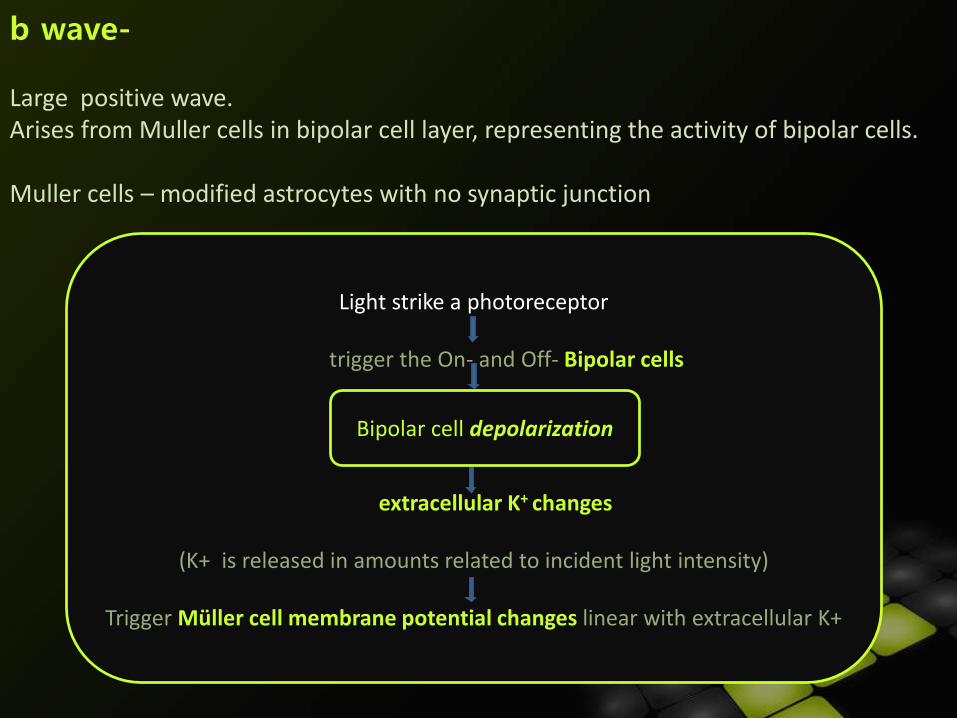
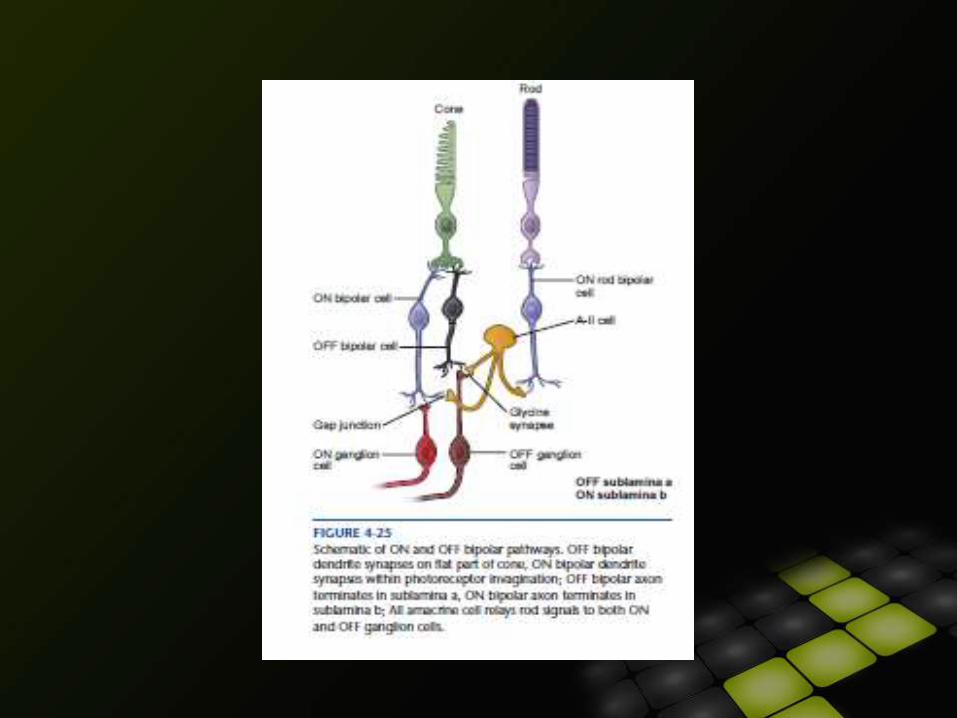
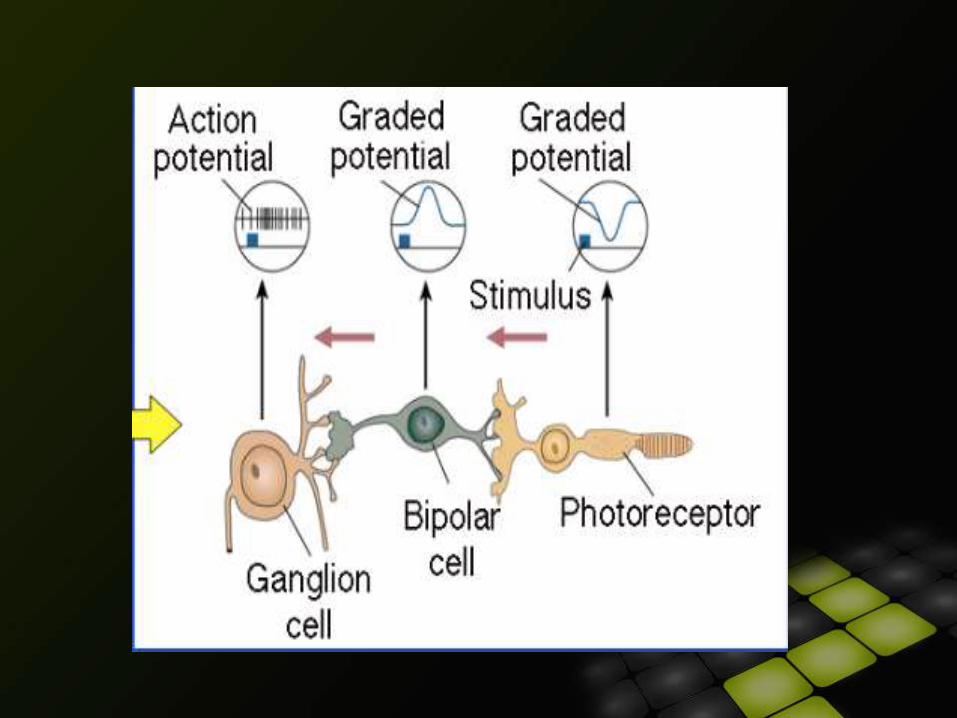
b wave-
Large positive wave.Arises from Muller cells in bipolar cell layer, representing the activity of bipolar cells.
Muller cells – modified astrocytes with no synaptic junction
Light strike a photoreceptor
trigger the On- and Off- Bipolar cells
extracellular K+ changes
(K+ is released in amounts related to incident light intensity)
Trigger Müller cell membrane potential changes linear with extracellular K+
Bipolar cell depolarization
Thus b wave Is dependant on electrical activity originating within Photoreceptor layer- Muller Cells provide b wave from rods and cones
Oscillatory Potential Seen on photopic light adapted b wave
produced by Amacrine cells in inner plexiform layer. Reflect feedback circuits in inner retina Disappear in cone dysfunction syndromes Selectively abolished in animals by clamping retinal circulation and in humans aft
er CRAO and in severe diabetic retinopathy
Because the ratio of Rods vs Cones is about 13:1, scotopic B-wave is a measure of the respons
e from the Rod system, especially for dim flash
C wave
Generated from RPE cells in response to rod signals only
as rod cells are in direct contact with apical end of RPE cells while cones do not appear to make such contact
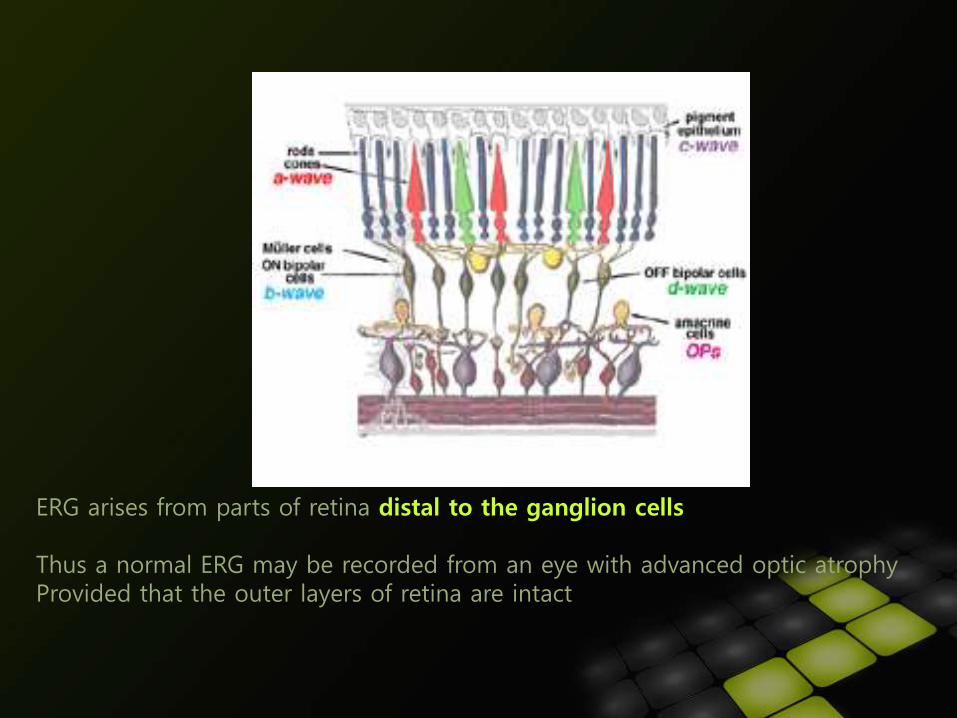
ERG arises from parts of retina distal to the ganglion cells
Thus a normal ERG may be recorded from an eye with advanced optic atrophy Provided that the outer layers of retina are intact
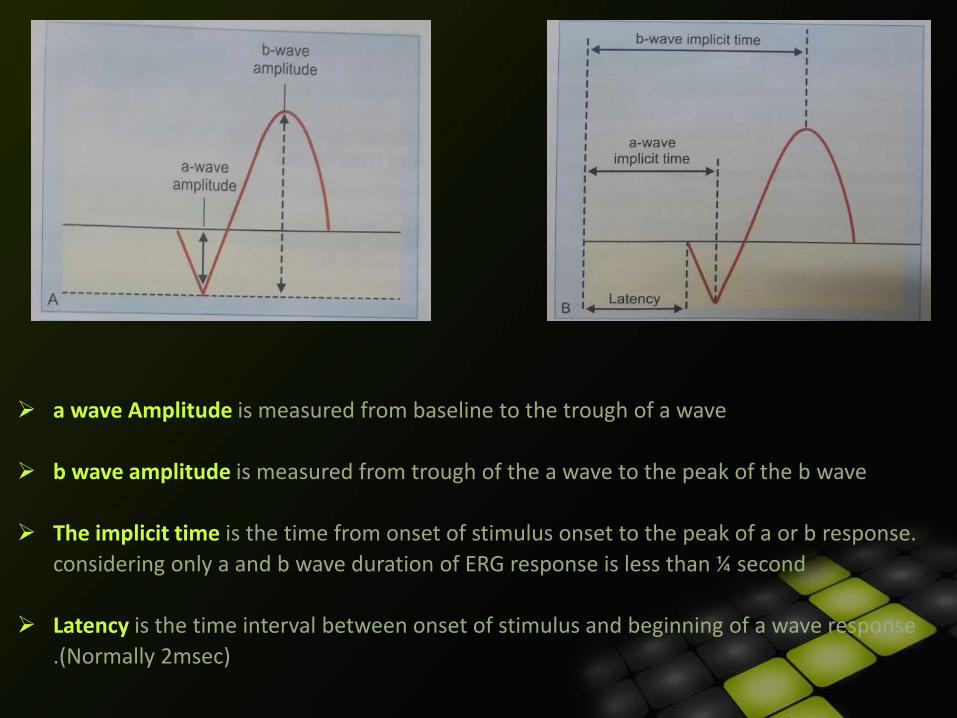
a wave Amplitude is measured from baseline to the trough of a wave
b wave amplitude is measured from trough of the a wave to the peak of the b wave
The implicit time is the time from onset of stimulus onset to the peak of a or b response.
considering only a and b wave duration of ERG response is less than ¼ second
Latency is the time interval between onset of stimulus and beginning of a wave response
.(Normally 2msec)
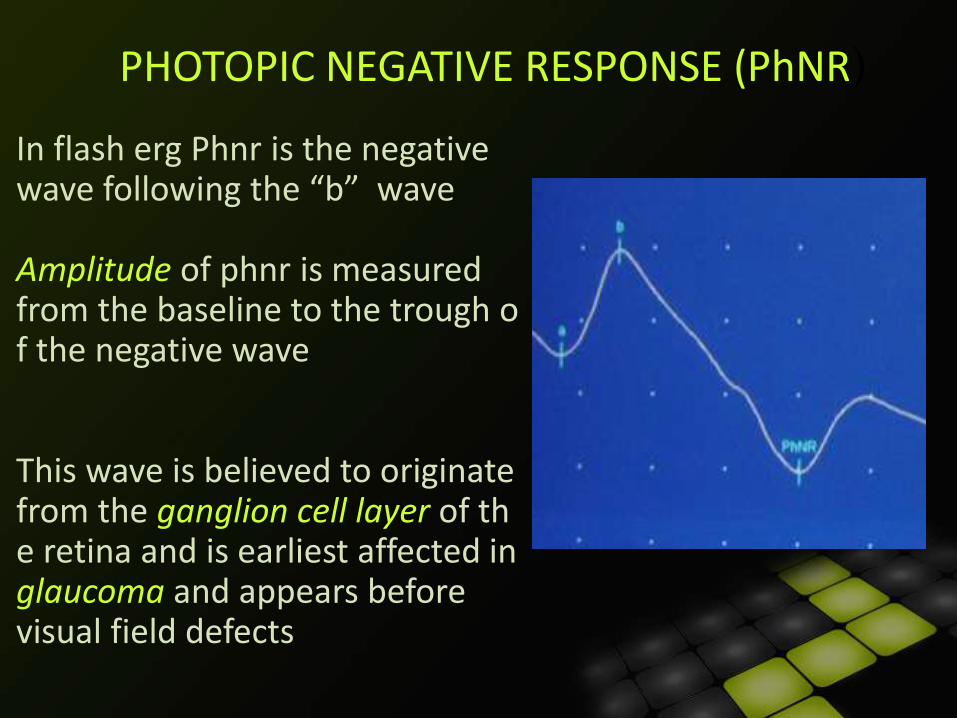
PHOTOPIC NEGATIVE RESPONSE (PhNR)
In flash erg Phnr is the negative wave following the “b” wave
Amplitude of phnr is measured from the baseline to the trough of the negative wave
This wave is believed to originate from the ganglion cell layer of the retina and is earliest affected in glaucoma and appears before visual field defects
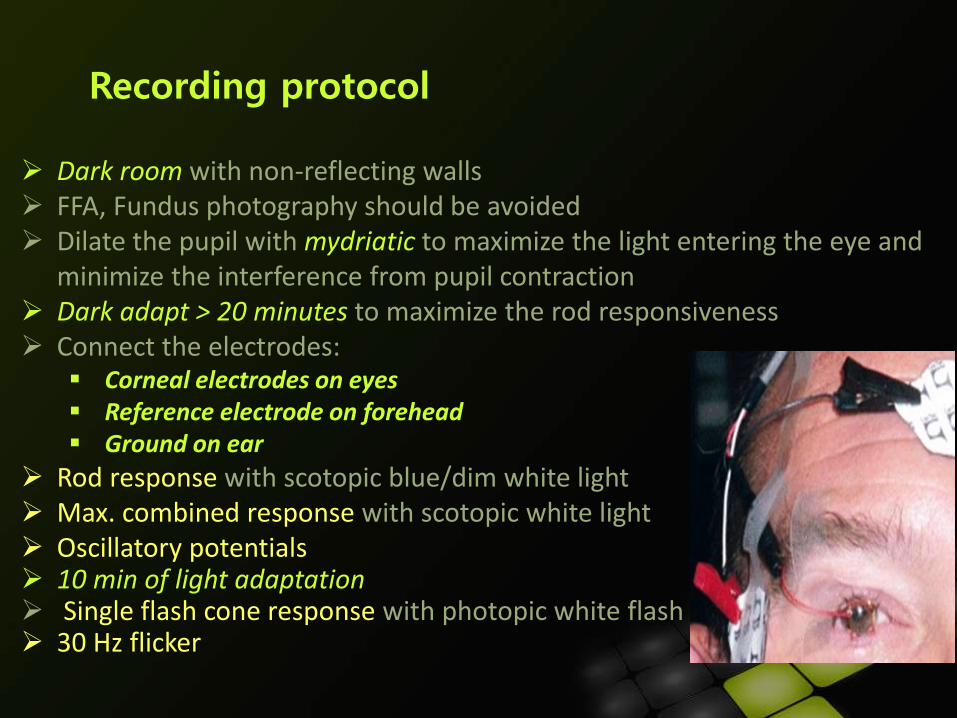
Recording protocol
Dark room with non-reflecting walls FFA, Fundus photography should be avoided Dilate the pupil with mydriatic to maximize the light entering the eye and
minimize the interference from pupil contraction Dark adapt > 20 minutes to maximize the rod responsiveness Connect the electrodes:
Corneal electrodes on eyes Reference electrode on forehead Ground on ear
Rod response with scotopic blue/dim white light Max. combined response with scotopic white light Oscillatory potentials 10 min of light adaptation Single flash cone response with photopic white flash 30 Hz flicker
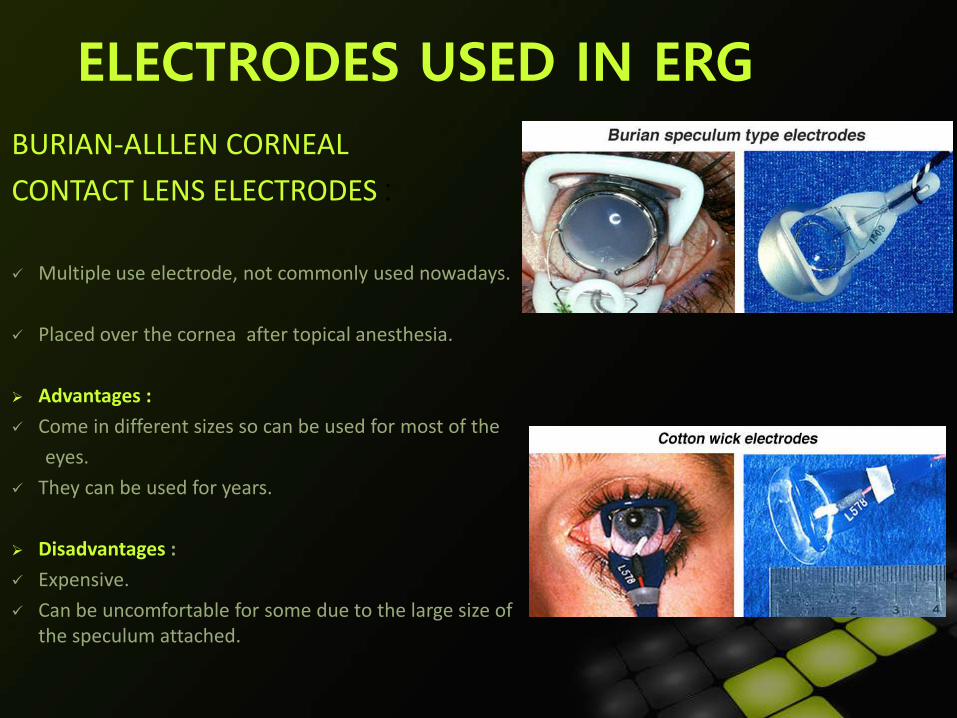
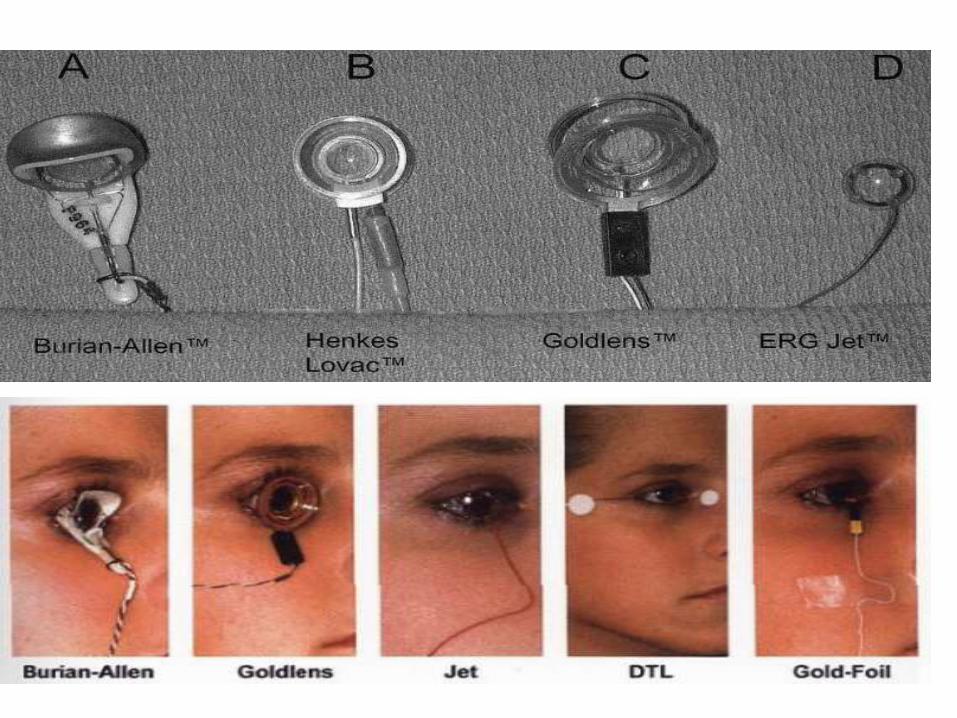
BURIAN-ALLLEN CORNEAL
CONTACT LENS ELECTRODES :
Multiple use electrode, not commonly used nowadays.
Placed over the cornea after topical anesthesia.
Advantages :
Come in different sizes so can be used for most of the
eyes.
They can be used for years.
Disadvantages :
Expensive.
Can be uncomfortable for some due to the large size of the speculum attached.
ELECTRODES USED IN ERG

JET DISPOSABLE ELECTRODE :
Small monopolar, hard contact lens
electrode which is placed over cornea.
Requires skin electrode as reference
electrode which is placed on forehead.
Single use electrodes & quite expensive.
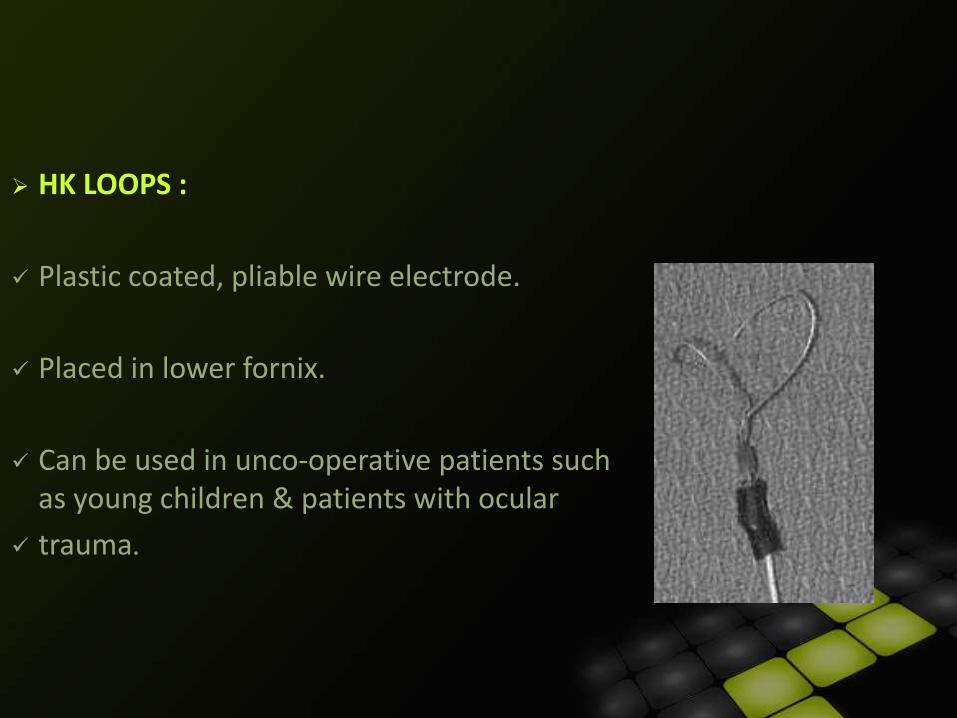
HK LOOPS :
Plastic coated, pliable wire electrode.
Placed in lower fornix.
Can be used in unco-operative patients such as young children & patients with ocular
trauma.
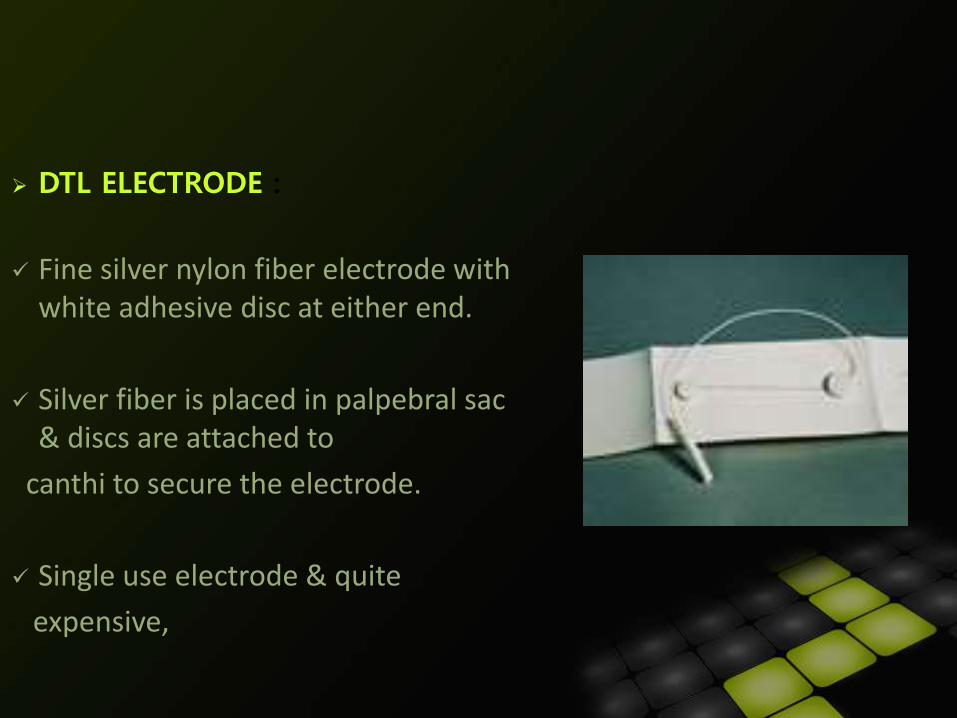
DTL ELECTRODE :
Fine silver nylon fiber electrode with white adhesive disc at either end.
Silver fiber is placed in palpebral sac & discs are attached to
canthi to secure the electrode.
Single use electrode & quite
expensive,
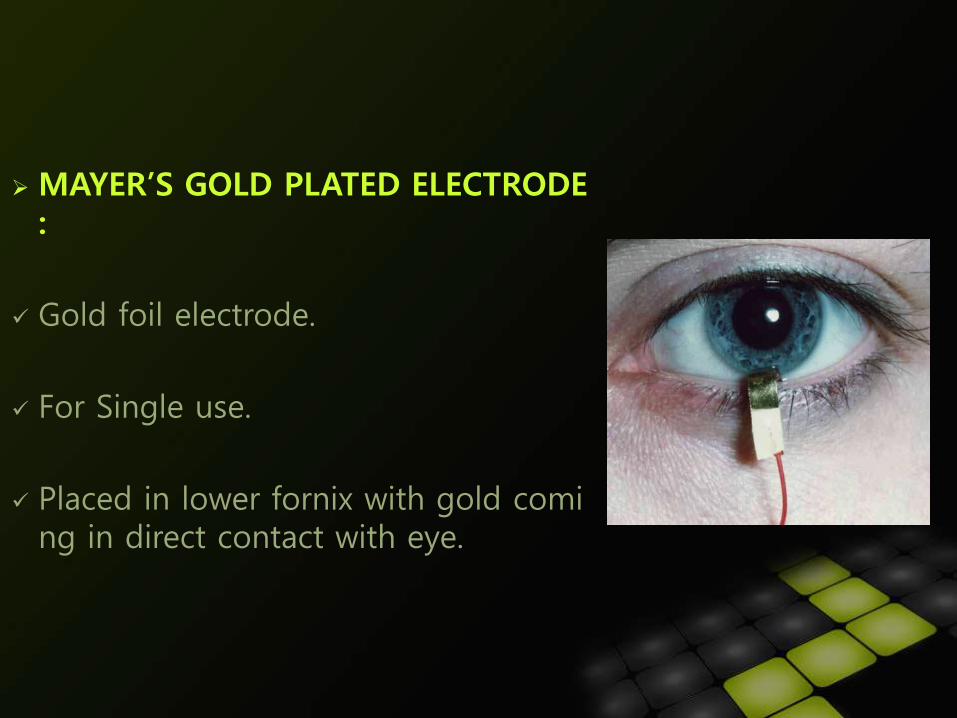
MAYER’S GOLD PLATED ELECTRODE :
Gold foil electrode.
For Single use.
Placed in lower fornix with gold coming in direct contact with eye.
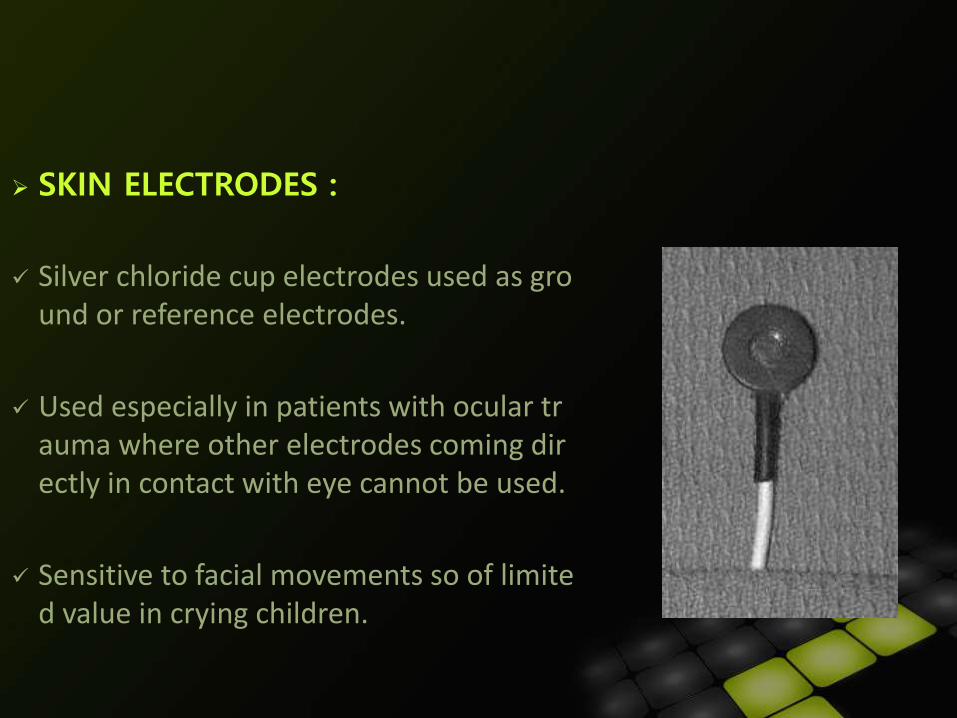
SKIN ELECTRODES :
Silver chloride cup electrodes used as ground or reference electrodes.
Used especially in patients with ocular trauma where other electrodes coming directly in contact with eye cannot be used.
Sensitive to facial movements so of limited value in crying children.
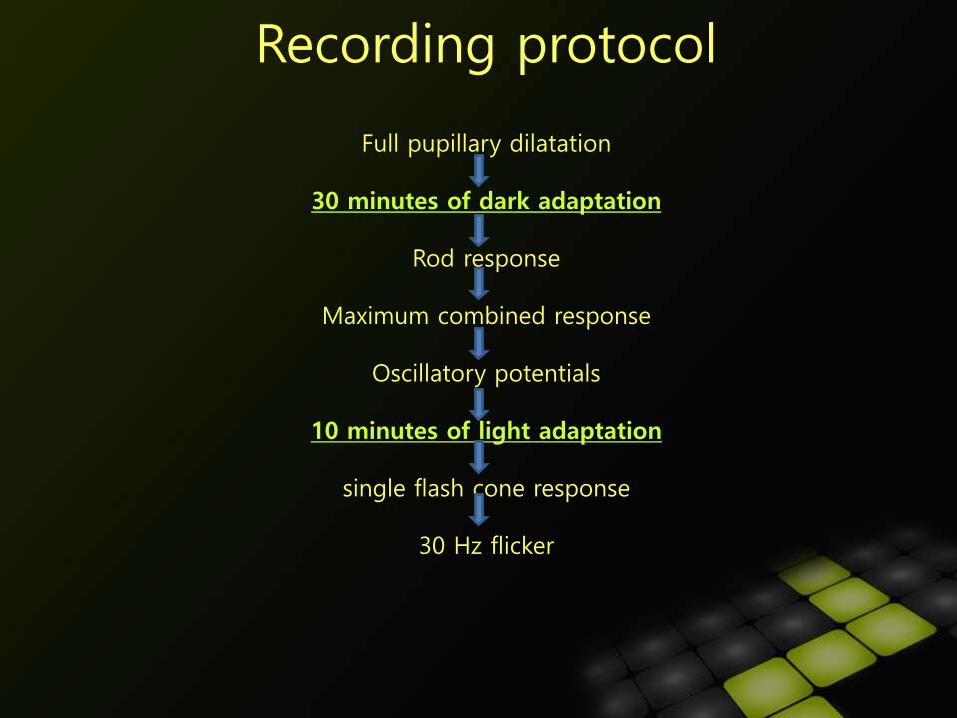
Recording protocol
Full pupillary dilatation
30 minutes of dark adaptation
Rod response
Maximum combined response
Oscillatory potentials
10 minutes of light adaptation
single flash cone response
30 Hz flicker
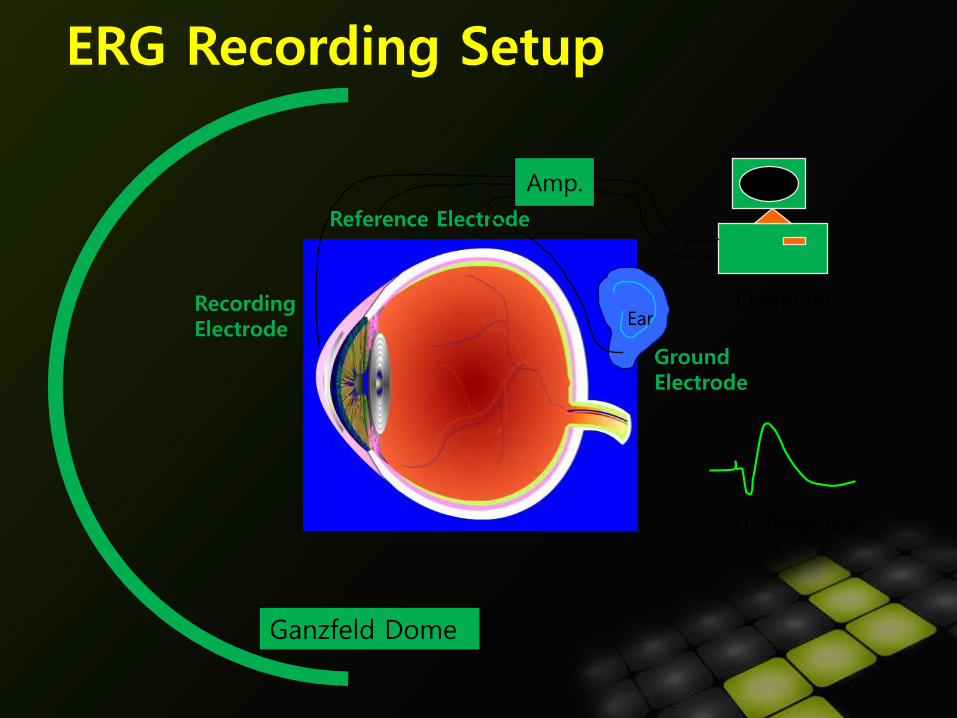
Recording Electrode
Amp.
Reference Electrode
ComputerEar
Ground Electrode
ERG Recording Setup
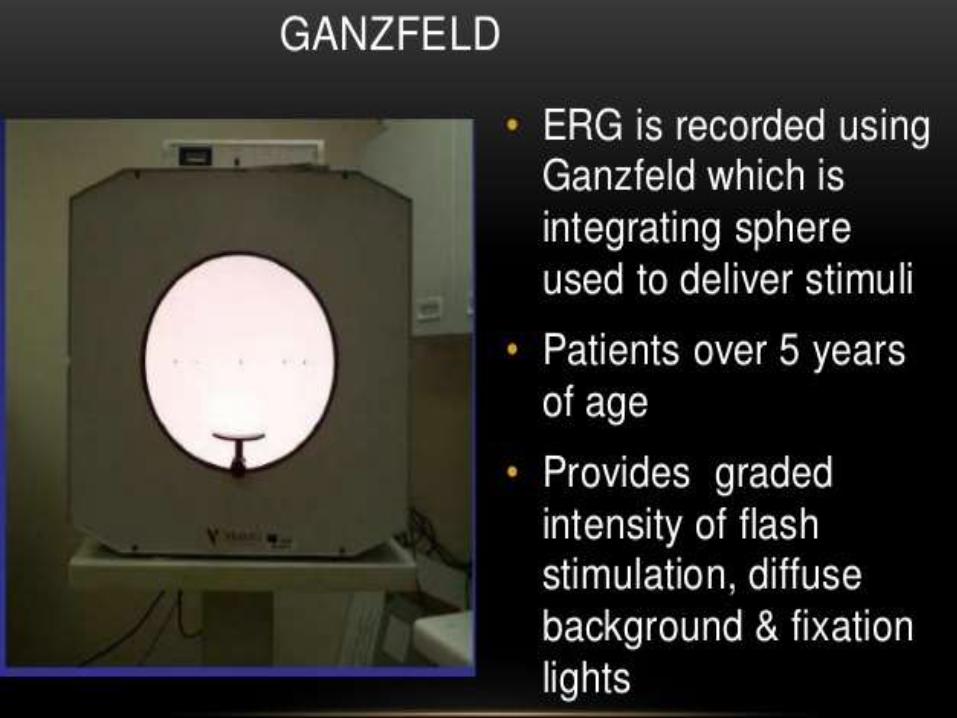
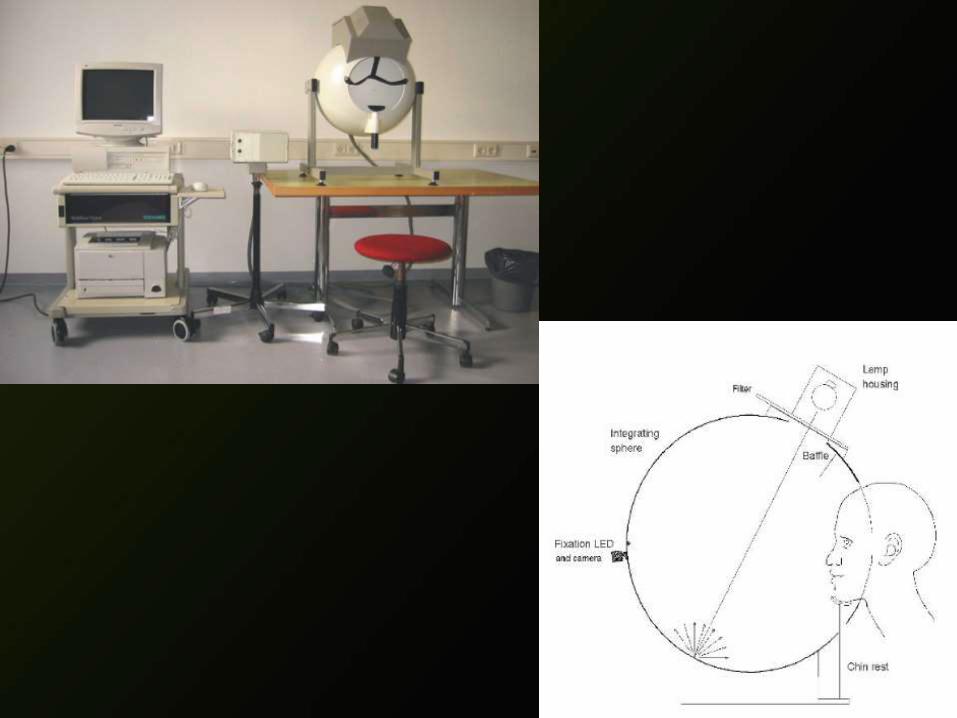
Ganzfeld Dome
ERG Response
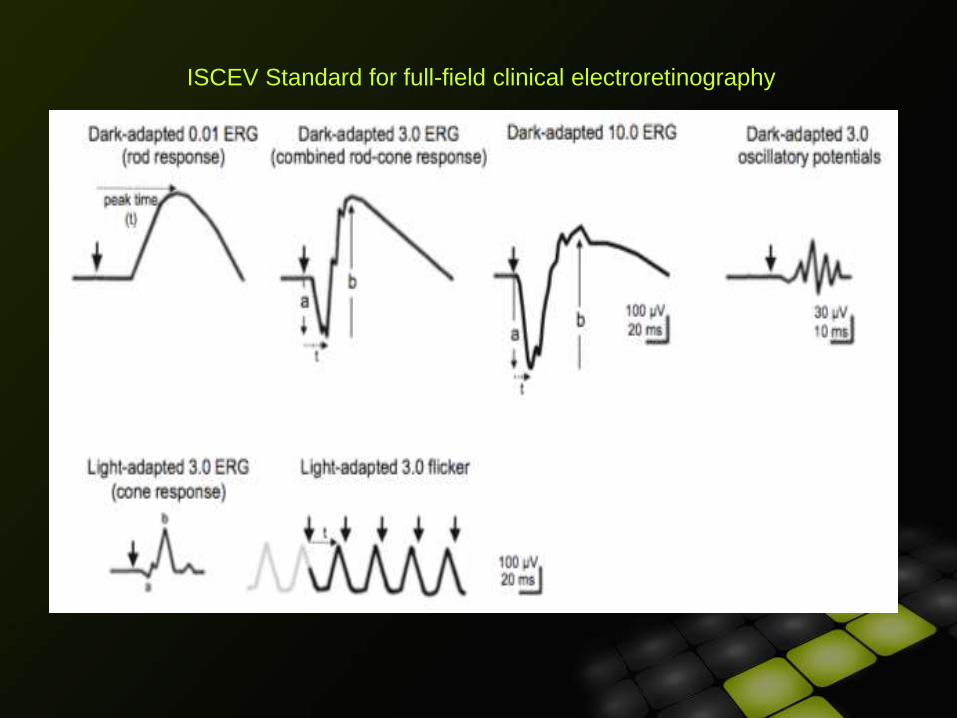
ISCEV Standard for full-field clinical electroretinography
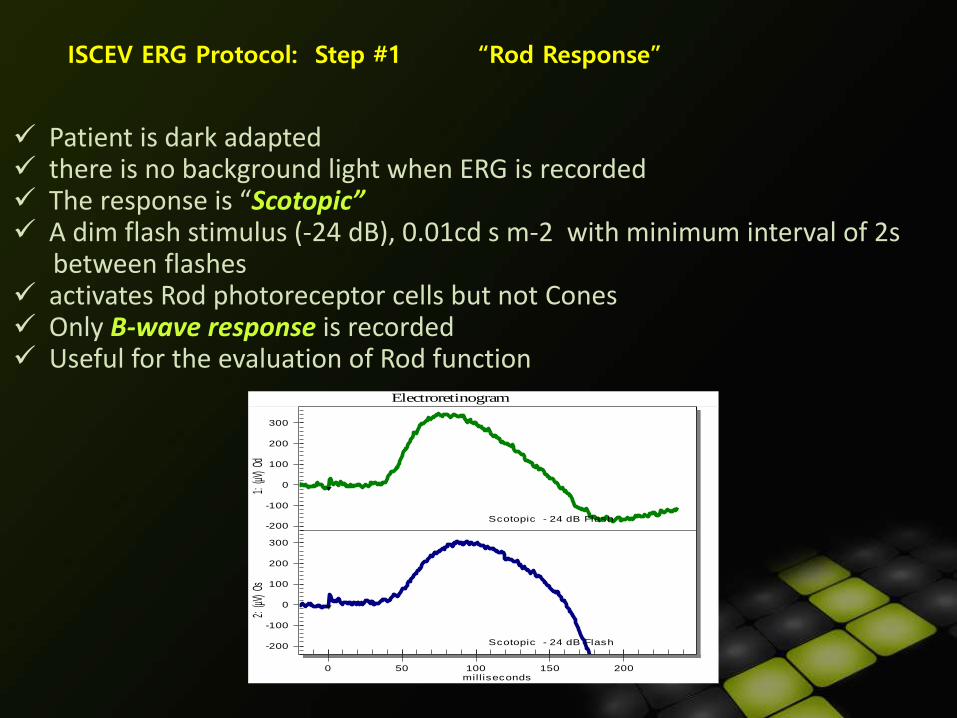
ISCEV ERG Protocol: Step #1 “Rod Response”
Patient is dark adapted there is no background light when ERG is recorded The response is “Scotopic” A dim flash stimulus (-24 dB), 0.01cd s m-2 with minimum interval of 2s
between flashes activates Rod photoreceptor cells but not Cones Only B-wave response is recorded Useful for the evaluation of Rod function
Scotopic - 24 dB Flash
Scotopic - 24 dB Flash
-200
-100
0
100
200
300
-200
-100
0
100
200
300
0 50 100 150 200
Electroretinogram
1: (µ
V) O
d 2:
(µV)
Os
milliseconds
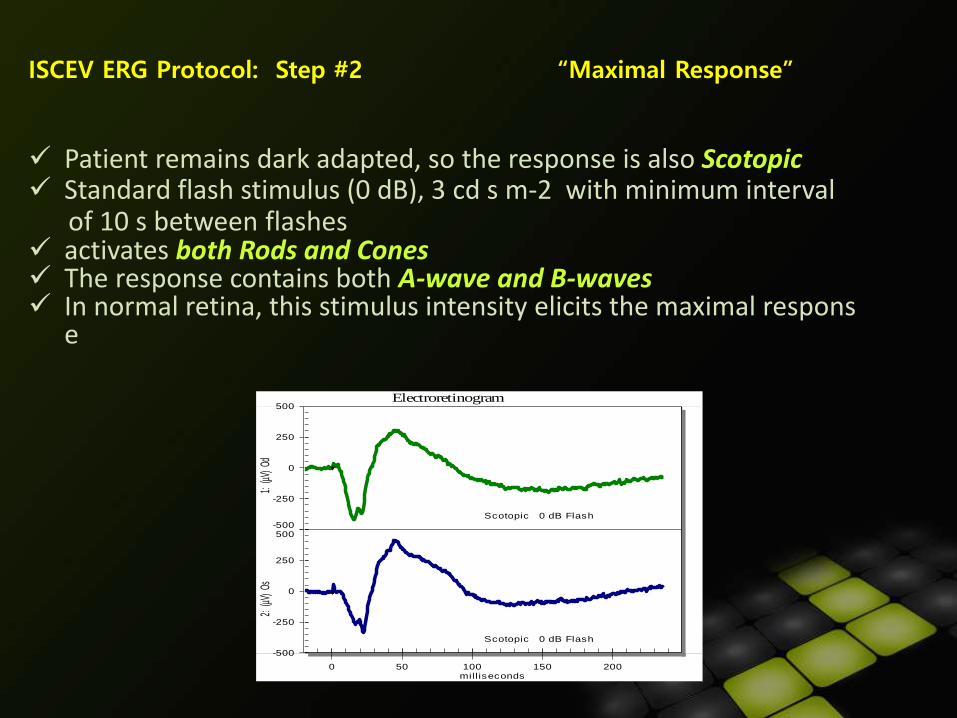
ISCEV ERG Protocol: Step #2 “Maximal Response”
Patient remains dark adapted, so the response is also Scotopic Standard flash stimulus (0 dB), 3 cd s m-2 with minimum interval
of 10 s between flashes activates both Rods and Cones The response contains both A-wave and B-waves In normal retina, this stimulus intensity elicits the maximal respons
e
Scotopic 0 dB Flash
Scotopic 0 dB Flash
-500
-250
0
250
500
-500
-250
0
250
500
0 50 100 150 200
Electroretinogram
1:
(µV)
Od
2:
(µV)
Os
milliseconds
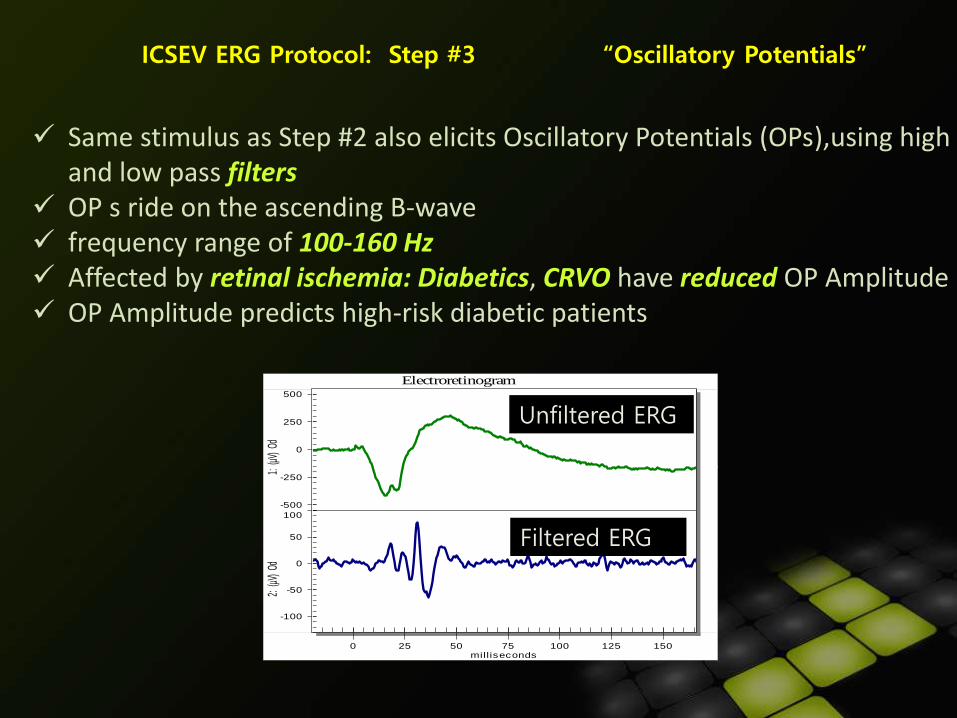
ICSEV ERG Protocol: Step #3 “Oscillatory Potentials”
Same stimulus as Step #2 also elicits Oscillatory Potentials (OPs),using high and low pass filters
OP s ride on the ascending B-wave frequency range of 100-160 Hz Affected by retinal ischemia: Diabetics, CRVO have reduced OP Amplitude OP Amplitude predicts high-risk diabetic patients
-500
-250
0
250
500
-100
-50
0
50
100
0 25 50 75 100 125 150
Electroretinogram
1:
(µV)
Od
2:
(µV)
Od
milliseconds
Filtered ERG
Unfiltered ERG
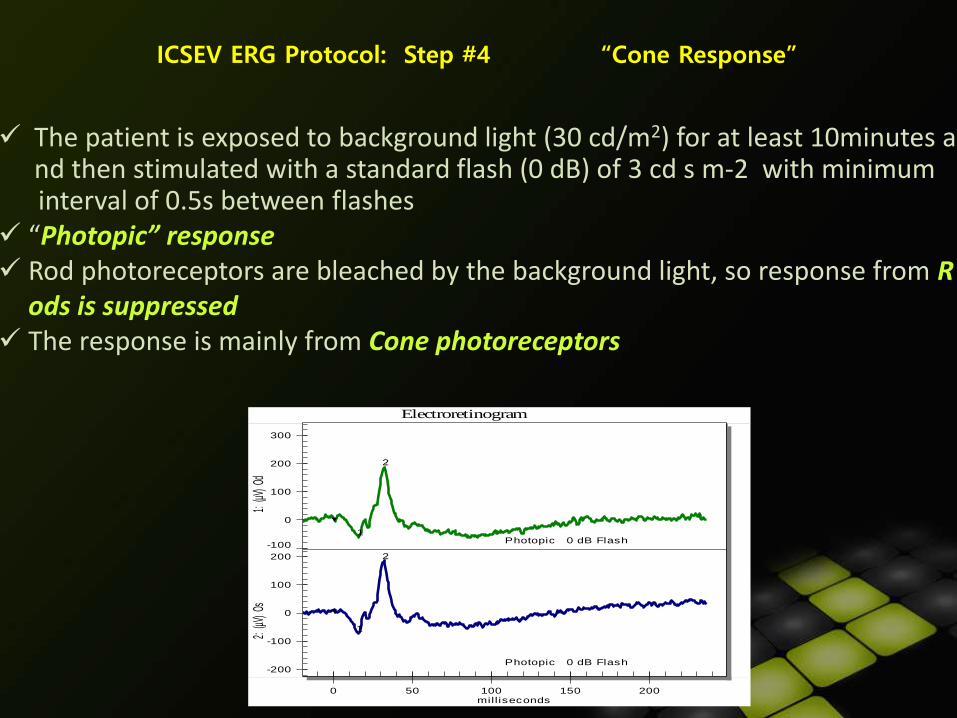
ICSEV ERG Protocol: Step #4 “Cone Response”
The patient is exposed to background light (30 cd/m2) for at least 10minutes and then stimulated with a standard flash (0 dB) of 3 cd s m-2 with minimum interval of 0.5s between flashes
“Photopic” response Rod photoreceptors are bleached by the background light, so response from R
ods is suppressed The response is mainly from Cone photoreceptors
1
2
1
2
Photopic 0 dB Flash
Photopic 0 dB Flash
-100
0
100
200
300
-200
-100
0
100
200
0 50 100 150 200
Electroretinogram
1: (µ
V) O
d 2:
(µV)
Os
milliseconds
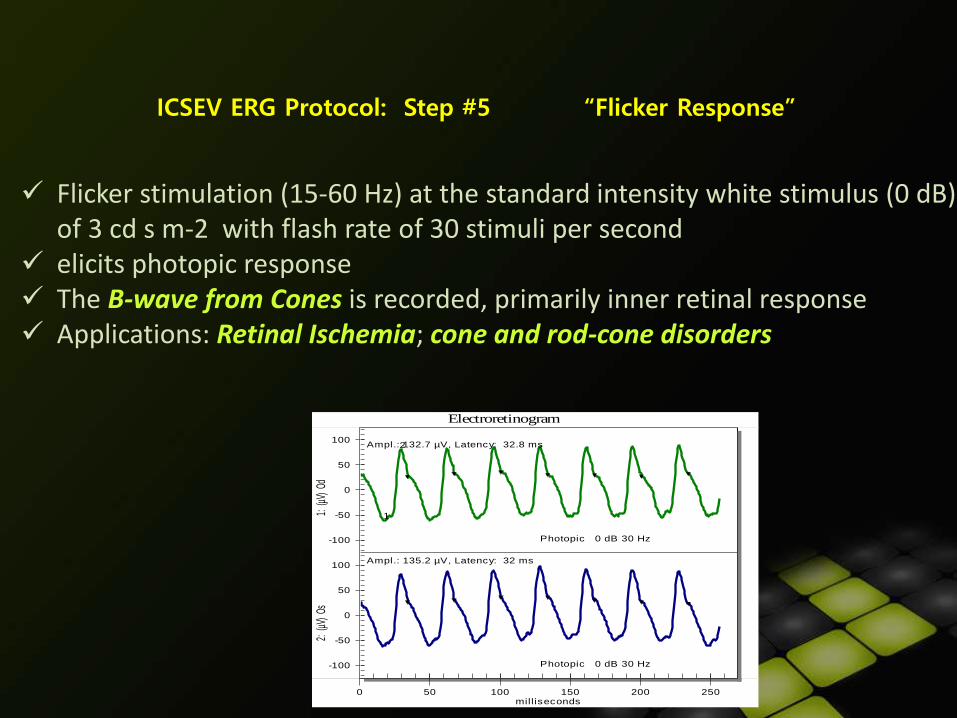
ICSEV ERG Protocol: Step #5 “Flicker Response”
Flicker stimulation (15-60 Hz) at the standard intensity white stimulus (0 dB) of 3 cd s m-2 with flash rate of 30 stimuli per second
elicits photopic response The B-wave from Cones is recorded, primarily inner retinal response Applications: Retinal Ischemia; cone and rod-cone disorders
1
2
Photopic 0 dB 30 Hz
Photopic 0 dB 30 Hz
Ampl.: 132.7 µV, Latency: 32.8 ms
Ampl.: 135.2 µV, Latency: 32 ms
-100
-50
0
50
100
-100
-50
0
50
100
0 50 100 150 200 250
Electroretinogram
1:
(µV)
Od
2:
(µV)
Os
milliseconds
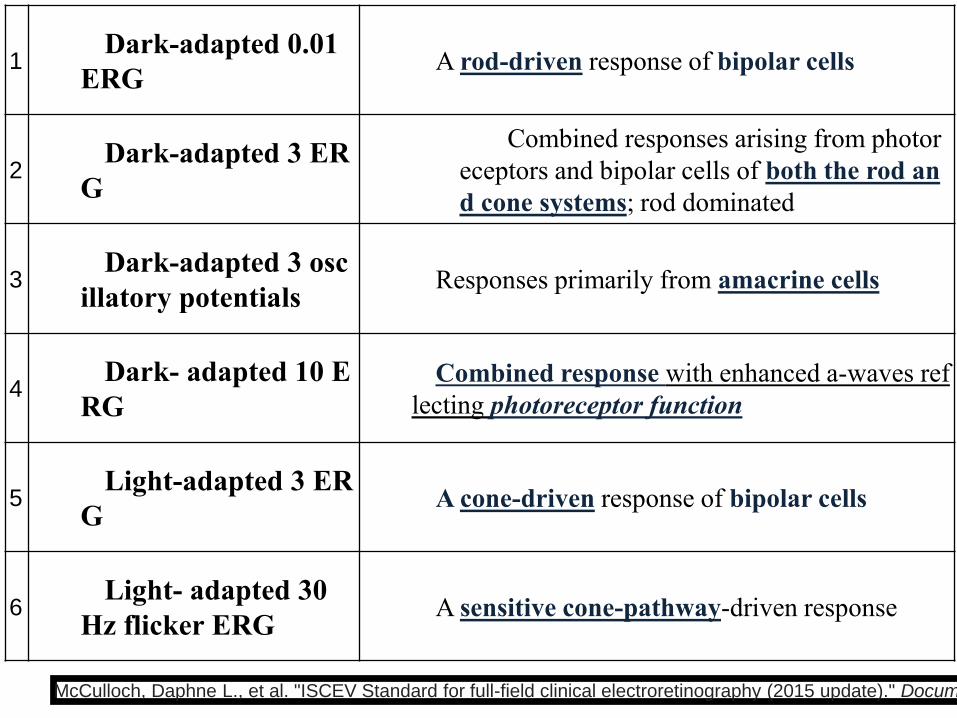
1Dark-adapted 0.01
ERGA rod-driven response of bipolar cells
2Dark-adapted 3 ER
G
Combined responses arising from photor
eceptors and bipolar cells of both the rod an
d cone systems; rod dominated
3Dark-adapted 3 osc
illatory potentialsResponses primarily from amacrine cells
4Dark- adapted 10 E
RG
Combined response with enhanced a-waves ref
lecting photoreceptor function
5Light-adapted 3 ER
GA cone-driven response of bipolar cells
6Light- adapted 30
Hz flicker ERGA sensitive cone-pathway-driven response
McCulloch, Daphne L., et al. "ISCEV Standard for full-field clinical electroretinography (2015 update)." Documenta Ophthalmologica
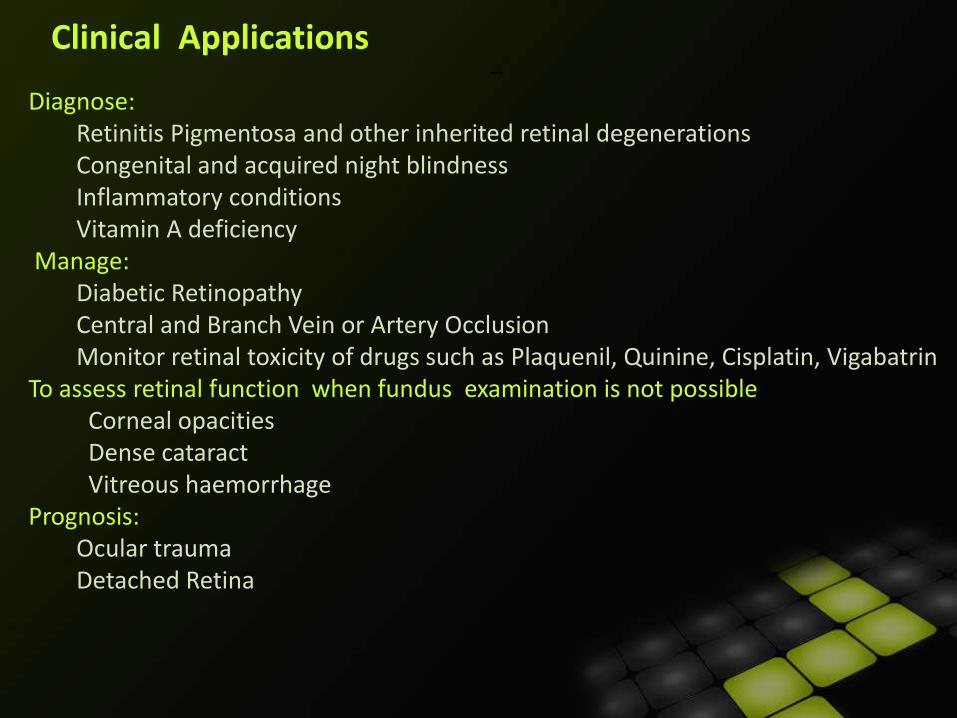
Diagnose:Retinitis Pigmentosa and other inherited retinal degenerationsCongenital and acquired night blindnessInflammatory conditions Vitamin A deficiency
Manage:Diabetic RetinopathyCentral and Branch Vein or Artery OcclusionMonitor retinal toxicity of drugs such as Plaquenil, Quinine, Cisplatin, Vigabatrin
To assess retinal function when fundus examination is not possibleCorneal opacitiesDense cataractVitreous haemorrhage
Prognosis:Ocular traumaDetached Retina
Clinical Applications–
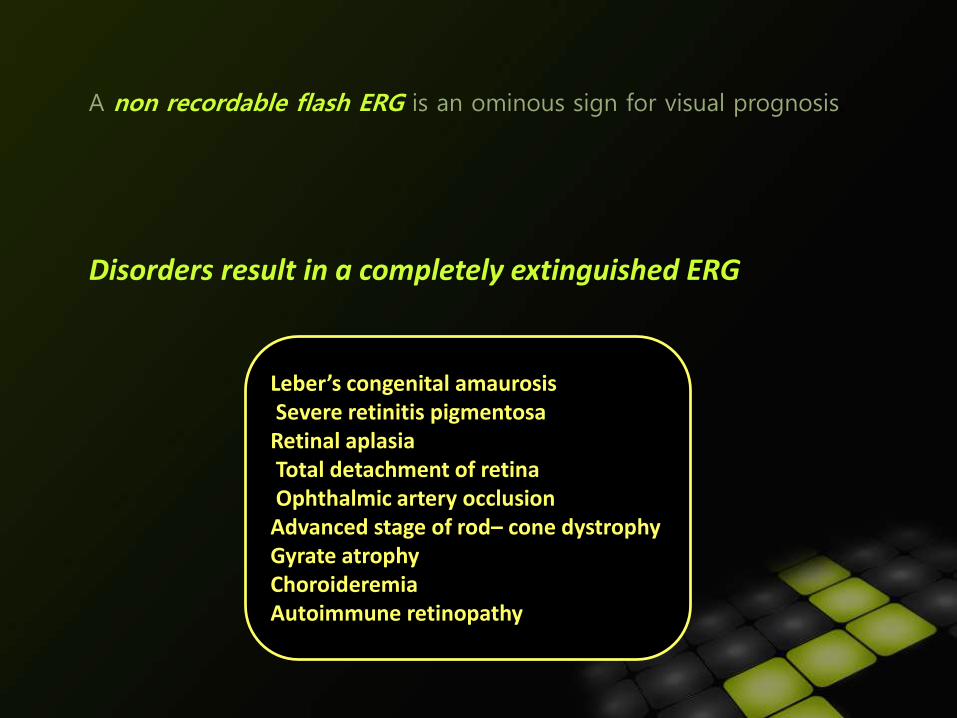
A non recordable flash ERG is an ominous sign for visual prognosis.
Disorders result in a completely extinguished ERG
Leber’s congenital amaurosisSevere retinitis pigmentosa
Retinal aplasiaTotal detachment of retinaOphthalmic artery occlusion
Advanced stage of rod– cone dystrophyGyrate atrophyChoroideremiaAutoimmune retinopathy
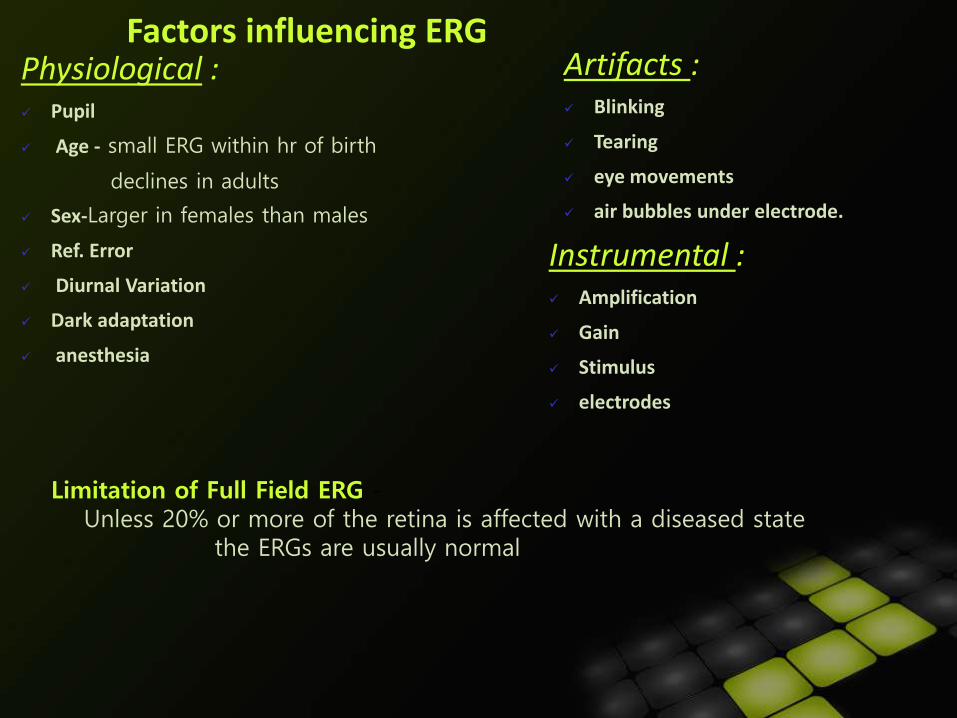
Factors influencing ERGPhysiological : Pupil
Age - small ERG within hr of birth
declines in adults
Sex-Larger in females than males
Ref. Error
Diurnal Variation
Dark adaptation
anesthesia
Limitation of Full Field ERG -Unless 20% or more of the retina is affected with a diseased state
the ERGs are usually normal
Artifacts : Blinking
Tearing
eye movements
air bubbles under electrode.
Instrumental : Amplification
Gain
Stimulus
electrodes
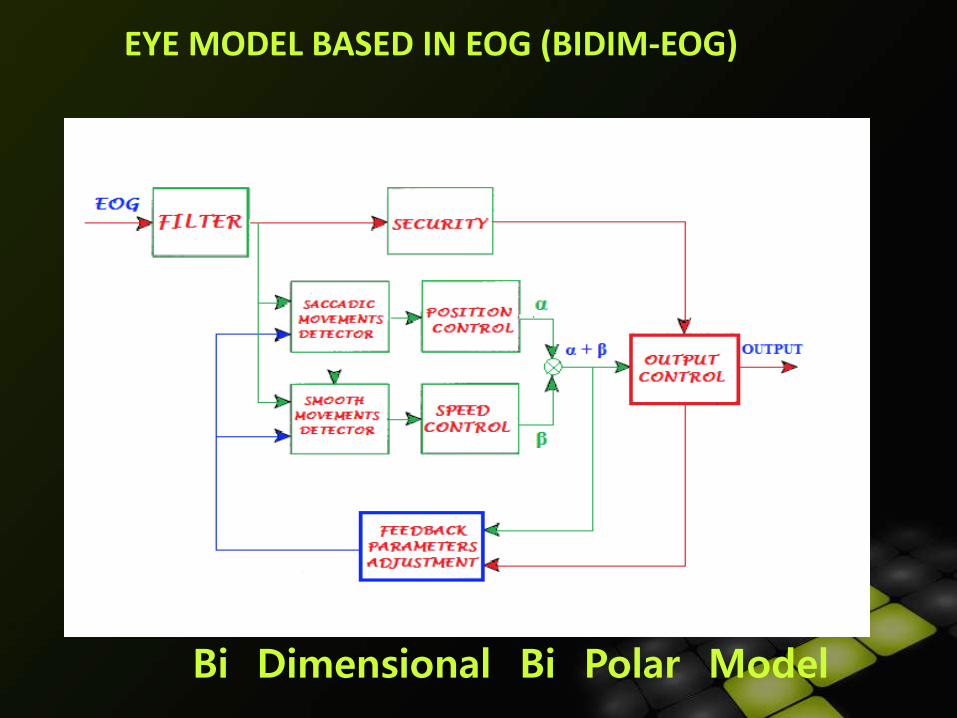
EYE MODEL BASED IN EOG (BIDIM-EOG)
Bi Dimensional Bi Polar Model
PATTERN ERG• Measure of macular function and generalized bipolar cell function.
• most common stimulus : Checkerboard stimulus composed of white and black squares
• PERG generation requires physiological integrity of anatomically present RGCs
• Reduction of PERG amplitude reflect the reduced activity of dysfunctional RGCs
• reflects inner retina activity under light-adaptation.
• should be used in combination with a traditional light-adapted luminance ERG to have an index of outer retina function
• an important tool to monitor the onset and the progression of RGC
dysfunction in optic nerve disease.
Example:-
Glaucoma, optic neuritis, ischemic optic neuropathy, and mitochondrial
optic neuropathy
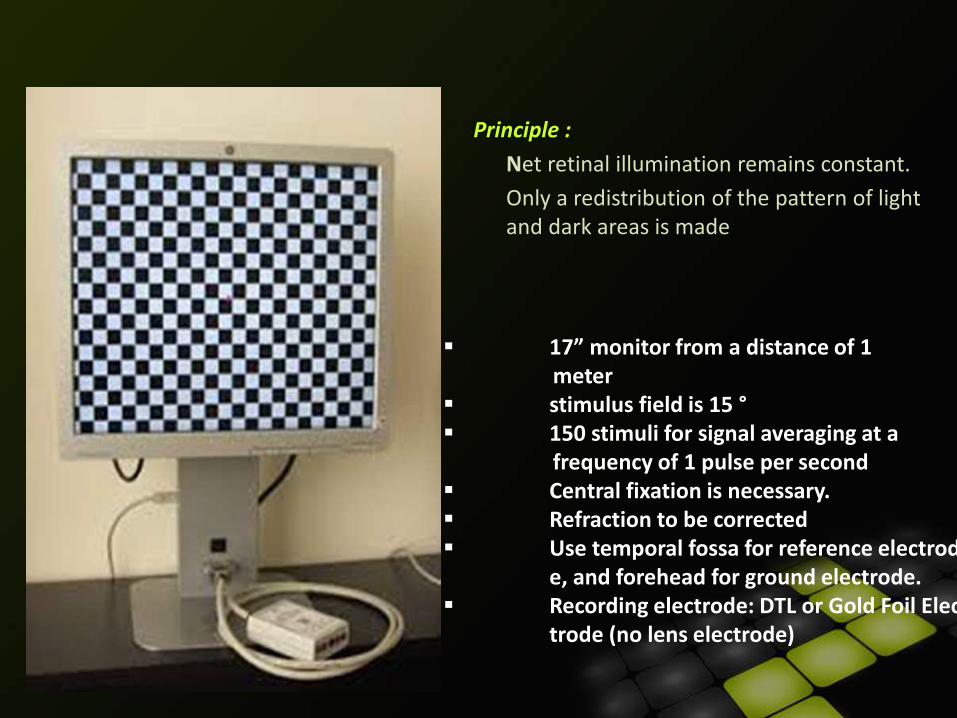
Principle :
Net retinal illumination remains constant.
Only a redistribution of the pattern of light and dark areas is made
17” monitor from a distance of 1 meter
stimulus field is 15 ° 150 stimuli for signal averaging at a
frequency of 1 pulse per second Central fixation is necessary. Refraction to be corrected Use temporal fossa for reference electrod
e, and forehead for ground electrode. Recording electrode: DTL or Gold Foil Elec
trode (no lens electrode)
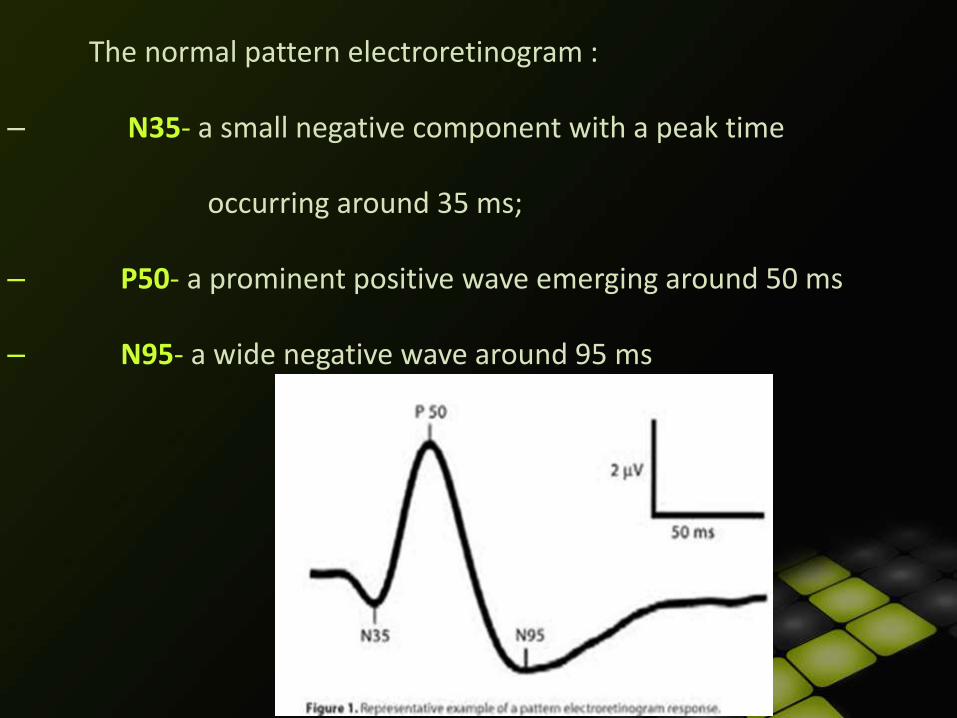
• The normal pattern electroretinogram :
– N35- a small negative component with a peak time
occurring around 35 ms;
– P50- a prominent positive wave emerging around 50 ms
– N95- a wide negative wave around 95 ms
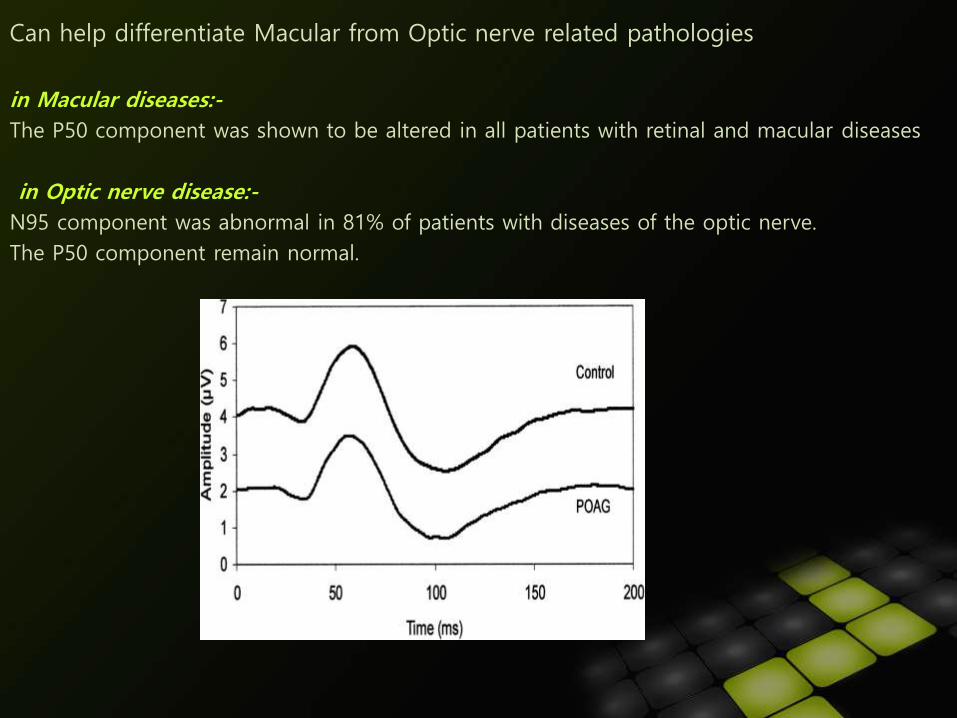
Can help differentiate Macular from Optic nerve related pathologies
in Macular diseases:-
The P50 component was shown to be altered in all patients with retinal and macular diseases
in Optic nerve disease:-
N95 component was abnormal in 81% of patients with diseases of the optic nerve.
The P50 component remain normal.
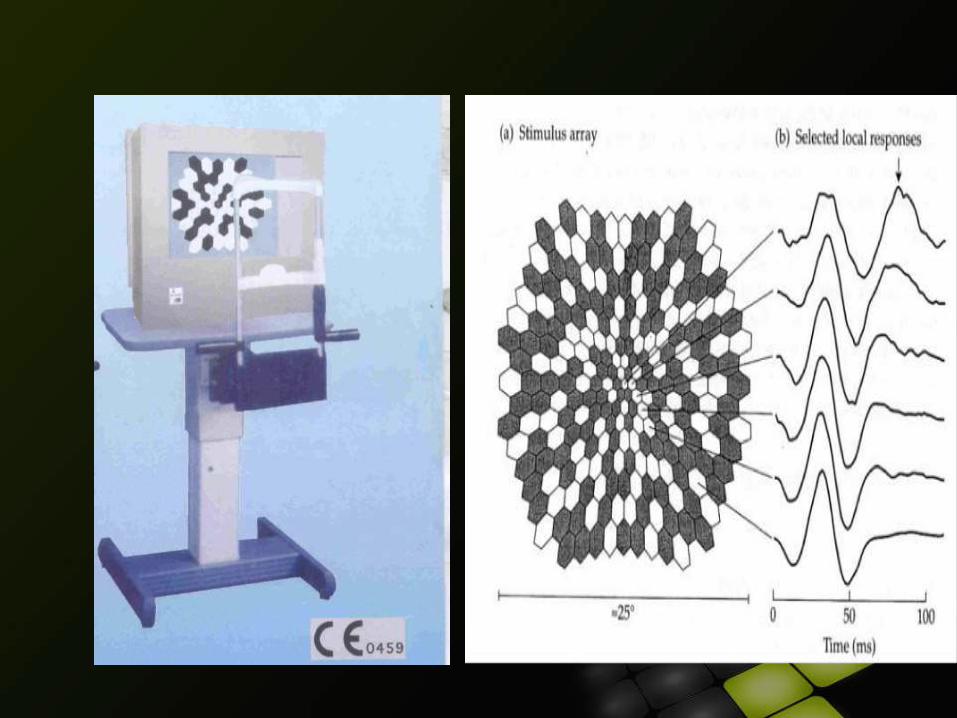
MFERG tests ERG activity in individual small retinal areas in central 30° area
Erich Sutter used binary m-sequences to extract hundreds of focalERGs from a single electrical signal.
Stimulation is provided by video display Sophisticated algorithms extract the response of each retinal area
from the overall recordingPhotopic test (cone function)Response amplitude related to cone density. Typically, stimulus areas are scaled to provide equal response.
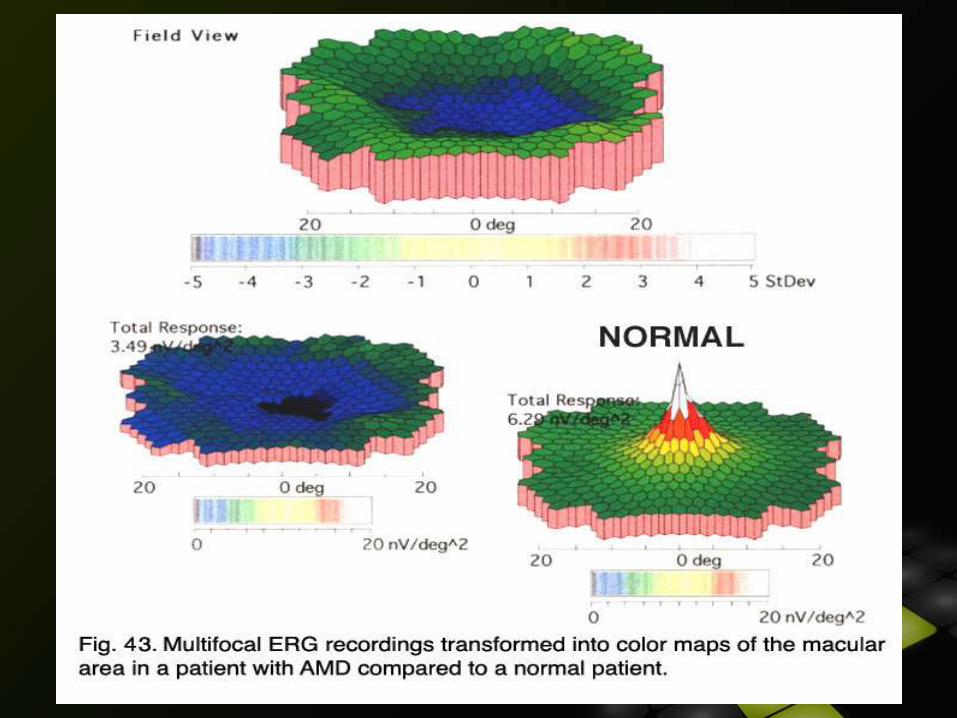
Multifocal ERG (MFERG): Mapping of Retinal Function
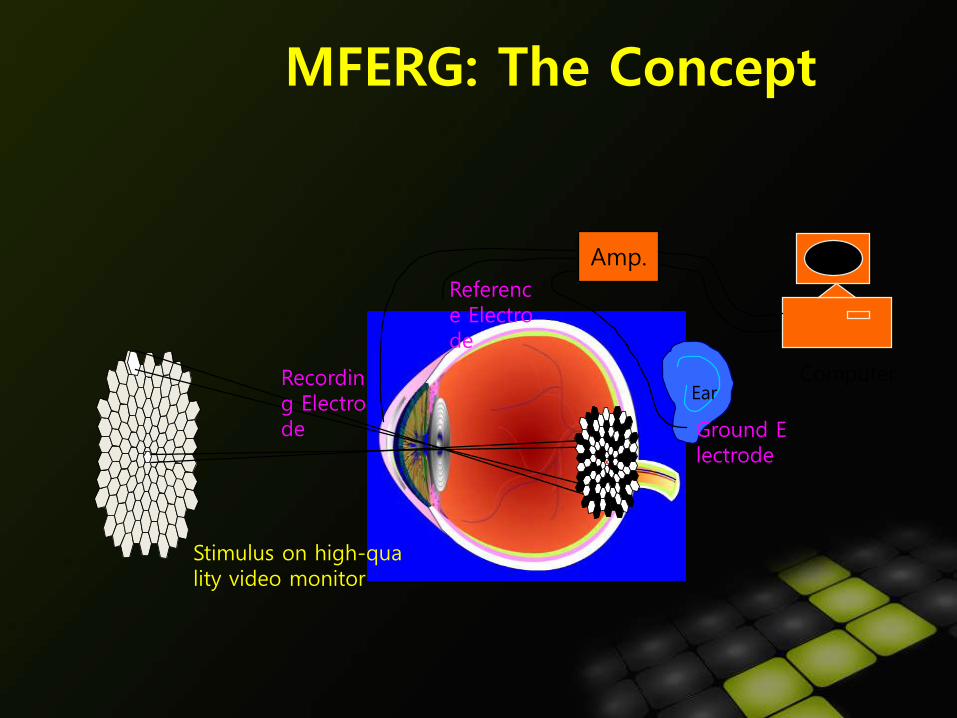
MFERG: The Concept
Recording Electrode
Amp.
Reference Electrode
ComputerEar
Ground Electrode
Stimulus on high-quality video monitor
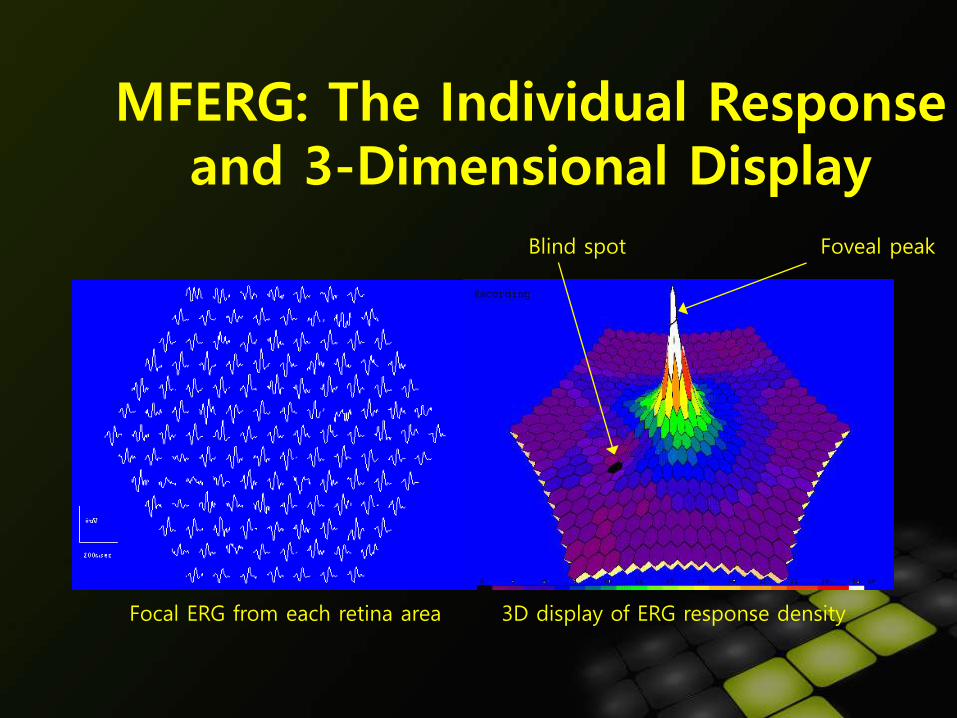
MFERG: The Individual Response and 3-Dimensional Display
Blind spot Foveal peak
3D display of ERG response densityFocal ERG from each retina area
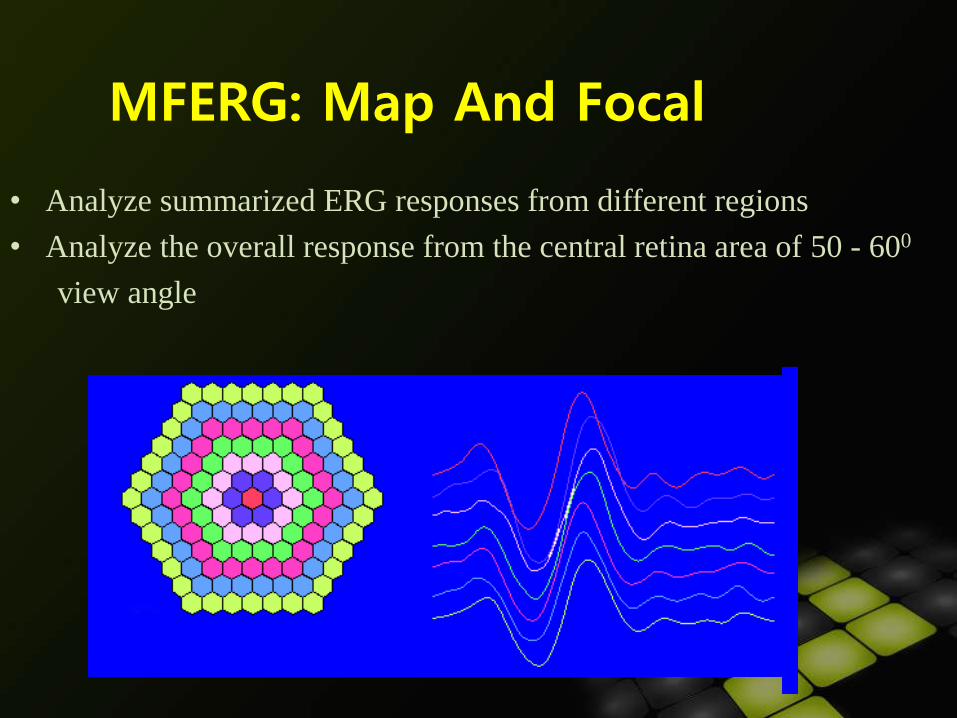
MFERG: Map And Focal
• Analyze summarized ERG responses from different regions
• Analyze the overall response from the central retina area of 50 - 600
view angle
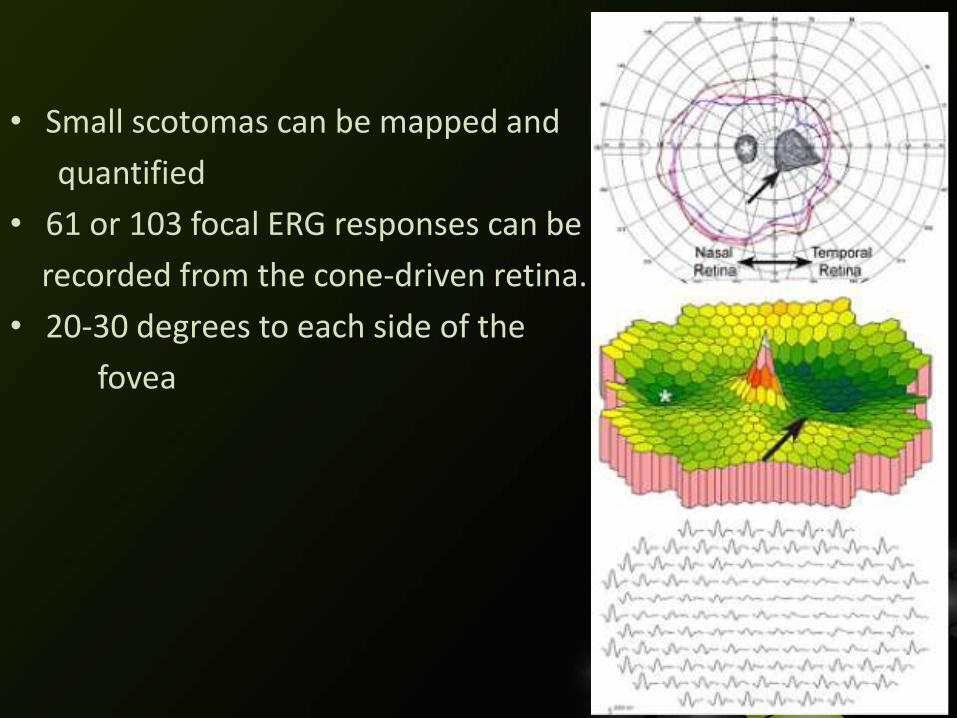
• Small scotomas can be mapped and
quantified
• 61 or 103 focal ERG responses can be
recorded from the cone-driven retina.
• 20-30 degrees to each side of the
fovea
Dilate patient’s pupil with a mydratic No dark adaptation is necessary. Refractive correction is recommended but not required. Recording using Burian-Allen or DTL electrode on the eye,
a reference electrode (only for DTL)a ground electrode
The test is composed of several segments, 10 - 30 seconds each Total recording time is 5 - 10 minutes per eye It is critical that patient is staring at the fixation during recording; the eye
can be monitored using a fixation camera Eye or body movement will distort the recording, and the segments shou
ld be repeated if there is too much noise
MFERG: Recording Procedure
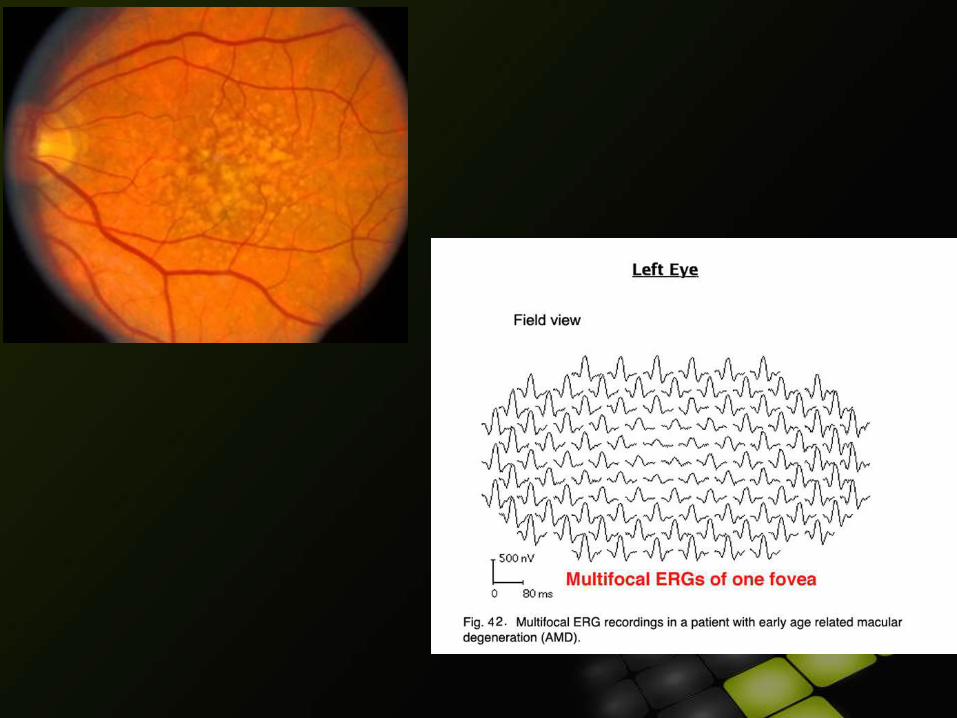
Diagnosing macular disease:ARMD, others
Retinal toxicity (Plaquenil and other drugs)
AZOOR (Acute Zonal Occult Outer Retinopathy)
Macula vs optic nerve in unexplained visual loss
Early diagnosis of retinal disease: Many retinal disorders affect small areas in early stages
Diabetic retinopathyRetinitis pigmentosa
MFERG: Applications
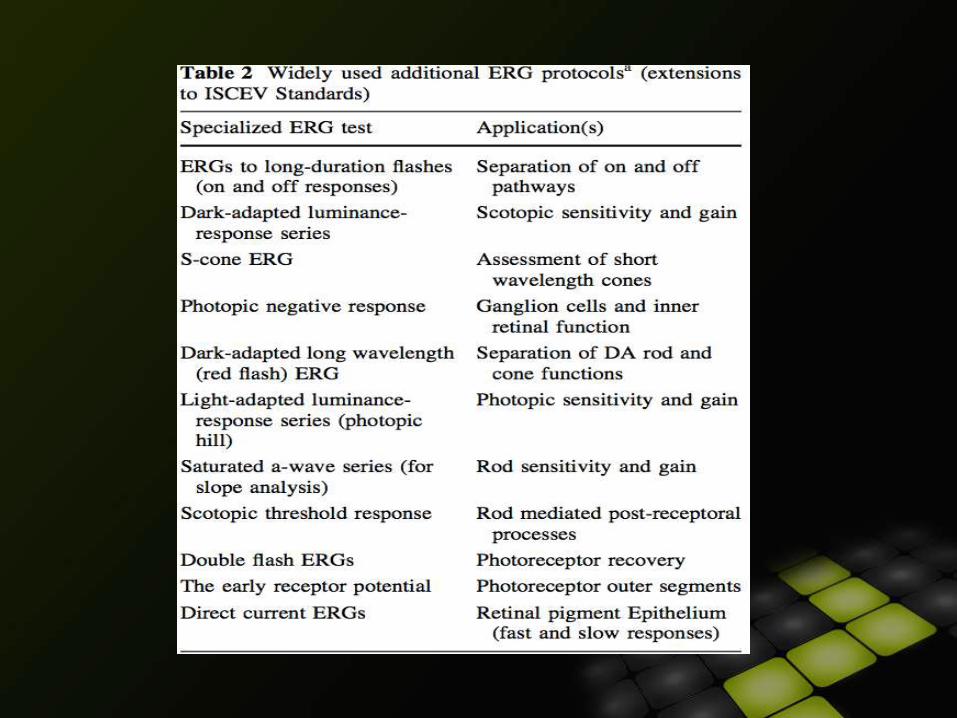
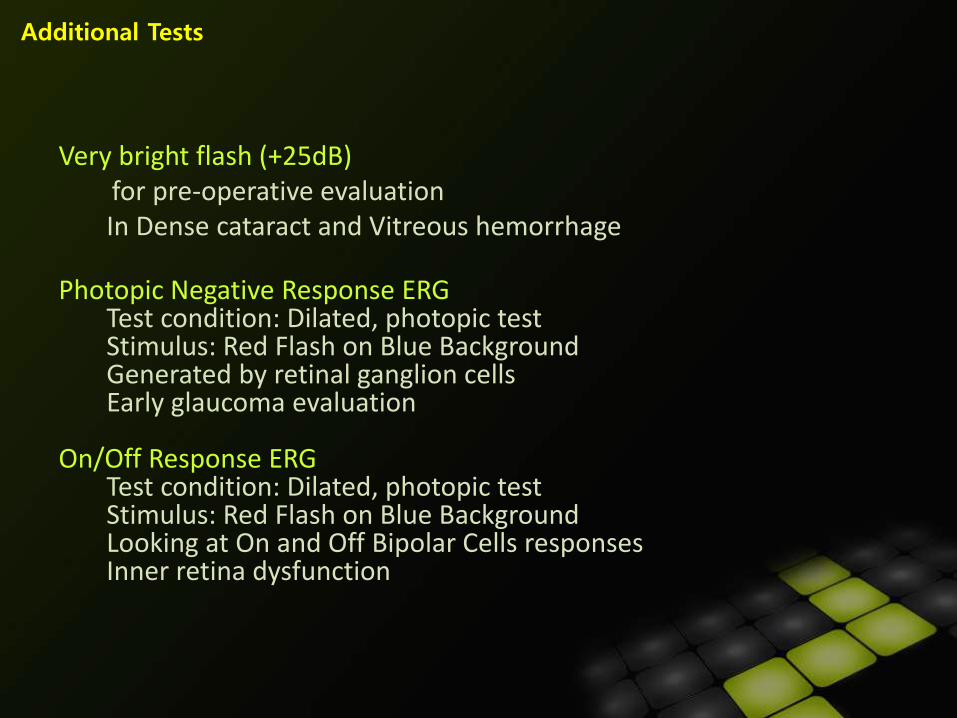
Additional Tests
Very bright flash (+25dB) for pre-operative evaluationIn Dense cataract and Vitreous hemorrhage
Photopic Negative Response ERGTest condition: Dilated, photopic testStimulus: Red Flash on Blue BackgroundGenerated by retinal ganglion cellsEarly glaucoma evaluation
On/Off Response ERGTest condition: Dilated, photopic testStimulus: Red Flash on Blue BackgroundLooking at On and Off Bipolar Cells responsesInner retina dysfunction
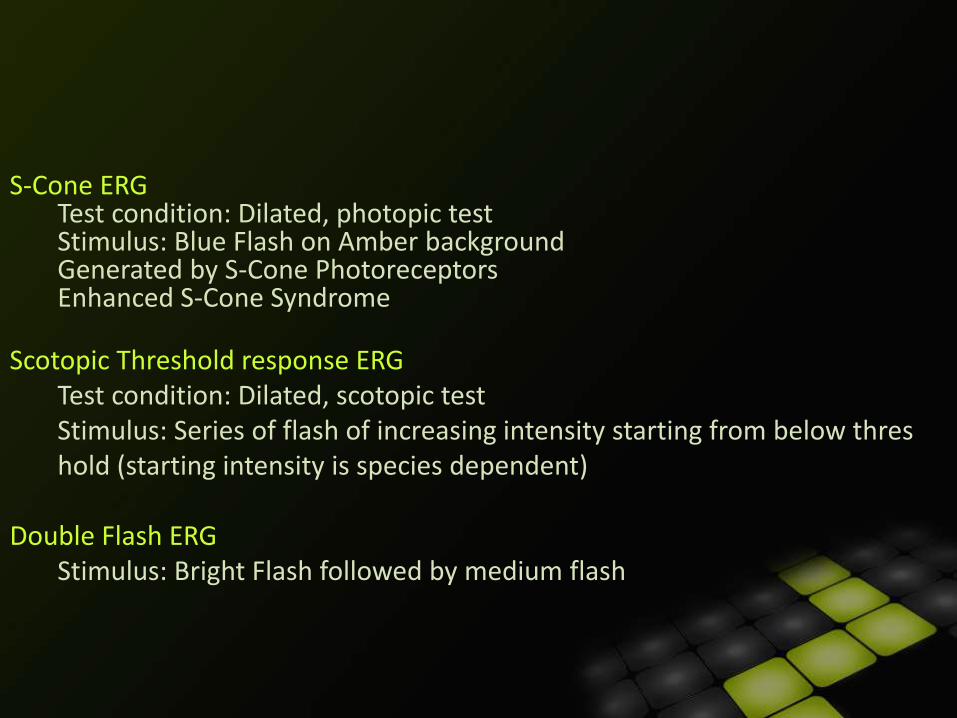
S-Cone ERGTest condition: Dilated, photopic testStimulus: Blue Flash on Amber backgroundGenerated by S-Cone PhotoreceptorsEnhanced S-Cone Syndrome
Scotopic Threshold response ERGTest condition: Dilated, scotopic testStimulus: Series of flash of increasing intensity starting from below threshold (starting intensity is species dependent)
Double Flash ERGStimulus: Bright Flash followed by medium flash
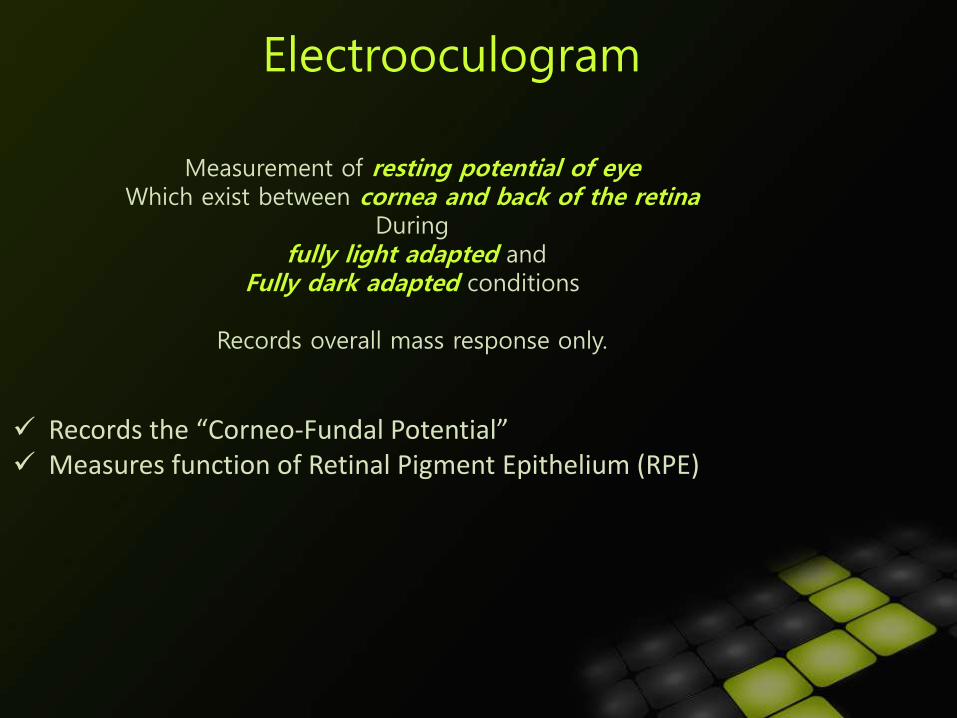
Electrooculogram
Measurement of resting potential of eyeWhich exist between cornea and back of the retina
Duringfully light adapted and
Fully dark adapted conditions
Records overall mass response only.
Records the “Corneo-Fundal Potential” Measures function of Retinal Pigment Epithelium (RPE)
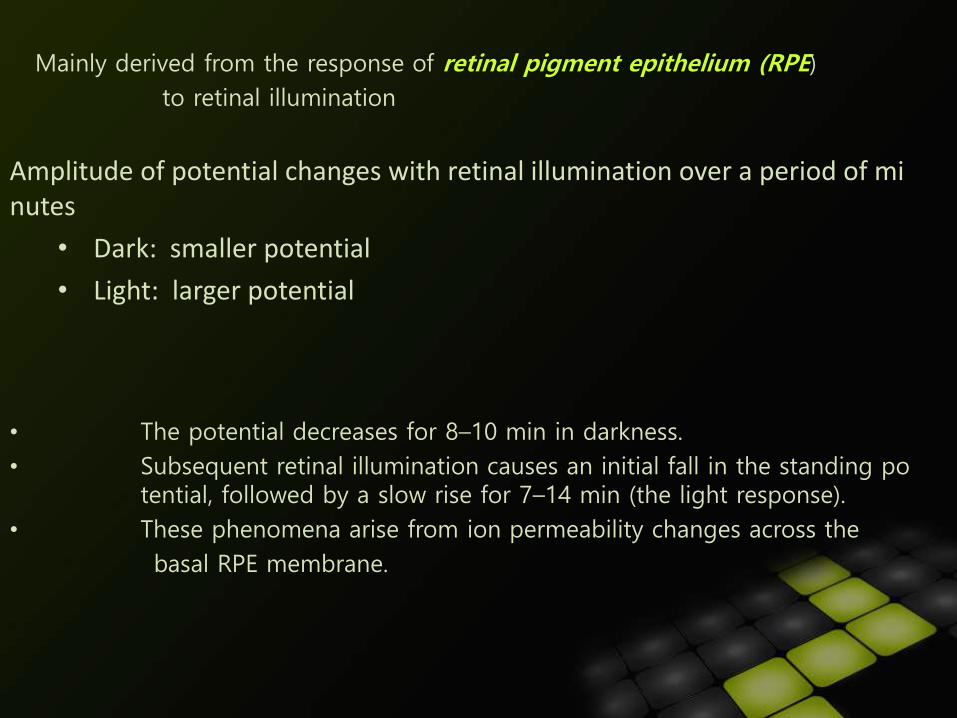
Mainly derived from the response of retinal pigment epithelium (RPE)
to retinal illumination
Amplitude of potential changes with retinal illumination over a period of minutes
• Dark: smaller potential
• Light: larger potential
• The potential decreases for 8–10 min in darkness.
• Subsequent retinal illumination causes an initial fall in the standing potential, followed by a slow rise for 7–14 min (the light response).
• These phenomena arise from ion permeability changes across the
basal RPE membrane.
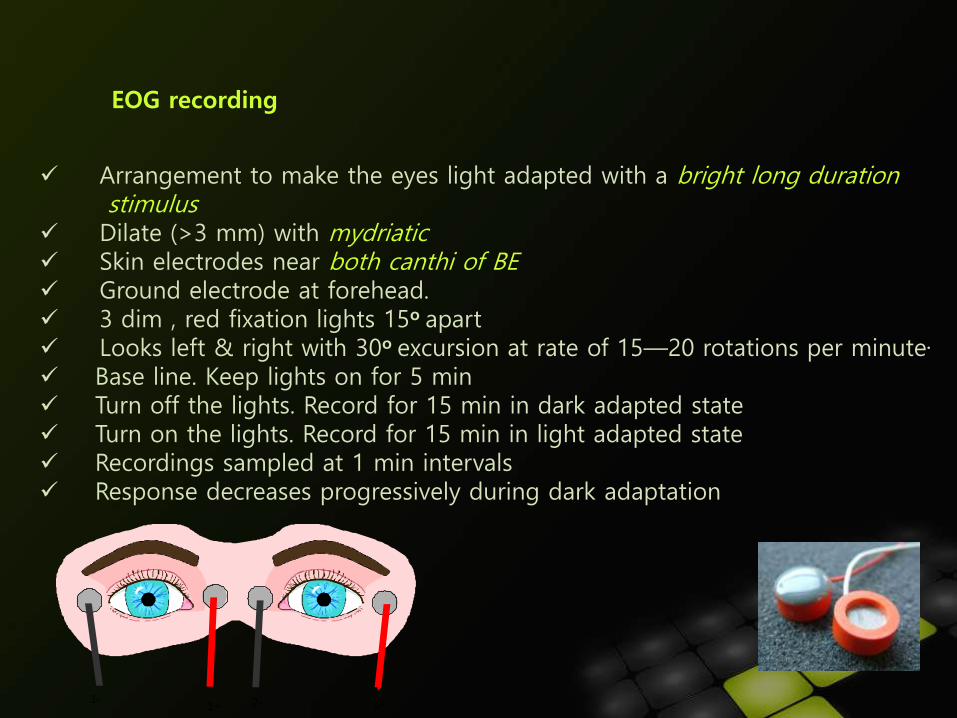
EOG recording
Arrangement to make the eyes light adapted with a bright long duration stimulus
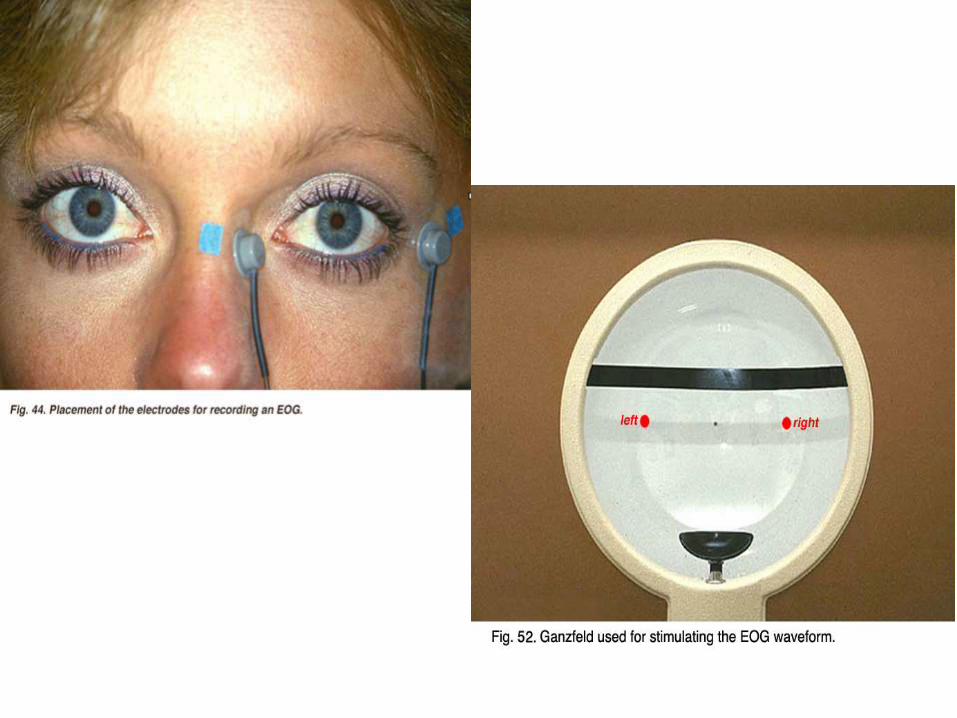
Dilate (>3 mm) with mydriatic Skin electrodes near both canthi of BE Ground electrode at forehead. 3 dim , red fixation lights 15o apart Looks left & right with 30o excursion at rate of 15—20 rotations per minute.
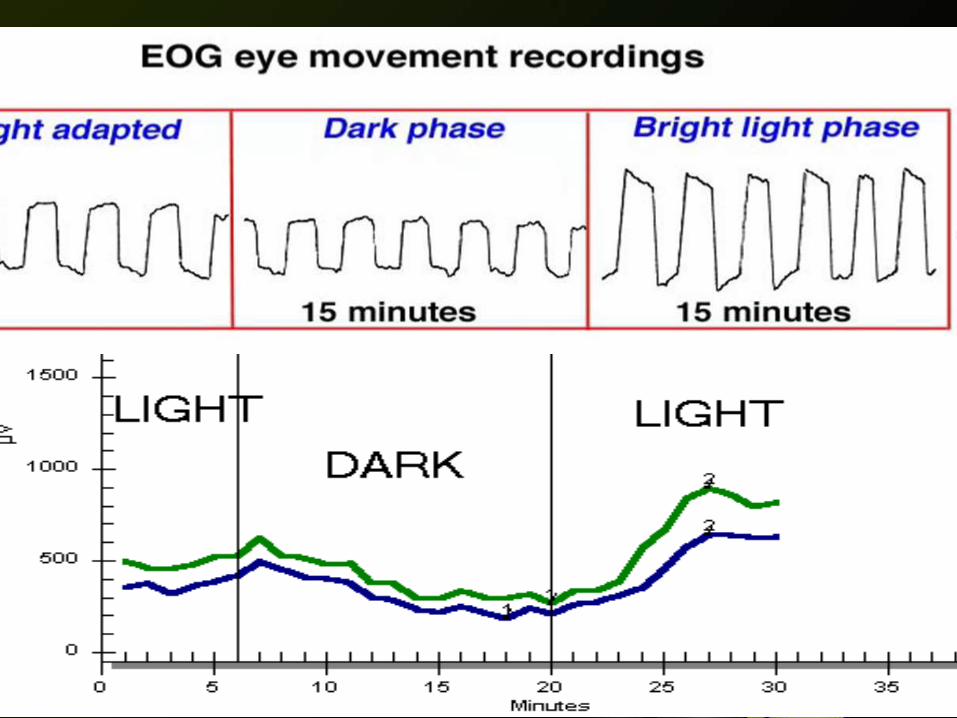
Base line. Keep lights on for 5 min Turn off the lights. Record for 15 min in dark adapted state Turn on the lights. Record for 15 min in light adapted state Recordings sampled at 1 min intervals Response decreases progressively during dark adaptation
1-1+ 2- 2+
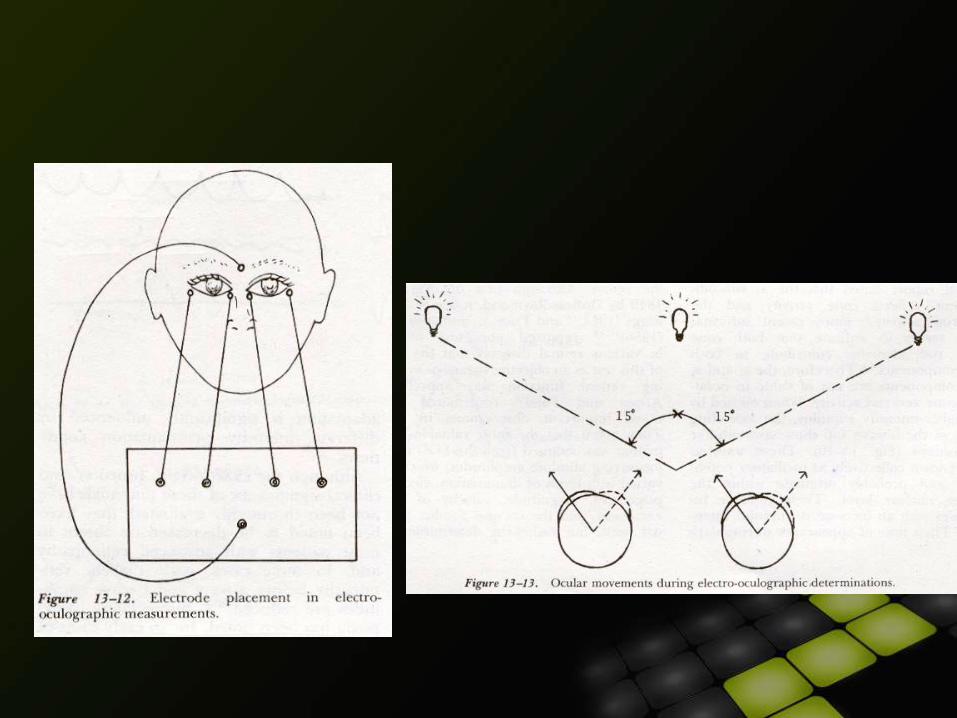
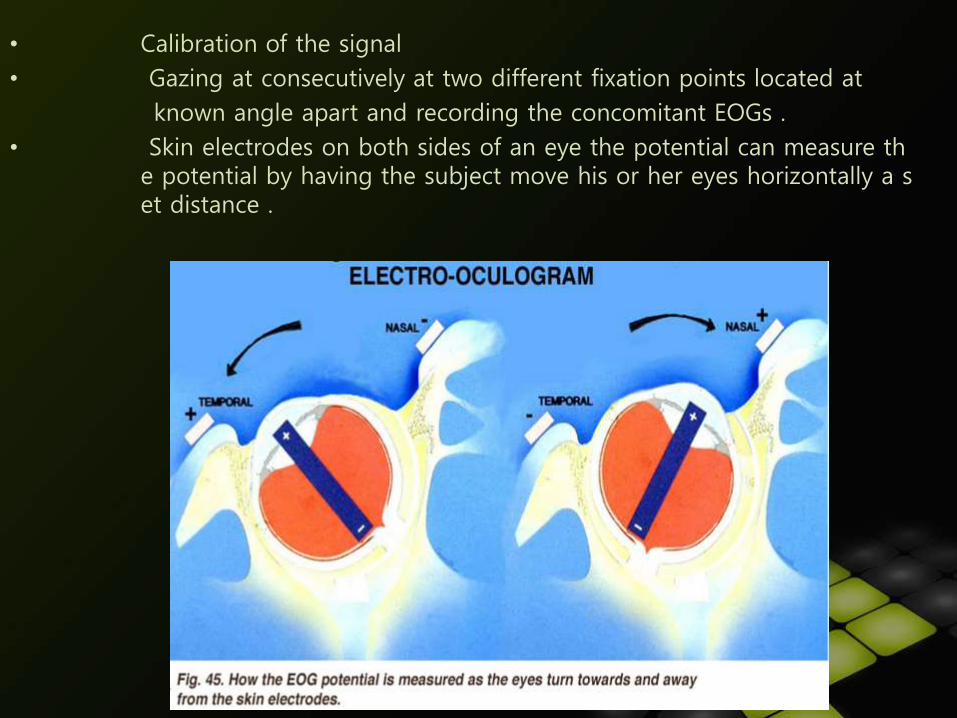
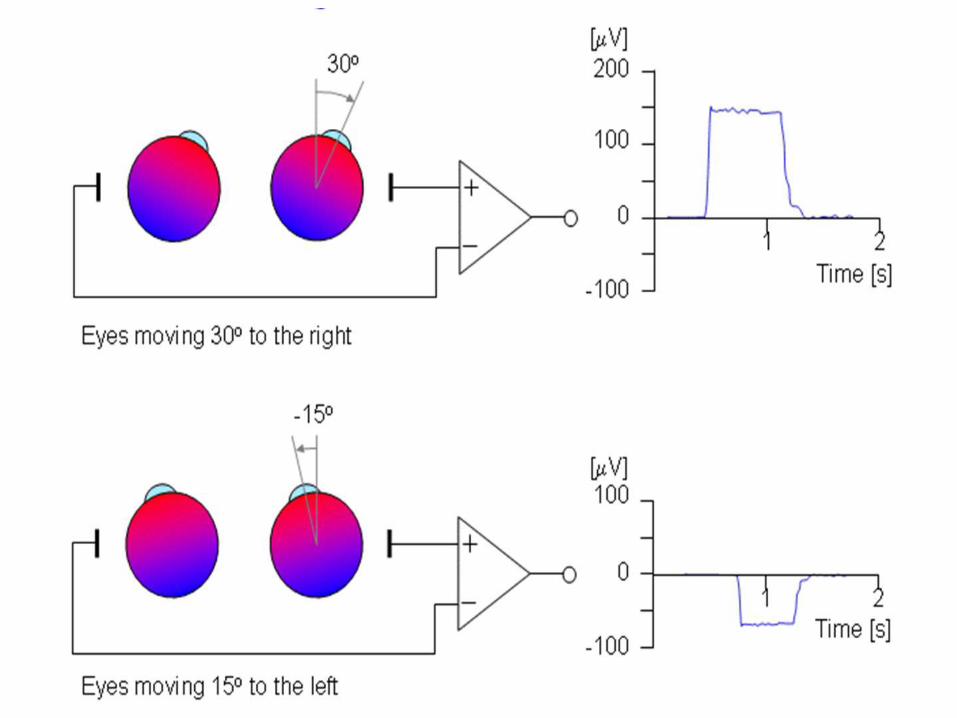
• Calibration of the signal
• Gazing at consecutively at two different fixation points located at
known angle apart and recording the concomitant EOGs .
• Skin electrodes on both sides of an eye the potential can measure the potential by having the subject move his or her eyes horizontally a set distance .
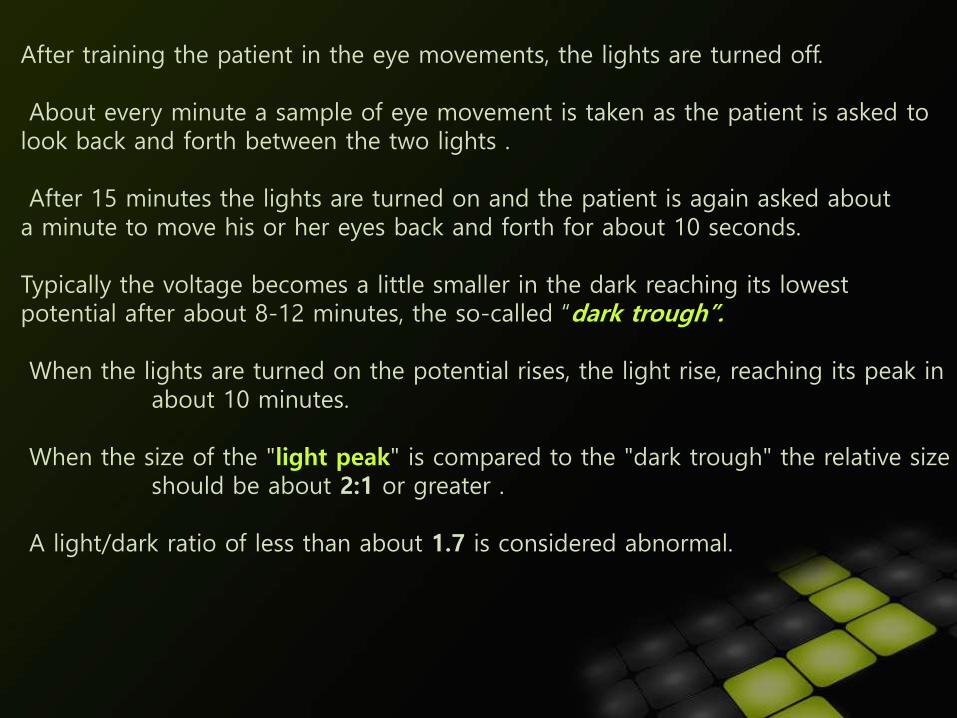
After training the patient in the eye movements, the lights are turned off.
About every minute a sample of eye movement is taken as the patient is asked to look back and forth between the two lights .
After 15 minutes the lights are turned on and the patient is again asked about a minute to move his or her eyes back and forth for about 10 seconds.
Typically the voltage becomes a little smaller in the dark reaching its lowest potential after about 8-12 minutes, the so-called “dark trough”.
When the lights are turned on the potential rises, the light rise, reaching its peak in about 10 minutes.
When the size of the "light peak" is compared to the "dark trough" the relative size should be about 2:1 or greater .
A light/dark ratio of less than about 1.7 is considered abnormal.
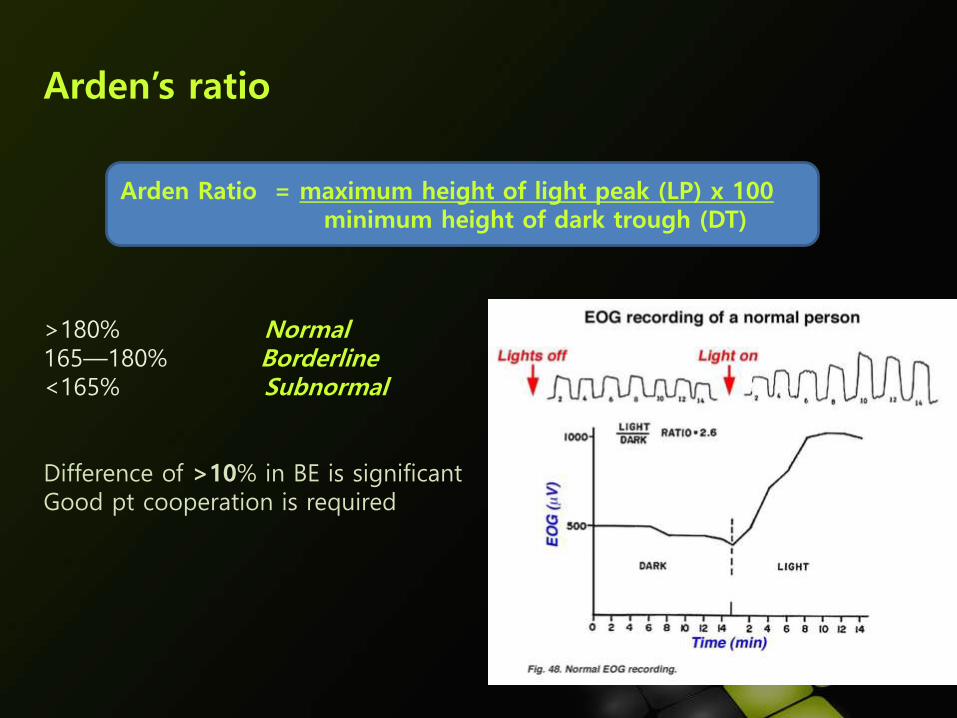
Arden’s ratio
>180% Normal165—180% Borderline<165% Subnormal
Difference of >10% in BE is significantGood pt cooperation is required
Arden Ratio = maximum height of light peak (LP) x 100minimum height of dark trough (DT)
2 components of EOGA)Light sensitive – [ Light peak ]
- Contributed by rods and cones
B) Light insensitive – [ Dark trough ]- Contributed by RPE , Photoreceptors ,inner nuclear layer
Three phases are typically recorded in EOG
The pre-adapt light phase is to standardize the standing potential, taking 1-5 min.
The dark-adapt phase is to “discharge” the standing potential, taking 10 - 20 min.
The light phase is to “recharge” the standing potential, taking 4 - 10 min.
The test takes about 30 - 40 min in total. Recording of both eyes are recommended to
save time

Indications1. Best’s Disease (Best’s Vitelliform Macular Dystrophy) markedly redu
ced with Arden ratio is less than 120%2. Butterfly pattern dystrophy3. Chloroquine toxicity4. Stargardt’s dystrophy5. Retinal pigmentary degenerations6. Chorioretinal dystrophies (e.g. choroideremia)
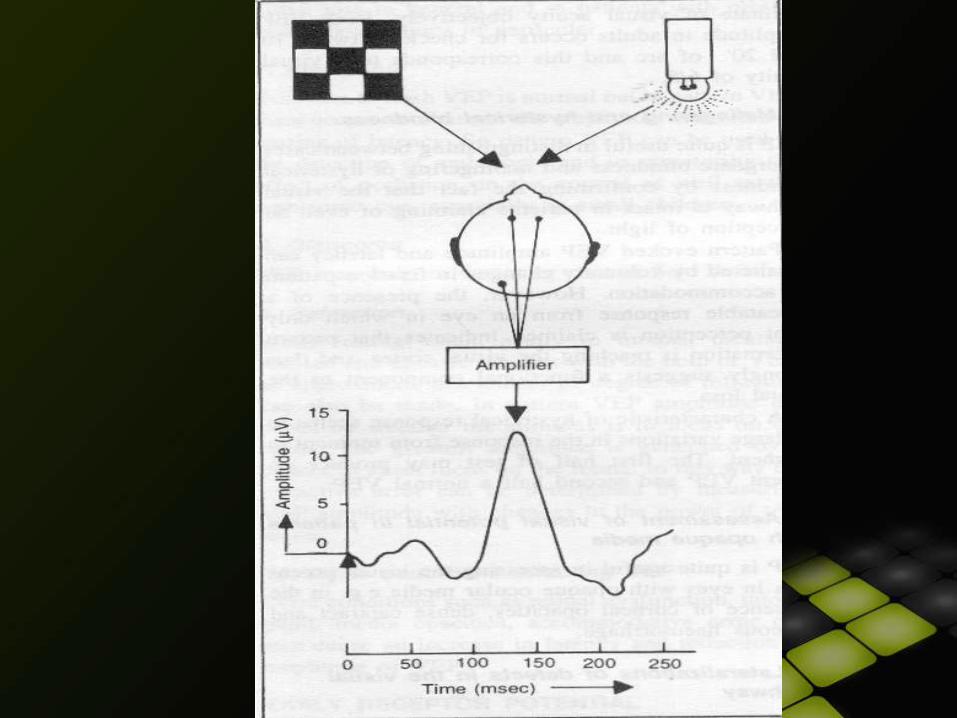
‘visually evoked response (VER)’ or ‘cortical potentials’.
It is the electrical response of the brain to sudden appearance / disappearance / change of visual stimulus.
Like EEG, VEP is detected by placing surface electrodes at scalp which can be placed anywhere, but should always include posterior occipital area.
VISUALLY EVOKED POTENTIALS (VEP)
1. Pattern VEP (checker-board patterns on TV monitor)
2. Flash VEP (diffuse flash light for uncooperative subjects)
TYPES OF VEP
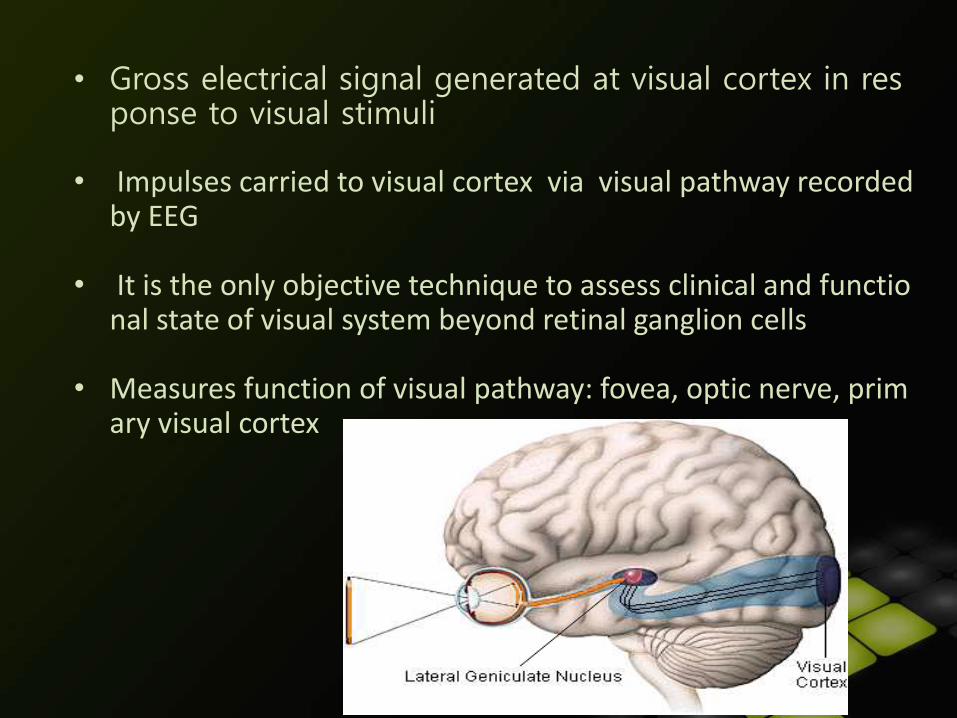
• Gross electrical signal generated at visual cortex in response to visual stimuli
• Impulses carried to visual cortex via visual pathway recorded by EEG
• It is the only objective technique to assess clinical and functional state of visual system beyond retinal ganglion cells
• Measures function of visual pathway: fovea, optic nerve, primary visual cortex
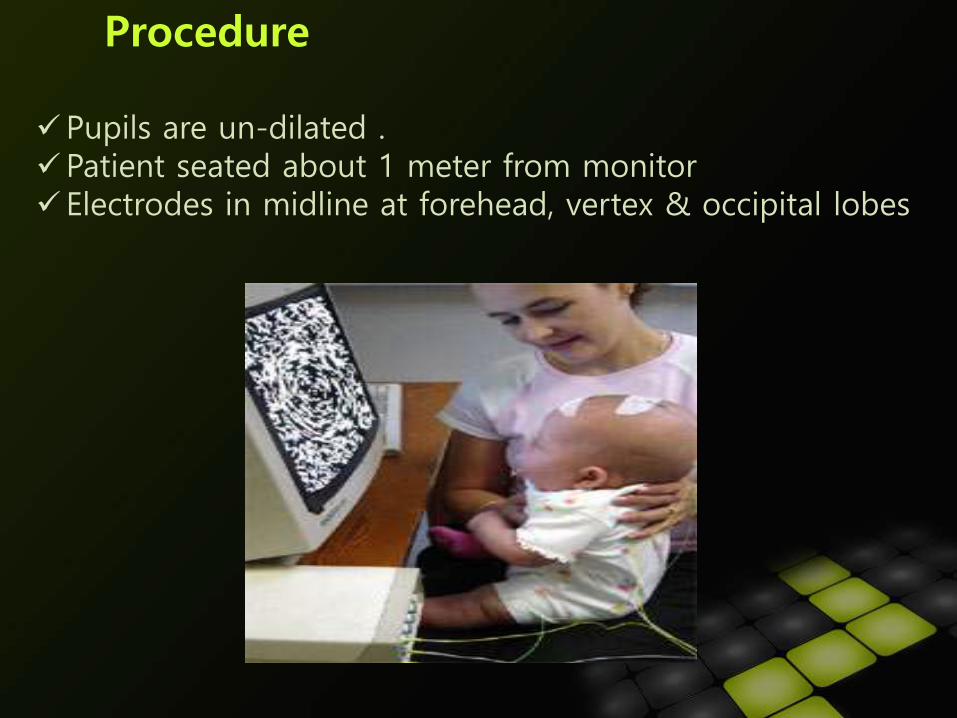
Pupils are un-dilated . Patient seated about 1 meter from monitor Electrodes in midline at forehead, vertex & occipital lobes
Procedure
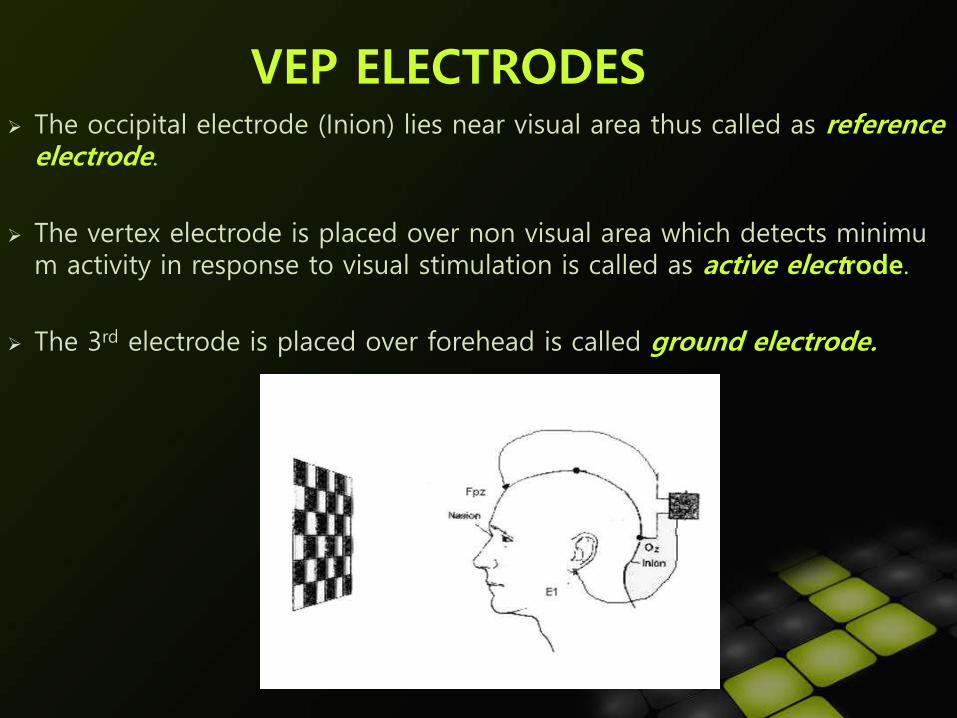
The occipital electrode (Inion) lies near visual area thus called as reference electrode.
The vertex electrode is placed over non visual area which detects minimum activity in response to visual stimulation is called as active electrode.
The 3rd electrode is placed over forehead is called ground electrode.
VEP ELECTRODES
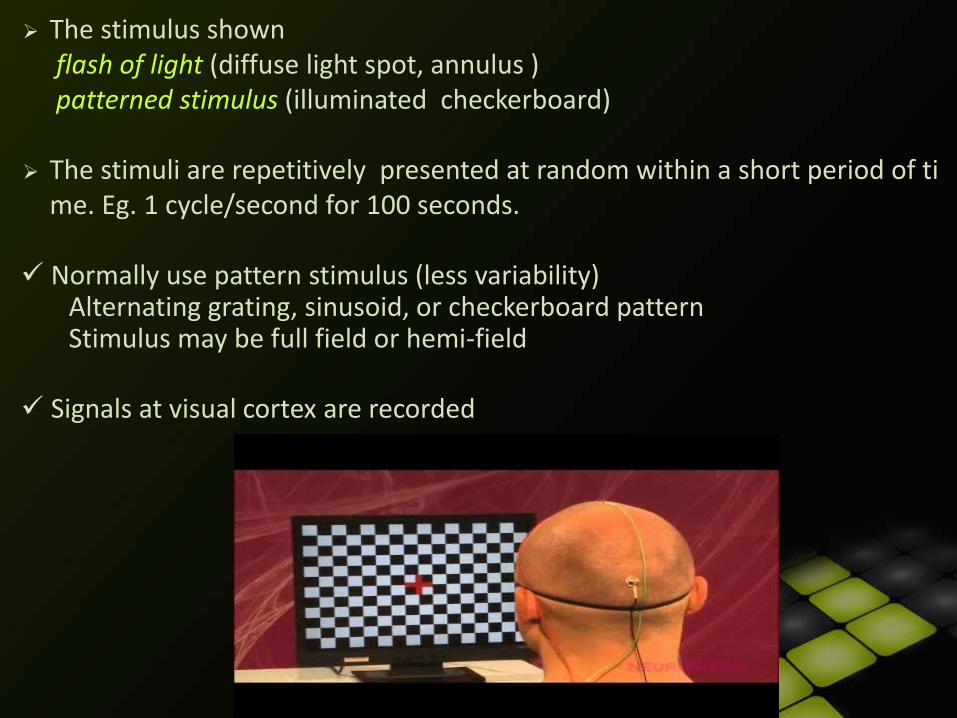
The stimulus shown flash of light (diffuse light spot, annulus ) patterned stimulus (illuminated checkerboard)
The stimuli are repetitively presented at random within a short period of time. Eg. 1 cycle/second for 100 seconds.
Normally use pattern stimulus (less variability)Alternating grating, sinusoid, or checkerboard patternStimulus may be full field or hemi-field
Signals at visual cortex are recorded
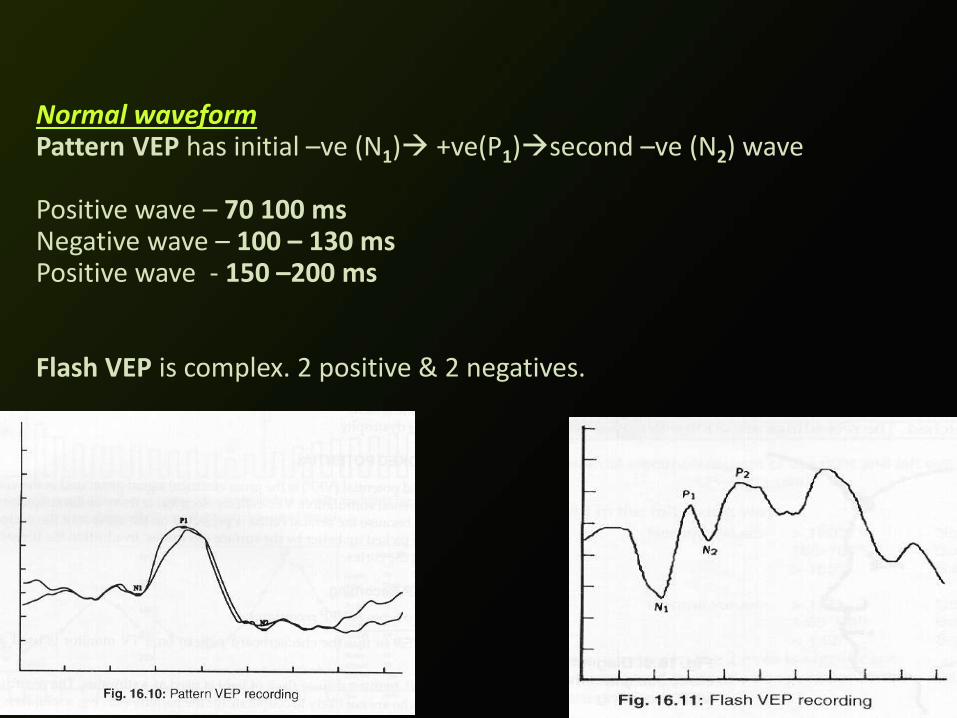
Normal waveformPattern VEP has initial –ve (N1) +ve(P1)second –ve (N2) wave
Positive wave – 70 100 msNegative wave – 100 – 130 msPositive wave - 150 –200 ms
Flash VEP is complex. 2 positive & 2 negatives.
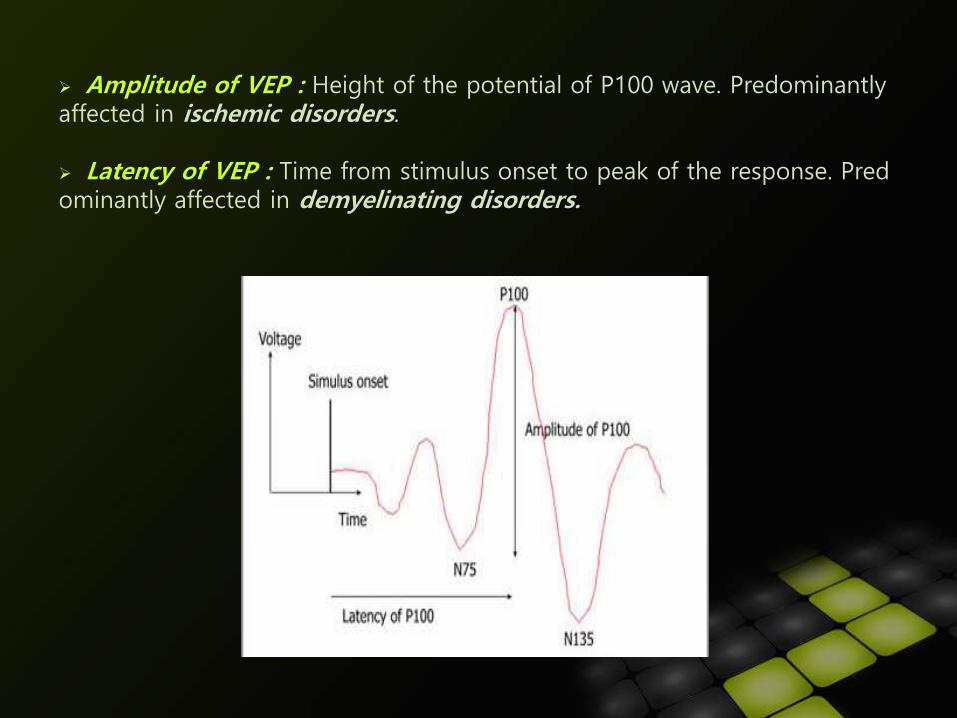
Amplitude of VEP : Height of the potential of P100 wave. Predominantly affected in ischemic disorders.
Latency of VEP : Time from stimulus onset to peak of the response. Predominantly affected in demyelinating disorders.
APPLICATIONS OF VEP
Recording visual acuity in nonverbal patients.
Macular function test.
Screening and early diagnosis of Multiple Sclerosis.
To identify optic nerve diseases, visual pathway abnormalities.
Amblyopia : latency relatively spared, so VEP can be used to monitor response to occlusion therapy.
Detection of a malingerer.
To detect color blindness : Using chromatic patterned light stimuli
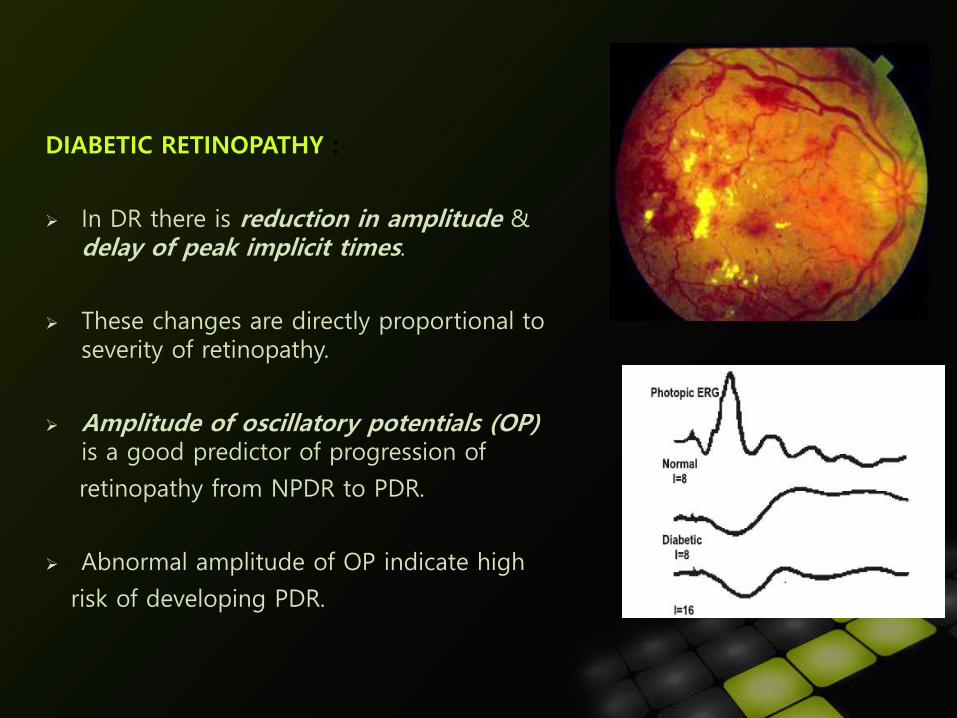
DIABETIC RETINOPATHY :
In DR there is reduction in amplitude & delay of peak implicit times.
These changes are directly proportional to severity of retinopathy.
Amplitude of oscillatory potentials (OP) is a good predictor of progression of
retinopathy from NPDR to PDR.
Abnormal amplitude of OP indicate high
risk of developing PDR.
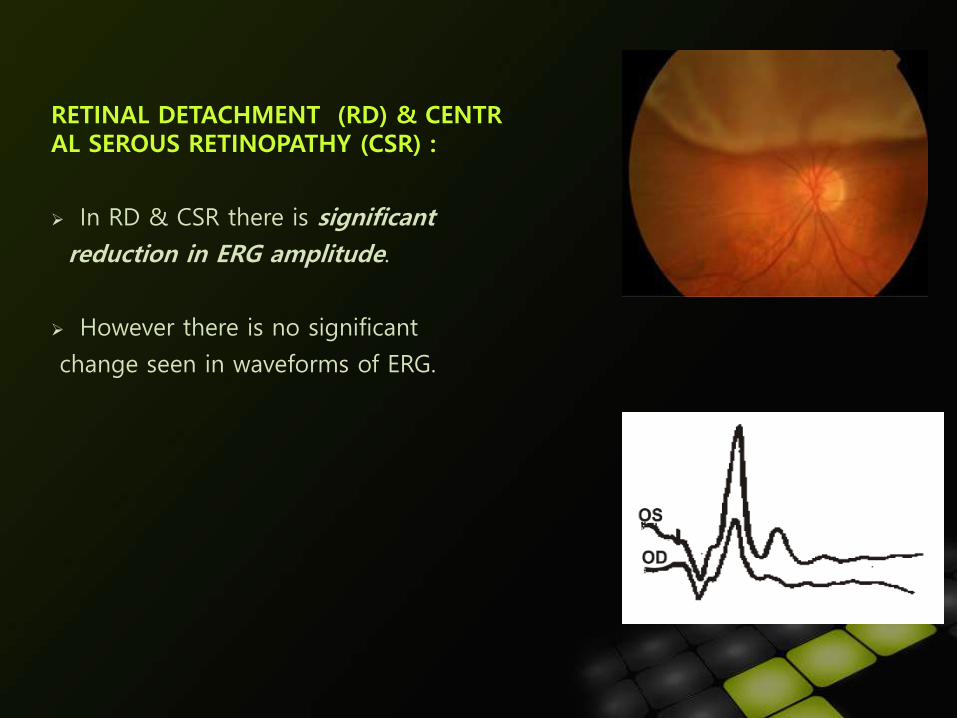
RETINAL DETACHMENT (RD) & CENTRAL SEROUS RETINOPATHY (CSR) :
In RD & CSR there is significant
reduction in ERG amplitude.
However there is no significant
change seen in waveforms of ERG.
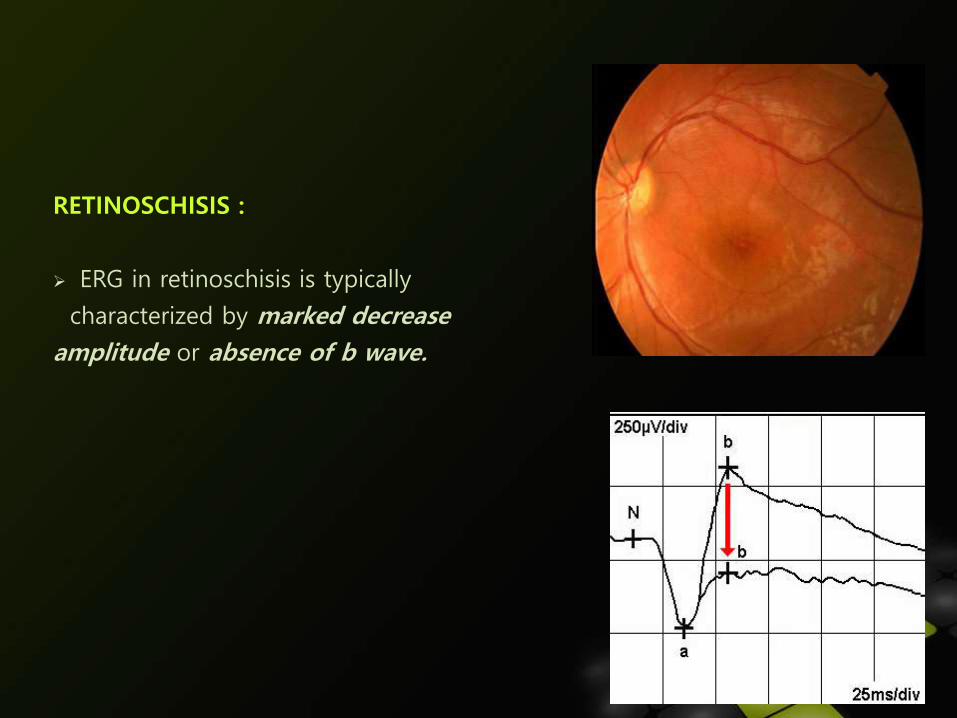
RETINOSCHISIS :
ERG in retinoschisis is typically
characterized by marked decrease
amplitude or absence of b wave.
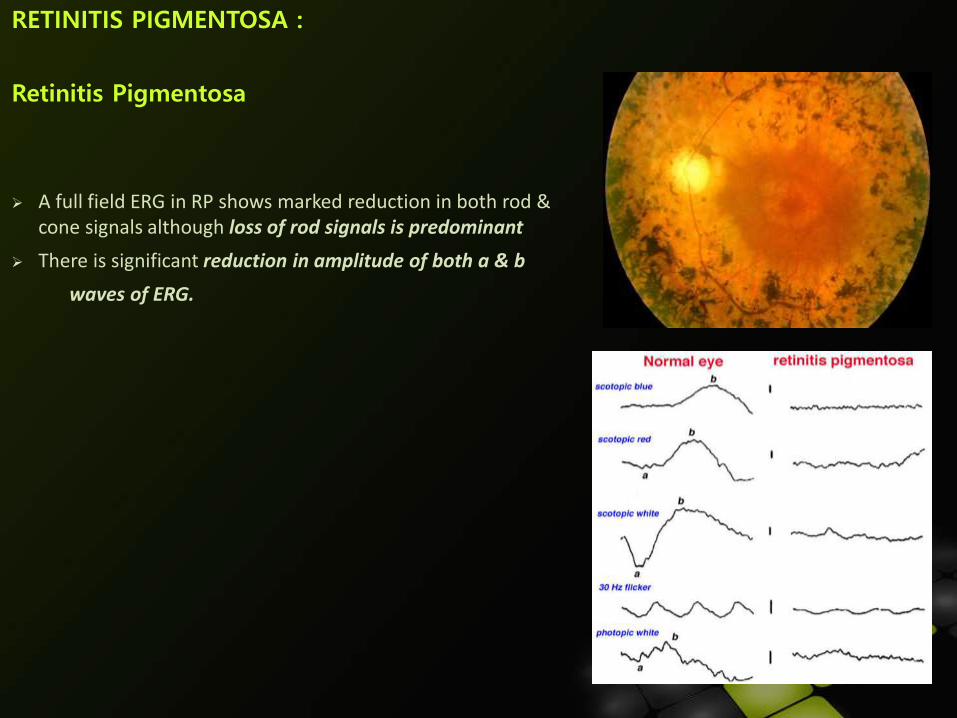
RETINITIS PIGMENTOSA :
Retinitis Pigmentosa
A full field ERG in RP shows marked reduction in both rod & cone signals although loss of rod signals is predominant
There is significant reduction in amplitude of both a & b
waves of ERG.
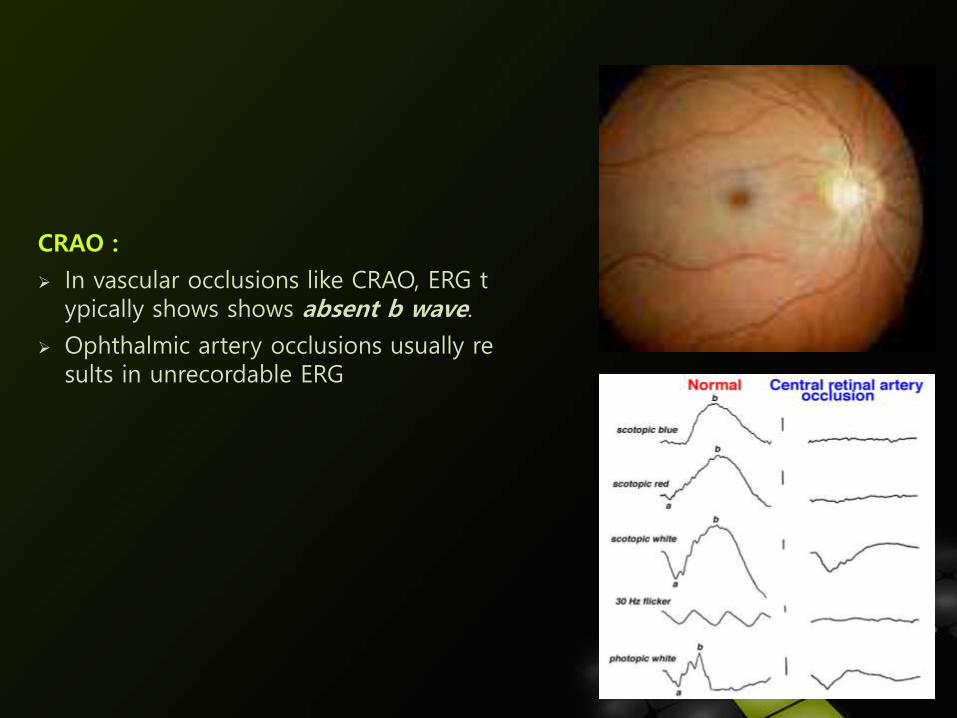
CRAO :
In vascular occlusions like CRAO, ERG typically shows shows absent b wave.
Ophthalmic artery occlusions usually results in unrecordable ERG
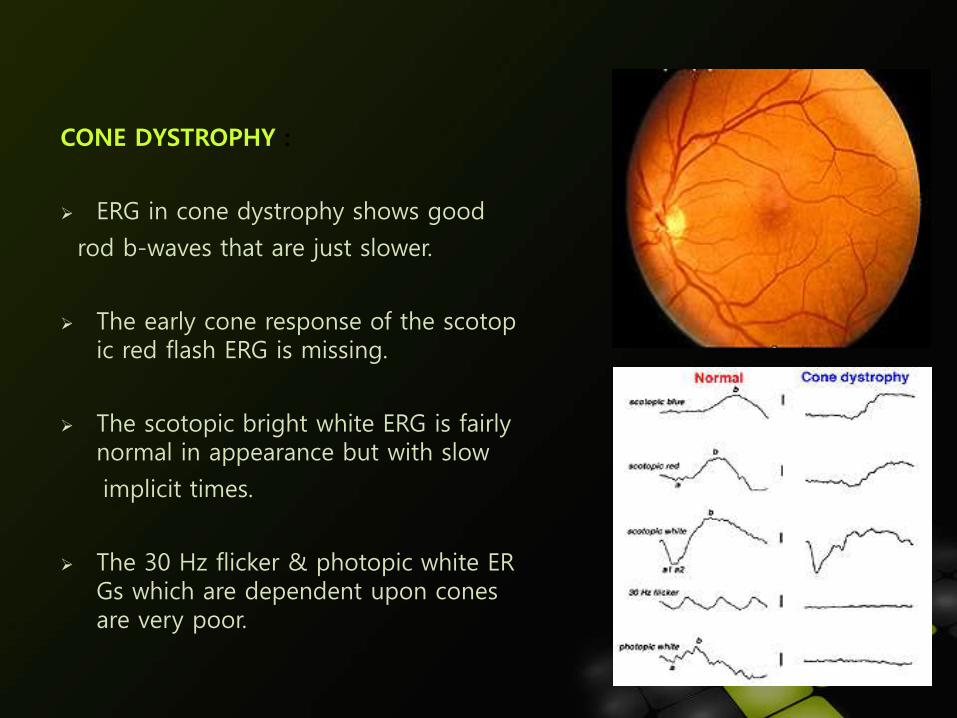
CONE DYSTROPHY :
ERG in cone dystrophy shows good
rod b-waves that are just slower.
The early cone response of the scotopic red flash ERG is missing.
The scotopic bright white ERG is fairly normal in appearance but with slow
implicit times.
The 30 Hz flicker & photopic white ERGs which are dependent upon cones are very poor.
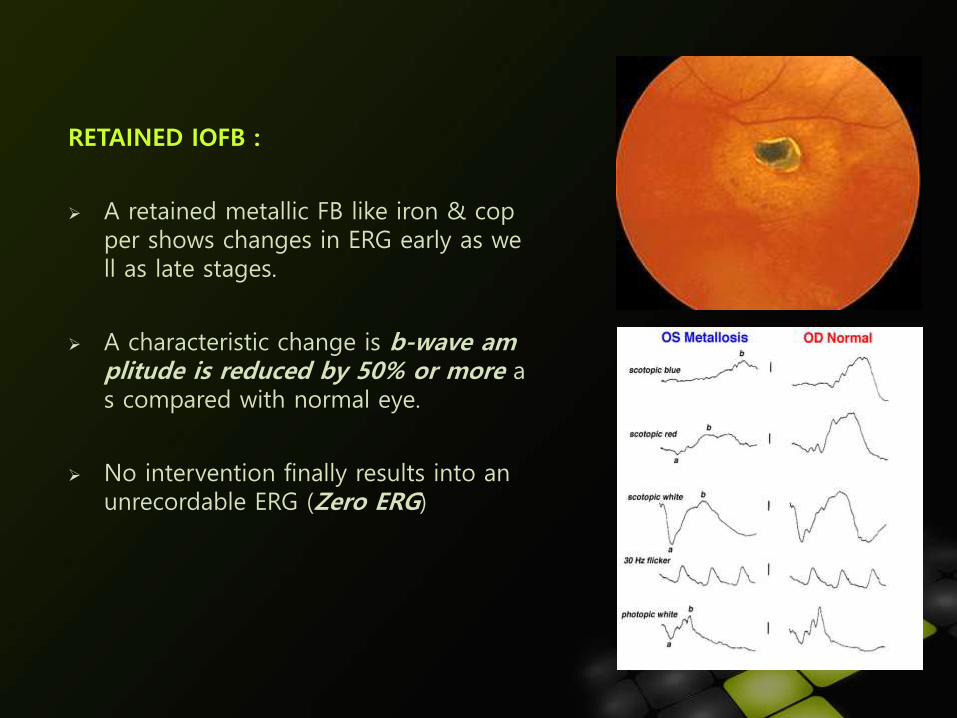
RETAINED IOFB :
A retained metallic FB like iron & copper shows changes in ERG early as well as late stages.
A characteristic change is b-wave amplitude is reduced by 50% or more as compared with normal eye.
No intervention finally results into an unrecordable ERG (Zero ERG)
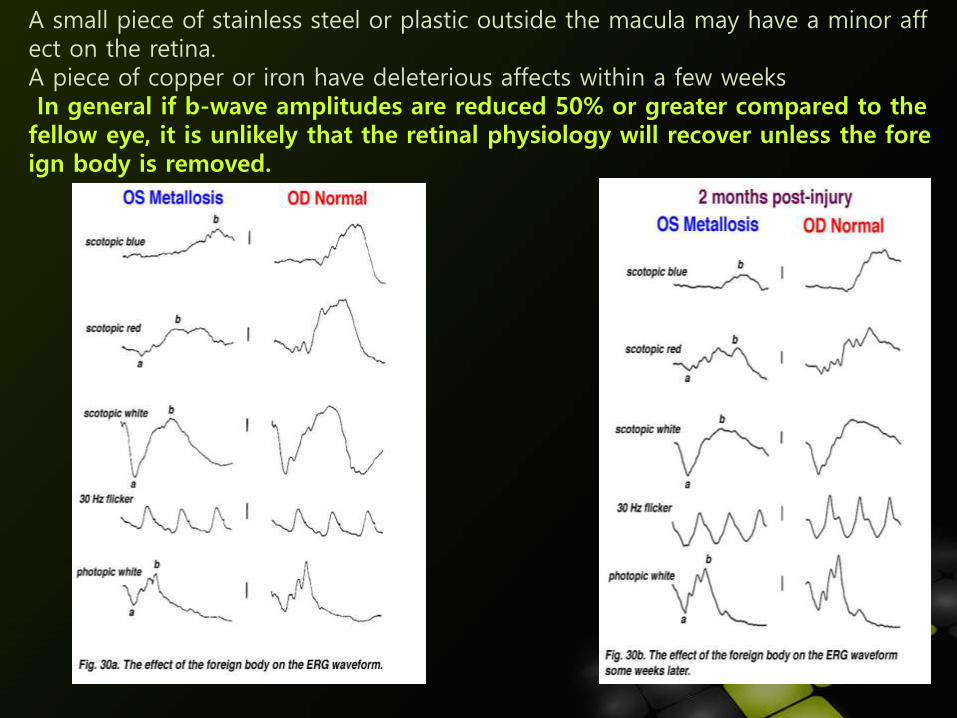
A small piece of stainless steel or plastic outside the macula may have a minor affect on the retina. A piece of copper or iron have deleterious affects within a few weeksIn general if b-wave amplitudes are reduced 50% or greater compared to the
fellow eye, it is unlikely that the retinal physiology will recover unless the foreign body is removed.
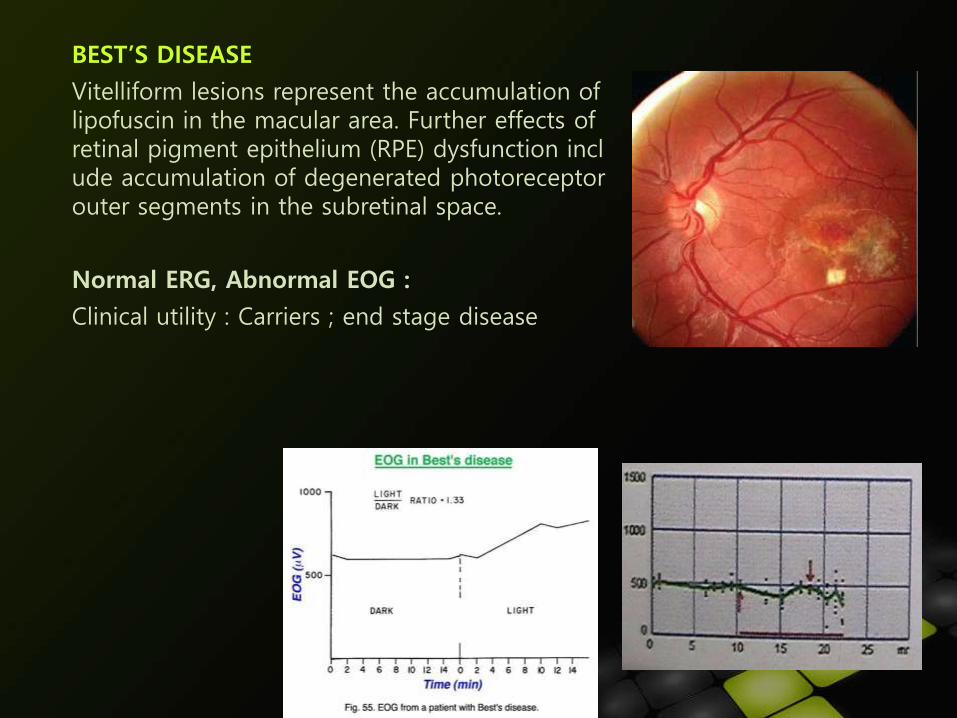
BEST’S DISEASE
Vitelliform lesions represent the accumulation of lipofuscin in the macular area. Further effects of retinal pigment epithelium (RPE) dysfunction include accumulation of degenerated photoreceptor outer segments in the subretinal space.
Normal ERG, Abnormal EOG :
Clinical utility : Carriers ; end stage disease
MULTIPLE SCLEROSIS :
Abnormalities in VEP are bilateral & seen 90 % of cases irrespective of visual symptoms.
In MS, increase in latency period is more predominant than decrease in P100 amplitude.
TOXIC & COMPRESSIVE OPTIC NEUROPATHY :
Following 2 changes are seen : Decreased amplitude of P100 wave.
Increase in latency period.
Decreased amplitude of P100 is more predominant than increased
latency period.
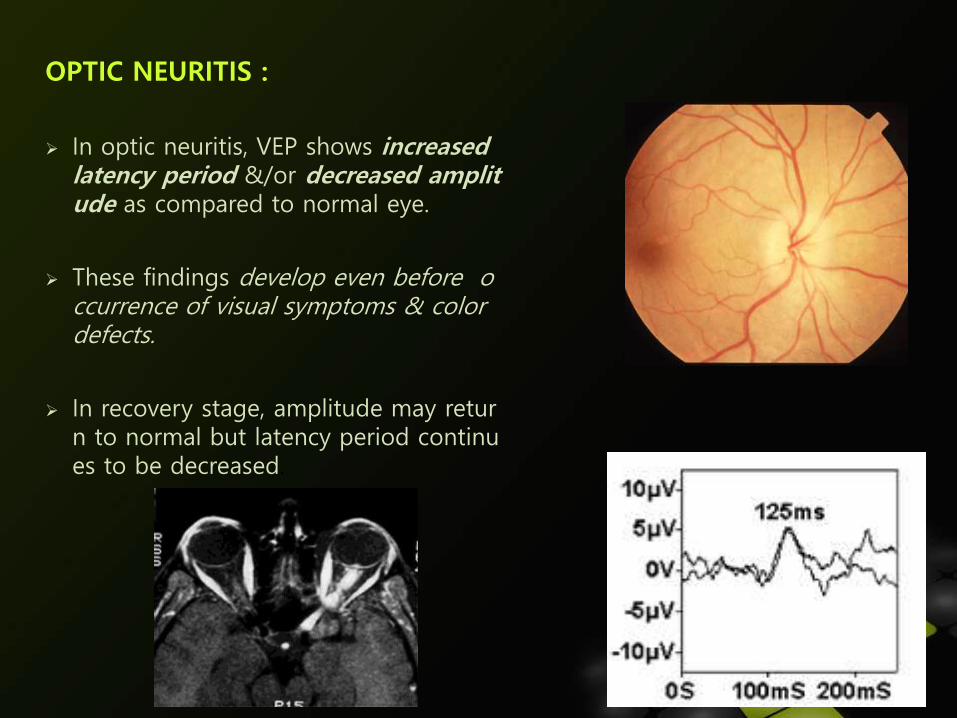
OPTIC NEURITIS :
In optic neuritis, VEP shows increased latency period &/or decreased amplitude as compared to normal eye.
These findings develop even before occurrence of visual symptoms & color defects.
In recovery stage, amplitude may return to normal but latency period continues to be decreased.
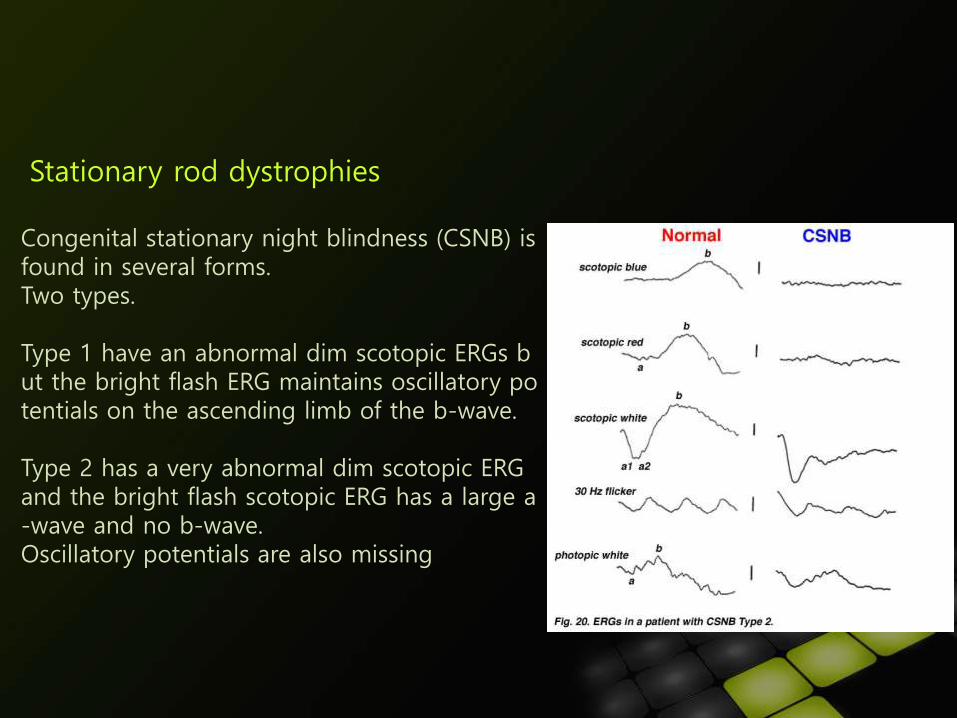
Stationary rod dystrophies
Congenital stationary night blindness (CSNB) is found in several forms.Two types.
Type 1 have an abnormal dim scotopic ERGs but the bright flash ERG maintains oscillatory potentials on the ascending limb of the b-wave.
Type 2 has a very abnormal dim scotopic ERG and the bright flash scotopic ERG has a large a-wave and no b-wave.Oscillatory potentials are also missing
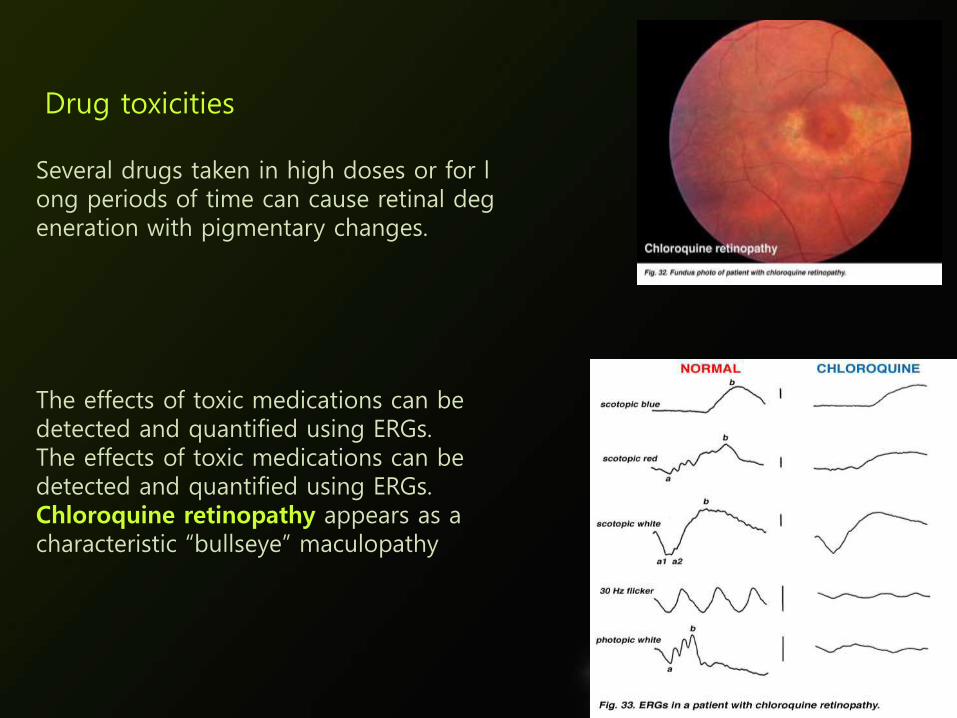
Drug toxicities
Several drugs taken in high doses or for long periods of time can cause retinal degeneration with pigmentary changes.
The effects of toxic medications can be detected and quantified using ERGs.The effects of toxic medications can be detected and quantified using ERGs.Chloroquine retinopathy appears as a characteristic “bullseye” maculopathy
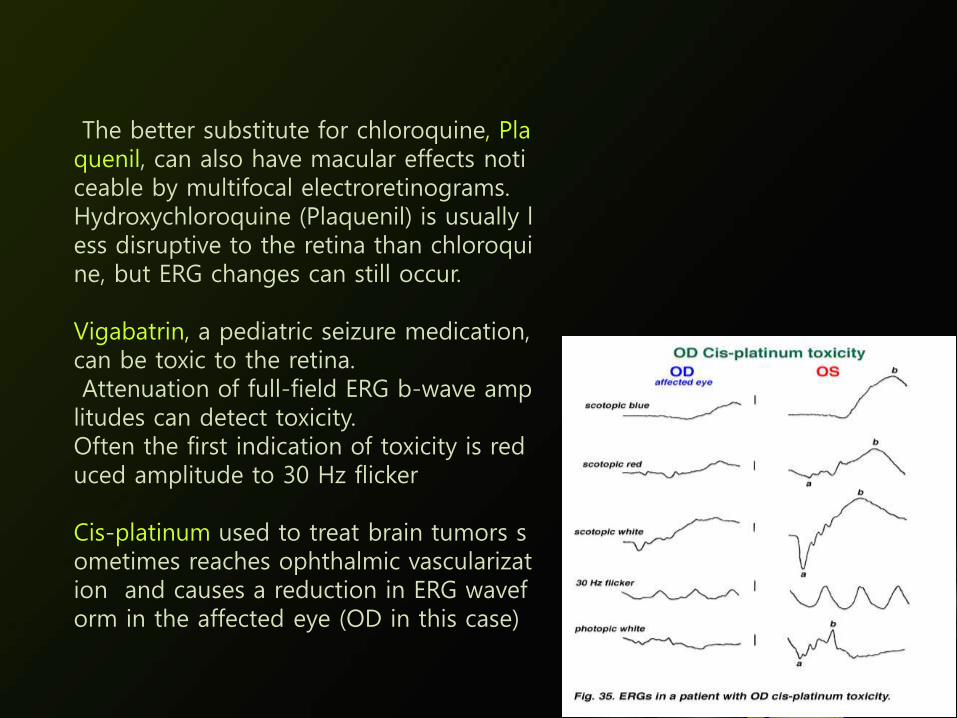
The better substitute for chloroquine, Plaquenil, can also have macular effects noticeable by multifocal electroretinograms.Hydroxychloroquine (Plaquenil) is usually less disruptive to the retina than chloroquine, but ERG changes can still occur.
Vigabatrin, a pediatric seizure medication, can be toxic to the retina.Attenuation of full-field ERG b-wave amp
litudes can detect toxicity. Often the first indication of toxicity is reduced amplitude to 30 Hz flicker
Cis-platinum used to treat brain tumors sometimes reaches ophthalmic vascularization and causes a reduction in ERG waveform in the affected eye (OD in this case)
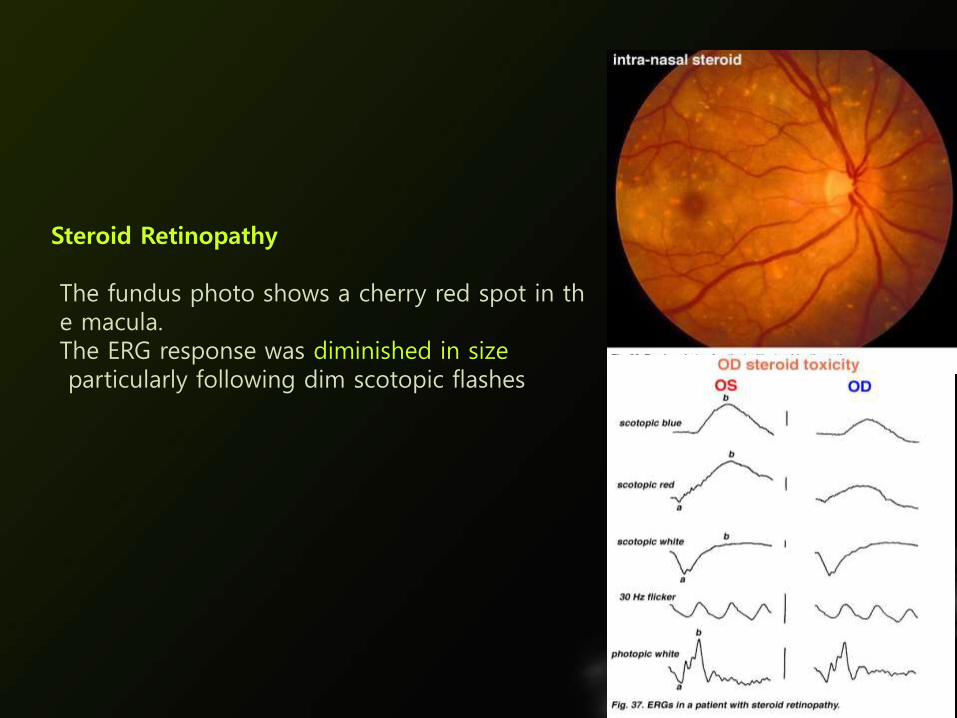
Steroid Retinopathy
The fundus photo shows a cherry red spot in the macula. The ERG response was diminished in sizeparticularly following dim scotopic flashes
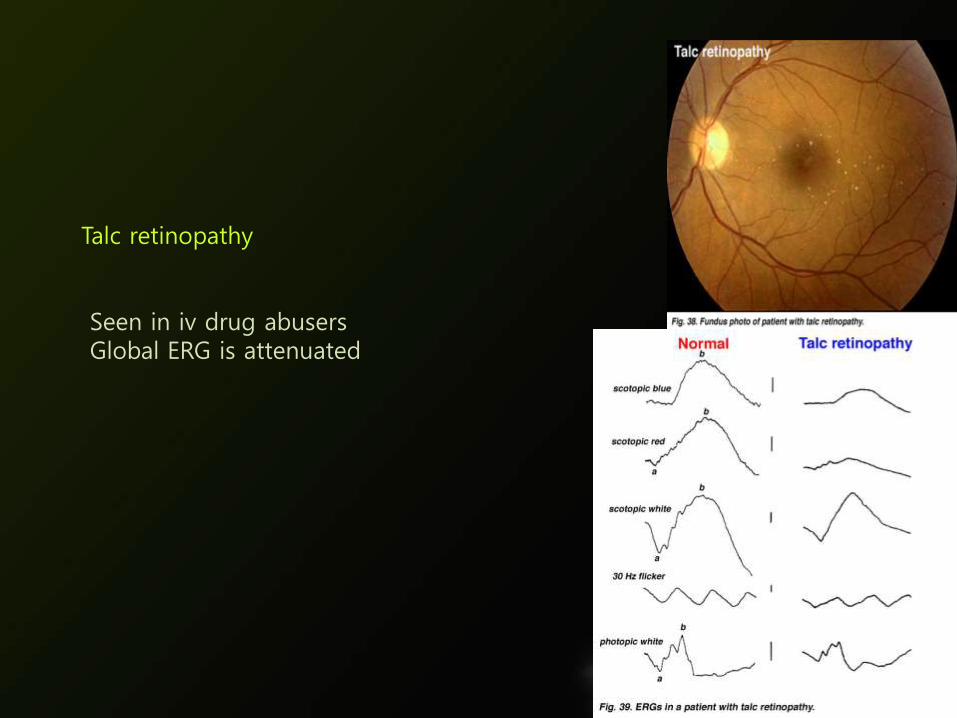
Talc retinopathy
Seen in iv drug abusersGlobal ERG is attenuated
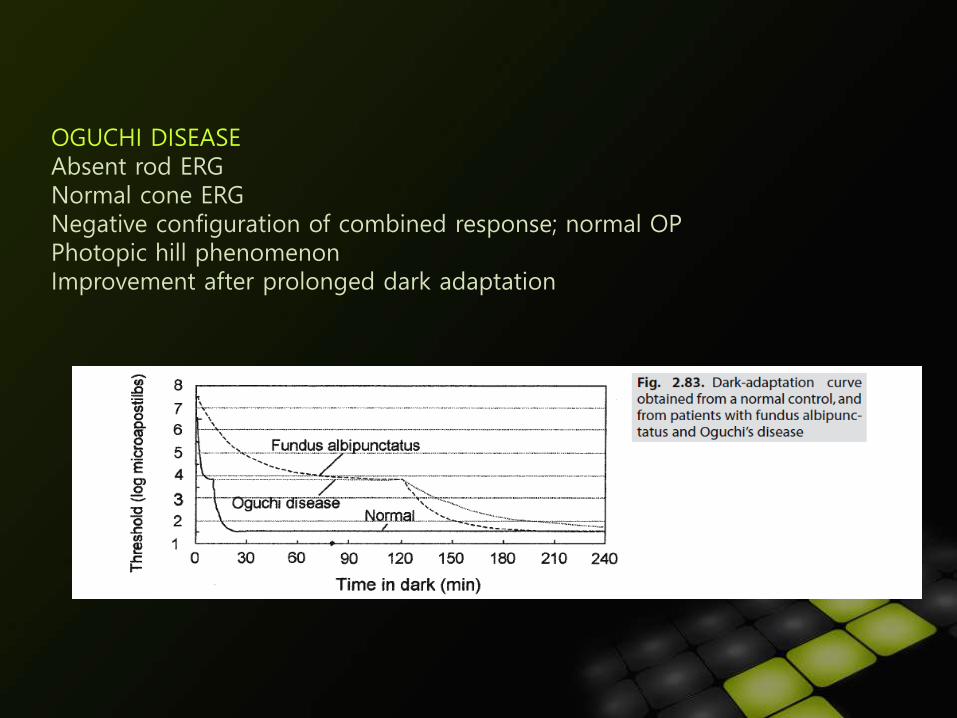
OGUCHI DISEASEAbsent rod ERGNormal cone ERGNegative configuration of combined response; normal OPPhotopic hill phenomenonImprovement after prolonged dark adaptation
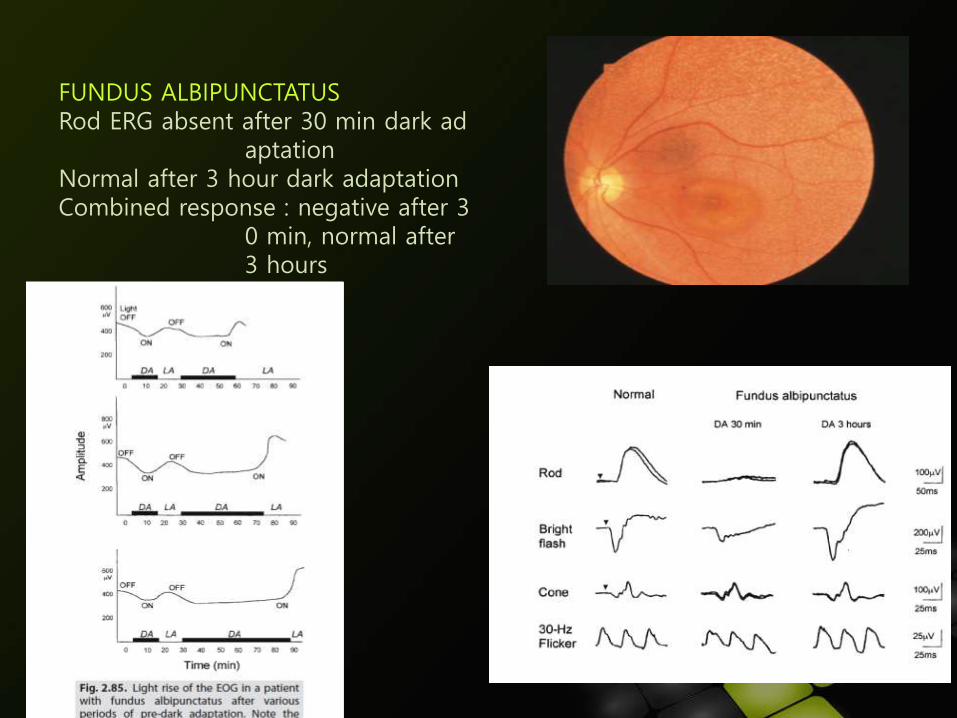
FUNDUS ALBIPUNCTATUSRod ERG absent after 30 min dark ad
aptation Normal after 3 hour dark adaptationCombined response : negative after 3
0 min, normal after 3 hours
REFERENCES1.The electroretinogram and the electro oculogram : Clinical applicationsBy Donnell J. Creel
2.Neuro- Ophthalmology Clinical signs and symptoms By Thomas J Walsh
3.Electrodiagnosis of Retinal Diseases By Y. Miyake
4.Diagnostic Procedures in Ophthalmology BY HV Nema
5.Anatomy and Physiology of the eye by A.K. khurana
6.Clinical Neurophthalmology by Ulrich Schiefer
7.Clinical Anatomy and Physiology of the visual system by Lee AnnRemington
THANK YOU
ALLPPT.com _ Free PowerPoint Templates, Diagrams and Charts