Non-auditory, electrophysiological potentials preceding ... electrophysiological potentials...
13
Vol.:(0123456789) 1 3 Journal of Comparative Physiology A (2018) 204:271–283 https://doi.org/10.1007/s00359-017-1234-0 ORIGINAL PAPER Non-auditory, electrophysiological potentials preceding dolphin biosonar click production James J. Finneran 1 · Jason Mulsow 2 · Ryan Jones 2 · Dorian S. Houser 2 · Alyssa W. Accomando 2 · Sam H. Ridgway 2 Received: 25 July 2017 / Revised: 16 November 2017 / Accepted: 20 November 2017 / Published online: 8 December 2017 © The Author(s) 2017. This article is an open access publication Abstract The auditory brainstem response to a dolphin’s own emitted biosonar click can be measured by averaging epochs of the instantaneous electroencephalogram (EEG) that are time-locked to the emitted click. In this study, averaged EEGs were measured using surface electrodes placed on the head in six different configurations while dolphins performed an echolocation task. Simultaneously, biosonar click emissions were measured using contact hydrophones on the melon and a hydrophone in the farfield. The averaged EEGs revealed an electrophysiological potential (the pre-auditory wave, PAW) that preceded the production of each biosonar click. The largest PAW amplitudes occurred with the non-inverting electrode just right of the midline—the apparent side of biosonar click generation—and posterior of the blowhole. Although the source of the PAW is unknown, the temporal and spatial properties rule out an auditory source. The PAW may be a neural or myogenic potential associated with click production; however, it is not known if muscles within the dolphin nasal system can be actuated at the high rates reported for dolphin click production, or if sufficiently coordinated and fast motor endplates of nasal muscles exist to produce a PAW detectable with surface electrodes. Keywords Dolphin · Biosonar · Sound production · Auditory brainstem response · Electromyography Introduction Dolphins and other odontocetes (toothed whales) possess biological sonar (biosonar) systems, whereby sound pulses (“clicks”) are emitted and returning echoes are analyzed to detect, localize, and identify underwater objects (e.g., dur- ing foraging). Dolphins produce the sound pulses required for echolocation by passing pressurized air past the “phonic lips” located within the nasal passages (Fig. 1, Ridgway et al. 1980, 2015; Amundin and Andersen 1983; Ridgway and Carder 1988; Cranford et al. 1996, 2011; Cranford 2000). Sound pulses produced at the phonic lips undergo complex interactions with the skull, air spaces, and other tissues in the head as they are coupled into the melon and emitted into the water in a forward-directed beam (Aroyan et al. 1992; Au et al. 2010; Finneran et al. 2014). Like most other odon- tocetes, dolphins possess two (left and right) pairs of phonic lips (Cranford 1992, 1999; Cranford et al. 2011); however, echolocation pulses appear to be typically generated using the right phonic lips, which are physically larger than those on the left (Mead 1975; Aroyan et al. 2000; Ridgway et al. 2009; Madsen et al. 2013). Despite considerable progress in identifying the general site and pneumatic nature of click production, the specific mechanisms underlying click pro- duction are still poorly understood. For example, the spe- cific vibrating structures responsible for the high-frequency, damped oscillations seen in farfield click recordings have not been identified (Cranford 2000). The extent to which the shape of the melon and air spaces can be manipulated to control beam characteristics is unknown (Harper et al. 2008; Cozzi et al. 2017). Finally, it is not clear if dolphins can control the timing of individual biosonar pulses; i.e., are individual clicks produced via discrete muscular activity, or are trains of clicks produced when air is pressured to the point where it escapes past the phonic lips? Biosonar clicks produced by odontocetes are audible to the echolocating animal (Bullock and Ridgway 1972; Ridg- way and Au 1999). Taking advantage of this, Supin et al. * James J. Finneran james.fi[email protected] 1 US Navy Marine Mammal Program, Space and Naval Warfare Systems Center Pacific Code 71510, 53560 Hull St., San Diego, CA 92152, USA 2 National Marine Mammal Foundation, 2240 Shelter Island Dr. #200, San Diego, CA 92106, USA
Transcript of Non-auditory, electrophysiological potentials preceding ... electrophysiological potentials...
Vol.:(0123456789)1 3
Journal of Comparative Physiology A (2018) 204:271–283 https://doi.org/10.1007/s00359-017-1234-0
ORIGINAL PAPER
Non-auditory, electrophysiological potentials preceding dolphin biosonar click production
James J. Finneran1 · Jason Mulsow2 · Ryan Jones2 · Dorian S. Houser2 · Alyssa W. Accomando2 · Sam H. Ridgway2
Received: 25 July 2017 / Revised: 16 November 2017 / Accepted: 20 November 2017 / Published online: 8 December 2017 © The Author(s) 2017. This article is an open access publication
AbstractThe auditory brainstem response to a dolphin’s own emitted biosonar click can be measured by averaging epochs of the instantaneous electroencephalogram (EEG) that are time-locked to the emitted click. In this study, averaged EEGs were measured using surface electrodes placed on the head in six different configurations while dolphins performed an echolocation task. Simultaneously, biosonar click emissions were measured using contact hydrophones on the melon and a hydrophone in the farfield. The averaged EEGs revealed an electrophysiological potential (the pre-auditory wave, PAW) that preceded the production of each biosonar click. The largest PAW amplitudes occurred with the non-inverting electrode just right of the midline—the apparent side of biosonar click generation—and posterior of the blowhole. Although the source of the PAW is unknown, the temporal and spatial properties rule out an auditory source. The PAW may be a neural or myogenic potential associated with click production; however, it is not known if muscles within the dolphin nasal system can be actuated at the high rates reported for dolphin click production, or if sufficiently coordinated and fast motor endplates of nasal muscles exist to produce a PAW detectable with surface electrodes.
Keywords Dolphin · Biosonar · Sound production · Auditory brainstem response · Electromyography
Introduction
Dolphins and other odontocetes (toothed whales) possess biological sonar (biosonar) systems, whereby sound pulses (“clicks”) are emitted and returning echoes are analyzed to detect, localize, and identify underwater objects (e.g., dur-ing foraging). Dolphins produce the sound pulses required for echolocation by passing pressurized air past the “phonic lips” located within the nasal passages (Fig. 1, Ridgway et al. 1980, 2015; Amundin and Andersen 1983; Ridgway and Carder 1988; Cranford et al. 1996, 2011; Cranford 2000). Sound pulses produced at the phonic lips undergo complex interactions with the skull, air spaces, and other tissues in the head as they are coupled into the melon and emitted into the water in a forward-directed beam (Aroyan et al. 1992;
Au et al. 2010; Finneran et al. 2014). Like most other odon-tocetes, dolphins possess two (left and right) pairs of phonic lips (Cranford 1992, 1999; Cranford et al. 2011); however, echolocation pulses appear to be typically generated using the right phonic lips, which are physically larger than those on the left (Mead 1975; Aroyan et al. 2000; Ridgway et al. 2009; Madsen et al. 2013). Despite considerable progress in identifying the general site and pneumatic nature of click production, the specific mechanisms underlying click pro-duction are still poorly understood. For example, the spe-cific vibrating structures responsible for the high-frequency, damped oscillations seen in farfield click recordings have not been identified (Cranford 2000). The extent to which the shape of the melon and air spaces can be manipulated to control beam characteristics is unknown (Harper et al. 2008; Cozzi et al. 2017). Finally, it is not clear if dolphins can control the timing of individual biosonar pulses; i.e., are individual clicks produced via discrete muscular activity, or are trains of clicks produced when air is pressured to the point where it escapes past the phonic lips?
Biosonar clicks produced by odontocetes are audible to the echolocating animal (Bullock and Ridgway 1972; Ridg-way and Au 1999). Taking advantage of this, Supin et al.
* James J. Finneran [email protected]
1 US Navy Marine Mammal Program, Space and Naval Warfare Systems Center Pacific Code 71510, 53560 Hull St., San Diego, CA 92152, USA
2 National Marine Mammal Foundation, 2240 Shelter Island Dr. #200, San Diego, CA 92106, USA
272 Journal of Comparative Physiology A (2018) 204:271–283
1 3
(2003) measured auditory brainstem responses (ABRs) in a false killer whale (Pseudorca crassidens) in response to the animal’s own biosonar click (the “self-heard” click) to investigate biosonar automatic gain control mechanisms. A number of subsequent studies utilized similar methodolo-gies to investigate automatic gain control and biosonar sig-nal processing in the same false killer whale (reviewed by Supin and Nachtigall 2013), dolphins (e.g., Li et al. 2011; Finneran et al. 2013, 2017), and porpoises (e.g., Beedholm et al. 2006; Linnenschmidt et al. 2012). In these studies, surface electrodes embedded in suction cups were placed on the animals’ heads and used to record the instantaneous electroencephalogram (EEG) while they echolocated. ABRs to the self-heard click and returning echoes were obtained by synchronously averaging epochs of EEG data time-locked with biosonar clicks.
In addition to ABRs to the self-heard click and returning echoes, a recent study also reported deflections in the aver-aged EEG occurring around the time of click emission, but before the first waves in the self-heard click ABR (Finneran et al. 2016). These early deflections in the time-locked, aver-aged EEG are referred to here as the “pre-auditory wave”
(PAW). Finneran et al. (2016) reported that the PAW was smaller when the non-inverting electrode was moved cau-dally away from the blowhole; however, investigation of the PAW was outside the scope of the study and therefore, no effort was made to identify its underlying cause. The present paper describes experiments that investigate the origin of the PAW and the relationship between the PAW morphology and the anatomical site of click generation.
Methods
Experimental task
The experimental approach featured measurements of elec-trophysiological potentials and click emissions while dol-phins performed an echolocation task. Electrophysiological potentials were measured using surface electrodes placed on the head in six different configurations. Click emissions were measured using contact hydrophones placed on the melon (similar to Diercks et al. 1971; Au et al. 2010; Madsen et al. 2010, 2013) and a hydrophone in the biosonar transmission
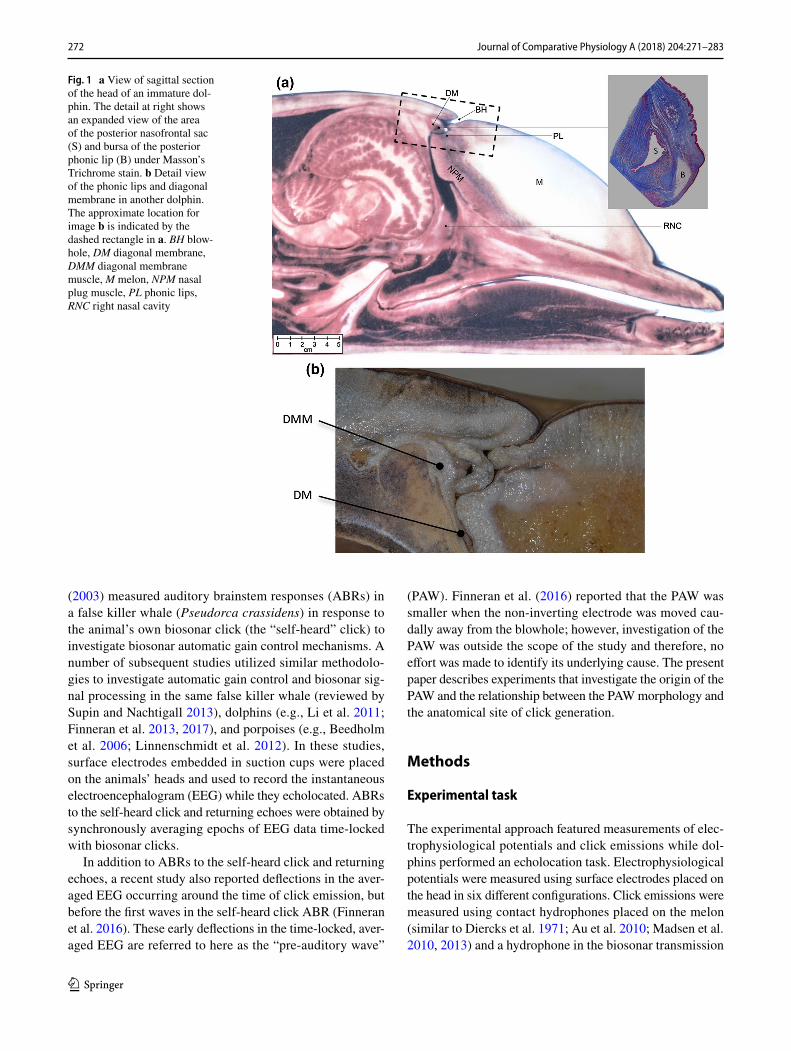
Fig. 1 a View of sagittal section of the head of an immature dol-phin. The detail at right shows an expanded view of the area of the posterior nasofrontal sac (S) and bursa of the posterior phonic lip (B) under Masson’s Trichrome stain. b Detail view of the phonic lips and diagonal membrane in another dolphin. The approximate location for image b is indicated by the dashed rectangle in a. BH blow-hole, DM diagonal membrane, DMM diagonal membrane muscle, M melon, NPM nasal plug muscle, PL phonic lips, RNC right nasal cavity
273Journal of Comparative Physiology A (2018) 204:271–283
1 3
beam acoustic farfield. Tests were conducted in July 2016, within a 9 m × 9 m floating, netted enclosure at the US Navy Marine Mammal Program facility in San Diego Bay, Cali-fornia. Subjects consisted of two bottlenose dolphins (SAY, female, 37 years, ~ 220 kg; TRO, male, 24 years, ~ 180 kg) with upper hearing limits (based on psychophysical thresh-old measurements) of ~ 140 kHz, which is “normal” for a bottlenose dolphin (Johnson 1967; Erbe et al. 2016).
The echolocation task was a go/no-go, echo-change detection task, where the dolphin was required to produce a conditioned acoustic response (SAY: whistle, TRO: echolo-cation burst-pulse) after detecting a change in biosonar ech-oes and to withhold the response otherwise (see below and Finneran et al. 2013, 2016). Echoes were generated using a “phantom” echo generator rather than a physical target (see below and Simmons 1973; Au et al. 1987). Each experimen-tal session lasted approximately 60–90 min and consisted of 120–130 discrete trials. During each trial, the dolphin posi-tioned itself in a hoop (~ 1 m depth, facing outward from the enclosure towards San Diego Bay), produced echolocation clicks, and listened to the returning phantom echoes. On 80% of the trials, the phantom target impulse response changed after a random interval of 5–10 s followed by a 2-s response interval. On the remainder of the trials, the phantom target remained constant for the 7- to 12-s trial duration. Correct responses by the dolphin were rewarded with fish. Sessions were divided into blocks of ten trials within which the con-tact hydrophone and electrode positions were fixed.
Signal generation and recording
Two piezoelectric transducers (1089D, International Trans-ducer Corp, Santa Barbara, CA and TC4013, Reson Inc., Slangerup, Denmark) were located approximately 1.3 m in front of the subject’s blowhole when positioned in the hoop. Phantom echoes were produced by capturing the dolphin’s outgoing echolocation clicks with the 1089D hydrophone and convolving the clicks with a target impulse response to create echo waveforms (for details see Finneran et al. 2010, 2013, 2016). Two impulse responses, denoted as A and B, were used to produce echo waveforms. Echo A consisted of a replica of the received click and echo B consisted of a replica of the click whose amplitude “jittered” (i.e., alter-nated on successive presentations) by 3 dB (± 1.5 dB). The p–p amplitude of echo A relative to the click was − 85 dB, respectively, and the simulated target range was 10 m (i.e., ~ 13-ms echo delay relative to the biosonar click). Analog echo waveforms were filtered (5–200 kHz, 3C module, Krohn-Hite Corporation, Brockton, MA, USA), attenuated (PA5, Tucker-Davis Technologies, Alachua, FL, USA), amplified (7600M, Krohn-Hite Corporation, Brockton, MA, USA), and broadcast to the dolphin using the TC4013 transducer.
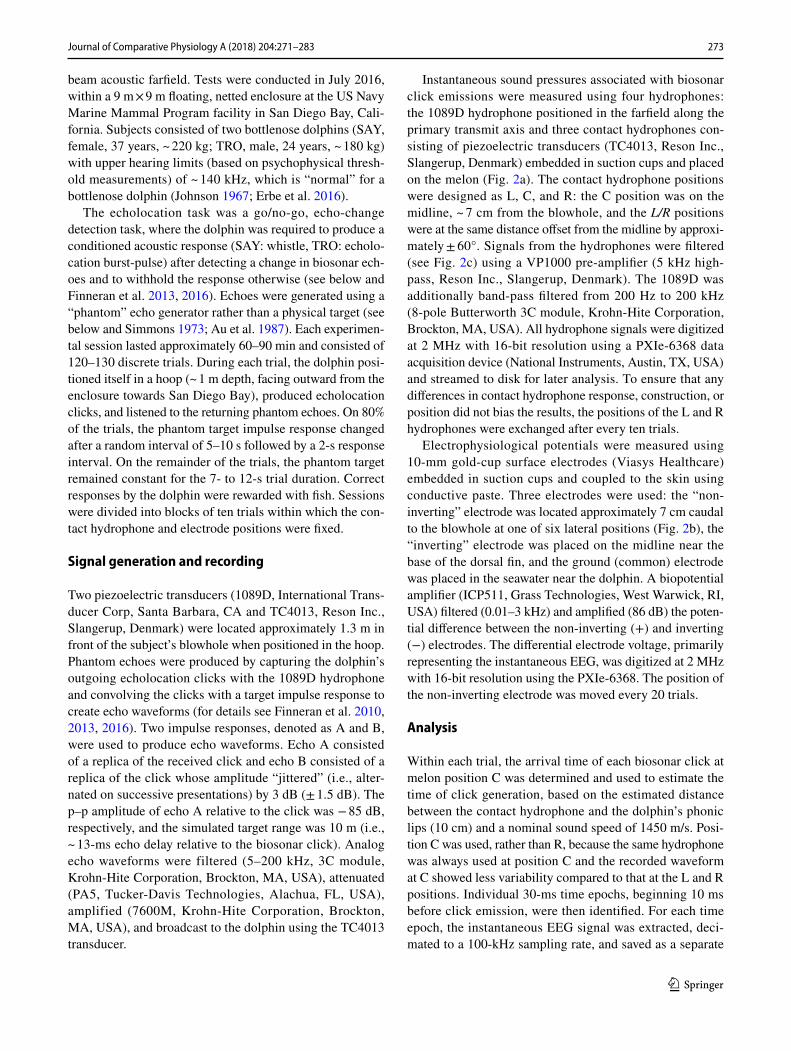
Instantaneous sound pressures associated with biosonar click emissions were measured using four hydrophones: the 1089D hydrophone positioned in the farfield along the primary transmit axis and three contact hydrophones con-sisting of piezoelectric transducers (TC4013, Reson Inc., Slangerup, Denmark) embedded in suction cups and placed on the melon (Fig. 2a). The contact hydrophone positions were designed as L, C, and R: the C position was on the midline, ~ 7 cm from the blowhole, and the L/R positions were at the same distance offset from the midline by approxi-mately ± 60°. Signals from the hydrophones were filtered (see Fig. 2c) using a VP1000 pre-amplifier (5 kHz high-pass, Reson Inc., Slangerup, Denmark). The 1089D was additionally band-pass filtered from 200 Hz to 200 kHz (8-pole Butterworth 3C module, Krohn-Hite Corporation, Brockton, MA, USA). All hydrophone signals were digitized at 2 MHz with 16-bit resolution using a PXIe-6368 data acquisition device (National Instruments, Austin, TX, USA) and streamed to disk for later analysis. To ensure that any differences in contact hydrophone response, construction, or position did not bias the results, the positions of the L and R hydrophones were exchanged after every ten trials.
Electrophysiological potentials were measured using 10-mm gold-cup surface electrodes (Viasys Healthcare) embedded in suction cups and coupled to the skin using conductive paste. Three electrodes were used: the “non-inverting” electrode was located approximately 7 cm caudal to the blowhole at one of six lateral positions (Fig. 2b), the “inverting” electrode was placed on the midline near the base of the dorsal fin, and the ground (common) electrode was placed in the seawater near the dolphin. A biopotential amplifier (ICP511, Grass Technologies, West Warwick, RI, USA) filtered (0.01–3 kHz) and amplified (86 dB) the poten-tial difference between the non-inverting (+) and inverting (−) electrodes. The differential electrode voltage, primarily representing the instantaneous EEG, was digitized at 2 MHz with 16-bit resolution using the PXIe-6368. The position of the non-inverting electrode was moved every 20 trials.
Analysis
Within each trial, the arrival time of each biosonar click at melon position C was determined and used to estimate the time of click generation, based on the estimated distance between the contact hydrophone and the dolphin’s phonic lips (10 cm) and a nominal sound speed of 1450 m/s. Posi-tion C was used, rather than R, because the same hydrophone was always used at position C and the recorded waveform at C showed less variability compared to that at the L and R positions. Individual 30-ms time epochs, beginning 10 ms before click emission, were then identified. For each time epoch, the instantaneous EEG signal was extracted, deci-mated to a 100-kHz sampling rate, and saved as a separate
274 Journal of Comparative Physiology A (2018) 204:271–283
1 3
file (an EEG waveform “clip”). During EEG clip extraction, time intervals containing a whistle or burst-pulse response, epochs corresponding to clicks with inter-click inter-vals < the two-way travel time between dolphin and phan-tom target, epochs occurring after target jitter initiation, and epochs with EEG peak amplitude > 40 μV were excluded. Time periods with relatively large dolphin head movements (identified by oscillations in the farfield click amplitude) were also excluded from EEG clip extraction. EEG clips were then grouped by subject and non-inverting electrode position, digitally band-pass filtered (300–3000 Hz, zero-phase 6th-order Butterworth), and synchronously averaged.
The high-pass cutoff of 300 Hz was used to remove low-fre-quency drift in the averaged EEG baseline that made inter-preting the ABR/PAW peaks difficult; preliminary analyses showed little effect of the high-pass filter on the ABR or PAW peaks. For visualizing the averaged EEGs, two sepa-rate averages were computed, each containing half the total available epochs.
Hydrophone data were analyzed by comparing the times-of-arrival (based on threshold-crossing) at each contact hydrophone for each click recorded on the farfield hydro-phone. Time delays associated with the analog electronics (amplifiers and band-pass filters) were estimated by passing
Fig. 2 a Click emissions were recorded using three contact hydrophones placed on the dolphin’s melon, 7 cm from the blowhole, on the centerline (C) and left (L) and right (R) of the centerline, and a single hydrophone along the main transmit axis in the acoustic far-field. The contact hydrophones at the L and R positions were switched after every ten trials. b The instantaneous EEG was based on the potential differ-ence between a non-inverting electrode placed at one of six locations near the blowhole (L1, L2, L3, R1, R2, R3) and an inverting electrode (INV) located near the base of the dor-sal fin. c Hydrophone and elec-trode signals were amplified, filtered, digitized and stored to computer disk for later analysis. Time delays associated with the electronic equipment were measured and used to correct the measured latencies for the biosonar clicks and instantane-ous EEG
275Journal of Comparative Physiology A (2018) 204:271–283
1 3
signals through the equipment and measuring the resulting time delays. For click measurements, the signals consisted of recorded dolphin clicks. For EEG measurements, 1-kHz tone bursts and digitized waveforms of dolphin click-evoked ABRs were used. The resulting time delays (2 μs for bioso-nar clicks, 220 μs for the EEG) were then used to correct the latencies of the measured biosonar clicks and EEG epochs.
The performance of each dolphin in the echolocation task was quantified using the hit rate (the number of responses during echo-change trials, divided by the number of echo-change trials) and the false alarm rate (the number of responses during no-change trials, divided by the number of no-change trials).
Results
The dolphins SAY and TRO participated in 250 and 240 tri-als, respectively. Hit rates were 89 and 90%, and false alarm rates were 25 and 14% for SAY and TRO, respectively.
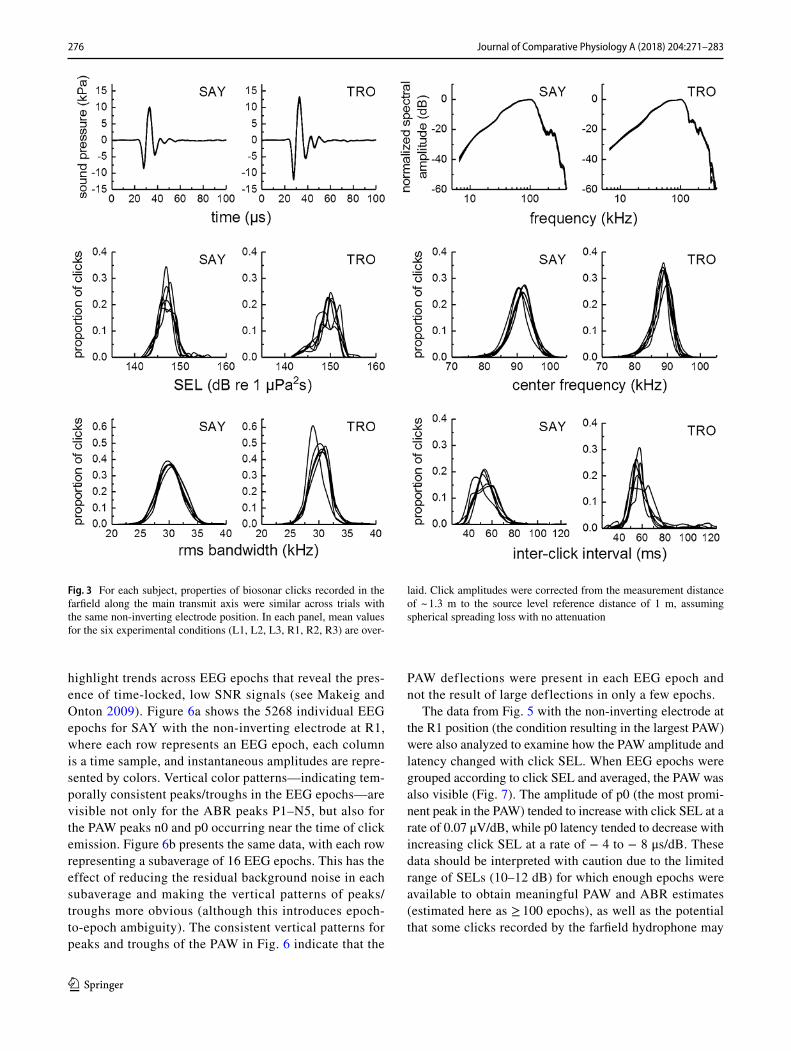
A total of 28,510 and 20,789 clicks and EEG epochs were obtained for SAY and TRO, respectively. For each non-inverting electrode location, the number of clicks/epochs ranged from 4184 to 5268 for SAY and 2974 to 4210 for TRO (Table 1). Properties of clicks recorded in the farfield (Fig. 3) were similar across groups of trials with the same non-inverting electrode position (i.e., differences between averaged EEGs with different electrode positions cannot be explained by differences in click emissions). Click instan-taneous sound pressures resembled exponentially damped sinusoids with peak pressures of ~ 10 to 15 kPa, p-p source levels (SLs) from ~ 200 to 213 dB re 1 μPa at 1 m, and SELs from ~ 142 to 155 dB re 1 μPa2s (all amplitude measures are referenced to 1 m, assuming spherical spreading loss). Center frequencies ranged from 80 to 100 kHz, rms band-widths were between 25 and 35 kHz, and inter-click intervals varied from 40 to 80 ms for both dolphins. Clicks produced
by TRO tended to have higher amplitude, higher frequency content, and larger inter-click intervals compared to those produced by SAY. The correlation between click p–p sound pressure measured with the center contact hydrophone and that measured in the farfield was moderate (SAY: r = 0.617; TRO: r = 0.553). Correlations between the farfield hydro-phone and the L/R contact hydrophones were relatively low (0.12 < r < 0.51). The limited range of click levels (15 dB) and the ability of the animals to move their heads in the hoop likely contributed to the relatively low correlation between clicks measured on the melon and in the farfield.
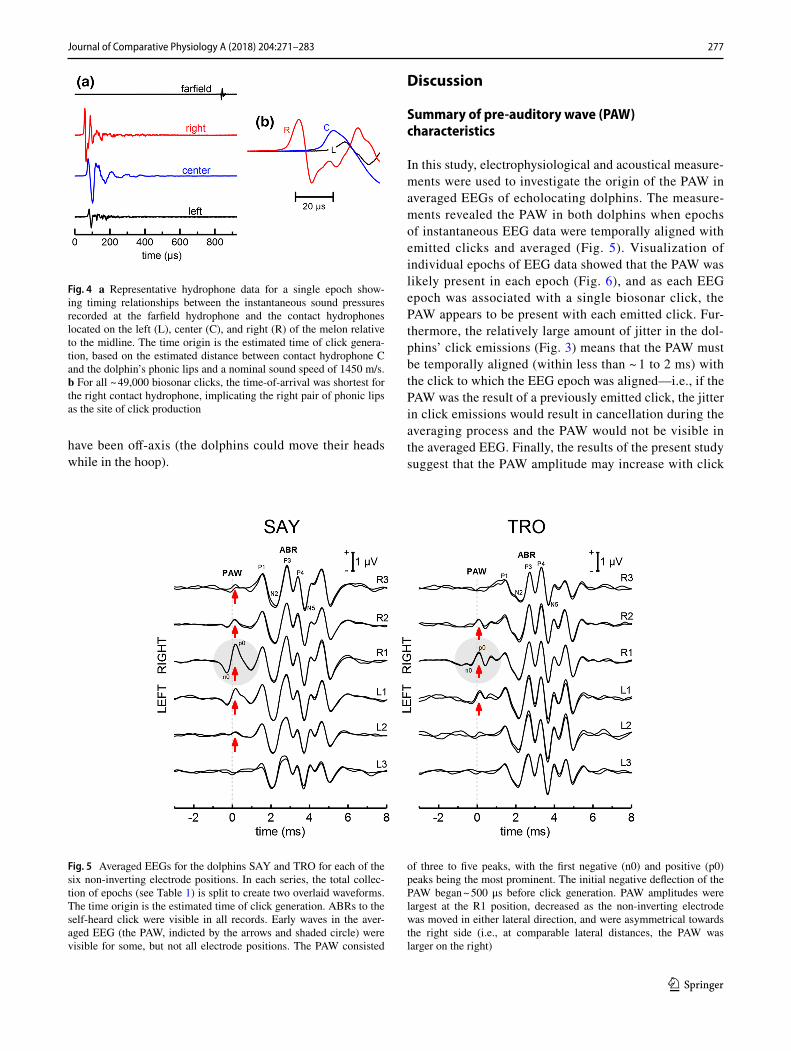
Figure 4 shows a representative example of the instan-taneous sound pressure recorded from the contact hydro-phones for a single epoch of data. Sound pressures recorded by the L/R contact hydrophones (off the main transmit axis) exhibited more complex signatures compared to the center and farfield hydrophones. For all epochs, the biosonar click time-of-arrival was shortest for the right contact hydro-phone; i.e., all ~ 49,000 biosonar clicks arrived at the right contact hydrophone first, implicating the right pair of phonic lips as the site of click production for both dolphins.
Figure 5 shows averaged EEGs for SAY and TRO for each of the six electrode configurations, with the total collec-tion of epochs for each condition split to create two overlaid waveforms. ABRs to the self-heard click resembled the typi-cal morphology for dolphins (Ridgway et al. 1981; Popov and Supin 1990) and were visible in all records. Additional waves in the averaged EEG occurred after the N5-peak in the self-heard click ABR and were visible in all records; the waves likely reflect the ABR to the echo from the farfield hydrophone. Early waves in the averaged EEG (the PAW, indicated by the arrows and shaded region in Fig. 5) are visible for some, but not all electrode configurations. The PAW consisted of three to five peaks, with the first negative (n0) and positive (p0) peaks being the most prominent. At larger amplitudes, the duration of each peak was approxi-mately 0.6–0.7 ms and the overall duration was about 2 ms. The initial negative deflection of the PAW began ~ 500 μs before click generation. PAW amplitudes were largest at the R1 position, and decreased as the non-inverting electrode was moved in either lateral direction. The PAW amplitude distributions were asymmetrical and favored the right side (i.e., at comparable lateral distances, the PAW was larger on the right).
It is important for understanding the origins of the PAW to know whether it is present in each epoch of EEG data (the presence of a visible PAW in the averaged EEG does not necessarily mean that the PAW is present in every epoch). Although the SNR of the PAW within a single EEG epoch is too low for the PAW to be identified within the physiological background noise, temporally aligning individual epochs of EEG data, or subaver-ages composed of only a few epochs of EEG data, can
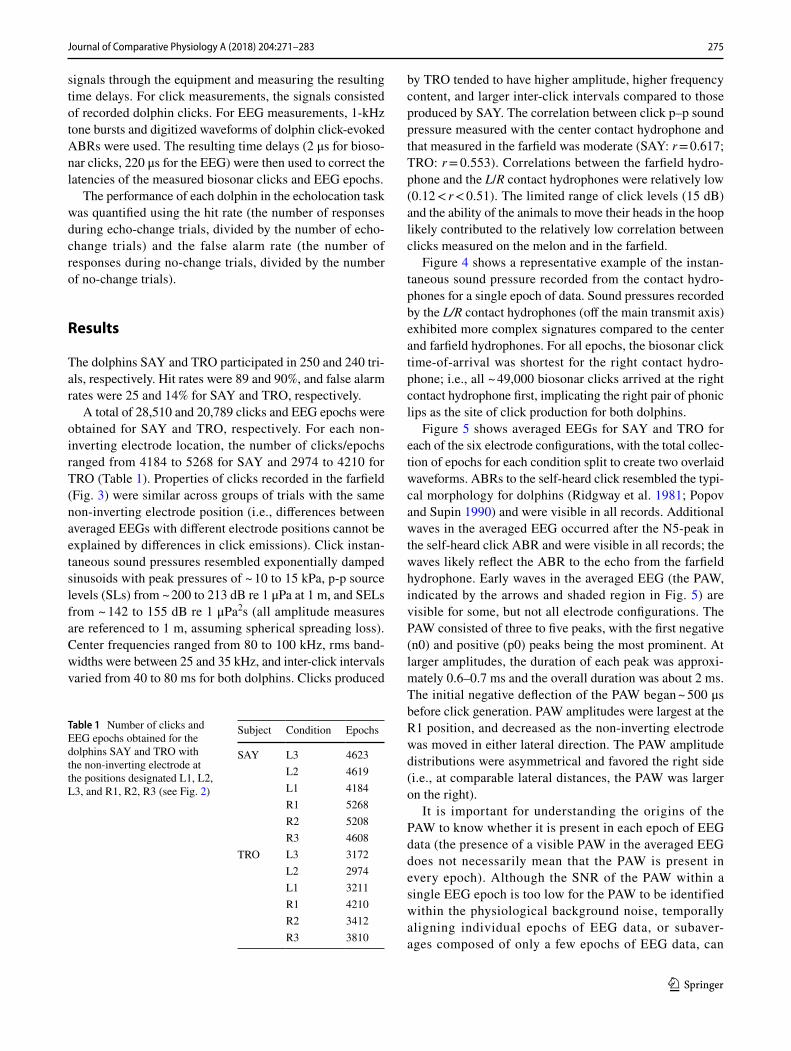
Table 1 Number of clicks and EEG epochs obtained for the dolphins SAY and TRO with the non-inverting electrode at the positions designated L1, L2, L3, and R1, R2, R3 (see Fig. 2)
Subject Condition Epochs
SAY L3 4623L2 4619L1 4184R1 5268R2 5208R3 4608
TRO L3 3172L2 2974L1 3211R1 4210R2 3412R3 3810
276 Journal of Comparative Physiology A (2018) 204:271–283
1 3
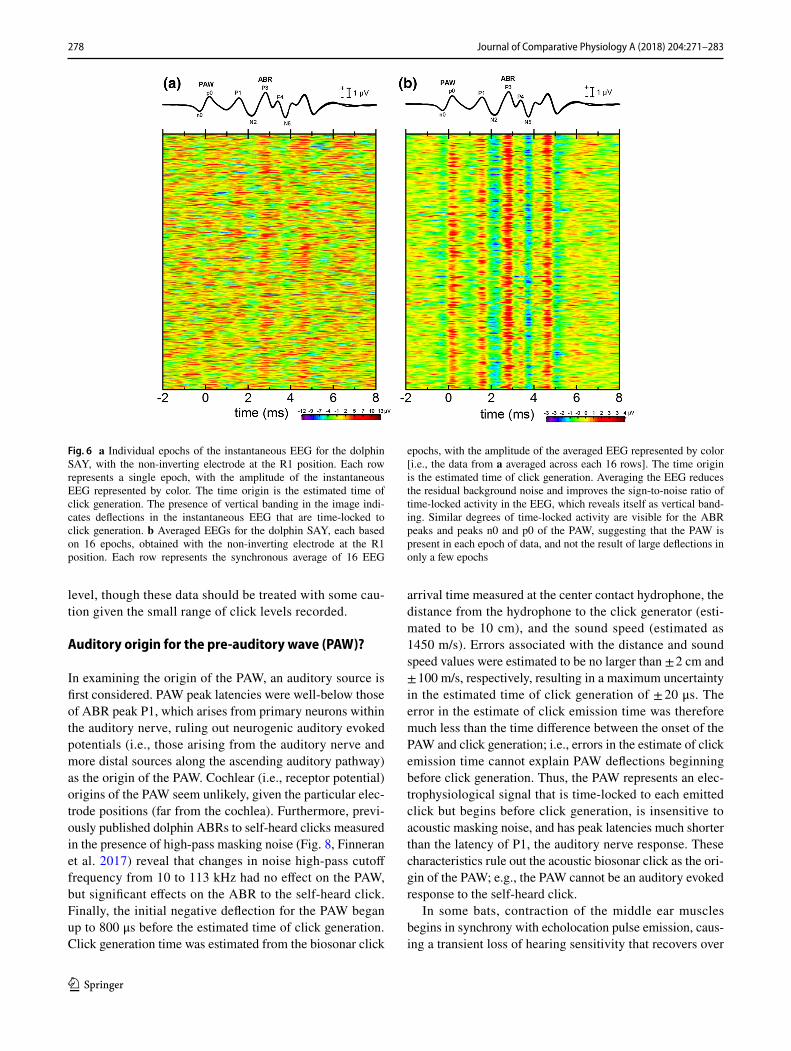
highlight trends across EEG epochs that reveal the pres-ence of time-locked, low SNR signals (see Makeig and Onton 2009). Figure 6a shows the 5268 individual EEG epochs for SAY with the non-inverting electrode at R1, where each row represents an EEG epoch, each column is a time sample, and instantaneous amplitudes are repre-sented by colors. Vertical color patterns—indicating tem-porally consistent peaks/troughs in the EEG epochs—are visible not only for the ABR peaks P1–N5, but also for the PAW peaks n0 and p0 occurring near the time of click emission. Figure 6b presents the same data, with each row representing a subaverage of 16 EEG epochs. This has the effect of reducing the residual background noise in each subaverage and making the vertical patterns of peaks/troughs more obvious (although this introduces epoch-to-epoch ambiguity). The consistent vertical patterns for peaks and troughs of the PAW in Fig. 6 indicate that the
PAW deflections were present in each EEG epoch and not the result of large deflections in only a few epochs.
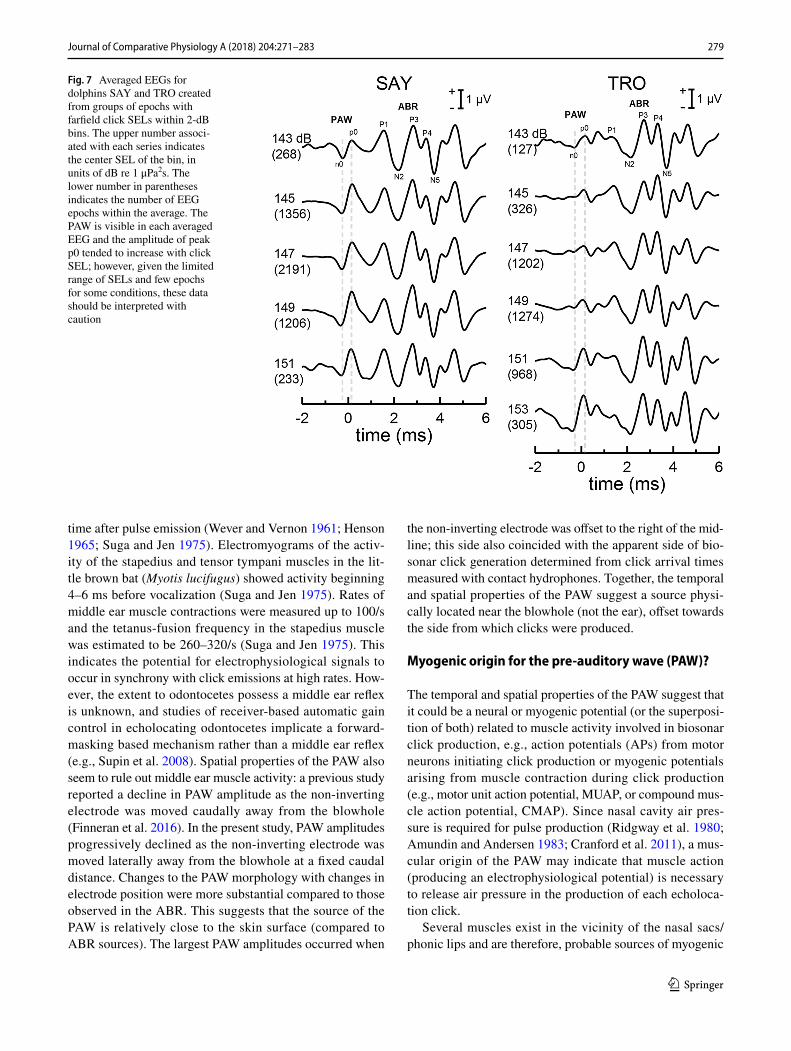
The data from Fig. 5 with the non-inverting electrode at the R1 position (the condition resulting in the largest PAW) were also analyzed to examine how the PAW amplitude and latency changed with click SEL. When EEG epochs were grouped according to click SEL and averaged, the PAW was also visible (Fig. 7). The amplitude of p0 (the most promi-nent peak in the PAW) tended to increase with click SEL at a rate of 0.07 μV/dB, while p0 latency tended to decrease with increasing click SEL at a rate of − 4 to − 8 μs/dB. These data should be interpreted with caution due to the limited range of SELs (10–12 dB) for which enough epochs were available to obtain meaningful PAW and ABR estimates (estimated here as ≥ 100 epochs), as well as the potential that some clicks recorded by the farfield hydrophone may
Fig. 3 For each subject, properties of biosonar clicks recorded in the farfield along the main transmit axis were similar across trials with the same non-inverting electrode position. In each panel, mean values for the six experimental conditions (L1, L2, L3, R1, R2, R3) are over-
laid. Click amplitudes were corrected from the measurement distance of ~ 1.3 m to the source level reference distance of 1 m, assuming spherical spreading loss with no attenuation
277Journal of Comparative Physiology A (2018) 204:271–283
1 3
have been off-axis (the dolphins could move their heads while in the hoop).
Discussion
Summary of pre‑auditory wave (PAW) characteristics
In this study, electrophysiological and acoustical measure-ments were used to investigate the origin of the PAW in averaged EEGs of echolocating dolphins. The measure-ments revealed the PAW in both dolphins when epochs of instantaneous EEG data were temporally aligned with emitted clicks and averaged (Fig. 5). Visualization of individual epochs of EEG data showed that the PAW was likely present in each epoch (Fig. 6), and as each EEG epoch was associated with a single biosonar click, the PAW appears to be present with each emitted click. Fur-thermore, the relatively large amount of jitter in the dol-phins’ click emissions (Fig. 3) means that the PAW must be temporally aligned (within less than ~ 1 to 2 ms) with the click to which the EEG epoch was aligned—i.e., if the PAW was the result of a previously emitted click, the jitter in click emissions would result in cancellation during the averaging process and the PAW would not be visible in the averaged EEG. Finally, the results of the present study suggest that the PAW amplitude may increase with click
Fig. 4 a Representative hydrophone data for a single epoch show-ing timing relationships between the instantaneous sound pressures recorded at the farfield hydrophone and the contact hydrophones located on the left (L), center (C), and right (R) of the melon relative to the midline. The time origin is the estimated time of click genera-tion, based on the estimated distance between contact hydrophone C and the dolphin’s phonic lips and a nominal sound speed of 1450 m/s. b For all ~ 49,000 biosonar clicks, the time-of-arrival was shortest for the right contact hydrophone, implicating the right pair of phonic lips as the site of click production
Fig. 5 Averaged EEGs for the dolphins SAY and TRO for each of the six non-inverting electrode positions. In each series, the total collec-tion of epochs (see Table 1) is split to create two overlaid waveforms. The time origin is the estimated time of click generation. ABRs to the self-heard click were visible in all records. Early waves in the aver-aged EEG (the PAW, indicted by the arrows and shaded circle) were visible for some, but not all electrode positions. The PAW consisted
of three to five peaks, with the first negative (n0) and positive (p0) peaks being the most prominent. The initial negative deflection of the PAW began ~ 500 μs before click generation. PAW amplitudes were largest at the R1 position, decreased as the non-inverting electrode was moved in either lateral direction, and were asymmetrical towards the right side (i.e., at comparable lateral distances, the PAW was larger on the right)
278 Journal of Comparative Physiology A (2018) 204:271–283
1 3
level, though these data should be treated with some cau-tion given the small range of click levels recorded.
Auditory origin for the pre‑auditory wave (PAW)?
In examining the origin of the PAW, an auditory source is first considered. PAW peak latencies were well-below those of ABR peak P1, which arises from primary neurons within the auditory nerve, ruling out neurogenic auditory evoked potentials (i.e., those arising from the auditory nerve and more distal sources along the ascending auditory pathway) as the origin of the PAW. Cochlear (i.e., receptor potential) origins of the PAW seem unlikely, given the particular elec-trode positions (far from the cochlea). Furthermore, previ-ously published dolphin ABRs to self-heard clicks measured in the presence of high-pass masking noise (Fig. 8, Finneran et al. 2017) reveal that changes in noise high-pass cutoff frequency from 10 to 113 kHz had no effect on the PAW, but significant effects on the ABR to the self-heard click. Finally, the initial negative deflection for the PAW began up to 800 μs before the estimated time of click generation. Click generation time was estimated from the biosonar click
arrival time measured at the center contact hydrophone, the distance from the hydrophone to the click generator (esti-mated to be 10 cm), and the sound speed (estimated as 1450 m/s). Errors associated with the distance and sound speed values were estimated to be no larger than ± 2 cm and ± 100 m/s, respectively, resulting in a maximum uncertainty in the estimated time of click generation of ± 20 μs. The error in the estimate of click emission time was therefore much less than the time difference between the onset of the PAW and click generation; i.e., errors in the estimate of click emission time cannot explain PAW deflections beginning before click generation. Thus, the PAW represents an elec-trophysiological signal that is time-locked to each emitted click but begins before click generation, is insensitive to acoustic masking noise, and has peak latencies much shorter than the latency of P1, the auditory nerve response. These characteristics rule out the acoustic biosonar click as the ori-gin of the PAW; e.g., the PAW cannot be an auditory evoked response to the self-heard click.
In some bats, contraction of the middle ear muscles begins in synchrony with echolocation pulse emission, caus-ing a transient loss of hearing sensitivity that recovers over
Fig. 6 a Individual epochs of the instantaneous EEG for the dolphin SAY, with the non-inverting electrode at the R1 position. Each row represents a single epoch, with the amplitude of the instantaneous EEG represented by color. The time origin is the estimated time of click generation. The presence of vertical banding in the image indi-cates deflections in the instantaneous EEG that are time-locked to click generation. b Averaged EEGs for the dolphin SAY, each based on 16 epochs, obtained with the non-inverting electrode at the R1 position. Each row represents the synchronous average of 16 EEG
epochs, with the amplitude of the averaged EEG represented by color [i.e., the data from a averaged across each 16 rows]. The time origin is the estimated time of click generation. Averaging the EEG reduces the residual background noise and improves the sign-to-noise ratio of time-locked activity in the EEG, which reveals itself as vertical band-ing. Similar degrees of time-locked activity are visible for the ABR peaks and peaks n0 and p0 of the PAW, suggesting that the PAW is present in each epoch of data, and not the result of large deflections in only a few epochs
279Journal of Comparative Physiology A (2018) 204:271–283
1 3
time after pulse emission (Wever and Vernon 1961; Henson 1965; Suga and Jen 1975). Electromyograms of the activ-ity of the stapedius and tensor tympani muscles in the lit-tle brown bat (Myotis lucifugus) showed activity beginning 4–6 ms before vocalization (Suga and Jen 1975). Rates of middle ear muscle contractions were measured up to 100/s and the tetanus-fusion frequency in the stapedius muscle was estimated to be 260–320/s (Suga and Jen 1975). This indicates the potential for electrophysiological signals to occur in synchrony with click emissions at high rates. How-ever, the extent to odontocetes possess a middle ear reflex is unknown, and studies of receiver-based automatic gain control in echolocating odontocetes implicate a forward-masking based mechanism rather than a middle ear reflex (e.g., Supin et al. 2008). Spatial properties of the PAW also seem to rule out middle ear muscle activity: a previous study reported a decline in PAW amplitude as the non-inverting electrode was moved caudally away from the blowhole (Finneran et al. 2016). In the present study, PAW amplitudes progressively declined as the non-inverting electrode was moved laterally away from the blowhole at a fixed caudal distance. Changes to the PAW morphology with changes in electrode position were more substantial compared to those observed in the ABR. This suggests that the source of the PAW is relatively close to the skin surface (compared to ABR sources). The largest PAW amplitudes occurred when
the non-inverting electrode was offset to the right of the mid-line; this side also coincided with the apparent side of bio-sonar click generation determined from click arrival times measured with contact hydrophones. Together, the temporal and spatial properties of the PAW suggest a source physi-cally located near the blowhole (not the ear), offset towards the side from which clicks were produced.
Myogenic origin for the pre‑auditory wave (PAW)?
The temporal and spatial properties of the PAW suggest that it could be a neural or myogenic potential (or the superposi-tion of both) related to muscle activity involved in biosonar click production, e.g., action potentials (APs) from motor neurons initiating click production or myogenic potentials arising from muscle contraction during click production (e.g., motor unit action potential, MUAP, or compound mus-cle action potential, CMAP). Since nasal cavity air pres-sure is required for pulse production (Ridgway et al. 1980; Amundin and Andersen 1983; Cranford et al. 2011), a mus-cular origin of the PAW may indicate that muscle action (producing an electrophysiological potential) is necessary to release air pressure in the production of each echoloca-tion click.
Several muscles exist in the vicinity of the nasal sacs/phonic lips and are therefore, probable sources of myogenic
Fig. 7 Averaged EEGs for dolphins SAY and TRO created from groups of epochs with farfield click SELs within 2-dB bins. The upper number associ-ated with each series indicates the center SEL of the bin, in units of dB re 1 μPa2s. The lower number in parentheses indicates the number of EEG epochs within the average. The PAW is visible in each averaged EEG and the amplitude of peak p0 tended to increase with click SEL; however, given the limited range of SELs and few epochs for some conditions, these data should be interpreted with caution
280 Journal of Comparative Physiology A (2018) 204:271–283
1 3
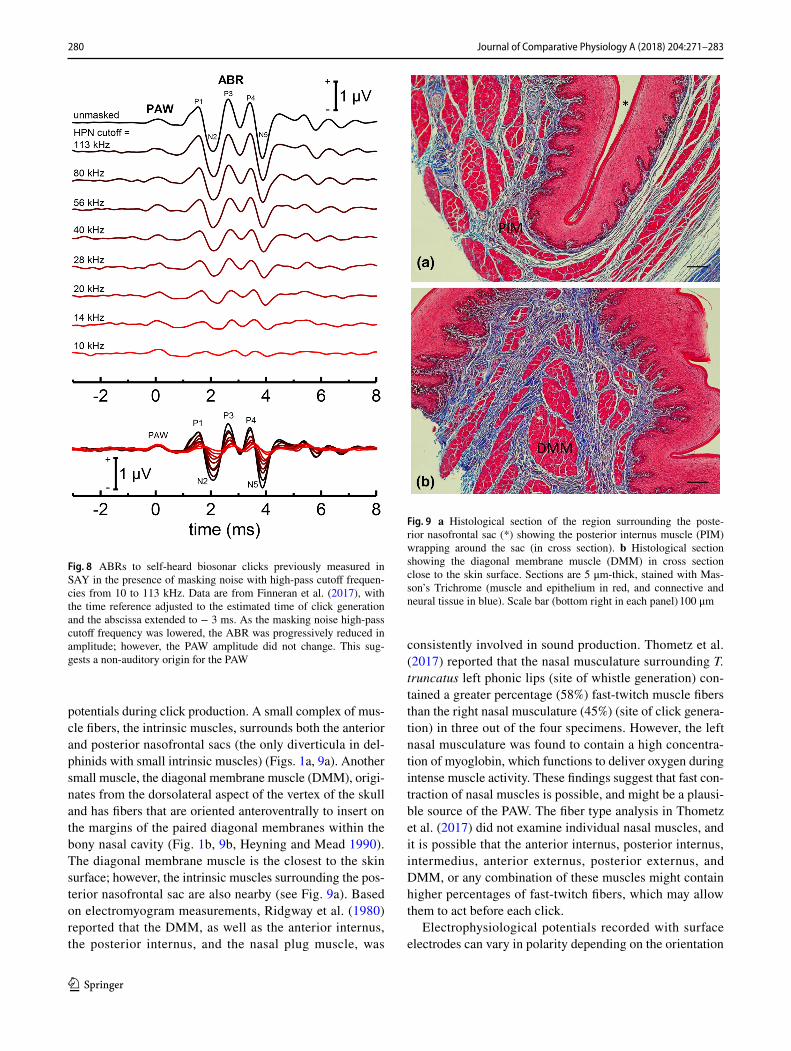
potentials during click production. A small complex of mus-cle fibers, the intrinsic muscles, surrounds both the anterior and posterior nasofrontal sacs (the only diverticula in del-phinids with small intrinsic muscles) (Figs. 1a, 9a). Another small muscle, the diagonal membrane muscle (DMM), origi-nates from the dorsolateral aspect of the vertex of the skull and has fibers that are oriented anteroventrally to insert on the margins of the paired diagonal membranes within the bony nasal cavity (Fig. 1b, 9b, Heyning and Mead 1990). The diagonal membrane muscle is the closest to the skin surface; however, the intrinsic muscles surrounding the pos-terior nasofrontal sac are also nearby (see Fig. 9a). Based on electromyogram measurements, Ridgway et al. (1980) reported that the DMM, as well as the anterior internus, the posterior internus, and the nasal plug muscle, was
consistently involved in sound production. Thometz et al. (2017) reported that the nasal musculature surrounding T. truncatus left phonic lips (site of whistle generation) con-tained a greater percentage (58%) fast-twitch muscle fibers than the right nasal musculature (45%) (site of click genera-tion) in three out of the four specimens. However, the left nasal musculature was found to contain a high concentra-tion of myoglobin, which functions to deliver oxygen during intense muscle activity. These findings suggest that fast con-traction of nasal muscles is possible, and might be a plausi-ble source of the PAW. The fiber type analysis in Thometz et al. (2017) did not examine individual nasal muscles, and it is possible that the anterior internus, posterior internus, intermedius, anterior externus, posterior externus, and DMM, or any combination of these muscles might contain higher percentages of fast-twitch fibers, which may allow them to act before each click.
Electrophysiological potentials recorded with surface electrodes can vary in polarity depending on the orientation
Fig. 8 ABRs to self-heard biosonar clicks previously measured in SAY in the presence of masking noise with high-pass cutoff frequen-cies from 10 to 113 kHz. Data are from Finneran et al. (2017), with the time reference adjusted to the estimated time of click generation and the abscissa extended to − 3 ms. As the masking noise high-pass cutoff frequency was lowered, the ABR was progressively reduced in amplitude; however, the PAW amplitude did not change. This sug-gests a non-auditory origin for the PAW
Fig. 9 a Histological section of the region surrounding the poste-rior nasofrontal sac (*) showing the posterior internus muscle (PIM) wrapping around the sac (in cross section). b Histological section showing the diagonal membrane muscle (DMM) in cross section close to the skin surface. Sections are 5 μm-thick, stained with Mas-son’s Trichrome (muscle and epithelium in red, and connective and neural tissue in blue). Scale bar (bottom right in each panel) 100 μm
281Journal of Comparative Physiology A (2018) 204:271–283
1 3
of the underlying sources relative to the recording electrodes (Dumitru and Jewett 1993), and both positive and negative waves may be recorded with surface electrodes from neu-ral or myogenic sources. The multi-phasic waveform of the PAW could therefore, have resulted from either neural or myogenic sources (or both). However, the duration of the PAW (~ 0.6–0.7 ms for each wave, total duration ~ 2 ms) is on the order of those for peaks of the ABR, which arise from action potentials in nerve fibers, and is shorter than typical durations of myogenic potentials resulting from muscle con-traction associated with multiple motor units (Picton 2011). MUAPs and CMAPs have longer durations than single fiber APs as a result of variation in arrival times for motor neuron AP at different endplates, jitter in neuromuscular synapses, and variation in muscle fiber propagation velocity (caused by different diameters) (Gootzen 1990). The short duration of the PAW—indicating a source with high synchrony—sug-gests either a neural source or a myogenic source with few motor units, short/consistent fiber length, and/or consistent propagation velocity.
Since the PAW was present in each epoch of EEG data delineated by a single click emission (Fig. 6), a muscular ori-gin for the PAW implies muscle contraction associated with the generation of each individual biosonar click; i.e., that each individual click is under active neuromuscular control. Such muscular activity would require high contraction rates. For bats, experimental measurements have shown that each vocalization is under active neuromuscular control (Suthers and Fattu 1973) and calling rates are limited by contrac-tion rates of “superfast” muscles with maximum rates ~ 180 to 200 Hz (Elemans et al. 2011). Fast muscle-contractile rates have also been reported in other species: e.g., mus-cles encircling the swimbladder of the toadfish (Opsanus tau) contract at rates up to ~ 200 Hz (Rome et al. 1996) and tetanus-fusion frequencies for the cat internal rectus muscle were described to be 240–300 Hz after stimulation of the horizontal canal nerve (Suzuki and Cohen 1966). Although most clicks in the present study were produced at repetition rates from ~ 10 to 30 Hz—below reported maximum mus-cle-contractile rates for other species, burst-pulse responses (i.e., rapid click sequences) from TRO had rates of ~ 300 Hz. Other studies have reported click rates for dolphins up to 430 Hz (Madsen et al. 2013), rates within burst-pulses up to 500–900 Hz (Blomqvist and Amundin 2004; Branstetter et al. 2012), and rates within terminal buzzes of 250–500 Hz (Wisniewska et al. 2014). Furthermore, evidence suggests that dolphin whistles may actually be formed via rapid pro-duction of clicks, meaning that click production rates may be as high as ~ 4–20 kHz (Madsen et al. 2012). At present, it is not known if muscles in the dolphin nasal system associ-ated with click production can achieve the high contraction rates required to precede each individual click or whether they possess superfast characteristics. It is also possible that
myogenic control of click production differs between gener-ating echolocation clicks at relatively low rates (e.g., below ~ 100 Hz) and producing terminal buzzes, burst-pulses, or whistles, and that the PAW is not associated with individual clicks during the latter.
Mechanoreceptor origin for pre‑auditory wave (PAW)?
Prahl et al. (2009) reported the presence of mechanorecep-tors in the connective tissue between the phonic lips and adjacent dorsal bursae in the harbor porpoise (Phocoena phocoena). Analogous structures have not been reported near the phonic lips in dolphins, but similar mechanorecep-tors have been described in the skin (Palmer and Weddell 1964). Given the general similarities in sound production structures across odontocetes, it is not unreasonable to sup-pose that mechanoreceptors may also be present within connective tissue near the phonic lips in dolphins. If pre-sent, mechanoreceptors near the phonic lips may respond to pressure/vibration events associated with click production and produce time-locked evoked responses; however, it not known if evoked responses from mechanoreceptors could be detected with surface electrodes or if they could actually precede click emissions.
Conclusions
A time-locked electrophysiological potential (the pre-audi-tory wave, PAW) precedes the production of individual bio-sonar clicks in bottlenose dolphins. Although the specific source of the PAW is unknown, the temporal and spatial properties of the PAW rule out an auditory system origin. The PAW may arise from muscle contraction associated with click production; however, it is not known if muscles within the dolphin nasal system can contract at the high rates typi-cal of dolphin click production. It may be possible that the PAW originates from mechanoreceptors located near the phonic lips, but the extent to which mechanoreceptors exist within the dolphin nasal system and whether such mecha-noreceptors could produce time-locked evoked responses preceding click emissions and detectable with surface elec-trodes are unknown. Measurements of the PAW at various click rates (e.g., normal echolocation to burst-pulse/buzzing rates) and over a broader range of click levels should shed additional light on the origins of the PAW. More detailed study of the arrangement and sub-cellular composition of the various muscles related to click production is also neces-sary to fully understand if dolphins can actively control the production of individual biosonar pulses.
282 Journal of Comparative Physiology A (2018) 204:271–283
1 3
Open Access This article is distributed under the terms of the Creative Commons Attribution 4.0 International License (http://creativecom-mons.org/licenses/by/4.0/), which permits unrestricted use, distribu-tion, and reproduction in any medium, provided you give appropriate credit to the original author(s) and the source, provide a link to the Creative Commons license, and indicate if changes were made.
References
Amundin M, Andersen SH (1983) Bony nares air pressure and nasal plug muscle activity during click production in the harbour porpoise, Phocoena phocoena, and the bottlenosed dolphin, Tursiops truncatus. J Exp Biol 105:275–282
Aroyan JL, Cranford TW, Kent J, Norris KS (1992) Computer mod-eling of acoustic beam formation in Delphinus delphis. J Acoust Soc Am 92:2539–2545
Aroyan JL, McDonald MA, Webb SC, Hildebrand JA, Clark D, Laitman JT, Reidenberg JS (2000) Acoustic models of sound production and propagation. In: Au WWL, Fay RR, Popper AN (eds) Hearing by whales and dolphins. Springer, New York, pp 409–469
Au WWL, Moore PWB, Martin SW (1987) Phantom electronic target for dolphin sonar research. J Acoust Soc Am 82:711–713
Au WWL, Houser DS, Finneran JJ, Lee W-J, Talmadge LA, Moore PW (2010) The acoustic field on the forehead of echolocating Atlantic bottlenose dolphins (Tursiops truncatus). J Acoust Soc Am 128:1426–1434. https://doi.org/10.1121/1.3372643
Beedholm K, Miller LA, Blanchet M-A (2006) Auditory brainstem response in a harbor porpoise show lack of automatic gain con-trol for simulated echoes. J Acoust Soc Am 119:EL41-EL46
Blomqvist C, Amundin M (2004) High-frequency burst-pulse sounds in agonistic/aggressive interactions in bottlenose dolphins, Tursiops truncatus. In: Thomas JA, Moss CF, Vater M (eds) Echolocation in bats and dolphins. University of Chicago Press, Chicago, pp 425–431
Branstetter BK, Moore PW, Finneran JJ, Tormey MN, Aihara H (2012) Directional properties of bottlenose dolphin (Tursiops truncatus) clicks, burst-pulse, and whistle sounds. J Acoust Soc Am 131:1613–1621
Bullock TH, Ridgway SH (1972) Evoked potentials in the central auditory system of alert porpoises to their own and artificial sounds. J Neurobiol 3:79–99
Cozzi B, Huggenberger S, Oelschläger H (2017) Anatomy of dol-phins: insights into body structure and function. Academic Press, London
Cranford TW (1992) Functional morphology of the odontocete fore-head: implications for sound generation. Dissertation, Univer-sity of California Santa Cruz
Cranford TW (1999) The sperm whale’s nose: sexual selection on a grand scale? Mar Mammal Sci 15:1133–1157
Cranford TW (2000) In search of impulse sound sources in odon-tocetes. In: Au WWL, Popper AN, Fay RR (eds) Hearing by whales and dolphins. Springer, New York, pp 109–156
Cranford TW, Amundin M, Norris KS (1996) Functional morphol-ogy and homology in the odontocete nasal complex: implica-tions for sound generation. J Morph 228:223–285
Cranford TW et al (2011) Observation and analysis of sonar signal generation in the bottlenose dolphin (Tursiops truncatus): evi-dence for two sonar sources. J Exp Mar Biol Ecol 407:81–96. https://doi.org/10.1016/j.jembe.2011.07.010
Diercks KJ, Trochta RT, Greenlaw CF, Evans WE (1971) Recording and analysis of dolphin echolocation signals. J Acoust Soc Am 49:1729–1732
Dumitru D, Jewett DL (1993) Far-field potentials. Muscle Nerve 16:237–254. https://doi.org/10.1002/mus.880160302
Elemans CP, Mead AF, Jakobsen L, Ratcliffe JM (2011) Superfast muscles set maximum call rate in echolocating bats. Science 333:1885–1888. https://doi.org/10.1126/science.1207309
Erbe C, Reichmuth C, Cunningham K, Lucke K, Dooling R (2016) Communication masking in marine mammals: a review and research strategy. Mar Pollut Bull 103:15–38. https://doi.org/10.1016/j.marpolbul.2015.12.007
Finneran JJ, Houser DS, Moore PW, Branstetter BK, Trickey JS, Ridgway SH (2010) A method to enable a bottlenose dolphin (Tursiops truncatus) to echolocate while out of water. J Acoust Soc Am 128:1483–1489. https://doi.org/10.1121/1.3471915
Finneran JJ, Mulsow J, Houser DS (2013) Auditory evoked poten-tials in a bottlenose dolphin during moderate-range echolocation tasks. J Acoust Soc Am 134:4532–4547
Finneran JJ, Branstetter BK, Houser DS, Moore PW, Mulsow J, Martin C, Perisho S (2014) High-resolution measurement of a bottlenose dolphin’s (Tursiops truncatus) biosonar transmis-sion beam pattern in the horizontal plane. J Acoust Soc Am 136:2025–2038
Finneran JJ, Echon R, Mulsow J, Houser DS (2016) Short-term enhancement and suppression of dolphin auditory evoked responses following echolocation click emission. J Acoust Soc Am 140:296–307
Finneran JJ, Mulsow J, Houser DS, Schlundt CE (2017) Neural repre-sentation of the self-heard biosonar click in bottlenose dolphins (Tursiops truncatus). J Acoust Soc Am 141:3379–3395
Gootzen THJM. (1990) Muscle fibre and motor unit action potentials: a biophysical basis for clinical electromyography. University of Nijmegen, Nijmegen
Harper CJ, McLellan WA, Rommel SA, Gay DM, Dillaman RM, Pabst DA (2008) Morphology of the melon and its tendinous connec-tions to the facial muscles in bottlenose dolphins (Tursiops trun-catus). J Morph 269:820–839
Henson OW Jr (1965) The activity and function of the middle-ear mus-cles in echo-locating bats. J Physiol 180:871–887
Heyning JE, Mead JG (1990) Evolution of the nasal antomy of ceta-ceans. In: Thomas JA, Kastelein RA (eds) Sensory abilities of cetaceans: laboratory and field evidence. Plenum Press, New York, pp 67–79
Johnson CS (1967) Sound detection thresholds in marine mammals. In: Tavolga WN (ed) Marine bioacoustics. Pergamon Press, Oxford, pp 247–260
Li S, Nachtigall PE, Breese M (2011) Dolphin hearing during echolo-cation: evoked potential responses in an Atlantic bottlenose dol-phin (Tursiops truncatus). J Exp Biol 214:2027–2035. https://doi.org/10.1242/jeb.053397
Linnenschmidt M, Beedholm K, Wahlberg M, Højer-Kristensen J, Nachtigall PE (2012) Keeping returns optimal: gain control exerted through sensitivity adjustments in the harbour porpoise auditory system. Proc R Soc B 279:2237–2245. https://doi.org/10.1098/rspb.2011.2465
Madsen PT, Wisniewska D, Beedholm K (2010) Single source sound production and dynamic beam formation in echolocating harbour porpoises (Phocoena phocoena). J Exp Biol 213:3105–3110
Madsen PT, Jensen FH, Carder DA, Ridgway SH (2012) Dolphin whis-tles: a functional misnomer revealed by heliox breathing. Biol Lett 8:211–213. https://doi.org/10.1098/rsbl.2011.0701
Madsen PT, Lammers M, Wisniewska D, Beedholm K (2013) Nasal sound production in echolocating delphinids (Tursiops truncatus and Pseudorca crassidens) is dynamic, but unilateral: clicking on the right side and whistling on the left side. J Exp Biol 216:4091–4102. https://doi.org/10.1242/jeb.091306
Makeig S, Onton J (2009) ERP features and EEG dynamics: an ICA perspective. In: Luck S, Kappenman E (eds) Oxford handbook
283Journal of Comparative Physiology A (2018) 204:271–283
1 3
of event-related potential components. Oxford University Press, New York
Mead JG (1975) Anatomy of the external nasal passages and facial complex in the delphinidae (mammalia: Cetacea). In: Smithsonian contributions to zoology. Smithsonian Institution Press, Wash-ington, pp 1–72
Palmer E, Weddell G (1964) The relationship between structure, inner-vation and function of the skin of the bottlenosed dolphin (Tursi-ops truncatus). Proc Zool Soc Lond 143:553–568
Picton TW (2011) Human auditory evoked potentials. Plural Publish-ing, San Diego
Popov V, Supin AY (1990) Electrophysiological studies of hearing in some cetaceans and a manatee. In: Thomas JA, Kastelein RA (eds) Sensory abilities in cetaceans. Plenum Press, New York, pp 405–415
Prahl S, Huggenberger S, Schliemann H (2009) Histological and ultrastructural aspects of the nasal complex in the harbor por-poise, Phocoena phocoena. J Morph 270:1320–1337. https://doi.org/10.1002/jmor.10760
Ridgway SH, Au WWL (1999) Hearing and echolocation: dolphin. In: Adelman G, Smith BH (eds) Elsevier’s encyclopedia of neurosci-ence. Elsevier Science, New York, pp 858–862
Ridgway SH, Carder DA (1988) Nasal pressure and sound produc-tion in an echolocating white whale, Delphinapterus leucas. In: Nachtigall PE, Moore PWB (eds) Animal sonar processes and per-formance. Plenum Publishing Corporation, New York, pp 53–60
Ridgway SH, Carder DA, Green RF, Gaunt AS, Gaunt SLL, Evans WE (1980) Electromyographic and pressure events in the nasolaryn-geal system of dolphins during sound production. In: Busnel RG, Fish JF (eds) Animal sonar systems. Plenum Press, New York, pp 239–250
Ridgway SH, Bullock TH, Carder DA, Seeley RL, Woods D, Galambos R (1981) Auditory brainstem response in dolphins. Neurobiology 78:1943–1947
Ridgway S, Keogh M, Carder D, Finneran J, Kamolnick T, Todd M, Goldblatt A (2009) Dolphins maintain cognitive performance during 72 to 120 h of continuous auditory vigilance. J Exp Biol 212:1519–1527
Ridgway S, Samuelson Dibble D, Van Alstyne K, Price D (2015) On doing two things at once: dolphin brain and nose coordinate sonar clicks, buzzes and emotional squeals with social sounds during fish capture. J Exp Biol 218:3987–3995. https://doi.org/10.1242/jeb.130559
Rome LC, Syme DA, Hollingworth S, Lindstedt SL, Baylor SM (1996) The whistle and the rattle: the design of sound producing muscles. Proc Natl Acad Sci 93:8095–8100
Simmons JA (1973) The resolution of target range by echolocating bats. J Acoust Soc Am 54:157–173
Suga N, Jen PH (1975) Peripheral control of acoustic signals in the auditory system of echolocating bats. J Exp Biol 62:277–311
Supin AY, Nachtigall PE (2013) Gain control in the sonar of odon-tocetes. J Comp Physiol A 199:471–478. https://doi.org/10.1007/s00359-012-0773-7
Supin AY, Nachtigall PE, Pawloski J, Au WWL (2003) Evoked poten-tial recording during echolocation in a false killer whale Pseu-dorca crassidens. J Acoust Soc Am 113:2408–2411
Supin AY, Nachtigall PE, Breese M (2008) Forward masking as a mechanism of automatic gain control in odontocete biosonar: a psychophysical study. J Acoust Soc Am 124:648–656. https://doi.org/10.1121/1.2918544
Suthers RA, Fattu JM (1973) Mechanisms of sound production by echolocating bats. Am Zool 13:1215–1226. https://doi.org/10.1093/icb/13.4.1215
Suzuki JI, Cohen B (1966) Integration of semicircular canal activity. J Neurophysiol 29:981–995
Thometz NM et al (2017) Comparative physiology of vocal muscula-ture in two odontocetes, the bottlenose dolphin (Tursiops trun-catus) and the harbor porpoise (Phocoena phocoena). J Comp Physiol B. https://doi.org/10.1007/s00360-017-1106-5
Wever EG, Vernon JA (1961) The protective mechanisms of the bat’s ear. Ann Otol Rhinol Laryngol 70:5–17
Wisniewska DM, Johnson M, Nachtigall PE, Madsen PT (2014) Buzz-ing during biosonar-based interception of prey in the delphinids Tursiops truncatus and Pseudorca crassidens. J Exp Biol. https://doi.org/10.1242/jeb.113415


![Shape Analysis of Somatosensory Evoked Potentials to ... · factors directly into the spinal cord of immunized rats [1]. Somatosensory evoked potential (SEP) is a reliable electrophysiological](https://static.fdocuments.in/doc/165x107/5f89ea2013c4ba6194512750/shape-analysis-of-somatosensory-evoked-potentials-to-factors-directly-into-the.jpg)