Electrolytic extraction drives volatile fatty acid chain ...
14
Andersen et al. Biotechnol Biofuels (2015) 8:221 DOI 10.1186/s13068-015-0396-7 RESEARCH Electrolytic extraction drives volatile fatty acid chain elongation through lactic acid and replaces chemical pH control in thin stillage fermentation Stephen J. Andersen 1* , Pieter Candry 1 , Thais Basadre 1 , Way Cern Khor 1 , Hugo Roume 1 , Emma Hernandez‑Sanabria 1 , Marta Coma 1,2 and Korneel Rabaey 1 Abstract Background: Volatile fatty acids (VFA) are building blocks for the chemical industry. Sustainable, biological produc‑ tion is constrained by production and recovery costs, including the need for intensive pH correction. Membrane electrolysis has been developed as an in situ extraction technology tailored to the direct recovery of VFA from fermen‑ tation while stabilizing acidogenesis without caustic addition. A current applied across an anion exchange membrane reduces the fermentation broth (catholyte, water reduction: H 2 O + e − → ½ H 2 + OH − ) and drives carboxylate ions into a clean, concentrated VFA stream (anolyte, water oxidation: H 2 O → 2e − + 2 H + + O 2 ). Results: In this study, we fermented thin stillage to generate a mixed VFA extract without chemical pH control. Membrane electrolysis (0.1 A, 3.22 ± 0.60 V) extracted 28 ± 6 % of carboxylates generated per day (on a carbon basis) and completely replaced caustic control of pH, with no impact on the total carboxylate production amount or rate. Hydrogen generated from the applied current shifted the fermentation outcome from predominantly C2 and C3 VFA (64 ± 3 % of the total VFA present in the control) to majority of C4 to C6 (70 ± 12 % in the experiment), with identical proportions in the VFA acid extract. A strain related to Megasphaera elsdenii (maximum abundance of 57 %), a bacteria capable of producing mid‑chain VFA at a high rate, was enriched by the applied current, alongside a stable commu‑ nity of Lactobacillus spp. (10 %), enabling chain elongation of VFA through lactic acid. A conversion of 30 ± 5 % VFA produced per sCOD fed (60 ± 10 % of the reactive fraction) was achieved, with a 50 ± 6 % reduction in suspended solids likely by electro‑coagulation. Conclusions: VFA can be extracted directly from a fermentation broth by membrane electrolysis. The electrolytic water reduction products are utilized in the fermentation: OH − is used for pH control without added chemicals, and H 2 is metabolized by species such as Megasphaera elsdenii to produce greater value, more reduced VFA. Electro‑ fermentation displays promise for generating added value chemical co‑products from biorefinery sidestreams and wastes. Keywords: Carboxylate platform, Chain elongation, Biorefinery, Extraction, Electro‑fermentation, Membrane electrolysis © 2015 Andersen et al. This article is distributed under the terms of the Creative Commons Attribution 4.0 International License (http://creativecommons.org/licenses/by/4.0/), which permits unrestricted use, distribution, and reproduction in any medium, provided you give appropriate credit to the original author(s) and the source, provide a link to the Creative Commons license, and indicate if changes were made. The Creative Commons Public Domain Dedication waiver (http://creativecommons.org/ publicdomain/zero/1.0/) applies to the data made available in this article, unless otherwise stated. Open Access Biotechnology for Biofuels *Correspondence: [email protected] 1 Laboratory of Microbial Ecology and Technology (LabMET), Ghent University, Coupure Links 653, Building A, Room A0.092, B‑9000 Ghent, Belgium Full list of author information is available at the end of the article
Transcript of Electrolytic extraction drives volatile fatty acid chain ...
Andersen et al. Biotechnol Biofuels (2015) 8:221 DOI 10.1186/s13068-015-0396-7
RESEARCH
Electrolytic extraction drives volatile fatty acid chain elongation through lactic acid and replaces chemical pH control in thin stillage fermentationStephen J. Andersen1*, Pieter Candry1, Thais Basadre1, Way Cern Khor1, Hugo Roume1, Emma Hernandez‑Sanabria1, Marta Coma1,2 and Korneel Rabaey1
Abstract
Background: Volatile fatty acids (VFA) are building blocks for the chemical industry. Sustainable, biological produc‑tion is constrained by production and recovery costs, including the need for intensive pH correction. Membrane electrolysis has been developed as an in situ extraction technology tailored to the direct recovery of VFA from fermen‑tation while stabilizing acidogenesis without caustic addition. A current applied across an anion exchange membrane reduces the fermentation broth (catholyte, water reduction: H2O + e− → ½ H2 + OH−) and drives carboxylate ions into a clean, concentrated VFA stream (anolyte, water oxidation: H2O → 2e− + 2 H+ + O2).
Results: In this study, we fermented thin stillage to generate a mixed VFA extract without chemical pH control. Membrane electrolysis (0.1 A, 3.22 ± 0.60 V) extracted 28 ± 6 % of carboxylates generated per day (on a carbon basis) and completely replaced caustic control of pH, with no impact on the total carboxylate production amount or rate. Hydrogen generated from the applied current shifted the fermentation outcome from predominantly C2 and C3 VFA (64 ± 3 % of the total VFA present in the control) to majority of C4 to C6 (70 ± 12 % in the experiment), with identical proportions in the VFA acid extract. A strain related to Megasphaera elsdenii (maximum abundance of 57 %), a bacteria capable of producing mid‑chain VFA at a high rate, was enriched by the applied current, alongside a stable commu‑nity of Lactobacillus spp. (10 %), enabling chain elongation of VFA through lactic acid. A conversion of 30 ± 5 % VFA produced per sCOD fed (60 ± 10 % of the reactive fraction) was achieved, with a 50 ± 6 % reduction in suspended solids likely by electro‑coagulation.
Conclusions: VFA can be extracted directly from a fermentation broth by membrane electrolysis. The electrolytic water reduction products are utilized in the fermentation: OH− is used for pH control without added chemicals, and H2 is metabolized by species such as Megasphaera elsdenii to produce greater value, more reduced VFA. Electro‑fermentation displays promise for generating added value chemical co‑products from biorefinery sidestreams and wastes.
Keywords: Carboxylate platform, Chain elongation, Biorefinery, Extraction, Electro‑fermentation, Membrane electrolysis
© 2015 Andersen et al. This article is distributed under the terms of the Creative Commons Attribution 4.0 International License (http://creativecommons.org/licenses/by/4.0/), which permits unrestricted use, distribution, and reproduction in any medium, provided you give appropriate credit to the original author(s) and the source, provide a link to the Creative Commons license, and indicate if changes were made. The Creative Commons Public Domain Dedication waiver (http://creativecommons.org/publicdomain/zero/1.0/) applies to the data made available in this article, unless otherwise stated.
Open Access
Biotechnology for Biofuels
*Correspondence: [email protected] 1 Laboratory of Microbial Ecology and Technology (LabMET), Ghent University, Coupure Links 653, Building A, Room A0.092, B‑9000 Ghent, BelgiumFull list of author information is available at the end of the article
Page 2 of 14Andersen et al. Biotechnol Biofuels (2015) 8:221
BackgroundThe chemical industry requires a broad range of carbon-based building blocks and platform chemicals, many of which can be generated sustainably through microbial conversions from sugar, lignocellulosic biomass, and carbon dioxide [1–4]. Anaerobic microbial conversions increasingly contribute to the production of sustainable, non-fuel chemicals. In chemistry, greater value is associ-ated with more reactive functional groups [4]. Non-fuel compounds, on average, are priced fifteen times higher per ton than fuels [3], though most anaerobic biotechnol-ogy success stories to date are those of bulk bio-fuels such as biogas and alcohols. These chemicals are generally recovered through gas separation or with petrochemical era separation technologies such as distillation and sol-vent extraction [5]. Though these technologies are mature and well developed for a broad range of chemicals, they are not broadly suited to biologically constrained titers in complex broths, particularly where extensive dewatering is required. The high energy and capital investment often fatally weaken the economics and sustainability of bulk biochemical production. This issue is compounded when production is constrained by a complex substrate, such as agro-industrial sidestreams and waste.
Production and recovery of compounds from a com-plex substrate of mixed organics require a strategy that includes both the conversion of non-ideal substrates and the targeted separation of products from fractions with overlapping physico-chemical characteristics (e.g. hydro-phobicity, volatility) [6, 7]. Volatile fatty acids (VFA) are attractive yet challenging in both substrate conversion and separation, as VFA: (1) are ubiquitously formed as intermediates during the decomposition of organic mat-ter, typically as a mixture of many VFA; (2) are hydro-philic at a more neutral pH and hydrophobic at low pH, allowing solvent extraction; and (3) have a charged
carboxyl group under more neutral conditions, allowing electrical motility. Industrially, short-chain linear satu-rated VFA such as acetic (C2), propionic (C3) and butyric (C4) acid are mostly produced thermochemically. Tar-geting bio-production of VFA for use as bulk chemicals or chemical precursors (e.g. for conversion to solvents, fuels, polymers) is known as the Carboxylate Platform [8, 9], and is often associated with second generation biorefinery processes and sustainable substrates such as syngas, and agro-industrial residues and sidestreams. Separation and recovery technology is recognized as a major challenge within the Carboxylate Platform due to the aforementioned unit operation technological hur-dles, but also due to product inhibition [10, 11]. Short to mid-chain VFA (C6–C8) acids are toxic at relatively low concentrations, but are commonly targeted for their high added value. Chain elongation to caproic acid (C6) has been demonstrated with mixed microbial communities on both synthetic feed and real streams, with Clostridium kluyveri and Ruminococci often identified as key players in the microbial community [12–17]. Megasphaera elsde-nii has been shown to generate caproic acid from sugars and lactate as a pure culture [18–21]. Active removal of caproic and heptanoic acid is critical in sustaining pro-duction [15, 17, 20].
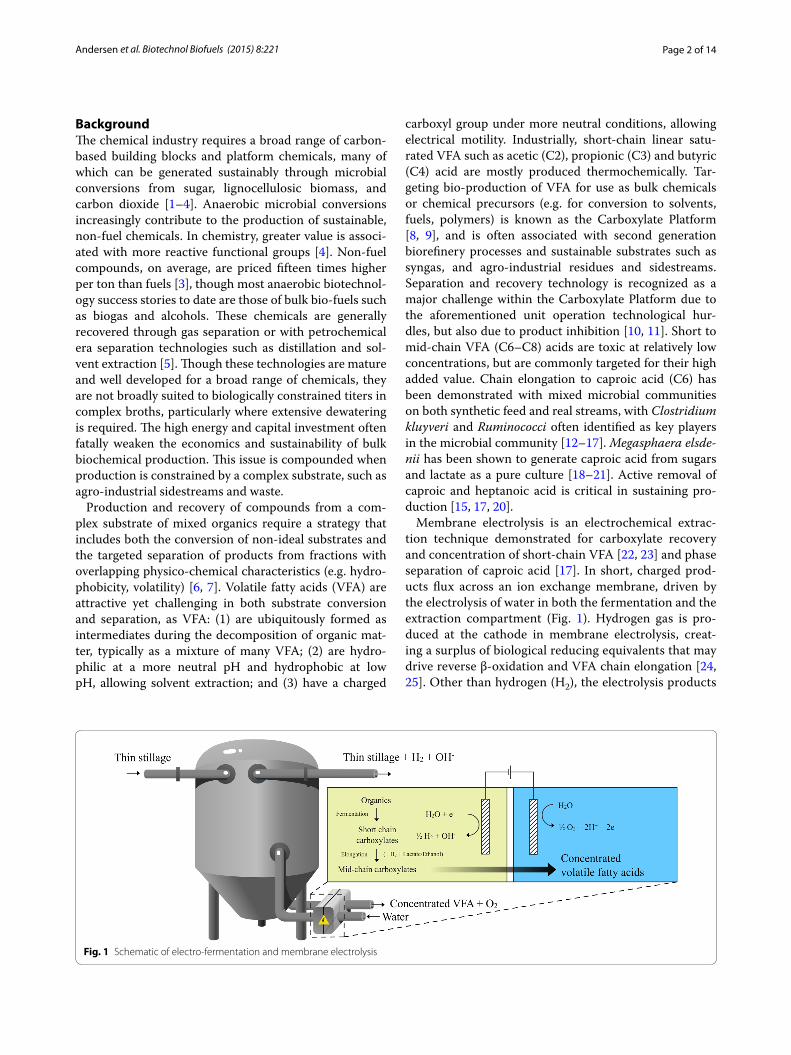
Membrane electrolysis is an electrochemical extrac-tion technique demonstrated for carboxylate recovery and concentration of short-chain VFA [22, 23] and phase separation of caproic acid [17]. In short, charged prod-ucts flux across an ion exchange membrane, driven by the electrolysis of water in both the fermentation and the extraction compartment (Fig. 1). Hydrogen gas is pro-duced at the cathode in membrane electrolysis, creat-ing a surplus of biological reducing equivalents that may drive reverse β-oxidation and VFA chain elongation [24, 25]. Other than hydrogen (H2), the electrolysis products
Fig. 1 Schematic of electro‑fermentation and membrane electrolysis
Page 3 of 14Andersen et al. Biotechnol Biofuels (2015) 8:221
of protons (H+) and hydroxide ions (OH-) can be utilized as acid and base without the addition of salts. Hydrox-ide can counter acidogenic fermentation, while protons generated at the anode acidify the extracted carboxy-late, allowing acid accumulation [17, 22, 23]. Andersen et al. demonstrated acetate extraction in a synthetic broth with a high extraction efficiency for a concentra-tion of around 10 g L−1, with efficiency decreasing at lower concentrations [22]. Gildemyn et al. demonstrated combined acetate production (microbial electrosynthe-sis) and extraction with membrane electrolysis, using homoacetogens enriched for hydrogen metabolism and low applied current [23]. Xu et al. used membrane elec-trolysis to extract, acidify and phase separate caproic acid from a chain elongation reactor; however, the mem-brane electrolysis was separated from the broth by two units (solids separation, liquid–liquid membrane extrac-tion) and did not interact directly with the fermentation [17].
The unconverted organic fraction of bioethanol pro-duction from food crops is a rich, untapped source of complex organic compounds [26, 27], with as much as half or more of the carbon entering the system remaining unconverted [3]. This unconverted fraction is most com-monly directed toward distillers grains (also known as ‘dried distillers grains with solubles’, DDGS), a low value agricultural feed product that is an integral co-product in modern bioethanol refineries [28, 29]. In this study, we target thin stillage, the liquid fraction separated from the whole stillage (the distillation column bottoms in a bioethanol production). Though it varies depending on the size and operation of the plant, thin stillage is gen-erated in the vicinity of 105 tons per year per plant and retains a high portion of solids, between 0.1 and 1 %, that are directed back to the production of DDGS after dewatering. Targeting the fermentation of thin stillage allows for a bio-production strategy on an organic rich, low impact stream, and avoids the embedded energy cost (e.g. distillation) in performing VFA chain elongation with recovered VFA and ethanol or lactic substrates.
Petrochemical era extractions typically sit downstream of the production process, while membrane electrolysis interacts directly with the fermentation for maximum utility of the input energy. It is therefore critical that the process implications of membrane electrolysis on the fer-mentation are understood in detail. Our study explored the impact of in situ membrane electrolysis on VFA fer-mentation of a real, untreated biorefinery stream. We characterized the impact of the electrolysis products (hydrogen, hydroxide) on thin stillage and the fermenta-tive bacterial community native to this stream. We relate this to changes in the fermentation process, and discuss how this may impact sustainable VFA production.
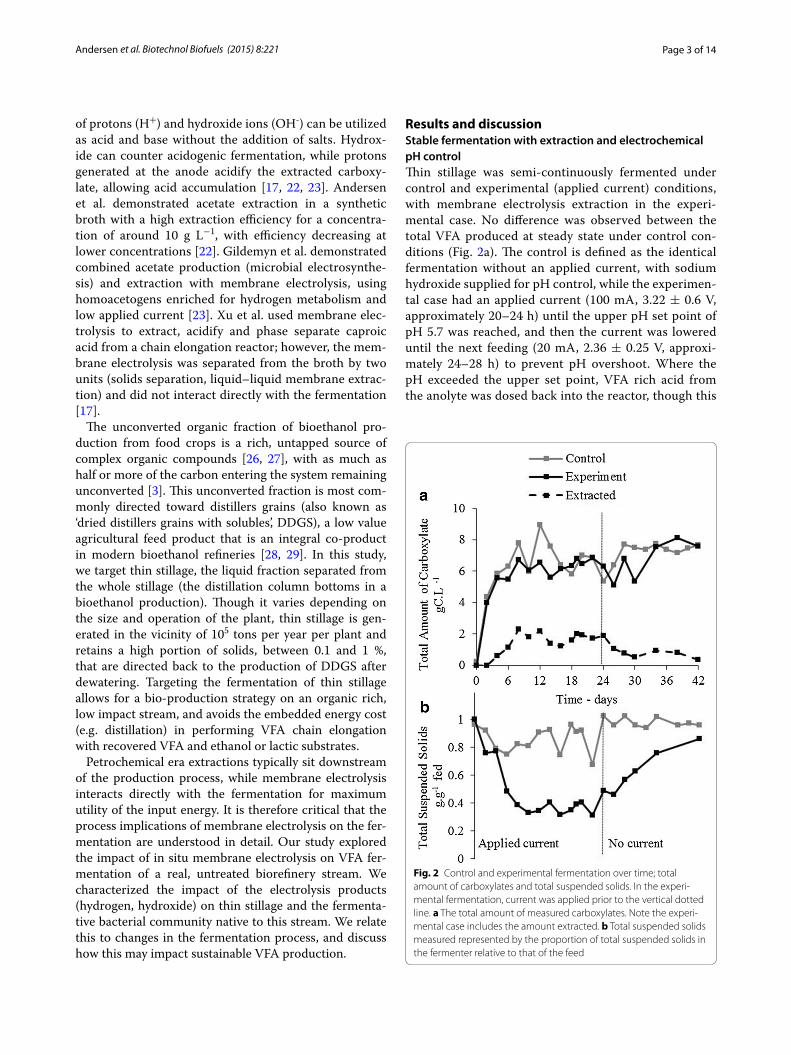
Results and discussionStable fermentation with extraction and electrochemical pH controlThin stillage was semi-continuously fermented under control and experimental (applied current) conditions, with membrane electrolysis extraction in the experi-mental case. No difference was observed between the total VFA produced at steady state under control con-ditions (Fig. 2a). The control is defined as the identical fermentation without an applied current, with sodium hydroxide supplied for pH control, while the experimen-tal case had an applied current (100 mA, 3.22 ± 0.6 V, approximately 20–24 h) until the upper pH set point of pH 5.7 was reached, and then the current was lowered until the next feeding (20 mA, 2.36 ± 0.25 V, approxi-mately 24–28 h) to prevent pH overshoot. Where the pH exceeded the upper set point, VFA rich acid from the anolyte was dosed back into the reactor, though this
Fig. 2 Control and experimental fermentation over time; total amount of carboxylates and total suspended solids. In the experi‑mental fermentation, current was applied prior to the vertical dotted line. a The total amount of measured carboxylates. Note the experi‑mental case includes the amount extracted. b Total suspended solids measured represented by the proportion of total suspended solids in the fermenter relative to that of the feed
Page 4 of 14Andersen et al. Biotechnol Biofuels (2015) 8:221
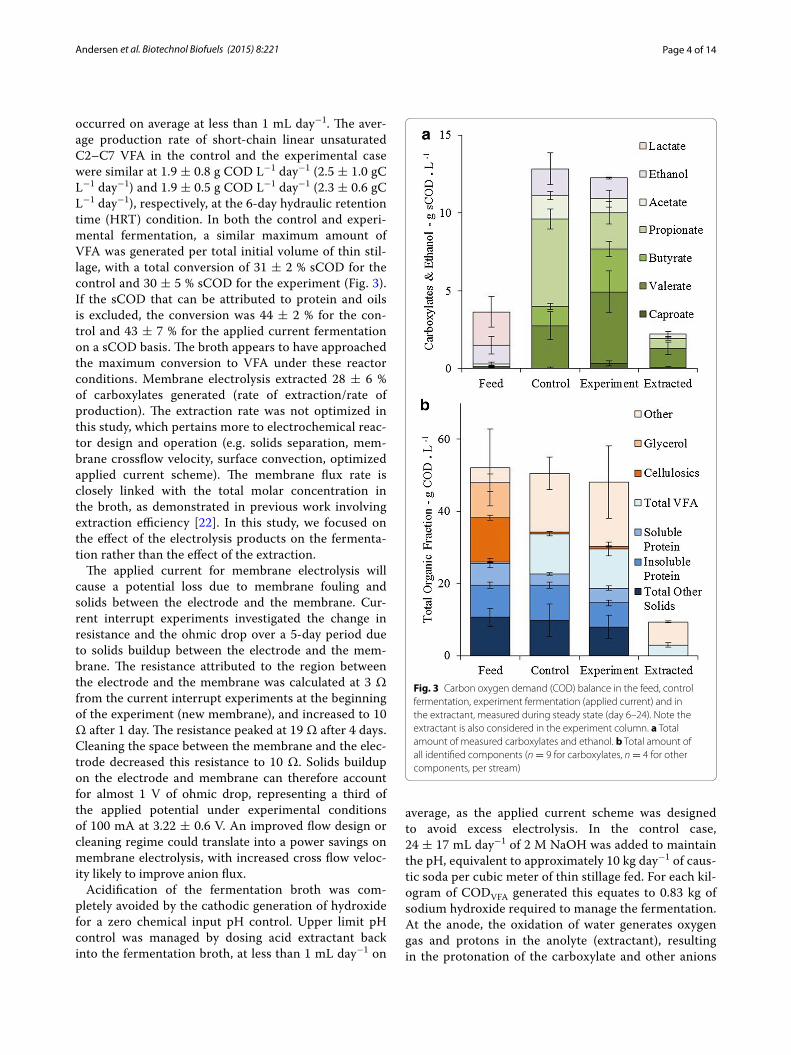
occurred on average at less than 1 mL day−1. The aver-age production rate of short-chain linear unsaturated C2–C7 VFA in the control and the experimental case were similar at 1.9 ± 0.8 g COD L−1 day−1 (2.5 ± 1.0 gC L−1 day−1) and 1.9 ± 0.5 g COD L−1 day−1 (2.3 ± 0.6 gC L−1 day−1), respectively, at the 6-day hydraulic retention time (HRT) condition. In both the control and experi-mental fermentation, a similar maximum amount of VFA was generated per total initial volume of thin stil-lage, with a total conversion of 31 ± 2 % sCOD for the control and 30 ± 5 % sCOD for the experiment (Fig. 3). If the sCOD that can be attributed to protein and oils is excluded, the conversion was 44 ± 2 % for the con-trol and 43 ± 7 % for the applied current fermentation on a sCOD basis. The broth appears to have approached the maximum conversion to VFA under these reactor conditions. Membrane electrolysis extracted 28 ± 6 % of carboxylates generated (rate of extraction/rate of production). The extraction rate was not optimized in this study, which pertains more to electrochemical reac-tor design and operation (e.g. solids separation, mem-brane crossflow velocity, surface convection, optimized applied current scheme). The membrane flux rate is closely linked with the total molar concentration in the broth, as demonstrated in previous work involving extraction efficiency [22]. In this study, we focused on the effect of the electrolysis products on the fermenta-tion rather than the effect of the extraction.
The applied current for membrane electrolysis will cause a potential loss due to membrane fouling and solids between the electrode and the membrane. Cur-rent interrupt experiments investigated the change in resistance and the ohmic drop over a 5-day period due to solids buildup between the electrode and the mem-brane. The resistance attributed to the region between the electrode and the membrane was calculated at 3 Ω from the current interrupt experiments at the beginning of the experiment (new membrane), and increased to 10 Ω after 1 day. The resistance peaked at 19 Ω after 4 days. Cleaning the space between the membrane and the elec-trode decreased this resistance to 10 Ω. Solids buildup on the electrode and membrane can therefore account for almost 1 V of ohmic drop, representing a third of the applied potential under experimental conditions of 100 mA at 3.22 ± 0.6 V. An improved flow design or cleaning regime could translate into a power savings on membrane electrolysis, with increased cross flow veloc-ity likely to improve anion flux.
Acidification of the fermentation broth was com-pletely avoided by the cathodic generation of hydroxide for a zero chemical input pH control. Upper limit pH control was managed by dosing acid extractant back into the fermentation broth, at less than 1 mL day−1 on
average, as the applied current scheme was designed to avoid excess electrolysis. In the control case, 24 ± 17 mL day−1 of 2 M NaOH was added to maintain the pH, equivalent to approximately 10 kg day−1 of caus-tic soda per cubic meter of thin stillage fed. For each kil-ogram of CODVFA generated this equates to 0.83 kg of sodium hydroxide required to manage the fermentation. At the anode, the oxidation of water generates oxygen gas and protons in the anolyte (extractant), resulting in the protonation of the carboxylate and other anions
Fig. 3 Carbon oxygen demand (COD) balance in the feed, control fermentation, experiment fermentation (applied current) and in the extractant, measured during steady state (day 6–24). Note the extractant is also considered in the experiment column. a Total amount of measured carboxylates and ethanol. b Total amount of all identified components (n = 9 for carboxylates, n = 4 for other components, per stream)

Page 5 of 14Andersen et al. Biotechnol Biofuels (2015) 8:221
(phosphate, chloride, sulfate, etc.) that have crossed the AEM.
The experimental reactor decreases in total suspended solids (TSS) relative to the control case after current is applied (Fig. 2b), stabilizing at 0.36 ± 0.04 g.g−1 TSS fed, relative to the control case of 0.86 ± 0.11 g.g−1 TSS fed in the control case during the steady state (solids content is reported here as grams per liter of TSSReactor/gram per liter of TSSFeed fed due to inconsistency of solids in the fed thin stillage, i.e. minimum 14 g TSS L−1, maximum 25 g TSS L−1.) The total suspended solids in the control stabilized at a rate of 0.7 ± 1.4 g TSS L−1 day−1 compared to the applied current case which decreased at an aver-age rate of 3.9 ± 1.9 g TSS L−1 day−1 in the steady state period from day 8 to day 24. This corresponds to a 4.5 times greater decrease in suspended solids, albeit with large variability. The current was stopped at day 24 to confirm the effect. The stoppage coincided with the sus-pended solids concentration returning to that of the feed. No equivalent decrease in the measured solids COD nor increase in measured soluble cellulosic fragments or VFA production was observed. This phenomenon is likely related to electro-coagulation, in which the applied cur-rent is neutralizing suspended particles, resulting in the formation of coagulated particles [30]. Some evidence to support this is revealed in nitrogen analysis, where 85 ± 6 % of total fed nitrogen remains in the broth in the control case, whereas 71 ± 5 % of total fed nitrogen is measured in the broth in the experimental case, with this difference accounted for mainly in the insoluble nitrogen compounds. Protein or lignin polymers can form colloids at high pH, which may adsorb at the high local pH on the cathode surface, or settle within the electrochemical cell. More research is required into the electro-coagulation phenomenon and the implication for the bacteria and their access to the substrate. If membrane electrolysis is applied in a similar broth in which conversion of solids are targeted, it is not clear if the apparent electro-coag-ulation will have an effect on the ability of the microbial community to metabolize these solids.
Fermentation and chain elongation of the soluble fraction to carboxylatesThe COD balance of the thin stillage fermentation revealed that membrane electrolysis resulted in a shift in the fermentation of VFA, from a majority C2 and C3 (64 ± 5 % C2 and C3, 36 ± 2 % C4–C6, as an average per-centage of the total carboxylates on a COD basis during steady state, n = 10) to a majority of C4 to C6 (30 ± 5 % C2–C3, 70 ± 12 % C3–C6) without a change in the total amount of VFA on a COD basis (Fig. 3a). The proportion of acetate was lower in the applied current case than in the control, but only slightly and not significantly across
all measured time points during the steady state (n = 10) (14 ± 2 % control, 8 ± 5 % with current). The propor-tion of propionate decreased from 51 ± 6 to 21 ± 7 % with current. The proportion of butyrate was greater under applied current (11 ± 2 % control, 25 ± 7 % with current), with a similar trend with valerate (25 ± 8 % control, 42 ± 11 % with current), and caproate (0 ± 1 % control, 3 ± 2 % with current). The extent of chain elon-gation can be compared as “chain elongation equivalents”, the concentration of carbon (gC L−1) at steady state that has been added through a chain elongation pathway on the theoretical assumption that all VFA start at either acetate (C2) or propionate (C3). The extent of VFA chain elongation at steady state in the applied current case was 2.6 ± 0.6 gC L−1 of chain elongation equivalents, signifi-cantly higher than the control case at 1.4 ± 0.4 gC L−1 (t test: α = 0.05, p = 1.9 × 10⁻⁴, n = 10).
Only a fraction of the feed was converted to VFA. This fraction is referred to here as the “reactive fraction” (Fig. 3b). The reactive fraction consisted of soluble cel-lulosic fragments (or ‘Sugars’), consisting of 4.4 ± 0.6 g L−1 glucose, 4.2 ± 0.5 g L−1 xylose and 2.9 ± 0.4 g L−1 arabinose (in total 12.3 ± 0.7 gCOD L−1); and glycerol (9.8 ± 2.4 gCOD L−1), lactate (2.1 ± 1.0 gCOD L−1), and C1 to C8 carboxylates (0.3 ± 0.2 gCOD L−1). The remainder of the thin stillage consisted of a solid frac-tion of proteins (8.9 ± 0.9 gCOD L−1) and other ligno-cellulosic solids (10.6 ± 2.5 gCOD L−1), a soluble COD fraction (sCOD) of protein (6.1 ± 1.3 gCOD L−1), and an assumed balance fats, oils and other biomass (4.2 gCOD L−1), in good agreement with a previous thin still-age characterization [27]. Membrane electrolysis did not alter any of the other main components characterized in this study (Fig. 3b). Zhou et al. studied glycerol fermenta-tion with applied current, resulting in a mixed outcome with approximately 15–30 % of the carbon ending as VFA (mostly propionate), 20 % ending as biomass, 3–6 % as ethanol and 20–50 % as 1,3-propanediol [31]. Insignifi-cant quantities of 1,3-propanediol were detected in this study, and propanol and butanol were detected at less than 1 gCOD L−1 each. Phenolic compounds were identi-fied in the feed and fermentations at 1.2 g L−1. Both the control and applied current case showed no net increase of ethanol in the broth from 1.2 ± 0.6 gCOD L−1 fed to 1.7 ± 1.0 gCOD L−1 and 1.3 ± 0.1 gCOD L−1, respec-tively. Phenolic compounds were detected in the extract-ant in trace quantities.
Soluble cellulosic fragments, glycerol and lactate were consumed equally in both the control and experimental reactors (Fig. 3b). In the control, this resulted in predom-inantly acetate and propionate. Lactate is present in the fed thin stillage and can be used to elongate acetate to butyrate, as can ethanol [16]. Approximately 0.14 gC L−1
Page 6 of 14Andersen et al. Biotechnol Biofuels (2015) 8:221
day−1 of lactate and 0.05 gC L−1 day−1 of ethanol enter the system by feeding. This fed lactate and ethanol can account for the chain elongation of C2 and C3 species to C4 and longer, assuming all carboxylates of C4 and longer are a result of chain elongation. The control case needs a total of 0.2 gC L−1 day−1 to elongate C2 and C3, compared with the applied current case which requires 0.7 gC L−1 day−1.
Increased organic loading and current lead to increased VFA productionA brief, secondary experiment tested the system under doubled organic loading rate and a constant applied cur-rent of 100 mA, resulting in a 5.5 times increase in the VFA production rate to 10.4 ± 1.1 gCODVFA L−1 day−1. The disproportional increase in production can be par-tially attributed to removing the substrate limitation, in addition to the constant supply of hydrogen gas to the fermentation. The VFA production rate was 10.4 ± 1.9 g COD L−1 day−1 (3.3 ± 0.6 gC L−1 day−1), at an extrac-tion of 26 ± 5 % of produced VFA. The conversion rate of sCOD was also higher at 60 ± 11 % of the total sCOD fed, or 86 ± 16 % of the reactive fraction, with a higher proportion of C6 and now also C7 VFA. In the previous experiment, heptanoic acid (C7) was not detected (Addi-tional file 1: Figure SI 1). The constant current appears to have increased the total conversion of the reactive fraction. The greater supply of hydrogen gas (per liter of reactor volume), 66 mmol L−1 day−1 compared with 25 mmol L−1 day−1 in the first experiment, resulted in a lower concentration of butyrate at 8 ± 0 % and valer-ate at 19 ± 1 % of the C2–C7 VFA. The proportion of caproate was 11 ± 6 %, compared to 3 ± 6 % in the previ-ous experiment, and heptanoate at 1 ± 0 % (Additional file 1: Figure SI 1). The chain elongation equivalents increased relative to hydrogen generation, though not proportionally (Additional file 1: Figure SI 2). This sug-gests that the high organic loading rate and high current case (Additional file 1: Exp II, Figure SI 2) were either under excess hydrogen or the hydrogen was escaping the system before it could be utilized. Short-term batch tests at a range of applied current (Additional file 1: Fig-ure SI 2B) showed a similar trend for total carbon chain elongation equivalents generated in the broth, where even though the applied current is doubled from 100 to 200 mA, the total chain elongation equivalents only increased incrementally.
In this high loading, constant current experiment, the volume of the extractant was halved and operated in batch to demonstrate acid accumulation and mimic a more realistic recovery strategy. A maximum concen-tration of 11.7 gC L−1 was reached in the anolyte, com-pared with the maximum of 2.3 gC L−1 in the previous
experiment (Additional file 1: Figure SI 1). Phenolic acids were concentrated at up to 2.5 g L−1. Phosphoric acid (H3PO4, pH <1) accumulated at up to a maximum of 4.1 g L−1 and hydrochloric acid to 1.6 g L−1.
Membrane electrolysis favors hydrogen metabolizing fermentersThe fermentation was initiated without an inoculum, and thus only organisms native to the thin stillage were culti-vated. Lactobacillus spp. represented a relative abundance between 96 and 99 % of the bacteria at time zero and in the thin stillage fed throughout the experiment, with Hal-lella sp. and others making up the balance (Additional file 1: Figure SI 5, Table SI 1). Lactobacillus spp. abundance swiftly diminished in the control case to a maximum rela-tive abundance of 1 %, and moved to a dominance of Hal-lella sp., with a relative abundance of 65 % after 2 days and a maximum relative abundance of 94 %, and an average of 75 ± 21 % across the whole experiment. The Hallella sp. dominance was similar to the applied current case with an average abundance of 42 ± 26 % across the whole experi-ment. The next most abundant species in the control case were Dialister sp. and Megasphaera sp., both of the fam-ily Veillonellaceae. Dialister sp. had a relative abundance between 3 and 26 %, with an average across all measured time points of 13 ± 8 %. Megasphaera sp. had a relative abundance between 1 and 5 %, with an average of 3 ± 2 %. The applied current case contained Dialister sp. at a simi-lar relative abundance to the control case at between 0 and 22 %, with an average of 11 ± 7 % across the whole experiment. The greatest difference between the control and experimental case arose from the abundance of Lac-tobacillus spp. and Megasphaera sp. The Megasphaera sp. was present with a relative abundance between 0 and 57 %, with an average of 15 ± 21 % (n = 9, at steady state). Lac-tobacillus spp. in the applied current case slowly decreased over the first 8 days and was then present between 6 and 17 % from day 8 to 24, in stark contrast to the control case of between 0 and 1 %. Pectinatus sp., Bifidobacterium sp. and Prevotella sp. are also present in the applied current case at a relative abundance of up to at least 5 %, which is similar to the control case with the exception of Pectina-tus sp. which never exceeded 0.7 %. The Lactobacillus spp. had a minimum abundance under applied current of 5.9 % and a maximum of 67.0 %, compared to the control case with a minimum of 0.0 % and a maximum of 1.3 % (ignor-ing t = 0, at which both had greater than 99 % abundance of Lactobacillus spp., identical to the feed). In the control case, the Lactobacillus spp. dropped from 99 % to a rela-tive abundance of 1.3 % after 2 days. The time point of the greatest abundance of the Megasphaera sp. (57 %, Addi-tional file 1: Figure SI 3 and SI 4) coincided with a slight increase in Lactobacillus spp. and an increase in chain
Page 7 of 14Andersen et al. Biotechnol Biofuels (2015) 8:221
elongation, albeit following a slump possibly related to competition with Pectinatus sp. (Additional file 1: Figure SI 3 and SI 4). Day 14 of the applied current fermenta-tion coincided with a low point of chain elongation in the steady state fermentation, a high relative abundance of Pectinatus sp., and the Hallella sp. maximum. In a brief period where Pectinatus outcompeted Megasphaera, mini-mal C4–C6 carboxylates were produced and a peak of pro-pionate was observed (Additional file 1: Figure SI 4).
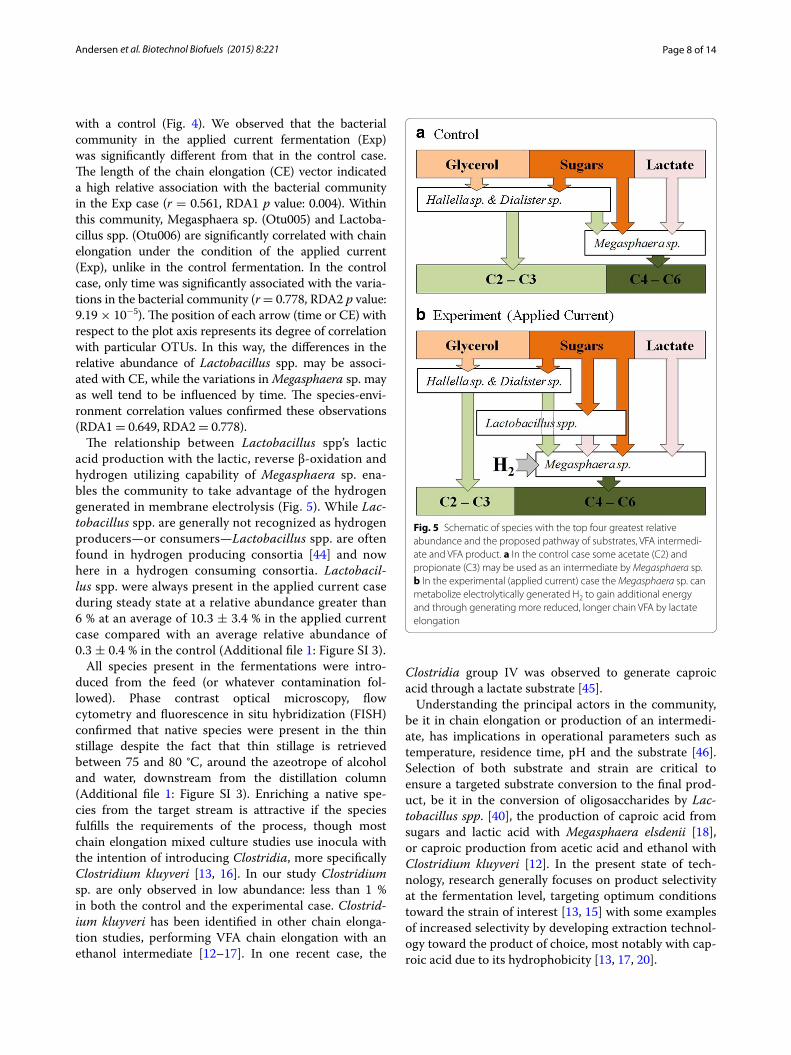
Soluble cellulosic fragments, glycerol and lactate were consumed in both the control and experimental reactors (Fig. 3a). In the control, this resulted in predominantly acetate and propionate while with an applied current a greater concentration of mid-chain VFA was observed (Figs. 3a, 5). Megasphaera sp. can ferment glucose, lactate and short-chain VFA toward short to mid-chain VFA, alongside CO2 and H2 [18], while the majority of the other bacteria of high relative abundance produce short chain VFA and intermediates. Hallella sp, consistently the most abundant species, is known to produce acetate and succinate, that latter of which can be decarboxylated to propionate, or lactate [32]. Dialister is a non-ferment-ing bacillus [32] and its consistent abundance alongside Hallella suggests that it may have produced propionate from succinate. Neither Hallella nor Dialister have been associated with longer chain carboxylates [32, 33]. Bifi-dobacterium sp. produces lactate and acetate [34], Prevo-tella sp. mainly produces acetate and succinate, with a slight production of iso-butyrate and iso-valerate [35] while Pectinatus sp. is associated with the production of acetic and propionic acid [36, 37]. Pectinatus sp. has been observed to produce propionate from glycerol at a bio-logical cathode [38].
Reverse β-oxidation VFA chain elongation with lactic acid has been described in Megasphaera elsdenii [16], and Lactobacillus spp., can produce lactic acid from a variety of substrates [39, 40]. The butyrate, valerate and caproate in both the control and applied current fermen-tation (Fig. 3a) were likely generated by Megasphaera sp. through the following pathway [18, 19]:
Megasphaera sp. stands out as one of few bacteria in these consortia with a high relative abundance that is known to generate mid-chain VFA, and there is evidence here to suggest that it was able to utilize hydrogen from membrane electrolysis to drive VFA chain elongation. Megasphaera sp. was the only species whose relative abundance correlated positively with the concentration
Lactate− + Acetate− + H+→ n-Butyrate− + CO2 + H2O;
∆G0= −59.43 kJ mol−1 at 37 ◦C
Lactate− + Propionate− + H+→ Valerate− + CO2 + H2O
Lactate− + Butyrate− + H+→ Caproate− + CO2 + H2O
of chain elongation equivalents (i.e. extent of VFA chain elongation) by the Pearson correlation test (R = 0.63, p = 0.04) in the applied current case, whereas no correla-tion can be seen in the control case (R = 0.05, p = 0.89). When compared in the RAST database, 100 % similar-ity was found with “Megasphaera NP3,” a sequenced species closely related to Megasphaera elsdenii (RAST, http://rast.nmpdr.org/). Megasphaera NP3 contains genes for fatty acid production, glycolysis/gluconeogen-esis and β-oxidation metabolism (for VFA chain elon-gation), along with genes for four NiFe hydrogenase mettalocenter assembly proteins, which makes it a good candidate for the ability to metabolize hydrogen [41]. Organisms that are both capable of reverse β-oxidation VFA chain elongation and hydrogen oxidation could gain energy by an increase of intracellular hydrogen which leads to an increase in NADH and NADPH, thus driving VFA reduction [2, 16, 24, 25, 41, 42, 43]. In this case, the majority of hydrogen was generated extracellularly in situ by membrane electrolysis and then transported into the cell to drive the so-called electro-fermentation.
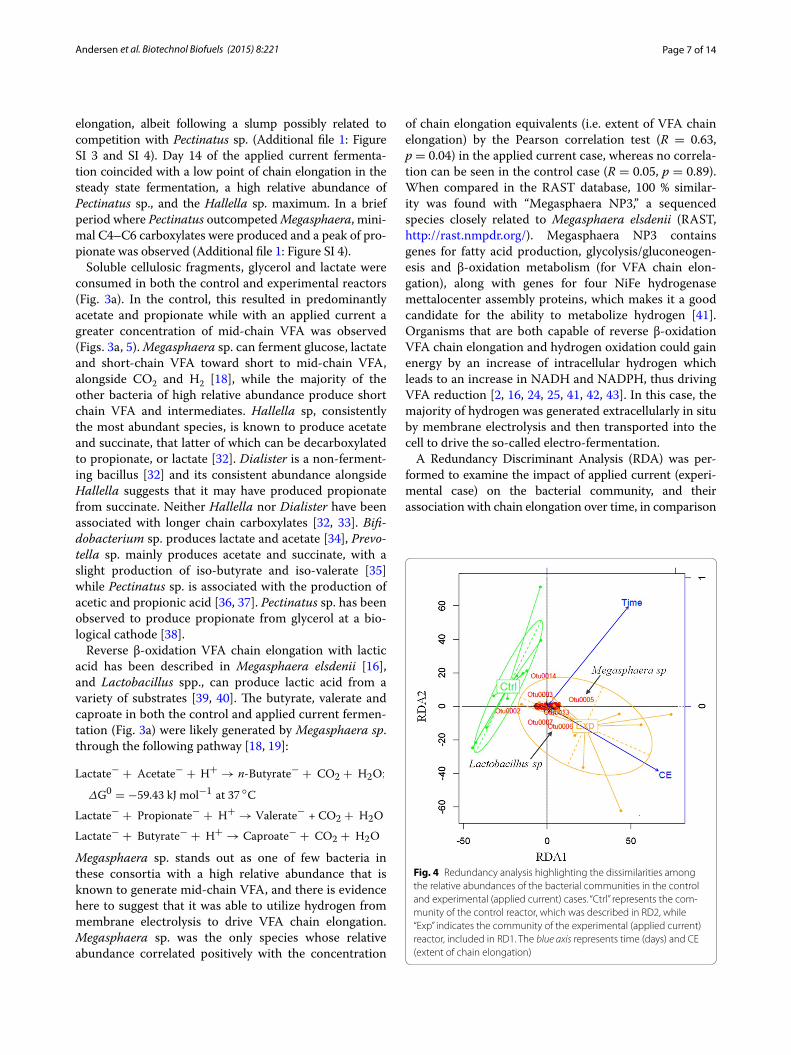
A Redundancy Discriminant Analysis (RDA) was per-formed to examine the impact of applied current (experi-mental case) on the bacterial community, and their association with chain elongation over time, in comparison
Fig. 4 Redundancy analysis highlighting the dissimilarities among the relative abundances of the bacterial communities in the control and experimental (applied current) cases. “Ctrl” represents the com‑munity of the control reactor, which was described in RD2, while “Exp” indicates the community of the experimental (applied current) reactor, included in RD1. The blue axis represents time (days) and CE (extent of chain elongation)
Page 8 of 14Andersen et al. Biotechnol Biofuels (2015) 8:221
with a control (Fig. 4). We observed that the bacterial community in the applied current fermentation (Exp) was significantly different from that in the control case. The length of the chain elongation (CE) vector indicated a high relative association with the bacterial community in the Exp case (r = 0.561, RDA1 p value: 0.004). Within this community, Megasphaera sp. (Otu005) and Lactoba-cillus spp. (Otu006) are significantly correlated with chain elongation under the condition of the applied current (Exp), unlike in the control fermentation. In the control case, only time was significantly associated with the varia-tions in the bacterial community (r = 0.778, RDA2 p value: 9.19 × 10⁻⁵). The position of each arrow (time or CE) with respect to the plot axis represents its degree of correlation with particular OTUs. In this way, the differences in the relative abundance of Lactobacillus spp. may be associ-ated with CE, while the variations in Megasphaera sp. may as well tend to be influenced by time. The species-envi-ronment correlation values confirmed these observations (RDA1 = 0.649, RDA2 = 0.778).
The relationship between Lactobacillus spp’s lactic acid production with the lactic, reverse β-oxidation and hydrogen utilizing capability of Megasphaera sp. ena-bles the community to take advantage of the hydrogen generated in membrane electrolysis (Fig. 5). While Lac-tobacillus spp. are generally not recognized as hydrogen producers—or consumers—Lactobacillus spp. are often found in hydrogen producing consortia [44] and now here in a hydrogen consuming consortia. Lactobacil-lus spp. were always present in the applied current case during steady state at a relative abundance greater than 6 % at an average of 10.3 ± 3.4 % in the applied current case compared with an average relative abundance of 0.3 ± 0.4 % in the control (Additional file 1: Figure SI 3).
All species present in the fermentations were intro-duced from the feed (or whatever contamination fol-lowed). Phase contrast optical microscopy, flow cytometry and fluorescence in situ hybridization (FISH) confirmed that native species were present in the thin stillage despite the fact that thin stillage is retrieved between 75 and 80 °C, around the azeotrope of alcohol and water, downstream from the distillation column (Additional file 1: Figure SI 3). Enriching a native spe-cies from the target stream is attractive if the species fulfills the requirements of the process, though most chain elongation mixed culture studies use inocula with the intention of introducing Clostridia, more specifically Clostridium kluyveri [13, 16]. In our study Clostridium sp. are only observed in low abundance: less than 1 % in both the control and the experimental case. Clostrid-ium kluyveri has been identified in other chain elonga-tion studies, performing VFA chain elongation with an ethanol intermediate [12–17]. In one recent case, the
Clostridia group IV was observed to generate caproic acid through a lactate substrate [45].
Understanding the principal actors in the community, be it in chain elongation or production of an intermedi-ate, has implications in operational parameters such as temperature, residence time, pH and the substrate [46]. Selection of both substrate and strain are critical to ensure a targeted substrate conversion to the final prod-uct, be it in the conversion of oligosaccharides by Lac-tobacillus spp. [40], the production of caproic acid from sugars and lactic acid with Megasphaera elsdenii [18], or caproic production from acetic acid and ethanol with Clostridium kluyveri [12]. In the present state of tech-nology, research generally focuses on product selectivity at the fermentation level, targeting optimum conditions toward the strain of interest [13, 15] with some examples of increased selectivity by developing extraction technol-ogy toward the product of choice, most notably with cap-roic acid due to its hydrophobicity [13, 17, 20].
Fig. 5 Schematic of species with the top four greatest relative abundance and the proposed pathway of substrates, VFA intermedi‑ate and VFA product. a In the control case some acetate (C2) and propionate (C3) may be used as an intermediate by Megasphaera sp. b In the experimental (applied current) case the Megasphaera sp. can metabolize electrolytically generated H2 to gain additional energy and through generating more reduced, longer chain VFA by lactate elongation

Page 9 of 14Andersen et al. Biotechnol Biofuels (2015) 8:221
Co‑products support biorefinery economicsThe VFA as presented in this study are intended as an added value co-product, similar to distiller grains in bioethanol production, though their production can incur considerable base and acid costs. Membrane elec-trolysis is an immature technology and a complete eco-nomic analysis is premature, but the hydroxide output can be compared against the potential cost associated with caustic soda dosing in biological VFA production, particularly from organic waste streams. The control fermentation in this experiment required 0.83 kg caus-tic per 1 kg CODVFA produced. Consider caproic acid as an attractive target product at around 1000 USD t−1 unrefined, and up to 2000–3000 USD t−1 refined (price assumptions here are based on discussions with industry partners and may vary). Assuming a conservative price of 300 USD t−1 of caustic, if the 0.83 kg caustic per 1 kg CODVFA ratio holds and all the CODVFA generated in this study could be directed to caproic acid (2.21 tCOD per 1 t caproic acid), then 1.83 t of caustic soda (550 USD) would be required for 1 t caproic acid. For unre-fined caproic, this is more than half the market price, and 18.3–27.5 % for the refined caproic acid price range. pH control may indeed be further optimized, but this control fermentation on real thin stillage demonstrates the clear and present issue of a high caustic dosing requirement. Moreover, the caustic dosing is required to maintain the fermentation in the biocompatible range for production, and to acquire an acid product, considerable acidification may be needed. The production of OH− and H+ by mem-brane electrolysis avoids caustic and acidic dosing, and also avoids salts entering the fermentation and extract-ant. The membrane electrolysis route has a cost associ-ated with power input, which is approximately 2 kWh per kg CODVFA based on these experiments. Assuming 0.05 USD kWh−1 electricity cost, this is around 100 USD t−1
COD, though we stress this is specific to these experimen-tal conditions. This includes the caustic correction and, unlike the control case, extraction and acidification. If the issue of solids buildup between the electrode and the membrane can be avoided and the theoretical power sav-ing of 30 % holds, the power cost comes to 70 USD t−1
COD. In principle this power input can come from renewables to improve the sustainability argument. Note that these calculations disregard downstream processing, which can be capital and energy intensive when separating com-pounds with similar properties, such as mixed VFA. For industrial, bulk chemicals, high product selectivity is crit-ical to the economics of recovery and purification.
The reactive fraction of thin stillage is attractive as a target substrate as the cellulosic fragments and glycerol are readily convertible and have little value, though it is important not to detract from the contribution of these
solids to existing production of DDGS. Avoiding degra-dation of solids is attractive in market in demand of live-stock feed, as thin stillage is generally dewatered with the solids and syrup contributing to the production of DDGS, a low value but critical co-product whose value is linked to protein and fiber content. At this stage, it appears that membrane electrolysis allows most solids and proteins to pass without degradation. The apparent electro-coagulation effect may improve the prospects for solids recovery, though this is speculative, as the mecha-nism is scarcely documented.
ConclusionsIn this work, we have demonstrated the impact of mem-brane electrolysis, a chemical-free extraction technology, on the fermentation of an under-utilized, real biorefinery stream to generate reduced VFA. This study has shown that membrane electrolysis can result in an increased abundance of Megasphaera sp. and Lactobacillus spp. in thin stillage, resulting in an increase in VFA chain elon-gation through lactic acid, driven by in situ hydrogen generation. Membrane electrolysis can provide a driving force to select for hydrogen metabolisers such as Megas-phaera elsdenii and potentially Clostridium kluyveri or others. In addition to hydrogen, membrane electrolysis generates hydroxide ions which can replace the extensive caustic dosing typical of VFA production.
A central tenet of this work is to move from chemical and heat intensive petrochemical processes, as chemicals and heat both imply embedded petrochemical energy. Membrane electrolysis is electricity driven, and can only be a sustainable technology if this electricity can be sourced sustainably. To move forward, an electro-fer-mentation should be performed at industrially relevant production and recovery rates. The overall sustainability with respect to the input power and the materials of the system must be critically assessed to confirm that mem-brane electrolysis can give an added value to the fermen-tation and chain elongation of sustainable VFA. Beyond sustainability, practicality and economics of scale are crucial to a new industrial biotechnology. Minimizing the electrode and membrane material relative to fermenter volume, and maximizing efficient use of power input will be crucial to transition to an industrial scale, with some lessons to be learned from full scale electrochemistry such as electrodialysis and the Chlor-Alkali process.
MethodsFermenter and electrochemical cellIn all experiments, semi-continuous fermenta-tion was coupled with a continuous electrochemi-cal membrane electrolysis. Multi-ported vessels of 1 L were used as fermenters (Glasgerätebau Ochs
Page 10 of 14Andersen et al. Biotechnol Biofuels (2015) 8:221
Laborfachhandel e.K., Germany) connected to electro-chemical cells as described previously with a volume of 0.2 L per electrode chamber, internal dimensions 200 mm × 50 mm × 20 mm (depth) [23]. The total work-ing liquid volume was 1.2 L, accounting for both the fer-menter, the electrochemical cell and tubing. The anolyte was circulated from a 1 L schott bottle to the electro-chemical cell, with an identical working volume of 1.2 L. The chambers were separated by an AEM (fumasep FAB, FumaTech GmbH, Germany). The cathode was an AISI Type 316L stainless steel wire mesh of 200 mm × 50 mm exposed working area with 564 µm mesh size, 140 µm wire thickness (Solana nv, Belgium), and the anode was an iridium mixed metal oxide coated titanium electrode (IrO2/TaO2: 0.65/0.35), 200 mm × 50 mm, with a cen-trally attached, perpendicular current collector (Magneto Special Anodes BV, The Netherlands). The catholyte and anolyte consisted in the fermentation broth and tap water (extractant), respectively. The electrolysis reactions con-sume water (catholyte, water reduction: H2O + e− → ½ H2 + OH−; anolyte, water oxidation: H2O → 2e− + 2 H+ + O2); however, assuming complete efficiency at the maximum current used here of 100 mA this would account for a 1.6 g of water per day from the catholyte and 0.8 g per day from the anolyte. Both were recircu-lated in their respective compartment at 6 L h−1 by peri-staltic pump. In the control case, the pH was controlled between pH 5.4 (2 M NaOH dosing) and 5.7 (2 M H2SO4 dosing), whereas in the experimental case (with applied current), the pH was controlled between 5.4 and 5.7 by electrochemical water reduction and dosing with the acidified extractant in case of pH overshoot. The current was applied by a potentiostat (VSP, Biologic, France) in chronopotentiometry mode. The current was manually adjusted according to pH of the fermentation broth. Fol-lowing feeding, an applied current of 100 mA (i.e. 10 A m−2) was applied for the first 20–24 h, or until pH 5.7 was reached. The pH controller would automatically dose acidic extractant from the previous period to return the pH below the set point. A maintenance period followed at which 20 mA was applied until the next feeding event as to minimize dosing of acidified extractant into the broth. All experiments were performed in a 35 °C tem-perature controlled room.
In the first experiment, 400 mL of the reactor volume was replaced with thin stillage at 2-day intervals for an equal HRT and solids retention time (SRT) of 6 days. The 6-day HRT/SRT was chosen to allow good conver-sion of substrate and sufficient time for adaption of the community to the conditions. The fermentation broth and the extractant were replenished at the same rate and the reactors were sampled every 2 days before feeding. After a steady state was reached the experimental cell
was operated for four HRTs. The applied current was removed after 24 days to confirm the negation of the effect.
In the second experiment, the current was applied and the residence time of the fermentation broth was decreased to 3 days by replacing 400 mL of reactor vol-ume daily, and sampling daily. The extractant volume was decreased to 600 mL from 1200 mL and operated in batch mode during this experiment, to mimic more realistic operation of extractant concentration and accumulation.
Supplementary batch tests explored a range of applied currents in which the reactor and extraction cell were filled with thin stillage and run for 6 days for each run. The reactors were emptied and refilled between each test. The applied current was set at 0.1 mA for the no current case, 50 mA (5 A m−1), 100 mA (10 A m−1) and 200 mA (200 A m−1) and the pH was controlled between pH 5.4 and 5.7 with 2 M NaOH and 2 M H2SO4. The AEM was replaced between each test and reactor components were scrubbed with a brush and tap water only to limit cross-contamination.
Microbial characterization and community analysisDNA extraction was performed using a PowerSoil DNA extraction kit (MO BIO Laboratories, USA) accord-ing to Roume et al. [47]. Biomass has first been concen-trated by centrifugation in sterile 2 mL bead beating Micrewtubes (Simport, Canada) for 1 min at 20,238g. The protocol consists of cell lysis by bead beating in 2 mL Microtubes bead beating tubes and lysis buffer, in a Fast Prep-96 instrument (2 times 40 s at 1600 rpm) followed by removal by precipitation of diverse polymerase chain reaction (PCR) inhibitors according to the manufac-turer’s instructions. Total DNA was captured on a silica membrane incorporated into a chromatographic spin column, washed and then eluted in the dedicated buffer. Concentration of double-stranded DNA was quantified using the QuantiFluor dsDNA system and measured with a GloMax 96 Microplate Luminometer (Promega GmbH, Germany). For quality control, the isolated DNA was amplified by PCR using Illumina sequencing primers and separated by electrophoresis.
The V3–V4 region of the bacterial 16S rRNA gene was sequenced with Illumina sequencing Miseq v3 Rea-gent kit (http://www.illumina.com/products/miseq-reagent-kit-v3.ilmn, by LGC Genomics GmbH, Berlin, Germany) using 2 × 300 bp paired-end reads and prim-ers 341F-785R described by Stewardson et al. [48]. The PCRs included about 5 ng of DNA extract, 15 pmol of each forward primer 341F 5′-NNNNNNNNTC CTACGGGNGGCWGCAG and reverse primer 785R 5′-NNNNNNNNTGACTACHVGGGTATCTAAKCC

Page 11 of 14Andersen et al. Biotechnol Biofuels (2015) 8:221
in 20 µL volume of MyTaq buffer containing 1.5 units MyTaq DNA polymerase (Bioline) and 2 µL of BioSta-bII PCR Enhancer (Sigma). For each sample, the forward and reverse primers had the same 8-nt barcode sequence. PCRs were carried out for 30 cycles using the follow-ing parameters: 2 min 96 °C pre-denaturation; 96 °C for 15 s, 50 °C for 30 s, 72 °C for 60 s. DNA concentration of amplicons of interest was determined by gel electro-phoresis. About 20 ng amplicon DNA of each sample was pooled for up to 48 samples carrying different bar-codes. PCRs showing low yields were further amplified for 5 cycles. The amplicon pools were purified with one volume AMPure XP beads (Agencourt) to remove primer dimer and other small mispriming products, followed by an additional purification on MinElute columns (Qia-gen). About 100 ng of each purified amplicon pool DNA was used to construct Illumina libraries using the Ova-tion Rapid DR Multiplex System 1-96 (NuGEN). Illumina libraries were pooled and size selected by preparative gel electrophoresis. Sequencing was done on an Illumina MiSeq using v3 Chemistry (Illumina).
Bioinformatics was executed with the mothur com-munity analysis pipeline [49]. The analysis started from the primers clipped 16Sr RNA sequences; containing sequences where primers were detected and removed (allowing 2 mismatches) and turn into forward and reverse primer orientation which was later combined using the make.contigs command. The use of this open-source software package involved three sequential steps. The first step consists of the preparation and denoising of sequences, and extraction of the V3–V4 region. Low-quality sequences were removed and the frequency of sequencing and PCR errors reduced. The sequences were first trimmed using screen.seqs command (allow-ing no base name ambiguity and a maximum length of 427 bases). Sequences showing a weak alignment (allow-ing a maximum of four bases in homopolymer) with a V3–V4 customized SILVA database (v119) were removed as well as overhangs at both end of each sequence. The sequences were pre-clustered (allowing a maximum of 4 mismatches per sequence) and chimeric sequences were removed using UCHIME software [50] and sequences have been classifying using RDP v10 database (allow-ing at least a bootstrap value of 65 %) and sequences not identified as bacteria have been removed. The second step of the pipeline consisted of clustering sequences into operational taxonomic units (OTUs). OTU binning was completed using a hierarchical clustering algorithm implemented within mothur and considering a cutoff of 0.03. The third step involved assignment of the taxo-nomic information to sequences and OTUs. The analy-sis was carried out on randomly subsampled OTUs such that each file contained the same number of sequences
(5401). The ade4, stat and psych packages of the R soft-ware (R version 2.13.2, http://www.r-project.org/) were used, respectively, for a principal component analysis (PCA; dudi.pca function), representation of the heatmap (heatmap function) and Pearson coefficient calculation (corr.test function).
For microbial activity analysis from the thin stillage, raw samples were evaluated under an optical microscope (Axioskop, Zeiss) by phase contrast and fluorescence. Fluorescence in situ hybridization (FISH) was performed as described by Anton et al. [52]. Samples were fixed with 4 % paraformaldehyde and stained with probes for gen-eral bacteria domain EUB 338 I, II and III with FLUO fluorophores.
Stream characterization and analysisIn this study we refer to the linear, saturated monocar-boxylate C2–C8 fatty acid conjugates collectively as VFA or individually by the common name of the dissociated anion, e.g. acetate, caproate, when discussing the com-pound in the more neutral fermentation broth. All car-boxylate fermentation is from thin stillage of Alco Bio Fuel NV (Ghent, Belgium) (stored at 4 °C). No inoculum was added, the fermentation proceeded according to the bacterial community already present in the broth. New batches of stillage were periodically retrieved, with one batch requiring dilution to the appropriate COD range to maintain consistent organic loading. Stream characteri-zation confirmed that after dilution the stream remained sufficiently consistent for these experiments, with some variation in solids content. Reported feed concentrations are averages of all feed streams including the diluted stream.
All samples were tested for TSS and VSS accord-ing to Standard Methods 2540D and E [51]. The C2–C8 fatty acids (including isoforms C4–C6) were measured according to Andersen et al. [22]. Management of pH was tracked by mass of acid or base dosed, and gas produc-tion was quantified with an external gas trap and assessed with a Compact Gas Chromatograph (Global Analyser Solutions, Breda, The Netherlands), equipped with a Molsieve 5A pre-column and Porabond column (CH4, O2, H2 and N2) and a Rt-Q-bond pre-column and col-umn (CO2, N2O and H2S). Concentrations of gases were determined by means of a thermal conductivity detector. Eight samples were selected at random from the thin stil-lage feed samples for further characterization: four sam-ples from the control effluent, four from the experimental effluent and four from the extractant during the steady state period with the average reported of the follow-ing analyses: total and soluble COD by Nanocolor® kits (Macherey–Nagel GmbH, Germany); lactate, glycerol, 1,3-propanediol, ethanol, propanol and butanol by ion
Page 12 of 14Andersen et al. Biotechnol Biofuels (2015) 8:221
chromatography (Dionex DX 500); hemicellulosic and cellulosic fragments in the soluble phase (reported in this text as “soluble cellulosic fragments”, as to differentiate from (hemi)cellulosic material in the solids) by the NREL procedure according to Sluiter et al. [53], measured with high-performance liquid chromatography [Agilent Varian ProStar 220 SDM, USA; 5 mM H2SO4 mobile phase, 0.6 mL min−1 and 60 °C column temperature with a refractive index detector and Rezex H + column (Aminex)]; soluble and insoluble proteins by Kjeldahl nitrogen measurements according to Standard methods (4500-Norg B; APHA, 1992) [51], and calculated to pro-tein COD content based on an assumed carbon to nitro-gen ratio of 5:1. The protein measurement is intended only as an indication of changing protein concentrations and not intended as a strict protein quantification. The “Total Other Solids” is based on the difference between the measured total COD and the soluble COD, and its difference from the calculated insoluble protein COD. Non-organic anions chloride, nitrite, nitrate, sulfate and phosphate were determined on a 761 Compact Ion Chromatograph (Metrohm, Switzerland) equipped with a conductivity detector. The total phenolic content was assessed with the Folin Ciocalteu Assay method [54].
Electrochemical analysisThe resistance of the whole cell was assessed by Current Interrupt [55]. 10 mA of current was applied at a period of 100 ms over 10 cycles successively, and the resulting voltage recorded at 0.2 ms intervals. The cell voltage change during the first interval of 0.2 ms is the ohmic drop of Current × Resistance, assuming that faradaic and diffusional processes present much slower relaxation times and therefore do not impact the voltage amplitude.
AbbreviationsVFA: volatile fatty acid; COD: chemical oxygen demand; sCOD: soluble chemi‑cal oxygen demand; DDGS: dried distillers grains with solubles; gC: grams of carbon, i.e. 1 mol of Caproic (C6) Acid = 116.16 g = 6 × 12.01 gC = 72.06 gC; HRT: hydraulic retention time; TSS: total suspended solids; PCR: polymerase chain reaction.
Authors’ contributionsSA designed and executed experiments, interpreted data and drafted the manuscript. PC and TB executed experiments, performed analysis and contributed to data interpretation. WCK was involved in stream characteriza‑tion and contributed to data interpretation. HR and EHS designed, executed and interpreted the microbial community analysis and performed statistical analysis. MC contributed to experimental design and interpretation of data. KR conceived of the study, participated in its design and coordination and
Additional file
Additional file 1.Further information on composition and microbial community abundance in the applied current and control thin stillage fermentations.
contributed to the drafting of the manuscript. All authors read and approved the final manuscript.
Author details1 Laboratory of Microbial Ecology and Technology (LabMET), Ghent University, Coupure Links 653, Building A, Room A0.092, B‑9000 Ghent, Belgium. 2 Present Address: Centre for Sustainable Chemical Technologies, University of Bath, Claverton Down, Bath BA2 7AY, UK.
AcknowledgementsSJA, MC, and KR are supported by Ghent University Multidisciplinary Research Partnership (MRP)—Biotechnology for a sustainable economy (01 MRA 510 W). WCK is supported by Het Bijzonder Onderzoeksfonds (BOF, DEF13/AOF/010). EHS is a postdoctoral fellow supported by the Research Foundation of Flanders (Fonds Wetenschappelijk Onderzoek‑Vlaanderen, FWO). KR and HR are supported by European Research Council Starter Grant ELECTROTALK. Prof Lars Angenent is heartily thanked for his insights and stimulating discus‑sion. Tim Lacoere is warmly thanked for his graphical contribution. Antonin Prévoteau is thanked for the electrochemical analysis and insight, and a critical read of the manuscript, with thanks for the latter also extended to Alberto Scoma and Ruben Props. We thank Alco Bio Fuel nv for generously providing thin stillage.
Competing interestsThe authors declare that they have no competing interests.
Received: 15 October 2015 Accepted: 30 November 2015
References 1. Gavrilescu M, Chisti Y. Biotechnology—a sustainable alternative
for chemical industry. Biotech Adv. 2005;23:471–99. doi:10.1016/j.biotechadv.2005.03.004.
2. Rabaey K, Ronzendal RA. Microbial electrosynthesis—revisiting the elec‑trical route for microbial production. Nat Rev Microbiol. 2010;8:706–16. doi:10.1038/nrmicro2422.
3. Deloitte. Opportunities for the fermentation‑based chemical industry: an analysis of the market potential and competitiveness of North‑West Europe. September 2014; http://www2.deloitte.com/global/en/pages/manufacturing/articles/opportunities‑for‑fermentation‑based‑chemical‑industry.html. Accessed 4th Aug 2015.
4. Wagemann K. Herstellung von Grundchemikalien auf Basis nachwach‑sender Rohstoffe als Alternative zur Petrochemie?/Production of basic chemicals on the basis of renewable resources as alternative to petro‑chemistry? Chelie Ingenieur Technik. 2014;86(12):2115–34. doi:10.1002/cite.201400108.
5. Ramaswamy S, Huang HJ, Ramarao BV. Separation and puri‑fication technologies in biorefineries. Hoboken: Wiley. 2013. doi:10.1002/9781118493441.
6. Percival Zhang YH. What is vital (and not vital) to advance economically‑competitive biofuels production. Process Biochem. 2011;46(11):2091–110. doi:10.1016/j.procbio.2011.08.005.
7. Fava F, Totaro G, Diels L, Reis M, Duarte J, Carioca OB, Poggio‑Varaldo HM, Ferreira BS. Biowaste biorefinery in Europe: opportunities and research and development needs. N Biotechnol. 2015;32(1):100–8. doi:10.1016/j.nbt.2013.11.003.
8. Agler MT, Wrenn BA, Zinder SH, Angenent LT. Waste to bioproduct con‑version with undefined mixed cultures: the carboxylate platform. Trends Biotechnol. 2011;29(2):70–8. doi:10.1016/j.tibtech.2010.11.006.
9. Holtzapple MT, Granda CB. Carboxylate platform: the MixAlco process Part 1: comparison of three biomass conversion platforms. Appl Biochem Biotechnol. 2009;156:525–36. doi:10.1007/s12010‑008‑8466‑y.
10. Yang ST. Bioprocessing for value‑added products from renewable resources: new technologies and applications. USA: Elsevier BV; 2011.
11. López‑Garzón CS, Straathof AJJ. Recovery of carboxylic acids produced by fermentation. Biotech Adv. 2014;32(5):873–904. doi:10.1016/j.biotechadv.2014.04.002.

Page 13 of 14Andersen et al. Biotechnol Biofuels (2015) 8:221
12. Barker HA, Taha SM. Clostridium kluyverii, an Organism concerned in the formation of caproic acid from ethyl alcohol. J Bacteriol. 1942;43(3):347–63.
13. Agler MT, Spirito CM, Usack JG, Werner JJ, Angenent LT. Chain elonga‑tion with reactor microbiomes: upgrading dilute ethanol to medium‑chain carboxylates. Energ Environ Sci. 2012;5(8):8189–92. doi:10.1039/C2EE22101B.
14. Steinbusch KJJ, Hamelers HVM, Plugge CM, Buisman CJN. Biological formation of caproate and caprylate from acetate: fuel and chemical production from low grade biomass. Energ Environ Sci. 2011;4(1):216–24. doi:10.1039/C0EE00282H.
15. Grootscholten TIM, Steinbusch KJJ, Hamelers HVM, Buisman CJN. High rate heptanoate production from propionate and ethanol using chain elongation. Bioresour Technol. 2013;136:715–8. doi:10.1016/j.biortech.2013.02.085.
16. Spirito CM, Richter H, Rabaey K, Stams AJM, Angenent LT. Chain elonga‑tion in anaerobic reactor microbiomes to recover resources from waste. Curr Opin Biotechnol. 2014;27:115–22. doi:10.1016/j.copbio.2014.01.003.
17. Xu J, Guzman JJ, Andersen SJ, Rabaey K, Angenent LT. In‑line and selec‑tive phase separation of medium chain carboxylic acids using membrane electrolysis. Chem Commun. 2015;51:6847–50. doi:10.1039/C5CC01897H.
18. Rogosa M, Transfer of Peptostreptococcus elsdenii Gutierrez, et al. to a new genus, Megasphaera [M. elsdenii (Gutierrez et al.) comb. nov.]. Int J Syst Bacteriol. 1971;21:187–9.
19. Hino T, Shimada K, Maruyama T. Substrate preference in a strain of Megasphaera elsdenii, a ruminal bacterium, and its implications in propionate production and growth competition. Appl Environ Microbiol. 1994;60(6):1827–31.
20. Choi K, Jeon BS, Oh MK, Sang BI. In situ biphasic extractive fermentation for hexanoic acid production from sucrose by Megasphaera elsdenii NCIMB 702410. Appl Biochem Biotechnol. 2013;171(5):1094–107. doi:10.1007/s12010‑013‑0310‑3.
21. Weimer PJ, Moen GN. Quantitative analysis of growth and volatile fatty acid production by the anaerobic ruminal bacterium Megasphaera elsdenii T81. Appl Microbiol Biotechnol. 2013;97(9):4075–81. doi:10.1007/s00253‑012‑4645‑4.
22. Andersen SJ, Hennebel T, Gildemyn S, Coma M, Desloover J, Berton J, Tsu‑kamoto J, Stevens C, Rabaey K. Electrolytic membrane extraction enables production of fine chemicals from biorefinery sidestreams. Environ Sci Technol. 2014;48(12):7135–42. doi:10.1021/es500483w.
23. Gildemyn S, Verbeeck K, Slabbinck R, Andersen SJ, Prevotéau A, Rabaey K. Integrated production, extraction and concentration of acetic acid from CO2 through microbial electrosynthesis. Environ. Sci. Technol. Lett. 2015;2(11):325–8. doi:10.1021/acs.estlett.5b00212.
24. Steinbusch KJJ, Hamelers HVM, Buisman CJN. Alcohol production through volatile fatty acids reduction with hydrogen as electron donor by mixed cultures. Water Res. 2008;42(15):4059–66. doi:10.1016/j.watres.2008.05.032.
25. Angenent LT, Rosenbaum MA. Microbial electrocatalysis to guide biofuel and biochemical bioprocessing. Biofuels. 2013;4(2):131–4. doi:10.4155/bfs.12.93.
26. Kim S, Dale BE. Global potential bioethanol production from wasted crops and crop residues. Biom Bioenerg. 2004;26(4):361–75. doi:10.1016/j.biombioe.2003.08.002.
27. Kim Y, Mosier NS, Hendrickson R, Ezeji T, Blaschek H, Dien B, Cotta M, Dale B, Ladisch MR. Composition of corn dry‑grind ethanol by‑products: DDGS, wet cake and thin stillage. Biores Technol. 2008;99:5165–76. doi:10.1016/j.biortech.2007.09.028.
28. Liu K, Rosentrater KA. Distillers grains: production, properties and utiliza‑tion. Boca Raton: CRC Press; 2012.
29. Lupitskyy R, Staff C, Satyavolu J. Towards integrated biorefinery from dried distillers grains: Evaluation of feed application for Co‑products. Biom Bioenerg. 2015;72:251–5. doi:10.1016/j.biombioe.2014.10.029.
30. Mollah MYA, Morkovsky P, Gomes JAG, Kezmez M, Parga J, Cocke DL. Fundamentals, present and future perspectives of electrocoagulation. J Hazard Mater B. 2004;114:199–210. doi:10.1016/j.jhazmat.2004.08.009.
31. Zhou M, Chen J, Freguia S, Rabaey K, Keller J. Carbon and electron fluxes during the electricity driven 1,3‑propanediol biosynthesis from glycerol. Environ Sci Technol. 2013;47:11199–205. doi:10.1021/es402132r.
32. Moore LVH. Moore WEC. Oribaculum catoniae gen. nov., sp. nov.; Catonella morbi gen. nov., sp. nov.; Hallella seregens gen. nov., sp. nov.; Johnsonella ignava gen. nov., sp. nov.; and Dialister pneumosintes
gen. nov., comb. nov., nom. rev., Anaerobic Gram‑Negative Bacilli from the Human Gingival Crevice. Int J Syst Evol Microbiol. 1994;44:187–92. doi:10.1099/00207713‑44‑2‑187.
33. Jumas‑Bilak E, Hélene JP, Carlier JP, Teyssier C, Bernard K, Gay B, Calpos J, Morio F, Marchandin H. Dialister micraerophilus sp. nov. and Dialister propionicifaciens sp. nov., isolated from human clinical samples. Int J Syst Evol Microbiol. 2005;55:2471–8. doi:10.1099/ijs.0.63715‑0.
34. Sgorbati B, Biavati B, Palenzona D. The genus Bifidobacterium. The genera of lactic acid bacteria; the lactic acid bacteria, vol 2. USA: Springer. 1995. pp. 279–306. doi:10.1007/978‑1‑4615‑5817‑0_8.
35. Shah HN, Collins DM. Prevotella, a new genus to include Bacteroides melaninogenicus and related species formerly classified in the genus bacteroides. Int J Syst Bacteriol. 1990;40(2):205–8.
36. Lee SY, Mabee MS, Jangaard NO. Pectinatus, a new genus of the family Bacteroidaceae. Int J Syst Bacteriol. 1978;28:582–94.
37. Caldwell JM, Juvonen R, Brown J, Breidt F. Pectinatus sottacetonis sp. nov., isolated from a commercial pickle spoilage tank. Int J Syst Evol Microbiol. 2013;63:3609–16. doi:10.1099/ijs.0.047886‑0.
38. Denis PG, Harnisch F, Yeoh YK, Tyson GW, Rabaey K. Dynamics of cathode‑associated microbial communities and metabolite profiles in a glycerol‑fed bioelectrochemical system. Appl Environ Microbiol. 2013;79(13):4008–14. doi:10.1128/AEM.00569‑13.
39. Beijerink MW. Sur les ferments lactiques de l’industrie. Arch Neerl Sci. 1901;II(7):212–43.
40. Gänle MG, Follador R. Metabolism of Oligosaccharides and starch in Lactobacilli: a review. Front Microbiol. 2012;3:340. doi:10.3389/fmicb.2012.00340.
41. Shafaat HS, Rüdiger O, Ogata H, Lubitz W. [NiFe] hydrogenases: a common active site for hydrogen metabolism under diverse condi‑tions. BBA‑Bioenergetics. 2013;1827(8–9):986–1002. doi:10.1016/j.bbabio.2013.01.015.
42. Velt A, Akhtar MK, Mizutani T, Jones PR. Constructing and testing the ther‑modynamic limits of synthetic NAD(P)H:H2 pathways. Microb Biotechnol. 2008;1(5):382–94. doi:10.1111/j.1751‑7915.2008.00033.
43. Kracke F, Krömer JO. Identifying target processes for microbial electrosyn‑thesis by elementary mode analysis. BMC Bioinform. 2014;15(1):410. doi:10.1186/s12859‑014‑0410‑2.
44. Sikora A, Zielenkiewicz U, Blaszczyk M, Jurkowki M. Lactic acid bacteria in hydrogen‑producing consortia: on purpose or by coincidence?, Lactic Acid Bacteria—R & D for Food, Health and Livestock Purposes, Dr. J. Marcelino Kongo (Ed.), InTech, 2013. doi:10.5772/50364.
45. Zhu X, Tao Y, Liang C, Li X, Zhang W, Zhou Y, Tank Y, Bo T. The synthesis of n‑caproate from lactate: a new efficient process for medium‑chain carboxylates production. Sci Rep. 2015;5:14360. doi:10.1038/srep14360.
46. Vanwonterghem I, Jensen PD, Rabaey K, Tyson G. Temperature and solids retention time control microbial population dynamics and volatile fatty acid production in replicated anaerobic digesters. Sci Rep. 2015;5:8496. doi:10.1038/srep08496.
47. Roume H, Muller EEL, Cordes T, Renaut J, Hiller K, Wilmes P. A biomolecu‑lar isolation framework for eco‑systems biology. ISME J. 2013;7:110–21.
48. Stewardson AJ, Gaïa N, François P, Malhotra‑Kumar S, Delémont C, Martinez de Tejada B, Schrenzel J, Harbarth S, Lazarevic V, SATURN WP1 and WP3 Study Groups. Collateral damage from oral ciprofloxacin versus nitrofurantoin in outpatients with urinary tract infections: a culture‑free analysis of gut microbiota. Clin Microbiol Infect. 2015;21(4):344.e1–11. doi:10.1016/j.cmi.2014.11.016.
49. Schloss PD, Westcott SL, Ryabin T, Hall JR, Hartmann M, Hollister EB, Lesniewski RA, Oakley BB, Parks DH, Robinson CJ, Sahl JW, Stres B, Thal‑linger GG, Van Horn DJ, Weber CF. Introducing mothur: open‑source, platform‑independent, community‑supported software for describ‑ing and comparing microbial communities. Appl Environ Microbiol. 2009;75(23):7537–41. doi:10.1128/AEM.01541‑09.
50. Edgar RC, Haas BJ, Clemente JC, Quince C, Knight R. UCHIME improves sensitivity and speed of chimera detection. Bioinformatics. 2011;27(16):2194–200. doi:10.1093/bioinformatics/btr381.
51. APHA. Standard methods for the examination of water and wastewater. Washington DC: American Public Health Association; 2005.
52. Anton JE, Llobet‑Brossa E, Rodriguez‑Valera F, Amann R. Fluorescence in situ hybridization analysis of the prokaryotic community inhabiting crystallizer ponds. Environ Microbiol. 1999;1:517–23.

Page 14 of 14Andersen et al. Biotechnol Biofuels (2015) 8:221
53. Sluiter A, Hames B, Ruiz R, Scarlata C, Sluiter J, Templeton D. Determina‑tion of sugars, byproducts, and degradation products in liquid fraction process samples: laboratory analytical procedure 2006. National Renewable Energy Laboratory; U.S. Department of Energy; NREL/TP‑510‑42623.
54. Swain, T., Goldstein, J.L. Chapter 11—the quantitative analysis of phenolic compounds. In: Methods in polyphenol chemistry, Proceedings of the Plant Phenolics Group Symposium, Oxford, 1964.
55. Bard AJ, Faulkner LR. Electrochemical methods: fundamentals and appli‑cations. 2nd ed. New York: Wiley; 2001.
• We accept pre-submission inquiries
• Our selector tool helps you to find the most relevant journal
• We provide round the clock customer support
• Convenient online submission
• Thorough peer review
• Inclusion in PubMed and all major indexing services
• Maximum visibility for your research
Submit your manuscript atwww.biomedcentral.com/submit
Submit your next manuscript to BioMed Central and we will help you at every step: