MIDI Technical note #101 - Fatty Acid Analysismidi-inc.com/pdf/MIS_Technote_101.pdf · INTRODUCTION...
6
INTRODUCTION For many years, analysis of short chain fatty acids (volatile fatty acids, VFAs) has been routinely used in identification of anaerobic bacteria. In numerous scientific papers, the fatty acids between 9 and 20 carbons in length have also been used to characterize genera and species of bacteria, especially nonfermentative Gram negative organisms. With the advent of fused silica capillary columns (which allows recovery of hydroxy acids and resolution of many isomers), it has become practical to use gas chromatography of whole cell fatty acid methyl esters to identify a wide range of organisms. FATTY ACIDS FOUND IN BACTERIA More than 300 fatty acids and related compounds have been found in bacteria analyzed in the MIDI Research and Development Laboratory. The wealth of information contained in these compounds can be estimated by considering not only the presence or absence of each acid, but also by using the data in quantitative fashion. While the theoretical ability to differentiate among 2 300 different combinations is not practical due to the nonrandom distribution within groups of bacteria, the huge number of fatty acids creates great “naming” power for the Sherlock MIS. Sherlock MIS uses fatty acids 9-20 carbons in length. The peaks are automatically named and quantitated by the system. Branched chain acids predominate in some Gram positive bacteria, while short chain hydroxy acids often characterize the lipopolysaccharides of the Gram negative bacteria. The structures of a few of these compounds are shown in Figure 1 In this note, all compounds will be referred to as fatty acids, even though the actual compounds may be aldehydes, hydro- carbons, or dimethyl acetals, and are typically analyzed as the methyl esters. The system of naming used in this note is to count carbons from the “omega” end (i.e. opposite the carboxyl end) and to indicate the other structures where known. The various combinations of features may result in very large numbers of fatty acids. Though most fatty acid identifications have been confirmed by mass spectroscopy, some are still listed as “unknown” or with a letter designating that the double bond position and/or configuration has not been confirmed. Figure 1. Structure of Fatty Acids Bacterial Identification by Gas Chromatographic Analysis of Fatty Acid Methyl Esters (GC-FAME) Technical Note #101 Myron Sasser May 1990 Last Revised July 2006
Transcript of MIDI Technical note #101 - Fatty Acid Analysismidi-inc.com/pdf/MIS_Technote_101.pdf · INTRODUCTION...
INTRODUCTION
For many years, analysis of short chain fatty acids (volatilefatty acids, VFAs) has been routinely used in identification ofanaerobic bacteria. In numerous scientific papers, the fattyacids between 9 and 20 carbons in length have also beenused to characterize genera and species of bacteria, especiallynonfermentative Gram negative organisms. With the adventof fused silica capillary columns (which allows recovery ofhydroxy acids and resolution of many isomers), it hasbecome practical to use gas chromatography of whole cellfatty acid methyl esters to identify a wide range of organisms.
FATTY ACIDS FOUND IN BACTERIA
More than 300 fatty acids and related compounds havebeen found in bacteria analyzed in the MIDI Research andDevelopment Laboratory. The wealth of information containedin these compounds can be estimated by considering notonly the presence or absence of each acid, but also by usingthe data in quantitative fashion. While the theoretical ability todifferentiate among 2300 different combinations is not practicaldue to the nonrandom distribution within groups of bacteria,the huge number of fatty acids creates great “naming” powerfor the Sherlock MIS.
Sherlock MIS uses fatty acids 9-20 carbons in length. Thepeaks are automatically named and quantitated by the system.Branched chain acids predominate in some Gram positivebacteria, while short chain hydroxy acids often characterizethe lipopolysaccharides of the Gram negative bacteria. Thestructures of a few of these compounds are shown in Figure 1In this note, all compounds will be referred to as fatty acids,even though the actual compounds may be aldehydes, hydro-carbons, or dimethyl acetals, and are typically analyzed as themethyl esters. The system of naming used in this note is tocount carbons from the “omega” end (i.e. opposite the carboxylend) and to indicate the other structures where known. Thevarious combinations of features may result in very largenumbers of fatty acids. Though most fatty acid identificationshave been confirmed by mass spectroscopy, some are stilllisted as “unknown” or with a letter designating that the doublebond position and/or configuration has not been confirmed.
Figure 1. Structure of Fatty Acids
Bacterial Identification by Gas ChromatographicAnalysis of Fatty Acid Methyl Esters (GC-FAME)
Technical Note #101
Myron SasserMay 1990
Last Revised July 2006
CULTURING OF THE BACTERIA
The most stable and reproducible cellular fatty acid profile isachieved by carefully regulating the growth conditions.Several scientific papers have reported the effects of growthtemperature and of different growth media on bacterial fattyacid composition. To minimize these variables, a specifictemperature and growth medium have been chosen for eachlibrary. For example, most aerobic bacteria will grow well onTrypticase Soy Broth Agar (TSBA), which consists of 30gTrypticase Soy Broth and 15g of agar (BBL). Those aerobicbacteria, which will not grow well on TSBA, are grown on themedium which would be most commonly used for theirgrowth in the laboratory (e.g. Legionella on buffered charcoalyeast extract, and Haemophilus on chocolate agar). The tem-perature chosen for the TSBA database was 28°C to enablegrowth of a wide range of organisms. A separate database,CLIN, uses 35°C and blood agar (Trypticase Soy base) as thestandards, with specialized media for specific organisms.
Table 1 Sherlock Standard Libraries
For the anaerobic bacteria, the plate-based dataset uses cultures grown at 35°C on brain-heart infusion with supple-ments. A database containing more than 800 entries wasdeveloped (by the VPI Anaerobe Lab) using overnight cultures from peptone-yeast extract-glucose broth.
The effect of age is minimized in the broth cultures by harvesting at a given turbidity. When using plate cultures, the growth period is 24 hours for aerobes and 48 hours foranaerobes. Standardization of physiological age of culture isobtained by choice of sector from a quadrant streak on theplate (Figure 2). Slow growing organisms may be incubatedfor the period of time necessary to obtain adequate growth.
Figure 2 Quadrant Streak
REAGENTS
Four reagents are required to cleave the fatty acids from lipids:
Reagent 1, Saponification—45g sodium hydroxide,150ml methanol, and 150ml distilled water. Dispensingthrough use of an autopipet assures reproducibility andallows for large numbers of assays in a day.
Reagent 2, Methylation—325ml certified 6.0Nhydrochloric acid and 275ml methyl alcohol. This drops thepH of the solution below 1.5 and causes methylation (for theincreased volatility in a partially polar column) of the fattyacid. The fatty acid methyl ester is poorly soluble in theaqueous phase at this point.
Reagent 3, Extraction—200ml hexane and 200ml methyltert-butyl ether. This will extract the fatty acid methyl estersinto the organic phase for use with the gas chromatograph.
Reagent 4, Sample Cleanup—10.8g sodium hydroxidedissolved in 900ml distilled water. This procedure reducescontamination of the injection port liner, the column, and thedetector. More than 10,000 analyses can be performed on acolumn prior to needing any maintenance.
SAMPLE PROCESSING
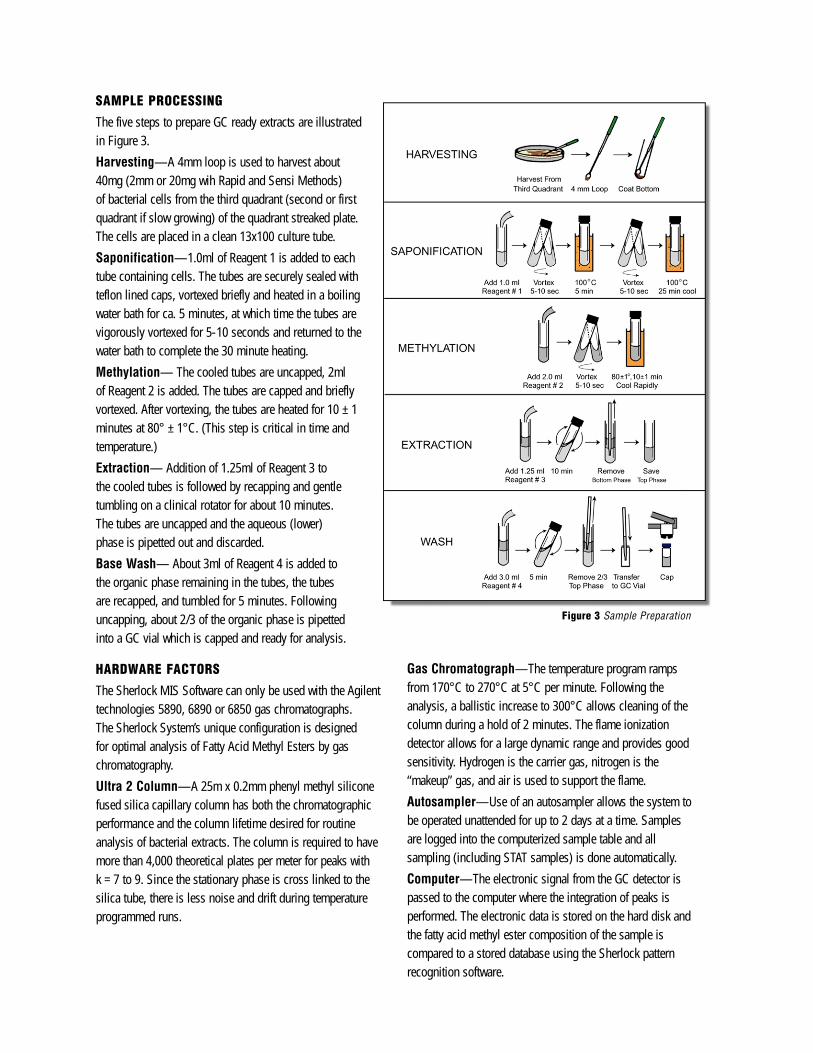
The five steps to prepare GC ready extracts are illustratedin Figure 3.
Harvesting—A 4mm loop is used to harvest about40mg (2mm or 20mg wih Rapid and Sensi Methods)of bacterial cells from the third quadrant (second or first quadrant if slow growing) of the quadrant streaked plate. The cells are placed in a clean 13x100 culture tube.
Saponification—1.0ml of Reagent 1 is added to eachtube containing cells. The tubes are securely sealed withteflon lined caps, vortexed briefly and heated in a boilingwater bath for ca. 5 minutes, at which time the tubes arevigorously vortexed for 5-10 seconds and returned to thewater bath to complete the 30 minute heating.
Methylation— The cooled tubes are uncapped, 2mlof Reagent 2 is added. The tubes are capped and brieflyvortexed. After vortexing, the tubes are heated for 10 ± 1minutes at 80° ± 1°C. (This step is critical in time andtemperature.)
Extraction— Addition of 1.25ml of Reagent 3 tothe cooled tubes is followed by recapping and gentletumbling on a clinical rotator for about 10 minutes.The tubes are uncapped and the aqueous (lower)phase is pipetted out and discarded.
Base Wash— About 3ml of Reagent 4 is added tothe organic phase remaining in the tubes, the tubesare recapped, and tumbled for 5 minutes. Followinguncapping, about 2/3 of the organic phase is pipettedinto a GC vial which is capped and ready for analysis.
HARDWARE FACTORS
The Sherlock MIS Software can only be used with the Agilenttechnologies 5890, 6890 or 6850 gas chromatographs. The Sherlock System’s unique configuration is designed for optimal analysis of Fatty Acid Methyl Esters by gas chromatography.
Ultra 2 Column—A 25m x 0.2mm phenyl methyl siliconefused silica capillary column has both the chromatographicperformance and the column lifetime desired for routineanalysis of bacterial extracts. The column is required to havemore than 4,000 theoretical plates per meter for peaks with k = 7 to 9. Since the stationary phase is cross linked to thesilica tube, there is less noise and drift during temperatureprogrammed runs.
Gas Chromatograph—The temperature program rampsfrom 170°C to 270°C at 5°C per minute. Following theanalysis, a ballistic increase to 300°C allows cleaning of thecolumn during a hold of 2 minutes. The flame ionizationdetector allows for a large dynamic range and provides goodsensitivity. Hydrogen is the carrier gas, nitrogen is the“makeup” gas, and air is used to support the flame.
Autosampler—Use of an autosampler allows the system tobe operated unattended for up to 2 days at a time. Samplesare logged into the computerized sample table and all sampling (including STAT samples) is done automatically.
Computer—The electronic signal from the GC detector ispassed to the computer where the integration of peaks is performed. The electronic data is stored on the hard disk andthe fatty acid methyl ester composition of the sample is compared to a stored database using the Sherlock patternrecognition software.
Figure 3 Sample Preparation
CALIBRATION AND PEAK NAMING
The Sherlock MIS uses an external calibration standarddeveloped and manufactured by Microbial ID, Inc. Thestandard is a mixture of the straight chained saturated fattyacids from 9 to 20 carbons in length (9:0 to 20:0) and fivehydroxy acids. All compounds are added quantitatively sothat the gas chromatographic performance may be evaluatedby the software each time the calibration mixture is analyzed.The hydroxy compounds are especially sensitive to changesin pressure/ temperature relationships and to contaminationof the injection port liner. As a result, theses compoundsfunction as quality control checks for the system
Retention time data obtained from injecting the calibrationmixture is converted to Equivalent Chain Length (ECL)data for bacterial fatty acid naming. The ECL value foreach fatty acid can be derived as a function of its elutiontime in relation to the elution times of a known series ofstraight chain fatty acids.
Where Rtx is the retention time of x; Rtn is the retention timeof the saturated fatty acid methyl ester preceding x; Rt(n + 1)is the retention time of the saturated fatty acid methyl estereluting after x.
Thus, it is possible, by comparison to the external standard,to compute the ECL value for each compound following ananalysis. The GC and column allow windows to be set at0.010 ECL unit wide giving great precision in resolution ofisomers. After naming the peaks in an unknown sample,Sherlock compares the ECL values for the most stableseries (e.g. saturated straight chain or branched chain acids)to the peak naming table’s theoretically perfect values andmay recalibrate internally if sufficient differences are detected.This feature allows the system to be run for up to two daysunattended without worrying about drift between runs.
LIBRARIES
The Sherlock libraries consist of more than 100,000 analysesof strains obtained from experts and from culture collections.The cultures were collected from around the world to avoidpotential geographic bias. Where possible, 20 or more strainsof a species or subspecies were analyzed to make the entry.When chromatographic subgroups were found within ataxon, more strains were obtained to delineate each group.
The method of culture and the corresponding library isindicated in the name field of the sample as it is logged intothe computer. Analysis of an unknown sample results in anautomatic comparison of the composition of the unknownstrain to a stored database using a covariance matrix, principalcomponent analysis and pattern recognition software. The covariance matrix takes into account the mole-for-molerelationship of the conversion of one fatty acid to another(e.g. 16:0 to 16:1 due to action of a desaturase), whichmight occur in relation to a temperature shift or age difference.The pattern recognition software uses calculations of crossterms (e.g. ratios between fatty acid amounts) in addition tothe principal component base. The subtle differencesbetween biovars or subspecies depends upon the power ofthe pattern recognition software to discriminate at this level.
The libraries are open ended (i.e. not limited by a finite setof biochemical assays) and the number of species in themis large and growing. The libraries are only limited by MIDI’sability to obtain adequate numbers of strains to make theentries. Of course, some groups of bacteria are more amenableto fatty acid composition analysis for identification than others.This relates to whether well characterized strains are availableand to whether “species” can be justified on the basis ofDNA relatedness (e.g. Escherichia coli is related at thespecies level to Shigella dysenteriae [see Brenner, Int. J.Syst. Bacteriol. 23: 298-307).
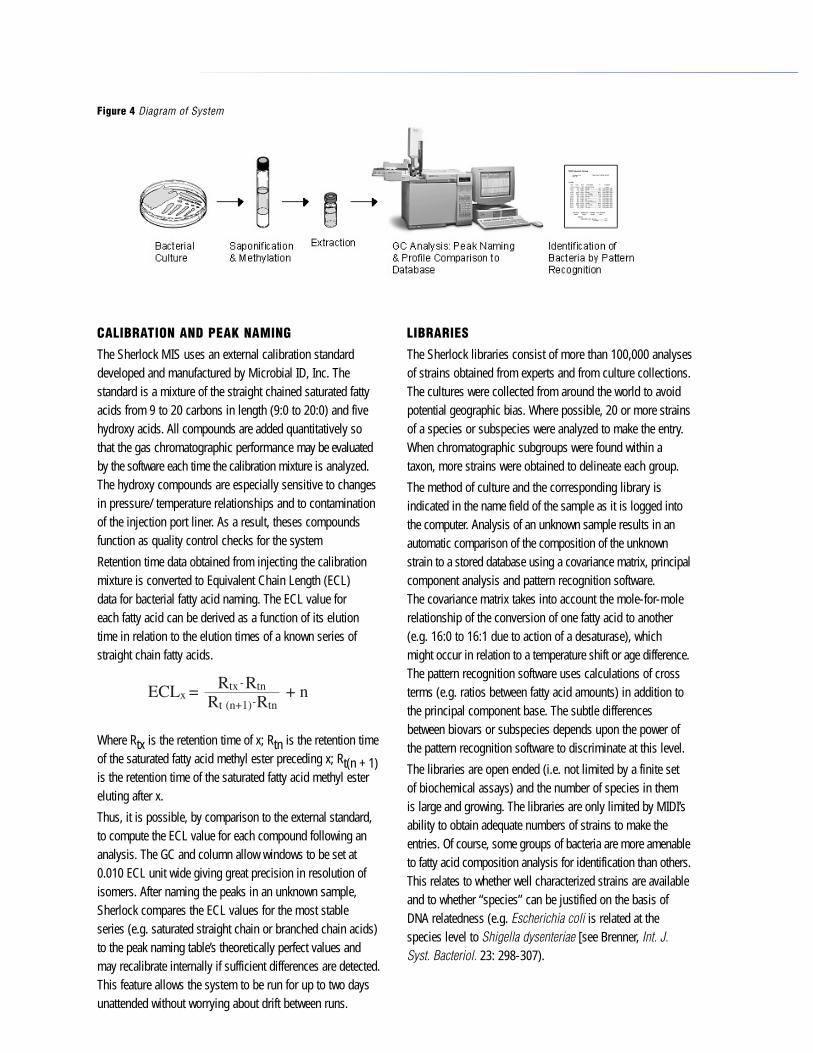
Figure 4 Diagram of System
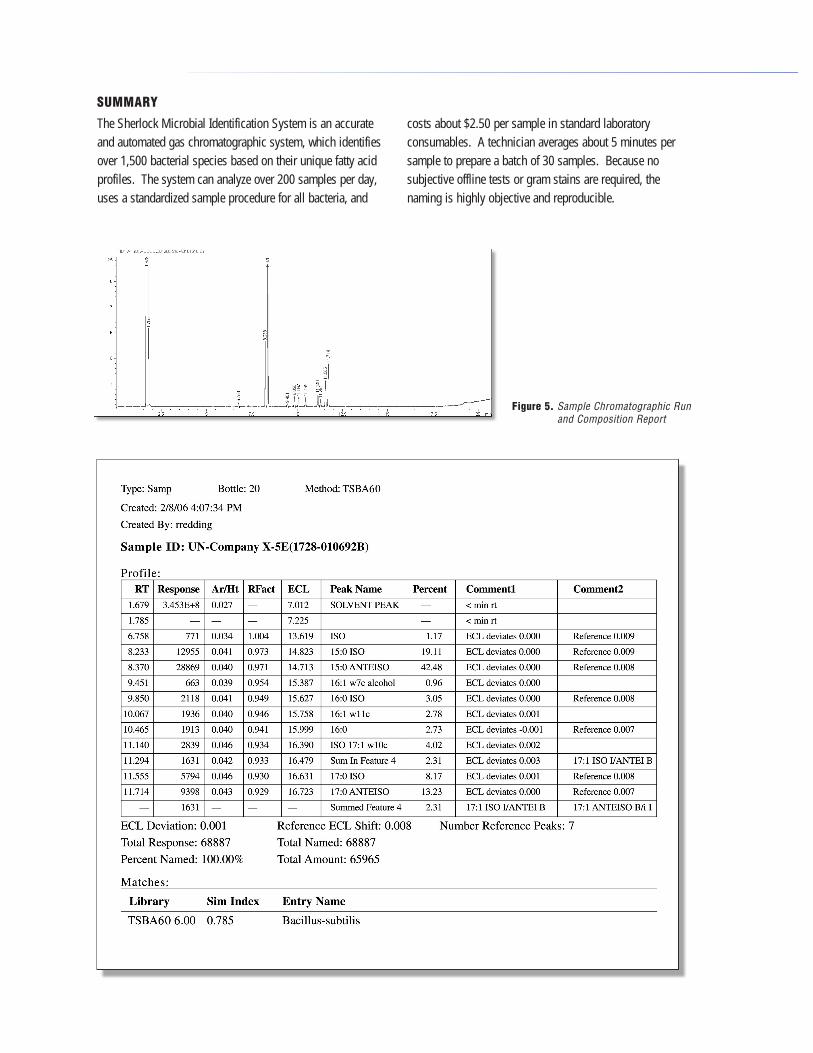
The Sherlock Microbial Identification System is an accurate and automated gas chromatographic system, which identifiesover 1,500 bacterial species based on their unique fatty acid profiles. The system can analyze over 200 samples per day, uses a standardized sample procedure for all bacteria, and
costs about $2.50 per sample in standard laboratory consumables. A technician averages about 5 minutes per sample to prepare a batch of 30 samples. Because nosubjective offline tests or gram stains are required, the naming is highly objective and reproducible.
SUMMARY
Figure 5. Sample Chromatographic Run and Composition Report
Animal ScienceForsblom, B., Sarkiala, K.E. & Jousimies-Somer, H.(2000). Agar pitting gram-negative rods in the subgingivalflora of dogs. Anaerobe 6, 163-168.
Vandamme, P., Vancanneyt, M., Segers, P., Ryll,M., Kohler, B., Ludwig, W. & Hinz, K.H. (1999).Coenonia anatina gen. nov., sp. nov., a novel bacterium asso-ciated with respiratory disease in ducks and geese. Int J SystBacteriol 49, 867-874.
Bioremediation/ PhytoremediationKozdrój, J. & van Elsas, J.D. (2000). Response of thebacterial community to root exudates in soil polluted withheavy metals assessed by molecular and cultural approaches.Soil Biol and Biochem 32, 1405-1417.
EntomologyKaufman, M.G., Walker, E.D., Smith, T.W., Merritt,R.W. & Klug, M.J. (1999). Effects of larval mosquitoes(Aedes triseriatus) and stemflow on microbial communitydynamics in container habitats. App Environ Microbial 65,2661-2673.
Marine ScienceLee, H.K., Chun, J., Moon, E.Y., Ko, S.H., Lee,D.S., Lee, H.S. & Bae, K.S. (2001). Hahella chejuen-sis gen. nov., sp. nov., an extracellular-polysaccharide-pro-ducing marine bacterium. Int J Syst Evol Microbiol 51, 661-666.
Medical ResearchGraves, M., Robin, T., Chipman, A.M., Wong J.,Khashe, S. & Janda, M. (1997). Four additional casesof Burkholderia gladioli infection with microbiological corre-lates and review. Clin Infect Dis 25, 838-842.
Hopkins, M.J., Sharp, R. & Macfarlane, G.T.(2001). Age and disease related changes in intestinal bacterial populations assessed by cell culture, 16S rRNAabundance, and community cellular fatty acid profiles. Gut 48, 198-205.
Hsueh, P.R., Jene, T.L., Ju, P.H., Chi, C.Y., Chuan,S.C. & Wu, H.S. (1998). Outbreak of Pseudomonas fluorescens bacteremia among oncology patients. J. ClinMicrobiol 36, 2914-2917.
Osterhout, G.J., Shull, V.H. & Dick, J.D. (1991).Identification of clinical isolates of gram-negative nonfermen-tative bacteria by an automated cellular fatty acid identificationsystem. J. Clin Microbiol 29, 1822-1830.
Plant PathologyNorman, D.J. & Yuen, J.M.F. (1998). A distinct patho-type of Ralstonia (Pseudomonas) solanacearum race I, biovarI entering Florida in pothos (Epipremnum aureum) cuttings.Can J. Plant Pathol 20, 171-175.
Walcott, R.R., Langston, D.B.Jr., Sanders, F.H.Jr. &Gitaitis, R.D. (2000). Investigating intraspecific variationof Acidovorax avenae subsp. citrulli using DNA fingerprintingand whole cell fatty acid analysis. Phytopathol 90, 191-196.
Process ControlPirttijärvi, T.S.M., Ahonen, L.M., Maunuksela, L.M.& Salkinoja-Salonen, M.S. (1998). Bacillus cereus in awhey process. Int J. Food Microbiol 44, 31-41.
Soil ScienceSong, B., Palleroni, N. & Haggblom, M.M. (2000).Isolation and characterization of diverse halobenzoate-degrading denitrifying bacteria from soils and sediments. App Environ Microbiol 66, 3446-3453.
TaxonomyCoenye, T., Laevens, S., Gillis, M. & Vandamme, P.(2001). Genotypic and chemotaxonomic evidence for thereclassification of Pseudomonas woodsii (Smith 1911)Stevens 1925 as Burkholderia andropogonis (Smith 1911)Gillis et al. 1995. Int J. Syst Evol Microbiol 51, 183-185.
Huys, G., Altwegg, M., Hanninen, M.L.,Vancanneyt, M., Vauterin, L., Coopman, R., Torck,U., Luthy, H.J., Janssen, P. & Kersters, K. (1996).Genotypic and chemotaxonomic description of two sub-groups in the species Aeromonas eucrenophilia and their affiliation to A. encheleia and Aeromonas DNA hybridizationgroup 11. Syst App Microbiol 19, 616-623.
Rainey, F.A., Burghardt, J., Kroppenstedt, R.M.,Klatte, S. & Stackebrandt, E. (1995). Polyphasic evi-dence for the transfer of Rhodococcus roseus toRhodococcus rhodochorus. Int J Syst Bacteriol 45, 101-103.
Water QualityNorton, C.D. & LeChevallier, M.W. (2000). A pilotstudy of bacteriological population changes through potablewater treatment and distribution. App Environ Microbiol 66,268-276.
Complete Reference ListMIDI, Inc. (2001). Sherlock Microbial IdentificationSystem References.
LITERATURE
125 Sandy Drive Newark, DE 19713
tel: 302-737-4297 fax:302-737-7781
www.midi-inc.com