
Effects of temperature on the recruitment ... - int-res.com · Reinhardt et al.: Effects of...
14
MARINE ECOLOGY PROGRESS SERIES Mar Ecol Prog Ser Vol. 489: 61–74, 2013 doi: 10.3354/meps10423 Published August 28 INTRODUCTION The timing of life history events (i.e. phenology), including the timing of recruitment in marine organ- isms, can have a large influence on both individuals and populations. For example, species-specific sea- sonal differences in the timing of recruitment can be an important factor determining the nature and strength of competitive interactions, population growth rates, exposure to adverse environmental conditions and reproductive success (Yang & Rudolf 2010). Ulti- mately, temporal variation in recruitment may help maintain biodiversity (Edwards & Stachowicz 2012) or as we suggest, enhance invasion rates. In many cases, the timing of the recruitment of benthic marine invertebrates is controlled by abiotic factors such as temperature (Stachowicz et al. 2002), which controls gametogenesis and larval development (Westerman et al. 2009). To reduce competition, organisms often partition resources. In seasonal environments resources can be temporally partitioned so that interspecific com- petition and the risk of competitive exclusion are reduced (Schoener 1974, Tokeshi 1986). Over time, © Inter-Research 2013 · www.int-res.com *Email: [email protected] Effects of temperature on the recruitment phenology and niche overlap of shallow epifaunal assemblages in southern New England James F. Reinhardt 1, *, Robert B. Whitlatch 2 , Richard W. Osman 3 1 Earth Resources Technology, NOAA Restoration Center, 1315 East-West Hwy, Silver Spring, Maryland 20910, USA 2 Department of Marine Sciences, University of Connecticut, 1080 Shennecossett Rd, Groton, Connecticut 06340, USA 3 Smithsonian Environmental Research Center, PO Box 28, 647 Contees Wharf Road, Edgewater, Maryland 21037, USA ABSTRACT: Recruitment phenology, or the timing of recruitment, can have a large influence on individuals and populations by affecting their exposure to adverse environmental conditions and interspecific competition. In this study, we examined whether temperature parameters could predict the timing of recruitment, the duration of recruitment and total recruitment in 18 benthic epifaunal species using partial least squares regression (PLSR) and ordinary least squares regres- sion. Additionally, we used a null model to test whether temperature parameters and inter-annual variation in those parameters affect the temporal niche overlap of these benthic species. We specifically examined the recruitment patterns of non-native species to help illustrate how shifts in phenology may help drive changes in the community composition. Results from the PLSR helped determine the most instructive regressors for univariate least-squares models. For many (14 of 18) of the species examined, recruitment patterns could be predicted by seasonal growing degree days. Additionally, communities at cooler sites exhibited greater temporal niche overlap than assemblages found at warmer sites. Finally, we observed a unique pattern among invasive species, with more recent invaders recruiting later in the season, which may be a result of shifts in niche overlap. The findings of this study illustrate potential mechanisms for species coexistence and increased rates of invasion resulting from climate change. KEY WORDS: Recruitment · Temperature · Long Island Sound · Niche overlap · Invasive species · Phenology · Fouling community Resale or republication not permitted without written consent of the publisher FREE REE ACCESS CCESS
Transcript of Effects of temperature on the recruitment ... - int-res.com · Reinhardt et al.: Effects of...

MARINE ECOLOGY PROGRESS SERIESMar Ecol Prog Ser
Vol. 489: 61–74, 2013doi: 10.3354/meps10423
Published August 28
INTRODUCTION
The timing of life history events (i.e. phenology),in cluding the timing of recruitment in marine organ-isms, can have a large influence on both individualsand populations. For example, species-specific sea-sonal differences in the timing of recruitment can be animportant factor determining the nature and strengthof competitive interactions, population growth rates,exposure to adverse environmental conditions andreproductive success (Yang & Rudolf 2010). Ulti-mately, temporal variation in recruitment may help
maintain biodiversity (Edwards & Stachowicz 2012)or as we suggest, enhance invasion rates. In manycases, the timing of the recruitment of benthic marineinvertebrates is controlled by abiotic factors such astemperature (Stachowicz et al. 2002), which controlsgametogenesis and larval development (Westermanet al. 2009).
To reduce competition, organisms often partitionresources. In seasonal environments resources canbe temporally partitioned so that interspecific com-petition and the risk of competitive exclusion arereduced (Schoener 1974, Tokeshi 1986). Over time,
© Inter-Research 2013 · www.int-res.com*Email: [email protected]
Effects of temperature on the recruitment phenology and niche overlap of shallow epifaunal
assemblages in southern New England
James F. Reinhardt1,*, Robert B. Whitlatch2, Richard W. Osman3
1Earth Resources Technology, NOAA Restoration Center, 1315 East-West Hwy, Silver Spring, Maryland 20910, USA2Department of Marine Sciences, University of Connecticut, 1080 Shennecossett Rd, Groton, Connecticut 06340, USA
3Smithsonian Environmental Research Center, PO Box 28, 647 Contees Wharf Road, Edgewater, Maryland 21037, USA
ABSTRACT: Recruitment phenology, or the timing of recruitment, can have a large influence onindividuals and populations by affecting their exposure to adverse environmental conditions andinterspecific competition. In this study, we examined whether temperature parameters could predict the timing of recruitment, the duration of recruitment and total recruitment in 18 benthicepifaunal species using partial least squares regression (PLSR) and ordinary least squares regres-sion. Additionally, we used a null model to test whether temperature parameters and inter-annualvariation in those parameters affect the temporal niche overlap of these benthic species. Wespecifically examined the recruitment patterns of non-native species to help illustrate how shiftsin phenology may help drive changes in the community composition. Results from the PLSRhelped determine the most instructive regressors for univariate least-squares models. For many(14 of 18) of the species examined, recruitment patterns could be predicted by seasonal growingdegree days. Additionally, communities at cooler sites exhibited greater temporal niche overlapthan assemblages found at warmer sites. Finally, we observed a unique pattern among invasivespecies, with more recent invaders recruiting later in the season, which may be a result of shifts inniche overlap. The findings of this study illustrate potential mechanisms for species coexistenceand increased rates of invasion resulting from climate change.
KEY WORDS: Recruitment · Temperature · Long Island Sound · Niche overlap · Invasive species ·Phenology · Fouling community
Resale or republication not permitted without written consent of the publisher
FREEREE ACCESSCCESS
Mar Ecol Prog Ser 489: 61–74, 2013
processes occur that recycle limiting resources(Loreau 1989, 1992). Specifically, in shallow epifau-nal communities substrate space becomes availablethrough processes such as physical disturbance, pre-dation, and senescence (Osman 1977, Sousa 1979,Mook 1981, Osman et al. 1992, Altman & Whitlatch2007). During the summer season in southeasternConnecticut, USA, open space is continuously gener-ated; however, open space comprises only ~15% ofthe total area on average (Altman & Whitlatch 2007).Once space is cleared, new recruits can colonize theopening and compete for resources (Stachowicz &Byrnes 2006, Altman & Whitlatch 2007).
In seasonal environments, higher annual tempera-tures can reduce physical (temperature) constraintson niche partitioning and may expand the resourcespectrum that can be partitioned among species (i.e.the time over which recruitment can take place islonger). Species may respond in a variety of ways tothe expansion of the resource spectrum. For example,(1) species at the edge of their seasonal temperaturelimits may broaden the temporal distribution of re-cruitment to occupy the expanded resource, (2) spe-cies may broaden their recruitment curves, (3) speciesmay shift their recruitment periods unidirectionally,(4) species may shorten their recruitment period as aresult of faster maturation and larval development,(5) species may demonstrate idiosyncratic responses,meaning that there is no common response patternamong species, or (6) species recruitment periodsmay remain unchanged (Tokeshi 1986). However,species inhabiting locations near the extremes oftheir temperature thresholds (or limits of thermal tol-erance) may respond differently. For instance, highertemperature may result in aestivisation in some tuni-cates (Tarjuelo et al. 2001) and ultimately limit the re-cruitment period, thus resulting in a shortened re-cruitment season. Regardless of the mechanisminvolved, shifts in species resource utilization mayhave effects on community dynamics. Studies haverecorded changes in community structure withinNew England epifaunal assemblage over time (Dijk-stra et al. 2011), but a complete understanding of themechanisms responsible for these changes is stilllacking. Understanding how temperature alters nichepartitioning in space and time may improve our un-derstanding of species coexistence and how tempera-ture-related shifts and changes in resource utilizationinfluence rates of species introductions or extinctions.In one hypothetical scenario, the shift of timing for re-cruitment to earlier in the year may open upresources later in the season and make species inva-sions at the end of the year more likely to occur. Null
models are one way to examine niche overlap andchanges that may be associated with temperature.
Null models randomize resource utilization curvesto compare the niche overlap of a random speciesassemblage with the niche overlap empirically ob -served in the assemblage. Temporal niche partition-ing has been examined using community niche over-lap indices for a variety of organisms and systems,ranging from insect emergence (Tokeshi 1986) andflowering phenology (Gotelli & Graves 1996) to antforaging (Albrecht & Gotelli 2001). In this study, ourgoal was to examine how shallow subtidal epifaunalspecies assemblages partition their seasonal recruit-ment, and understand how site-specific and inter-annual variation in temperature influences overlap.
To examine the effect of temperature on the overlapin species recruitment in shallow hard-substrate epi-faunal communities, we compared water temperatureparameters to community overlap using linear regres-sion. Additionally, we examined the timing of the be-ginning of recruitment for each species and the lengthof the recruitment season in relation to a variety oftemperature parameters to determine whether inter-annual temperature fluctuations can predict the tim-ing of important phenological traits (i.e. the timing ofrecruitment). Two basic assumptions were madeabout the system: competition for space among re-cruits drive partitioning of resources, and communityoverlap reflects potential competition among recruits.We examined weekly recruitment data for 18 shal-low-water epifaunal invertebrate species over 7 yrand across 3 coastal sites in southern New England.This data set allowed us to look for patterns bothwithin a single site as well as among sites. Finally, wecompared the recruitment patterns of resident andnon-native species to assess whether differencesoccur in the timing of recruitment between specieswithin these groups. Understanding the relative tim-ing and potential shifts of species (and the comparisonof native and non-native species) within the epifaunalcommunity may help us understand why coastalhard-substrates have become one of the most heavilyinvaded systems. As marine habitats continue to beaffected by global change it is important to evaluatepast patterns to help predict future impacts.
MATERIALS AND METHODS
Data collection
Recruitment and temperature data were collectedat 3 coastal sites at eastern Long Island Sound, Con-
62
Reinhardt et al.: Effects of temperature on phenology and niche overlap
necticut. Recruitment was monitored at Avery Point(AP; 41° 18’ 58.53” N, 72° 03’ 39.04” W) Groton LongPoint (GLP; 41° 18’ 43.56” N, 72° 00’ 39.28” W), andNoank (NK; 41° 19’ 24.66” N, 71° 59’ 09.25” W) (seehttp:// invasions.si.edu/cgi/labs/ltreb for all data col-lected from 1991 to 2006). Temperature data havealso been collected at all 3 sites since 2002. Thesesites are all within 7 km of each other. To estimateepifaunal recruitment, 4 replicate 100 cm2 PVC pan-els were repeatedly exposed at each site for 1 wkperiods. At AP and GLP, the panels were suspendedface down ~1 m below the water’s surface from afloating dock. At NK, the panels were suspendedfrom a fixed dock, so the panels’ depth below the sur-face varied with the tidal state (typically <1 m). Eachweek, all individuals settling on the panels werecounted and identified to the species level under adissecting microscope, and new sets of blank panelswere deployed. In the present study, we limited our-selves to 18 species (Table 1) that commonlyoccurred at most of the sites (~ 35% of the total num-ber of species but >90% of the individuals).
HOBO® Tidbit temperature loggers were sus-pended with the PVC panels to collect hourly seawa-ter temperature data at all sites. Data loggers wereoccasionally lost, resulting in some missing datapoints in the temperature records. Gaps in the datawere filled by first creating a seasonal water temper-ature signal using all of the water temperature datafrom a particular site. Then, missing water tempera-tures were interpolated by performing a multiple lin-ear regression including the seasonal signal anddaily mean air temperature data from the Groton andBridgeport airports (<5 km and 71 km away from allsites) as independent variables (AP r2 = 0.97; GLP r2 =0.91; NK r2 = 0.96). Temperature was then averagedover each year and over each month from January toOctober for all years. Growing degree days (GDDs)were also calculated for each year. GDDs were calcu-lated as the average of the daily temperature mini-mum and maximum minus base temperature (10°C).Negative values were excluded, and GDDs werecumulatively summed for each year. GDD are com-monly used to predict phenological events and aregood predictors because they represent a moremeaningful sum of energy accumulation than tem-perature (e.g. Cross & Zuber 1972).
Niche overlap
Temporal patterns in recruitment were investi-gated at the 3 sites over a 7 yr period (2002 to 2008).We excluded 2005 from the community niche analy-sis at AP and GLP because of missing data during themiddle of the recruitment season; however, 2005 wasstill used to determine the date of recruitment onsetand the length of the recruitment season. For theniche overlap analyses, the recruitment season wasconstrained from Day of Year 140−310 (May 19 toOct. 27) at AP, 136−310 at GLP (May 15 to Oct. 27)and 152−312 (May 31 to Oct. 29) at NK. It was neces-sary to limit the seasonal recruitment domain to anecologically relevant time period to avoid obviousseasonal constraints on recruitment and remove biasfor clumped distributions. The domains employed inthis study were defined based on GDD temperaturescorresponding to more than 90% of the recruitmentof all species. The starting day of the recruitment sea-son was based on the average Day of Year when thewater reached 20 GDD. This time point coincidedwith a rapid increase in recruitment activity (data notshown). The last day of the season was defined as theaverage last day of GDD accumulation. The last dayof GDD accumulation is the last day of a calendar
63
Species Colonial/ Non-native/solitary resident
SpongesHalichondria bowerbanki Colonial Non-native
HydroidsObelia sp. Colonial Resident
PolychaetesSpirorbis spp. Solitary ResidentHydroides dianthus Solitary Resident
BryozoansCryptosula pallasiana Colonial ResidentSchizoporella errata Colonial ResidentElectra pilosa Colonial ResidentElectra crustulenta Colonial ResidentBugula turrita Colonial ResidentBugula neritina Colonial Non-nativeBowerbankia gracilis Colonial ResidentMembranipora membranacea Colonial Non-native
AscidiansBotryllus schlosseri Colonial Non-nativeBotrylloides violaceus Colonial Non-nativeDiplosoma listerianum Colonial Non-nativeDidemnum vexillum Colonial Non-nativeMolgula manhattensis Solitary ResidentAscidiella aspersa Solitary Non-nativeCiona intestinalis Solitary ResidentStyela clava Solitary Non-native
Table 1. List of species included in the analyses, with theirgrowth form (solitary or colonial) and resident or non-nativestatus (taken from Karlson & Osman 2012 or J. T. Carlton
pers. comm.)

Mar Ecol Prog Ser 489: 61–74, 2013
year when temperatures were greater than 10°C.However, because recruitment was only measuredweekly, the start and end dates are somewhat biased.Therefore, the recruitment domain actually coveredfrom the first sampling day before the start date untilthe last sampling day before the end date. For eachyear and site, 21 to 23 weeks were included in thedomain. The colonial bryozoan Cryptosula pallasianarecruited earlier than the beginning of the defineddomain, albeit at very low levels (<4 ind. 100 cm−2
wk−1). The species included in this study wereencrusting and arborescent bryozoans, solitary andcolonial ascidians and 2 polychaete species (Table 1).We performed the analyses with 18 species, 16 ofwhich occurred at all sites at all times. In some years,Diplosoma listerianum was not always present at NK,and Didemnum vexillum did not always recruit atGLP.
Community niche overlap was estimated by firstcalculating the pairwise Czekanowski index (Legen -dre & Legendre 1998) for all species during a singleyear at each site using the recruitment curves gener-ated from the mean weekly replicate (n = 4) samples.
(1)
The Czekanowski index (Cz) is a symmetricalindex that sums the difference between the propor-tion (P) of recruits of species i and the proportion ofrecruits of species j at each resource state (k) and nor-malizes this value to the number of resource states(n). Each week during the recruitment season (Maythrough October) represented a separate resourcestate (ki = 1…n). The values of the Czekanowskiindex range from 0 to 1, where 0 represents no over-lap, and 1 indicates complete overlap. All pairwiseCzekanowski indices for a single year and site wereaveraged to estimate community niche overlap(Inger & Colwell 1977). Although there are a varietyof similarity indices that could have been used todetermine overlap, our exploratory data analysisdetermined that results with different overlap met-rics were qualitatively similar, and relatively insensi-tive to the similarity metric used. Thus, we used theCzekanowski index to be consistent with previousstudies (e.g. Inger & Colwell 1977).
To determine whether the observed communityoverlap was different than what should be expectedat random, we created a null model. The null modelof community niche overlap was built by first ran-domly shuffling the data matrix (recruitment curvesof all species) for each year and site so that the peakand the shape of the recruitment patterns were
retained but the starting points randomized (similarto the Mika randomization model in Tokeshi 1986).All pairwise Czekanowski overlaps were then calcu-lated and averaged to obtain a randomized measureof community niche overlap. This procedure wasrepeated 10 000 times to generate a distribution ofrandom community niche overlaps for each site andyear. The observed community niche overlap wasconsidered significantly different from the null modelif it was greater or less than 95% of the randomizedcommunity niche models. This null model preservedthe shape and empirical auto-correlation of therecruitment curve through the randomization. Pre-serving the shape of the recruitment curve was mostappropriate because we wanted to test the effect onshifts in the timing of recruitment (or shifts in therecruitment curve) rather than changes to the shapeof the recruitment curve per se; retaining the shapeof the recruitment curve results in a more conserva-tive null model.
When comparing the community niche overlap tothe seasonal temperature patterns, we used the dif-ference between the empirical community nicheoverlap and the median of the randomized nicheoverlaps to standardize the observed overlap to a nullmodel for each site and year (Abrams 1980).
Phenology
The time of first recruitment, or recruitment onset,was estimated by identifying the week in each year,no earlier than March 1, in which the first recruit-ment event for a given species was observed. March1 was chosen as a starting date because it representsthe seasonal cycle of recruitment in the New Englandmarine system better than January 1 (J. F. Reinhardtpers. obs.). The length of the recruitment season wasestimated as the number of days between theappearance of a species’ first and last recruits on thesettling panels. Additionally, the sum of all individu-als for each species that recruited over a season wascalculated to indicate whether temperature parame-ters influenced the overall recruit abundance. Inaddition to the time of first recruitment, we deter-mined the average time required for the first 10% ofrecruits for each species to be recruited. Althoughthe choice of this 10% value was somewhat arbitrary,it tended to remove extremes and better representrecruit populations.
We performed multivariate partial least squaresregression (PLSR) using temperature parameters (i.e.monthly, seasonal and annually averaged tempera-
Cz Czn
P Pij ji ki kjk
n= = − −=∑1
11
64

Reinhardt et al.: Effects of temperature on phenology and niche overlap
tures and GDDs as well as cumulative summed GDD)as independent variables, and the date of firstrecruitment, length of the recruitment season or totalrecruits for all species as the multivariate dependentvariables. Our initial set of predictors included 45temperature variables, but we reduced the predictorset by eliminating variables that had negligible load-ings. Our final predictor set included cumulativeGDD from May to September and monthly GDD fromMay to September (this is because GDD did not accu-mulate until either April or May and no longer accu-mulated after September or October, making monthsoutside this range less informative). Site wasincluded as a factor using the addition of dummyvariables and we included all GDD and site interac-tion terms in the model. PLSR was used to determinethe predictability of recruitment and to determineindependent variables that were most useful for pre-diction of recruitment variables (using loadingweights). PLSR is a regression method that createsorthogonal transforms of both the dependent andindependent variables to create latent variables.Latent variables are created to maximize theexplained variance in the dependent variables. Thecreation of latent variables lowers the multidimen-sionality of the predictor set. In this case PLSR is use-ful because the orthogonal transform reduces theconcern of multi-colinearity (and here our tempera-ture parameters are not independent). To eliminatemissing values in the data set we used the Day ofYear 366 for the day of first recruitment for speciesthat did not recruit during a given year. PLSR wasimplemented using ‘pls’ package (Mevik & Wehrens2007) in R 2.15 (R Development Core Team 2012).
Following PLSR we ran a series of univariate linearregressions on the time of first recruitment, durationof recruitment and the total number of recruits for all18 species using cumulative GDD through Septemberas the regressor (this variable was indicated as themost promising through the PLSR). To test the nullhypothesis that the slope of the regression was equalto zero we ran a full factor regression with the regres-sor, site and interaction terms included in the model.If interaction terms were not significant the modelwas simplified to include only the GDD. If the simpli-fied model was not selected, we added back site as afactor. This method of model selection favored parsi-mony and was utilized to avoid the inclusion of ‘site’terms because site and GDD have the potential to beconfounding (because sites have different GDD accu-mulation rates). By not including site terms we riskedunexplained variance associated with site. Withoutthe interaction terms this variance would manifest it-
self in the intercept (a term we were less interested infor this test), not the slope of the equation.
The across-year average time of recruitment wasalso calculated. We then compared the time of year inwhich non-native species recruited to their year ofinvasion in southern New England for all species forwhich a sufficient recruitment record was available(species and dates first recorded in Long IslandSound or southern New England: Botryllus schloss -eri, 1838; Halichondria bowerbanki, 1871; Styelaclava, 1973; Botrylloides violaceus, 1974; Diplosomalisterianum, 1970s (we used 1975); Ascidiellaaspersa, 1983; Bugula neritina, 1985; Membraniporamembranacea, 1990; Didemnum vexillum, 2000,dates from J. T. Carlton unpubl. data). We performedthis analysis by first ordering the species by the dateon which each species first recruited for each year(2002 to 2008) and site and then averaging theserankings across all years. We then compared theinter-year averaged order of recruitment at each siteto the order in which these species were firstrecorded in Long Island Sound (via a 2-tailed Spear-man correlation). Other than PLSR, statistical analy-ses and null model analyses were performed usingMATLAB 2009.
RESULTS
The temperature measurements showed distinctseasonal patterns between sites (Fig. 1). GLP wasthe warmest site in summer and the coldest in win-ter. The temperature variability at GLP is largelydue to the shallow (approx. 1 to 1.5 m) bathymetryof its inner harbor compared to the other sites. NKwarmed slightly more slowly during spring and
65
Jan
25
20
15
10
5
0
Avery PointGroton Long PointNoank
Ave
rage
mon
thly
tem
per
atur
e (°
C)
Feb Mar Apr May Jun Jul Aug Sep Oct Nov Dec
Fig. 1. Average monthly sea surface temperatures for 2002 to 2008 (interpolated values)

Mar Ecol Prog Ser 489: 61–74, 2013
summer but also cooled more slowly in fall andwinter. AP presented intermediate rates of warmingand cooling (Fig. 1). The maximum temperaturefor a single day during the entire study periodwas 25.6°C at GLP, 24.6°C at AP and 23.7°C at NK.Subtle but distinct seasonal thermal patterns amongsites within 7 km of each other provide a sourceof temporal and spatial heterogeneity within theregion.
Niche Overlap
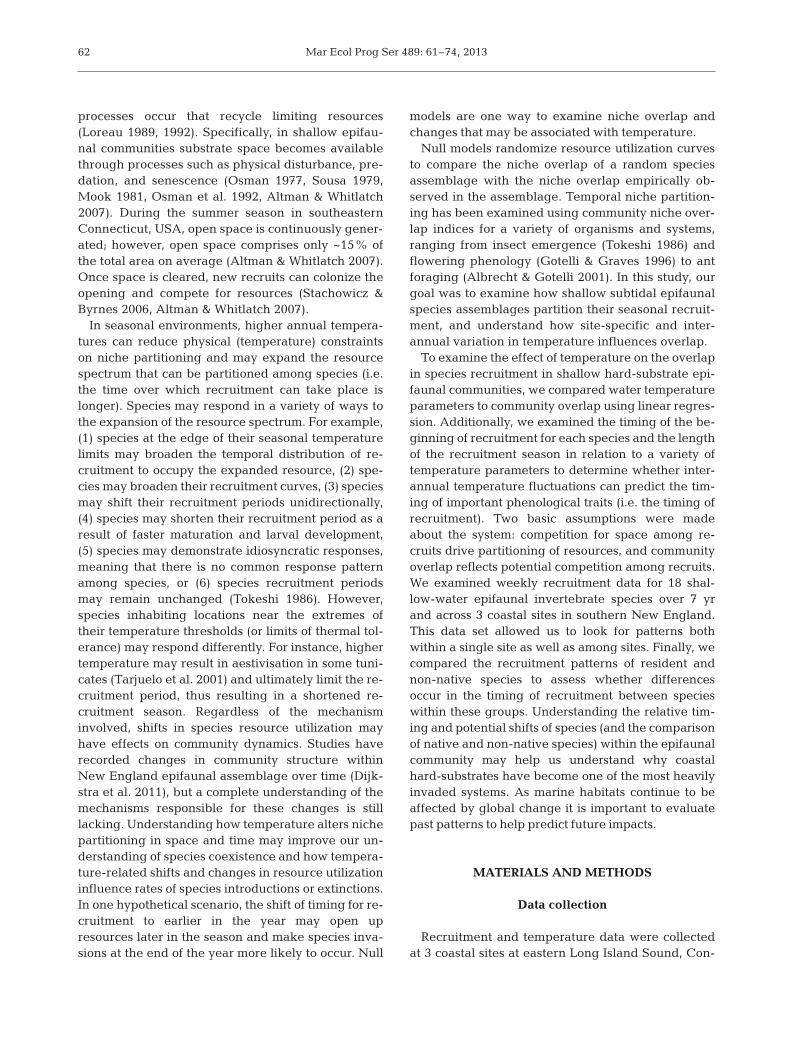
The analysis of species recruitment overlap indi-cated that there was less temporal partitioning on aseasonal scale than would be expected at random atNK and AP, whereas the partitioning at GLP wasno different than that predicted by the null model(Table 2). When all sites were included, the nicheoverlap pattern indicated that temperature was cor-related negatively with overlap (Fig. 2).
Phenology
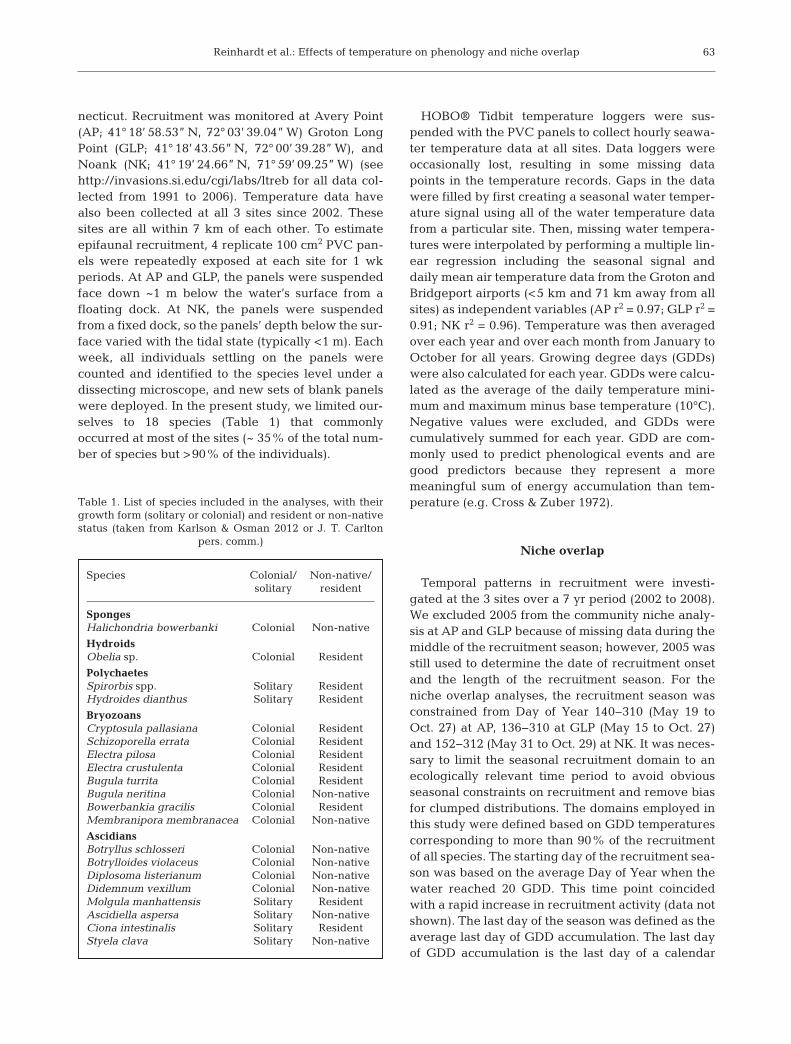
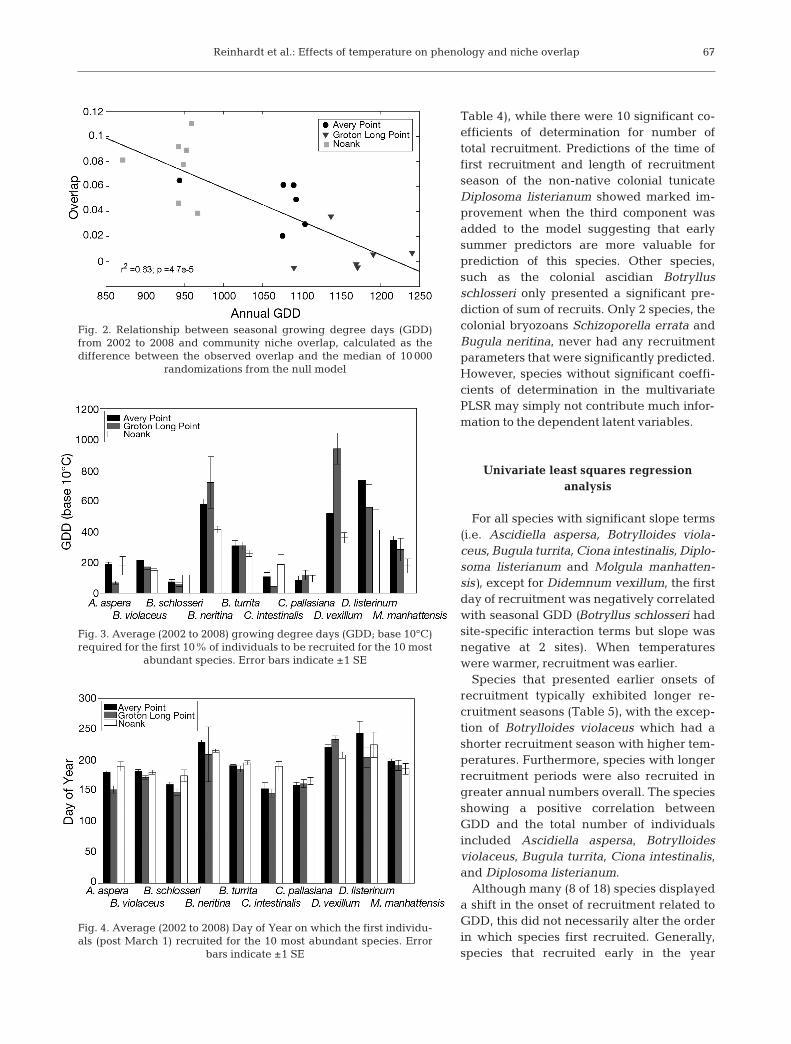
Species showed clear differences in their timing ofrecruitment based on GDDs and Day of Year. For themost part, representations of recruitment timingwere consistent between Day of Year and GDD(Figs. 3 & 4). Notable exceptions were for species thatrecruited later in the year (e.g. Bugula neritina) whenGDD accumulate more rapidly (Fig. 3). The order ofspecies recruitment among sites was quite consistentusing Day of Year: species typically recruited at GLPthen AP then NK, following the order of warming atthese sites (Fig. 4). This pattern was less consistentlyrepresented using GDD. The order in which non-native species recruited was positively correlatedwith the historical order in which these speciesinvaded the region (Fig. 5). This pattern was consis-tent across all sites (AP: Spearman’s ρ = 0.77, p =0.0214; GLP: Spearman’s ρ = 0.72, p = 0.037; NK:Spearman’s ρ = 0.87, p = 0.004).
Multivariate partial least squaresregression analysis
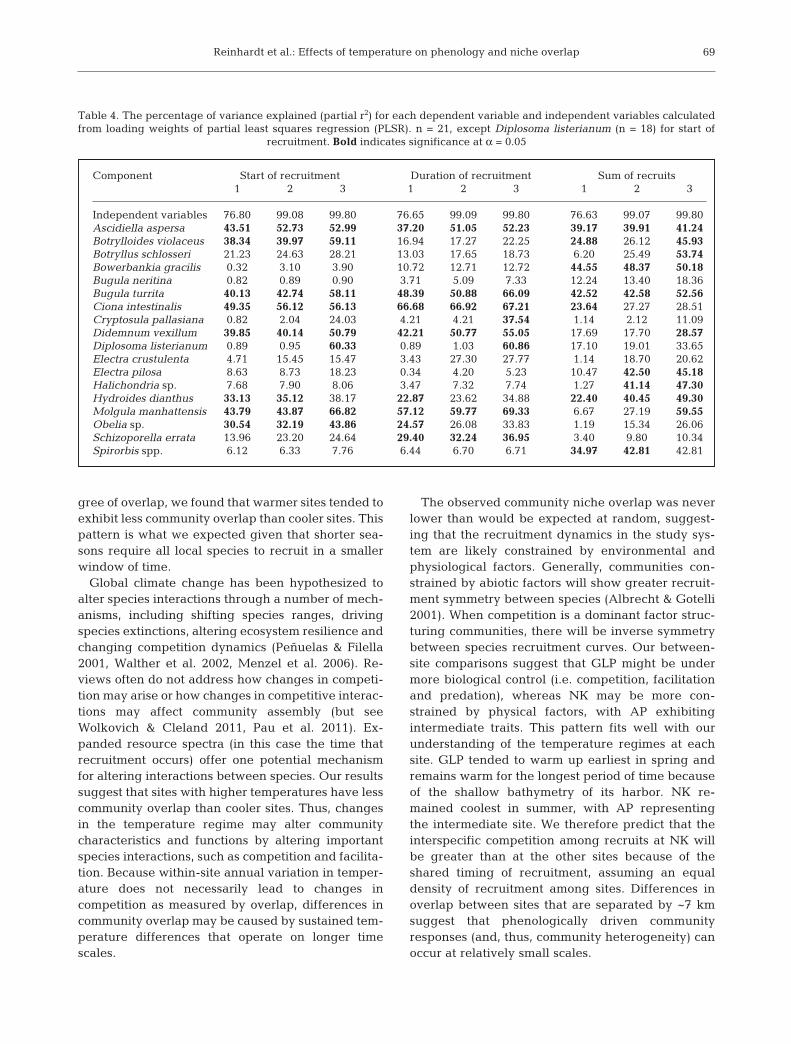
The first 3 components of the multi-variate PLSR explained 99.8% of thevariation in the predictor variables(Table 3). Across all 3 multivariatePLSR (i.e. first recruitment date, lengthof recruitment and total individuals)similar predictor variables contributedmost significantly to the components.Specifically, the interaction term ofthe GLP dummy variable and cumula-tive GDD through September madethe most significant contribution tofirst component, the interaction termof the NK dummy variable and cumu-lative GDD through September madethe most significant contribution tosecond component, while cumulativeGDD through July and August werethe most significant contributors to thethird component. Time of first recruit-ment, duration of recruitment periodand the total number of individualsshowed a varying degree of pre-dictability across species. Overall thePLSR for time of first recruitment andduration of recruitment showed that8 species had significant co ef fi cientsof determination (with 3 components,
66
Observed Median 95% CI p DifferenceOL OL
Avery Point2002 0.5121 0.4547 0.4365 0.5014 0.0115 0.05752003 0.6018 0.5320 0.5134 0.5799 0.0048 0.06982004 0.6197 0.5694 0.5524 0.6147 0.0170 0.05032005 NOT CALCULATED2006 0.4639 0.3736 0.3511 0.4302 0.0034 0.09032007 0.5361 0.4214 0.4014 0.4743 0.0002 0.11472008 0.4655 0.4186 0.3963 0.4801 0.0528 0.0469
Groton Long Point2002 0.3673 0.3607 0.3463 0.3879 0.2720 0.00662003 0.6350 0.6150 0.5998 0.6502 0.0993 0.02002004 0.5102 0.4870 0.4713 0.5220 0.0767 0.02312005 NOT CALCULATED2006 0.3971 0.4072 0.3890 0.4479 0.1867 –0.0102 2007 0.3455 0.3494 0.3273 0.4031 0.4071 –0.0039 2008 0.3785 0.3696 0.3486 0.4229 0.3187 0.0090
Noank2002 0.4213 0.3701 0.3530 0.4071 0.0060 0.05122003 0.4277 0.2865 0.2623 0.3452 0.0002 0.14122004 0.4930 0.3787 0.3595 0.4126 0.0000 0.11432005 0.4492 0.3349 0.3121 0.3939 0.0009 0.11432006 0.5122 0.4463 0.4283 0.4881 0.0034 0.06592007 0.4709 0.3854 0.3656 0.4269 0.0002 0.08552008 0.5336 0.4188 0.3989 0.4656 0.0002 0.1148
Table 2. Observed community overlap (OL) and median overlap, 95% confi-dence intervals and p-values (p) for 10 000 randomizations of the null model.The difference between the observed and median overlap of epifuanal com-munities from Avery Point, Groton Long Point and Noank is also shown. Neg-ative values indicate less overlap than expected at random, and positive
values indicate more overlap than expected at random
Reinhardt et al.: Effects of temperature on phenology and niche overlap
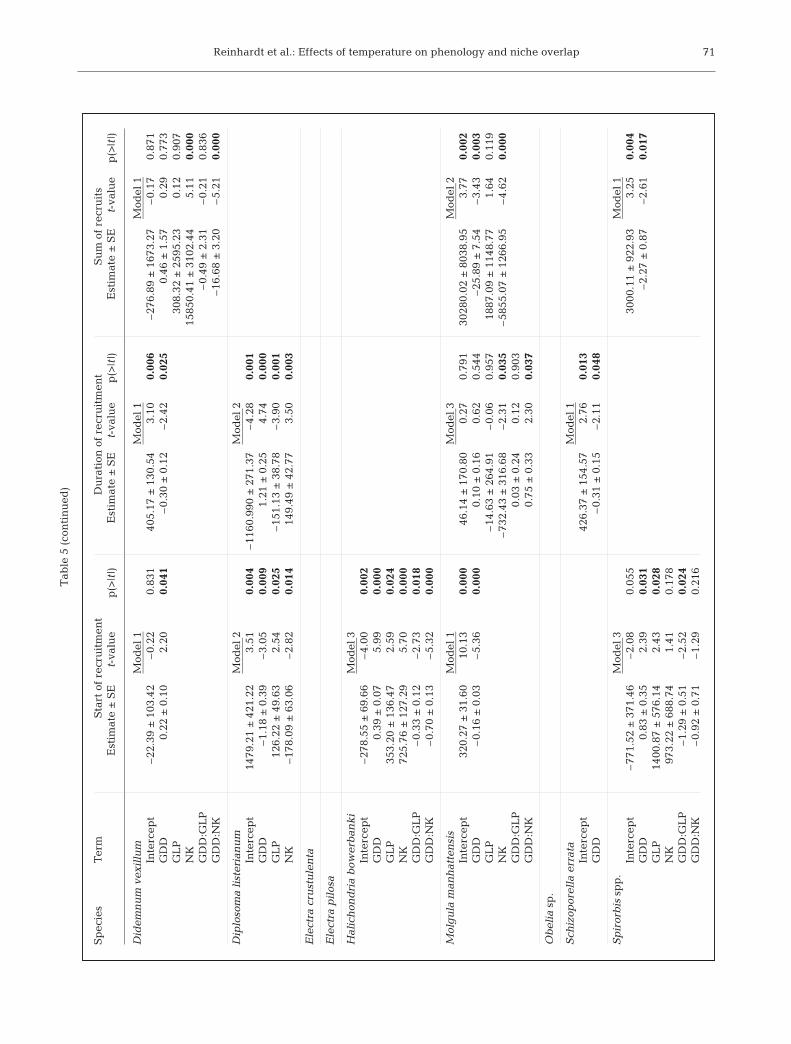
Table 4), while there were 10 significant co -efficients of determination for number oftotal recruitment. Predictions of the time offirst recruitment and length of recruitmentseason of the non-native colonial tunicateDiplosoma listerianum showed marked im -provement when the third component wasadded to the model suggesting that earlysummer predictors are more valuable forprediction of this species. Other species,such as the colonial ascidian Botryllusschlosseri only presented a significant pre-diction of sum of recruits. Only 2 species, thecolonial bryozoans Schizoporella errata andBugula neritina, never had any recruitmentparameters that were significantly predicted.However, species without significant coeffi-cients of determination in the multivariatePLSR may simply not contribute much infor-mation to the dependent latent variables.
Univariate least squares regression analysis
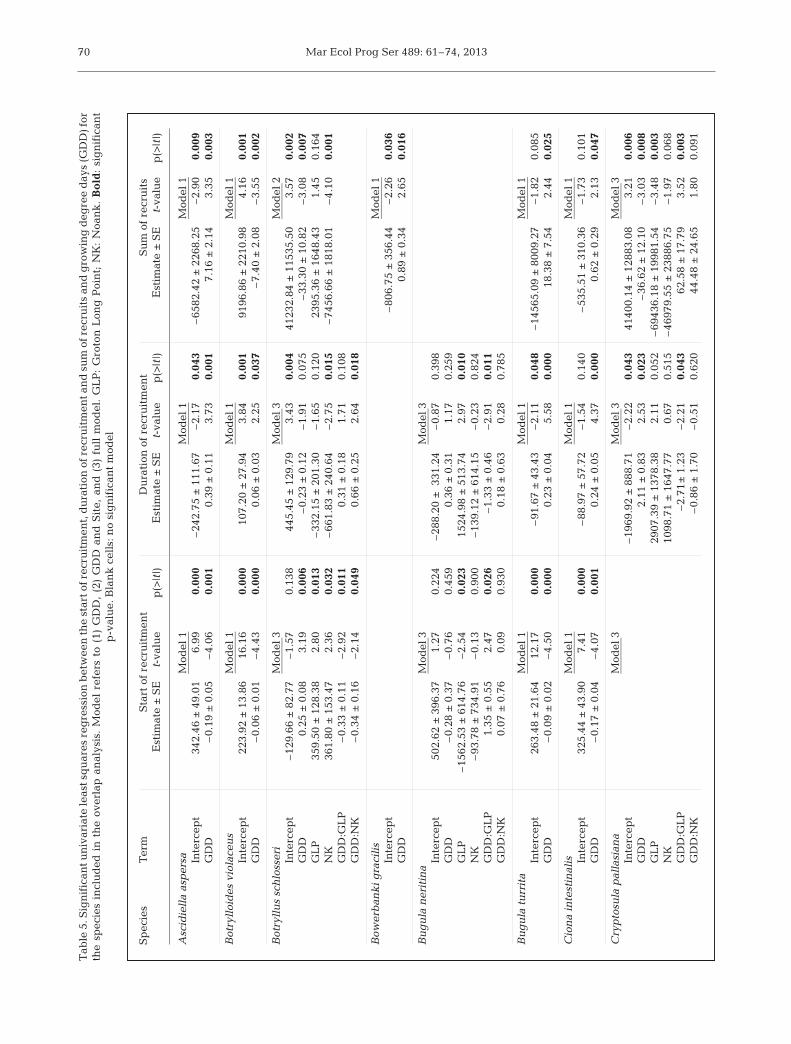
For all species with significant slope terms(i.e. Ascidiella aspersa, Botrylloides viola -ceus, Bugula turrita, Ciona intestinalis, Diplo-soma listerianum and Molgula manhatten-sis), except for Didemnum vexillum, the firstday of recruitment was negatively correlatedwith seasonal GDD (Botryllus schlosseri hadsite-specific interaction terms but slope wasnegative at 2 sites). When temperatureswere warmer, recruitment was earlier.
Species that presented earlier onsets ofrecruitment typically exhibited longer re -cruitment seasons (Table 5), with the excep-tion of Botrylloides violaceus which had ashorter recruitment season with higher tem-peratures. Furthermore, species with longerrecruitment periods were also recruited ingreater annual numbers overall. The speciesshowing a positive correlation betweenGDD and the total number of individualsincluded Ascidiella aspersa, Botrylloidesviolaceus, Bugula turrita, Ciona intestinalis,and Diplosoma listerianum.
Although many (8 of 18) species displayeda shift in the onset of recruitment related toGDD, this did not necessarily alter the orderin which species first recruited. Generally,species that re cruited early in the year
67
Fig. 2. Relationship between seasonal growing degree days (GDD)from 2002 to 2008 and community niche overlap, calculated as the difference between the observed overlap and the median of 10 000
randomizations from the null model
Fig. 3. Average (2002 to 2008) growing degree days (GDD; base 10°C)required for the first 10% of individuals to be recruited for the 10 most
abundant species. Error bars indicate ±1 SE
Fig. 4. Average (2002 to 2008) Day of Year on which the first individu-als (post March 1) recruited for the 10 most abundant species. Error
bars indicate ±1 SE

Mar Ecol Prog Ser 489: 61–74, 2013
always recruited early, regardless of the temperaturecharacteristics in that year. For instance, Obelia sp.and Cryptosula pallasiana were either first or secondin the recruitment order 15 of 21 and 18 of 21 times,
respectively (across all sites and years). Although dif-ferential shifts existed in the timing of recruitment,they did not necessarily change the order in whichthe species were recruited.
DISCUSSION
Our analysis showed that there waseither a greater or equivalent amountof community niche overlap com-pared to what would be expected bychance at 3 sites in southern NewEngland over 7 yr. It is possible thatrecruits within the epifaunal commu-nity present strong interspecific com-petitive interactions because of highoverlap in their seasonal recruitmentpatterns. It is well recognized thatmembers of hard-substrate epifaunalcommunities compete intensely forspace (Jackson 1977, Nadakumar1996). Despite a relatively high de -
68
Component Start of recruitment Duration of recruitment Sum of recruits 1 2 3 1 2 3 1 2 3
CumMay 0.00 0.00 0.15 0.00 0.00 –0.13 0.00 0.00 0.15CumJun 0.00 0.00 0.40 0.00 0.00 –0.41 0.00 0.00 0.39CumJul 0.00 0.00 0.48 0.00 0.00 –0.51 0.00 0.00 0.49CumAug 0.00 0.00 0.44 0.00 0.00 –0.45 0.00 0.00 0.50CumSep 0.00 0.00 0.40 0.00 0.00 –0.37 0.00 0.00 0.44May 0.00 0.00 0.13 0.00 0.00 –0.15 0.00 0.00 0.15Jun 0.00 0.00 0.25 0.00 0.00 –0.28 0.00 0.00 0.24Jul 0.00 0.00 0.00 0.00 0.00 0.00 0.00 0.00 0.11CumJun: GLP 0.12 0.00 0.17 –0.12 0.00 –0.11 0.12 0.10 0.00CumJul: GLP 0.27 0.17 0.13 –0.26 –0.21 0.00 0.27 0.21 0.00CumAug: GLP 0.44 0.30 0.00 –0.42 –0.33 0.00 0.41 0.32 0.00CumSep: GLP 0.56 0.41 0.00 –0.53 –0.43 0.12 0.53 0.41 0.15May: GLP 0.00 0.00 0.00 0.00 0.00 0.00 0.00 0.00 0.00Jun: GLP 0.00 0.00 0.00 0.00 0.00 0.00 0.00 0.00 0.00Jul: GLP 0.15 0.11 0.00 –0.15 –0.11 0.00 0.15 0.11 0.00Aug: GLP 0.16 0.14 0.11 –0.15 –0.12 0.00 0.15 0.11 0.00Sep: GLP 0.12 0.11 0.00 –0.12 0.00 0.11 0.12 0.00 0.00CumJun: NK 0.00 0.00 0.00 0.00 0.00 0.00 0.00 0.10 0.00CumJul: NK 0.18 0.24 0.11 0.19 –0.23 0.00 0.19 0.25 0.00CumAug: NK 0.30 0.42 0.12 0.32 –0.41 0.00 0.33 0.41 0.00CumSep: NK 0.39 0.56 0.13 0.43 –0.55 0.00 0.43 0.54 0.00Jul: NK 0.11 0.15 0.00 0.12 –0.15 0.00 0.12 0.15 0.00Aug: NK 0.12 0.19 0.00 0.13 –0.18 0.00 0.13 0.16 0.00Sep: NK 0.00 0.14 0.00 0.10 –0.14 0.00 0.10 0.13 0.00
Fig. 5. Average Day of Year for the first recruitment of non-native species plotted in rank order of their first record in Long Island Sound in southern
New England. Error bars indicate ±1 SD
Table 3. Predictor weights (of components 1 to 3) of the 3 partial least squares regression (PLSR) analyses describing the re -lationship between start of recruitment, duration of recruitment and sum of all recruits of epifaunal organisms (Table 1) fromAvery Point (AP), Groton Long Point (GLP) and Noank (NK). Note: AP represents the base case of the dummy-variable regres-sion and is not explicitly included as a parameter. Predictor weights represent the contribution of temperature variable to PLSR
component; PLSR weights whose squares are larger than 0.2 are shown in bold. Cum: cumulative growing degree days
Reinhardt et al.: Effects of temperature on phenology and niche overlap
gree of overlap, we found that warmer sites tended toexhibit less community overlap than cooler sites. Thispattern is what we expected given that shorter sea-sons require all local species to recruit in a smallerwindow of time.
Global climate change has been hypothesized toalter species interactions through a number of mech-anisms, including shifting species ranges, drivingspecies extinctions, altering ecosystem resilience andchanging competition dynamics (Peñuelas & Filella2001, Walther et al. 2002, Menzel et al. 2006). Re -views often do not address how changes in competi-tion may arise or how changes in competitive interac-tions may affect community assembly (but seeWolkovich & Cleland 2011, Pau et al. 2011). Ex -panded resource spectra (in this case the time thatrecruitment occurs) offer one potential mechanismfor altering interactions between species. Our resultssuggest that sites with higher temperatures have lesscommunity overlap than cooler sites. Thus, changesin the temperature regime may alter communitycharacteristics and functions by altering importantspecies interactions, such as competition and facilita-tion. Because within-site annual variation in temper-ature does not necessarily lead to changes in competition as measured by overlap, differences incommunity overlap may be caused by sustained tem-perature differences that operate on longer timescales.
The observed community niche overlap was neverlower than would be expected at random, suggest-ing that the recruitment dynamics in the study sys-tem are likely constrained by environmental andphysiological factors. Generally, communities con-strained by abiotic factors will show greater recruit-ment symmetry between species (Albrecht & Gotelli2001). When competition is a dominant factor struc-turing communities, there will be inverse symmetrybe tween species recruitment curves. Our between-site comparisons suggest that GLP might be undermore biological control (i.e. competition, facilitationand predation), whereas NK may be more con-strained by physical factors, with AP exhibitingintermediate traits. This pattern fits well with ourunderstanding of the temperature regimes at eachsite. GLP tended to warm up earliest in spring andremains warm for the longest period of time becauseof the shallow bathy metry of its harbor. NK re -mained coolest in summer, with AP representingthe intermediate site. We therefore predict that theinterspecific competition among recruits at NK willbe greater than at the other sites because of theshared timing of recruitment, assuming an equaldensity of recruitment among sites. Differences inoverlap between sites that are separated by ~7 kmsuggest that phenologically driven communityresponses (and, thus, community heterogeneity) canoccur at relatively small scales.
69
Component Start of recruitment Duration of recruitment Sum of recruits 1 2 3 1 2 3 1 2 3
Independent variables 76.80 99.08 99.80 76.65 99.09 99.80 76.63 99.07 99.80Ascidiella aspersa 43.51 52.73 52.99 37.20 51.05 52.23 39.17 39.91 41.24Botrylloides violaceus 38.34 39.97 59.11 16.94 17.27 22.25 24.88 26.12 45.93Botryllus schlosseri 21.23 24.63 28.21 13.03 17.65 18.73 6.20 25.49 53.74Bowerbankia gracilis 0.32 3.10 3.90 10.72 12.71 12.72 44.55 48.37 50.18Bugula neritina 0.82 0.89 0.90 3.71 5.09 7.33 12.24 13.40 18.36Bugula turrita 40.13 42.74 58.11 48.39 50.88 66.09 42.52 42.58 52.56Ciona intestinalis 49.35 56.12 56.13 66.68 66.92 67.21 23.64 27.27 28.51Cryptosula pallasiana 0.82 2.04 24.03 4.21 4.21 37.54 1.14 2.12 11.09Didemnum vexillum 39.85 40.14 50.79 42.21 50.77 55.05 17.69 17.70 28.57Diplosoma listerianum 0.89 0.95 60.33 0.89 1.03 60.86 17.10 19.01 33.65Electra crustulenta 4.71 15.45 15.47 3.43 27.30 27.77 1.14 18.70 20.62Electra pilosa 8.63 8.73 18.23 0.34 4.20 5.23 10.47 42.50 45.18Halichondria sp. 7.68 7.90 8.06 3.47 7.32 7.74 1.27 41.14 47.30Hydroides dianthus 33.13 35.12 38.17 22.87 23.62 34.88 22.40 40.45 49.30Molgula manhattensis 43.79 43.87 66.82 57.12 59.77 69.33 6.67 27.19 59.55Obelia sp. 30.54 32.19 43.86 24.57 26.08 33.83 1.19 15.34 26.06Schizoporella errata 13.96 23.20 24.64 29.40 32.24 36.95 3.40 9.80 10.34Spirorbis spp. 6.12 6.33 7.76 6.44 6.70 6.71 34.97 42.81 42.81
Table 4. The percentage of variance explained (partial r2) for each dependent variable and independent variables calculatedfrom loading weights of partial least squares regression (PLSR). n = 21, except Diplosoma listerianum (n = 18) for start of
recruitment. Bold indicates significance at α = 0.05
Mar Ecol Prog Ser 489: 61–74, 201370
Sp
ecie
s
T
erm
Sta
rt o
f re
cru
itm
ent
D
ura
tion
of
recr
uit
men
tS
um
of
recr
uit
s
E
stim
ate
± S
E
t-v
alu
e
p(>
|t|)
Est
imat
e ±
SE
t
-val
ue
p(>
|t|)
Est
imat
e ±
SE
t
-val
ue
p
(>|t
|)
Asc
idie
lla
asp
ersa
M
odel
1
M
odel
1
M
odel
1
I
nte
rcep
t
3
42.4
6 ±
49.
01
6
.99
0.00
0
–
242.
75 ±
111
.67
–2.1
7
0.
043
–65
82.4
2 ±
226
8.25
–2.9
0
0.0
09
G
DD
–0.
19 ±
0.0
5
–
4.06
0.00
1
0.
39 ±
0.1
1
3
.73
0.00
1
7.1
6 ±
2.1
4
3
.35
0
.003
Bot
ryll
oid
es v
iola
ceu
s
Mod
el 1
Mod
el 1
Mod
el 1
In
terc
ept
223
.92
± 1
3.86
16.1
6
0.
000
107.
20 ±
27.
94
3
.84
0.00
1
919
6.86
± 2
210.
98
4
.16
0
.001
GD
D
–
0.06
± 0
.01
–4.
43
0.
000
0.06
± 0
.03
2.2
5
0.
037
–7.
40 ±
2.0
8
–
3.55
0
.002
Bot
ryll
us
sch
loss
eri
Mod
el 3
Mod
el 3
Mod
el 2
In
terc
ept
–
129.
66 ±
82.
77
–1
.57
0.13
8
445
.45
± 1
29.7
9
3
.43
0.00
4
41
232.
84 ±
115
35.5
0
3
.57
0
.002
GD
D
0
.25
± 0
.08
3.1
9
0.
006
–
0.23
± 0
.12
–1.9
1
0.
075
–
33.3
0 ±
10.
82
–
3.08
0
.007
GL
P
3
59.5
0 ±
128
.38
2.8
0
0.
013
–33
2.15
± 2
01.3
0
–1
.65
0.12
0
239
5.36
± 1
648.
43
1
.45
0
.164
NK
3
61.8
0 ±
153
.47
2.3
6
0.
032
–66
1.83
± 2
40.6
4
–2
.75
0.01
5
–
7456
.66
± 1
818.
01
–
4.10
0
.001
GD
D:G
LP
–
0.33
± 0
.11
–2.9
2
0.
011
0.31
± 0
.18
1.7
1
0.
108
GD
D:N
K
–
0.34
± 0
.16
–2.1
4
0.
049
0.66
± 0
.25
2.6
4
0.
018
Bow
erb
ank
i g
raci
lis
Mod
el 1
In
terc
ept
–80
6.75
± 3
56.4
4
–2
.26
0
.036
GD
D
0.
89 ±
0.3
4
2
.65
0
.016
Bu
gu
la n
erit
ina
Mod
el 3
Mod
el 3
In
terc
ept
5
02.6
2 ±
396
.37
1.2
7
0.
224
–28
8.20
± 3
31.2
4
–
0.87
0.39
8
G
DD
–0.
28 ±
0.3
7
–
0.76
0.45
9
0.
36 ±
0.3
1
1
.17
0.25
9
G
LP
–
1562
.53
± 6
14.7
6
–2
.54
0.02
3
1
524.
98 ±
513
.74
2.9
7
0.
010
NK
–
93.7
8 ±
734
.91
–0.
13
0.
900
–13
9.12
± 6
14.1
5
–
0.23
0.82
4
G
DD
:GL
P
1.
35 ±
0.5
5
2
.47
0.02
6
–1.
33 ±
0.4
6
–2
.91
0.01
1
G
DD
:NK
0.0
7 ±
0.7
6
0
.09
0.93
0
0.
18 ±
0.6
3
0
.28
0.78
5
Bu
gu
la t
urr
ita
M
odel
1
Mod
el 1
Mod
el 1
In
terc
ept
263
.48
± 2
1.64
12.1
7
0.
000
–91
.67
± 4
3.43
–2.1
1
0.
048
–145
65.0
9 ±
800
9.27
–1.8
2
0.0
85
G
DD
–0.
09 ±
0.0
2
–
4.50
0.00
0
0.
23 ±
0.0
4
5
.58
0.00
0
1
8.38
± 7
.54
2.4
4
0.0
25
Cio
na
inte
stin
alis
M
odel
1
M
odel
1
M
odel
1
I
nte
rcep
t
3
25.4
4 ±
43.
90
7
.41
0.00
0
–
88.9
7 ±
57.
72
–1
.54
0.14
0
–
535.
51 ±
310
.36
–1.7
3
0.1
01
G
DD
–0.
17 ±
0.0
4
–
4.07
0.00
1
0.
24 ±
0.0
5
4
.37
0.00
0
0.6
2 ±
0.2
9
2
.13
0
.047
Cry
pto
sula
pal
lasi
ana
M
odel
3
M
odel
3
M
odel
3
I
nte
rcep
t
–19
69.9
2 ±
888
.71
–2.2
2
0.
043
4140
0.14
± 1
2883
.08
3.2
1
0.0
06
G
DD
2
.11
± 0
.83
2.5
3
0.
023
–
36.6
2 ±
12.
10
–
3.03
0
.008
GL
P
2
907.
39 ±
137
8.38
2.1
1
0.
052
–
6943
6.18
± 1
9981
.54
–3.
48
0.0
03
N
K
1
098.
71 ±
164
7.77
0.6
7
0.
515
–
4697
9.55
± 2
3886
.75
–1.9
7
0.0
68
G
DD
:GL
P
–2
.71
± 1
.23
–2.2
1
0.
043
62.5
8 ±
17.
79
3
.52
0
.003
GD
D:N
K
–0.
86 ±
1.7
0
–
0.51
0.62
0
44
.48
± 2
4.65
1.8
0
0.0
91
Tab
le 5
. Sig
nif
ican
t un
ivar
iate
leas
t sq
uar
es r
egre
ssio
n b
etw
een
the
star
t of r
ecru
itm
ent,
du
rati
on o
f rec
ruit
men
t an
d s
um
of r
ecru
its
and
gro
win
g d
egre
e d
ays
(GD
D) f
orth
e sp
ecie
s in
clu
ded
in
th
e ov
erla
p a
nal
ysis
. M
odel
ref
ers
to (
1) G
DD
, (2
) G
DD
an
d S
ite,
an
d (
3) f
ull
mod
el.
GL
P:
Gro
ton
Lon
g P
oin
t; N
K:
Noa
nk
. B
old
: si
gn
ific
ant
p-v
alu
e. B
lan
k c
ells
: no
sig
nif
ican
t m
odel
Reinhardt et al.: Effects of temperature on phenology and niche overlap 71
Sp
ecie
s
T
erm
Sta
rt o
f re
cru
itm
ent
D
ura
tion
of
recr
uit
men
tS
um
of
recr
uit
s
E
stim
ate
± S
E
t-v
alu
e
p(>
|t|)
Est
imat
e ±
SE
t
-val
ue
p(>
|t|)
E
stim
ate
± S
E
t-v
alu
e
p(>
|t|)
Did
emn
um
vex
illu
m
M
odel
1
M
odel
1
M
odel
1
I
nte
rcep
t
–22
.39
± 1
03.4
2
–
0.22
0.83
1
405
.17
± 1
30.5
4
3
.10
0.00
6
–27
6.89
± 1
673.
27
–
0.17
0
.871
GD
D
0
.22
± 0
.10
2
.20
0.04
1
–0.
30 ±
0.1
2
–2
.42
0.02
5
0.4
6 ±
1.5
7
0.2
9
0.7
73
G
LP
308
.32
± 2
595.
23
0.1
2
0.9
07
N
K
1
5850
.41
± 3
102.
44
5.1
1
0.0
00
G
DD
:GL
P
–
0.49
± 2
.31
–0.
21
0.8
36
G
DD
:NK
–
16.6
8 ±
3.2
0
–
5.21
0
.000
Dip
loso
ma
list
eria
nu
m
M
odel
2
M
odel
2
In
terc
ept
147
9.21
± 4
21.2
2
3.5
1
0.
004
–
1160
.990
± 2
71.3
7
–
4.28
0.00
1
G
DD
–1.1
8 ±
0.3
9
–
3.05
0.00
9
1.
21 ±
0.2
5
4
.74
0.00
0
G
LP
126
.22
± 4
9.63
2
.54
0.02
5
–15
1.13
± 3
8.78
–3.
90
0.
001
NK
–17
8.09
± 6
3.06
–2.
82
0.
014
149.
49 ±
42.
77
3
.50
0.00
3
Ele
ctra
cru
stu
len
ta
Ele
ctra
pil
osa
Hal
ich
ond
ria
bow
erb
ank
i
M
odel
3
I
nte
rcep
t
–27
8.55
± 6
9.66
–4.
00
0.
002
G
DD
0.3
9 ±
0.0
7
5.9
9
0.
000
G
LP
353.
20 ±
136
.47
2
.59
0.02
4
NK
725
.76
± 1
27.2
9
5.7
0
0.
000
G
DD
:GL
P
–
0.33
± 0
.12
–2.
73
0.
018
G
DD
:NK
–
0.70
± 0
.13
–5.
32
0.
000
Mol
gu
la m
anh
atte
nsi
s
Mod
el 1
Mod
el 3
Mod
el 2
In
terc
ept
320.
27 ±
31.
60
1
0.13
0.00
0
46
.14
± 1
70.8
0
0
.27
0.79
1
3
0280
.02
± 8
038.
95
3.7
7
0.0
02
G
DD
–0.
16 ±
0.0
3
–
5.36
0.00
0
0.
10 ±
0.1
6
0
.62
0.54
4
–2
5.89
± 7
.54
–3.
43
0.0
03
G
LP
–1
4.63
± 2
64.9
1
–
0.06
0.95
7
188
7.09
± 1
148.
77
1.6
4
0.1
19
N
K
–73
2.43
± 3
16.6
8
–2
.31
0.03
5
–
5855
.07
± 1
266.
95
–
4.62
0
.000
GD
D:G
LP
0.0
3 ±
0.2
4
0
.12
0.90
3
G
DD
:NK
0.7
5 ±
0.3
3
2
.30
0.03
7
Ob
elia
sp
.
Sch
izop
orel
la e
rrat
a
M
odel
1
In
terc
ept
426.
37 ±
154
.57
2.7
6
0.
013
GD
D
–0.
31 ±
0.1
5
–2
.11
0.04
8
Sp
iror
bis
sp
p.
M
odel
3
Mod
el 1
In
terc
ept
–77
1.52
± 3
71.4
6
–
2.08
0.05
5
300
0.11
± 9
22.9
3
3.2
5
0.0
04
G
DD
0.8
3 ±
0.3
5
2.3
9
0.
031
–2.
27 ±
0.8
7
–
2.61
0
.017
GL
P
140
0.87
± 5
76.1
4
2.4
3
0.
028
N
K
9
73.2
2 ±
688
.74
1
.41
0.17
8
GD
D:G
LP
–1.
29 ±
0.5
1
–
2.52
0.02
4
GD
D:N
K
–0.
92 ±
0.7
1
–
1.29
0.21
6
Tab
le 5
(co
nti
nu
ed)
Mar Ecol Prog Ser 489: 61–74, 201372
The phenology of many species is driven by tem-perature (Visser & Both 2005). Here, we show thatseasonal GDD can predict the first day of recruitmentfor many organisms in southern New England epi-faunal communities. In some cases, this pattern wasconsistent for a species across sites, whereas in othercases, we observed idiosyncratic responses.
Although there is no a priori reason that the phenol-ogy of different species should be predicted by a singletemperature parameter (although many temperatureparameters covary), the relative loadings of compo-nents in PLSR and subsequent regression ana lysis in-dicated that site-specific factors are important in de-termining recruitment phenology. The variability inpredictors further indicates the difficulty of developingphenological models that account for spatial and tem-poral heterogeneity at small scales. The predictor (cu-mulative GDD through September) that we identifiedas most useful through the PLSR was not a leading in-dicator of recruitment timing, and thus limits its utilityin designing ‘real time’ prediction of recruitment. Cu-mulative GDD through September provided more in-formation than other predictors because it incorpo-rates information from all previous months in a givenseason. Problems may arise when some environmen-tal conditions are not accounted for, such as tempera-ture variability and, possibly, day-length, salinity andproductivity; however, this study has identified somegeneral trends that may serve as a starting point formodeling and predicting future phenological patternsfor the 18 investigated benthic invertebrate species.
Idiosyncratic responses to temperature variationare not unique to the present study. Forrest et al.(2010) report idiosyncratic changes in flowering timeamong subalpine plants in Colorado. Although theresponses to temperature varied in magnitudeamong the examined benthic species, the inter-annual responses did not affect community overlap,and differential shifts in the timing of recruitment didnot translate into clear differences in the order inwhich species were recruited.
We found that the length of the recruitment seasonwas often predicted by GDD. The length of therecruitment season and first date of recruitment werenot independent of each other, and in most cases,species that showed a shift in the beginning ofrecruitment in re sponse to temperature also exhib-ited a longer re cruitment season. When all speciesand sites were aggregated, there was a strong nega-tive relationship detected between the length of therecruitment season and the date of first recruitment(i.e. species that recruit earlier also displayed longerrecruitment seasons).
In contrast to previous findings (Stachowicz et al.2002), we found that the onset of recruitment waspositively correlated with temperature for both resi-dent and non-native species. Here, we show that thetiming of the first recruitment of many resident spe-cies can be predicted by temperature. For many resi-dent species, the responses to shifts in temperaturewere similar to those of non-native species in thatthey recruited earlier under warmer temperatures(i.e. Bugula turrita, Ciona intestinalis and Molgulamanhattensis). However, there are some species,both resident and non-native, that showed the oppo-site pattern. For example, the non-native tunicateDidemnum vexillum recruited later in the seasonwhen temperatures were higher. Complex responsesto temperature variations make it difficult to general-ize about species. Our results may be different fromprevious findings (i.e. Stachowicz et al. 2002)because we used recruitment data with a more com-plete temporal (i.e. year-round coverage) and spatialcoverage and because our temperature data werecollected at multiple sites.
Predicting the indirect effects of changes in overlapor competition can be difficult (Suttle et al. 2007). Weinterpreted overlap to reflect the relative potential forcompetition between recruits within the community.The decrease in community overlap coincident withdecreased temperatures illustrates the type ofchanges that may be occurring along temperaturegradients, such as related to latitude. A larger tempo-ral domain effectively increases the access to re -sources, with the result that inter-specific competi-tion among new recruits is reduced, assuming equalnumbers of recruits.
Less overlap may be particularly important duringthe initial stages of an invasion but less importantonce an invasive species is fully established (Sta-chowicz & Byrnes 2006). As resident species show aforward shift in their timing of recruitment unutilizedresources become available to invading species.Interestingly, the average time of recruitment forinvaders is correlated with the order in which theyinitially invaded the area. The most recent invadersfor which we have recruitment data (e.g. Diplosomalisterianum, Bugula neritina and Didemnum vexil-lum) recruited later in the year. This pattern mayoccur because recent invaders are warmer waterspecies (although this does not appear to be the casefor one recent invader, D. vexillum; McCarthy et al.2007). Additionally, because of shifts in the recruit-ment timing among resident organisms, there maybe an ‘open’ recruitment window available for in -vaders toward the end of the year. Species such as

Reinhardt et al.: Effects of temperature on phenology and niche overlap
D. vexillum are known to be weak competitors andcan be overwhelmed in habitats with high recruit-ment (Janiak et al. 2013). By recruiting at the end ofthe season, D. vexillum may avoid periods whererecruitment (and competition with other recruits) ishighest. We have yet to obtain recruitment data forthe most recent tunicate invader (Clavelina lepadi-formis) along the Connecticut coast (Reinhardt et al.2010), but data from this species would enable anadditional test of this hypothesis. Regardless ofwhether this hypothesis is correct, there appears tobe different controls on the timing of recruitment forinvasive species (see also Reinhardt et al. 2012).From the few years of data that have been collected,we observed that the latest recruiting species haveshifted their time of first recruitment earlier in theseason. The exact reason for this pattern is notentirely known. For B. neritina and D. listerianum,the effect may be temperature-related or could be asampling effect caused by a larger population size.This pattern may also be the result of a series of pop-ulations evolving toward earlier recruitment.
Acknowledgements. This research was partially supportedby U.S. EPA STAR and NSF grants awarded to R.B.W. andR.W.O. J.F.R. was supported by a fellowship from the LongIsland Sound Study for a portion of this work. Thanks to J.Carlton, R. Colwell, D. Avery and M. Whitney for helpfulinformation and suggestions. Many thanks to the individu-als who helped collect recruitment data and the anonymousreviewer.
LITERATURE CITED
Abrams PA (1980) Consumer functional response and com-petition in consumer-resource systems. Theor Popul Biol17: 80−102
Albrecht M, Gotelli NJ (2001) Spatial and temporal nichepartitioning in grassland ants. Oecologia 126: 134−141
Altman S, Whitlatch RB (2007) Effects of small-scale distur-bance on invasion success in marine communities. J ExpMar Biol Ecol 342: 15−29
Cross HZ, Zuber MS (1972) Prediction of flowering dates inmaize based on different methods of estimating thermalunits. Agron J 64: 351−355
Dijkstra JA, Westerman EL, Harris LG (2011) The effects ofclimate change on species composition, succession andphenology: a case study. Glob Change Biol 17: 2360−2369
Edwards KF, Stachowicz JJ (2012) Temporally varying larvalsettlement, competition, and coexistence in a sessileinvertebrate community. Mar Ecol Prog Ser 462: 93−102
Forrest J, Inouye DW, Thomson JD (2010) Flowering phenol-ogy in subalpine meadows: Does climate variation influ-ence community co-flowering patterns? Ecology 91: 431−440
Gotelli NJ, Graves GR (1996) Null models in ecology. Smith-sonian Institution Press, Washington, DC
Inger RF, Colwell RK (1977) Organization of contiguouscommunities of amphibians and reptiles in Thailand.Ecol Monogr 47: 229−253
Jackson JB (1977) Competition on marine hard substrata: the adaptive significance of solitary and colonial strate-gies. Am Nat 111: 743−767
Janiak DS, Osman RW, Whitlatch RB (2013) The role of spe-cies richness and spatial resources in the invasion suc-cess of the colonial ascidian Didemnum vexillum Kott,2002 in eastern Long Island Sound. J Exp Mar Biol Ecol443: 12−20
Karlson RH, Osman RW (2012) Species composition andgeographic distribution of invertebrates in fouling com-munities along the east coast of the USA: a regional per-spective. Mar Ecol Prog Ser 458: 255−268
Legendre P, Legendre L (1998) Numerical ecology, 2nd English edn. Elsevier, Amsterdam
Loreau M (1989) Coexistence of temporally segregated com-petitors in a cyclic environment. Theor Popul Biol 36: 181−201
Loreau M (1992) Time scale of resource dynamics and coex-istence through time partitioning. Theor Popul Biol 41: 401−412
McCarthy A, Osman RW, Whitlatch RB (2007) Effects of tem-perature on growth rates of colonial ascidians: a compar-ison of Didemnum sp. to Botryllus schlosseri and Botryl-loides violaceus. J Exp Mar Biol Ecol 342: 172−174
Menzel A, Sparks TH, Estrella N, Koch E and others (2006)European phenological response to climate changematches the warming pattern. Glob Change Biol 12: 1969−1976
Mevik BH, Wehrens R (2007) The pls package: principalcomponent and partial least squares regression in R.J Stat Soft 18: 1: 24
Mook DH (1981) Effects of disturbance and initial settle-ment on fouling community structure. Ecology 62: 522−526
Nandakumar K (1996) Importance of timing of panel expo-sure on the competitive outcome and succession of ses-sile organisms. Mar Ecol Prog Ser 131: 191−203
Osman RW (1977) The establishment and development of amarine epifaunal community. Ecol Monogr 47: 37−63
Osman RW, Whitlatch RB, Malatesta RJ (1992) Potential roleof micro-predators in determining recruitment into amarine community. Mar Ecol Prog Ser 83: 35−43
Pau S, Wolkovich EM, Cook BI, Davies TJ, Kraft NJB, Bolm-gre KE, Betancourt JL, Cleland EE (2011) Predictingphenology by integrating ecology, evolution and climatescience. Glob Change Biol 17: 3633−3643
Peñuelas J, Filella I (2001) Phenology: responses to a warm-ing world. Science 294: 793−795
R Development Core Team (2012) R: a language and envi-ronment for statistical computing. R foundation for statis-tical computing, Vienna. www.r-project.org
Reinhardt JF, Stefaniak LM, Hudson DM, Mangiafico J,Gladych R, Whitlatch RB (2010) First record of the non-native light bulb tunicate Clavelina lepadiformis (Müller,1776) in the northwest Atlantic. Aquat Invasions 5: 185−190
Reinhardt JF, Osman RW, Whitlatch RB (2012) A phenologi-cal mid-domain analysis of non-native and native speciesrecruitment richness. J Ecosyst Ecogr 2: 4
Schoener TW (1974) The compression hypothesis and tem-poral resource partitioning. Proc Natl Acad Sci USA 71: 4169−4172
73

Mar Ecol Prog Ser 489: 61–74, 2013
Sousa WP (1979) Disturbance in marine intertidal boulderfields: the nonequilibrium maintenance of species diver-sity. Ecology 60: 1225−1239
Stachowicz JJ, Byrnes J (2006) Species diversity, invasionsuccess, and ecosystem functioning: disentangling theinfluence of resource competition, facilitation and extrin-sic factors. Mar Ecol Prog Ser 311: 251−262
Stachowicz JJ, Terwin JR, Whitlatch RB, Osman RW (2002)Linking climate change and biological invasions: oceanwarming facilitates nonindigenous species invasions.Proc Natl Acad Sci USA 99: 15497−15500
Suttle KB, Thompson MA, Power ME (2007) Species inter -action reverse grassland responses to changing climate.Science 315: 640−642
Tarjuelo I, Posada D, Crandall KA, Pascual M, Turon X(2001) Cryptic species of Clavelina (Ascidiacea) in twodifferent habitats: harbours and rocky littoral zones inthe northwestern Mediterranean. Mar Biol 139: 455−462
Tokeshi M (1986) Resource utilization, overlap and tempo-
ral community dynamics: a null model analysis of anepiphytic chironomid community. J Anim Ecol 55: 491−506
Visser ME, Both C (2005) Shifts in phenology due to globalclimate change: the need for a yardstick. Proc Biol Sci272: 2561−2569
Walther GR, Post E, Convey P, Menzel A and others (2002)Ecological responses to recent climate change. Nature416: 389−395
Westerman EL, Whitlatch RB, Dijkstra JA, Harris LG (2009)Variation in brooding period masks similarities inresponse to changing temperatures. Mar Ecol Prog Ser391: 13−19
Wolkovich EM, Cleland EE (2011) The phenology of plantinvasions: a community ecology perspective. Front EcolEnviron 9: 287−294
Yang LH, Rudolf VHW (2010) Phenology, ontogeny and theeffects of climate change on the timing of species inter -actions. Ecol Lett 13: 1−10
74
Editorial responsibility: Romuald Lipcius,Gloucester Point, Virginia, USA
Submitted: October 5, 2012; Accepted: May 29, 2013Proofs received from author(s): August 9, 2013