
EFFECTS OF PRESSURE ON STEAM TURBINE...
62
EFFECTS OF PRESSURE ON STEAM TURBINE PERFORMANCE IN A SMALL SCALE POWER PLANT BALA MURUGAN CHANDIRAN FACULTY OF ENGINEERING UNIVERSITY OF MALAYA KUALA LUMPUR 2018
-
Upload
nguyenhanh -
Category
Documents
-
view
213 -
download
0
Transcript of EFFECTS OF PRESSURE ON STEAM TURBINE...

EFFECTS OF PRESSURE ON STEAM TURBINE PERFORMANCE IN A SMALL SCALE POWER PLANT
BALA MURUGAN CHANDIRAN
FACULTY OF ENGINEERING
UNIVERSITY OF MALAYA KUALA LUMPUR
2018

EFFECTS OF PRESSURE ON STEAM TURBINE
PERFORMANCE IN A SMALL SCALE POWER PLANT
BALA MURUGAN CHANDIRAN
THESIS SUBMITTED IN FULFILMENT
FULFILLMENT OF THE REQUIREMENTS FOR THE
MASTER OF MECHANICAL ENGINEERING
FACULTY OF ENGINEERING
UNIVERSITY OF MALAYA
KUALA LUMPUR
2018

ii
UNIVERSITY OF MALAYA
ORIGINAL LITERARY WORK DECLARATION
Name of Candidate: Bala Murugan Chandiran (I.C/Passport No:
Matric No: KQK170002
Name of Degree: Master of Mechanical Engineering
Title of Research Report: Effects of Pressure on Steam Turbine Performance in a
Small Scale Power Plant
Field of Study:
I do solemnly and sincerely declare that:
(1) I am the sole author/writer of this Work;
(2) This Work is original;
(3) Any use of any work in which copyright exists was done by way of fair dealing
and for permitted purposes and any excerpt or extract from, or reference to or
reproduction of any copyright work has been disclosed expressly and
sufficiently and the title of the Work and its authorship have been
acknowledged in this Work;
(4) I do not have any actual knowledge nor do I ought reasonably to know that the
making of this work constitutes an infringement of any copyright work;
(5) I hereby assign all and every rights in the copyright to this Work to the
University of Malaya (“UM”), who henceforth shall be owner of the copyright
in this Work and that any reproduction or use in any form or by any means
whatsoever is prohibited without the written consent of UM having been first
had and obtained;
(6) I am fully aware that if in the course of making this Work I have infringed any
copyright whether intentionally or otherwise, I may be subject to legal action
or any other action as may be determined by UM.
Candidate’s Signature Date:
Subscribed and solemnly declared before,
Witness’s Signature Date:
Name:
Designation:

iii
EFFECTS OF PRESSURE ON STEAM TURBINE PERFORMANCE IN A
SMALL SCALE POWER PLANT
ABSTRACT
Power plant consists of 4 main components that determine the efficiency of the whole
system. Each component has its own function and there are always room for
improvements to increase the efficiency. Advancing the procedure of working condition
of power plant impressively enhanced the turbine power output, in which simultaneously
reduce the energy consumption. The industrial sector being the biggest player in power
plant usage, constantly seeking improvisation and effectiveness of the power plant
operation. With the present market trend of continuous rising of fuel and energy prices,
reducing the energy requirement has become a top objective. Every minor or major
changes in power plant system greatly affect the output. The main objective of this study
was to vary the boiler pressure plus turbine pressure and study the efficiency of the steam
turbine power output. Therefore, modification and changes were done for the operating
conditions of boiler pressure and turbine pressure which influenced the power plant
turbine performance significantly. Energy balance of the plant was analysed in the
experiment by varying aforesaid parameters. Detailed calculation and analysis had been
done for each sets of experiment outcome. Increasing these parameters value influences
the steam utilization in the turbines and further increased the turbine effectiveness. The
examination done shows that increasing boiler pressure and turbine pressure enhance the
power yield of the turbine, efficiency and effectiveness in regular steam control plants. In
the end of thesis, the experiment had been conducted successfully and some
recommendation had been identified for future research and development.
Keywords: Steam Turbine Power Plant, Boiler, Turbine, Pressure, Power Output.

iv
KESAN TEKANAN TERHADAP PRESTASI TURBIN STIM DALAM LOJI
JANAKUASA SKALA KECIL
ABSTRAK
Loji janakuasa terdiri daripada 4 komponen utama yang menentukan kecekapan
seluruh sistem. Setiap komponen mempunyai fungsi tersendiri dan sentiasa ada ruang
untuk penambahbaikan bagi meningkatkan kecekapan. Memajukan prosedur keadaan
kerja loji janakuasa mampu meningkatkan pengeluaran kuasa turbin dan pada masa yang
sama mengurangkan penggunaan tenaga. Sektor industri sentiasa mencari cara
penambahbaikan dan keberkesanan operasi loji janakuasa disebabkan mereka merupakan
pengguna utama loji janakuasa. Tambahan pula dengan trend pasaran semasa bagi bahan
api dan tenaga yang sentiasa meningkat, mengurangkan penggunaan tenaga menjadi
objektif utama. Setiap perubahan sama ada yang kecil atau besar memberi impak yang
besar terhadap penghasilan tenaga. Objektif utama kajian ini adalah untuk mengkaji
pengubahan tekanan dandang dan tekanan turbin terhadap kecekapan penghasilan kuasa
turbin stim. Oleh itu, pengubahan dilakukan pada keadaan operasi tekanan dandang dan
tekanan turbin yang mempengaruhi prestasi turbin loji janakuasa. Imbangan tenaga dikaji
dengan mengubah faktor manipulasi tersebut. Pengiraan dan analisis terperinci dilakukan
pada setiap set hasil eksperimen. Peningkatan nilai kedua-dua tekanan mempengaruhi
penggunaan stim di turbin dan seterusnya meningkatkan keberkesanan turbin. Hasil
eksperimen ini menunjukkan bahawa tekanan dandang dan tekanan turbin yang semakin
menaik akan meningkatkan tenaga turbin, kecekapan dan keberkesanan loji janakuasa
stim. Akhirnya, eksperimen telah dijalankan dengan jayanya serta beberapa cadangan
telah dikenal pasti untuk penyelidikan dan pembangunan pada masa hadapan.
Kata kunci: Loji Janakuasa Turbin Stim, Dandang, Turbin, Tekanan, Hasil Tenaga.

v
ACKNOWLEDGEMENTS
Praise and thanks to God first and foremost whose blessing enabled me to accomplish
this study. I wish to express my deepest appreciation to my supervisor, Dr. Mohd Zamri
Bin Zainon for his continuous guidance, constructive suggestion, close supervision and
moral support to complete this task. A special thanks to my parents and family members
for their continuous support and encouragement throughout this research being carried
out.
Besides that, I would like to express my heartfelt gratitude to the lab assistant who are
always there during my experiment and helpful in guiding me with using the lab
equipment. I truly thank all my friends who helped me with their never ending help and
encouragement that helped me overcome my obstacles

vi
TABLE OF CONTENTS
Abstract ............................................................................................................................ iii
Abstrak ............................................................................................................................. iv
Acknowledgements ........................................................................................................... v
Table of Contents ............................................................................................................. vi
List of Figures ................................................................................................................ viii
List of Tables..................................................................................................................... x
List of Symbols and Abbreviations .................................................................................. xi
List of Appendices .......................................................................................................... xii
CHAPTER 1: INTRODUCTION .................................................................................. 1
1.1 Project Background ................................................................................................. 1
1.2 Problem Statement ................................................................................................... 2
1.3 Project Objective ..................................................................................................... 2
1.4 Project Scope ........................................................................................................... 3
CHAPTER 2: LITERATURE REVIEW ...................................................................... 4
2.1 History of Power Plant............................................................................................. 5
2.2 Thermal Power Station ............................................................................................ 7
2.2.1 Advantages of Thermal Power Plants ........................................................ 8
2.2.2 Disadvantages of Thermal Power Plants .................................................... 8
2.3 Thermal Power Plant System................................................................................... 9
2.3.1 Analyzing Power System ......................................................................... 10
2.3.1.1 Turbine ...................................................................................... 10
2.3.1.2 Condenser .................................................................................. 11
2.3.1.3 Pump ........................................................................................ 12

vii
2.3.1.4 Boiler ........................................................................................ 12
2.3.1.5 Performance Analysis ............................................................... 13
2.3.2 Ideal Rankine Cycle ................................................................................. 14
2.3.3 Effects of Boiler and Condenser Pressure on the Rankine Cycle ............ 16
2.4 Effects of Condenser Pressure on the Rankine Cycle ........................................... 17
2.5 Improving Performance ......................................................................................... 22
2.5.1 Superheat .................................................................................................. 23
CHAPTER 3: RESEARCH METHODOLOGY ....................................................... 24
3.1 Experiment Set Up ................................................................................................. 24
3.2 Steam Cycle ........................................................................................................... 26
CHAPTER 4: RESULTS AND DISCUSSIONS ........................................................ 31
4.1 Experimental Condition ......................................................................................... 31
4.2 Results .................................................................................................................. 32
4.3 Ideal Cycle vs Experimental Result ....................................................................... 33
4.4 Discussion .............................................................................................................. 34
CHAPTER 5: CONCLUSION AND RECOMMENDATION ................................. 42
5.1 Recommendation ................................................................................................... 43
References ....................................................................................................................... 44
Appendix ......................................................................................................................... 46
Experimental Data ........................................................................................................... 47
Calculated Results ........................................................................................................... 48
Steam Properties.............................................................................................................. 49
viii
LIST OF FIGURES
Figure 1.1: STEM ISI IMPIANTI 3-kW........................................................................... 3
Figure 2.1: Components of thermal power plant (Michael J. Moran, 2014) .................... 9
Figure 2.2: Work and heat transfer principal of subsystem A(Michael J. Moran, 2014) 10
Figure 2.3: Temperature-entropy of the ideal Rankine Cycle ......................................... 14
Figure 2.4: Effects of varying operating pressure on the ideal Rankine cycle ............... 17
Figure 2.5: Variation of thermal efficiency with respect to condenser pressure ............ 18
Figure 2.6: Variation of net power with respect to condenser pressure .......................... 18
Figure 2.7: Condenser pressure vs cooling water inlet temperature ............................... 19
Figure 2.8: Variation of condenser heat transfer rate vs cooling water inlet temperature
......................................................................................................................................... 20
Figure 2.9: Condenser steam load vs condenser pressure ............................................... 21
Figure 2.10: Rankine cycle with superheater .................................................................. 23
Figure 3.1: Basic components of steam turbine power plant .......................................... 24
Figure 3.2: Component set-up in lab ............................................................................... 25
Figure 3.3: Pressure gauge, P1 connected at boiler ......................................................... 26
Figure 3.4: Superheater installed along the steam pipeline............................................. 27
Figure 3.5: Pressure gauge, P2 connected at turbine ....................................................... 28
Figure 3.6: Turbine connected through shaft with generator .......................................... 29
Figure 3.7: Complete experiment set-up ......................................................................... 30
Figure 4.1 Deviation of Actual Vapor Power Cycle from the Ideal Rankine Cycle (Yunus
A. Cengel, 2015a) ........................................................................................................... 33
Figure 4.2 Average Turbine Rotational Speed (RPM).................................................... 34
Figure 4.3 Power Output (Kw-H) for Different Boiler and Turbine Pressure Value ..... 35
Figure 4.4 Mechanical Work for Different Boiler and Turbine Pressure Value ............. 36

ix
Figure 4.5: Enthalpy value at boiler pressure 7 bar ........................................................ 37
Figure 4.6: Enthalpy value at boiler pressure 8 bar ........................................................ 38
Figure 4.7: Entropy value at boiler pressure 7 bar .......................................................... 39
Figure 4.8: Entropy value at boiler pressure 8 bar .......................................................... 39
Figure 4.9 Efficiency for Different Boiler and Turbine Pressure Value ......................... 41

x
LIST OF TABLES
Table 2.1: Process orders ................................................................................................ 15
Table 3.1 Diesel fuel properties ...................................................................................... 25
Table 4.1 Diesel fuel heat input value ............................................................................. 31
Table 4.2 Experimental Results ...................................................................................... 32
Table 4.3 Power Output for Different Boiler and Turbine Pressure Value .................... 35
Table 4.4 Mechanical Work for Different Boiler and Turbine Pressure Value .............. 36
Table 4.5 Enthalpy Value at Different Temperature ....................................................... 37
Table 4.6 Entropy Value at Different Temperature ........................................................ 38
Table 4.7 Efficiency for Different Boiler and Turbine Pressure Value .......................... 40

xi
LIST OF SYMBOLS AND ABBREVIATIONS
P : Pressure
T : Temperature
Ƞ : Efficiency
P : Power output rate
h : Mass specific enthalpy
m : Mass
W : Work done
s : Entropy
Q : Heat absorbed or released
W : Watt
J : Joule
kg : kilogram
𝜌 : Density
TNB : Tenaga Nasional Berhad
Int.rev : Internally reversible
CCGT : Combined Cycle Gas Turbine
HRSG : Heat Recovery Steam Generator
RPM : Rotation per minute

xii
LIST OF APPENDICES
Appendix A: Experimental Data 47
Appendix B: Calculated Results 48
Appendix C: Steam Properties 49

1
CHAPTER 1: INTRODUCTION
1.1 Project Background
Candles would be the only item fast selling in a grocery shop if electric utility company
in Peninsular Malaysia known as Tenaga Nasional Malaysia (TNB) announce there
would be power supply cut-off on any particular area be it for maintenance or any other
reason. Electricity/power and water has become such an important element in our daily
lives and a day being without either one of it would make our life so unbearable. Our
younger generation especially, have been used to having electricity and water without any
disruption and even 1 hour disruption would cause a major haywire in our daily live
routines. Dating back to 1800s, our ancestors used to pump the water from well and light
up lamp only during the required time to avoid wastage of oil. Then there’s a period where
water and power being supplied by the authority on daily basis but with time restriction
whereby they would only supply on specific time. Focusing on electricity and precisely,
without electricity our life would be a total mess and hassle.
Electricity is produced in the electricity generating stations called the power plant. It
is mainly working on turbine and since ages steam has been the medium as conveying
energy. To name it, there are many type of power plant such as thermal, nuclear,
hydraulic, gas and fossil fuel. Among everything that available, steam power plant use to
be the one commonly used as it is much more conventional and electricity production can
be expected in large scale. Being the most sought after, studies for steam power plant has
never stopped to improvise the power output and reduce the cost consumption. Dating the
existence of power plant goes back to 1880s where a fossil fueled power plant been started
using for supplying electricity. It was a very simple mechanism at that period which only
able to be delivered over short distance and been used for street lighting. Until today, new
invention in the development of power plant being continually researched to improve the
unit performance. Comparing from those days to today, power plant have advanced

2
beyond our imagination. It has been easy to be operated and more importantly analyzing
the energy of a power plant have made everyone’s life easy.
1.2 Problem Statement
The work is related to energy analyses and therefore utilizing the steam power plant
would be the best option in using it as an experiment apparatus and tools. Power output
of a steam power plant have never achieved efficiency of more than 80%. The research
to improve the efficiency have been continually carried out from time to time and its
enhancement can be achieved by analyzing every components and manipulating the
parameter to achieve a desired power output. A steam power plant has 4 main
components; the boiler, turbine, condenser and pump. These components have variable
parameter and analyse of the energy balance on the system will result the best
performance of a particular plant. In order to do that, it is very important to explore the
first and second law of thermodynamics and translate them into practicality.
1.3 Project Objective
Theoretically, the optimum performance on energy balance of a steam power plant can
be easily carried out by manipulating the pressure value on both boiler. Precisely, the
efficiency of the steam power plant can be analyzed with the following main objective;
1. Investigation on the effect of pressure variation on the performance of a steam
turbine power plant.
2. Measurement and analyses of pressure during the power plant operation.
3. Validation of the factors that affecting the steam turbine performance.

3
1.4 Project Scope
Utilizing the STEM ISI IMPIANTI 3-kW experimental power plant at Thermal-
hydraulic laboratory, Faculty of Engineering, University of Malaya experiments were
performed to study the effects of pressure on steam power plant. Therefore a complete
studies have been carried out on the energy balance of the system and the functionality of
steam power plant. A complete and thorough studies have been conducted on Rankine
cycle and other basic principle of working system of the steam power plant. Components
of a steam power plants were also analyzed in detail in order to avoid any error and
unnecessary factors that may compromise the results. Every parameter involves with the
components and the power plant were operated correctly using the ‘manual operating
book’. The first law of thermodynamic has been studied in detail to analyse the equation
for the energy balance and to conduct analyses for energy relationships involved in each
components.(Balmer, 2011a) Data were collected completely and analyses on energy
balance were carried out analytically to obtain the relationship of energy balance of this
steam power plant.
Figure 1.1: STEM ISI IMPIANTI 3-kW

4
CHAPTER 2: LITERATURE REVIEW
Power station or in another word referred to as power generating station are the
industrial facility made use of for the purpose of electric power generation. The electric
power normally generated and distributed in both small scale range of 100MW to 500MW
and mass scale of more than 500MW as well. The usual targeted location are the sub-
urban regions or the place far from main town due to the requisites like huge land and
water demand. Usually huge power stations would have one or more generators which
converts the mechanical power to electrical power. As it is known, the relative motion
between conductor and magnetic field creates the electrical source. Looking from a bigger
scope, power plants could be in different forms as follows: (a) Geo-thermal, (b)
Hydraulic, (c) Gas turbine, (d) Thermal and (e) Nuclear. Furthermore, Power plants of
Thermal, geo-thermal, and nuclear sources uses steam as their fluid for working and those
plants have a lot of likeliness with respect to their structure as well as cycle. Gas turbine
plants are often used as peaking units and combine cycle as well.(Kehlhofer, Hannemann,
Rukes, & Stirnimann, 2009) This is because they run just for limited time-periods of the
day in order to satisfy the demand of the peak load. However, they are being increasingly
used in conjunction with a bottoming steam plant in the mode of combined cycle power
generation. Other than that, we too have hydraulic power plant which has multipurpose
such cater for irrigation, afforestation, flood control, fisheries, navigation, etc. on the
downside note, they are expensive and take long time to build. In other hand, geothermal
power plant can only be built in certain geographical locations.

5
Among other power plant, thermal-based power plant generates beyond 80% of the
overall electricity produced globally. Some of the energy source for the thermal power
plant are coal, fuel oil, fossil fuel and natural gas while steam are the working fluid.
Besides that, steam is also required in many industries for the purpose of heat processing.
For the purpose of meeting the combined necessities for heat processing as well as power,
cogeneration plants are mostly installed. (16.1 Sasaki & Hisa, 2003)
2.1 History of Power Plant
The supply of electricity by the fueled fossil power-plants for the purpose of industrial
usage can be backdated from the 1870s whereby initially easy-to-use D.C. generators
were coupled together into piston steam engines that were reciprocating and coal-fired.
Primarily, electricity was used for essence of providing light in the districts and relatively
delivered over short distances. However, the initial ever-existent central stations for
generation was pioneered in September 1880 at Pearl Street, Manhattan, New York City
by Thomas Edison. Due to the usage of electricity only for lighting alone, it couldn’t
offer a market that was economical for the successive generations, which hence led to the
necessity of discovering new electricity applications. As more popularity began to arise
for the electric tramways at urban areas, this led to the subway system’s electric traction
adoption which was in coincidence with the extensive spread in latter parts of 1880s and
1890s, of the generating equipment’s construction.(Casella & Leva, 2003)
In early stage, power plant boiler designs using the coal or coal gas supply led to the
generation of steam in an easy-to-use tube for boiling water which typically operated at
0.9MPa (9 bar) and 150 ˚C (300 ˚F) and could have been in connection with a generator
of 30kW. Since that period, there have been evolvement of into a system of more
complexity by the typical power plant’s topography. In contemporary times, boiler
designs as well as turbine designs makes use of newly-made metallic alloys that has the

6
capability of operating at super-crucial conditions of 28.5 MPa (285bar) at a temperature
of 600˚C (1112˚F), thereby leading to an electricity generation of 1300MW.
However, in order to reduce the operating costs, there have been advances in the design
of plants from units generation based on Rankine Cycle wherein it normally could achieve
a 30-40% range of thermal efficiency. Nowadays, combined cycle gas turbine (CCGT)
units making use of the latest heat recovery steam generator (HRSG) plant can achieve
efficiency up to 50-70%. Locally, about 67% of efficiency is achieved by TNB’s Tunku
Jaafar Power Plant in Port Dickson. Other than that, the exclusion of the limitations of
the European Community with regards to the burning of gas to generate power, coupled
with other factors, has led to the units of the CCGT being deployed increasingly. Besides
that, different current plant may now appear in which the core principles for distributing
and generating have been put into mastery as of the end of the 19th century. In the new
era, the evolution of the design of power-plants has been largely incremental mainly
driven by the new technology.(Achilli, Cath, & Childress, 2009)
In the previous thirty years, we have seen the equipment used for micro-processing
being integrated into every facet for both distributing and generating whereas in the
coming 20 years we should see the technology develop further whereby bringing in
applications that are of pseudo-intelligence and which can definitely lead to the
harnessing of the rapid expansion of the power for computation. Other than that,
computer-based systems that are newly developed will as well lead to the increase in the
automation of the plant, enhance control of units, and allow additional flexibility in the
operation of plants as well as concurrently aid in maximizing unit efficiency and reducing
harmful emissions. In order to improve the unit emissions, better means of developing
designs of plants are continuously sought off until now.(Tschoegl, 2000b)

7
2.2 Thermal Power Station
It is important to state that a thermal-based power plant that is coal-fired or a thermal-
based power station, to a large extent, is the mostly used conventional approach of
generating power in electricity with a high efficiency that is reasonable. For example,
coal is being used by it as the essential supply of fuel for purpose of boiling the available
water to s stream that is super-heated in order to drive the turbine of the stream. Other
than coal as fuel supply, fuel oil, natural gas and fossil fuel are also widely being used to
boil the water. Then, there is a mechanical coupling of the turbine steam to a rotor
alternator whereas this will lead the rotation into generating electric power. India in
general, makes use of brown or bituminous coal in replacement of the fuel boiler which
consists of a content that is volatile with ranges from 8-13% as well as a 5-16% content
of ash. However, for purpose of the plant’s thermal efficiency enhancement, coal is
therefore made use of in the powdered or pulverized form.(Flynn, 2003)
Furthermore, steam is gotten inside the boiler of the steam at quite a high pressure,
with regards to a thermal power-plant that is coal fired through the pulverized coal been
burnt. Next, in order to attain a temperature that is highly extreme, there is need for the
super-heater to super heat the steam. Permission is then given to the steam that has been
super-heated to have entrance to the turbine wherein the blade of the turbine will undergo
rotation through the steam’s pressure.(Ersayin & Ozgener, 2015) As stated earlier,
mechanically coupled turbine with alternator is done in order to ensure that the rotor
rotates with the blades of the turbine’s rotation. Subsequently after the turbine has gone
through, there is a sudden fall by the pressure of the steam which eventually leads to the
steam’s volume decreased correspondingly. Also, after energy has been transferred to the
rotors of the turbine, it allows the steam to pass through the blades of the turbine into
turbines’ condenser steam. However, there is a circulation, with the aid of the pump of

8
cold water at the ambient temperature which eventually results to the wet steam’s low
pressure being condensed.
There were an additional supply of the condensed water into a water heater of lower
pressure wherein an increase in the feed water temperature occurs due to the lower
pressure steam, and the high pressure is heated again. This therefore gives an outline of a
thermal-based power-plant’s fundamental working methodology.(Gyftopoulos, 1997)
2.2.1 Advantages of Thermal Power Plants
a) Cheaper price of fuel for the power plant usage.
b) Less initial modal required compared to other power plant.
c) Requires less space as compared to hydro-electric power stations.
2.2.2 Disadvantages of Thermal Power Plants
a) The smoke and fumes produced by the power plant during operation pollute the
atmosphere.
b) Higher cost required for the operation of the power plant compared to hydroelectric
plant

9
2.3 Thermal Power Plant System
Most of the electricity generating power-plants are the variation of thermal power-
plant wherein the working fluid is water. The essential segments of the plant are
demonstrated in Figure 2.1 to get a better understanding and facilitate the analysis.
Separating the general plant into four subsystems marking from A to D on the diagram.
The main focus would be on the subsystem A whereby thermal power plant plays an
important role. Subsystem A consists of Boiler, Turbine, Condenser, and Pump parts.
Each analysis were made considering certain principles to verify the results. Energy
principles conservation, thermodynamics 2nd law, and Mass principles conservation, are
some of the factors that high priority were given.(Balmer, 2011c)
Figure 2.1: Components of thermal power plant (Michael J. Moran, 2014)

10
2.3.1 Analyzing Power System
The work and heat principal from the subsystem part A is shown clearly in in Figure
2.2. Constraint factors are taken into consideration such as stray heat transfer, kinetic and
potential energy changes that takes place will be neglected for accurate analysis. System
is considered operating in steady state. Let us examine how energy transfers take place in
each state under subsystem A. (Balmer, 2011b)
Figure 2.2: Work and heat transfer principal of subsystem A(Michael J. Moran,
2014)
2.3.1.1 Turbine
(Michael J. Moran, 2014)Steam at the 1st state from the boiler having a pressure and
temperature of a high degree expands via the turbine and leads to the production of W
(work) which later flows at the 2nd state to the Condenser with a pressure of very low
degree. Analyzing the work produced by turbine would be:

11
�̇�𝑡
�̇�= ℎ1 − ℎ2
where; �̇� = mass flow rate
�̇�𝑡
�̇� = work rate developed per unit mass of steam
2.3.1.2 Condenser
Condenser operates in a way that the transfer of heat occurs to the cooling water from
the steam which flows in a stream that is separated inside the condenser part itself. This
causes the steam to condense. Analyzing the steady condition of the rate of energy and
mass gives out;
�̇�𝑜𝑢𝑡
�̇�= ℎ2 − ℎ3
where; �̇� = mass flow rate
�̇�𝑜𝑢𝑡
�̇� = heat rate transferred by energy from the working fluid to
cooling water per unit mass of working fluid flowing through the
condenser

12
2.3.1.3 Pump
The liquid which has been condensed after flowing through condenser will be pumped
back into the boiler to continue the working fluid cycle. Analyzing the heat transfer,
energy rate and mass balances gives:
𝑊𝑝̇
�̇�= h4 – h3
where; �̇� = mass flow rate
�̇�𝑝
�̇� = Power rate per unit of mass that pass through the pump
2.3.1.4 Boiler
The working fluid that leaves the pump will enter back the boiler to complete the cycle
which will be again heated up to the point of saturation as well as evaporated in the boiler.
Analyzing the rate of balance between the energy and mass of a boiler gives:
�̇�𝑖𝑛
�̇�= ℎ1 − ℎ4
where; �̇� = mass flow rate
�̇�𝑖𝑛
�̇� = heat rate transferred by energy into the working fluid per unit mass
that pass through the boiler

13
2.3.1.5 Performance Analysis
The thermal-efficiency measures the level to which energy that is inputted into the
working-fluid and passes alongside the boiler is again converted into the output of the
network.(Ersayin & Ozgener, 2015) Therefore, the outputted network is of equivalence
to the inputted net-heat. In other ways, the expression of the thermal-efficiency can be;
Ƞ= �̇�𝑡
�̇�−
𝑊𝑝̇
�̇�
�̇�𝑖𝑛
�̇�
=(ℎ1−ℎ2)−(ℎ4−ℎ3)
(ℎ1−ℎ4)̇
Since the net work output equals the net heat input, therefore it is equivalently
Ƞ= �̇�𝑖𝑛
�̇�−
�̇�𝑜𝑢𝑡
�̇�
�̇�𝑖𝑛
�̇�
= 1 −�̇�𝑜𝑢𝑡
�̇�
�̇�𝑖𝑛
�̇�
= 1 −(ℎ2−ℎ3)
(ℎ1−ℎ4)̇

14
2.3.2 Ideal Rankine Cycle
When a working-fluid pass across many constituents of a power-plant cycle that is
easy without irreversibility, there will be a flow by the working fluid at a fixed pressure
across all those components as frictional pressure loss is considered absent from the
condenser and boiler. Whereas for the turbine and pump, the processes would be
isentropic in the absence of irreversibility and heat loss to surroundings. A clear figure
idealizing the Ideal Rankine Cycle shown in Figure 2.3 (1’ - 2’ – 3 – 4 - 1’) when including
the possibility of superheating the vapor is given below:(Tschoegl, 2000a)
Figure 2.3: Temperature-entropy of the ideal Rankine Cycle

15
Table 2.1: Process orders
Process
1-2
Isentropic expansion. Happens to the working fluid that pass through
the turbine to condenser pressure from saturated vapor at state 1.
Process
2-3
Heat transfer from the working fluid when it flows at fix pressure
through the condenser with saturated liquid at state 3.
Process
3-4
Isentropic compression in the pump to state 4
Process
4-1
Heat transfer to the working fluid when it flows at fix pressure through
the boiler.
(Gyftopoulos, 1997)However since an ideal Rankine cycle consists of internally
reversible process, we could analyze the areas under the process lines as heat transfers
per unit of mass. Considering the area “1 – b – c – 4 – a – 1”, representing the transferring
heat to the working-fluid as it pass across the boiler whereas area “2 – b – c – 3 – 2”
represents the transferred heat from the working-fluid that passes across the condenser,
both considered per unit of the flowing mass. As the pump idealized as operating without
irreversibility’s, earlier equation of pump work would be;
(𝑊𝑝̇
�̇�) 𝑖𝑛𝑡. 𝑟𝑒𝑣 = ∫ 𝑣𝑑𝑝
4
3

16
2.3.3 Effects of Boiler and Condenser Pressure on the Rankine Cycle
Thermodynamically, the cycle’s thermal efficiency would be increased if the energy’s
temperature is added averagely via the mean of increased transfer of heat. Study shown
above were the effects on performance when there are changes in the condenser pressure
and boiler pressure in an ideal Rankine Cycle. Figure 2.4 shown two ideal cycles varies
when the boiler pressure and condenser pressure were manipulated. Figure 2.4(a) refers
to the cycle which have the same condenser pressure but the boiler pressure were
manipulated. Maintaining a higher pressure cycle of (1’ – 2’ – 3’ – 4’ – 1’) results in the
average temperature of heat addition to be high as well. Therefore, raising up the pressure
of the boiler of a very good Rankine Cycle results into a higher thermal efficiency. Figure
2.4(b) shown the cycles with the same boiler pressure but different condenser pressure (1
– 2’ – 3’ – 4’ – 1) results into a lower temperature of heat rejection. Therefore, this shows
that the decrease in the pressure of the condenser will result into a thermal efficiency that
is higher. Furthermore, the lowest achievable pressure for condenser is the pressure that
saturates and which corresponds to the temperature that is ambient as it could be the least
probable temperature needed for rejection of the heat to the surrounding/environment.
However, the main reason for including the condenser in a power-plant is for the
maintenance of the least achievable pressure of the condenser in order to ensure that there
is an impactful up-rise in the thermal efficiency as well as network. Having a condenser
will as well ensure that the flow of the working fluid will be in a loop that is closed.
(Regulagadda, Dincer, & Naterer, 2010)

17
Figure 2.4: Effects of varying operating pressure on the ideal Rankine cycle
2.4 Effects of Condenser Pressure on the Rankine Cycle
Condenser is considered as one of the main component that affect the steam power
plant performance even though thermal power plant consists of pump, steam generator,
turbine and condenser. (Demirel, 2014) Condenser functions as a means of creating a
turbine’s pressure of vacuum so as to ensure increase in the output of power and in
generating low-steam and this is an important factor as well for the creation of a given
output of power. Secondly, its importance is by declining feed-water heat in water
circulation and recovering the condensate. Other than that, many other efforts have being
made continuously to improve the condenser’s performance or heat exchanger in other
words. Operating the plant at an optimum condition is important for the extraction of the
maximum power output. In order to achieve the desired thermal efficiency, parameters
that affect the performance were studied by detailing the lower end of the pressure’s
condenser condition on the outcome of the power-plant. For the purpose of this study,
following aspects were assumed;
a) Exchanger of heat of the tube and shell type is to prevent any leakage of air to the
condenser.
b) Steady-state condition by thermodynamic law.

18
Figure 2.5: Variation of thermal efficiency with respect to condenser pressure
Figure 2.6: Variation of net power with respect to condenser pressure
(Ali, Baheta, & Hassan, 2014) stated that Figure 2.5 and Figure 2.6 shows the impact
made by the pressure in the condenser with regards to the efficiency of the plant as well
as its output of the net-power accordingly. Both the efficiency of the cycle thermal as well
as the output of the net-power decreases as there is an increase in the pressure of the
condenser. This is because the steam that leaves where the turbine is has an enthalphy
that is high and the rejected energy from the medium of cooling is in a waste form. Other

19
than that, the mass rate flow of the cooling water, its leakage in air and temperature also
affects the pressure of the condenser. Other simulation’s has shown the impact of the
temperature of the cooling water with regards to the pressure of the condenser. Analyzing
the Figure 2.7, it shows that the condenser pressure rises up as there occurs an increase in
the temperature of the cooling water inlet. Usually cooling water could be from the natural
water or in a loop system that is closed after it has been cooled down. Therefore, an
increase should occur in the rate flow of the mass if there is an increase also in the
temperature of the cooling water for the purpose of ensuring maintenance of the pressure
of the condenser. (Ali et al., 2014)
Figure 2.7: Condenser pressure vs cooling water inlet temperature

20
Figure 2.8: Variation of condenser heat transfer rate vs cooling water inlet
temperature
Whereas the Figure 2.8 shows the differences in the transfer of heat rate by the
condenser in accordance with the different flow-rate of the cooling water. As can be seen
in Figure 2.8, the rate in transferring heat reduces as an increase occurs in the temperature
of the inlet water. This is so due to the fact that for every given steam temperature of a
condenser, there is a decrease in the gradient of the temperature amidst two streams once
there is an increase in the temperature of the inlet cooling water, which results to reduced
transfer of heat between the two streams. Besides that, the more the increase in flow, the
greater the transfer of heat as the flow-rate of the mass is in direct proportion to the
transfer of heat.(Ali et al., 2014)

21
Figure 2.9: Condenser steam load vs condenser pressure
Referring to Figure 2.9, the increasing pressure of the condenser causes an increase in
the steam that enters into the condenser as well. This happens because when there is a
high pressure in the condenser, the exit-enthalpy of the turbine would be higher as well
and the precise output of the power of the turbine would be low. The desired output would
be using flow-rate of steam that is higher and therefore there will be an increase in the
steam load of the condenser as well.(Ali et al., 2014) If the cooling water flow-rate of
mass is reduced, then there would be an increase in a condenser’s steam load for its given
pressure. The power-plant is firmly dependent on lesser conditions in operating pressure
because the condenser is one of the important element for the exchange of heat. If an
increase occurs in the pressure of the condenser, both the efficiency of the thermal as well
as the output of the net-power would decrease while an up-rise would occur in the
consumption of steam. On the other side, the pressure of the condenser is determined via
the flor-rate of mass and temperature of the cooling water. In that way, the condenser
pressure is higher as the flow-rate of cooling water is smaller for a given temperature of
a cooling water inlet.

22
2.5 Improving Performance
Power plant sector have never stopped on working out to improve its efficiency. This
also entails the improving of efficiency in power plants by means that can generate more
work output compared to less heat input. Profitability of a power plant always play an
important role considering other factors of a power plant such the lifespan, maintenance
and wear-tear of its component.(Hussain, Sebzali, & Ameer, 2014) Many modifications
were incorporated over the years but two cycle modification we would see in depth are
superheat and reheat which could much more assist in the increase of the pressure in
boilers and in the reduction of the pressure in condensers. It is mentioned earlier in the
discussion that the increase in the pressure of the boiler or the pressure of the condenser
would increase the thermal efficiency overall but at the same time it’s important to note
that it might end up in reducing the quality of the steam at the turbine’s end-point which
would cause to erode the turbine blade. In other word, it would decrease the turbine
efficiency and increase the expenses for maintenance. These two cycle modification,
superheat and reheat could also offshore the challenge of low duality of the exhaust of
the turbine.

23
2.5.1 Superheat
Superheat assist in further transferring heat to the saturated vapor at the turbine inlet
therefore producing super-heated state of the vapor at the inlet of the turbine. Superheat
is done in a distinct exchanger of heat referred to as super-heater. Having a mixture of
super-heater and boiler brings out a complete steam generator. Figure 2.10 gives a
description of an actual Rankine cycle complete with a superheated vapor at the turbine
inlet; 1’ –> 2’ –> 3 –> 4 –> 1’. This shows that a super-heater included cycle has a higher
average heat addition temperature compared to cycle without a superheating and therefore
the thermal efficiency becomes higher as well. Besides that, superheating do eliminate
the challenge of low quality in steam at the exhaust of a turbine as regarding a super-
heating that is adequate, the state of exhausting the turbine would be in the vapor region
that has been super-heated.(Haseli, 2018)
Figure 2.10: Rankine cycle with superheater

24
CHAPTER 3: RESEARCH METHODOLOGY
3.1 Experiment Set Up
As mentioned earlier in Chapter 1 and Chapter 2 complete power plant set up consists
of 4 components which are boiler, turbine, pump and condenser as shown in Figure 3.1.
The Rankine cycle starts by having water flows from pump to turbine through high
pressure boiler whereby the work done by the pump known as Wout. The heat that
transferred into the working fluid at boiler known as Qin. Next, the working fluid flows
through turbine whereby work produced by the turbine, known as Wt. At the turbine, the
work produced through the rotation of turbine as a results of the steam hitting the turbine
blade in which the turbine shaft connected with the rotary of generator. As the working
fluid flows through the condenser, the heat is transferred out, Qout to cooling water which
is in separate stream line. Afterwards, the working fluid channeled back to high pressure
boiler through the pump and keeping the working fluid in continuous cycle.(Alobaid et
al., 2017)
Figure 3.1: Basic components of steam turbine power plant

25
Figure 3.2 below shows the diagram components arrangement and order for the
methodology of the research of steam power plant in the STEM ISI IMPIANTI 3-kW
experimental power plant at Thermal-hydraulic laboratory, Faculty of Engineering,
University of Malaya.
Figure 3.2: Component set-up in lab
The small scale power plant lab consists of boiler and turbine were sufficient for us to
research on the effects of pressure on the steam turbine output. Additionally, superheater
were installed between boiler and turbine along the pipeline which is between T2 and T3.
Diesel fuel were used to power up the boiler and heat the water and the working fluid was
from the water treatment facility. The total fuel consumption for the whole experiment
reflected in the table below with its calorific value and density.
Table 3.1 Diesel fuel properties
Total experiment time 90 min
Diesel consumption 25 L
Diesel calorific value 45.5 MJ/kg
Diesel density, 𝜌 0.832 kg/L
Mass Used 20.8 kg

26
3.2 Steam Cycle
The Rankine cycle starts with water being pumped by the pump to the high-pressure
boiler. The work being done by the pump considered as Wp. The high-pressure boiler
being feed with diesel fuel to assist in creating working fluid in the form of steam. There
was pressure gauge, P1 connected with the boiler to control the pressure of steam at the
boiler stage before allowing steam to enter the working fluid pipeline.
Figure 3.3: Pressure gauge, P1 connected at boiler
Pressure gauge, P1 considered as the first manipulating variable parameter whereby
the whole experiment conducted using two value of this boiler pressure, at 7bar and 8bar.
Once the steam flows out from the boiler, the temperature 1, T1 is recorded as the steam
flows into the pipeline. It’s installed right after the steam flows into the steam pipeline to
measure the energy that the steam carries when it enters the pipeline. A component known
as superheater installed along the pipeline approximately in the middle of whole steam
pipeline.

27
Figure 3.4: Superheater installed along the steam pipeline
Superheater assisted in making the steam to a state superheated vapor condition before
it reaches turbine inlet. Another temperature sensor, T2 installed right before the steam
enters the superheater and another temperature sensor, T3 right after the steams exits the
superheater. This is to monitor the temperature increment happens inside the superheater.
Steam flows through the pipeline in a very high temperature and in another word, having
a high kinetic energy. The fourth temperature sensor, T4 were installed right before the
steam enters the turbine.

28
Figure 3.5: Pressure gauge, P2 connected at turbine
In total, we had 4 temperature sensor installed along the steam pipeline. The second
manipulating variable were the turbine pressure whereby a pressure gauge, P2 installed
right before the steam enters the turbine. In that way, the pressure of the steam that enters
the turbine can be controlled. The experiment were conducted in a way that boiler
pressure set at 7 bar and turbine pressure set at 2, 3 and 4 bar. Then the experiment
repeated using those turbine pressure value for boiler pressure of 8 bar. The boiler
pressure, P1 and turbine pressure, P2 are the two parameter that were used as the
manipulating variable to study the turbine power output. The high pressure and high
temperature from the steam enters the turbine through the pipeline and hit the surface of
the turbine blade connected to the rotary generator whereby it produce mechanical energy
and later this energy converted into electrical energy.

29
Figure 3.6: Turbine connected through shaft with generator
Based on the temperature values recorded at 4 different point, we can get the value of
enthalpy and entropy by referring to property table and charts from the Thermodynamic
reference book. Therefore, the amount of energy carried by the steam at each point were
identified and compared when the pressure value manipulated. Other than that, the main
objective of studying the power output when the boiler pressure and turbine pressure
manipulated were recorded and analysed accordingly.(Yunus A. Cengel, 2015b)

30
Figure 3.7: Complete experiment set-up

31
CHAPTER 4: RESULTS AND DISCUSSIONS
4.1 Experimental Condition
Experiment conducted by manipulating boiler pressure, P1 and turbine pressure, P2 and
the value of the turbine power output recorded. The maximum rotation of the generator
in the lab stands at 8600 rotation per minute. The maximum power of the generator is
3kW and the power factor is 2.5. Based on the lab experiment size, the maximum
efficiency that achieved using this generator is 2.567625.
Table 4.1 Diesel fuel heat input value
Total experiment time 90 min
Diesel consumption 25 L
Diesel calorific value 45.5 MJ/kg
Diesel density, 𝜌 0.832 kg/L
Mass Used 20.8 kg
Total Heat (MJ) 946.4 MJ
Total Heat (kJ) 946400 kJ
Total Heat Input 175.259259 kW
Rate of Heat Input 116.839506 kW-h
Table 4.1 above shows the experimental condition of this work for the rate of heat
input using the calorific value of diesel gas properties. The rate of heat input from the
burning of diesel gas to the working fluid inside the high pressure boiler is 117 kWh.
Point to note is that the steam flow rate for all the experiment above fixed at 420 kg/h
which is constant value throughout the whole experiment. Table 4.2 below shows the
complete result of the experiment when the boiler pressure and turbine pressure
manipulated.(Regulagadda et al., 2010) Readings of temperature at 4 different location
and the turbine rotational speed stated in the table below at respective pressure values.

32
4.2 Results
Table 4.2 below shows the experimented data obtained on this work. Based on the
result, it shows that as the turbine pressure increases for each value of boiler pressure, the
rotational speed increases too up to 3100 RPM. The turbine pressure of 4 bar for each 7
and 8 bar of boiler pressure shows the highest turbine inlet temperature. This could be
due to the buildup pressure that occurs at turbine inlet as a result of controlling the turbine
pressure at high value of 4 bar. Therefore the temperature also shows a high value at
turbine inlet. When the temperature value is high, relatively the amount of kinetic energy
in the steam is high as well. The high turbine rotational speed were the result of the steam
hitting the turbine blade at a very high speed. As a result, high turbine rotational speed
created high electricity. The efficiency of the generator at these turbine pressure also
would be higher which is cost saving as well.
Table 4.2 Experimental Results
Test
No
Pressure (bar) Temperature (oC) Turbine
Rotational
Speed
(RPM)
Boiler
P1
Turbine
P2
Boiler
Outlet
T1
Superheater
Inlet T2
Superheater
Outlet T3
Turbine
Inlet T4
Average
Rotation
(RPM)
1 7 2 122 120 125 135 1100 -
1300 1200
2 7 3 137 134 136 140 2100 -
2500 2300
3 7 4 141 139 142 148 2600 -
3100 2850
4 8 2 130 128 132 135 1200 -
1400 1300
5 8 3 136 135 138 143 2100 -
2700 2400
6 8 4 145 140 146 150 2700 -
3100 2800

33
4.3 Ideal Cycle vs Experimental Result
Other important element to note is the deviation of the temperature from point T1 to
T2. (Yunus A. Cengel, 2015a) stated that in an idealized cycle, the temperature from point
T1 to T2 should be constant to achieve the maximum efficiency but based on the results of
the experiment, we noticed a slight decrease as the steam flows from T1 to T2 and
increased back when it reaches T3 which is mainly due to the superheater installed. The
temperature drop as the steam flows from T1 to T2 is due to the reversibilities. Two main
factors which might have contributed to this are the heat loss to the surroundings and fluid
friction. Heat loss might have occurred as the steam flow in the pipeline from T1 to T2.
The length of pipeline in which the steam flows and the internal features of the pipeline
have contributed to this factor. Eventually temperature increase occurred when the steam
reaches T3; thanks to the superheater contribution. In addition, this results was proven in
the figure below, Figure 4.1 stated that deviation occurs compared to the idealized
Rankine cycle.
.
Figure 4.1 Deviation of Actual Vapor Power Cycle from the Ideal Rankine
Cycle (Yunus A. Cengel, 2015a)

34
4.4 Discussion
Figure 4.2 Average Turbine Rotational Speed (RPM)
Figure 4.2 above shows the average turbine rotational speed for each turbine pressure
on respective boiler pressure value. It shows that boiler pressure at 7 bar with turbine
pressure 4 bar recorded the highest turbine rotational speed. Recalling the objective of the
studies which is to study the boiler and turbine pressure that gives out the highest value
of turbine rotational speed, boiler pressure of 7 bar and turbine pressure 4 bar have the
highest generation of electricity from the power plant located in the lab. The boiler
pressure of the current plant can only achieve maximum up to 8 bar. Respectively, the
boiler pressure of 8 bar have lesser turbine rotational compared to boiler pressure of 7 bar
due to straining the system to achieve maximum boiler pressure and therefore less
efficiency resulted. This shows that the power output increases as the turbine pressure
increase regardless of the boiler pressure. This is shown in the Table 4.3 below.
2 3 4
Boiler Pressure 7 bar 1200 2300 2850
Boiler Pressure 8 bar 1300 2400 2800
0
500
1000
1500
2000
2500
3000
RP
M
Turbine Pressure
AVERAGE TURBINE ROTATIONAL SPEED (RPM)
35
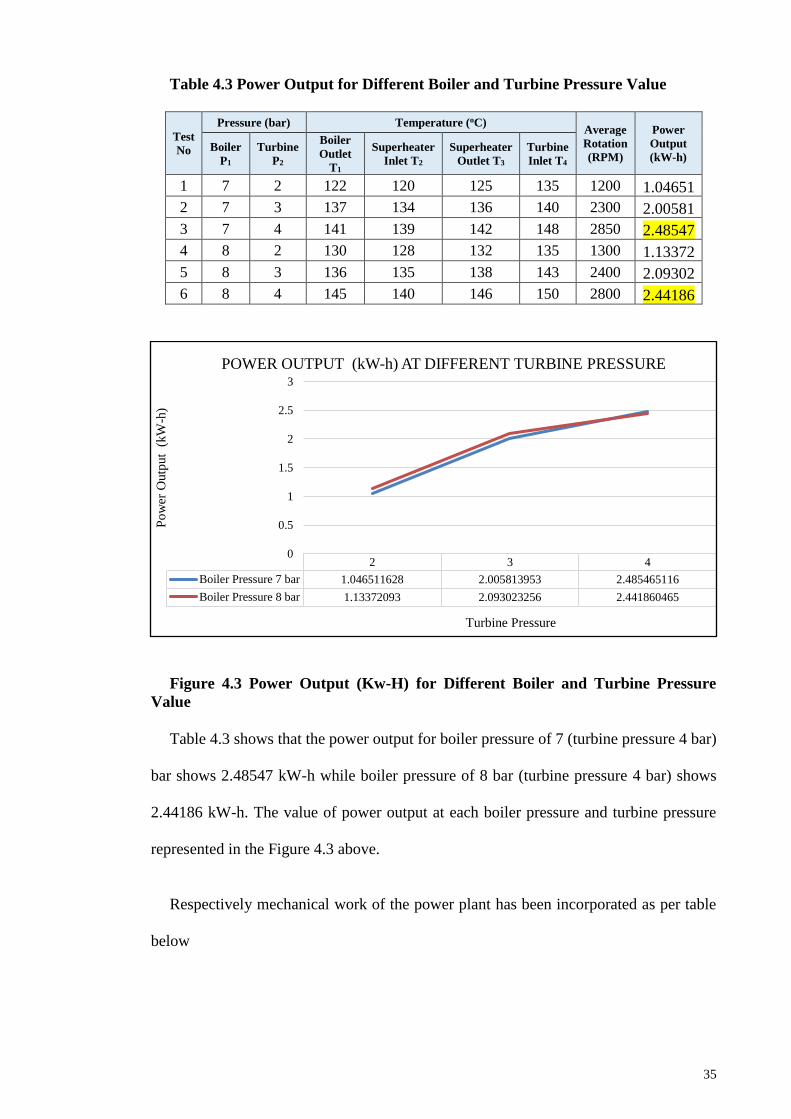
Table 4.3 Power Output for Different Boiler and Turbine Pressure Value
Test
No
Pressure (bar) Temperature (oC) Average
Rotation
(RPM)
Power
Output
(kW-h) Boiler
P1
Turbine
P2
Boiler
Outlet
T1
Superheater
Inlet T2
Superheater
Outlet T3
Turbine
Inlet T4
1 7 2 122 120 125 135 1200 1.04651
2 7 3 137 134 136 140 2300 2.00581
3 7 4 141 139 142 148 2850 2.48547
4 8 2 130 128 132 135 1300 1.13372
5 8 3 136 135 138 143 2400 2.09302
6 8 4 145 140 146 150 2800 2.44186
Figure 4.3 Power Output (Kw-H) for Different Boiler and Turbine Pressure
Value
Table 4.3 shows that the power output for boiler pressure of 7 (turbine pressure 4 bar)
bar shows 2.48547 kW-h while boiler pressure of 8 bar (turbine pressure 4 bar) shows
2.44186 kW-h. The value of power output at each boiler pressure and turbine pressure
represented in the Figure 4.3 above.
Respectively mechanical work of the power plant has been incorporated as per table
below
2 3 4
Boiler Pressure 7 bar 1.046511628 2.005813953 2.485465116
Boiler Pressure 8 bar 1.13372093 2.093023256 2.441860465
0
0.5
1
1.5
2
2.5
3
Po
wer
Outp
ut
(kW
-h)
Turbine Pressure
POWER OUTPUT (kW-h) AT DIFFERENT TURBINE PRESSURE

36
Table 4.4 Mechanical Work for Different Boiler and Turbine Pressure Value
Test
No
Pressure (bar) Temperature (oC) Average
Rotation
(RPM)
Mechanical Boiler
P1
Turbine
P2
Boiler
Outlet
T1
Superheater
Inlet T2
Superheater
Outlet T3
Turbine
Inlet T4
1 7 2 122 120 125 135 1200 34.89552
2 7 3 137 134 136 140 2300 66.88307
3 7 4 141 139 142 148 2850 82.87685
4 8 2 130 128 132 135 1300 37.80348
5 8 3 136 135 138 143 2400 69.79103
6 8 4 145 140 146 150 2800 81.42287
Figure 4.4 Mechanical Work for Different Boiler and Turbine Pressure Value
Relatively, enthalpy shows high value as the recorded temperature is high as well.
Higher enthalpy shows that the working fluid having higher kinetic energy.
2 3 4
Boiler Pressure 7 bar 34.8955 66.8831 82.8768
Boiler Pressure 8 bar 37.8035 69.7910 81.4229
0.0000
10.0000
20.0000
30.0000
40.0000
50.0000
60.0000
70.0000
80.0000
90.0000
Mec
han
ical
Turbine Pressure
Mechanical Work

37
Table 4.5 Enthalpy Value at Different Temperature
Boiler Pressure: 7 bar Boiler Pressure: 8 bar
Turbine
Pressure
(bar)
Temperature
(˚C)
Enthalpy,
h (kJ/kg)
Turbine
Pressure
(bar)
Temperature
(˚C)
Enthalpy,
h (kJ/kg)
2
T1 122 2708.8
2
T1 130 2720.1
T2 120 2706.0 T2 128 2717.3
T3 125 2713.1 T3 132 2722.8
T4 135 2726.9 T4 135 2726.9
3
T1 137 2729.5
3
T1 136 2728.2
T2 134 2725.5 T2 135 2726.9
T3 136 2728.2 T3 138 2730.9
T4 140 2733.5 T4 143 2737.3
4
T1 141 2734.8
4
T1 145 2739.8
T2 139 2732.2 T2 140 2733.5
T3 142 2736.0 T3 146 2741
T4 148 2743.5 T4 150 2745.9
Figure 4.5: Enthalpy value at boiler pressure 7 bar
2680
2690
2700
2710
2720
2730
2740
2750
T1 T2 T3 T4
En
thal
py, h
(kJ/
kg)
Temperature Point
Enthalpy, h at Boiler Pressure 7 Bar
Turbine Pressure 2 bar Turbine Pressure 3 bar Turbine Pressure 4 bar

38
Figure 4.6: Enthalpy value at boiler pressure 8 bar
Other important factor in comparison is analyzing the entropy of the working fluid at
respective particular temperature.
Table 4.6 Entropy Value at Different Temperature
Boiler Pressure: 7 bar Boiler Pressure: 8 bar
Turbine
Pressure
(bar)
Temperature
(˚C)
Entropy, s
(kJ/kg.K)
Turbine
Pressure
(bar)
Temperature
(˚C)
Entropy, s
(kJ/kg.K)
2
T1 122 7.1084
2
T1 130 7.0265
T2 120 7.1292 T2 128 7.0467
T3 125 7.0771 T3 132 7.0068
T4 135 6.9773 T4 135 6.9773
3
T1 137 6.9581
3
T1 136 6.9677
T2 134 6.9871 T2 135 6.9773
T3 136 6.9677 T3 138 6.9486
T4 140 6.9294 T4 143 6.9014
4
T1 141 6.9201
4
T1 145 6.8827
T2 139 6.9390 T2 140 6.9294
T3 142 6.9107 T3 146 6.8736
T4 148 6.8553 T4 150 6.8371
2700
2705
2710
2715
2720
2725
2730
2735
2740
2745
2750
T1 T2 T3 T4
En
thal
py, h
(kJ/
kg)
Temperature Point
Enthalpy, h at Boiler Pressure 8 Bar
Turbine Pressure 2 bar Turbine Pressure 3 bar Turbine Pressure 4 bar

39
Figure 4.7: Entropy value at boiler pressure 7 bar
Figure 4.8: Entropy value at boiler pressure 8 bar
6.7000
6.7500
6.8000
6.8500
6.9000
6.9500
7.0000
7.0500
7.1000
7.1500
T1 T2 T3 T4
En
tro
py, s
(kJ/
kg.K
)
Temperature Point
Entropy, s At Boiler Pressure 7 Bar
Turbine Pressure 2 bar Turbine Pressure 3 bar Turbine Pressure 4 bar
6.7000
6.7500
6.8000
6.8500
6.9000
6.9500
7.0000
7.0500
7.1000
T1 T2 T3 T4
En
tro
py, s
(kJ/
kg.K
)
Temperature Point
Entropy, s At Boiler Pressure 8 Bar
Turbine Pressure 2 bar Turbine Pressure 3 bar Turbine Pressure 4 bar

40
Table 4.7 Efficiency for Different Boiler and Turbine Pressure Value
Test
No
Pressure (bar) Temperature (oC) Average
Rotation
(RPM) Efficiency Boiler
P1
Turbine
P2
Boiler
Outlet
T1
Superheater
Inlet T2
Superheater
Outlet T3
Turbine
Inlet T4
1 7 2 122 120 125 135 1200 0.895986
2 7 3 137 134 136 140 2300 1.717306
3 7 4 141 139 142 148 2850 2.127967
4 8 2 130 128 132 135 1300 0.970651
5 8 3 136 135 138 143 2400 1.791972
6 8 4 145 140 146 150 2800 2.090634
Relatively to the power output produced by each manipulated variable, efficiency table
constructed as above and represented in the graph below as well.

41
Figure 4.9 Efficiency for Different Boiler and Turbine Pressure Value
In the end, it shows that operating the lab power plant system with 7 bar of boiler
pressure and 4 bar of turbine pressure produce the most effective and efficient output.
Even though operating the boiler pressure at 8 bar produce almost the same power output
and efficiency level as 7 bar, but 8 bar of pressure would strain the system. Other than
that, the drawback of using 8 bar boiler pressure is that it would consume more fuel to
burn in order to achieve the 8 bar. Therefore, using 7 bar of boiler pressure would be the
best choice suiting the 4 bar of turbine pressure to produce the most power output.
2 3 4
Boiler Pressure 7 bar 0.895985983 1.717306467 2.127966709
Boiler Pressure 8 bar 0.970651481 1.791971966 2.09063396
0
0.5
1
1.5
2
2.5
Eff
icie
ncy
Turbine Pressure
EFFICIENCY AT DIFFERENT PRESSURE

42
CHAPTER 5: CONCLUSION AND RECOMMENDATION
Referring to the objective of the work which is to study the effects of pressure variation
on the performance of a steam turbine power plant, the experiment was conducted
properly and any error that could jeopardize the results was avoided completely to achieve
the accurate outcome. Therefore, it can be concluded that increasing the turbine pressure
would increase the efficiency of the steam turbine power plant regardless of the boiler
pressure value. Manipulating the boiler pressure value and turbine pressure value to study
the power output of steam turbine, the whole experiment was modeled
thermodynamically and accordingly. Furthermore, the factors affecting the steam turbine
performance were validated and found out that operating this power plant with the boiler
pressure of 7 bar and 4 bar of turbine pressure would be the most efficient for generating
electricity. Controlling the turbine pressure value at 4 bar produce the highest rotation of
turbine and directly proven to be the most efficient value. Meanwhile for the boiler
pressure value, after repeated experiment it shows that 7 bar is the most suitable pressure
compare to 8 bar. This is because 8 bar is the maximum capacity that boiler can operate
and operating the boiler at that pressure could strain the system and consequently the
efficiency drops. Therefore, increasing the pressure at the inlet of turbine have increased
the temperature of the steam at the inlet of turbine and subsequently enhance the
performance of the power plant. When higher efficiency achieved, it contributes for the
cost saving in power plant industry. As discussed in Chapter 1, cost saving is an important
factor in power plant industry because poor management of power plant system could
lead to loss in the power plant electricity generation and therefore it wouldn’t be a
profitable venture.

43
5.1 Recommendation
1. Improvement can be made to the power plant to increase the efficiency such as
including irreversibilities into the analysis to improve significant influence on the
cycle performance.
2. Other than that, conducting thermodynamic analysis to equipment such as
condenser and feedwater pump too can improve the performance of the power
plant.

44
REFERENCES
16.1 Sasaki, T., & Hisa, S. (2003). Thermal power plant: Google Patents.
Achilli, A., Cath, T. Y., & Childress, A. E. (2009). Power generation with pressure
retarded osmosis: An experimental and theoretical investigation. Journal of
Membrane Science, 343(1), 42-52. doi:
https://doi.org/10.1016/j.memsci.2009.07.006
Ali, S. H., Baheta, A. T., & Hassan, S. (2014). Effect of Low Pressure End Conditions on
Steam Power Plant Performance. Paper presented at the MATEC Web of
Conferences.
Alobaid, F., Mertens, N., Starkloff, R., Lanz, T., Heinze, C., & Epple, B. (2017). Progress
in dynamic simulation of thermal power plants. Progress in Energy and
Combustion Science, 59, 79-162. doi: https://doi.org/10.1016/j.pecs.2016.11.001
Balmer, R. T. (2011a). Chapter 4 - The First Law of Thermodynamics and Energy
Transport Mechanisms. In R. T. Balmer (Ed.), Modern Engineering
Thermodynamics (pp. 99-146). Boston: Academic Press.
Balmer, R. T. (2011b). Chapter 6 - First Law Open System Applications. In R. T. Balmer
(Ed.), Modern Engineering Thermodynamics (pp. 167-203). Boston: Academic
Press.
Balmer, R. T. (2011c). Chapter 7 - Second Law of Thermodynamics and Entropy
Transport and Production Mechanisms. In R. T. Balmer (Ed.), Modern
Engineering Thermodynamics (pp. 205-247). Boston: Academic Press.
Casella, F., & Leva, A. (2003). Modelica open library for power plant simulation: design
and experimental validation. Paper presented at the Proceeding of the 2003
Modelica conference, Linkoping, Sweden.
Demirel, Y. (2014). Chapter 4 - Using the Second Law: Thermodynamic Analysis. In Y.
Demirel (Ed.), Nonequilibrium Thermodynamics (Third Edition) (pp. 177-264).
Amsterdam: Elsevier.
Ersayin, E., & Ozgener, L. (2015). Performance analysis of combined cycle power plants:
A case study. Renewable and Sustainable Energy Reviews, 43, 832-842. doi:
https://doi.org/10.1016/j.rser.2014.11.082
Flynn, D. (2003). Thermal power plant simulation and control: IET.
Gyftopoulos, E. P. (1997). Fundamentals of analyses of processes. Energy Conversion
and Management, 38(15), 1525-1533. doi: https://doi.org/10.1016/S0196-
8904(96)00214-2
Haseli, Y. (2018). Efficiency improvement of thermal power plants through specific
entropy generation. Energy Conversion and Management, 159, 109-120. doi:
https://doi.org/10.1016/j.enconman.2018.01.001

45
Hussain, H., Sebzali, M., & Ameer, B. (2014). Efficiency improvement of steam power
plants in Kuwait. WIT Transactions on Ecology and the Environment, 186, 173-
184.
Kehlhofer, R., Hannemann, F., Rukes, B., & Stirnimann, F. (2009). Combined-cycle gas
& steam turbine power plants: Pennwell Books.
Michael J. Moran, H. N. S. (2014). Fundamentals of Engineering Thermodynamics
(Kindle Edition ed. Vol. 8): Wiley.
Regulagadda, P., Dincer, I., & Naterer, G. F. (2010). Exergy analysis of a thermal power
plant with measured boiler and turbine losses. Applied Thermal Engineering,
30(8), 970-976. doi: https://doi.org/10.1016/j.applthermaleng.2010.01.008
Tschoegl, N. W. (2000a). 11 - IDEAL SYSTEMS. In N. W. Tschoegl (Ed.),
Fundamentals of Equilibrium and Steady-State Thermodynamics (pp. 72-73).
Amsterdam: Elsevier Science.
Tschoegl, N. W. (2000b). Inroduciton to Equilibrium Thermodynamics. In N. W.
Tschoegl (Ed.), Fundamentals of Equilibrium and Steady-State Thermodynamics
(pp. 1). Amsterdam: Elsevier Science.
Yunus A. Cengel, M. A. B. (2015a). Thermodynamics, An Engineering Approach
Thermodynamics, An Engineering Approach Eighth Edition in SI Units
(Vol. 8, pp. 559). New York: McGraw-Hill Education.
Yunus A. Cengel, M. A. B. (2015b).
Thermodynamics: An Engineering Approach Eighth Edition In SI Units Thermodynamics
(Vol. 8, pp. 954). New York: McGraw_Hill Education.

46
APPENDIX

47
EXPERIMENTAL DATA
Test No
Pressure (bar) Temperature (oC)
Turbine Rotational
Speed (RPM)
Average Rotation
Steam Flow Rate
(kg/h)
Water droplet weight (g)
Droplet collection
duration (min) Boiler P1 Turbine P2 Boiler
Outlet T1 Superheater
Inlet T2 Superheater
Outlet T3 Turbine Inlet T4
1 5 2 133 118 124 120 530 - 700 615 420 7.2 10
2 7 2 122 120 125 135 1100 - 1300 1200 420 11.8 10
3 7 3 137 134 136 140 2100 - 2500 2300 420 28.0 10
4 7 4 141 139 142 148 2600 - 3100 2850 420 101.6 10
5 8 2 130 128 132 135 1200 - 1400 1300 420 11.1 5
6 8 3 136 135 138 143 2100 - 2700 2400 420 30.0 5
7 8 4 145 140 146 150 2700 - 3100 2800 420 111.0 5

48
CALCULATED RESULTS
Power Output Efficiency Mechanical Defficiency
0.536337209 0.459192816 17.88395175 82.11587412
1.046511628 0.895985983 34.89551561 65.10414462
2.005813953 1.717306467 66.88307159 33.11627718
2.485465116 2.127966709 82.87684958 17.12234347
1.13372093 0.970651481 37.80347525 62.19615667
2.093023256 1.791971966 69.79103123 30.20828924
2.441860465 2.09063396 81.42286977 18.57633744

49
STEAM PROPERTIES
Specific Volume on T4 Mass of vapor at T4 Volume of vapor at T4 Mass of collected
water(w) Quality
0.8919 70 62.433 0.0072 0.999897
0.5887 70 41.209 0.0118 0.999831
0.5089 70 35.623 0.028 0.9996
0.416 70 29.12 0.1016 0.998551
0.5887 35 20.6045 0.0111 0.999683
0.474 35 16.59 0.03 0.999144
0.3928 35 13.748 0.111 0.996839