Effects of Enforcer!en$ lirm
60
"gfle Effects of Patd INedia sinnd Enforcer!en$ on Snkhly Dolt i,,.lse lirm /~lbchl(~nua David W. f by, Lidia P. Kostyninrk, Kriolhnan Sudharserr, Juarathour M. Viruuda, auld Wdlevv K. SpradlIu~
Transcript of Effects of Enforcer!en$ lirm

"gfle Effects of Patd INedia sinnd Enforcer!en$ on Snkhly Dolt i,,.lse lirm /~lbchl(~nua
David W. f by, Lidia P. Kostyninrk, Kriolhnan Sudharserr, Juarathour M. Viruuda, auld Wdlevv K. SpradlIu~

UMTRI-2002-27 4. Title and Subtitle 5. Report Date
Technical Report
The Effects of Paid Media and Enforcement on Safety Belt Use in Michigan 6. Performing Organization Code
1. Report NO. 2. Government Accession No. 3. Recipient's Catalog No.
1 9. Performing Organizaton Name and Address 1 10. Work Unit No. (TRAIS) I
7.Author(s)Da~id W. Eby, Lidia P. Kostyniuk, Krishnan Sudharsan, Jonathon M. Vivoda, and Helen Spradlin
8. Performing Organization Report No.
UMTRI-2002-27
1 12. Sponsoring Agency Name and Address ( 13. Type of Report and Period Covered I
The University of Michigan Transportation Research Institute 2901 Baxter Road Ann Arbor, MI 481 09
11. Contract or Grant No.
OP-02-28
16. Abstract
Michigan Office of Highway Safety Planning 400 Coilins Road, PO BOX 30633 Lansing, MI 48909-81 33
The purpose of this study was to evaluate the effectiveness of a medialenforcement program designed to increase safety belt use. The program included a paid media campaign using advertisements on broadcast television, cable television, radio, and outdoor bulletins and posters. Concurrent with the media campaign, Michigan also implemented increased police enforcement of the safety belt use law. The study utilized an experimental region, where all media and enforcement activities took place, and a control region, in which no media or enforcement were implemented specifically as part of the program. Study measures were acquired from three waves of a direct observation survey of safety belt use, with each wave conducted concurrently in each region. The direct observation study was supplemented by a telephone-survey conducted by a NHTSA-sponsored research firm during each of the waves in each region. The direct observation survey results showed that safety belt use did not significantly increase in either region immediately after the program. The medialenforcement program did not seem to have a differential effect on safety belt use in the experimental region. One reason for this lack of effect may have been that the medialenforcement campaign had far-reaching effects in Michigan. Even though no specific program activities were scheduled to appear in the counties comprising the control region, the telephone survey revealed that people in the control region were exposed to an increase in messages and enforcement during the program period. Because of this exposure in the control region, the experimentallcontrol study-design we utilized was compromised. Without the ability to compare! safety belt use in the experimental region to use in a region without any program activities, we have no way of determining the differential effects of the program on the background of other statewide factors that influence safety belt use.
Final 411 9/02 - 1 0131 102 14, Sponsoring Agency Code
17. Key Words
Safety Belt, Media, Enforcement, Survey
15. Supplementary Noles
18. Distribution Statement
Unlimited
I Unclassified I Unclassified 60 Reproduction of completed page authorized
19. Security Classif. (of this repori) 20. Security Classif. (of this page) 21. No. of Pages 22. Price

CONTENTS
. . . . . . . . . . . . . . . . . . . . . . . . . . . . . . . . . . . . . . . . . . . . . . . . . . . . . INTRODUCTION 1
. . . . . . . . . . . . . . . . . . . . . . . . . . . . . . . . . . . . . . . . . . . . . . . . . . . . . . . . . . METHODS 5 . . . . . . . . . . . . . . . . . . . . . . . . Selection of Experimental and Control Regions 5
. . . . . . . . . . . . . . . . . . . . . . . . . . . . . . . . . . . . . . . . . Direct Observation Survey 6 . . . . . . . . . . . . . . . . . . . . . . . . . . . . . . . . . . . . . . . . . . . . Sample Design 6 . . . . . . . . . . . . . . . . . . . . . . . . . . . . . . . . . . . . . . . . . . . . Data Collection 9
. . . . . . . . . . . . . . . . . . . . . . . . . . . . . . . . . . . . . . . . . Observer Training 11 . . . . . . . . . . . . . . . . . . . . . . . . . . Observer Supervision and Monitoring 11
. . . . . . . . . . . . . . . . . . . . Data Processing and Estimation Procedures 12 . . . . . . . . . . . . . . . . . . . . . . . . . . . . . . . . . . . . . . . . . . . . . . Telephone Survey 13
Methods . . . . . . . . . . . . . . . . . . . . . . . . . . . . . . . . . . . . . . . . . . . . 13 . . . . . . . . . . . . . . . . . . . . . . . . . . . . . . . . . . . . . Sample and Interviews 14
. . . . . . . . . . . . . . . . . . . . . . . . . . . . . . . . . . . . . . . . . Sample Weighting 14 . . . . . . . . . . . . . . . . . . . . . . . . . . . . . . . . . . . . . . . . . . . . . Respondents 14
RESULTS . . . . . . . . . . . . . . . . . . . . . . . . . . . . . . . . . . . . . . . . . . . . . . . . . . . . . . . . . . 16 Direct Observation Survey . . . . . . . . . . . . . . . . . . . . . . . . . . . . . . . . . . . . . . . . 16 Telephone Survey . . . . . . . . . . . . . . . . . . . ... . . . . . . ... . . . . . . . . . . . . . 18
DrivingNehicle/Safety Belt Use . . . . . . . . . . . . . . . . . . . . . . . . . . . . . . . 19 Knowledge and opinions about Michigan's mandatory safety belt use law
. . . . . . . . . . . . . . . . . . . . . . . . . . . . . . . . . . . . . . . . . . . . . . . . . . 21 Attitudes Toward Safety Belts . . . . . . . . . . . . . . . . . . . . . . . . . . . . . . . . 22
. . . . . . . . . . . . . . . . . Awareness of the MediaJEnforcement Campaign 24
DISCUSSION . . . . . . . . . . . . . . . . . . . .. . . . . . . . . . . . . . . . . . . . . . . . . . . . . . . . . . 31
REFERENCES . . . . . . . . . . . . . . . . . . . . . . . . . . . . . . . . . . . . . . . . . . . . . . . . . . . . 33
APPENDIX A Data Collection Forms . . . . . . . . . . . . . . . . . . . . . . . . . . . . . . . . . . . . . . . . . . . 34
APPENDIX B . . . . . . . . . . . . . . . . . . . . . . . . . . . . . . . . . . . . . . . . . . . . . . . . . . . . Site Listing 37
APPENDIXC . . . . . . . . . . . . . . . . . . . . . . . . . . . . . . . . . . . . . . . . . . . . . . . . . . . . . . . 41 Telephonesurvey . . . . . . . . . . . . . . . . . . . . . . . . . . . . . . . . . . . . . . . . . 41

ACKNOWLEDGMENTS
This work was sponsored by the Michigan Office of Highway Safety Planning
(OHSP) through Highway Safety Funds from the National Highway Traffic Safety
Administration (NHTSA). We express our thanks to several individuals who were essential
to the completion of this project. Steven Guerriero and Brenda Farnam conducted field
observations. Judy Settles and Mary Chico coordinated administrative procedures for the
field observers. Betty Mercer and Pat Eliason of OHSP provided valuable feedback on the
project. We also thank Fredrick Streff and Jean Shope for their contributions to the project.
We thank SRBl for providing us with telephone survey data. The opinions, findings, and
conclusions expressed in this publication are those of the authors and not necessarily
those of the OHSP or NHTSA.

INTRODUCTION
Motor vehicle crashes are a leading cause of injury and death to individuals of all
ages. The use of safety belts has been identified as an effective means of reducing
trauma incurred by vehicle occupants involved in crashes. Although the advantages of
using a safety belt are obvious, the nationwide belt use rate observed in June 2002, was
only 75 percent (US Department of Transportation, 2002). While this level of belt use is
the highest ever reported since nationwide surveys began in 1994, there is still obvious
progress to be made. The National Highway Traffic Safety Administration (NHTSA ,2000)
suggests that nationwide, more than 5,000 fewer people would have died in motor vehicle
crashes in 2000 if the level of belt use in the US had been the same as in other countries
(85 percent use). NHTSA (2000) also reports that if every passenger vehicle occupant
over age 4 used safety belts, an additional 9,238 lives would have been saved in 2000.
While the reduction of loss of life and injury that would result from increasing use of safety
belts is striking, there is also an economic aspect to consider. The average in-patient
hospital charges of an unbelted driver involved in a crash exceed those of a belted driver
by $5,000 (NHTSA, 2002). Increasing the belt use rate from 68 percent to 85 percent
would save Medicare and Medicaid alone $275 million each year (NHTSA, 2002).
Based on these economic and societal savings, the advantages of using safety belts
are obvious and generally accepted. The challenge to traffic-safety professionals is to find
ways to ensure that these beliefs are translated into actual behaviors; that is, the use of
safety belts. To increase the overall safety belt use rate in any given area, it is necessary
to convince each individual in that population that it is important to use his ir her safety belt.
When each individual begins to accept this idea and to make behavioral changes, these
changes will start to be reflected in the population as a whole.
There are several potential ways to change the behavior of the motoring public,
One proven method is to change the expectation that individuals have about the
consequences of their behavior. For example, traffic safety programs have attempted to
educate people about the dangers of not using safety belts in the event of an automobile
crash. One problem with this approach is that many people have the "optimism bias"; the
generally mistaken belief that you are less likely to be involved in a traffic crash than
everyone else because of your superior driving skills or luck. It may be difficult to get
motorists to use safety belts by explaining the possible dangers of lack of belt use in a
crash, because of the strong optimism bias exhibited by drivers, particularly young clrivers.
People often understand the message and are educated about the importance oli. using
safety belts, but since they do not believe they will get into a crash, they weigh the risk of
injury in a crash as low, and assign little benefit to personal safety belt use.
Traffic safety professionals have also dealt with this problem by focusing on another
possible consequence of safety belt nonuse-the possibility of receiving a safety belt
citation for violating the mandatory safety belt use law. A study conducted by Campbell
(1 987) suggests that the perception of police enforcement might be more importarit than
the actual enforcement level, An individual's perception of enforcement, and thus the
likelihood of receiving a citation, is something that can be targeted and affected by various
programs designed to increase belt use.
Perhaps the most effective means by which to change the perception of the
likelihood of receiving a safety belt citation is by changing the enforcement provisiorl of the
safety belt law. In Michigan, and many other states, the original mandatory safety belt use
law was implemented with a secondary enforcement provision. This type of enforcement
provision allows police officers to issue a safety belt citation only if the vehicle is si:opped
for some other violation, and the motorist is also not using a safety belt. Michigan has
recently changed this provision to standard (primary) enforcement. Officers can now stop
and cite motorists solely for a lack of safety belt use. Changing the enforcement provision
in this way most likely affected the perception of the likelihood of receiving a citation
because of an increase in both actual enforcement, and perception of enforcement. This
legislative change resulted in one of the largest increases in safety belt use that has ever
been observed in Michigan (Eby, Vivoda, & Fordyce, 2002).
Another effective way to change the perception of the likelihood of receiving a safety
belt citation is by active and visible police enforcement coupled with media campaigns that
inform the public of the enforcement programs. When people see media that warn of
receiving a citation for lack of belt use, it is important that they see police officers backing

up these messages. The campaign known as Click It or Ticket is an example of a
successful program that has utilized this idea. The program educates the public about the
importance of using a safety belt and also informs people that there will be police
enforcement and consequences for failure to buckle up. Finally, these warnings are
supported by active and visible police enforcement of the safety belt law.
Whenever there is a new program designed to increase belt use, it is importa~nt that
the program be properly evaluated. This evaluation is important for a variety of reasons.
To begin with, the organization that has provided the funding for the program often wants
to make sure that it has spent its money wisely. Additionally, a program may affect
different groups in a given population in different ways. It is critical to understand how each
of these groups respond to the program overall. Finally, an evaluation can provide
information regarding different aspects of the program to assess which parts (of the
program have been effective, and which parts might need to be changed in future
campaigns.
The purpose of the current study was to evaluate the effectiveness of a
medidenforcement program designed to increase safety belt use. Incentive funding for
states to implement innovative projects designed to increase safety belt use, including
media campaigns and enforcement programs, is available under Section 157 of the
Highway Safety Act of 1966 through the Transportation Equity Act for the 21" Century
(TEA-21). Under this section, Michigan was one of several states to receive funcling to
implement a paid media campaign using advertisements on broadcast television, cable
television, radio, and outdoor bulletins and posters. Concurrent with the media campaign,
Michigan also implemented increased police enforcement of the safety belt law.
The study utilized an experimental region where all media and enforcement
activities took place and a control region in which no media or enforcement were to be
implemented specifically as part of the program. Study measures were acquired from
three waves of a direct observation survey of safety belt use, with each wave concfucted
concurrently in each region. The direct observation study was supplemented by a
telephone-survey study conducted by a NHTSA-sponsored research firm during each of
the waves in each region. Results from both the direct observation study and the
telephone survey were used in assessing the effects of the media and enforcement
mobilization campaign.

METHODS
Selection of Experimental and Control Regions
The study design started with the selection of an experimental region and a control
region. The best experimental region is one in which the full impact of the paid media
campaign is realized; that is, an area in which broadcast television, cable television, radio,
and outdoor media are present. The best control region is one in which no paid media
coverage or safety belt enforcement is present. In order to assess differences in belt use
resulting from only the media campaign, it is imperative to match the two regions as closely
as possible. Because the dependent variable is safety belt use, the regions should match
as closely as possible on this variable prior to the media campaign. In additicm, the
populations of the regions should also be as similar as possible in their ability to process
the information in the campaign. The best surrogate for this ability is level of education.
Because of the uniqueness of Southeastern Michigan, this area was not a candidate for
the experimental region, as no control region in Michigan would match. Based uporl these
criteria, the experimental region consisted of three counties: Kent, Ottawa, and Muskegon.
The control region that matched most closely with the experimental region consisted of
three counties: Grand Traverse, Emmett, and Wexford. Table 1 shows the safety belt use
and education level1 of each study region. Kent county matched most closely with Grand
Traverse County, Ottawa County with Emmett County, and Muskegon County with
Wexford County. Overall, the average safety belt use and education levels between the
experimental and control regions matched closely.
Education was defined as the proportion of population in the county over 25 years of age with a professional or graduate degree based on 1990 estimates.

The study consisted of three waves of both direct observation and telephone
surveys. The first wave of data collection was conducted from May 1, 2002 to Mlay 15,
2002; the second wave from June 19,2002 to July 3, 2002; and the third wave from July
31, 2002 to August 14, 2002. The first wave of data collection served as the baseline
(called "Pre") and was conducted prior to the medidenforcement campaign which was held
in the last 2 weeks of May, 2002 and the first 2 weeks of June, 2002. The purpose of the
second wave of the data collection effort (called "Post 1 ") was to evaluate the immediate
impact of the campaign. The third wave (called "Post 2") was conducted to evaluate the
longer-term impact of the campaign. The three waves of data collection tagether
represented a complete picture for evaluating the effectiveness of the medidenforcement
campaign in increasing safety belt use.
Table 1. Safety Belt Use and Education Level for the Experimental and Control Groups by County and Overall.
Direct Observation Survey
Sample Design
For each wave, a total of 100 intersections were observed, 50 in the experilmental
region, and 50 in the control region. The sites were chosen using a method that ensured
that each intersection within a region had an equal probability of selection. Detailed, equal-
scale road maps for each county were obtained. The maps of each county within the
experimental region were then joined together to form a contiguous region map. The same
procedure was carried out for the control region. The region maps were then divided into
Education, %
12.6
11.0
7.0
10.2
14.1
12.6
8.0
11.6
Experimental
Kent
Ottawa
Muskegon
Overall
Control
Grand Traverse
Emmett
Wexford
Overall
Belt Use, %
74.2
69.0
61.6
68.3
76.3
70.3
63.8
70.1

a grid by breaking down the horizontal and vertical axes into 1 -mile square blocks. The grid
dimensions were 59 lines horizontally by 48 lines vertically for the experimental region, and
43 lines horizontally and 57 lines vertically for the control region. Each grid square was
uniquely identified by two numbers, a horizontal (x) coordinate and a vertical (y) coordinate.
The 50 intersection sites within each region were selected sequentially. The sites
were chosen by randomly selecting a grid square. Thus, each grid square within a region
had an equal probability of selection. If a single intersection was contained within the grid
square, that intersection was chosen as an observation site. If there was no intersection
within the square, or there was an intersection but it was located one road link from an
already selected intersection, then a new grid square was selected randomly. If more than
one intersection was present within the grid square, all intersections within the square were
assigned a number, and one of these numbers was picked randomly. The corresponding
intersection was then chosen as the site.
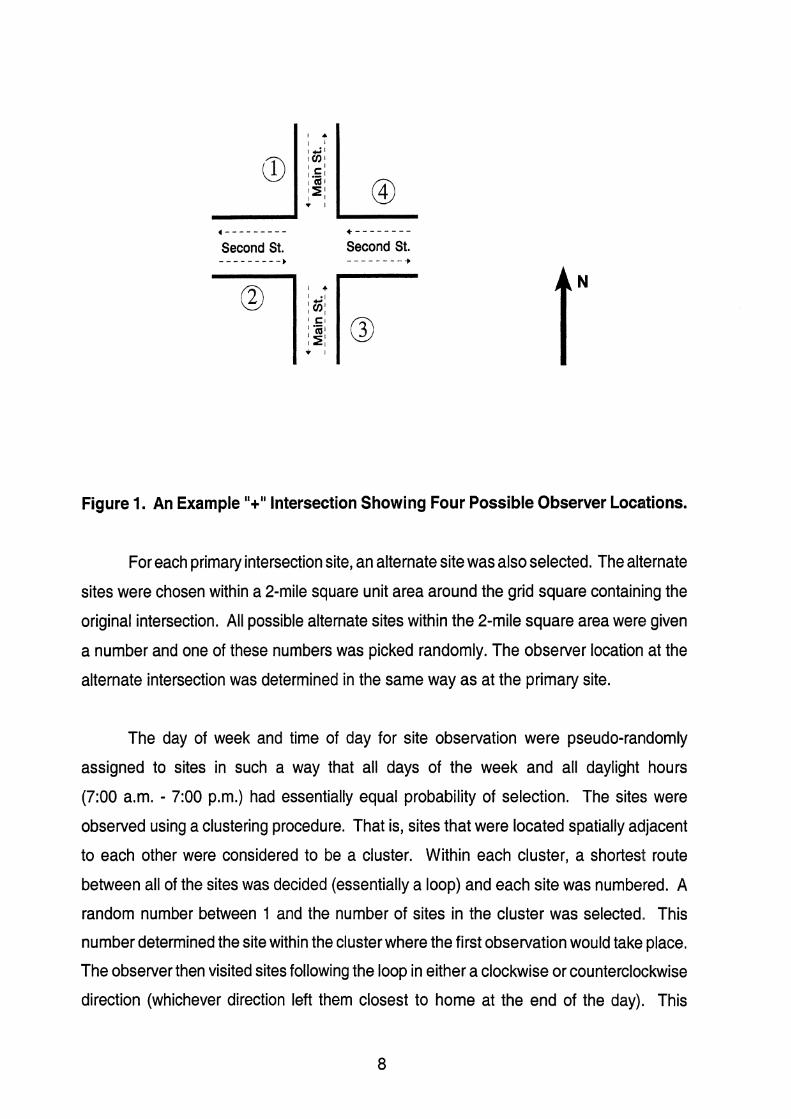
Once a site was chosen, the following procedure was used to determine the
particular street and direction of traffic flow that would be observed. For each intersection,
all possible combinations of street and traffic flow were determined. From this set of
observer locations, one location was randomly selected with a probability equal to
llnumber of locations. For example, if the intersection, was a "+" intersection, as !shown
in Figure 1, then there would be four possible combinations of street and direction of' traffic
flow to be observed (observers watched traffic only on the side of the street on whic:h they
were standing). In Figure 1, observer location number one indicates that the observer
would watch southbound traffic and stand next to Main Street. For observer location
number two, the observer would watch eastbound traffic and stand next to Second !Street,
and so on. In this example, a random number between 1 and 4 would be selected to
determine the observer location for this specific site. The probability of selecting an
intersection approach is dependent upon the type of intersection. Four-legged
intersections like that shown in Figure 1 have four possible observer locations, while three-
legged intersections like "T" and "Y" intersections have only three possible observer
locations. The effect of this slight difference in probability accounts for .01 percent lor less
of the standard error in the belt use estimate.
,--------- + - - - - - - - - Second St. Second St. - - - - - - - - .- - - - - - - - -
Figure 1. An Example "+" Intersection Showing Four Possible Observer Locations.
For each primary intersection site, an alternate site was also selected. The alternate
sites were chosen within a 2-mile square unit area around the grid square containing the
original intersection. All possible alternate sites within the 2-mile square area were given
a number and one of these numbers was picked randomly. The observer location at the
alternate intersection was determined in the same way as at the primary site.
The day of week and time of day for site observation were pseudo-randomly
assigned to sites in such a way that all days of the week and all daylight hours
(7:OO a.m. - 7:00 p.m.) had essentially equal probability of selection. The sites were
observed using a clustering procedure. That is, sites that were located spatially adjacent
to each other were considered to be a cluster. Within each cluster, a shortest route
between all of the sites was decided (essentially a loop) and each site was numbeired. A
random number between 1 and the number of sites in the cluster was selected,, This
number determined the site within the cluster where the first observation would take place.
The observer then visited sites following the loop in either a clockwise or countercloc~kwise
direction (whichever direction left them closest to home at the end of the day). This
direction was determined by the project manager prior to sending the observer into the
field. An observer watched traffic at all sites in the cluster during a single day. The day in
which the cluster was to be observed was randomly determined. After taking into
consideration the time required to finish all sites before dark, a random starting time lfor the
day was selected. Because of various scheduling limitations (e.g., observer availability,
number of hours worked per week) certain days andlor times were selected that cotlld not
be observed. When this occurred, a new day and/or time was randomly selected until a
usable one was found. The important issue about the randomization is that the day and
time assignments to the sites were not correlated with belt use at a site. This ps'eudo-
random method is randorn with respect to this issue.
Data Collection
Data collection for the study involved direct observation of shoulder belt use,
estimated age, sex, and race. There were two observers for each wave and the same
observers participated in all three waves. Each observer collected data at 50 sites. Both
observers collected data in both regions during the same period of data collection. The
observers noted shoulder belt use of drivers and front-right passengers traveling in
passenger cars, sport-utility vehicles, vanslminivans, and pickup trucks during daylight
hours for the three waves. Safety belt use, age, sex, and race observations were
conducted when a vehicle came to a stop at a traffic light or a stop sign.
Two forms were used for data collection: a site description form and an observation
form. The site description form (see Appendix A) provided descriptive information about
the site including the site number, location, observer number, date, day of week, t'ime of
day, weather, and a count of eligible vehicles traveling on the proper traffic leg. A place
on the form was also furnished for observers to sketch the intersection and to identify
observation locations and traffic flow patterns. Finally, a comments section was available
for observers to identify landmarks that might be helpful in characterizing the site (e.g.,
school, shopping mall) and to discuss problems or issues relevant to the site or study.
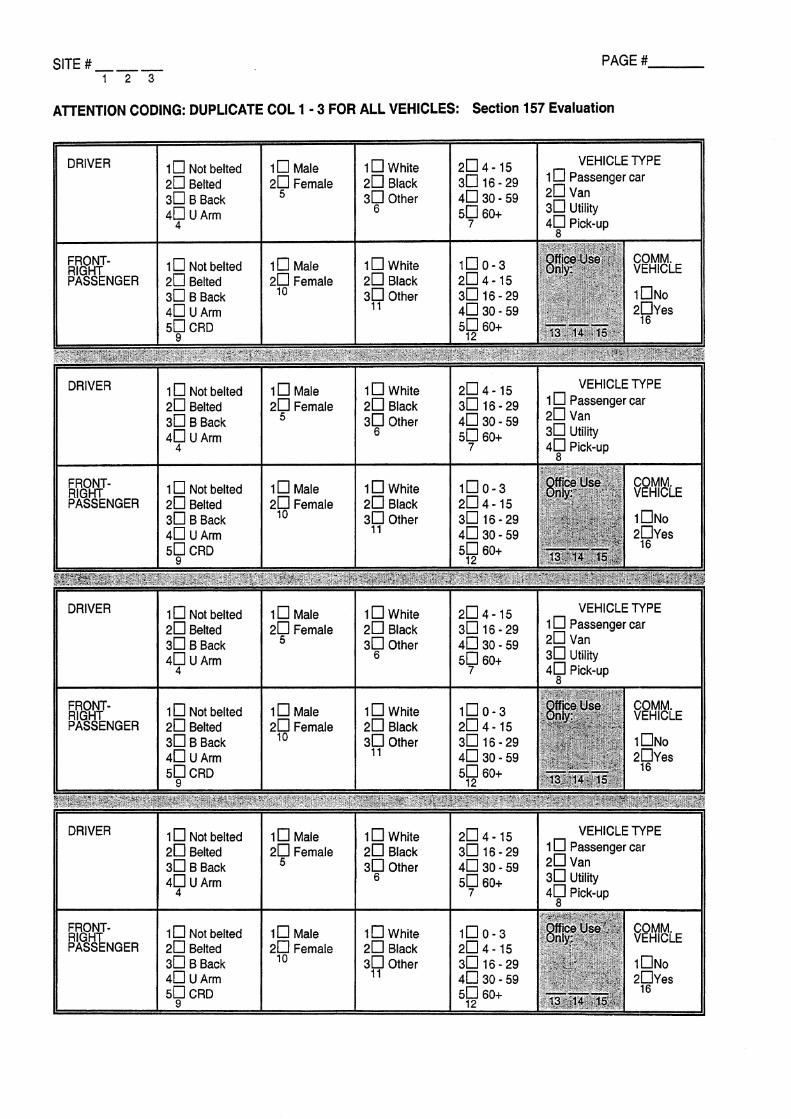
The second form, the observation form, was used to record safety belt use,
passenger information, and vehicle information (see Appendix A). Each observatio~n form

was divided into four boxes with each box having room for the survey of a single vehicle.
For each vehicle surveyed, shoulder belt use, sex, race, and estimated age for the driver
as well as vehicle type were recorded on the upper half of the box, while the same
information for the front-outboard passenger could be recorded in the lower half of the box
if there was a front-outboard passenger present. Children riding in child safety seats were
recorded but not included in any part of the analysis. Occupants observed with their
shoulder belt worn under the arm or behind the back were noted but considered as belted
in the analysis. Based upon NHTSA (1998) guidelines, the observer also relcorded
whether the vehicle was commercial or noncommercial. At each site, the observer carried
several data collection forms and completed as many as were necessary during the
observation period.
All sites in the sample were visited by one observer for a period of 1 hour. Upon
arrival at a site, observers determined whether observations were possible at that site. If
observations were not possible (e.g., due to construction), observers proceeded to the
alternate site. Otherwise, observers completed the site description form and then moved
to their observation position near the traffic control device. Observers were instructed to
observe only the lane immediately adjacent to the curb for safety belt use regardless of the
number of lanes present.
At each site, observers conducted a 5-minute count of all eligible vehicles on the
designated traffic leg before beginning safety belt observations. Observations began
immediately after completion of the count and continued for 50 minutes. During the
observation period, observers recorded data for as many eligible vehicles as they could.
If traffic flow was heavy, observers were instructed to record data for the first eligible
vehicle they saw and then look up and record data for the next eligible vehicle they saw,
continuing this process for the remainder of the observation period. At the end of the
observation period, a second 5-minute vehicle count was conducted.
Observer Training
Prior to data collection, field observers participated in 2 days of intensive training,
including both classroon~ review of data collection procedures and practice field
observations. Each observer received a training manual containing detailed information
on field procedures for observations, data collection forms, and administrative policies and
procedures. Included in the manual was a listing of the sites for the study that identified
the location of each site and the traffic leg to be observed (see Appendix B for a listing of
the sites), as well as a site schedule identifying the date and time each site was to be
observed.
After intensive review of the manual, observers conducted practice observations at
several sites chosen to represent the types of sites and situations that would actually be
encountered in the field. None of these practice sites were the same as sites observed
during the study. Training at each practice site focused on completing the site description
form, determining where to stand and which lanes to observe, conducting the vehicle
count, recording safety belt use, and estimating age and sex. Observers worked in pairs,
observing the same vehicles, but recording data independently on separate data collection
forms. Each observer pair practiced recording safety belt use, sex, race, and age until
there was an inter-observer reliability of at least 85 percent for all measures on drivers and
front-right passengers.
Each observer was provided with an atlas of Michigan county-maps alnd all
necessary field supplies. Observers were given time to mark their assigned sites on the
appropriate maps and plan travel routes to the sites. After marking the sites on their maps,
the marked locations were compared to a master map of locations to ensure that the
correct sites had been pinpointed. Field procedures were reviewed for the final time and
observers were informed that unannounced site visits would be made by the field
supervisor during data collection to ensure adherence to study protocols.
Observer Supen/ision and Monitoring
During data collection, each observer was spot checked in the field on at least two
occasions by the field supervisor for each wave. Contact between the field supervisor and

field staff was also maintained on a regular basis through staff visits to the UMTRl office
to drop off completed forms and through telephone calls from staff to report progre:ss and
discuss problems encountered in the field. Field staff were instructed to call the field
supervisor at home if problems arose during evening hours or on weekends.
Incoming data forms were examined by the field supervisor and problems (e.g.,
missing data, discrepancies between the site description form and site listing or schedule)
were noted and discussed with field staff. Attention was also given to comments on the
site description form about site-specific characteristics that might affect future siurveys
(e.g., traffic flow patterns, traffic control devices, site access).
Data Processing and Estimation Procedures
The site and data collection forms were entered into an electronic format:. The
accuracy of the data entry was verified in two ways. First, all data were entered twice and
the data sets were compared for consistency. Second, the data from randomly selected
sites were reviewed for accuracy by a second party and all site data were checked for
inconsistent codes (e.g., the observation end time occurring before the start time). Errors
were corrected after consultation with the original data forms.
For each site, the number of observed vehicles, belted and unbelted drivers, and
belted and unbelted passengers was determined. Separate counts were made for each
independent variable in the survey (i.e., site type, time of day, day of week, weather, sex,
race, age, seating position, and vehicle type). This information was combined with the site
information to create a file used for generating study results. Vehicle count information
was used to weight the obsewed traffic volumes so they would more accurately reflect
traffic volumes in the study areas.
This weighting was done by first adding each of the two 5-minute counts and then
multiplying this number by 5 so that it would represent a 50-minute duration. The resulting
number was the estimated number of vehicles passing the site if all eligible vehicles had
been included in the survey during the observation period, The estimated count then was
divided by the actual vehicle count to obtain a traffic-volume weighting-factor for th'at site.
Unless otherwise indicated, all analyses reported here are based upon the weighted
values.
Telephone Survey
The objective of the telephone survey was to measure the effects of paid media
activities and police-enforcement programs on public attitudes and perceptions about
safety belt use and the program itself.
Methods
NHTSA selected Schulman, Ronca and Bucuvalas, Inc. (SRBI), a professional
survey research organization to conduct the telephone surveys for all of the participating
states. This included sampling, conducting the telephone interviews, developing the data
files, including data weighting, preliminary data analysis, and documentation. The
telephone survey instrument was specified by NHTSA for consistency across participating
states. The version used in Michigan included items on media slogans and types of
enforcement used in Michigan. A copy of the telephone survey instrument used in
Michigan can be found in Appendix C.
The telephone interviews were conducted in three waves in the same experimental
and control regions of Michigan used in the direct observation portion of the study. The
same instrument was used throughout the study. Baseline information on the public's
knowledge, attitudes, and reported behavior related to safety belt use was collected
between April 18 and May 3,2002, prior to any paid media and enforcement efforts in the
Pre wave of the survey. The Post 1 wave of the telephone survey was conducted between
June 3 and June 24, 2002, immediately after the media and enforcement mobilization.
The Post 2 wave of the survey was conducted between July 9 and July 22, 2002. The
intent of the third wave was to determine if the attitudes and perceptions of resporldents
changed with time. Further details on the survey design and data collection can be found
elsewhere (Schulman, Ronca and Bucuvalas, Inc., 2002).
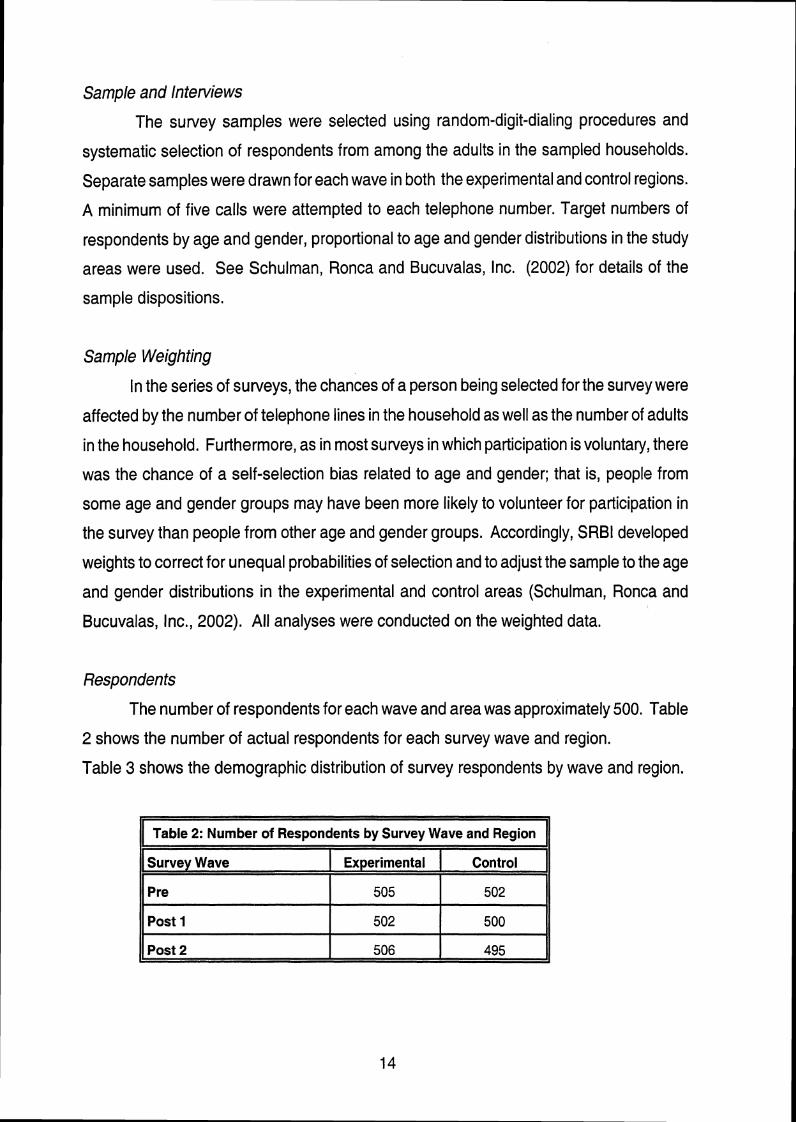
Sample and Intenliews
The survey samples were selected using random-digit-dialing procedures and
systematic selection of respondents from among the adults in the sampled households.
Separate samples were drawn for each wave in both the experimental and control regions.
A minimum of five calls were attempted to each telephone number. Target numbers of
respondents by age and gender, proportional to age and gender distributions in the study
areas were used. See Schulman, Ronca and Bucuvalas, Inc. (2002) for details of the
sample dispositions.
Sample Weighting
In the series of surveys, the chances of a person being selected for the survey were
affected by the number of telephone lines in the household as well as the number of adults
in the household. Furthermore, as in most surveys in which participation is voluntary, there
was the chance of a self-selection bias related to age and gender; that is, people from
some age and gender groups may have been more likely to volunteer for participation in
the survey than people from other age and gender groups. Accordingly, SRBl developed
weights to correct for unequal probabilities of selection and to adjust the sample to the age
and gender distributions in the experimental and control areas (Schulman, Ronc:a and
Bucuvalas, Inc., 2002). All analyses were conducted on the weighted data.
Respondents
The number of respondents for each wave and area was approximately 500. Table
2 shows the number of actual respondents for each survey wave and region.
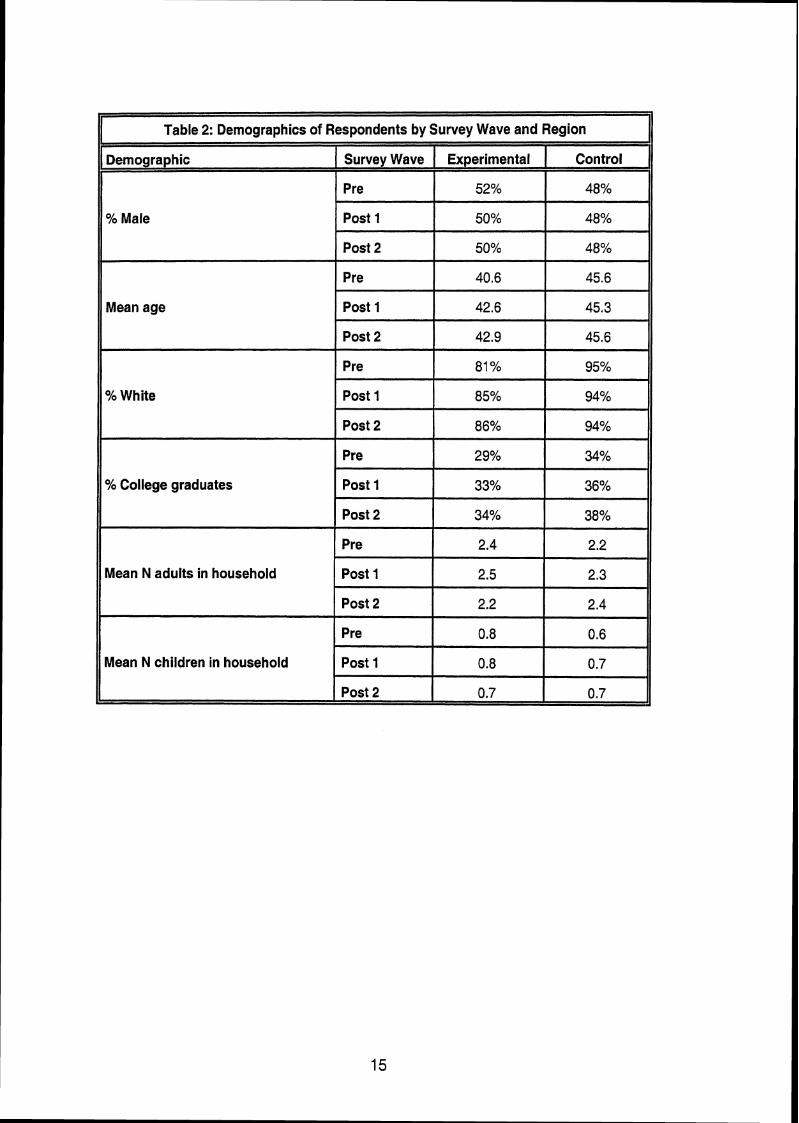
Table 3 shows the demographic distribution of survey respondents by wave and region.
Table 2: Number of Respondents by Survey Wave and Region
Survey Wave I Experimental I Control
Post 1
Post 2 506 495
Region Table 2: Demographics of
Demographic I Respondents by
Survey Wave
Survey Wave and
Experimental Control 1 48%
48%
48%
45.6
45.3
45.6
95%
94%
94%
34%
36%
38%
2.2
2.3
2.4
0.6
0.7
% Male
Mean age
% White
% College graduates
Mean N adults in household
Mean N children in household
Pre
Post 1
Post 2
Pre
Post 1
Post 2
Pre
Post 1
Post 2
Pre
Post 1
Post 2
Pre
Post 1
Post 2
Pre
Post 1
52%
50%
50%
40.6
42.6
42.9
81 %
85%
86%
29%
33%
34%
2.4
2.5
2.2
0.8
0.8

RESULTS
Direct Observation Survey
Table 3 shows the overall safety belt use rates, 95 percent confidence bands, and
unweighted Ns for each region and survey wave. Confidence bands that do not olverlap
can be considered significantly different. Note again that the Pre survey was conducted
prior to the medideducation program, the Post 1 survey was conducted immediatelly after
the program, and the Post 2 survey wave was conducted 6 weeks after program
completion, Comparing across survey waves showed that safety belt use in the
experimental region, where the medialenforcement program was conducted, did not
change except for a significant increase between Post 1 and Post 2. In the control region,
where no specific medidenforcement program activities occurred, the estimated rate
increased between the Pre and Post 1 survey waves but not significantly. Thus, the
program does not appear to have increased belt use in the experimental region.
Unexpectedly, safety belt use was significantly higher in the control than in the
experimental region for Post 1.
Table 3: Overall Safety Belt Use by Survey Wave and Study Region 11
Table 4 shows estimated safety belt use rates, 95 percent confidence bancls, and
unweighted Ns for each region and survey wave by vehicle type. As is typically found,
safety belt use for pickup truck occupants was significantly lower than for occupants of
other vehicle types, while little difference was found in safety belt use for occupants of
passenger cars, vanslminivans, or sport-utility vehicles (SUVs). Analysis across survey
waves for the experimental region showed no differences in safety belt use for pickup
trucks, SUVs, or vanslminivans. Passenger car occupant belt use increased significantly
between the Post 1 and Post 2 surveys.
Region Pre Post 1 j Experimental
Control t Significant with Experimental group. fl Significant with Post 1.
74.7 * 5.1 (2,242)
77.5 * 3.4 (2,321)
72.2 * 1.8 (2,786)
81.4 s 3.8t (3,140)
77.9 s 2.7g (2,913)
82.3 s 4.7 (3,095)
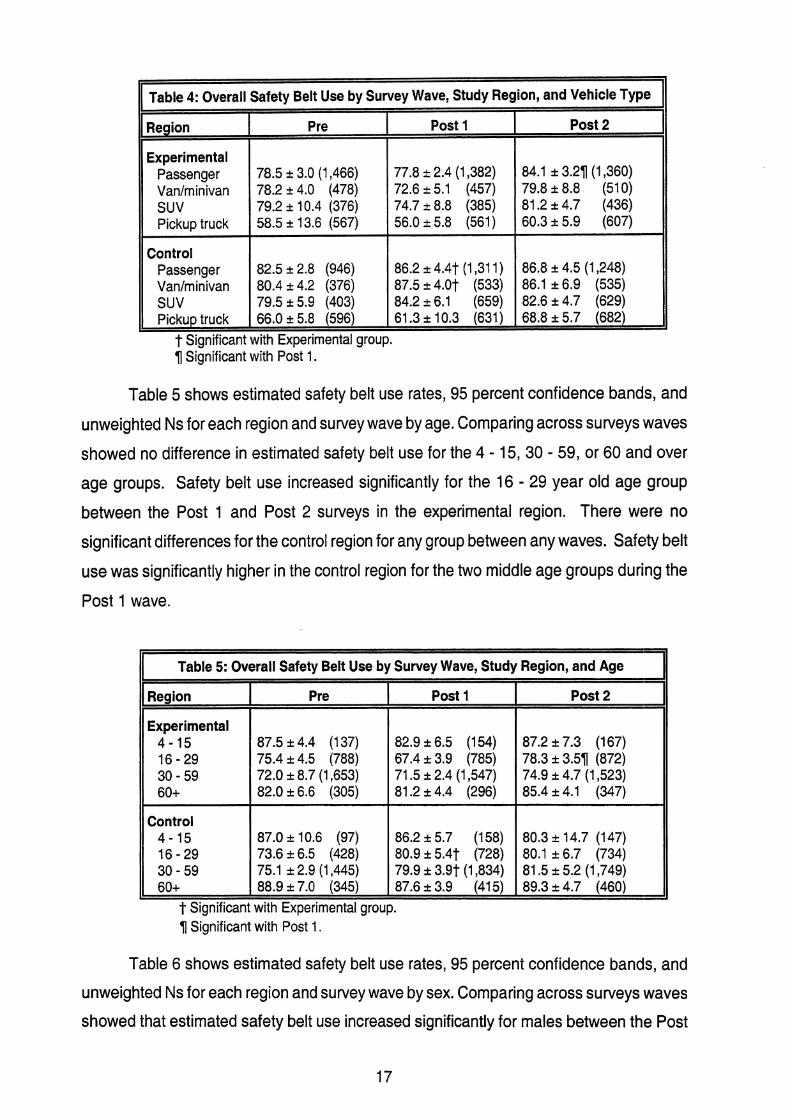
Table 4: Overall Safety Belt Use by Survey Wave, Study Region, and Vehicle Type - -
Table 5 shows estimated safety belt use rates, 95 percent confidence bands, and
Control Passenger Vanlminivan SUV Pickup truck
unweighted Ns for each region and survey wave by age. Comparing across surveys waves
Post 2 - -
showed no difference in estimated safety belt use for the 4 - 15, 30 - 59, or 60 and over
Post 1 Region
t Significant with Experimental group. 7 Significant vvith Post 1.
82.5 k 2.8 (946) 80.4 + 4.2 (376) 79.5 + 5.9 (403) 66.0 A 5.8 (596)
age groups. Safety belt use increased significantly for the 16 - 29 year old age group
Pre
between the Post 1 and Post 2 surveys in the experimental region. There were no
-
86.2 * 4.4t (1,311) 87.5 r 4.0t (533) 84.2 + 6.1 (659) 61.3 + 10.3 (631)
significant differences for the control region for any group between any waves. Safety belt
86.8 r 4.5 (1,248) 86.1 * 6.9 (535) 82.6 k 4.7 (629) 68.8 2 5.7 (682) -
use was significantly higher in the control region for the two middle age groups during the
Post 1 wave.
Table 5: Overall Safety Belt Use by Survey Wave, Study Region, and Age
Region Pre Post 1 I I
Experimental 4 - 1 5 87.5 + 4.4 (1 37) 82.9 + 6.5 (1 54) 16 - 29 75.4 + 4.5 (788) 67.4 + 3.9 (785) 30 - 59 72.0 + 8.7 (1,653) 71.5 + 2.4 (1,547) 60+ 82.0 + 6.6 (305) 81.2 + 4.4 (296)
Control
t Significant with Experimental group. fl Significant with Post 1.
Post 2
Table 6 shows estimated safety belt use rates, 95 percent confidence bands, and
unweighted Ns for each region and survey wave by sex. Comparing across surveys waves
showed that estimated safety belt use increased significantly for males between the Post

1 and Post 2 surveys for the experimental region. There were no significant differences
for the control region for males or females between any waves. Safety belt use was
significantly higher in the control region for males in Post 1.
Table 6: Overall Safety Belt Use by Survey Wave, Study Region, and Sex 11 - - - -
Region
Experimental Male Female
1 Significant with Post 1.
Pre
--
Control Male Female
Table 7 shows estimated safety belt use rates, 95 percent confidence bands, and
66.9 k 5.5 (1,517) 83.6k5.0 (1,372)
unweighted Ns for each region and survey wave by seating position. Analysis across
Post 1
t Significant with Experimental group. 1 72.0 k 3.8 (1,238)
83.5 2 3.5 (1,083)
survey waves showed that estimated safety belt use increased significantly for drivers
Post 2 41 64.7 + 2.6 (1,548) 81 .9~2 .0 (1,238)
between the Post 1 and Post 2 surveys, while no differences for passengers were found
71.7 + 3.81 (1,577) 85 .3~4.6 (1,336)
76.7 * 4.7t (1,687) 87.0 k 3.1 (1,452)
in the experimental region. There were no significant differences for the control region for
75.7 * 4.9 (1,609) 89.1 k 4.2 (1,486)
drivers or passengers between any waves. In the Post 1, safety belt for both drivers and
passengers was higher for the control region than the experimental region.
Table 7: Overall Safety Belt Use by Survey Wave, Study Region, and Seating Positilon 11
Telephone Survey
Region
Experimental Driver Passenger
Control Driver Passenger
The telephone survey was divided into four sections: Driving/vehicle/safety belt use;
Knowledge and opinions about Michigan's mandatory safety belt use law; Attitudes toward
t Significant with Experimental group. fl Significant with Post 1.
Pre
76.1 + 3.9 (2,271) 69.8 k 9.2 (620)
76.9 k 3.0 (1,642) 78.9k5.9 (679)
Post 1
71.8 1.8 (2,051) 73.2 k 3.1 (735)
80.6 4.4t (2,080) 83.2*3.4t(1,060)
Post 2
77.6 -1 3.21 (2,268) 79.1 4.8 (645)
81.5 4.3 (2,083) 83.8k6.1 (1,012)
safety belts; and Awareness of the medidenforcement campaign. We present the
telephone survey results organized by these categories.
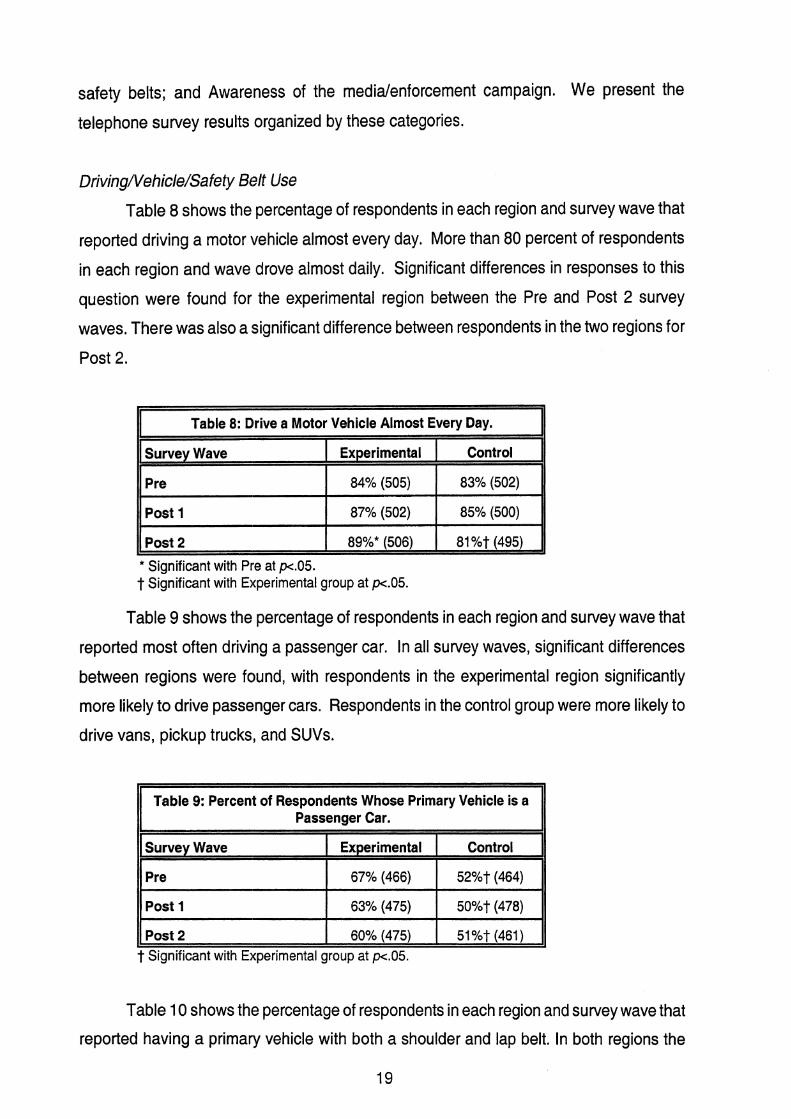
DrivingNe hicle/Sa fety Belt Use
Table 8 shows the percentage of respondents in each region and survey wave that
reported driving a motor vehicle almost every day. More than 80 percent of respondents
in each region and wave drove almost daily. Significant differences in responses to this
question were found for the experimental region between the Pre and Post 2 survey
waves. There was also a significant difference between respondents in the two regions for
Post 2.
* Significant with Pre at pc.05. t Significant with Experimental group at ~ . 0 5 .
Table 8: Drive a Motor Vehicle Almost Every Day.
Table 9 shows the percentage of respondents in each region and survey wave that
reported most often driving a passenger car. In all survey waves, significant differences
Control
83% (502)
85% (500)
81 % t (495)
Survey Wave
Pre
Post 1
Post 2
between regions were found, with respondents in the experimental region significantly
Experimental
84% (505)
87% (502)
89%* (506)
more likely to drive passenger cars. Respondents in the control group were more li!kely to
drive vans, pickup trucks, and SUVs.
II Table 9: Percent of Respondents Whose Primary Vehicle is a Passenger Car. II
t Significant with Experimental group at p .05 .
Survey Wave
Pre
Post 1
Post 2
Table 10 shows the percentage of respondents in each region and survey wave that
reported having a primary vehicle with both a shoulder and lap belt. In both regions the
Experimental
67% (466)
63% (475)
60% (4751
Control
52%t (464)
50%t (478)
51 %t (461)

presence of lap and shoulder belts was extremely high, with no differences between survey
waves or regions.
Tables 11 and 12 show the percentage of respondents in each region and survey
wave that reported using a shoulder belt and a lap belt all of the time. For the experimental
region, both Post survey waves had a significantly greater number of respondents report
using shoulder belts "all of the time" than in the Pre survey wave, while no diffe~rences
between waves were found for the control region. In addition, self-reported all-of-the-time
use was significantly greater in the control region than in the experimental region for the
Pre survey wave. Similar results were found when respondents were asked about lap belt
use (Table 12).
Table 10: Percent of Respondents with Both a Shoulder and Lap Belt in Primary Vehicle.
11 Table 11 : Percent of Respondents Reporting Using Shoulder Belt All of the Time. 11
Control
96% (464)
93% (478)
93% (459)
Survey Wave
Pre
Post 1
Post 2
Experimental
95% (465)
94% (475)
94% (471)
Survey Wave
Pre
Post 1
* significant with Pre at p.05. t Significant with Experimental group at pc.05.
Post 2
- - -- - -
Table 12: Percent of Respondents Reporting Using Lap Belt All of the Time. 1)
Experimental
87% (462)
89%* (471 )
Control
92%t (46 1 )
89% (470)
91 %* (468) 90% (454)
Survey Wave
Pre
Post 1
Post 2
Experimental
86% (434)
Control
91 % t (441 )
* Significant with Pre at p.05. t Significant with Experimental group at pc.05.
89% (446)
91 %* (447)
88% (446)
88% (433)
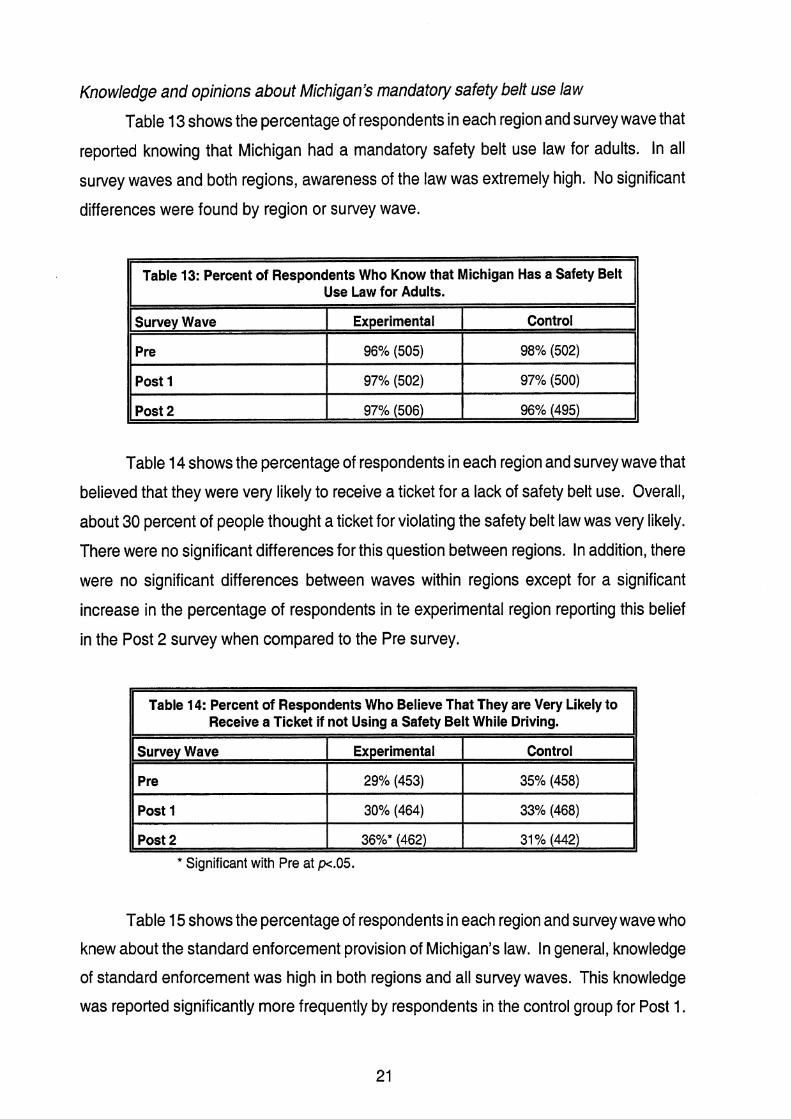
Knowledge and opinions about Michigan's mandatory safety belt use law
Table 13 shows the percentage of respondents in each region and survey wave that
reported knowing that Michigan had a mandatory safety belt use law for adults. In all
survey waves and both regions, awareness of the law was extremely high. No significant
differences were found by region or survey wave.
Table 14 shows the percentage of respondents in each region and survey wave that
believed that they were very likely to receive a ticket for a lack of safety belt use. Overall,
about 30 percent of people thought a ticket for violating the safety belt law was very likely.
There were no significant differences for this question between regions. in addition, there
were no significant differences between waves within regions except for a sign~ificant
increase in the percentage of respondents in te experimental region reporting this belief
in the Post 2 survey wheri compared to the Pre survey.
Table 13: Percent of Respondents Who Know that Michigan Has a Safety Belt Use Law for Adults.
* Significant with Pre at w.05.
Control
98% (502)
97% (500)
96% (495)
Survey Wave
Pre
Post 1
Post 2
Table 14: Percent of Respondents Who Believe That They are Very Likely to Receive a Ticket if not Using a Safety Belt While Driving.
Table 15 shows the percentage of respondents in each region and survey wave who
knew about the standard enforcement provision of Michigan's law. In general, knowledge
of standard enforcement was high in both regions and all survey waves. This knowledge
was reported significantly more frequently by respondents in the control group for Post 1.
Experimental
96% (505)
97% (502)
97% (506)
Survey Wave
Pre
Post 1
Post 2
Experimental
29% (453)
30% (464)
36%* (462)
Control
35% (458)
33% (468)
31 % (442)

There was also a significant decrease in the knowledge in the control group between Post
1 and Post 2 surveys.
t Significant with Experimental group at p<.05. 1 Significant with Post 1 at p<.05.
Table 15: Percent of Respondents Who Know that According to State Law, Police Can Stop a Vehicle if they Observe a Seat Belt Violation Without
Observing Some Other Offense.
Table 16 shows the percentage of respondents in each region and survey wave who
support standard enforcement. Overall, support for standard enforcement was found in
about two-thirds of respondents. There were no significant differences between waves or
regions.
Control - 89% (490)
91 %t (488)
85%n (473)
Survey Wave
Pre
Post 1
Post 2
Attitudes To ward Safety Belts
Table 17 shows the percentage of respondents in each region and survey wave who
strongly disagreed that safety belts are just as likely to cause harm as to help. Clverall,
about one-half of respondents held this belief. There were no significant differences
between regions. Within the control region, however, significantly more respondents in
Post 1 held this belief than in the Pre survey wave.
Experimental
85% (488)
87% (490)
87% (492)
-
Table 16: Percent of Respondents Who Believe that Police Should be Allowed to Stop a Vehicle if they Observe a Seat Belt Violation When no
Other Traffic Laws are Being Broken.
Survey Wave
Pre
Post 1
Post 2
Experimental
68% (505)
70% (502)
69% (506)
Control
66% (502)
68% (500)
67% (495)

Table 18 shows the percentage of respondents in each region and survey wave who
Table 17: Percent of Respondents Who Strongly Disagree with the Statement "Seat Belts are Just as Likely to Harm You as Help You."
reported that they would want to be using a safety belt if they were in a crash. In all (cases,
nearly 90 percent of respondents held this belief with no differences between regions. In
Control
45% (502)
51 %* (500)
47% (495)
Survey Wave
Pre
Post 1
Post 2
the experimental region, significantly fewer respondents held this belief in the IPost 1
* Significant with Pre at p<.05.
Experimental
45% (505)
46% (502)
47% (506)
survey than in the Pre survey.
* Significant with Pre at pc.05.
Table 18: Percent of Respondents Who Strongly Agree with Statement, "If I Was in an Accident, I Would Want to Have my Seat Belt On."
Table 19 shows the percentage of respondents in each region and survey wave who
either somewhat or strongly agreed that police in their community do not generally enforce
the safety belt law. In general, slightly less than 30 percent of respondents at least agreed
somewhat with this statement. There were no differences between regions. The study
found a significant decrease in the percentage of respondents in the experimental region
who at least agreed somewhat with this statement between the Pre and Post 1 surveys.
Control
87% (502)
85% (500)
86% (495)
Survey Wave
Pre
Post 1
Post 2
Experimental
89% (505)
87%* (502)
89% (506)

Table 19: Percent of Respondents who Agree with the Statement, "Police in My Community Generally will not Bother to Write Tickets for Seat Belt
Violations."
Survey Wave I Experimental Control I I !I
Post 2 28% (506) 29% (495) 1
Pre
Post 1
* Significant with Pre at pc.05.
Table 20 shows the percentage of respondents in each region and survey wave who
strongly agreed that it is important for police to enforce safety belt laws. In all survey
waves and regions, about 60 percent of respondents agreed with this statement, with no
significant differences by region or survey wave.
33% (505)
27%* (502)
28% (502)
27% (500)
Awareness of the Media/Enforcement Campaign
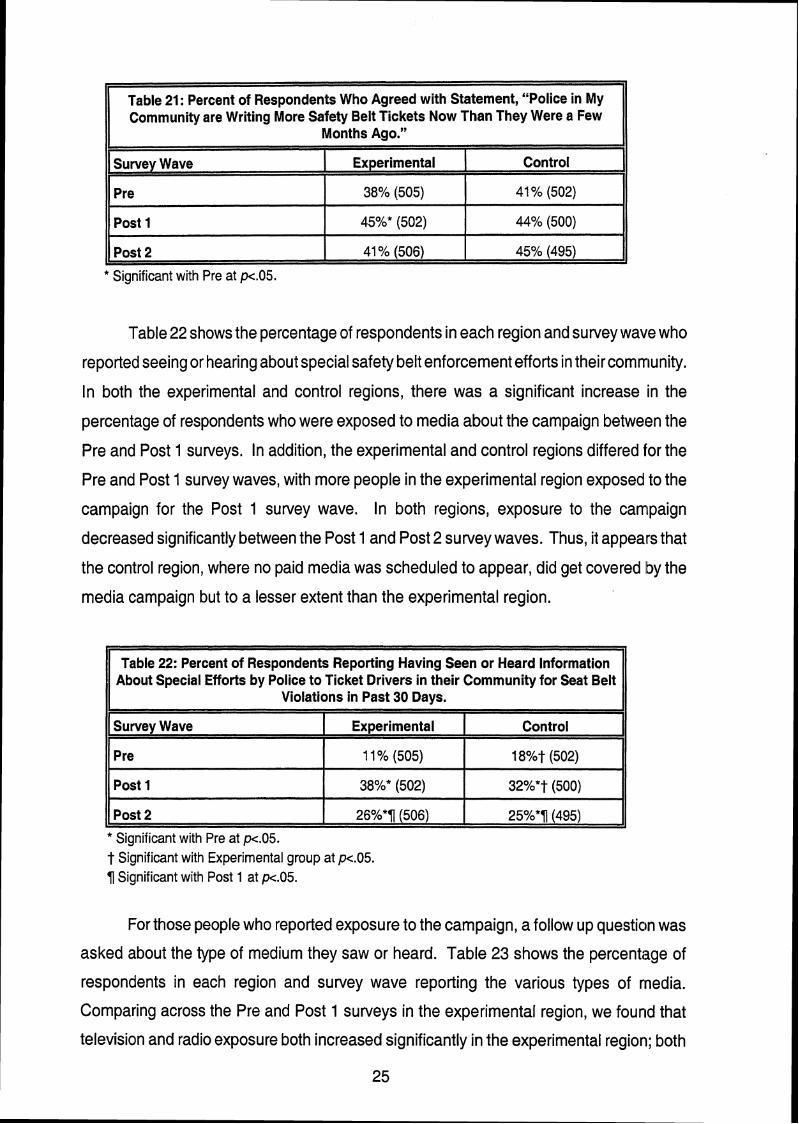
Table 21 shows the percentage of respondents in each region and survey wave who
somewhat or strongly agreed that police safety belt citation activity has increasedl in the
past few months. In general, slightly more than 40 percent of respondents held this belief
with no differences between the regions. The study also found a significant increase in
the percentage of respondents holding this belief in the experimental region between the
Pre and Post 1 survey waves. Thus, it appears that the enforcement component: of the
campaign in the experimental region was visible to respondents in that region.
Table 20: Percent of Respondents who Strongly Agreed it was Important For Police to Enforce Safety Belt Laws.
Survey Wave
Pre
Post 1
Post 2
Experimental
61% (505)
64% (502)
62% (506)
Control - 61 % (502)
60% (500)
59% (495)
* Significant with Pre at pc.05.
Table 21: Percent of Respondents Who Agreed with Statement, "Police in My Community are Writirtg More Safety Belt Tickets Now Than They Were a Few
Months Ago."
Table 22 shows the percentage of respondents in each region and survey wave who
reported seeing or hearing about special safety belt enforcement efforts in their community.
In both the experimental and control regions, there was a significant increase in the
percentage of respondents who were exposed to media about the campaign between the
Pre and Post 1 surveys. In addition, the experimental and control regions differed for the
Pre and Post 1 survey waves, with more people in the experimental region exposed to the
campaign for the Post 1 survey wave. In both regions, exposure to the carr~paign
decreased significantly between the Post 1 and Post 2 survey waves. Thus, it appears that
the control region, where no paid media was scheduled to appear, did get covered by the
media campaign but to a lesser extent than the experimental region.
Survey Wave
Pre
Post 1
Post 2
* Significant with Pre at pe.05. t Significant with Experimental group at pc.05. fl Significant with Post 1 at pc.05.
Experimental
38% (505)
45%* (502)
41% (506)
For those people who reported exposure to the campaign, a follow up question was
asked about the type of medium they saw or heard. Table 23 shows the percentage of
respondents in each region and survey wave reporting the various types of media.
Comparing across the Pre and Post 1 surveys in the experimental region, we found that
television and radio exposure both increased significantly in the experimental region; both
Control
41% (502)
44% (500)
45% (495)
I
Table 22: Percent of Respondents Reporting Having Seen or Heard Information About Special Efforts by Police to Ticket Drivers in their Community for Seat Belt
Violations in Past 30 Days.
Survey Wave
Pre
Post 1
Post 2
Experimental
1 1 % (505)
38%* (502)
26%*1(506)
Control
1 8% t (502)
32%*t (500)
25%*1(495)
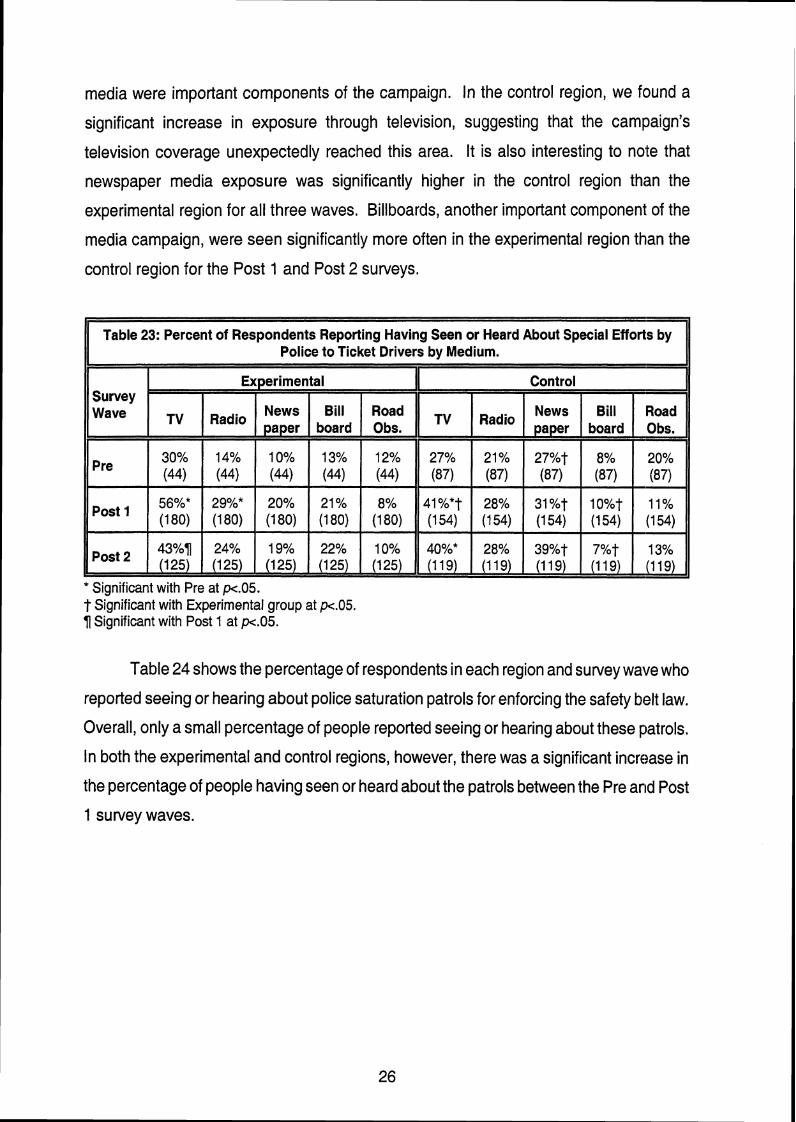
media were important components of the campaign. In the control region, we found a
significant increase in exposure through television, suggesting that the campaign's
television coverage unexpectedly reached this area. It is also interesting to note that
newspaper media exposure was significantly higher in the control region than the
experimental region for all three waves. Billboards, another important component of the
media campaign, were seen significantly more often in the experimental region than the
control region for the Post 1 and Post 2 surveys.
II Table 23: Percent of Respondents Reporting Having Seen or Heard About Special Efforts by Police to Ticket Drivers by Medium.
* Significant with Pre at pe.05. t Significant with Experimental group at pe.05. fl Significant with Post 1 at pe.05.
Table 24 shows the percentage of respondents in each region and survey wave who
reported seeing or hearing about police saturation patrols for enforcing the safety belt law.
Overall, only a small percentage of people reported seeing or hearing about these patrols.
In both the experimental and control regions, however, there was a significant increase in
the percentage of people having seen or heard about the patrols between the Pre and Post
1 survey waves.

* Significant with Pre at pc.05. t Significant with Experimental group at pc.05.
7 / Significant with Post 1 at pc.05.
Table 24: Percent of Respondents Reporting Having Seen or Heard About the Police Saturation Patrols for Safety Belt Law Enforcement in the Past 30 Days.
Table 25 shows the percentage of respondents in each region and survey wave who
reported having seen or heard about special efforts by police to enforce child occ:upant
Control
12%t (502)
20%* (500)
1 3"/07/(495)
Survey Wave
Pre
Past 1
Post 2
protection laws. In general, slightly less than one-quarter of respondents reported seeing
Experimental
5% (505)
16%" (502)
13%" (506)
or hearing about these special efforts. In the experimental region, however, the
percentages significantly increased after the Pre survey wave, while no differences were
found for the control region.
Table 25: Percent of Respondents Who in the Past 30 Days, Have Seen or Heard of Any Special Effort by Police to Ticket Drivers in My Community if Children in their Vehicles are Not Wearing Seat Belts or Not in Car Seats.
Survey Wave I Experimental I Control
Table 26 shows the percentage of respondents in each region and survey wave who
reported exposure to messages in the last month that encourage safety belt use. About
80 percent of all respondents reported having been exposed to this message within the
past month. There was a significant increase in people reporting exposure to the safety
belt message in both regions between the Pre and Post 1 survey waves.
Pre
Post 1
Post 2
* Significant with Pre at pc.05.
15% (505)
25%* (502)
24%* (506)
1 9% (502)
23% (500)
20% (495)

* Significant with Pre at pc.05. f l Significant with Post 1 at pc.05.
Table 26: Percent of Respondents Who in the Past 30 Days, Have Seen or Heard Any Messages that Encourage People to Wear Their Seat Belts.
Those people who reported having heard or seen messages promoting safety belt
use were asked a follow up question about which type of medium carried the message.
Table 27, shows the percentage of respondents by region and survey waves reporting
exposure by type of media. For the experimental region, significant increases in
percentage were found between the Pre and Post 1 survey waves for television, radio,
newspapers, and billboards. For the control region, significant increases were found for
radio, newspapers, and on-the-road observation. Again, it appears as if the media
campaign unexpectedly reached the control region, or another campaign was in effect at
the same time.
II Table 27: Percent of Respondents Reporting Having Seen or Heard Messages About Spc!cial Efforts by Police to Ticket Drivers by Medium. 11
Control
79% (502)
84%* (500)
79%fl (495)
Survey Wave
Pre
Post 1
Post 2
Survey Wave t
Experimental
76% (505)
85%* (502)
83%* (506)
Radio I ,":; I
tal
BiH 1 1; board
* Significant with Pre at p.05. t Significant with Experimental group at pe.05. f l Significant with Post 1 at pc.05.
Control II News Bill Road Radio paper board 1
Table 28 shows the percentage of respondents in each region and survey wave who
reported having seen advertisements or activities in the past month encouraging child

occupant protection device use. Again, for both regions, significant increases in reported
exposure were found bet\~een the Pre and Post 1 survey waves.
* Significant with Pre at p<.05.
Table 28: Percent of Respondents Reporting Seeing Advertisements or Activities in the Past 30 Days that Encouraged Adults to Make Sure Their
Children Use Car Seats or Seat Belts.
Table 29 shows the percentage of respondents in each region and survey wave who
think it is important for Michigan to enforce the adult safety belt law more strictly. Overall,
about one-half of respondents held this belief with no significant differences between
regions or survey waves.
Control
38% (502)
46%* (500)
44%* (495)
Survey Wave
Pre
Post 1
Post 2
Table 30 shows the percentage of respondents in each region and survey wave who
reported having seen or heard any of the following messages in the past month: Buckle
Up Always; Buckle up Michigan; Click It or Ticket Michigan; Get the Keys; Didn't see it
coming? No one ever does; You Drink, You Drive, You Lose; Children in Back; Buckle up
America; Click It or Ticket; or Friends Don't Let Friends Drive Drunk. Nearly 100 percent
of respondents had heard of at least one of these messages, with no difference between
regions or survey waves. Table 31 shows the percentages of people reporting exposure
to the various safety-belt-related messages by region and survey wave. The study found
increases in the percentages of people reporting exposure to both Click it or Ticket
messages between the Pre and Post 1 survey waves for both regions. Significantly more
Experimental
38% (505)
46%* (502)
42% (506)
Table 29: Percent of Respondents Who Think That it is Very Important for Michigan to Enforce Seat Belt Laws for Adults More Strictly.
Control
51 % (502)
51 % (500)
51 % (495)
Survey Wave
Pre
Post 1
Post 2
Experimental
52% (505)
56% (502)
56% (506)

people in the control than in the experimental region reported exposure to the Buckle Up
Michigan message for the Pre and Post 1 surveys waves.
* Significant with Pre at pc.05. t Significant with Experimental group at pc.05. f l Significant with Post 1 at pe.05.
Table 30: Percent of Respondents Who Recall Hearing or Seeing Any Safety Belt Messages in the Past 30 Days.
Control
97% (502)
98% (500)
97% (495)
Survey Wave
Pre
Post 1
Post 2
Experimental
96% (505)
97% (502)
98% (506)

DISCUSSION
This study was designed to assess the effects of a paid media and safety belt
enforcement campaign in selected regions of Michigan. The study utilized an experimental
region, where the full impact of the campaign was scheduled, and a matched c:ontrol
region, where no specific campaign impact was intended. Three waves of a direct
observation survey of safety belt use were conducted in each of the regions concurrently.
The first wave (Pre) occurred prior to any campaign activities, the second (Post 1) oclcurred
immediately following the campaign activities, and the third (Post 2) occurred about 6
weeks after completion of program activities. In addition, a telephone survey regarding
awareness of various program activities and other safety-belt-related issues, was
conducted in each region during each of the three direct observation survey wave periods.
The direct observation survey results showed that safety belt use did not
significantly increase in either region between the Pre and Post 1 survey waves. Thus
there was no immediate effect of the medialenforcement campaign on safety belt use. For
the experimental region, however, safety belt use during the Post 2 survey wave increased
significantly from the Post 1 survey, indicating possible long-term effects of the program.
In the control region, safety belt use increased between the Pre and Post 1 survey waves,
but not significantly. When the two regions were compared by survey wave, we found the
control region had significantly higher safety belt use than the experimental region
immediately after the program (Post I ) , while no significant differences were found for the
other waves. Based upon these results, it appears that the medialenforcement program
did not have a differential effect in the experimental region.
One reason for this lack of effect may have been that the medidenforcement
campaign had more far-reaching effects than intended in the control region of Michigan.
Even though no specific program activities were scheduled to appear in the counties
comprising the control region, the telephone survey revealed that people in the control
region were exposed to an increase in messages after the Pre survey wave. Respondents
in this region also reported a greater perceived threat of safety belt enforcement, similar
to people in the experimental region. Very likely, people in the control region read or
watched news stories from the Detroit or Southeastern Michigan areas that discussed the

campaign or increased safety belt enforcement in general. In this respect, we coinclude
that the program had ur~expected effects in that local media and enforcement efforts
trickled out to areas far removed from the areas for which media was purchased.
Because the control region was exposed to increased safety belt media and
enforcement at the same time as the experimental region, the experimental/control study-
design we utilized for comparing changes in observed safety belt use was compromised.
Without the ability to compare safety belt use in the experimental region to safety belt use
in a region without any program activities, we have no way of determining the differential
effects of the program on the background of other statewide factors that influence safety
belt use.
REFERENCES
Campbell, B.J. (1 987). The Relationship of Seat Belt Law Enforcement to Level of Belt Use. Chapel Hill, NC: University of North Carolina Highway Safety Research Center.
National Highway Traffic Safety Administration (1 998). Uniform Criteria for State Obsen/ational Surveys of Seat Belt Use. (Docket No. NHTSA-98-4280). Washington, DC: US Department of Transportation.
National Highway Traffic Safety Administration. (2000), Traffic Safety Facts 2000: Occupant Protection. [Electronic Version]. (Report No. DOT HS 809 327). Washington, DC: US Department of Transportation.
National Highway Traffic Safety Administration. (2002). Occupant Protection: Region 5. Retrieved October 1 1, 2002 from http:llwww.nhtsa.dot.govlnhtsalwhatis/regions/ Region05/05op. html.
Schulman, Ronca and Bucuvalas, Inc. (2002). 2002 NHTSA Seat Belt Tracking Telephone Surveys: Methodology.
US Department of Transportation. (2002). Seat Belt Use by Drivers, Passengers Reaches 75 percent, NHTSA Reports. Retrieved October 11, 200i! from http:llwww.dot.gov/ affairslnhtsa5802. htm.

APPENDIX A Data Collection Forms
SITE # PAGE # 1 2 3
ATTENTION CODING: DUPLICATE COL 1 - 3 FOR ALL VEHICLES: Section 157 Evaluation
VEHICLE TYPE
VEHICLE TYPE

SECTION 157 EVALUATION SlTE DESCRIPTION 2002
SITE # SITE LOCATION - 1 2 3
SlTE TYPE
1 Intersection
2 0 Freeway
Exit No.
DATE (monthlday): I 12002 6 7 8 9
OBSERVER DAY OF WEEK
1 steve 1 Monday
2 0 Brenda 2 0 Tuesday
3 0 Helen 3 0 Wednesday
4 0 Krishnan 4 0 Thursday
5 0 Jonathon 5 0 Friday
TRAFFIC CONTROL
1 Traffic Light
2 0 stop sign
3 0 None
4 0 Other 5
6 0 Dave 6 0 Saturday
7 0 Sunday 10
11
START TIME: : (24 hour clock) END TIME: : (24 hr clock) 13 14 15 16 17 181920
INTERRUPTION (total number of minutes during observation period): - - 21 22
MEDIAN: 10 yes 2 0 No
23
TRAFFIC COUNT 1: - - 24 25 26
TRAFFIC COUNT 2: - - - - 27 28 29
COMMENTS:
WEATHER
1 q ~ o s t ~ y Sunny
2 0 Mostly Cloudy
3 0 Rain
4 0 Snow 12
North

APPENDIX 6
Site Listing

EXPERIMENTAL REGION
Site Number 001 002 003 004 005 006 007 008 009 010 01 1 012 01 3 01 4 01 5 01 6 01 7 01 8 01 9 020 02 1 022 023 024 025 026 027 028 029 030 03 1 032 033 034 035 036 037 038 039 040 04 1 042 043 044
Site Location EB 15 Mile RoadJTruman and Fruit Ridge Ave. SEB Butternut and Quincy St. WB Ellis Rd. and Ravenna Rd. NB Carr Rd. and Sternberg Rd. WB Hackley Ave, and Getty St. NB Tisdel Ave. and Dickerson Lake122 Mile Rd. SB 48th Ave. and M-21lChicago Rd. WB New Holland St. and US-31 SB Weber Rd, and River Rd. EB WilkeslOld Channel and Lamos SB Murray Lake and 2 Mile Rd. EB Main St./Byron Rd, and Fairview Ave. NB Sikkenga Rd. and Fruitvale Rd. SB 88th Ave. and Taft St. SB Blue Lake Rd, and Holton-Whitehall Rd. WB Bauer Rd. and 2oth Ave. WB Warner St. and 6oth Ave. NB Division Ave. and 10 Mile Rd. SB Wabasis Ave, and Belding Rd./M-44 SWB W.River Dr. and Pine Island Dr. SB Maynard Ave, and O'BrienWealthy St. NB Harvard Ave. and 18 Mile Rd. WB White Rd. and Canada Rd. WB Crocker Rd./96th St. and Holton-Duck Lake Rd. EB Vergennes St. and Flat River Dr./Sayles Rd. EB Wilson Rd, and 11 2'h Ave. WB State Rd. and Fruitport Rd. SB 128'~ Ave. and M-45lLake Michigan Dr. WB Riley St. and bake Shore Ave. EB Bailey Rd. and Newago Rd. NB Paine Rd. and 17 Mile Rd./M-46 EB 5 Mile Rd. and Lincoln Lake Ave. EB Lincoln Ave. and US-31 EB Johnson St. and 24th Ave. SB Keller and 18 Mile Rd. SWB M-120 and Getty St. WB 20 MileWhite Rd. and Kenowa Rd. SB 1 1 2th Ave.lMain St. and Leonard St. W B Johnson and 1 44th Ave. NB Blakely Dr. and Kies St. EB Hancock Rd. and Cook St. NB 48th Ave. and Fillmore St. EB Becker St. and Pine Lake Ave. WB Lake Michigan Dr./M-45 and US-31
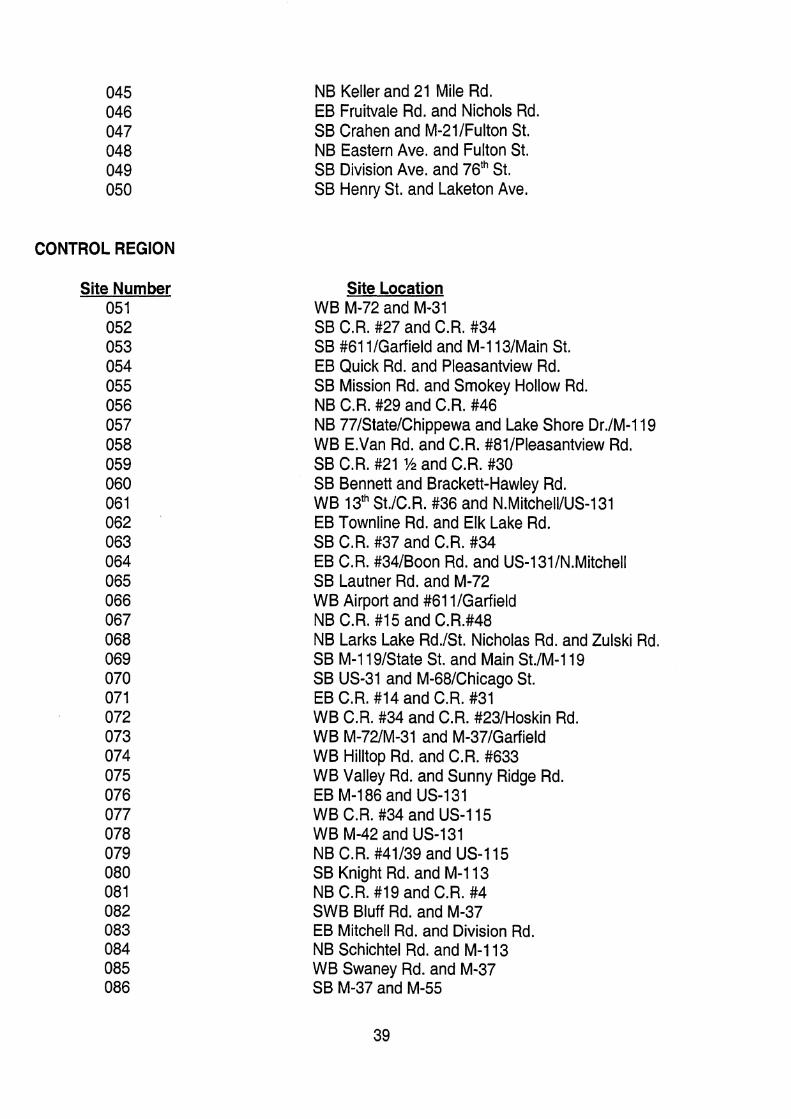
CONTROL REGION
Site Number 05 1 052 053 054 055 056 057 058 059 060 06 1 062 063 064 065 066 067 068 069 070 07 1 072 073 074 075 076 077 078 079 080 08 1 082 083 084 085 086
NB Keller and 21 Mile Rd. EB Fruitvale Rd. and Nichols Rd. SB Crahen and M-21IFulton St, NB Eastern Ave. and Fulton St. SB Division Ave. and 76th St. SB Henry St. and Laketon Ave.
Site Location WB M-72 and M-31 SB C.R. #27 and C.R. #34 SB #611/Garfield and M-113lMain St. EB Quick Rd. and Pleasantview Rd. SB Mission Rd. and Smokey Hollow Rd. NB C.R. #29 and C.R. #46 NB 77lStatelChippewa and Lake Shore Dr,lM-1 'I 9 WB E.Van Rd. and C.R. #81/Pleasantview Rd. SB C.R. #21 Y i and C.R. #30 SB Bennett and Brackett-Hawley Rd. WB 1 3th St,/C.R. #36 and N.MitchelllUS-131 EB Townline Rd. and Elk Lake Rd. SB C.R. #37 and C.R. #34 EB C,R. #34/Boon Rd, and US-131lN.Mitchell SB Lautner Rd, and M-72 WB Airport and #611/Garfield NB C.R. #15 and C.R.#48 NB Larks Lake Rd./St. Nicholas Rd, and Zulski Rd. SB M-119IState St, and Main St./M-119 SB US-31 and M-68lChicago St. EB C.R. #14 and C.R. #31 WB C.R, #34 and C.R. #231Hoskin Rd. W B M-72lM-31 and M-37lGarfield WB Hilltop Rd. and C.R. #633 WB Valley Rd. and Sunny Ridge Rd. EB M-186 and US-1 31 WB C.R. #34 and US-1 15 WB M-42 and US-131 NB C.R. #41/39 and US-1 15 SB Knight Rd, and M-113 NB C.R. #I9 and C.R. #4 SWB Bluff Rd. and M-37 EB Mitchell Rd. and Division Rd. NB Schichtel Rd. and M-113 WB Swaney Rd. and M-37 SB M-37 and M-55

NB Valley Rd. and Levering Rd.1C.R. #66 SB Munro Rd. and Angell Rd. NB Lightfoot Rd. and Middle Rd. WB Voice Rd, and Clark Rd. SB Mackinaw Hwy. and US-31 SB Orchard Rd. and E,Van Rd. NB 5 Mile Rd. and Holiday Rd. WB Cassidy Rd. and Pleasantview Rd. SB Eppler Rd. and Intertown Rd. EB C.R. #46 and C.R. #25 SB C.R. #13 and M-55 WB C.R. #14 and M-37 NB Resort Pike Rd. and US-31 SB C.R. #27 and M-55

APPENDIX C
Telephone Survey
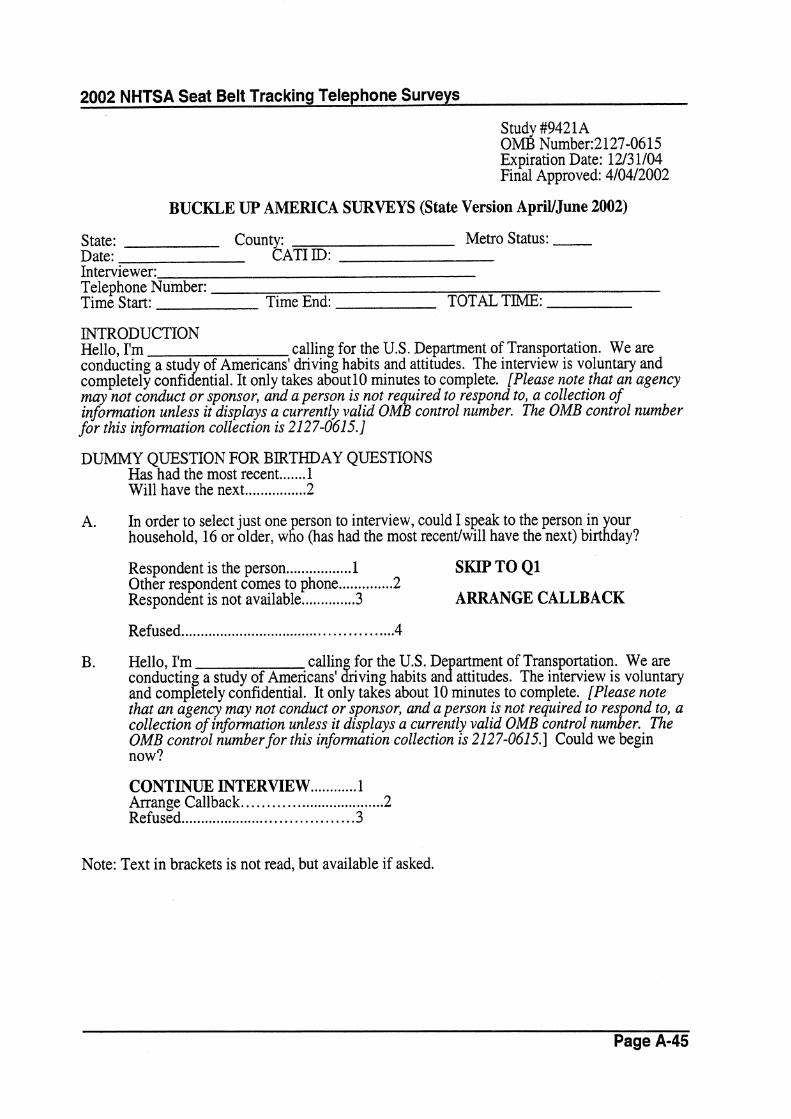
2002 NHTSA Seat Belt Tracking Telephone Surveys -- Study #942 1 A OMB Number:2 127-0ti 15 Expiration Date: 1213 1104 Final Approved: 4/04/2002
BUCKLE UP AMERICA SURVEYS (State Version ApriVJune 2002)
State: County: Metro Status: Date: CAT1 ID: Interviewer: Telephone Number: - Time Start: Time End: TOTAL TIME:
INTRODUCTION Hello, I'm calling for the U.S. Department of Transportation, We are conducting a study of Americans' driving habits and attitudes. The interview is voluntary imd completely confidential. It only takes about10 minutes to complete. [Please note that an argency may not conduct or sponsor, and a person is not required to respond to, a collection of information unless it displays a currently valid OMB control number. The OMB control number for this infomation collection is 2127-0615.1
DUMMY QUESTION FOR BIRTHDAY QUESTIONS Has had the most recent ....... 1 Will have the next ................ 2
A. In order to select just one person to interview, could I speak to the person in our i: household, 16 or older, who (has had the most recentlwill have the next) birt day?
Respondent is the person ................ 1 SKIP TO Q1 Other respondent comes to phone .............. 2 Respondent is not available .............. 3 ARRANGE CALLBACK
................................................. Refused 4
B. Hello, I'm callin for the U.S. De artment of Transportation. We are
f B conductin a study of Americans' &wing habits an attitudes. The interview is voluntary and comp etely confidential. It only takes about 10 minutes to complete. [Please note that an agency may not conduct or sponsor, and a person is not required to res ond to, a collection of information unless it displays a currently valid OMB control nunz 1 er. The OMB control number for this infomation collection is 2127-0615.1 Could we beg:in now?
CONTINUE INTERVIEW ............ 1 Arrange Callback. ................................ .2 Refused ...................................... .3
Note: Text in brackets is not read, but available if asked.
Page A-45
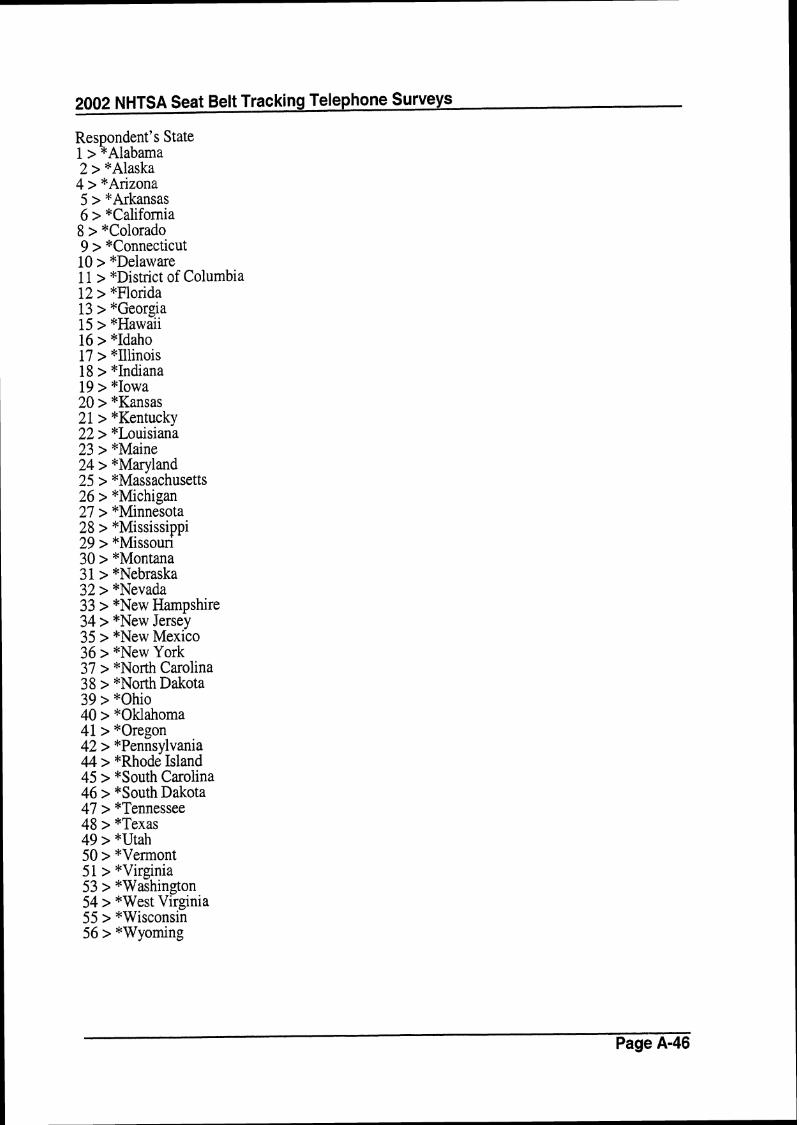
2002 NHTSA Seat Belt Tracking Telephone Surveys - Respondent's State 1 > *Alabama 2 > *Alaska 4 > *Arizona 5 > *Arkansas 6 > "California 8 > *Colorado 9 > "Connecticut 10 > *Delaware 11 > "District of Columbia 12 > *Florida 13 > *Georgia 15 > *Hawaii 16 > *Idaho 17 > *Illinois 18 > *Indiana 19 > *Iowa 20 > *Kansas 21 > *Kentucky 22 > *Louisiana 23 > *Maine 24 > *Maryland 25 > *Massachusetts 26 > "Michigan 27 > *Minnesota 28 > "Mississippi 29 > *Missom 30 > *Montana 31 > "Nebraska '32 > *Nevada 33 > *New Hampshire 34 > *New Jersey 35 > *New Mexico 36 > *New York 37 > *North Carolina 38 > *North Dakota 39 > *Ohio 40 > *Oklahoma 41 > *Oregon 42 > "Pennsylvania 44 > *Rhode Island 45 > *South Carolina 46 > *South Dakota 47 > *Tennessee 48 > *Texas 49 > *IJtah 50 > *Vermont 51 > *Virginia 53 > *Washington 54 > *West Virginia 55 > *Wisconsin 56 > *Wyoming
- Page A-46

2002 NHTSA Seat Belt Tracking Telephone Surveys . Q.1 How often do you drive a motor vehicle? Almost every day. a few days
a week. a few days a month. a few days a year. or do you never drive?
Almost every day ................. 1 .......................... Few days a week 2
Few days a month ................ 3 Few days a year .......................... 4 Never ................................. 5 SKIP TO Q9 Other (SPECIFY) ........................ 6
(VOL) Don't know ........... 7 (VOL) Refused ......................... 8
Q.2 Is the vehicle you dnve most often a car. van. motorcycle. sport utility vehicle. pick:u truck. or other type of truck? (NOTE: IF RESPONDENT DRNES MORE THAN 0h VEHICm OFTEN. ASK:) "What kind of vehicle did you LAST drive?"
Car ................................. 1 ............. ...... Van or minivan .. 2
Motorcycle ..................... -3 SKIP TO 0 9 . Pickup truck ........................... 4 Sport utility Vehicle ......... 5 Other ...................................... 10 Other truck (SPECIFY) .... 11
(VOL) Don't know ................. 12 (VOL) Refused ............... 13
Q.3 For the next series of questions. please answer only for the (car1trucWvan) you said you usually drive . Do the seat belts in the front seat of the (car1trucMvan) go across your shoulder only. across your lap only. or across both your shoulder and lap?
INTERVIEWER INSTRUCTION: SEATBELT QUESTIONS REFER TO DRIVER SIDE BELTS .
...................... Across shoulder 1 ................................... Across lap 2 Q 5 SKIP TO
Across both ........................... 3 ..................... Vehicle has no belts 4 Q 9 SKIP TO ............... (VOL) Don't know 5 SKIP TO Q9
........................... (VOL) Refused 6 Q 9 SKIP TO
. Page A-47
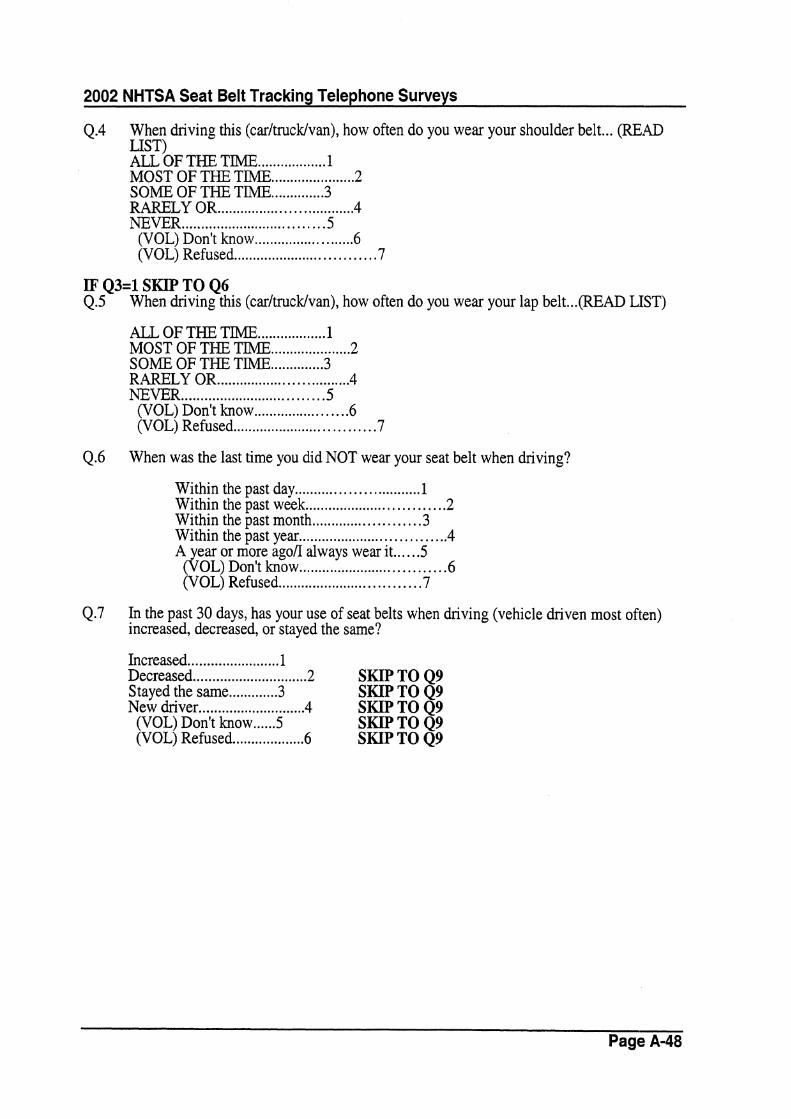
2002 NHTSA Seat Belt Tracking Telephone Surveys
4.4 When driving this (car/trucMvan). how often do you wear your shoulder belt ... (READ LIST)
.................. ALL OF THE TIME 1 .................... MOST OF T I E TIME 2
SOME OF TI% T&IE .............. 3 RARELY OR ................................... 4
.......... ....................... NEVER .. 5 (VOL) Don't know ......................... 6 (VOL) Refused ................................ 7
IF Q3=1 SKIP TO Q6 Q.5 When driving this (car/truck/van). how often do you wear your lap belt ... (READ LIST)
ALL OF THE TIME .................. 1 MOST OF THE TIME ..................... 2 SOME OF THE TIME! .............. 3 RARELY OF: ................................ 4 NEVER ................................... 5
(VOL) Don't know ....................... 6 (VOL) Refused .................................. 7
Q.6 When was the last time you did NOT wear your seat belt when driving?
.............................. Within the past day 1 ................................. Within the past week 2
Within the past month ......................... 3 Within the past year ................................... 4 A year or more agoA always wear it ...... 5
(VOL) Don't know ................................... 6 (V0:L) Refused ................................ 7
Q.7 In the past 30 days. has your use of seat belts when driving (vehicle driven most oft. en) increased. decreased. or stayed the same?
Increased ..................... 1 Decreased .............................. 2 SKIP TO Q9 Stayed the same ............. 3 SKIP TO 09 ~ e k driver ............ ... ...... 4 SKIP TO Q9
(VOL) Don't know ...... 5 SKIP TO Q9 (VOL) Refused ............... 6 SKIP TO Q9
Page A-48

2002 NHTSA Seat Belt Tracking Telephone Surveys . Q.8 What caused our use of seat belts to increase?
(DO NOT &AD LIST . MULTIPLE RECORD)
........ Increased awareness of safety 1 ......................................... Seat belt law 2
Don't want to get a ticket .............. 3 ...................................... Was in a crash 4
New car with automatic belt .......... 5 ................ Influencelpressure from others 6
...................... More long distance driving 7 ........ Remember morelmore in the habit 8
.......................... The weather 9 ........................... The hoIidays 10 ....................... Drivin faster 11
other SPECIFY--). ................ 27 ................ (VOL) Don't know ............... 28
.......................... (VOL) Refused -29
Q.9 Does (RESP'S STATE) have a law requiring seat belt use by adults?
Yes ............................ .. ... 1 No ......................................... 2 Q 1 2 SKIP TO
(VOL) Don't know ............ 3 Q 1 2 SKIP TO (VOL) Refused ....................... 4 Q 1 2 SKIP TO
IF Q1=5 AND Q9=1. SKIP TO Q11 If Q2 = 3 AND Q9 = 1. SKIP TO Q11
Q . 10 Assume that you do not use your seat belt AT ALL while driving over the next six months . How likely do you think you will be to receive a ticket for not wearing a seat belt? READ
........................ Very likely 1 ............... Somewhat likely ..... 2
........... Somewhat unlikely 3 ............................... Very unlikely 4
......... (VOL) Don't know 5 (VOL) Refused ........................ 6
Q . 11 According to your state law. can police stop a vehicle if they observe a seat belt violation or do they have to observe some other offense first in order to stop the vehicle?
Can stop just for seat belt violation .......... 1 Must observe another offense first ................ 2
.............................. (VOL) Don't know 3 (VOL) Refused ......................................... 4
Q.12 In your opinion. SHOULD olice be allowed to stop a vehicle if they observe a seal belt P violation when no other tra fic laws are being broken?
...... Should be allowed to stop 1 Should not .............................. 2
(VOL) Don't know ............. 3 (VOL) Refused ....................... 4
Page A-49

2002 NHTSA Seat Belt Tracking Telephone Surveys
Ohio Only, all else skip to q13 Q. 12b Have you ever received a ticket for not wearing seat belts?
.................................... Yes 1 .............................................. No 2 SKIP TO Q13
(VOL) Don? know .............. 3 SKIP TO Q13 ........................... (VOL) Refused ..4 SKIP TO Q13
Q . 1 2 ~ How long ago did you receive a ticket for not wearing seat belts? (IF MORE THAN ONCE, ASK FOR LAST TIME]
- WEEKS AGO - MONTHS AGrO, OR - YEARS AGO
4.13 Please tell me whether you strongly agree, somewhat agree, somewhat disagree or strongly disagree with the following statements? ROTATE
a) Seat belts are just as likely to h a m you as help you.
b) If I was in an accident, I would want to have my seat belt on.
c) Police in my community generally will not bother to write tickets for seat belt violations.
d) It is important for police to enforce the seat belt laws.
e) Putting on a seat belt makes me worry more about being in an accident.
f) Police in my community are writing more seat belt tickets now than they were a few months ago.
Q. 14 Yes or No--in the past 30 days, have you seen or heard of any special effort by police to ticket drivers in your community for seat belt violations?
........................ Yes 1 No ............................ -2 SKIP TO CONDITIONAL BEFORE Q17 (Vol) Don't know ... 3 SKIP TO CONDITIONAL BEFORE Q17
.............. (Vol) Refused 4 SKIP TO CONDITIONAL BEFORE Q17
Q.15 Where did ou see or hear about that s ecial effort? [DO NOT AD--MULTIPLE RE&ONSE]
.................................. Radio .2 ................ Friend/Relative. .3 SKIP TO CONDITIONAL BEFORE Q17
Newspa er.. ............ ..4 P SKIP TO CONDITIONAL BEFORE Q17 Persona observation/on the road.. . .5 SKIP TO CONDITIONAL BEFOR&017
.............. Billboard/signs.. .7 SKIP TO CONDITIONAL BEFORE ~ 1 7 I'm a police officerfjudge.. .... ..9 SKIP TO CONDITIONAL BEFORE Q17 Other (specify ) ......... 17 SKIP TO CONDITIONAL BEFORE Q17 Don't know ....................... 18 SKIP TO CONDITIONAL BEFORE Q17 Refused ................................. 1 9 SKIP TO CONDITIONAL BEFORE Q17

2002 NHTSA Seat Belt Tracking Telephone Surveys
Q.16 Was the (TVlradio) message a commercial (or advertisement). was it part of a news program. or was it something else? MULTIPLE RECORD
Commercial/Advertisement/ ................. Public Service Announcement 1
.................................. News story/news program 2 .......... Something else (specify): 3
...................................................... Don't know 4 Refused .................................................... 5
IF STATE EQ MICHIGAN SKIP TO ALTERNATIVE M.17 IF STATE EQ INDIANA SKIP TO ALTERNATIVE 1.17 IF STATE EQ OHIO ASK: Q17 ALL OTHER STATES SKIP TO Q24 Q . 17 Yes or no- in the past 30 days. have you seen or heard anything about the police setting
up seat belt checkpoints where they will stop motor vehicles to check whether drivem and passengers are wearing seat belts?
Yes ......................... 1 No .................................... -2 SKIP TO Q24
...... (Vol.) Don't know 3 SKIP TO Q24 ................... (Vol.) Refused 4 SKIP TO Q24
By checkpoint. we mean a systematic effort by police to stop vehicles for the purpose of checking for compliance with existing seat belt laws .
Q.18 Let me just confirm. is this the type of checkpoint that you have seen or heard about in the past 30 days?
.......................... Yes 1 No ................... .. .. ... .. 2 SKIP TO Q24 (Vol.1 Don't know ...... 3 SKIP TO 024
................. ( ~ o 1 . j Refused 4 SKIP TO Q24
Q . 19 Where did ou see or hear about the olice checkpoints for seat belts? [DO NOT AD--MULTIPLE ~ S P O N S E ]
............................. .. TV .. - 1 ....................................... Radio -2
.................... Friend/Relative 3 .................... Newspaper 4 .... Personal observatiodon the road 5
................. Billboard/signs 7 ........ I'm a police officerljudge 9
......... Other (specify ) 17 ....................... Don't know 18
................................... Refused 19
SKIP TO Q21 SKIP TO Q21 SKIP TO Q21 SKIP TO Q21 SKIP TO 421 SKIP TO Q21 SKIP TO Q21 SKIP TO Q21
Q.20 Was the (radiolradio) message a commercial (or advertisement). was it art of a news program. or was it something else? MULTIPLE R E C O ~
Commercial/Advertisement/ ............ Public Service Announcement 1
News storylnews program ............................... 2 Something else (specify): ..... 3
................................................. Don't know 4 ............................................... Refused 5
Page A-51

2002 NHTSA Seat Belt Tracking Telephone Surveys - 4.21 In the past 30 days, did you personally see any checkpoints where police wen
stopping motor vehicles to see if drivers and passengers were wearing seat belts?
............................ Yes 1 .................................. No .2 SKIP TO Q24
..... (Vol.) Don't know 3 SKIP TO Q24 .............. (Vol.) Refused. .4 SKIP TO Q24
Again, by checkpoint, we mean a systematic effort by police to sto vehicles P for the purpose of checking for compliance with existing seat belt aws.
4.22 Let me just confirm, is this the type of checkpoint that you personally saw in the past 30 days?
Yes ......................... . 1 ..... No ....................... ... .2 SKIP TO Q24
(Vol.) Don't know ..... .3 SKIP TO Q24 (Vol.) Refused ............... ..4 SKIP TO 424
Q.23 Were you personally stopped by police at a seat belt checkpoint in the past 30 days?
Yes ................. .. ........ 1 ................................. No.. .2
..... (Vol.) Don't know .3 (Vol.) Refused. ............... .4
- Page A-52
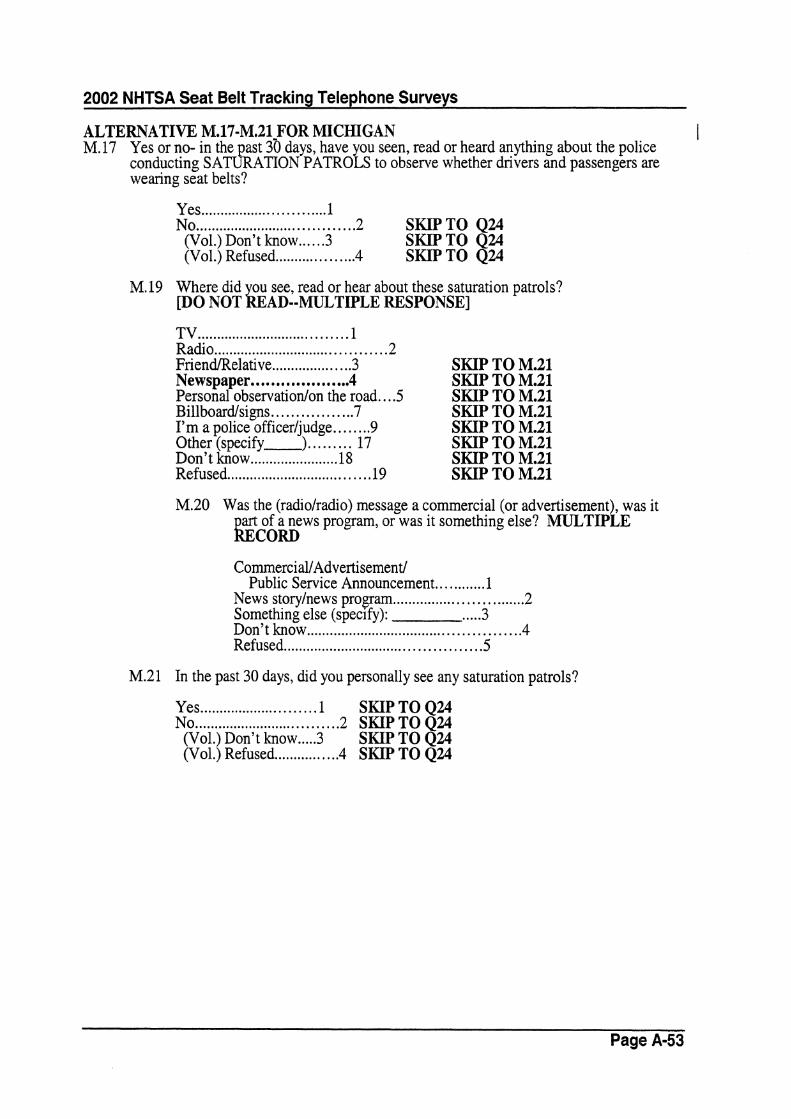
2002 NHTSA Seat Belt Tracking Telephone Surveys . ALTERNATIVE M.17-M,21 FOR MICHIGAN M . 17 Yes or no- in the ast 30 days. have you seen. read or heard anything about the police
1 conducting SAT & ATION PATROLS to observe whether drivers and passengers ;ire wearing seat belts?
Yes ............................. 1 .................................... No 2 SKIP TO 4 2 4
(Vol.) Don't know ...... 3 SKIP TO Q24 (Vol.) Refused ................... 4 SKIP TO Q24
M . 19 Where did ou see. read or hear about these saturation patrols? [DO NOT AD--MULTIPLE RESPONSE]
TV ................................ 1 Radi 0 .......................................... 2 FriendRelative .................... 3 .................... Newspaper 4 Personal observation/on the road .... 5 Billboard/signs ................. 7 I'm a police officerljudge ...... 9 Other (specify ) ......... 17 Don't know ....................... 18 Refused ................................... -19
SKIP TO M.21 SKIP TO M.21 SKIP TO M.21 SKIP TO M.21 SKIP TO M.21 SKIP TO M.21 SKIP TO M.21 SKIP TO M.21
M.20 Was the (radiolradio) message a commercial (or advertisement). was it art of a news program. or was it something else? MULTIPLE
hc0R.D CommerciallAdvertisementl
Public Service Announcement ............ 1 ............................... News storylnews program 2
Something else (specify): ..... 3 ................................................ Don't know 4
............................................... Refused 5
M.21 In the past 30 days. did you personally see any saturation patrols?
Yes ............................ 1 SKIP TO Q24 No ................... ... ..... 2 SKIPTO Q24
(Vol.) Don't know ..... 3 SKIP TO Q24 (Vol.) Refused ................ 4 SKIP TO Q24

2002 NHTSA Seat Belt Tracking Telephone Surveys . ALTERNATIVE 1.17-I.21-FOR INDIANA 1.17 Yes or no- in the as!: 30 days. have you seen. read or heard anything about the o1ic:e
I P P setting up seat be t ENFORCEMENT ZONES in your community? By seat be t
enforcement zones. we mean a special area where police officers observe whether drivers or passengers are we'zring seat belt .
.............................. Yes 1 .................................... No 2 SKIP TO Q24
(Vol.) Don't know ...... 3 SKIP TO Q24 (Vol.) Refused ................... 4 SKIP TO Q24
1.19 Where did ou see. read or hear about the seat belt enforcement zones? [DO NOT LAD.. MULTIPLE RESPONSE]
..................................... TV 1 .......................................... Radio 2
FriendlRelative .................... 3 Newspaper .................... 4
.... Personal observation/on the road 5 Billboard/sig~~s ................. 7
........ I'm a police officerljudge 9 ......... Other (specify ) 17
....................... Don't know 18 .................................... Refused 19
SKIP TO 1.21 SKIP TO 1.21 SKIP TO 1.21 SKIP TO 1.21 SKIP TO 1.21 SKIP TO 1.21 SKIP TO 1.21 SKIP TO 1.21
1.20 Was the (radiolradio) message a commercial (or advertisement). was it art of a news program. or was it something else? MULTIPLE R E C O ~
CommerciallAdvertisement/ ............ Public Service Announcement 1
............................... News stoflnews program 2 ..... Something else (specify): 3
Don't know ................................................... 4 Refused ............................................... 5
1.21 In the past 30 days. did you personally see any enforcement zones where police Were observing whether drivers and passengers were wearing seat belts?
............................ Yes 1 No ................. .. ........... 2 SKIPTO 424
..... (Vol.) Don't know 3 SKIP TO Q24 ................ (Vol.) Refused 4 SKIP TO Q24
Page A-54
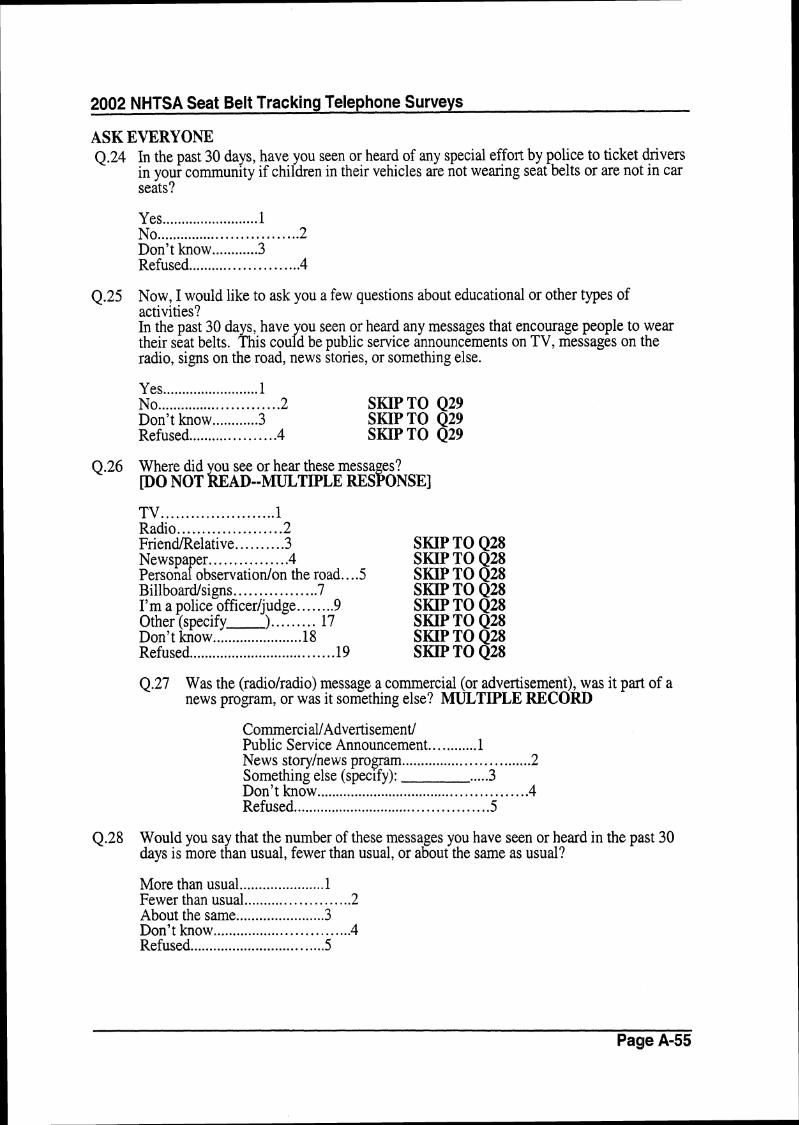
2002 NHTSA Seat Belt Tracking Telephone Surveys
ASK EVERYOh3 Q.24 In the past 30 days. have you seen or heard of any special effort by police to ticket drivers
in your community ~f children in their vehicles are not wearing seat belts or are not in car seats?
....................... Yes : 1 No .............................. 2
............ Don't know 3 Refused ............ ... ....... 4
Q.25 Now. I would like to ask you a few questions about educational or other types of activities? In the past 30 days. have ou seen or heard any messages that encourage people to .wear their seat belts . This cou Y d be public service announcements on TV. messages on the radio. signs on the road. news stories. or something else .
......................... Yes 1 ............................ No 2
............ Don't know 3 ................... Refused 4
SKIPTO Q29 SKIP TO Q29 SKIP TO Q29
4.26 Where did ou see or hear these messa es? [DO NOT AD--MULTIPLE RESFONSEI
....................... TV 1 ..................... Radio 2
Friendmelative .......... 3 SKIP TO Q28 ................ Newspa er 4 P SKIP TO Q28
.... Persona observation/on the road 5 SKIP TO Q28 ................. Billboard/signs 7 SKIP TO Q28
........ I'm a police officerljudge 9 SKIP TO 428 ......... Other(specify ) 17 SKIP TO Q28
Don't know ....................... 18 S U P TO Q28 Refused ................................... 19 SKIP TO 4 2 8
Q.27 Was the (radiolradio) message a commercial (or advertisement). was it part of a news program. or was it something else? MULTIPLE RECORD
Commercial/Advertisement/ Public Service Announcement ............ 1 News storylnews program ............................... 2 Something else (specify): ..... 3 Don't know ................................................... 4 Refused ............ .. .............................. 5
4.28 Would you sa that the number of these messages you have seen or heard in the past 30 days is more t i: an usual. fewer than usual. or about the same as usual?
...................... More than usual 1 ........................ Fewer than usual 2
................... .. About the same ., 3 ................................ Don't know 4
Refused .................................. 5
Page A-55

2002 NHTSA Seat Belt Tracking Telephone Surveys . 4.29 Are there any advertisements or activities that you have seen or heard in the past 30 days
that encouraged adults to make sure that children use car seats or seat belts '?
Yes ...................... 1 .......................... No ..2 SKIP TO Q31
Don't know ............ 3 SKIP TO Q31 ....................... Refused 4 SKIP TO Q31
Q.30 What did you see or hear?
4.3 1 Thinkin about everything you have heard. how important do you think it is for i [respon ent's STATIE] to enforce seat belt laws for ADULTS more strictly . . . . very important. fairly important. just somewhat important. or not that important?
.......................... Very important 1 ............................ Fairly important 2
............ Just somewhat important 3 ......................... Not that important 4
............................... Don't know 5 Refused ........................................ 6

2002 NHTSA Seat Belt Tracking Telephone Surveys - Q.32 Do ou recall hearin or seeing the following slogans in the past 30 days? READ LIST AN^ MULTIPLE :&CORD
ROTATE PUNCHES 1-9 Friends don't let friends drive drunk .............. 1
................................................... Click it or ticket 2 Buckle U America ..................................... -3
............................................... Children k Back.. .4 You drink, you drive, you lose ...................... 5 Didn't see it coming? No one ever does ................. .6 Get the keys.. ............................................. 7 Please Buckle Up (Ohio). .................................. 8 What's Ho1d:ing You Back (Ohio). .............. 9 Operation Pullover (Indiana) Buckle Up Always Why Risk It (Nevada) No, Exceptions, No Excuses, Buckle Up Now (Nevada) Click It Or Ticket: (State Name) Buckle Up (State Name) Buckling Up Makes Good Sense for Kids (Colorado) Buckle Up It's the Law and It's Enforced (Connecticut) Show a Little Restraint (Iowa ) Kansas Clicks (Kansas) Buckle Up or Pay the Price (Minnesota) Click It don? Risk I:t (Missouri) Click It don? Risk It (Nebraska) Life Is Good. The Way to Go (Oregon). Fasten for Life (South Carolina) Buckle Up or Busted (Utah) Click It Why Risk 11; (Wisconsin) No Excuses, Buckle: Up (Wyoming)
............. .............................. None of these .... Don't h o w ................ .. ........... .88
................................................ Refused.. .99
Page A-57

2002 NHTSA Seat Belt Tracking Telephone Surveys
FOR OHIO ONLY, ALL ELSE SKIP TO Q33. Q.32b Is there any particular t e of i,nformation you would find helpful on how to protect a 'Ip child in a motor vehicle.
....................... Yes.. 1 No ....................... .. .. ..2 SKIP TO Q32d
......... Don't know.. 3 SKIP TO Q32d Refused ................ .. ..... 4 SKIP TO Q32d
Q.32~ What information would you find helpful?
Q.32d If you wanted to receive inforniation on how to protect children in a motor vehicle,, where would you like to be able to et that information? [DO NOT READ, MULTI~L~E RESPONSE]
................................... WEB site.. -1 . . . ...................................... Ped~atnc~an.. .2 .......... Doctor (Unspecified) ..... 3
Nurse.. ................. .. ..................a.9.. -4 Clinic ......................................... .5 - -- -- -
................................................... TV. .6 Radio ................... .. ............. ., ... -7
......................................... Magazines.. .8 ....................... Grocery Store.. .9
..... Other (specify): - 10 ........ ............................. Don't h o w .... 98
Refused ..................................... ..99
4.33 Now, I need to ask you some biisic information about you and your household. What is your age?
AGE REFUSEIl=99
4.34 Includin yourself, how many persons, age 16 or older, are living in your householcl at least ha1 f of the time or consider it their primary residence?
4.35 How many children age 15 or younger are living in your household at least half of the time or consider it their primary residence?
4.36 Do you consider yourself to be lHispanic or Latino?
.............................. Yes 1 No ............................... .2
(VOL) Not sure .......... 3 (VOL) Refused ............ -4
Page A-58
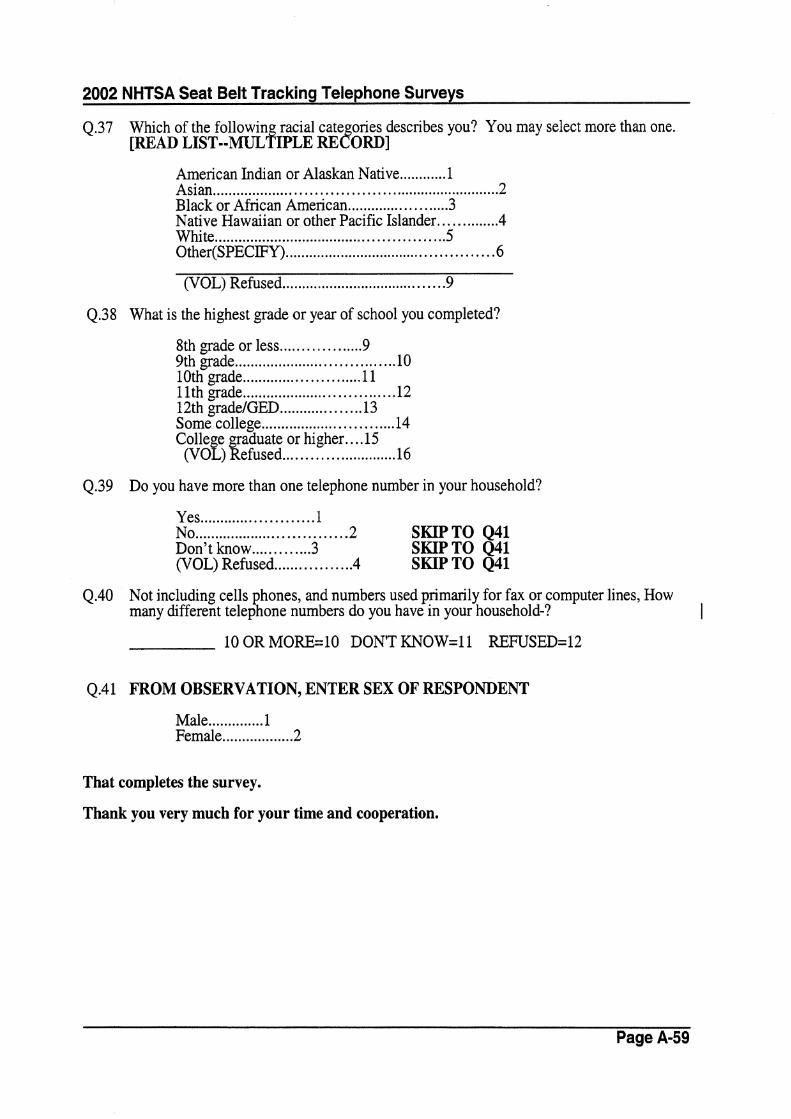
2002 NHTSA Seat Belt Tracking Telephone Surveys
Q.3'7 Which of the followin racial cate ories describes you? You may select more than one . [READ LIST- MUL~IPLE R E ~ O R D ]
American Indian or Alaskan Native ............ 1 Asian .................................................................. 2 Black or African American ................... 3 Native Hawaiian or other Pacific Islander .............. 4 White ..................................................... 5 Other(SPECIFY) ..................... .... ........................ 6
(VOL) Refused ........................................ 9
4.38 What is the highest grade or year of school you completed?
8th grade or less ................... 9 ..................................... 9th grade 10 . ........................... 10th grade 11 .............. ............. 11th grade ... 12
12th grade/GED ................... 13 Some college ............................. 14
... College graduate or higher -15 .......................... (VOL) Refused 16
4.39 Do you have more than one telephone number in your household?
Yes ....................... 11 No ......................... ... .. 2 SKIP TO 441 Don't know ............. 3 SKIPTO Q41 (VOL) Refused ................. 4 SKIP TO 441
Q.40 Not including cells phones. and numbers used primarily for fax or computer lines. How many different telephone numbers do you have in your household-? I
10 OR MORE-10 DON'T KNOW=11 REFUSED=12
Q.41 FROM OBSERVATION. EIVTER SEX OF RESPONDENT
Male .............. 1 .................. Female 2
That completes the survey.
Thank you very much for your time and cooperation .
Page A-59