Effects of alcohol on plasma lipoproteins and cholesterol ... · Effects of alcohol on plasma...
11
Effects of alcohol on plasma lipoproteins and cholesterol and triglyceride metabolism in man John R. Crouse’ and Scott M. Grundy2 Veterans Administration Medical Center and University of California, San Diego, CA 92161 Abstract To define the effects of moderate alcohol intake on cholesterol and triglyceride metabolism in man, twelve patients were hospitalized on a metabolic ward and were fed defined diets for 10 weeks. Each patient underwent testing of plasma lipid and lipoprotein levels, of cholesterol metabolism (absorp tion, fecal excretion, bile saturation), and of triglyceride me- tabolism [turnover of triglycerides in chylomicrons and very low density lipoproteins (VLDL)]. This testing was done twice, first during a 4-week control period and then during a 4-week period in which 630 calories of alcohol were either added to or sub- stituted for baseline calories. This increased the average baseline caloric intake by only 24% (range 20% to 30% depending on the initial caloric intake). Addition of alcohol to the baseline diet did not cause weight gain in lean individuals. Obese indi- viduals’ responses were more variable, and 3/6 definitely gained weight when the diet was supplemented with alcohol. In addition, obese subjects appeared to be more susceptible to the hyper- lipidemic effects of alcohol; whereas 4/6 obese patients devel- oped increased total triglyceride and VLDL-triglyceride con- centrations when alcohol was administered, concentrations in- creased with alcohol administration in only 1/6 lean individuals. High density lipoprotein (HDL) cholesterol increased in all vol- unteers. Low density lipoprotein (LDL) levels did not change. Metabolic studies showed increased transport of VLDL-triglyc- erides in overweight patients but not in normal weight individ- uals; increased transport of VLDL-triglycerides in the former was associated with delayed clearance of chylomicron triglyc- erides. Alcohol consumption did not affect lipoprotein lipase or hepatic triglyceride lipase in six patients in whom these enzyme activities were measured. In the amounts of alcohol taken in this study, no changes were observed in absorption, synthesis, or excretion of bile acids, or percent saturation of gallbladder bile with cholesterol.-Crouse, J. R., and S. M. Grundy. Effects of alcohol on plasma lipoproteinsand cholesterol and triglyceride metabolism in man. J. Lipid Res. 25: 486-496. Supplementary key words lipids chylomicron clearance bile salts obesity changes are exaggerated in those consuming large amounts of alcohol (4-7) compared to “social drinkers” (1-3, 8-10). Recently, epidemiologic studies have also correlated alcohol consumption with increased plasma high density lipoproteins (HDL) (10-1 2). However, rel- atively little is known about effects of ethanol on metab- olism of cholesterol,triglycerides,and lipoproteins in man. Although two previous reports have addressed the short- term effectsof acute administration of alcohol on plasma triglyceride metabolism (13, 14), longer-term actions of consumption of moderate doses of alcohol on the me- tabolism of endogenous and exogenous triglyceride-rich lipoproteins have not been evaluated. Furthermore, ef- fects of alcohol on cholesterol absorption have not been reported, and only one previous paper has evaluated the effects of moderate alcohol consumption on excretion and synthesis of cholesterol and bile acids in man (15). Finally, no information is available on the influence of alcohol on the percent saturation of gallbladder bile with cholesterol. For these reasons we undertook a study of the effects of moderate quantities of alcohol, approxi- mately 20% of total calories, on the metabolism of cho- lesterol and triglycerides in human volunteers. The studies were carried out on a metabolic ward to insure controlled conditions. In this study the following questions were addressed. a) How do moderate intakes of alcohol (24% of calories) affect plasma concentrations of the lipoprotein fractions? b) What are the effects of alcohol on hepatic secretion of triglycerides and on clearance of triglyceride-rich lipo- proteins from plasma? c) Does alcohol ingestion alter the absorption of cholesterol,the fecal excretion of cholesterol Despite the large quantities of alcohol consumed in - - - many populations, research on the influence of alcohol On plasma lipids and lipoproteins and On lipid has been largely of a descriptive nature. Previous studies Abbreviations: VLDL, very low density lipoprotein; LDL, low density lipoprotein; HDL, high density lipoprotein; LPL, lipoprotein lipase; HTGL, hepatic triglyceride lipase: TG, triglyceride; CH, cholesterol: FFA, free fatty acid. v , in human subjects have shown that ethanol consumption is often associated with transient increases in concentra- tions of plasma triglycerides, particularly pronounced in patients with underlying hypertriglyceridemia (1 -3); these ’ T o whom‘reprint requests should be addressed at Bowman Gray School of Medicine, Department of Medicine, 300 South Hawthorne Present address: Center for Human Nutrition, University of Texas Road, Winston-Salem, NC 27 103, Science Center, TX 75235. 486 Journal of Lipid Research Volume 25, 1984 by guest, on September 5, 2018 www.jlr.org Downloaded from
Transcript of Effects of alcohol on plasma lipoproteins and cholesterol ... · Effects of alcohol on plasma...

Effects of alcohol on plasma lipoproteins and cholesterol and triglyceride metabolism in man
John R. Crouse’ and Scott M. Grundy2 Veterans Administration Medical Center and University of California, San Diego, CA 92161
Abstract To define the effects of moderate alcohol intake on cholesterol and triglyceride metabolism in man, twelve patients were hospitalized on a metabolic ward and were fed defined diets for 10 weeks. Each patient underwent testing of plasma lipid and lipoprotein levels, of cholesterol metabolism (absorp tion, fecal excretion, bile saturation), and of triglyceride me- tabolism [turnover of triglycerides in chylomicrons and very low density lipoproteins (VLDL)]. This testing was done twice, first during a 4-week control period and then during a 4-week period in which 630 calories of alcohol were either added to or sub- stituted for baseline calories. This increased the average baseline caloric intake by only 24% (range 20% to 30% depending on the initial caloric intake). Addition of alcohol to the baseline diet did not cause weight gain in lean individuals. Obese indi- viduals’ responses were more variable, and 3/6 definitely gained weight when the diet was supplemented with alcohol. In addition, obese subjects appeared to be more susceptible to the hyper- lipidemic effects of alcohol; whereas 4/6 obese patients devel- oped increased total triglyceride and VLDL-triglyceride con- centrations when alcohol was administered, concentrations in- creased with alcohol administration in only 1/6 lean individuals. High density lipoprotein (HDL) cholesterol increased in all vol- unteers. Low density lipoprotein (LDL) levels did not change. Metabolic studies showed increased transport of VLDL-triglyc- erides in overweight patients but not in normal weight individ- uals; increased transport of VLDL-triglycerides in the former was associated with delayed clearance of chylomicron triglyc- erides. Alcohol consumption did not affect lipoprotein lipase or hepatic triglyceride lipase in six patients in whom these enzyme activities were measured. In the amounts of alcohol taken in this study, no changes were observed in absorption, synthesis, or excretion of bile acids, or percent saturation of gallbladder bile with cholesterol.-Crouse, J. R., and S. M. Grundy. Effects of alcohol on plasma lipoproteins and cholesterol and triglyceride metabolism in man. J. Lipid Res. 25: 486-496.
Supplementary key words lipids chylomicron clearance bile salts obesity
changes are exaggerated in those consuming large amounts of alcohol (4-7) compared to “social drinkers” (1-3, 8-10). Recently, epidemiologic studies have also correlated alcohol consumption with increased plasma high density lipoproteins (HDL) (1 0-1 2). However, rel- atively little is known about effects of ethanol on metab- olism of cholesterol, triglycerides, and lipoproteins in man. Although two previous reports have addressed the short- term effects of acute administration of alcohol on plasma triglyceride metabolism (1 3, 14), longer-term actions of consumption of moderate doses of alcohol on the me- tabolism of endogenous and exogenous triglyceride-rich lipoproteins have not been evaluated. Furthermore, ef- fects of alcohol on cholesterol absorption have not been reported, and only one previous paper has evaluated the effects of moderate alcohol consumption on excretion and synthesis of cholesterol and bile acids in man (15). Finally, no information is available on the influence of alcohol on the percent saturation of gallbladder bile with cholesterol. For these reasons we undertook a study of the effects of moderate quantities of alcohol, approxi- mately 20% of total calories, on the metabolism of cho- lesterol and triglycerides in human volunteers. The studies were carried out on a metabolic ward to insure controlled conditions.
In this study the following questions were addressed. a) How do moderate intakes of alcohol (24% of calories) affect plasma concentrations of the lipoprotein fractions? b) What are the effects of alcohol on hepatic secretion of triglycerides and on clearance of triglyceride-rich lipo- proteins from plasma? c) Does alcohol ingestion alter the absorption of cholesterol, the fecal excretion of cholesterol
Despite the large quantities of alcohol consumed in - - - many populations, research on the influence of alcohol On plasma lipids and lipoproteins and On lipid has been largely of a descriptive nature. Previous studies
Abbreviations: VLDL, very low density lipoprotein; LDL, low density lipoprotein; HDL, high density lipoprotein; LPL, lipoprotein lipase; HTGL, hepatic triglyceride lipase: TG, triglyceride; CH, cholesterol: FFA, free fatty acid.
v ,
in human subjects have shown that ethanol consumption is often associated with transient increases in concentra- tions of plasma triglycerides, particularly pronounced in patients with underlying hypertriglyceridemia (1 -3); these
’ T o whom‘reprint requests should be addressed at Bowman Gray School of Medicine, Department of Medicine, 300 South Hawthorne
Present address: Center for Human Nutrition, University of Texas Road, Winston-Salem, NC 27 103,
Science Center, TX 75235.
486 Journal of Lipid Research Volume 25, 1984
by guest, on Septem
ber 5, 2018w
ww
.jlr.orgD
ownloaded from

and bile acids, or the lipid composition of gallbladder bile?
METHODS
Patients Studies were carried out in twelve men on the Special
Diagnostic and Treatment Unit (metabolic ward), Vet- erans Administration Medical Center, San Diego, Cali- fornia. Their clinical data are given in Table 1. Patients were excluded who had a history of either complete ab- stinence from alcohol, or of past hospitalization to treat complications of alcohol abuse. Patients also were ex- cluded who had evidence of abnormalities of liver function (including BSP test), or who had any metabolic disease such as thyroid dysfunction or diabetes mellitus. Half of the patients (No. 1-6, Table 1) were obese (over 120% of ideal body weight); three had fasting hypertriglycer- idemia, and two had clinical manifestations of athero- sclerotic disease.
Metabolic ward conditions and diet All patients remained hospitalized on the metabolic
ward for 10 weeks. The first 2 weeks served as an “equil- ibration’’ period to allow for adjustment to the liquid- formula diet and to regulate dietary intake to establish weight maintenance. During this period the patients con- sumed a diet of mixed solid food and liquid formula (1 6). Fat supplied 40% of total calories, protein 15%, and car- bohydrate 45%. Fat was mostly in the form of lard. The ratio of saturated:monounsaturated:polyunsaturated fatty acids was 1.0:1.2:0.2. Daily intakes of cholesterol were low (85-1 34 mg/day). The second (4-wk) period was the “control” period. Ten of the twelve patients continued
TABLE 1.
the diet of the equilibration period while they underwent the studies described below. These ten then entered the third (4-wk) “test” period of alcohol-feeding during which time the studies were repeated. In this period 630 calories of alcohol (90 g in five divided doses daily) were given daily. In one patient (No. 9) the alcohol was substituted for liquid calories. For reasons discussed below, the alcohol was added to the isocaloric diet in the remaining nine patients. Two of the twelve patients (Nos. 4 and 10) en- tered the alcohol test period before the control period.
In the first patient (No. 9) substitution of alcohol for an equal portion of weight maintenance calories resulted in a fall in weight. In view of this response and a previous report that excess calories as alcohol do not cause weight gain (1 7), all subsequent patients were given alcohol in addition to weight maintenance calories. For seven of the eleven remaining individuals these additional alcohol calories did not cause weight gain. When weight gain was noted during alcohol feeding in three subjects (as de- scribed under Results, below), formula calories were ad- justed to maintain constant weight.
Clinical monitoring The patients were followed carefully on the metabolic
ward by physicians and nurses throughout the study. They were restricted to the metabolic ward throughout the first 2 weeks of alcohol feeding, and at no time in the study were they allowed to leave the hospital. Routine blood testing upon admission included complete blood count, fasting blood glucose, bilirubin, serum protein, albumin, routine liver function tests including BSP, and hepatitis B antigens. Urinalysis was performed on all pa- tients. Measurements were repeated at the end of each period.
Clinical data
Baseline Lipids
Patient Fasting Alkaline No. Age Wt. IBW” 52 IBW CH TG Plasma Glucose Phosphatase SGOT BSP
grr kg kg lllg
I 32 105 73 144 207 2 22 95 73 131 171 3 59 102 78 131 202 4 60 79 64 123 180 5 56 87 72 121 214 6 62 83 69 120 278 7 60 85 72 118 179 8 39 75 65 116 186 9 47 78 70 112 171
10 35 74 69 106 220 1 1 52 63 73 86 167 12 49 56 66 84 200
. / d l
3 76 214 174 96
175 801 109 166 199 360 134 220
nigldl
95 82 86 98 93 92 94 73 92 81 87 49
U / l h
75 80 51 71 55 43 72 68 68
100 76 78
L ‘ / F a 20 4 21 4 15 4 17 3 11 3 14 4 13 2 17 5 18 3 15 4 12 3 26 4
‘‘ Abbreviations: IBW, ideal body weight; CH, total plasma cholesterol; T G , total plasma triglyceride.
‘ Normal range = 0-40 U/l. Normal range = 30-1 15 U/l.
Grouse and Grundy Alcohol and lipids 487
by guest, on Septem
ber 5, 2018w
ww
.jlr.orgD
ownloaded from
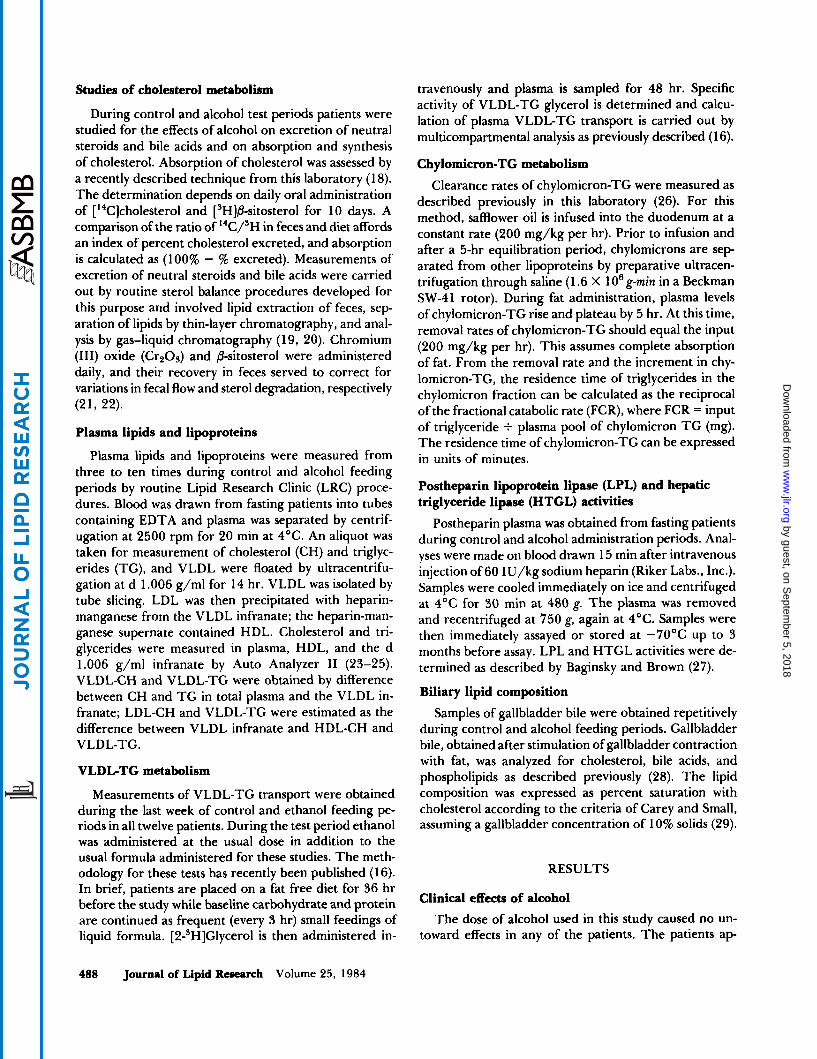
Studies of cholesterol metabolism
During control and alcohol test periods patients were studied for the effects of alcohol on excretion of neutral steroids and bile acids and on absorption and synthesis of cholesterol. Absorption of cholesterol was assessed by a recently described technique from this laboratory (1 8). The determination depends on daily oral administration of ['4C]cholesterol and [SH]/3-sitosterol for 10 days. A comparison of the ratio of 14C/'H in feces and diet affords an index of percent cholesterol excreted, and absorption is calculated as (1 00% - % excreted). Measurements of excretion of neutral steroids and bile acids were carried out by routine sterol balance procedures developed for this purpose and involved lipid extraction of feces, sep- aration of lipids by thin-layer chromatography, and anal- ysis by gas-liquid chromatography (1 9, 20). Chromium (111) oxide (Cr20s) and /3-sitosterol were administered daily, and their recovery in feces served to correct for variations in fecal flow and sterol degradation, respectively (21, 22).
Plasma lipids and lipoproteins
Plasma lipids and lipoproteins were measured from three to ten times during control and alcohol feeding periods by routine Lipid Research Clinic (LRC) proce- dures. Blood was drawn from fasting patients into tubes containing EDTA and plasma was separated by centrif- ugation at 2500 rpm for 20 min at 4°C. An aliquot was taken for measurement of cholesterol (CH) and triglyc- erides (TG), and VLDL were floated by ultracentrifu- gation at d 1.006 g/ml for 14 hr. VLDL was isolated by tube slicing. LDL was then precipitated with heparin- manganese from the VLDL infranate; the heparin-man- ganese supernate contained HDL. Cholesterol and tri- glycerides were measured in plasma, HDL, and the d 1.006 g/ml infranate by Auto Analyzer I1 (23-25). VLDL-CH and VLDL-TG were obtained by difference between CH and TG in total plasma and the VLDL in- franate; LDL-CH and VLDL-TG were estimated as the difference between VLDL infranate and HDL-CH and VLDL-TG.
VLDL-TG metabolism
Measurements of VLDL-TG transport were obtained during the last week of control and ethanol feeding pe- riods in all twelve patients. During the test period ethanol was administered at the usual dose in addition to the usual formula administered for these studies. The meth- odology for these tests has recently been published (16). In brief, patients are placed on a fat free diet for 36 hr before the study while baseline carbohydrate and protein are continued as frequent (every 3 hr) small feedings of liquid formula. [ 2-3H]Glycerol is then administered in-
travenously and plasma is sampled for 48 hr. Specific activity of VLDL-TG glycerol is determined and calcu- lation of plasma VLDL-TG transport is carried out by multicompartmental analysis as previously described (1 6).
Chylomicron-TG metabolism Clearance rates of chylomicron-TG were measured as
described previously in this laboratory (26). For this method, safflower oil is infused into the duodenum at a constant rate (200 mg/kg per hr). Prior to infusion and after a 5-hr equilibration period, chylomicrons are sep- arated from other lipoproteins by preparative ultracen- trifugation through saline (1.6 X lo6 g-min in a Beckman SW-4 1 rotor). During fat administration, plasma levels of chylomicron-TG rise and plateau by 5 hr. At this time, removal rates of chylomicron-TG should equal the input (200 mg/kg per hr). This assumes complete absorption of fat. From the removal rate and the increment in chy- lomicron-TG, the residence time of triglycerides in the chylomicron fraction can be calculated as the reciprocal of the fractional catabolic rate (FCR), where FCR = input of triglyceride + plasma pool of chylomicron TG (mg). The residence time of chylomicron-TG can be expressed in units of minutes.
Postheparin lipoprotein lipase (LPL) and hepatic triglyceride lipase (HTGL) activities
Postheparin plasma was obtained from fasting patients during control and alcohol administration periods. Anal- yses were made on blood drawn 15 min after intravenous injection of 60 IU/kg sodium heparin (Riker Labs., Inc.). Samples were cooled immediately on ice and centrifuged at 4°C for 30 min at 480 g. The plasma was removed and recentrifuged at 750 g, again at 4°C. Samples were then immediately assayed or stored at -70°C up to 3 months before assay. LPL and HTGL activities were de- termined as described by Baginsky and Brown (27).
Biliary lipid composition Samples of gallbladder bile were obtained repetitively
during control and alcohol feeding periods. Gallbladder bile, obtained after stimulation of gallbladder contraction with fat, was analyzed for cholesterol, bile acids, and phospholipids as described previously (28). The lipid composition was expressed as percent saturation with cholesterol according to the criteria of Carey and Small, assuming a gallbladder concentration of 10% solids (29).
RESULTS
Clinical effects of alcohol The dose of alcohol used in this study caused no un-
toward effects in any of the patients. The patients ap-
488 Journal of Lipid Research Volume 25, 1984
by guest, on Septem
ber 5, 2018w
ww
.jlr.orgD
ownloaded from
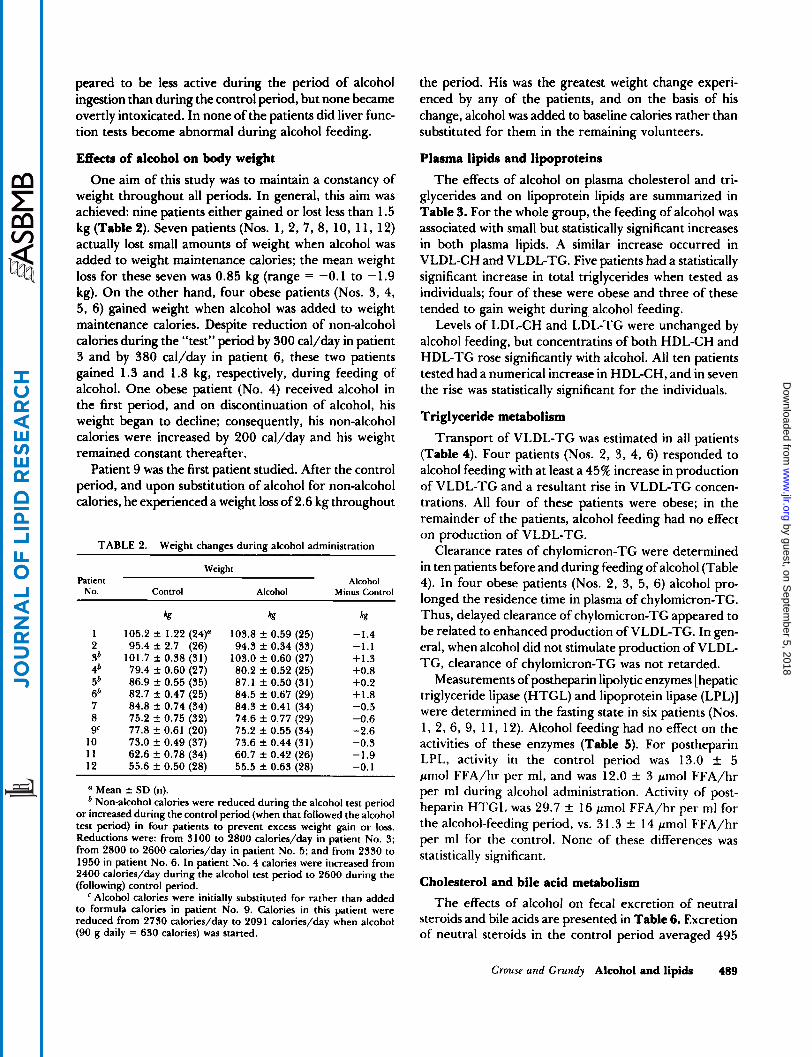
peared to be less active during the period of alcohol ingestion than during the control period, but none became overtly intoxicated. In none of the patients did liver func- tion tests become abnormal during alcohol feeding.
Effects of alcohol on body weight One aim of this study was to maintain a constancy of
weight throughout all periods. In general, this aim was achieved: nine patients either gained or lost less than 1.5 kg (Table 2). Seven patients (Nos. 1, 2, 7, 8, 10, 1 1, 12) actually lost small amounts of weight when alcohol was added to weight maintenance calories; the mean weight loss for these seven was 0.85 kg (range = -0.1 to -1.9 kg). On the other hand, four obese patients (Nos. 3, 4, 5, 6) gained weight when alcohol was added to weight maintenance calories. Despite reduction of non-alcohol calories during the “test” period by 300 cal/day in patient 3 and by 380 cal/day in patient 6, these two patients gained 1.3 and 1.8 kg, respectively, during feeding of alcohol. One obese patient (No. 4) received alcohol in the first period, and on discontinuation of alcohol, his weight began to decline; consequently, his non-alcohol calories were increased by 200 cal/day and his weight remained constant thereafter.
Patient 9 was the first patient studied. After the control period, and upon substitution of alcohol for non-alcohol calories, he experienced a weight loss of 2.6 kg throughout
TABLE 2. Weight changes during alcohol administration
Weight Patient Alcohol No. Control Alcohol Minus Control
t kg t 1 105.2 2 1.22 (24)“ 103.8 2 0.59 (25) -1.4 2 95.4 f 2.7 (26) 94.3 f 0.34 (33) -1.1
5b 86.9 f 0.55 (35) 87.1 f 0.50 (31) +0.2
Sb 101.7 f 0.38 (31) 103.0 f 0.60 (27) +1.3 4b 79.4 f 0.60 (27) 80.2 f 0.52 (25) +0.8
6’ 82.7 f 0.47 (25) 84.5 f 0.67 (29) +1.8 7 84.8 f 0.74 (34) 84.3 f 0.41 (34) -0.5 8 75.2 f 0.75 (32) 74.6 f 0.77 (29) -0.6 9‘ 77.8 f 0.61 (20) 75.2 5 0.55 (34) -2.6
10 73.0 f 0.49 (37) 73.6 f 0.44 (31) -0.3 11 62.6 f 0.78 (34) 60.7 f 0.42 (26) -1.9 12 55.6 f 0.50 (28) 55.5 * 0.63 (28) -0.1
Mean f SD (n). Non-alcohol calories were reduced during the alcohol test period
or increased during the control period (when that followed the alcohol test period) in four patients to prevent excess weight gain or loss. Reductions were: from 3100 to 2800 calories/day in patient No. 3; from 2800 to 2600 calories/day in patient No. 5; and from 2330 to 1950 in patient No. 6. In patient No. 4 calories were increased from 2400 calories/day during the alcohol test period to 2600 during the (following) control period.
Alcohol calories were initially substituted for rather than added to formula calories in patient No. 9. Calories in this patient were reduced from 2730 calories/day to 2091 calories/day when alcohol (90 g daily = 630 calories) was started.
the period. His was the greatest weight change experi- enced by any of the patients, and on the basis of his change, alcohol was added to baseline calories rather than substituted for them in the remaining volunteers.
Plasma lipids and lipoproteins The effects of alcohol on plasma cholesterol and tri-
glycerides and on lipoprotein lipids are summarized in Table 3. For the whole group, the feeding of alcohol was associated with small but statistically significant increases in both plasma lipids. A similar increase occurred in VLDL-CH and VLDL-TG. Five patients had a statistically significant increase in total triglycerides when tested as individuals; four of these were obese and three of these tended to gain weight during. alcohol feeding.
Levels of LDL-CH and LDL-TG were unchanged by alcohol feeding, but concentratins of both HDL-CH and HDL-TG rose significantly with alcohol. AH ten patients tested had a numerical increase in HDL-CH, and in seven the rise was statistically significant for the individuals.
Triglyceride metabolism Transport of VLDL-TG was estimated in all patients
(Table 4). Four patients (Nos. 2, 3, 4, 6) responded to alcohol feeding with at least a 45% increase in production of VLDL-TG and a resultant rise in VLDL-TG concen- trations. All four of these patients were obese; in the remainder of the patients, alcohol feeding had no effect on production of VLDL-TG.
Clearance rates of chylomicron-TG were determined in ten patients before and during feeding of alcohol (Table 4). In four obese patients (Nos. 2, 3, 5, 6) alcohol pro- longed the residence time in plasma of chylomicron-TG. Thus, delayed clearance of chylomicron-TG appeared to be related to enhanced production of VLDL-TG. In gen- eral, when alcohol did not stimulate production of VLDL- TG, clearance of chylomicron-TG was not retarded.
Measurements of postheparin lipolytic enzymes [hepatic triglyceride lipase (HTGL) and lipoprotein lipase (LPL)] were determined in the fasting state in six patients (Nos. 1, 2, 6, 9, 11, 12). Alcohol feeding had no effect on the activities of these enzymes (Table 5). For postheparin LPL, activity in the control period was 13.0 f 5 pmol FFA/hr per ml, and was 12.0 f 3 pmol FFA/hr per ml during alcohol administration. Activity of post- heparin HTGL was 29.7 f 16 pmol FFA/hr per ml for the alcohol-feeding period, vs. 3 1.3 f 14 pmol FFA/hr per ml for the control. None of these differences was statistically significant.
Cholesterol and bile acid metabolism The effects of alcohol on fecal excretion of neutral
steroids and bile acids are presented in Table 6. Excretion of neutral steroids in the control period averaged 495
Crouse and Grundy Alcohol and lipids 489
by guest, on Septem
ber 5, 2018w
ww
.jlr.orgD
ownloaded from
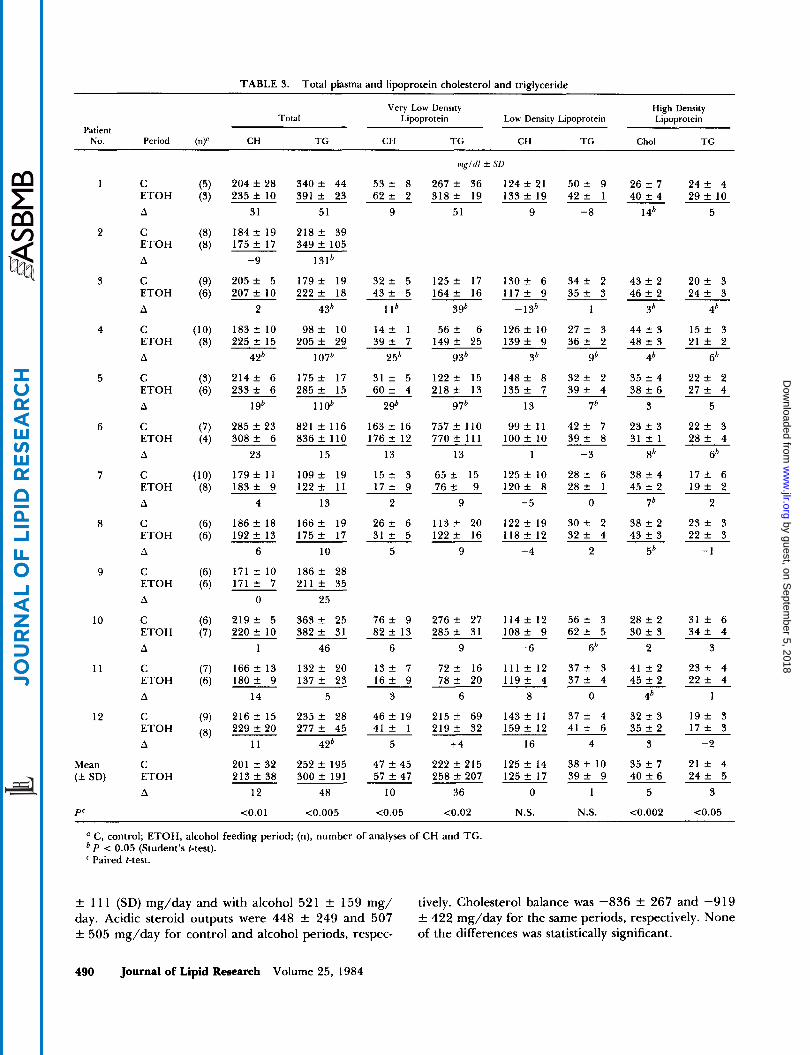
TABLE 3. Total plasma and lipoprotein cholesterol and triglyceride
Patient
Very Low Density High Density Total Lipoprotein Low Density Lipoprotein Lipoprotein
NO. Period (n)B CH TG CH TG CH TG Chol TG
1
2
3
4
5
6
7
8
9
10
11
12
Mean (f SD)
P'
C ETOH A
C ETOH A
C ETOH A
C ETOH A
C ETOH A
C ETOH A
C ETOH A
C ETOH A
C ETOH A
C ETOH A
C ETOH A
C ETOH A
C ETOH A
204 f 28 235 f 10
31
184 f 19 175 f 17
-9
205 f 5 207 f 10
2
183 f 10 225 f 15
42'
2 1 4 f 6 233 f 6
196
285 f 23 3 0 8 f 6
23
179 f 11 1 8 3 f 9
4
186 f 18 192 f 13
6
171 f 10 171 f 7
0
2 1 9 f 5 220 f 10
1
166 f 13 1 8 0 2 9
14
216 f 15 229 f 20
11
201 f 32 213 f 38
12
<0.01
3 4 0 f 44 391 f 23
51
2 1 8 f 39 349 f 105
131b
1 7 9 f 19 2 2 2 f 18
436
98 f 10 205 f 29
1076
1 7 5 f 17 2 8 5 f 15
1 lob
821 f 116 836 f 110
15
109 f 19 1 2 2 f 11
13
1 6 6 f 19 1 7 5 f 17
10
1 8 6 f 28 211 f 35
25
363 f 25 382 f 31
46
1 3 2 f 20 137 f 23
5
2 3 5 f 28 277 f 45
42'
252 f 195 300 f 191
48
<0.005
mg/ dl lr SD
53 f 8 267 f 36 1 2 4 f 21 50 f 9 26 f 7 2 4 f 4 6 2 f 2 3 1 8 f 1 9 1 3 3 f 1 9 4 2 f 1 4 0 f 4 2 9 f 1 0
9 51 9 -8 1 4' 5
3 2 f 5 4 3 f 5
1 lb
1 4 f 1 3 9 f 7
25'
3 l f 5 6 0 f 4
296
163 f 16 176 f 12
13
1 5 f 3 1 7 f 9
2
2 6 f 6 3 1 f 5
5
7 6 f 9 8 2 f 13
6
13 f 7 1 6 f 9
3
46 f 19 41 f 1
5
47 f 45 57 f 47
10
t0.05
1 2 5 f 17 164 f 16
396
56 f 6 1 4 9 f 25
936
1 2 2 2 15 2 1 8 f 13
976
757 f 110 770 f 111
13
65 t- 15 76 + 9
9
113 f 20 1 2 2 f 16
9
276 f 27 285 1 31
9
72 f 16 78 f 20
6
215 f 69 219 f 32
+4
222 f 215 258 f 207
36
<0.02
1 3 0 f 6 1 1 7 f 9
-13'
126 f 10 1 3 9 f 9
36
148 f 8 1 3 5 f 7
-13
9 9 f 11 100 f 10
1
125 f 10 12Of 8
-5
122 f 19 1 1 8 f 12
-4
114 f 12 1 0 8 f 9
-6
111 f 12 1 1 9 f 4
8
143 f 11 159 f 12
16
125 f 14 125 f 17
0
N.S.
3 4 f 2 3 5 f 3
1
2 7 f 3 3 6 f 2
96
3 2 f 2 3 9 f 4
7'
4 2 f 7 3 9 f 8
-3
2 8 f 6 2 8 + 1
0
3 0 f 2 3 2 f 4
2
5 6 f 3 6 2 f 5
66
3 7 f 3 3 7 f 4
0
3 7 f 4 4 1 f 6
4
38 f 10 3 9 f 9
1
N.S.
43 f 2 46 f 2
36
44 f 3 48 f 3
46
35 f 4 38 f 6
3
23 f 3 31 f 1
8'
38 f 4 45 f 2
76
38 f 2 43 f 3
5'
28 f 2 30 f 3
2
41 f 2 45 f 2
46
32 f 3 35 f 2
3
35 f 7 40 f 6
5
<0.002
2 0 f 3 2 4 f 3
46
15 f 3 2 1 f 2
6'
2 2 f 2 2 7 f 4
5
2 2 f 3 2 8 f 4
6'
1 7 f 6 1 9 f 2
2
2 3 f 3 2 2 f 3
-1
3 1 f 6 3 4 f 4
3
2 3 f 4 2 2 f 4
1
1 9 f 3 17 k 3
-2
2 1 f 4 2 4 f 5
3
<0.05
'' C, control; ETOH, alcohol feeding period; (n), number of analyses of CH and TG.
' Paired t-test. P < 0.05 (Student's t-test).
f 11 1 (SD) mg/day and with alcohol 52 1 f 159 mg/ day. Acidic steroid outputs were 448 k 249 and 507 f 505 mg/day for control and alcohol periods, respec-
tively. Cholesterol balance was -836 f 267 and -919 f 422 mg/day for the same periods, respectively. None of the differences was statistically significant.
490 Journal of Lipid Research Volume 25, 1984
by guest, on Septem
ber 5, 2018w
ww
.jlr.orgD
ownloaded from
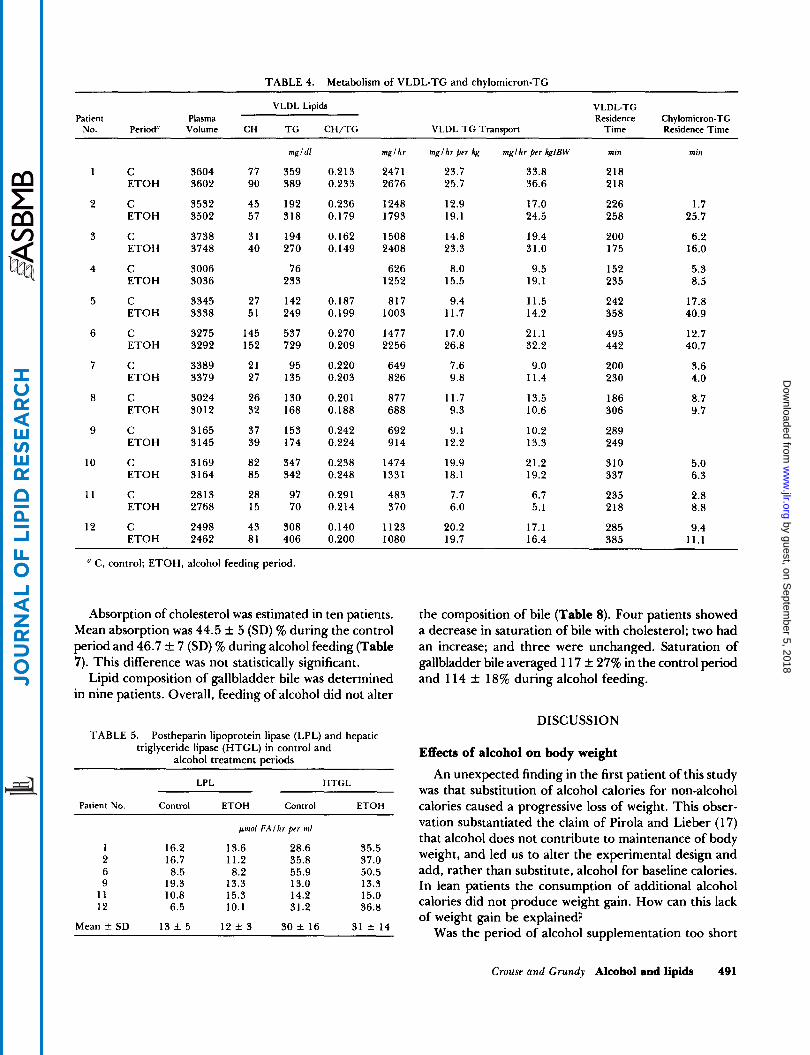
TABLE 4. Metabolism of VLDL-TG and chylomicron-TG
VLDL Lipids VLDL-TG Patient Plasma Residence Chylomicron-TG
NO. Period" Volume CH T G CH/TG VLDL T G Transport Time Residence Time
1
2
3
4
5
6
7
8
9
10
11
12
C ETOH
C ETOH
C ETOH
C ETOH
C ETOH
C ETOH
C ETOH
C ETOH
C ETOH
C ETOH
C ETOH
C ETOH
3604 3602
3532 3502
3738 3748
3006 3036
3345 3338
3275 3292
3389 3379
3024 3012
3165 3145
3169 3164
2813 2768
2498 2462
77 90
45 57
31 40
27 51
145 152
21 27
26 32
37 39
82 85
28 15
43 81
mgldl
359 389
192 318
194 270
76 233
142 249
537 729
95 135
130 168
153 174
347 342
97 70
308 406
0.2 13 0.233
0.236 0.179
0.162 0.149
0.187 0.199
0.270 0.209
0.220 0.203
0.201 0.188
0.242 0.224
0.238 0.248
0.291 0.214
0.140 0.200
mglkr
247 1 2676
1248 1793
1508 2408
626 1252
817 1003
1477 2256
649 826
877 688
692 914
1474 1331
483 370
1123 1080
'' C, control; ETOH, alcohol feeding period.
Absorption of cholesterol was estimated in ten patients. Mean absorption was 44.5 f 5 (SD) % during the control period and 46.7 f 7 (SD) 9% during alcohol feeding (Table 7). This difference was not statistically significant.
Lipid composition of gallbladder bile was determined in nine patients. Overall, feeding of alcohol did not alter
TABLE 5. Postheparin lipoprotein lipase (LPL) and hepatic triglyceride lipase (HTGL) in control and
alcohol treatment periods
LPL HTGL
Patient No. Control ETOH Control ETOH
pmol FA1 kr p r r in1
1 16.2 13.6 28.6 35.5 2 16.7 11.2 35.8 37.0 6 8.5 8.2 55.9 50.5 9 19.3 13.3 13.0 13.3
11 10.8 15.3 14.2 15.0 12 6.5 10.1 31.2 36.8
Mean f SD 13 f 5 12 f 3 30 f 16 31 f 14
mgl hr ppr kg
23.7 25.7
12.9 19.1
14.8 23.3
8.0 15.5
9.4 11.7
17.0 26.8
7.6 9.8
11.7 9.3
9.1 12.2
19.9 18.1
7.7 6.0
20.2 19.7
mglhr per kglBW
33.8 36.6
17.0 24.5
19.4 31.0
9.5 19.1
11.5 14.2
21.1 32.2
9.0 11.4
13.5 10.6
10.2 13.3
21.2 19.2
6.7 5.1
17.1 16.4
min
218 218
226 258
200 175
152 235
242 358
495 442
200 230
186 306
289 249
310 337
235 218
285 385
min
1.7 25.7
6.2 16.0
5.3 8.5
17.8 40.9
12.7 40.7
3.6 4.0
8.7 9.7
5.0 6.3
2.8 8.8
9.4 11.1
the composition of bile (Table 8). Four patients showed a decrease in saturation of bile with cholesterol; two had an increase; and three were unchanged. Saturation of gallbladder bile averaged 1 17 & 27% in the control period and 1 14 f 18% during alcohol feeding.
DISCUSSION
Effects of alcohol on body weight An unexpected finding in the first patient of this study
was that substitution of alcohol calories for non-alcohol calories caused a progressive loss of weight. This obser- vation substantiated the claim of Pirola and Lieber (17) that alcohol does not contribute to maintenance of body weight, and led us to alter the experimental design and add, rather than substitute, alcohol for baseline calories. In lean patients the consumption of additional alcohol calories did not produce weight gain. How can this lack of weight gain be explained?
Was the period of alcohol supplementation too short
Crouse and Grundy Alcohol and lipids 491
by guest, on Septem
ber 5, 2018w
ww
.jlr.orgD
ownloaded from
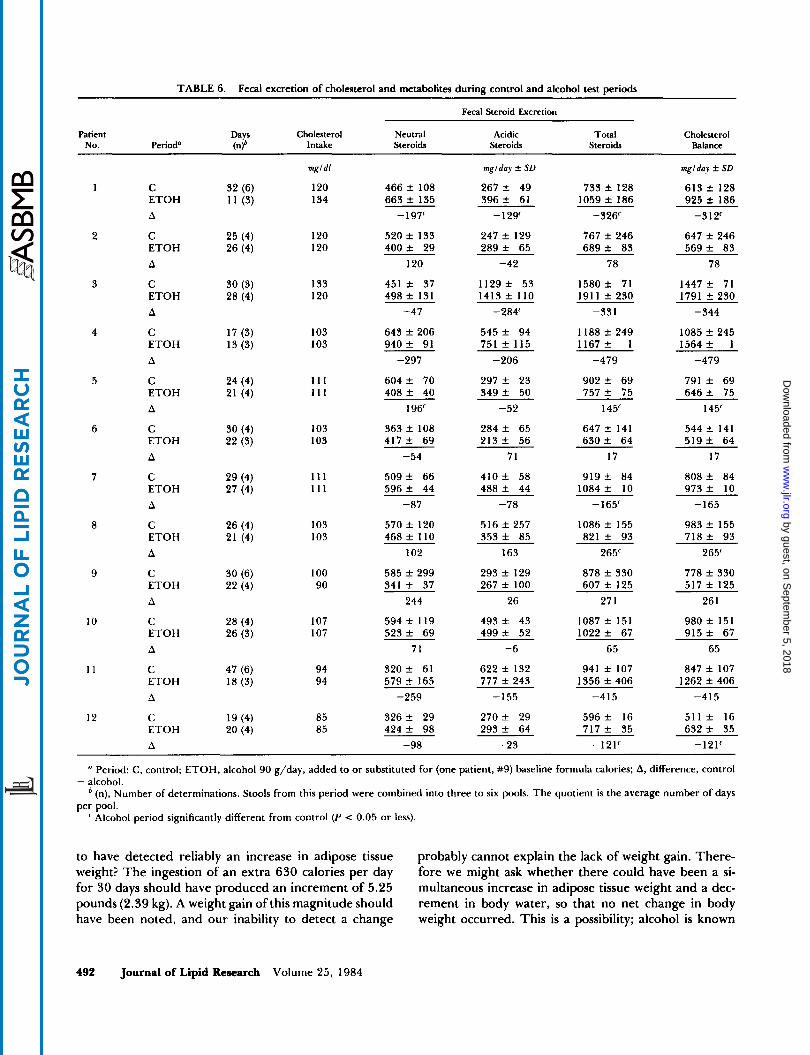
TABLE 6. Fecal excretion of cholesterol and metabolites during control and alcohol test periods
Fecal Steroid Excretion
Patient Days Cholesterol Neutral Acidic Total Cholesterol No. Period" (.3 Intake Steroids Steroids Steroids Balance
1
2
3
4
5
6
7
8
9
10
11
12
C E T O H A
C ETOH A
C ETOH A
C ETOH A
C ETOH A
C ETOH A
C ETOH A
C ETOH A
C ETOH A
C ETOH A
C ETOH A
C ETOH A
mgldl
120 134
120 120
133 120
103 103
111 111
103 103
111 111
103 103
100 90
107 107
94 94
85 85
466 f 108 663 f 135
-197'
520 f 133 400 f 29
120
451 f 37 498 f 131
-47
643 f 206 9 4 0 f 91
-297
604 f 70 408 f 40
196'
363 f 108 4 1 7 f 69
-54
5 0 9 f 66 596 f 44
-87
570 f 120 468 f 110
102
585 f 299 341 f 37
244
594 f 119 5 2 3 f 69
71
320 f 61 579 ? 165
-259
326 f 29 424 f 98
-98
mglday f SD
267 f 49 3 9 6 f 61 - 129'
247 f 129 289 f 65
-42
1 1 2 9 f 53 1413 f 110
-284'
545 f 94 751 f 115
-206
297 f 23 3 4 9 f 50
-52
284 f 65 213 f 56
71
4 1 0 f 58 488 f 44
-78
516 f 257 353 f 85
163
293 f 129 267 f 100
26
493 f 43 499 f 52
-6
622 f 132 777 f 243
-155
2 7 0 f 29 293 f 64
-23
733 f 128 1059 f 186
-326'
767 f 246 689 f 83
78
1 5 8 0 f 71 1911 f 230
-331
1188 f 249 1167 f 1
-479
902 f 69 757 f 75
145'
647 f 141 6 3 0 f 64
17
9 1 9 f 84 1084 f 10
- 165'
1086 f 155 821 f 93
265'
878 f 330 607 f 125
27 1
1087 f 151 1022 f 67
65
941 f 107 1356 f 406
-415
596 f 16 717 f 35
-121'
mglday f SD
613 f 128 925 f 186
-312'
647 f 246 569 f 83
78
1447 f 71 1791 f 230
-344
1085 f 245 1564 f I
-479
791 f 69 646 f 75
145'
544 f 141 5 1 9 f 64
17
808 f 84 973 f 10
-165
983 f 155 7 1 8 f 93
265'
778 f 330 517 f 125
26 1
980 f 151 915 f 67
65
847 f 107 1262 f 406
-415
5 1 1 f 16 632 f 35
-121'
" Period: C, control; ETOH, alcohol 90 g/day, added to or substituted for (one patient, #9) baseline formula calories; A, difference, control
(n), Number of determinations. Stools from this period were combined into three to six pools. The quotient is the average number of days
Alcohol period significantly different from control (P < 0.05 or less).
- alcohol.
per pool.
to have detected reliably an increase in adipose tissue weight? The ingestion of an extra 630 calories per day for 30 days should have produced an increment of 5.25 pounds (2.39 kg). A weight gain of this magnitude should have been noted, and our inability to detect a change
probably cannot explain the lack of weight gain. There- fore we might ask whether there could have been a si- multaneous increase in adipose tissue weight and a dec- rement in body water, so that no net change in body weight occurred. This is a possibility; alcohol is known
492 Journal of Lipid Research Volume 25 , 1984
by guest, on Septem
ber 5, 2018w
ww
.jlr.orgD
ownloaded from

TABLE 7. Cholesterol absorption
Control Alcohol Difference Patient 11) 111) (11 - 1)
1 2 3 4 6 7 8
10 11 12
Mean f SD
8 0 1 ) "
45 (3) 42 (4) 41 (3) 40 (4) 48 (4) 47 (4) 36 (3) 45 (3) 54 (3) 47 (4)
44.5 f 5
%
+8 -9 -2 +4 +5 +1
+13 +7 +1 -6
2.2
' %, % Absorption; n, number of determinations.
to induce a transitory diuresis (30,3 l), and a net reduction in body water could have occurred. A longer duration of alcohol feeding might be needed to prove the presence or absence of adipose tissue gain. Another possible reason for lack of weight gain is malabsorption of calories. In previous studies of patients with chronic alcoholism, it is difficult to separate the effects of alcohol from those of malnutrition; the latter frequently accompanies alcohol abuse and also is associated with malabsorption (32). The influence of alcohol on absorption of various nutrients is no exception: early work demonstrated that alcohol interfered with absorption of thiamine, folic acid, vitamin B12, and d-xylose (33-35). In another study, in which alcohol provided 46 to 66% of calories, an adequate diet and folic acid supplements prevented malabsorption of d-xylose and fat (36).
Interference with nutrient absorption thus cannot be implicated in the calorie wastage apparently induced by alcohol consumption. This has led investigators to evaluate the possibility that chronic alcohol ingestion leads to a hypermetabolic state not unlike that induced by hyper- thyroidism or thyroxine administration (3'7). In rats, chronic treatment with alcohol increases oxygen con- sumption, and this effect is thought to result from in- creased hepatic mitochondrial sodium-potassium ATPase activity. The rise in ATPase activity can account for the rise in oxygen consumption in these animals (37). Thus, further studies on effects of alcohol on energy consump- tion in man might prove revealing.
Finally, the apparent lack of weight gain during alcohol supplementation seemed to be related to the initial weight. Most patients who failed to gain weight with addition of alcohol were nonobese. Previous investigators have ob- served that enhancement of caloric intake does not nec- essarily cause weight gain in nonobese people. The reason for this is unknown. Therefore, we do not know whether alcohol is unique among nutrients in its failure to cause weight gain in nonobese subjects. Pirola and Leiber (1 7) showed that addition of alcohol calories to a baseline diet was not as effective in causing weight gain as was the addition of an equal amount of carbohydrate calories. However, they added a great deal more ethanol (2000 Kcal per day) than we did. In this study only 63% Kcal of alcohol was administered and this accounted for an increase of, on average, only 24% above baseline calories (range 20-30%). In the present study the weight gain noted in four obese patients given alcohol provides a striking contrast to results in nonobese subjects. Whether obese patients are more likely than nonobese subjects to
TABLE 8. Biliary lipid composition ~ _ _
Control Ethanol
Lipid Composition" Lipid Composition" Bile
Patient No. CH BA PL Saturation* CH BA PL Bile Saturation*
moirs8 8
1 9.2 67.3 23.6 132 (2) 2 5.9 76.6 17.7 96 (3) 3 8.9 69.5 22.2 114 (4) 4 10.7 70.1 19.2 158 (4) 5 10.0 66.7 23.3 133 (3) 6 9.3 59.7 30.9 112 (1) 7 6.1 7.3 19.6 93 (1)
11 4.6 76.7 18.7 73 (2) 9 9.6 68.0 22.4 141 (4)
Mean f SD 117 f 27 (9)
molrs8
8.8 66.3 25.0 6.7 74.1 19.2 9.3 72.2 18.5 9.0 71.5 19.5 7.6 72.0 20.4 8.4 67.0 24.6 6.1 76.0 18.1 6.5 74.0 19.4 5.9 77.3 16.8
8
114 (2) 101 (3) 152 (3) 133 (2) 110 (3) 109 (5) 99 (2)
99 (1) 106 (5)
114 f 18 (9)
a Abbreviations: CH, cholesterol; BA, bile acids; PL, phospholipids. Percent saturation of gallbladder with cholesterol according to Carey and Small (29) assuming 10%
solids for (n) samples.
Crouse and Grundy Alcohol and lipids 493
by guest, on Septem
ber 5, 2018w
ww
.jlr.orgD
ownloaded from
gain weight with a given increment in calories regardless of their source would seem worthy of further study.
Effects of alcohol on plasma lipids and lipoproteins Very low density lipoproteins and chylomicrons. Alcohol is
known to enhance concentrations of hepatic triglycerides. This increase is due to an increased synthesis of triglyc- erides in the liver (38). The actions of alcohol on plasma triglycerides are more variable and depend upon the dose of alcohol administered, the underlying diet, the genetic predisposition to hypertriglyceridemia, and the duration of administration (1-10). In a previous study (4) for in- stance, the increase in plasma levels of triglycerides fol- lowing the administration of very large amounts of alcohol was only transitory. Likewise, administration of smaller amounts of alcohol, such as described in the present study and within the boundaries of social drinking, resulted in a hypertriglyceridemic response in individuals with type 4 hyperlipoproteinemia but not in normal persons (1 -3). In our own study the response to alcohol ingestion was also variable and appeared to depend upon both under- lying hypertriglyceridemia and initial body weight. Only one of six nonobese individuals developed significant hy- pertriglyceridemia during the consumption of alcohol, whereas four of six individuals whose body weight ex- ceeded 120% of ideal showed a significant increase in plasma triglycerides over control values (Table 3). Alcohol feeding was continued for 4 weeks, and in all patients, plasma triglyceride had returned to control values at the end of this period of alcohol feeding; this observation therefore seems in agreement with the experience of pre- vious investigators. Experiments carried out during the early phase of alcohol feeding have shown increased syn- thesis of VLDL-TG in human volunteers (13, 14). T o our knowledge, however, synthesis of VLDL-TG after longer-term alcohol feeding has not been studied pre- viously. Our studies of the latter type showed that changes in production of VLDL-TG often occur but not invari- ably. All six obese patients had a rise in production rates of VLDL-TG after a month of alcohol feeding. In con- trast, nonobese subjects generally did not demonstrate this response. Therefore, as with the effects of obesity on both the body weight response and the plasma tri- glyceride response to alcohol feeding, an increased syn- thesis of VLDL-TG was confined mainly to obese patients.
The rise in plasma triglycerides in several of the subjects during alcohol feeding was due mainly to a stimulation of VLDL-TG synthesis. Another possibility is that alcohol reduces the clearance of triglyceride-rich lipoproteins. We could demonstrate no effects of alcohol on activities of postheparin LPL or HTGL; in another report, an increase in activities of these enzymes was noted (39). A reduction in clearance rates of chylomicron-TG during alcohol administration occurred in several of our patients.
This change however was primarily in obese patients who also had enhanced synthesis of VLDL-TG. Delayed clear- ance of chylomicron-TG therefore might be explained by competition for removal of excess VLDL-TG (40) and not necessarily by induction of a clearance defect. Com- petition seems particularly likely in view of the fact that most nonobese subjects had no delay in chylomicron clearance with alcohol feeding. Also, alcohol had no con- sistent effect on the residence time of VLDL-TG. Al- though four patients (Nos. 4, 5, 8, and 12) had prolon- gation of the residence time of VLDL-TG during alcohol administration, the absence of this effect in the remaining patients, together with the absence of any demonstrable effect on activities of post-heparin LPL or HTGL, makes unlikely the induction of a definite defect in clearance for plasma triglycerides by alcohol.
Low density lipoproteins. A previous epidemiologic report noted an inconsistent reciprocal relationship between al- cohol intake and plasma LDL-CH (1 2). This might imply that alcohol per se lowers LDL. In the present study, however, no such effect was seen. For the group as a whole, no changes in levels of LDL-CH were observed.
High density lipoproteins. Several epidemiological studies suggest that alcohol raises plasma HDL-CH (1 0- 12). This effect also has been demonstrated in experimental animals (41). T o our knowledge, however, it has not been shown that controlled administration of alcohol raises HDL con- centrations in man under metabolic ward conditions. In the current study all of the patients showed a rise in HDL- CH, and the increase for the whole group was statistically significant. Most patients also had a small increase in HDL- TG. Thus, despite the fact that alcohol raised triglyc- erides, which usually is associated with decrease in HDL- CH, there was instead a definite and paradoxical increase in HDL-CH. The mechanism for this rise in HDL-CH induced by alcohol remains to be determined.
Cholesterol metabolism. Studies in experimental animals suggest that alcohol has a variety of effects on cholesterol metabolism (41), but we know of only one previous study on effects of alcohol on cholesterol metabolism in man; in this study (1 5), three hypertriglyceridemic and four normolipidemic individuals were investigated during a control period and during a period in which ethanol (about 37% of calories) was substituted for carbohydrate or fat. In these patients there was no consistent effect on synthesis or excretion of cholesterol, except that the pro- portion of steroid excreted as bile acids increased during alcohol feeding in the three hyperlipidemic subjects.
CONCLUSIONS
In summary, this investigation defines certain differ- ences in the metabolic response to alcohol that appeared
494 Journal of Lipid Research Volume 25, 1984
by guest, on Septem
ber 5, 2018w
ww
.jlr.orgD
ownloaded from

to be related to body weight. Overweight individuals re- sponded to alcohol feeding by increasing their body weight, by transient increases in VLDL-TG levels, and by an increase in VLDL-TG production. Concomitantly, these individuals had a reduction in clearance of chylo- micron-TG that was most likely the result of competition for LPL with VLDL-TG rather than a reduction in LPL. These metabolic responses of the obese were not noted in lean individuals who did not gain weight when fed alcohol and in whom metabolism of triglyceride-rich li- poproteins was unaffected. In spite of the rise in TG levels in overweight individuals, alcohol feeding caused a paradoxical increase in levels of HDL-CH in overweight as well as in lean subjects. Alcohol feeding resulted in no changes in levels of LDL-CH, although we cannot rule out the possibility of an increased flux of LDL. Further- more, we could not detect changes in the metabolism of either cholesterol or bile acids, and alcohol feeding did not cause a tendency for increased saturation of gall- bladder bile. This study suggests that the most adverse metabolic effects of alcohol are in obese subjects, who already are at increased risk in other ways.l The authors express their appreciation to the Nursing and Die- tetic Services of the Special Diagnostic Unit of the Veterans Administration Medical Center, San Diego, CA. We acknowledge the excellent technical support ofJanna Naylor, Elliott Groszek, Susan Butler, Michael Gardner, Lynne Lesh, and Marjorie Whelan. This work was supported by the Veterans Adminis- tration and grants HL-1497 and AM-16667, NIH/HDS/DHHS. Dr. Grundy was a Medical Investigator and Dr. Crouse was a Research Associate of the Veterans Administration. Manuscript received 30 August 1983.
REFERENCES
1.
2.
3.
4.
5.
6.
Ginsberg, H., J. Olefsky, J. W. Farquhar, and G. M. Reaven. 1974. Moderate ethanol ingestion and plasma triglyceride levels. A study in normal and hypertriglyceridemic persons. Ann. Intern. Med. 80: 143-149. Wood, R. D., M. P. Stern, and A. Silvers. 1972. Prevalence of plasma lipoprotein abnormalities in a free-living popu- lation of the central valley, California. Circulation. 45: 121- 125. Mendelson, J. H., and N. K. Mello. 1974. Significance of alcohol-induced hypertriglyceridemia in patients with type IV hyperlipoproteinemia. Ann. Intern. Med. 8 0 270-271. Leiber, C. S., D. P. Jones, J. Mendelson, and L. M. DeCarli. 1963. Fatty liver, hyperlipidemia, and hyperuricemia pro- duced by prolonged alcohol consumption, despite adequate dietary intake. Trans. Assoc. Am. Physicians. 7 6 289-300. Schapiro, R. H., R. I. Scheig, G. D. Grummey, J. H. Men- delson, and K. H. Isselbacker. 1965. Effect of prolonged ethanol ingestion on the transport and metabolism of lipids in man. N. Engl. J . Med. 272: 610-615. Losowsky, M. S., D. P. Jones, C. S. Davidson, and C. S. Lieber. 1963. Studies of alcoholic hyperlipemia and its mechanism. Am. J. Med. 35: 794-803.
7.
8.
9.
10.
11.
12.
13.
14.
15.
16.
17.
18.
19.
Scheig, R. 1971. Lipid synthesis from ethanol in liver. Gas- troenterology. 6 0 751. Belfrage, P., B. Berg, I. Hagerstrand, P. Nilsson-Ehle, H. Turnqvist, and T. Wiebe. 1977. Alterations of lipid me- tabolism in healthy volunteers during long-term ethanol intake. Eur. J . Clin. Invest. 7: 127- 1 3 1. Ostrander, L. D., Jr., D. E. Lamphiear, W. D. Block, B. C. Johnson, C. Ravenscroft, and F. H. Epstein. 1974. Re- lationship of serum concentrations to alcohol consumption. Arch. Intern. Med. 134: 451-456. Castelli, W. P., T. Gordon, M. C. Hjortland, A. Kagan, J. T. Doyle, C. G. Hames, S. B. Julley, and W. J. Zukel. 1977. Alcohol and blood lipids. The cooperative lipoprotein phenotyping study. Lancet 2: 153-1 55. Heiss, G., N. J. Johnson, S. Reiland, C. E. Davis, and H. A. Tyroler. 1980. The epidemiology of plasma high- density lipoprotein cholesterol levels. The Lipid Research Clinics Program Prevalence Study. Circulation. 62(suppl IV):
Barrett-Connor, E., and L. Suarez. 1982. A community study of alcohol and other factors associated with the dis- tribution of high density lipoprotein cholesterol in older vs. younger men. Am. J. Epidemiol. 115 888-893. Nestel, P. J., and E. Z. Hirsch. 1965. Mechanism of alcohol- induced hypertriglyceridemia. J. Lab. Clin. Med. 6 6 357- 365. Wolfe, B. M., J. R. Havel, E. B. Marlis, J. P. Kane, J. Sey- mour, and S. P. Ahuja. 1976. Effects of a 3-day fast and of ethanol on splanchnic metabolism of FFA, amino acids, and carbohydrates in healthy young men. J . Clin. Invest.
Nestel, P. J., L. A., Simons, and Y. Homma. 1976. Effects of ethanol on bile acid and cholesterol metabolism. Am. J . Clin. Nutr. 2 9 1007-1015. Beil, U., S. M. Grundy, J. R. Crouse, and L. Zech. 1982. Triglyceride and cholesterol metabolism in primary hy- pertriglyceridemia. Arteriosclerosis. 2: 44-57. Pirola, R. C., and C. S. Lieber. 1972. The energy cost of the metabolism of drugs, including ethanol. Pharmacology.
Crouse, J. R., and S. M. Grundy. 1978. Evaluation of a continuous isotope feeding method for measurement of cholesterol absorption in man. J . Lipid Res. 1 9 967-97 1. Miettinen, T. A., E. H. Ahrens, Jr., and S. M. Grundy. 1965. Quantitative isolation and gas-liquid chromato- graphic analysis of total dietary and fecal neutral steroids. 1. Lipid Res. 6: 41 1-424.
1 16-1 36.
57: 329-340.
7: 185-196.
20. krundy, S. M., E. H. Ahrens, Jr., and T. A. Miettinen. 1965. Quantitative isolation and gas-liquid chromato- graphic analysis of total fecal bile acids.]. Lipid Res. 6: 397- 410.
21. Grundy, S. M., E. H. Ahrens, Jr., and G. Salen. 1968. Dietary p-sitosterol as an internal standard to correct for cholesterol losses in sterol balance studies. J. Lipid Res. 9
22. Davignon, J., W. J. Simmonds, and E. H. Ahrens, Jr. 1968. Usefulness of chromic oxide as an internal standard for balance studies in formula-fed patients and for assessment of caloric function. J . Clin. Invest. 47: 127-1 38.
23. Block, W. D., K. J. Jarrett, and J. B. Levine. 1965. Use of a single color reagent to improve the automated deter- mination of serum total cholesterol. I n Automation in An- alytical Chemistry, Mediad Inc., New York, 345-347.
24. Kessler, G., and H. Lederer. 1965. Fluorometric measure-
374-387.
Crouse and Grundy Alcohol and lipids 495
by guest, on Septem
ber 5, 2018w
ww
.jlr.orgD
ownloaded from
ment of triglycerides. In Automation in Analytic Chemistry, Mediad Inc., New York. 341-344.
25. Manual of Laboratory Operations. 1974. Lipid Research Clinics Program. Lipid and Lipoprotein Analysis. Depart- ment of Health, Education, and Welfare Publication No.
26. Grundy, S. M., and H. Y. I. Mok. 1976. Chylomicron clear- ance in normal and hyperlipidemic man. Metabolism. 25:
27. Baginsky, M. L., and W. V. Brown. 1979. A new method for the measurement of lipoprotein lipase in postheparin plasma using sodium dodecyl sulfate for the inactivation of hepatic triglyceride lipase. J. Lipid Res. 2 0 548-556.
28. Mok, H. Y. I., K. von Bergmann, J. R. Crouse, and S. M. Grundy. 1979. Biliary lipid metabolism in obesity. Effects of bile acid feeding before and during weight reduction. Gastroenterology. 76: 556-567.
29. Carey, M. C., and D. M. Small. 1978. The physical chemistry of cholesterol solubility in bi1e.J. Clin. Invest. 61: 998-1026.
30. Rubini, M. E., C. R. Kluman, and E. Lamdin. 1955. Studies on alcohol diuresis. I. T h e effect of ethyl alcohol ingestion on water, electrolyte, and acid-base metabolism. J. Clin. Invest. 34: 439-447.
31. Ogata, M., J. H. Mendelson, and N. K. Mello. 1968. Elec- trolytes and osmolality in alcoholics during experimentally induced intoxication. Psychosom. Med. 3 0 453-488.
32. Frederick, A,, and M. D. Klipstein. 1970. Recent advances in tropical malabsorption. Scand. J . Gastroenterol. 5(suppl. 6): 93-114.
33. Thomson, A. D., H. Bakar, and C. M. Levy. 1970. Patterns
(NI H)7 5-628.
1225-1239.
of '%-thiamine hydrochloride absorption in the malnour- ished alcoholic patient. J. Lab. Clin. Med. 7 6 34-45.
34. Halstead, C. H. E., E. A. Rolsler, and E. Mezey. 1971. Decreased jejunal uptake of labeled folic acid ('H-PGA) in alcoholic patients. Roles of alcohol and nutrition. N. Engf. J. Med. 285: 701-706.
35. Mezey, E. 1975. Intestinal function in chronic alcoholism. Ann. NY Acad. Sci. 252: 215-227.
36. Lindenbaum, J,, and C. S. Lieber. 1975. Effects of chronic ethanol administration on intestinal absorption in man in the absence of nutritional deficiency. Ann. NY Acad. Sci.
37. Israel, Y., L. Videla, and J. Bernstein. 1975. Liver hyper- metabolic state after chronic ethanol consumption: hor- monal interrelations and pathogenic implications. Federation
38. Baraona, E., and C. S. Lieber. 1979. Effects of ethanol on lipid metabolism. J . Lipid Res. 2 0 289-3 15.
39. Taskinen, M. R., M. Valimaki, E. A. Nikkila, T. Kuusi, C. Ehnholm, and R. Ylikahri. 1982. High density lipoprotein subfractions and postheparin plasma lipases in alcoholic men before and after ethanol withdrawal. Metabolism. 31: 1168- 1174.
40. Brunzell, J. D., W. R. Hazard , D. Porte, Jr., and E. L. Bierman. 1973. Evidence for a common, saturable triglyc- eride removal mechanism for chylomicrons and very low density lipoproteins in man.]. Clin. Invest. 52: 1578-1585.
41. Rudel, L. L., C. W. Leathers, M. G. Bond, and B. C. Bullock. 198 1 . Dietary ethanol-induced modifications in hyperli- poproteinemia and atherosclerosis in nonhuman primates (Macaca nemestrina). Arteriosclerosis. 1: 144-1 55.
252: 228-234.
PYOC. 34: 2052-2059.
496 Journal of Lipid Research Volume 25, 1984
by guest, on Septem
ber 5, 2018w
ww
.jlr.orgD
ownloaded from