Effective Communications - XLSTAT · To return to previous slide, right click (in presentation...
91
Effective Communications Wilma Andrews, Virginia Commonwealth University
Transcript of Effective Communications - XLSTAT · To return to previous slide, right click (in presentation...
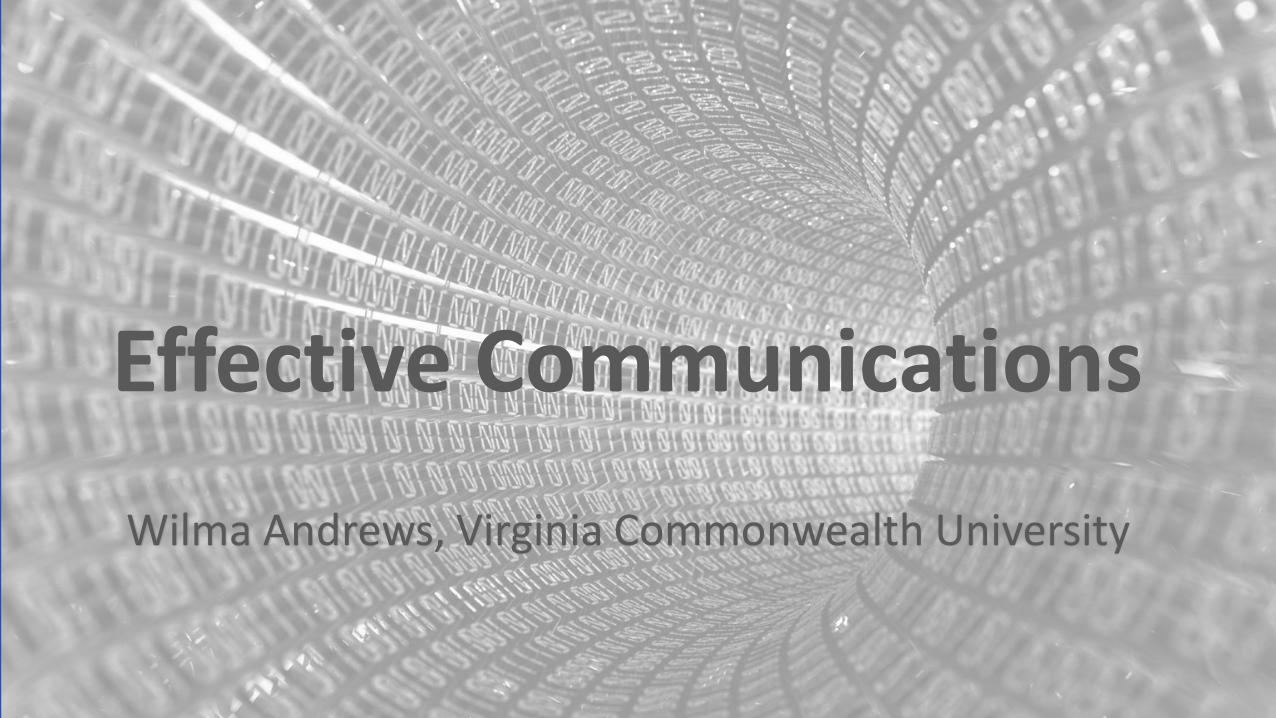
Effective Communications
Wilma Andrews, Virginia Commonwealth University

Statisticians
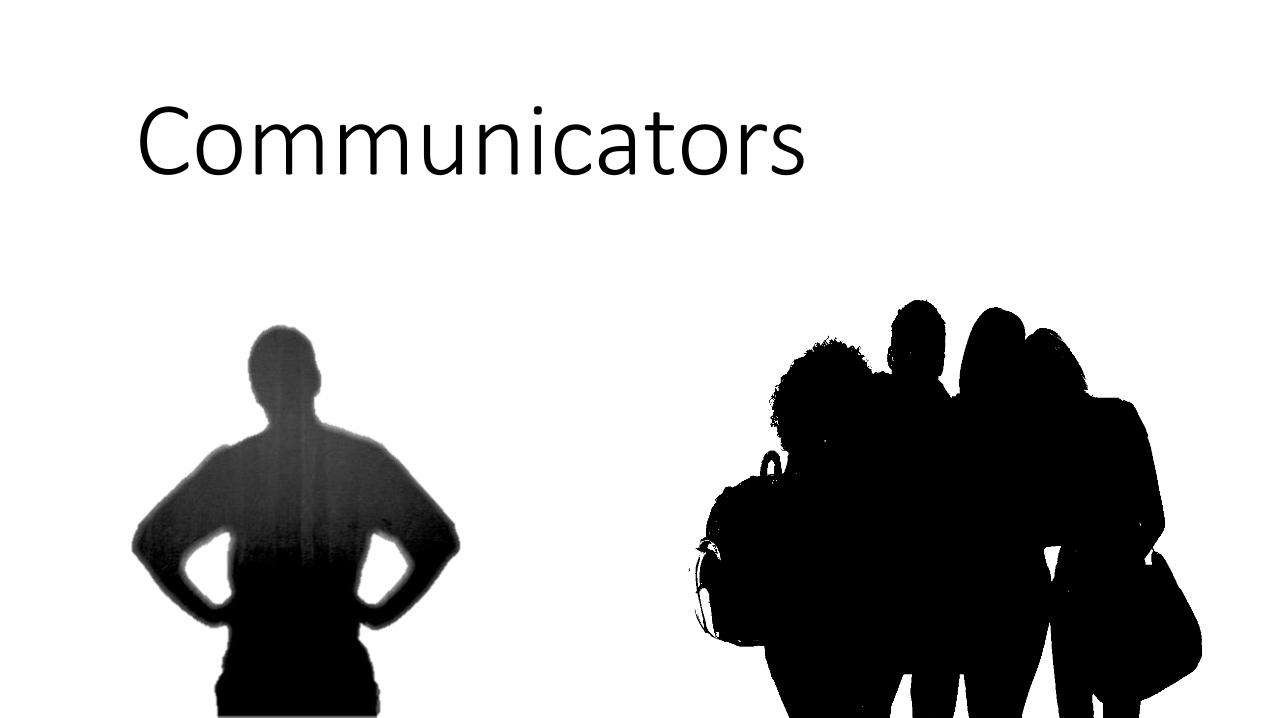
Communicators
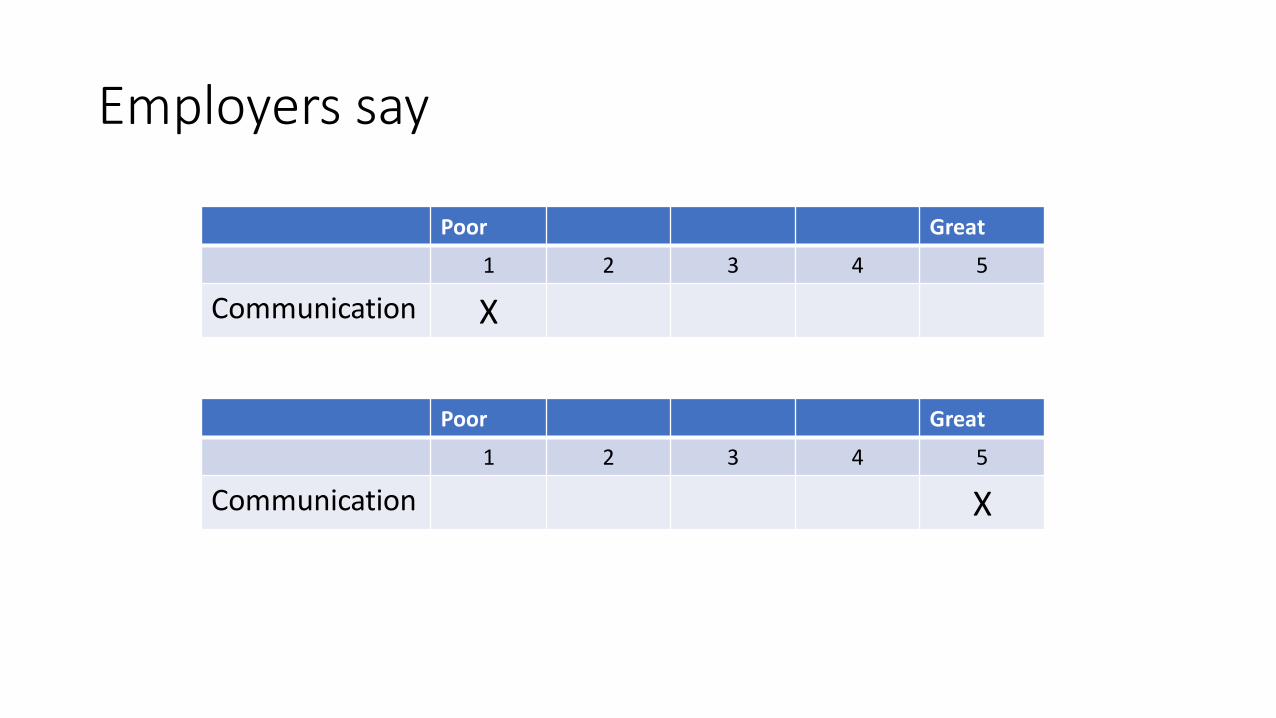
Employers say
Poor Great
1 2 3 4 5
Communication X
Poor Great
1 2 3 4 5
Communication X
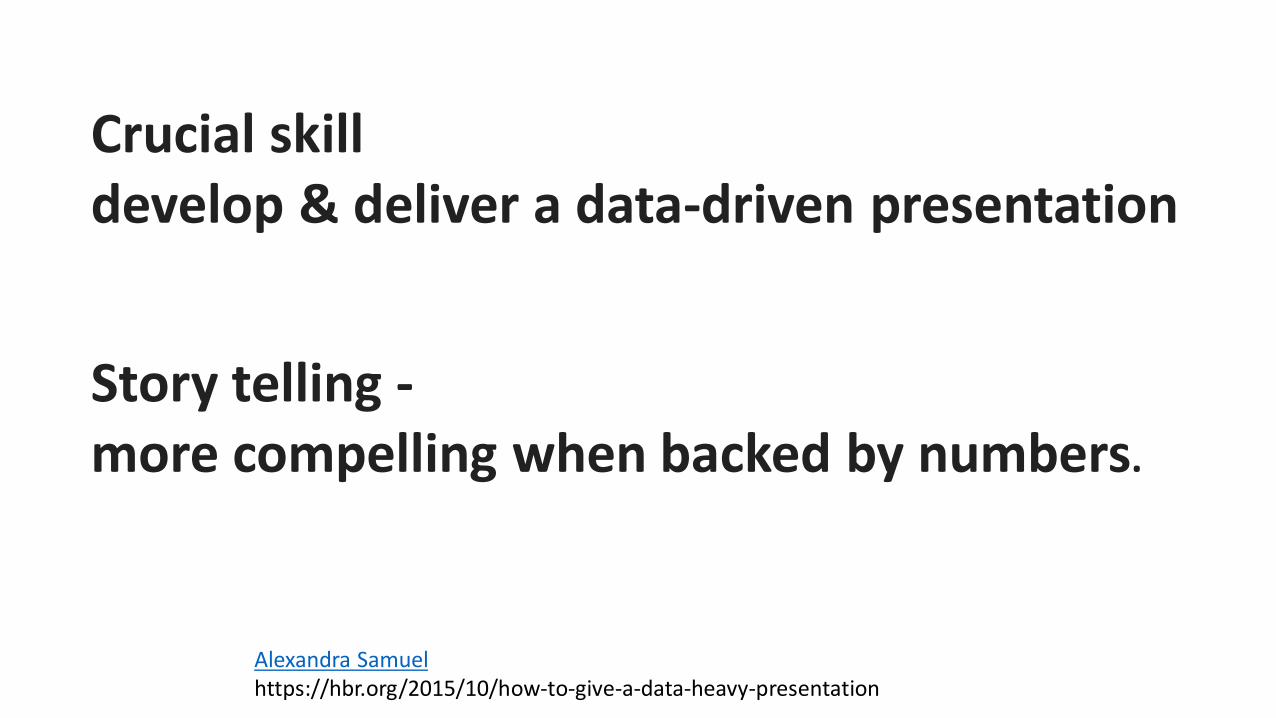
Alexandra Samuelhttps://hbr.org/2015/10/how-to-give-a-data-heavy-presentation
Crucial skilldevelop & deliver a data-driven presentation
Story telling -more compelling when backed by numbers.

Presentations
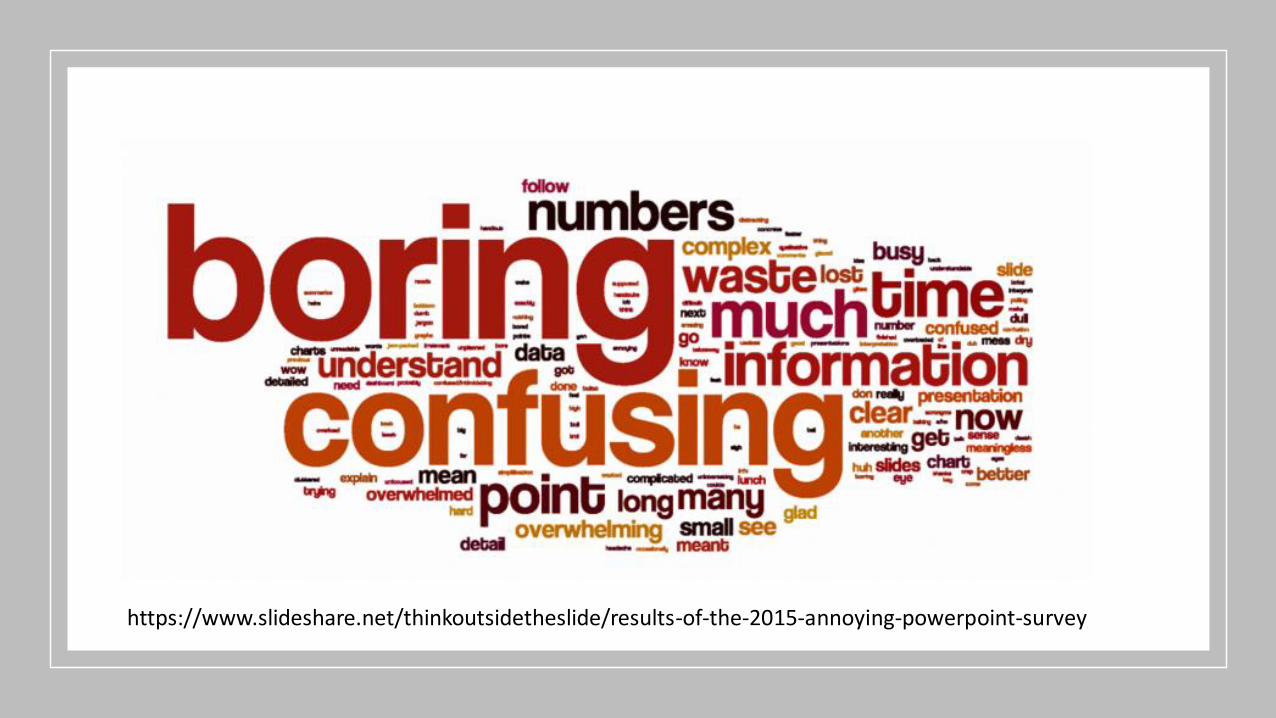
https://www.slideshare.net/thinkoutsidetheslide/results-of-the-2015-annoying-powerpoint-survey

Numbers overwhelm
https://www.slideshare.net/thinkoutsidetheslide/results-of-the-2015-annoying-powerpoint-survey
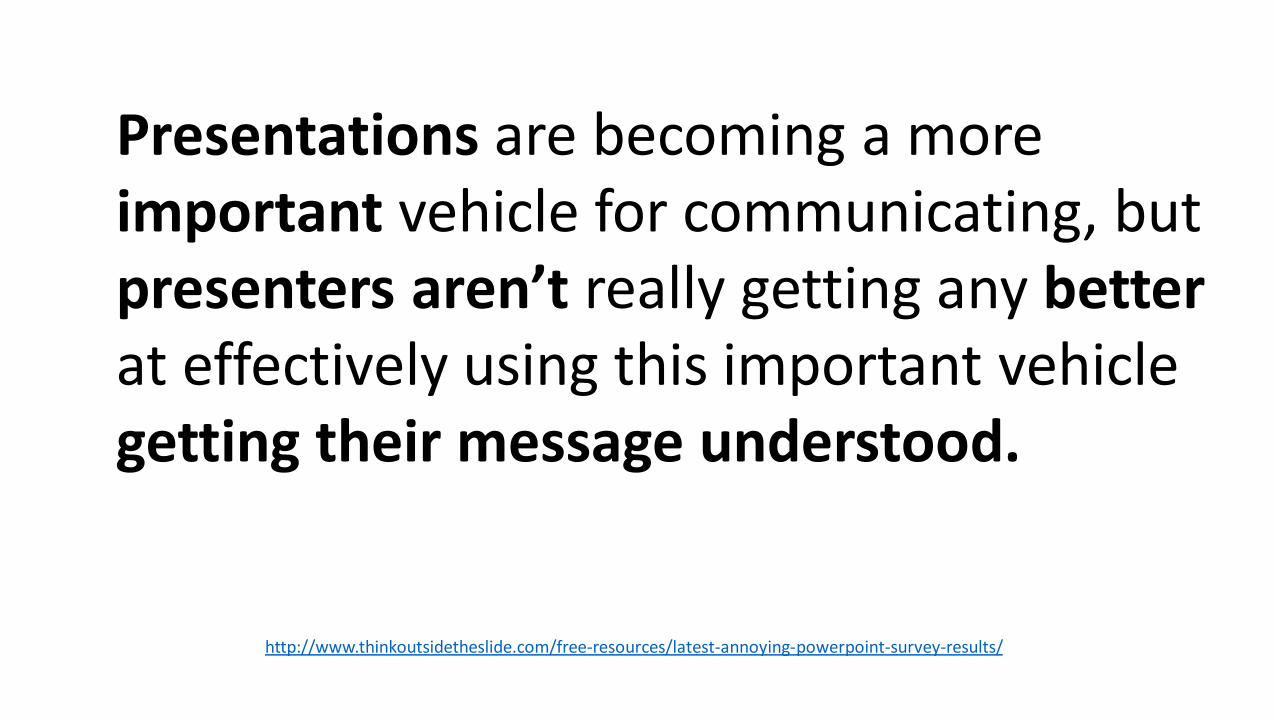
http://www.thinkoutsidetheslide.com/free-resources/latest-annoying-powerpoint-survey-results/
Presentations are becoming a more important vehicle for communicating, but presenters aren’t really getting any betterat effectively using this important vehicle getting their message understood.

Spreadsheets are for calculations not for communication.
Include as hidden slides if more info is needed. (Slide #_Enter)To return to previous slide, right click (in presentation mode) and click on V.
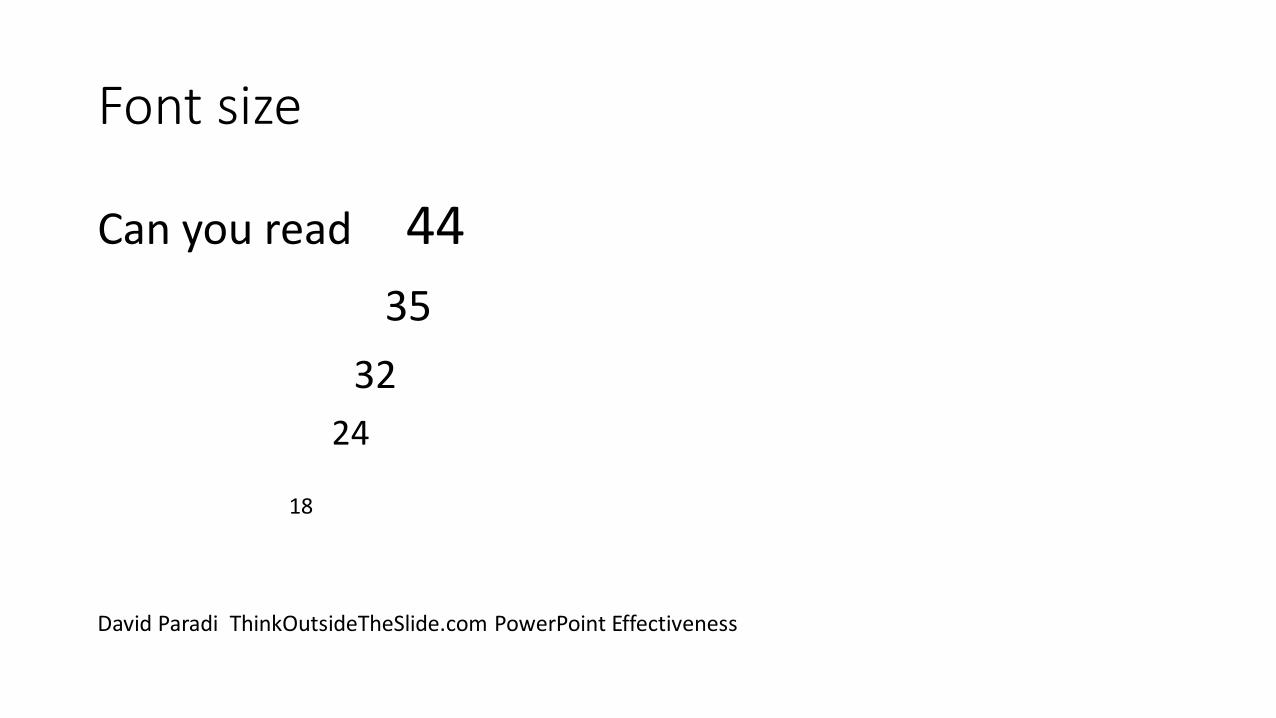
Font size
Can you read 44
35
32
24
18
David Paradi ThinkOutsideTheSlide.com PowerPoint Effectiveness
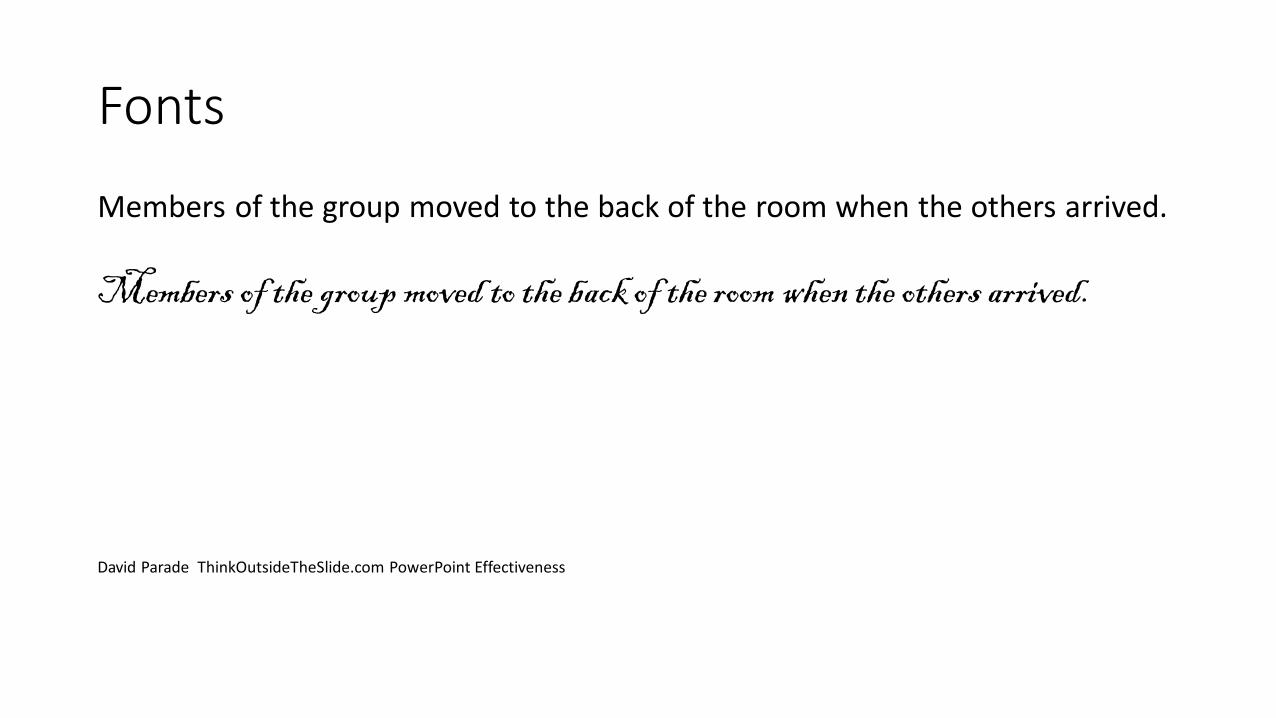
Fonts
Members of the group moved to the back of the room when the others arrived.
Members of the group moved to the back of the room when the others arrived.
David Parade ThinkOutsideTheSlide.com PowerPoint Effectiveness
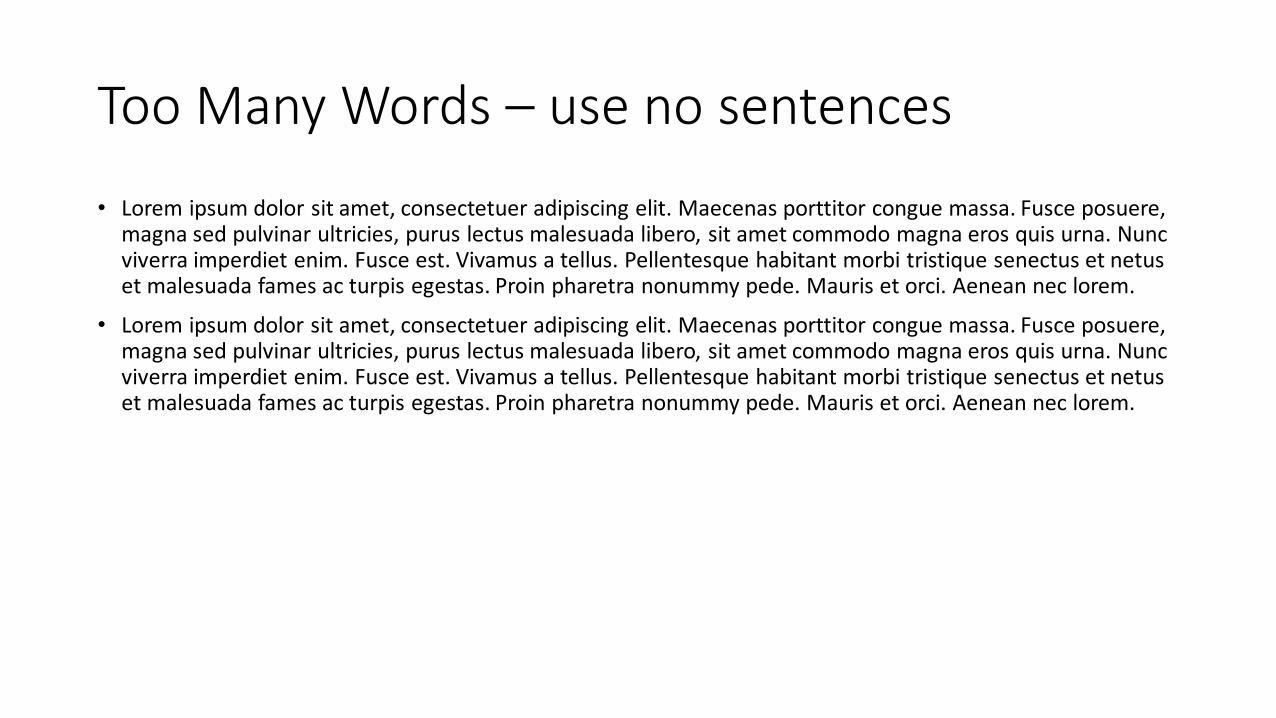
Too Many Words – use no sentences
• Lorem ipsum dolor sit amet, consectetuer adipiscing elit. Maecenas porttitor congue massa. Fusce posuere, magna sed pulvinar ultricies, purus lectus malesuada libero, sit amet commodo magna eros quis urna. Nuncviverra imperdiet enim. Fusce est. Vivamus a tellus. Pellentesque habitant morbi tristique senectus et netuset malesuada fames ac turpis egestas. Proin pharetra nonummy pede. Mauris et orci. Aenean nec lorem.
• Lorem ipsum dolor sit amet, consectetuer adipiscing elit. Maecenas porttitor congue massa. Fusce posuere, magna sed pulvinar ultricies, purus lectus malesuada libero, sit amet commodo magna eros quis urna. Nuncviverra imperdiet enim. Fusce est. Vivamus a tellus. Pellentesque habitant morbi tristique senectus et netuset malesuada fames ac turpis egestas. Proin pharetra nonummy pede. Mauris et orci. Aenean nec lorem.

Find Data
Analyze it
Pull together
Build Models
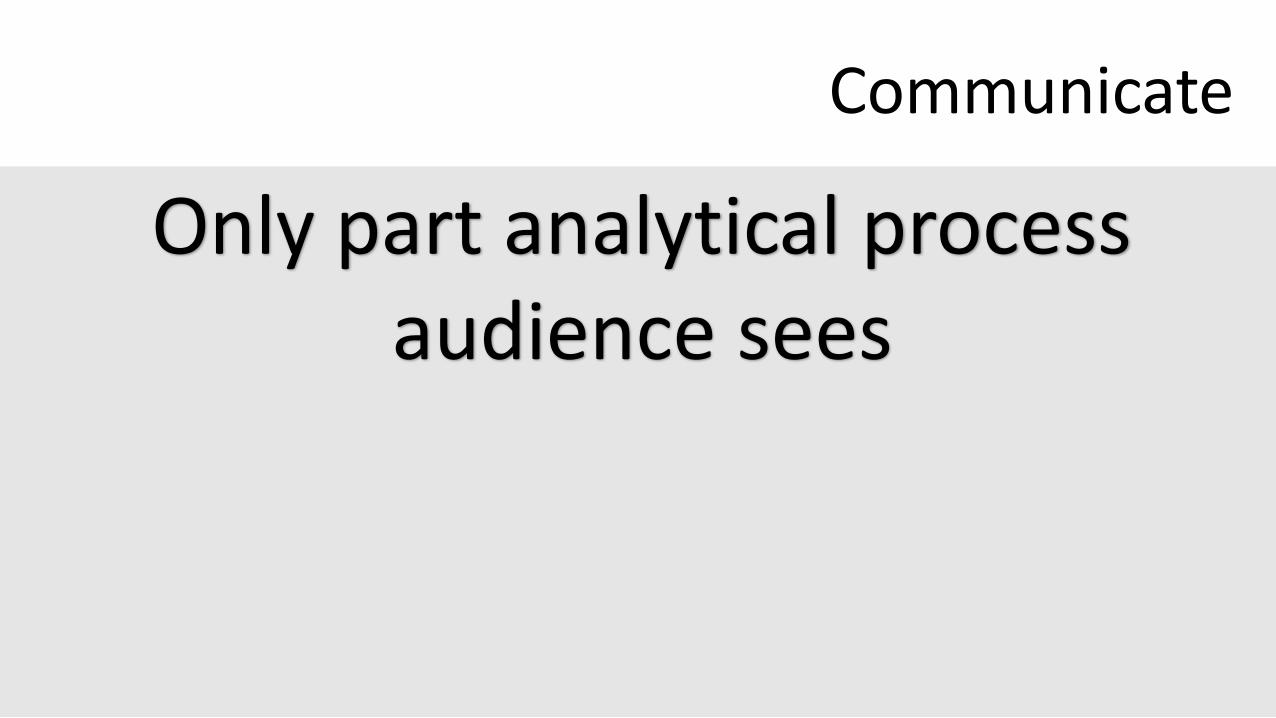
CommunicatePrepare presentation

Find Data
Analyze it
Pull together
Build Models
Communicate
Only part analytical process audience sees
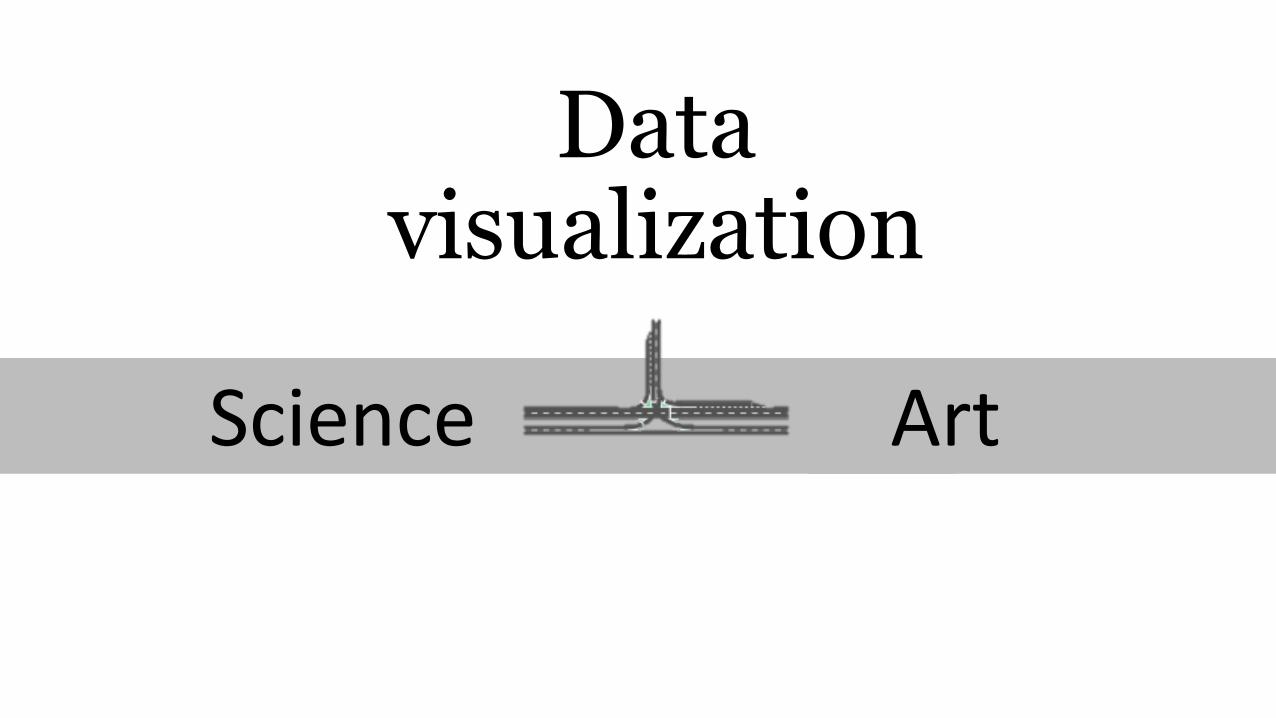
Science Art
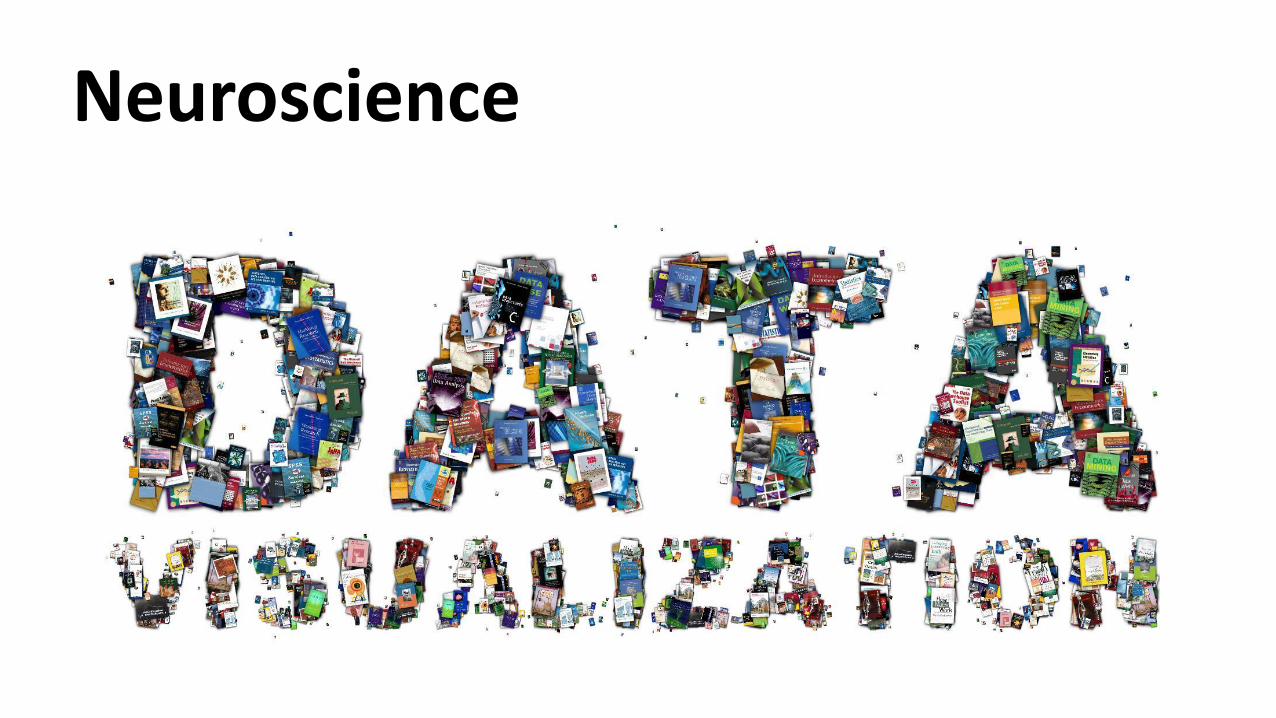
Datavisualization

Understand context
Exploratory vs explanatory


Know your audience


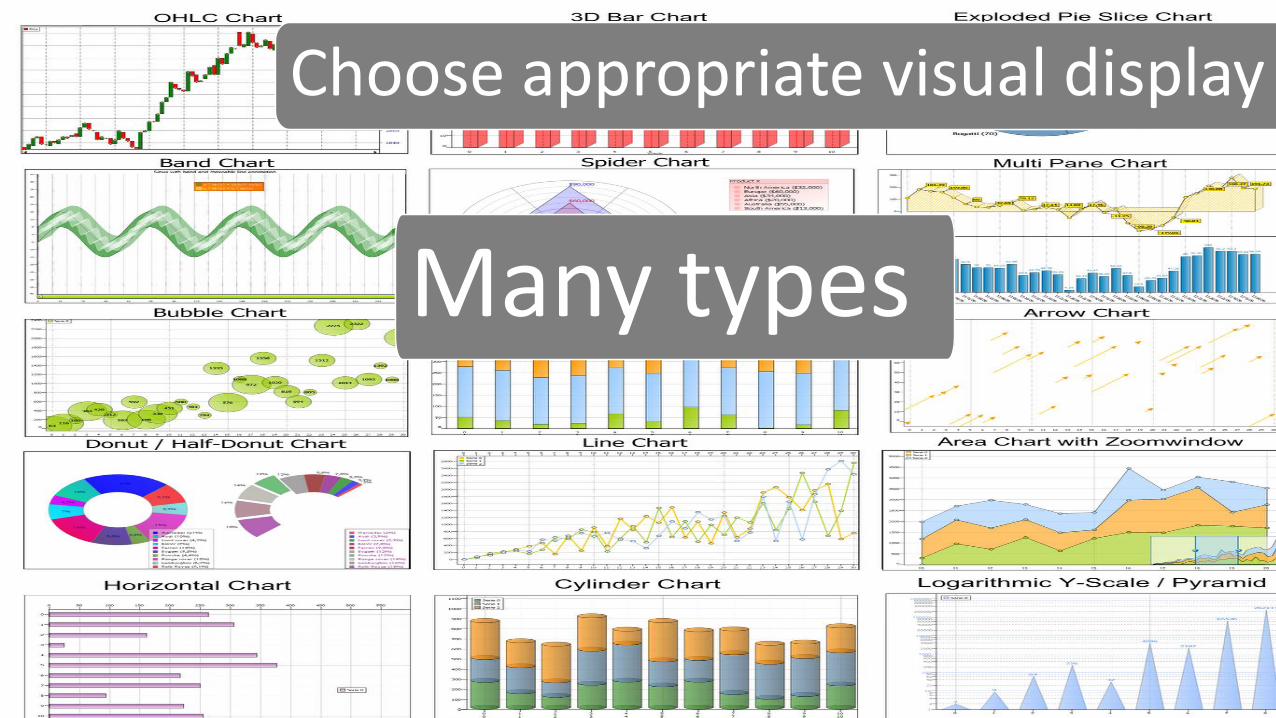
Choose appropriate visual display
Many types

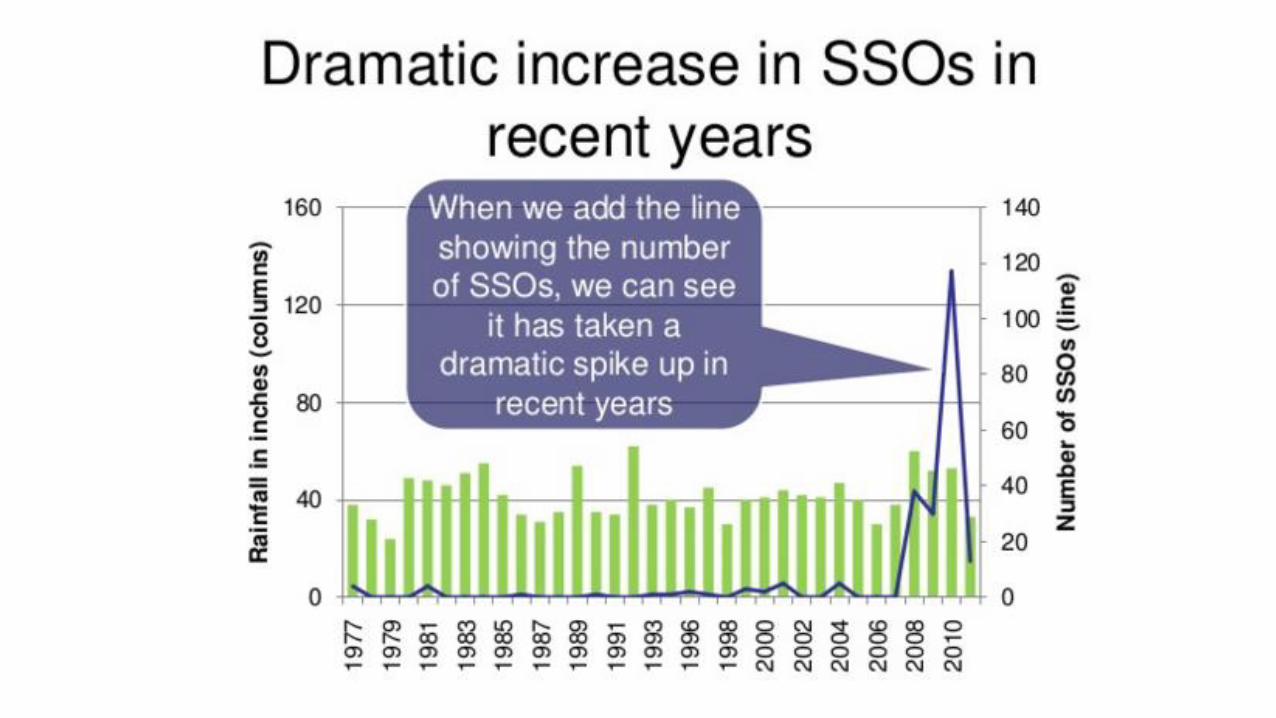
Charts to avoid
pie, donut, 3D

Eliminate clutter
Takes up brain power, causes confusion
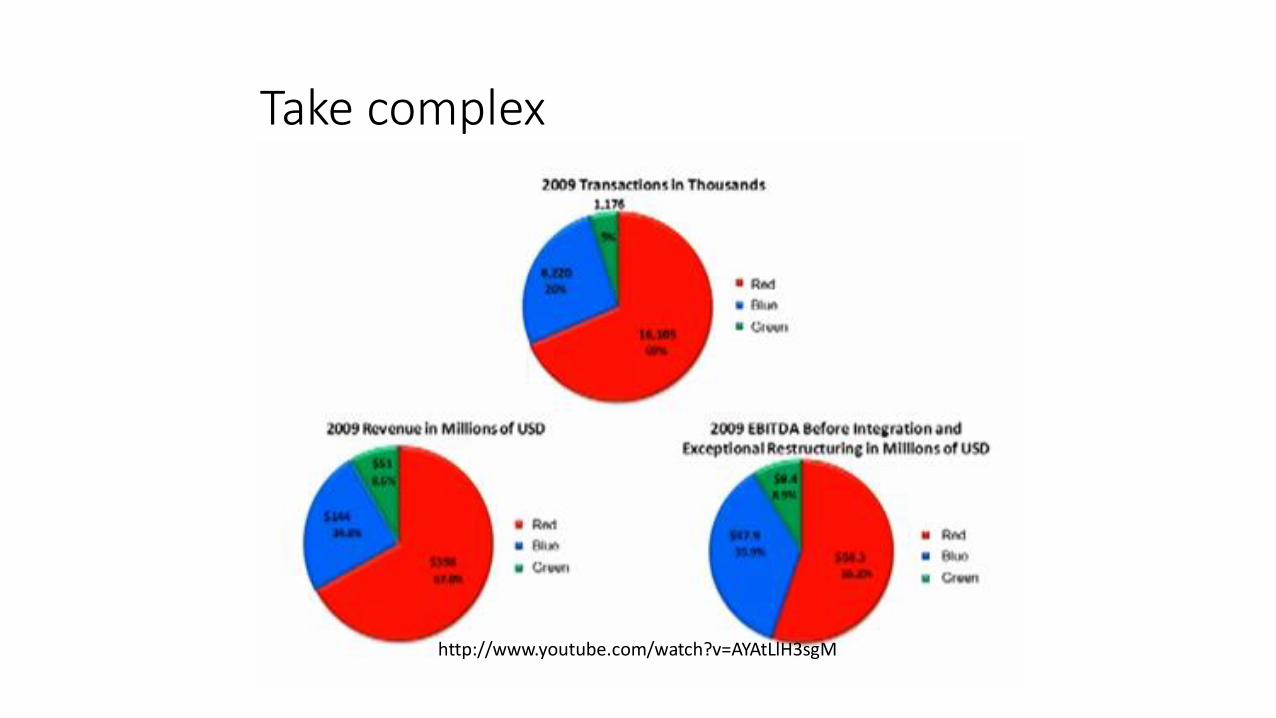
Take complex
http://www.youtube.com/watch?v=AYAtLlH3sgM
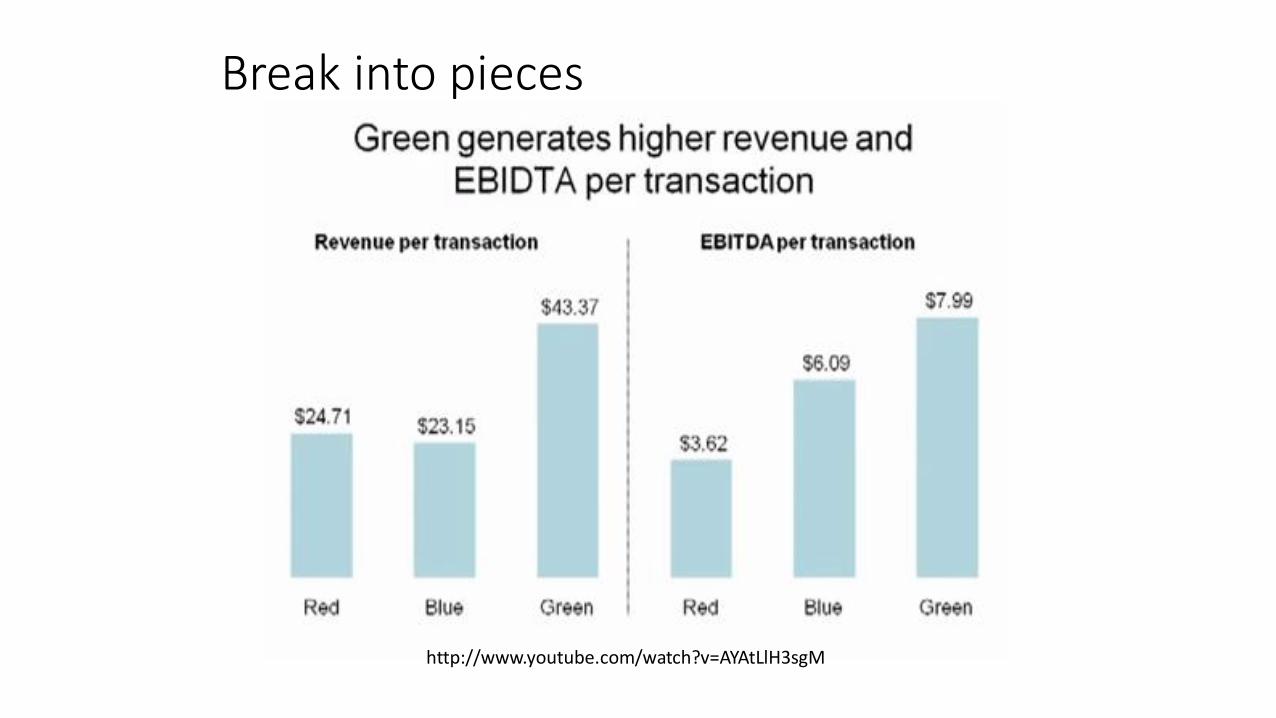
Break into pieces
http://www.youtube.com/watch?v=AYAtLlH3sgM

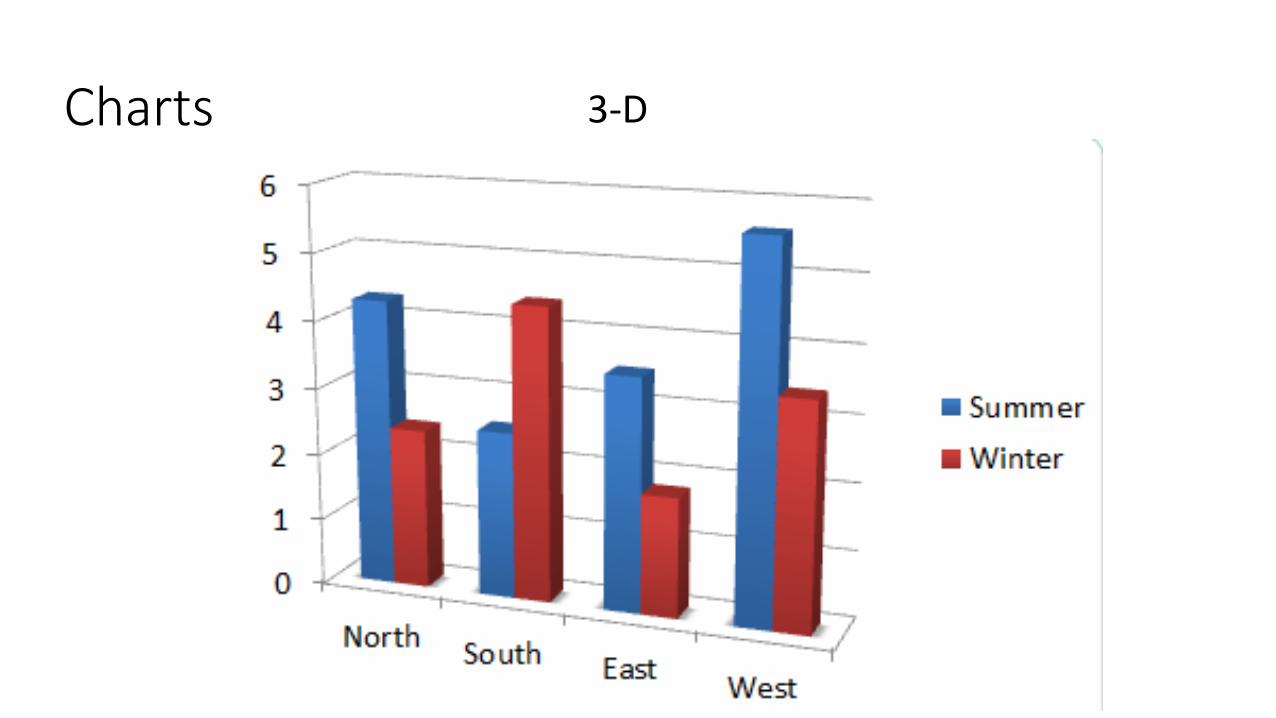
Charts 3-D
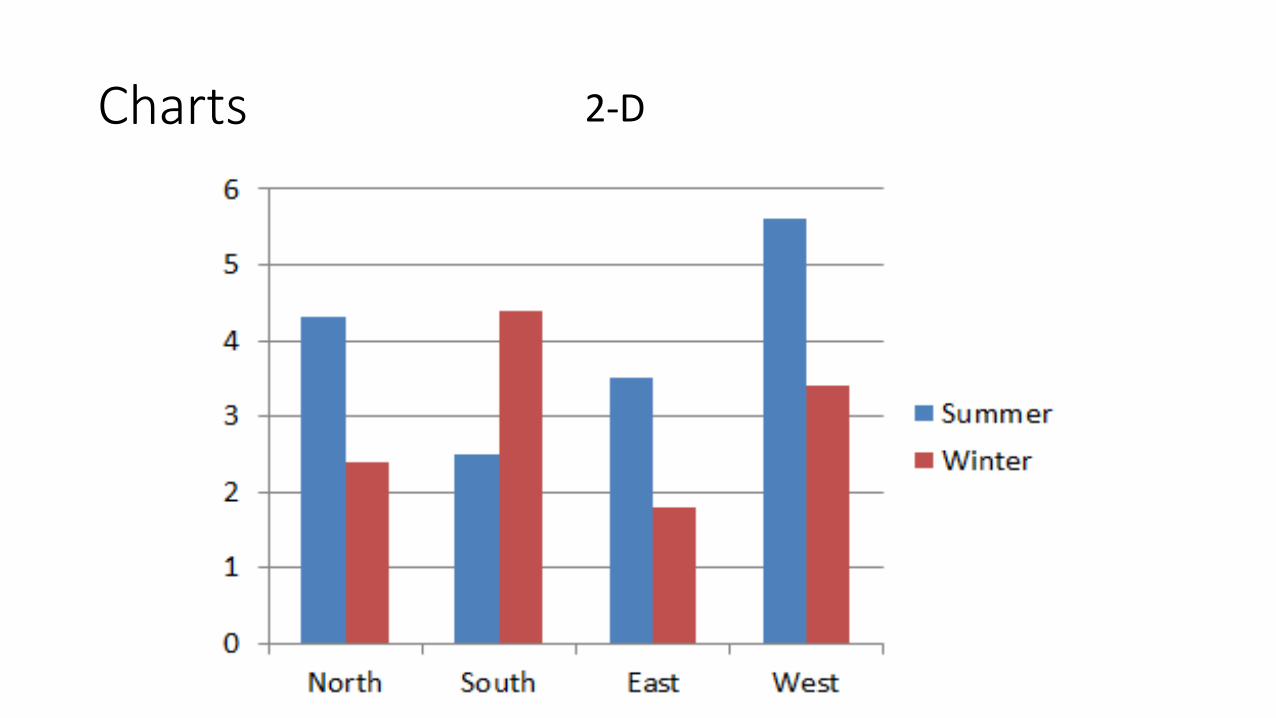
Charts 2-D

http://www.slideteam.net/default/blog/17-presentation-design-trends-to-look-out-for-in-2017/
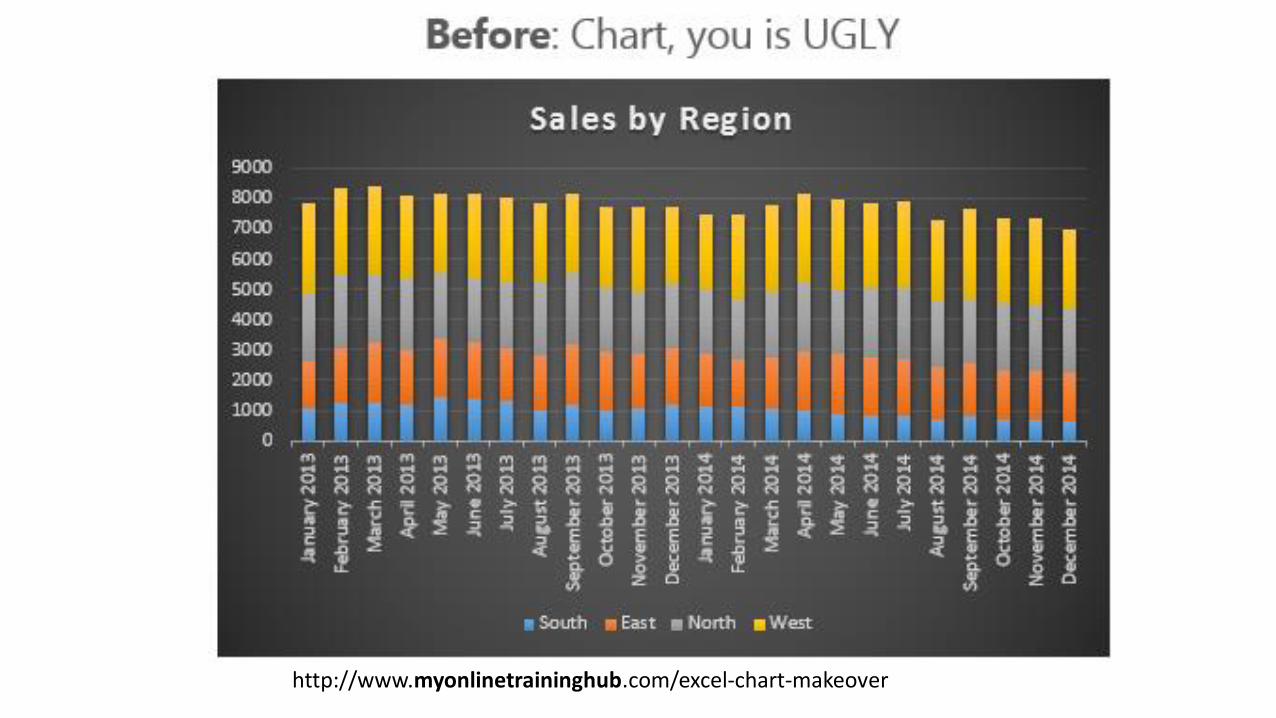
http://www.myonlinetraininghub.com/excel-chart-makeover
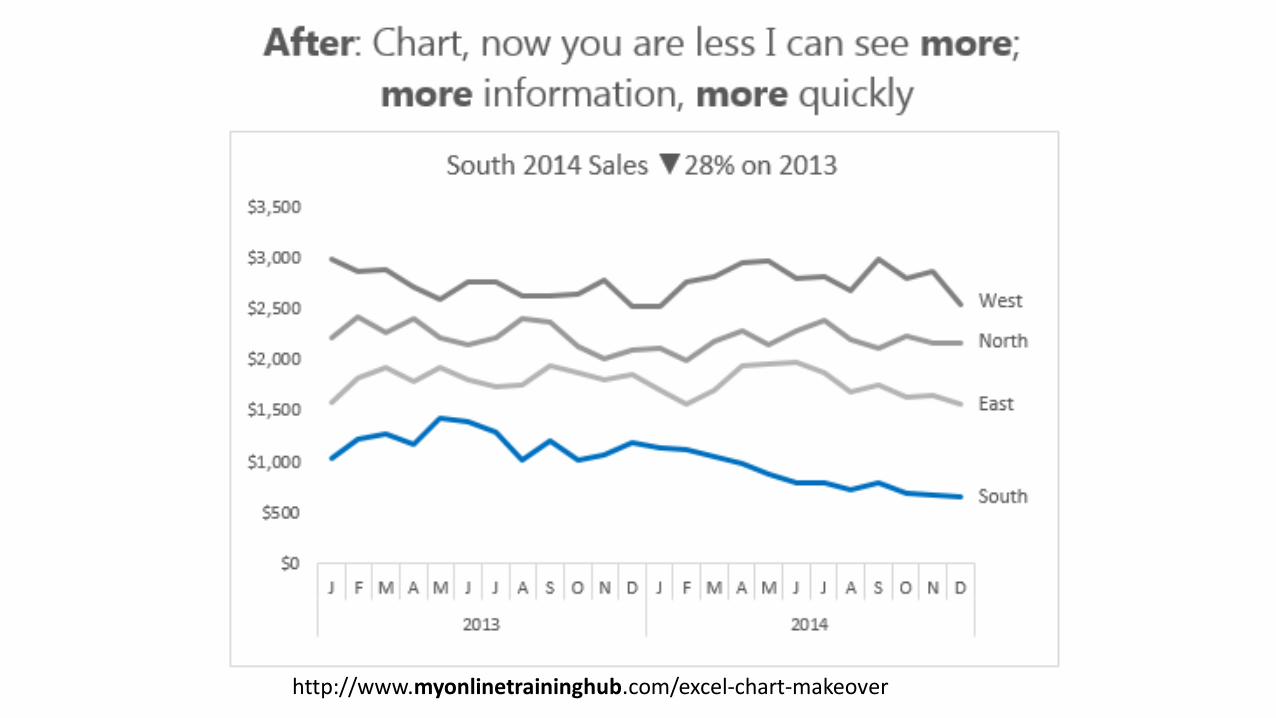
http://www.myonlinetraininghub.com/excel-chart-makeover

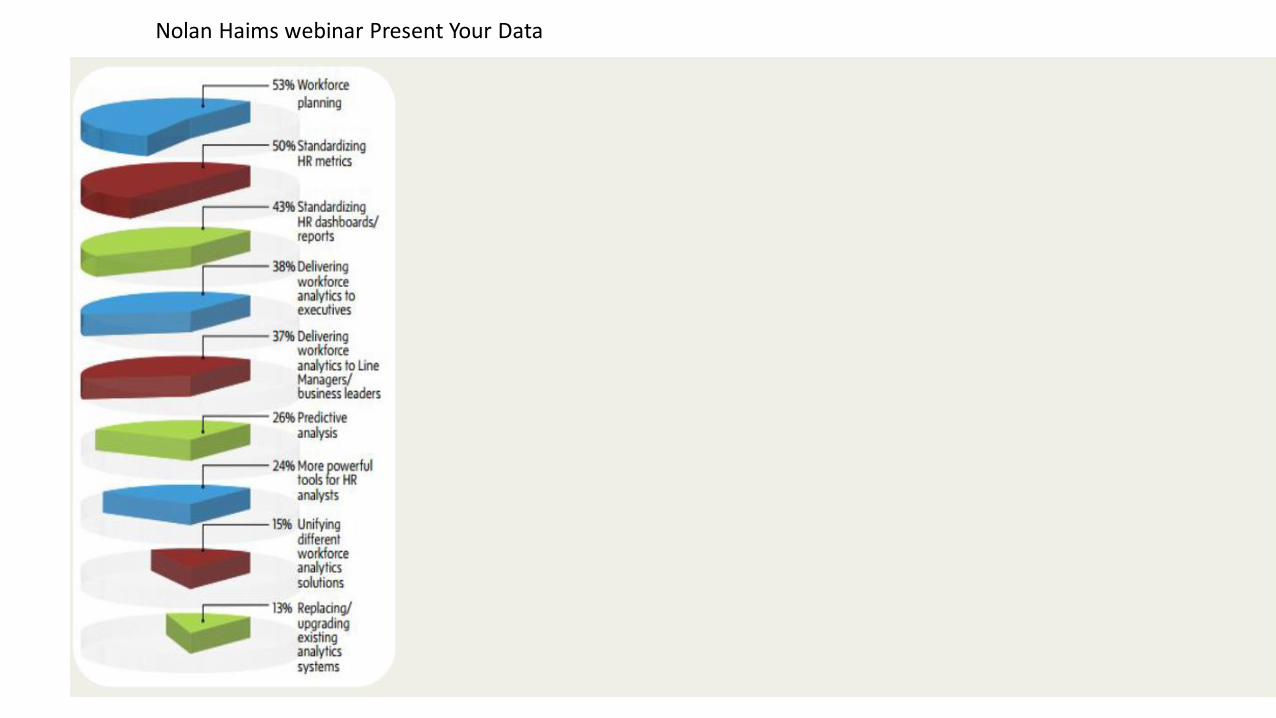
Nolan Haims webinar Present Your Data

Bar charts vs. column charts
Myonlinetraininghub.com

Collect Good/Bad Examples

Focus attention
How brain “works”
Neuroscience

http://www.billiondollargraphics.com/infographics.html

Look and listen
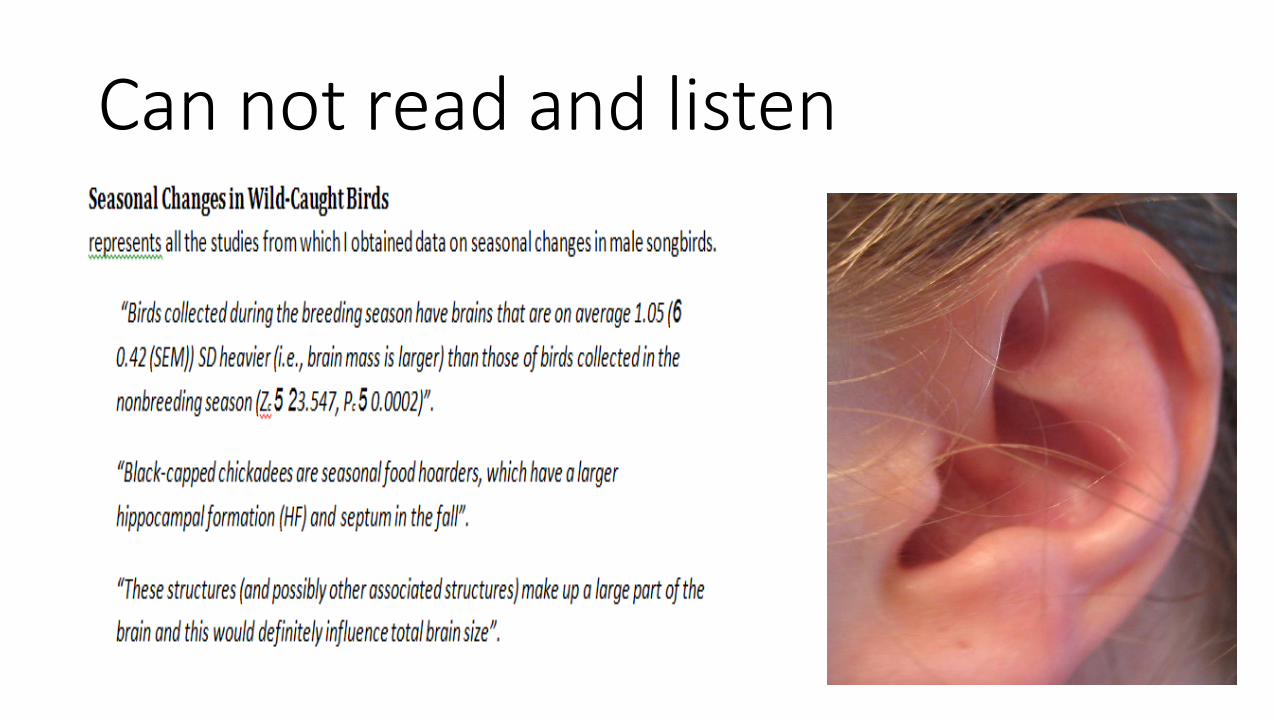
Can not read and listen

Choose appropriate visual display
Many types
avoid pie, donut, 3D
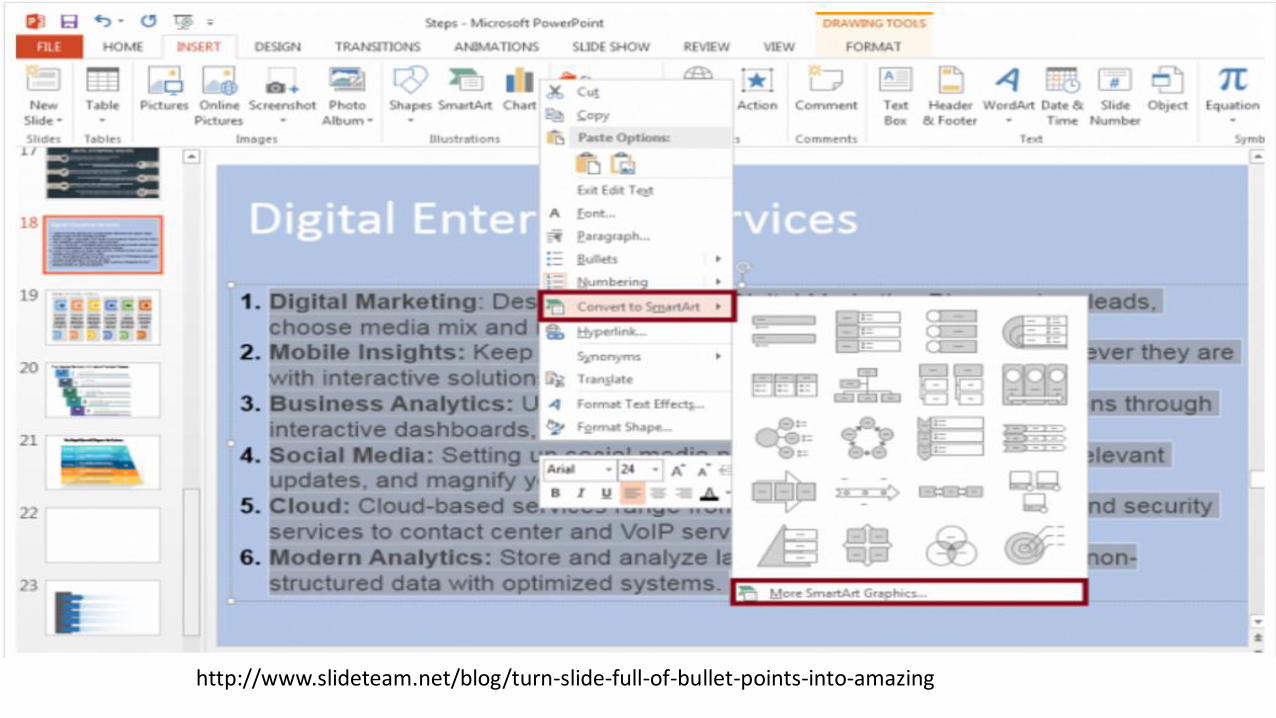
http://www.slideteam.net/blog/turn-slide-full-of-bullet-points-into-amazing

https://remotepossibilities.wordpress.com/2016/12/19/modern-presenting-3-secrets/
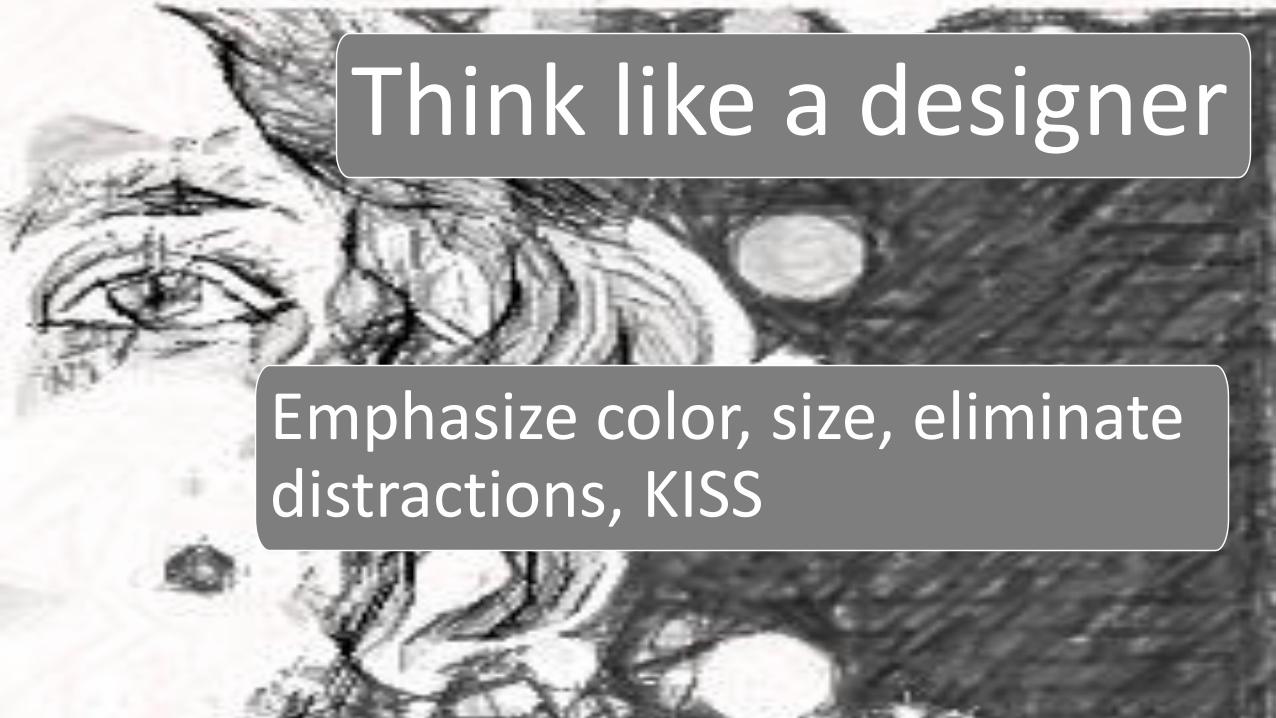
Think like a designer
Emphasize color, size, eliminate distractions, KISS
Nolan Haims – PresentYourStory.com
Nolan Haims – PresentYourStory.com
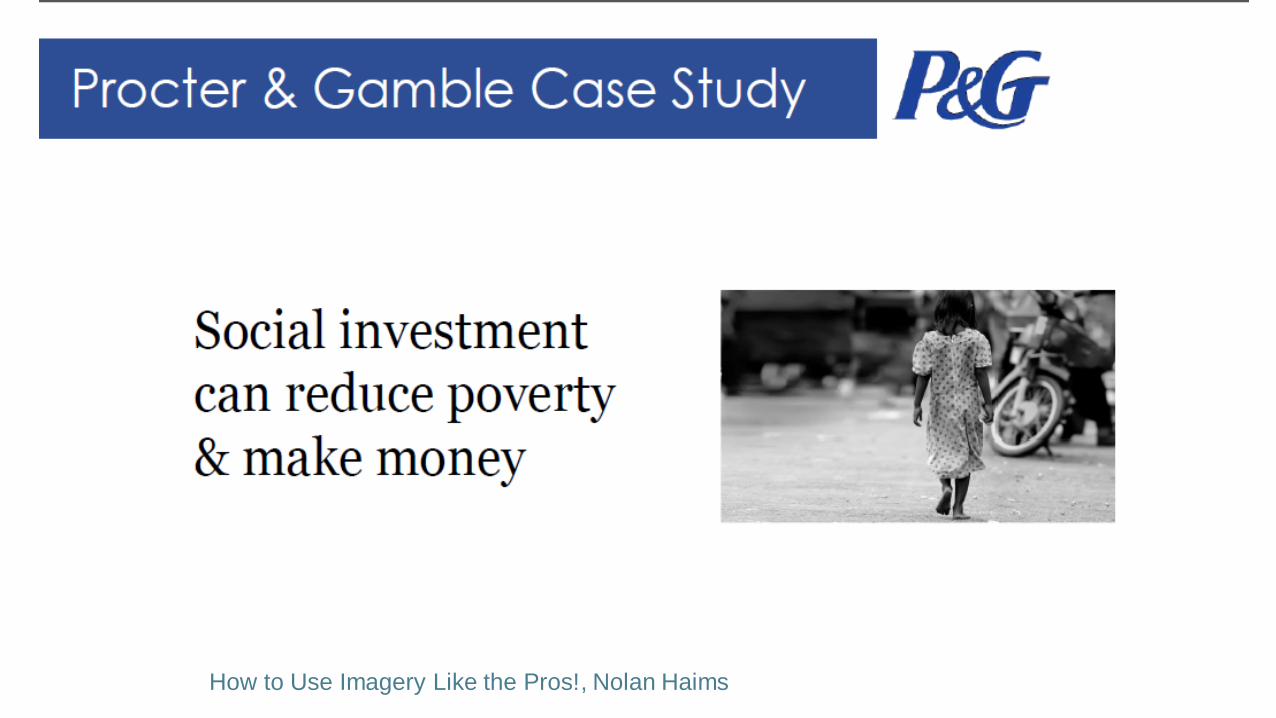
How to Use Imagery Like the Pros!, Nolan Haims

How to Use Imagery Like the Pros!, Nolan Haims

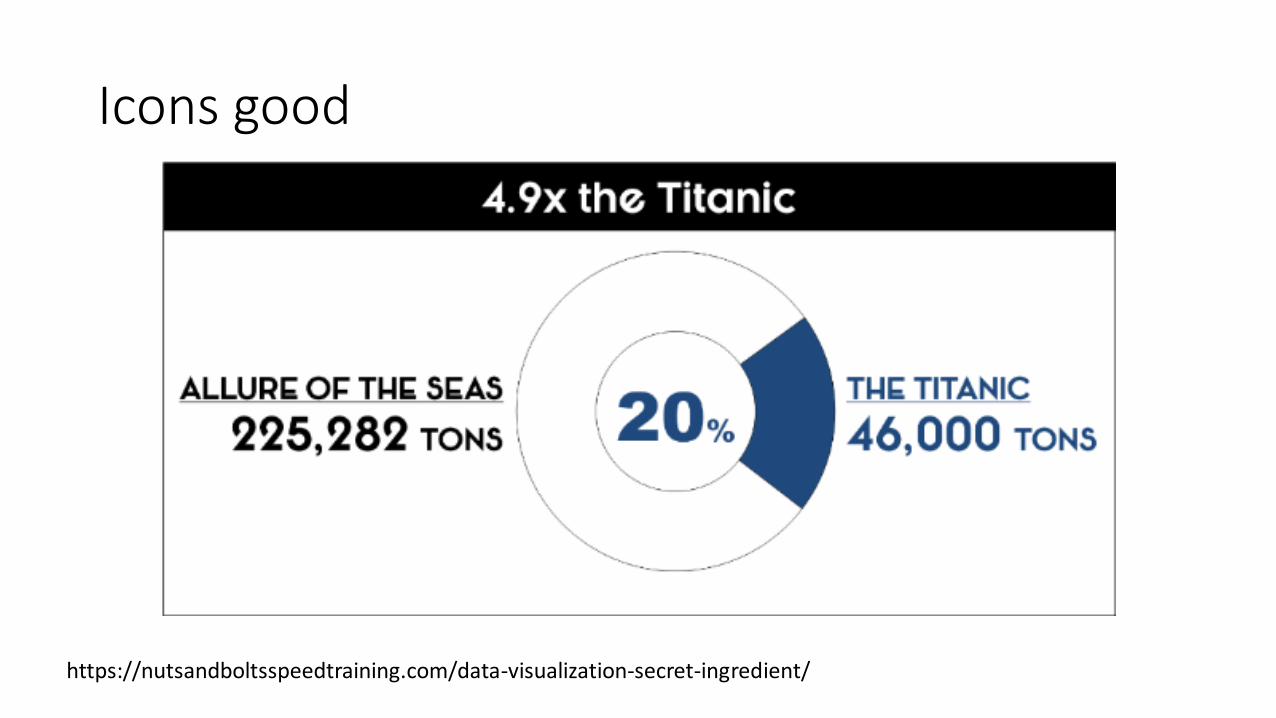
Icons good
https://nutsandboltsspeedtraining.com/data-visualization-secret-ingredient/

https://nutsandboltsspeedtraining.com/data-visualization-secret-ingredient


Tell a story

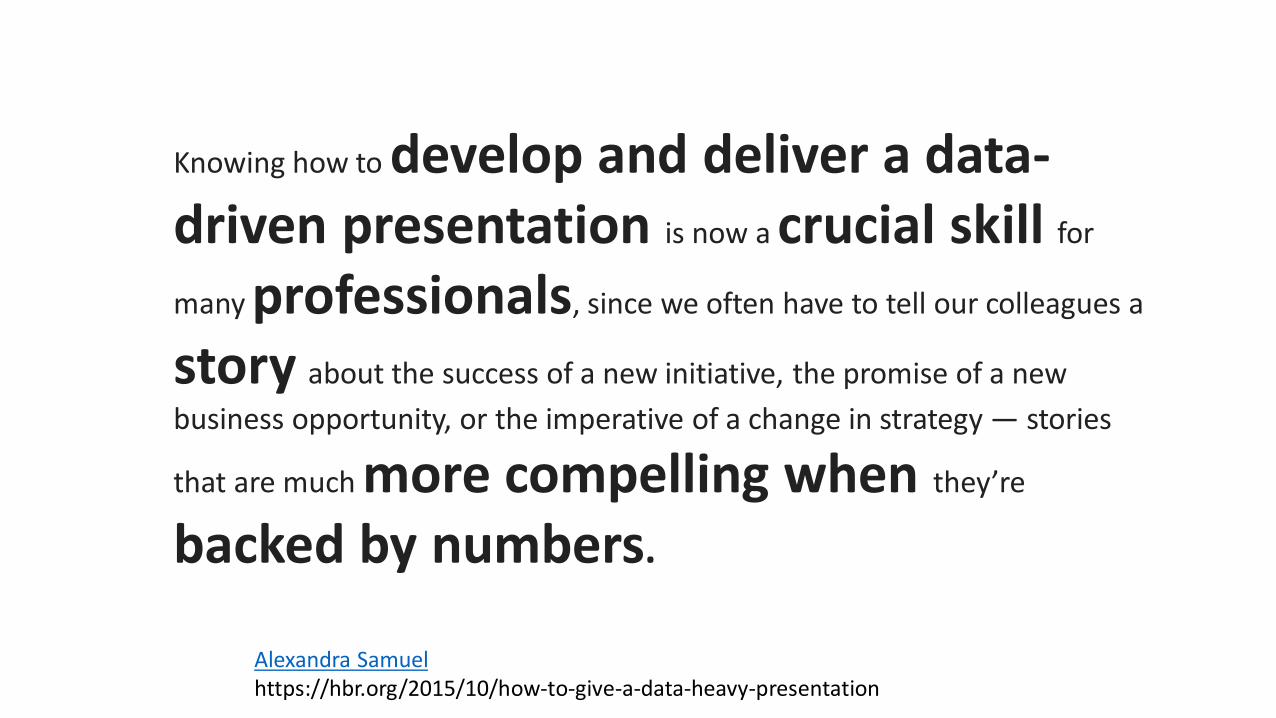
Alexandra Samuelhttps://hbr.org/2015/10/how-to-give-a-data-heavy-presentation
Knowing how to develop and deliver a data-driven presentation is now a crucial skill for
many professionals, since we often have to tell our colleagues a
story about the success of a new initiative, the promise of a new
business opportunity, or the imperative of a change in strategy — stories
that are much more compelling when they’re
backed by numbers.
Presentation preparation
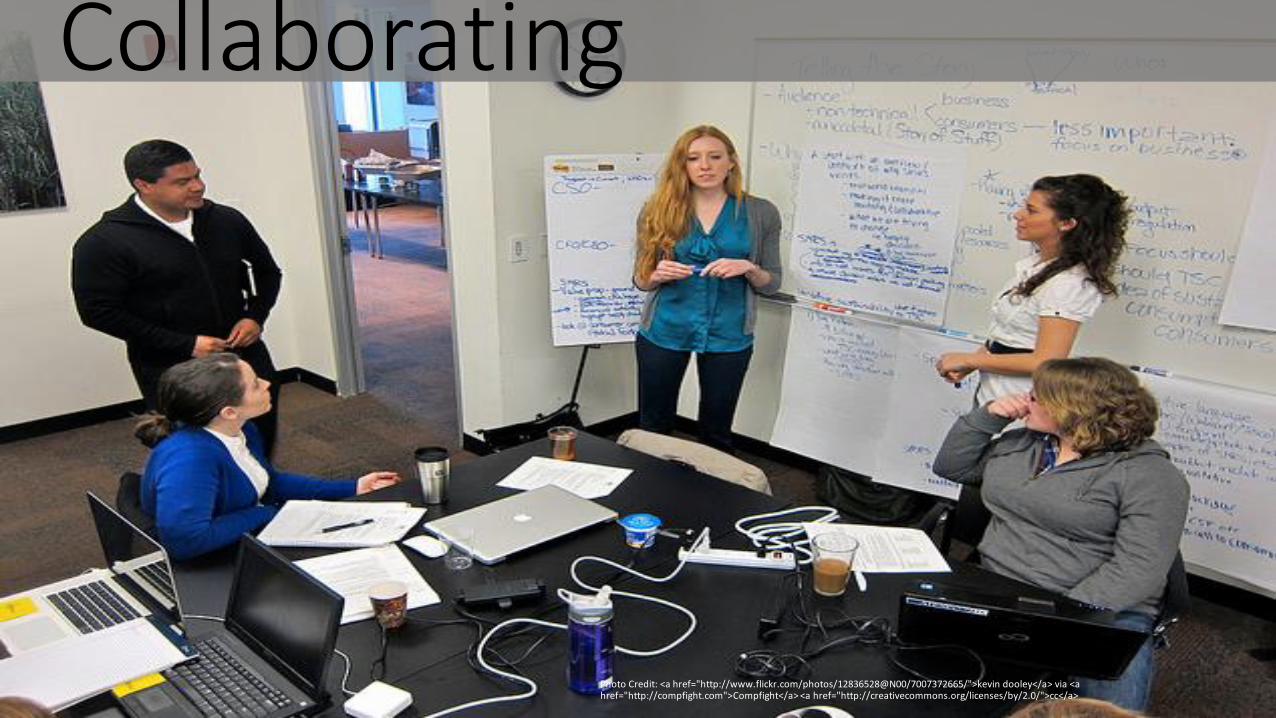
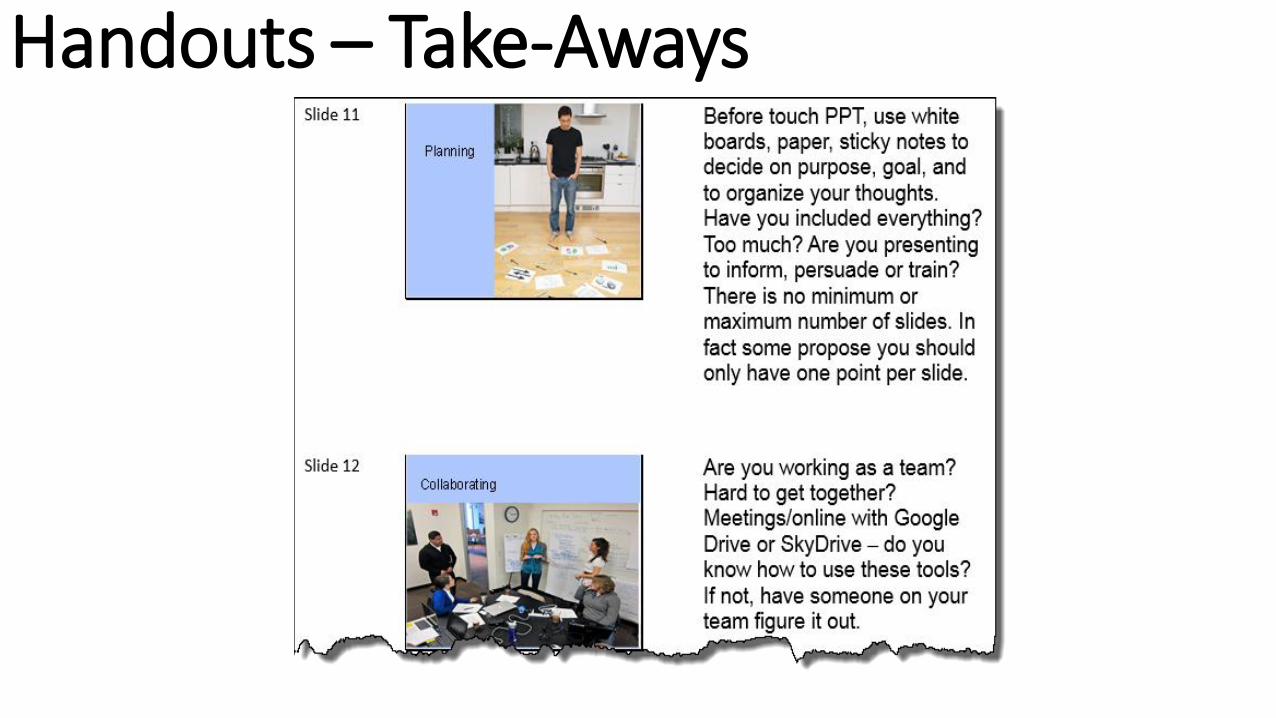
Collaborating
Photo Credit: <a href="http://www.flickr.com/photos/12836528@N00/7007372665/">kevin dooley</a> via <a href="http://compfight.com">Compfight</a> <a href="http://creativecommons.org/licenses/by/2.0/">cc</a>


Planning

Expand skills


Practice by recording the presentation
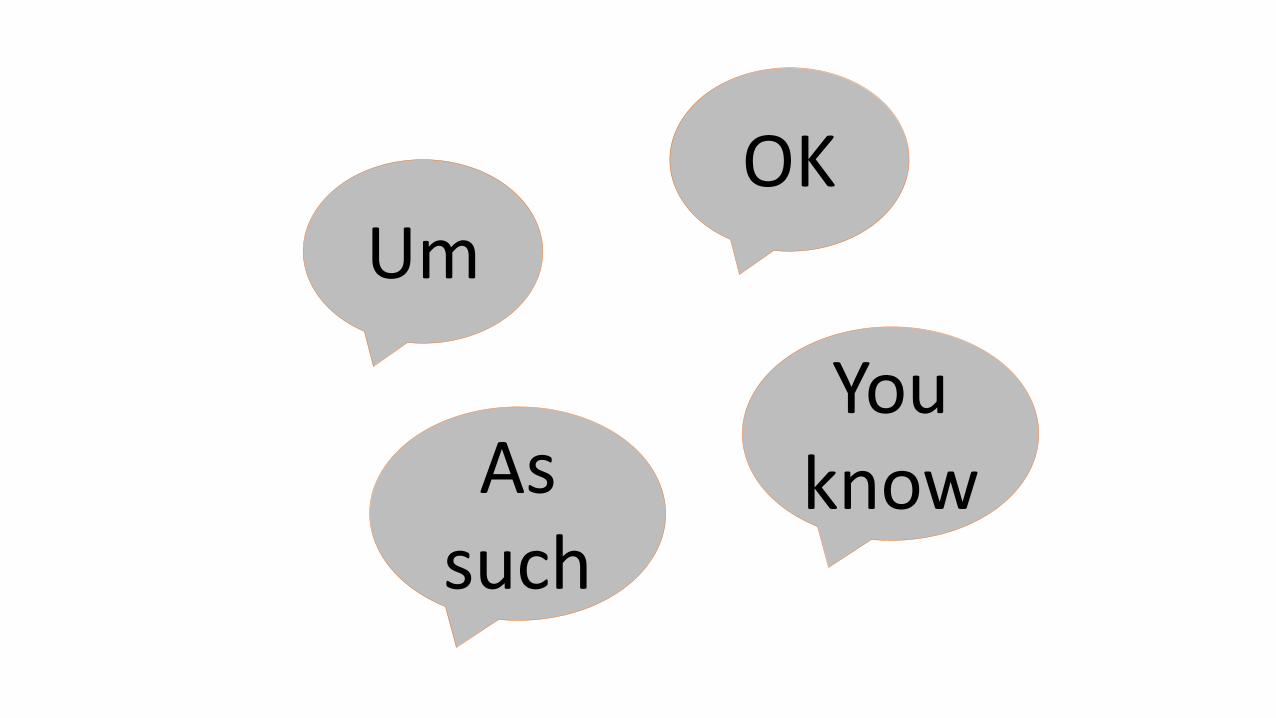
UmOK
As such
You know


Professional Attire

Do not read the slides

Use remotes

Observe time limit

Technology Glitches
Be prepared
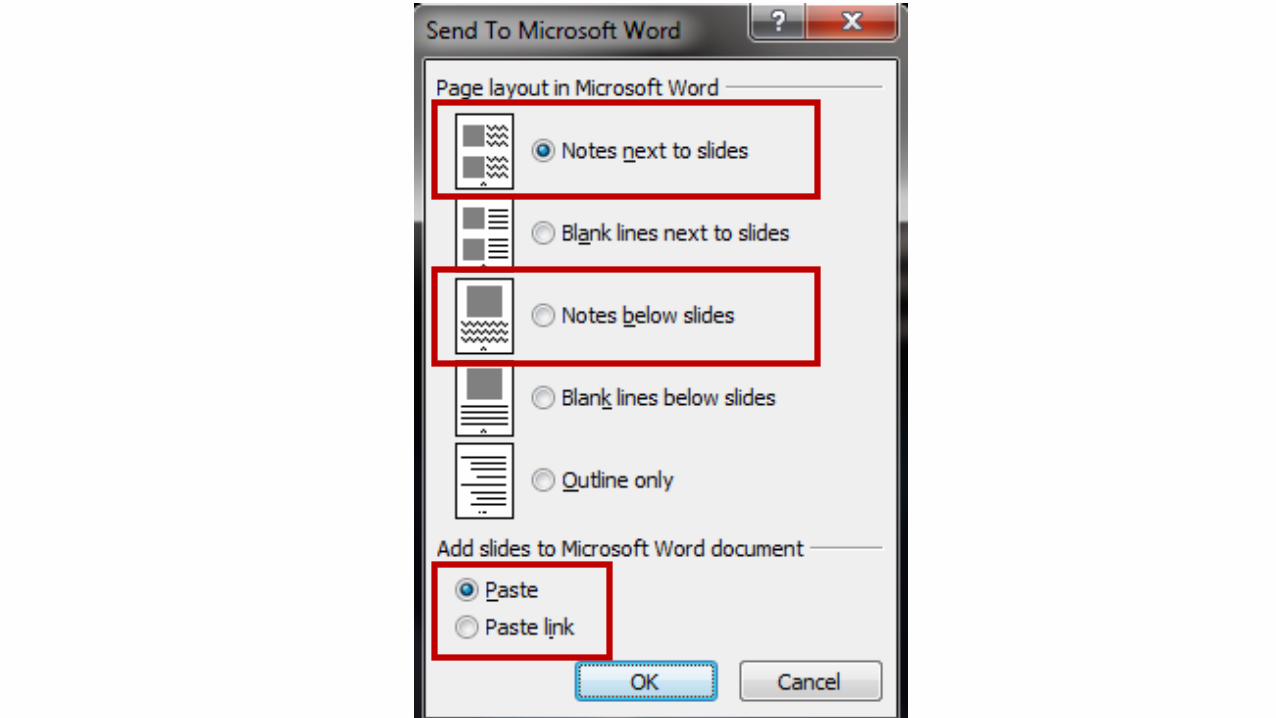
Handouts – Take-Aways


80
Software Options
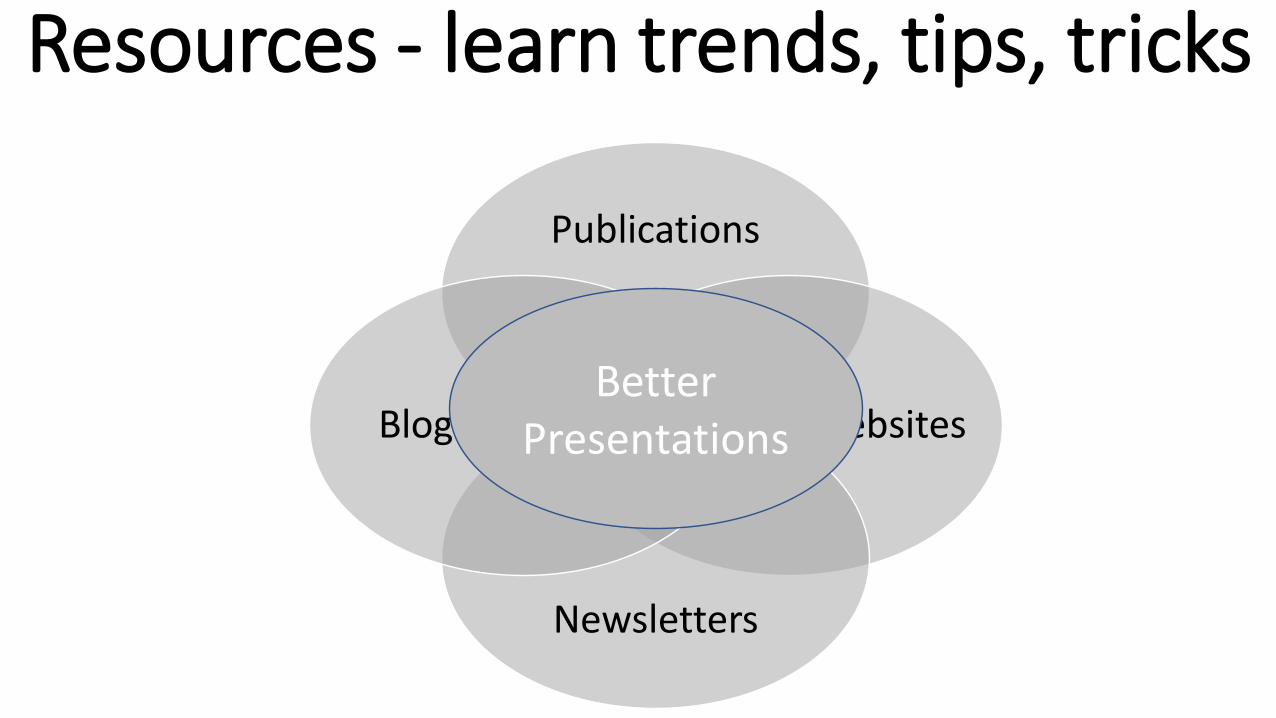
Resources - learn trends, tips, tricks
Publications
Websites
Newsletters
BlogsBetter
Presentations
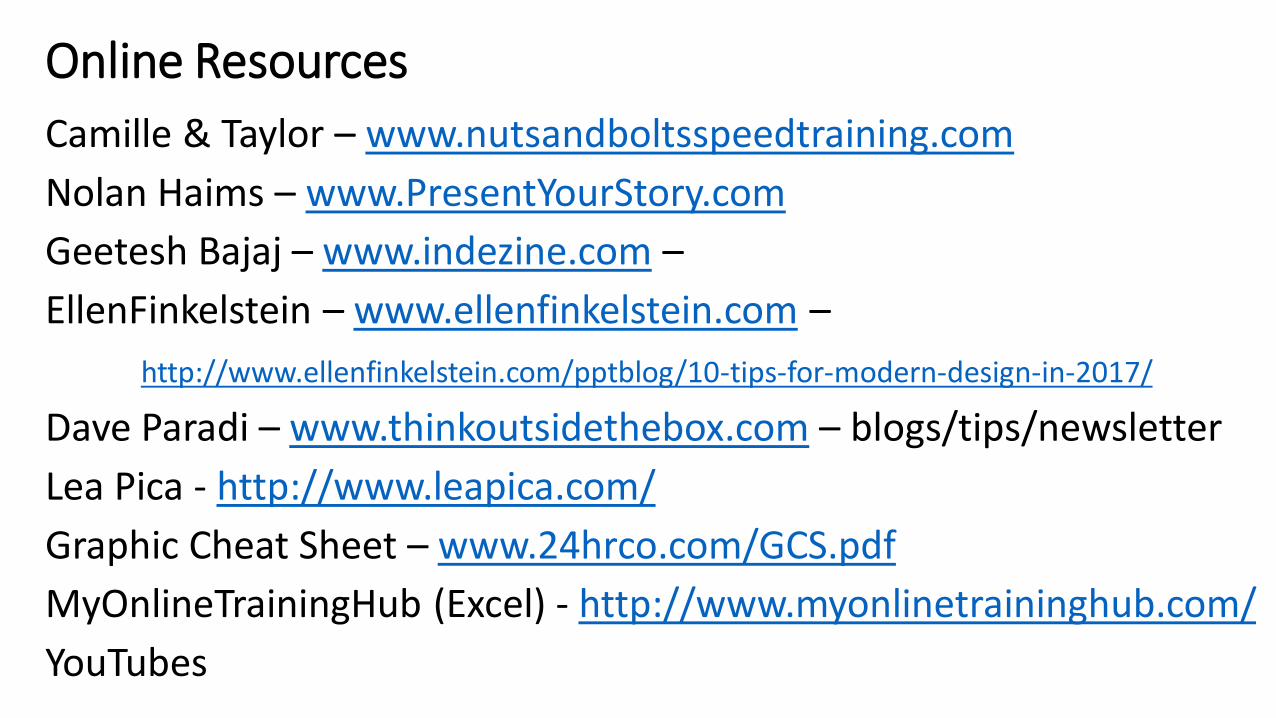
Online Resources
Camille & Taylor – www.nutsandboltsspeedtraining.com
Nolan Haims – www.PresentYourStory.com
Geetesh Bajaj – www.indezine.com –
EllenFinkelstein – www.ellenfinkelstein.com –
http://www.ellenfinkelstein.com/pptblog/10-tips-for-modern-design-in-2017/
Dave Paradi – www.thinkoutsidethebox.com – blogs/tips/newsletter
Lea Pica - http://www.leapica.com/
Graphic Cheat Sheet – www.24hrco.com/GCS.pdf
MyOnlineTrainingHub (Excel) - http://www.myonlinetraininghub.com/
YouTubes


Resources
Nolan Hains – Data Webinar presentationXpert
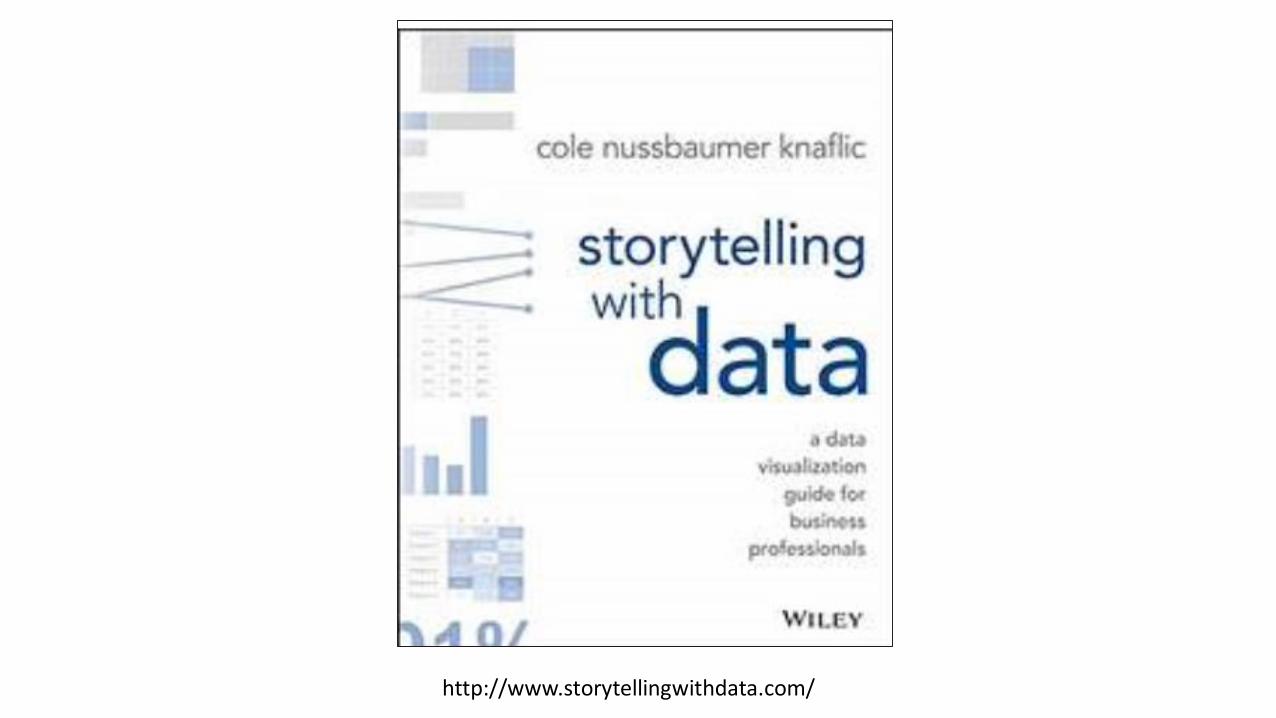
http://www.storytellingwithdata.com/

Understand context
Choose appropriate visual display
Eliminate clutter
Focus attention
Think like a designer
Tell a story

Find Data
Analyze it
Pull together
Build Models
CommunicatePrepare Presentation
Find Data
Analyze it
Pull together
Build Models
Communicate
Only part analytical process audience sees

Communicate


DASI (Data, Analytics & Statistics Instruction)
Decision Science Institute
November 18 – 21, 2017
Washington, DC
Bob Andrews, [email protected]