Effect of Blast Design on Crack response
10
Effect of Blast Design on Crack Response C.H. Dowding Professor of Civil & Environmental Engineering, Northwestern University C. Aimone-Martin Professor of Mineral Engineering, New Mexico Institute of Mining & Technology M.L. Snider Graduate Student, Civil & Environmental Engineering, Northwestern University ABSTRACT: This case history describes the instrumentation of a house near an aggregate quarry to assess the effect of changes in blast design on the house response. Velocity response was measured for the superstructure as well as walls and ceilings. Micrometer response of three cracks was measured as well. In all some 11 velocity transducers and 3 crack sensors measured excitation and response for each blast. Dynamic response of these cracks was compared to various measures of ground and/or structure motion to determine those with the best correlation. Variations in the ground motion and air pressure wave (air blast) reflected changes in the blast design. In addition dynamic crack response was compared to the long-term, weather induced crack response as well as the changes in temperature and humidity that produced the response. The study confirms the domination of long-term, weather induced crack response compared to the dynamic response produced by blast-induced phenomena. 1 INTRODUCTION Three years ago at the First EFEE Conference Siebert and Dowding (2000) described development of the autonomous crack measurement (ACM) system that simultaneously measures crack response to both long term and vibratory effects. At that time the system was operational but had yet to be field- tested. Since then a great deal has occurred. The system has been extensively field-tested. A number of thesis have been written to qualify sensors and to document the comparative response of a number of differing structures (Louis, 2000, McKenna 2002, and Snider 2003). These theses are available online at www.iti.northwestern.edu/research/current/acm. This article describes a case history of the use of that system to measurement crack responses in a house adjacent to a basalt aggregate quarry (Snider, 2003). Several different blast designs were employed in the full scale blasting that was monitored. The case begins by describing the rationale for employing micrometer changes in crack width as an index of the severity of the stresses and strains in a structure. The structure and blasting environment are then described as background. The long-term responses are then compared to those produced by the blasting. Finally differences in crack and house response are made for four pairs of shots that illustrate effects produced by differences in the blast hole layout, free faces, initiation sequence, shot timing as well as dominant frequency of the ground motions. In addition to monitoring the crack response and documenting the ground motion and air blast, velocity response of both the super structure as well as walls and a ceiling were also measured. The procedure for these additional velocity measurements is documented in a report on the response of atypical structures written for the U.S. Office of Surface Mining (Aimone et al, 2003). These additional measurements allow calculation of differential displacements within walls and ceilings of the structure for comparison with the crack response. 2 MEASURING CRACK RESPONSE Advances in sensor technology and computerized data acquisition now make it possible to simultaneously measure crack response to both long term and vibratory effects. Relatively inexpensive systems that combine measurement of both crack response and ground motion have been developed that involve the manual downloading of data on a periodic basis. These systems can be combined with telecommunications for near real-time display on the Internet to allow access to a wide variety of interested parties.
Transcript of Effect of Blast Design on Crack response

Effect of Blast Design on Crack Response
C.H. Dowding Professor of Civil & Environmental Engineering, Northwestern University
C. Aimone-Martin Professor of Mineral Engineering, New Mexico Institute of Mining & Technology
M.L. Snider Graduate Student, Civil & Environmental Engineering, Northwestern University
ABSTRACT: This case history describes the instrumentation of a house near an aggregate quarry to assess the effect of changes in blast design on the house response. Velocity response was measured for the superstructure as well as walls and ceilings. Micrometer response of three cracks was measured as well. In all some 11 velocity transducers and 3 crack sensors measured excitation and response for each blast. Dynamic response of these cracks was compared to various measures of ground and/or structure motion to determine those with the best correlation. Variations in the ground motion and air pressure wave (air blast) reflected changes in the blast design. In addition dynamic crack response was compared to the long-term, weather induced crack response as well as the changes in temperature and humidity that produced the response. The study confirms the domination of long-term, weather induced crack response compared to the dynamic response produced by blast-induced phenomena.
1 INTRODUCTION
Three years ago at the First EFEE Conference Siebert and Dowding (2000) described development of the autonomous crack measurement (ACM) system that simultaneously measures crack response to both long term and vibratory effects. At that time the system was operational but had yet to be field-tested. Since then a great deal has occurred. The system has been extensively field-tested. A number of thesis have been written to qualify sensors and to document the comparative response of a number of differing structures (Louis, 2000, McKenna 2002, and Snider 2003). These theses are available online at www.iti.northwestern.edu/research/current/acm.
This article describes a case history of the use of that system to measurement crack responses in a house adjacent to a basalt aggregate quarry (Snider, 2003). Several different blast designs were employed in the full scale blasting that was monitored. The case begins by describing the rationale for employing micrometer changes in crack width as an index of the severity of the stresses and strains in a structure. The structure and blasting environment are then described as background. The long-term responses are then compared to those produced by the blasting. Finally differences in crack and house response are made for four pairs of shots that illustrate effects produced by differences in the blast hole layout, free faces, initiation
sequence, shot timing as well as dominant frequency of the ground motions.
In addition to monitoring the crack response and documenting the ground motion and air blast, velocity response of both the super structure as well as walls and a ceiling were also measured. The procedure for these additional velocity measurements is documented in a report on the response of atypical structures written for the U.S. Office of Surface Mining (Aimone et al, 2003). These additional measurements allow calculation of differential displacements within walls and ceilings of the structure for comparison with the crack response.
2 MEASURING CRACK RESPONSE
Advances in sensor technology and computerized data acquisition now make it possible to simultaneously measure crack response to both long term and vibratory effects. Relatively inexpensive systems that combine measurement of both crack response and ground motion have been developed that involve the manual downloading of data on a periodic basis. These systems can be combined with telecommunications for near real-time display on the Internet to allow access to a wide variety of interested parties.

A dual-purpose sensor like that shown in Figure 2 can be placed across a crack to simultaneously measure long-term and vibratory response in terms of changes in crack width. This direct measurement, termed "crack displacement" is simple to understand and requires no reliance upon empirical guidelines. These sensors do not measure total crack width, but rather the change in crack width. Total crack widths could be calculated from the change by adding the change to the initial total crack width. For the remainder of this article, change in crack width will be referred to as change in crack width or crack displacement.
Maximum total crack width is an index of potential extension of a crack. In other words, the greater the increase in total crack width (displacement plus initial crack width) the greater the potential for crack extension. Figure 1 shows the results of special tests (Miller, 1995) to determine the change in crack length with the change in the crack mouth opening. The change in crack mouth opening is analogous to total crack width, as defined above. In the test summarized by Figure 1, a specimen of cement paste like that shown in the insert, was subjected to increasing force, F, at the mouth of a crack of length “a”. As F was increased, the crack mouth opening, or crack opening displacement (COD), increased, as did the crack length, a. The main graph portrays the change in COD with the extension of the crack. For instance, as COD increased from 3.5 micrometers (+ 7 to – 7 = 14 x 10-5 inches = 140 micro-inches) to 7.5 micrometers (+ 15 to –15) the crack extended from 35.5 to 40.6 mm (1.4 to 1.6 inches).
Measurements summarized in Figure 1 show the crack extending only when it experiences a displacement that surpasses the maximum total crack width experienced. Thus, if the crack width remains less than its maximum historic value, it will not extend. However by logical extension, it can be said that the greater the crack displacement, the larger is the potential for cracking.
Figure 1. Experimental Verification of Crack Extension with increasing Maximum Crack Width.
The principle of employing the same sensor to
simultaneously measure crack displacements produced by both long-term and transient effects is not dependent on the type of sensor. Therefore, any number of sensor types can be employed. Details pertaining to the performance of a variety of different displacement sensors used in crack monitoring can be found in other references (Siebert, 2000 & Louis, 2000). While the authors have employed both eddy current proximity sensor and linear variable differential transformers, LVDT’s in other studies, only the eddy current sensors were employed in this study.
3 HOUSE AND INSTRUMENTATION
The instrumented house shown in Figure 2 is constructed on a hillside some 700 m from a quarry mining igneous rock for construction aggregate. House response was measured for the blasting events between 20 May and 9 August, 2002 summarized in Table 1. These blasts involved 30 to 50 holes with explosive weights per delay between 150 and 360 kg. They produced peak particle velocities between 0.8 and 8.8 mm/s and peak airblast overpressures from less than 100 to 132 db, which in turn produced maximum horizontal super structure responses of 0.8 to 4.6 mm/s. During this observation period weather conditions varied daily with indoor temperatures and humidity ranging between 18.8 ° and 31.5° C and 76.2 to 32.6 % respectively.
Figure 2. Combination photo and elevation view of the house
As shown in Figure 2 the lower story of the house
is constructed of concrete masonry units or blocks (CMU) and the upper story is constructed with traditional North American wood frame walls encapsulated with gypsum drywall on the interior and wood shingles on the exterior. Because the house is located on a hillside, the lower story

(basement) does not extend the full width as shown in the elevation view in Figure 2. Rooms above the 2 car garage are supported on a steel beam that spans the entire 7m width of the garage, which affects the dynamic response characteristics of this part of the house. Typically floor and ceiling joists are supported mid way with a span of 3.5 m, which stiffens the structure.
Excitation motions and structural response were measured by 12 velocity transducers. As shown by the S1 and S2 locations in the elevation view in Figure 2, two, sets of orthogonally oriented (L –radial,T- transverse & V- vertical) velocity transducers were placed on the upper and lower
corners of the garage. The L or radial direction is horizontally oriented parallel to the long axis of the house. The S2 cluster in the upper corner measured gross or superstructure response. While additionally oriented midwall transducers were located on the transverse and radial walls as well as the ceiling of the rooms above the garage, their response will not be discussed in this paper because of the lack of space. Midwall response information can be found in Snider (2003). A traditional triaxial velocity transducer block and an airblast transducer were placed on the ground outside the garage and below the S1 cluster to measure excitation motions.
Table 1. Shot design and initiation parameters as well as resultant ground motions and structural response for comparison of effects on crack response. Shot #
Distance (m)
# Holes
Total weight (kg)
Weight per hole (kg)
Charge weight per delay (kg)
Scaled Distance (m/kg1/2)
Total shot time (ms)
PPV V/L (mm/s)
Dominant frequency V/L (Hz)
Airblast (dB)
Crack Displ. (1/3) (µm)
Normal δ/PPV Crack 1/V
Normal δ/PPV Crack 3/L
1 740 30 3759 125 251 47 352 1.4/4.6 24/21 106 1.0/NA 0.71 N/A 9 821 37 4663 126 378 42 428 1.4/3.7 25/22 110 0.73/NA 0.52 N/A 8 676 48 1780 67 163 53 557 0.8/2.0 23/22 132 2.25/NA 2.81 N/A 15 724 51 5939 116 349 39 419 2.4/8.8 25/23 117 2.25/1.25 0.94 0.14 14 741 41 3612 88 264 46 310 2.4/4.8 25/19 106 1.5/1.5 0.63 0.31 22 692 57 6016 105 316 39 402 3.4/6.9 25/27 112 1.5/0.85 0.44 0.12 18 744 59 6967 118 354 40 436 2.9/5.0 25/25 126 2.0/0.93 0.69 0.19 19 759 37 3403 92 367 40 215 2.2/5.5 25/22 119 0.95/0.83 0.43 0.15 Note shot 8: Weight per hole is average of 32, 10m holes and 16, 2.5m holes Note total shot time: 500 ms pre-trigger delay for all shots not included
Three cracks in interior gypsum drywall, were instrumented with eddy current “Kamen” micrometer displacement sensors. Locations of the three cracks are shown in the elevation view in Figure 2. Crack 1, the most active, shown along with the sensor in Figure 3, was located in the ceiling of the rooms above the garage. It runs east-west (in the transverse direction) at the mid-span of long span, unsupported joists at the beginning of a hallway leading between rooms in the addition. The sensor placed on uncracked material adjacent to crack 1 is the null sensor to determine if none crack response is significant. Two other cracks on a wall and ceiling were in the main portion of the structure and are identified as cracks 2 and 3. Crack 3, shown in Figure 4, runs vertically up an interior wall in the bedroom of the main portion of the structure. Crack 2 lies in the center of the living room ceiling, but was so unresponsive to either weather or vibratory excitation that its response was not analyzed.
For each blast, time correlated excitation (ground motions and air blast), structural velocity response and crack response time histories were collected for five seconds. Any channel could trigger the entire system. Temperature and humidity were recorded in
each room containing a sensor every 10 minutes by independent Supco weather loggers.
Figure 3. Photos of sensor and crack 1

Figure 4. Photos of sensor and crack 3
One of the challenges involved in this case study
is the correlation of measured response. Typically, relative displacements are calculated from responses at the top (S2) and bottom (S1) of structures with uniform framing and materials. In this case, however, S1 response is measured near the base of the concrete masonry unit garage wall, while S2 response is measured near the ceiling at the southwest corner of the wood frame and drywall apartment addition. There was no response data recorded at the junction of these two wall types. Consequently, the gross wall, in-plane shear distribution cannot be accurately calculated across a single wall type by subtracting top and bottom displacements. This challenge emphasizes the necessity for three sensor locations for two-story structures to ensure that the proper response mode shape is chosen.
Likewise, structural response was measured only in the southwest corner of the apartment addition. Crack 1 lies within this addition, supported by the garage underneath. Cracks 2 and 3, however, are located some distance away, within the main, ungaged portion of the house that includes no underlying basement. Therefore, the structural responses measured in the addition are most applicable for the addition and response from Crack 1. Both of these correlation challenges will be explored further when the transient responses are analyzed.
4 BLAST RESPONSE
Figure 5 shows time histories of excitation ground motion, structural response, and the corresponding crack responses at locations 1 & 3 for shots 19 and 18. These events produced peak particle velocities of 5.5 mm/s and 5 mm/s respectively in the L direction
and air overpressures of 119 db. Dominant frequencies varied between 20 to 30 Hz as shown in Table 1. This observation is confirmed by the response spectrum in Figure 6 that peaks at 23 Hz.
The L motions in Figure 6 are parallel to the plane of the wall containing Crack 3, and therefore can be employed to calculate gross wall displacements to compare with directly measured crack displacements. The vertical motions are in the direction of the out of plane motions of the crack 1 in the ceiling. In both cases, the air blasts produced significant response of almost the same magnitude as the ground motions.
Natural frequency and damping of the structure are important for calculating structural response and can be estimated from either free response or Fourier transforms of response motions (Dowding 1985 & 1996). These approaches indicated that the natural frequency of the structure was approximately 11 to 12 Hz and that of the walls was 17 to 18 Hz (Snider, 2003). Damping was estimated to be 5%.
Figure 5. Crack displacement 1 and 3 time histories for blast events 18 and 19 compared to longitudinal and vertical ground motion and upper structure response and airblast overpressure.

Figure 6. Response spectrum of radial ground motion produced by shot 15.
5 CRACK RESPONSE TO ENVIRONMENTAL EFFECTS
Figure 7 compares the long-term response of cracks 1 and 3 to the long-term fluctuation of temperature and humidity. Long-term crack displacement was measured hourly for the duration of the monitoring period, while temperature and humidity were measured every ten minutes and averaged to obtain one sample per hour. Some sharp changes are observed in the temperature, humidity and crack displacement during the monitoring period. Large, simultaneous changes in temperature and humidity, such as those on July 5th and July 24th, produce the largest changes in crack displacement.
Figure 7. Two month variation in time of long term response of Cracks 1 & 3, null sensor displacement, temperature and humidity.
Differences of the raw data, 24 hour rolling
averages (smoothed raw data in Figure 6) and overall averages (solid horizontal line) are employed collectively to quantify micro-inch crack response to weather effects (McKenna 2002). Weather effects are analyzed for three different effects. Weather frontal movements change overall temperature and humidity for periods of several days to weeks They are defined as the deviation of a peak 24-hour average value from the overall average. Daily changes reflect the typical day and night changes in the temperature and humidity produced by changes in solar radiation. They are defined as the deviation of a peak field measurement from the corresponding 24-hour average. Extremes of unusual weather or
other environmental effects show long term effects caused by seasonal changes. They defined as the difference in the peak field measurement from the overall computed average. The longer the period observation, the larger are the extreme effects.
These three environmental effects on crack response, daily changes in insolation and temperature, weekly changes in humidity with the passage of weather fronts and extreme events, are compared with the vibratory response for cracks 1 and 3 in Figure 8. The two vibratory responses are for the maximum excitation (8.8 mm/s) and that at a level that is noticeable (2.5 mm/s). As can be seen by the differences in the bar heights, both cracks respond far more to the weather (by almost a factor

of 10) than to vibration excitation. To ensure that these measurements reflected only crack response, a null gage was placed next to crack 1 and its response is shown in Figure 7. Null sensors are placed nearby but across an uncracked portion of the wall to document the sensor and wall material response where no crack is present. Note the small response of the null sensor compared to that produced by the weather. See Siebert & Dowding (2001) for a full discussion of null gages.
Figure 8. Bar graphs showing blast induced response of Cracks 1 and 3 to be 50 to 100 times smaller than long term (weather) effects.
6 STICK SLIP CRACK MOTION
Figure 9 displays in detail the relatively dominant effect of weather phenomena on crack displacement and stick-slip opening and closing of cracks. As shown in the upper inset, blast event 8 produced a jump in the displacement of crack 1, which was completely masked by the subsequent daily response. Comparison with the following changes in crack width produced by frontal effects, shows that even the overpowering daily effects were small compared to those produced by a passing weather front.
This shot produced a peak particle velocity of 0.08 ips and airblast of 132 dB. The 132 dB airblast that occurs approximately 2 ½ seconds into the monitoring period produces a peak crack displacement of 2.0.10-3 mm (80micro-inches), far exceeding the 8.9.10-4 mm (35 micro-inch)
displacement induced by the ground motion. Second, this airblast also produces what appears to be a 2.3.10-3 mm (90 micro-inch) offset during the 8-second record. However, the hourly crack response in Figure 9 shows that the daily weather phenomena on June 10th produced a maximum crack displacement in the apartment ceiling of 3.8.10-2 mm (1500 micro-inches), which is 15 times greater than that produced by the event. This crack, even if it were offset by 2.3.10-3 mm (90 micro-inches), was returned to its pre-blast displacement less than four hours later as a result of the temperature and humidity change.
Offsets such as these measured during event 8 are believed to be the result of stick-slip movement of cracks as they open and close. Cracks do not respond smoothly to changes in temperature and humidity. Other measurements (Snider, 2003) at a test house in Nevada capture this phenomenon. Nevada measurements of crack width were made every second for several hours rather than the once every hour or at best every 10 minutes as is typical (Snider, 2003). These measurements show that cracks open and close in a stair step fashion. The step portions of the response occur over time intervals less than 1 second. Thus it is inevitable that blasts will trigger the recording of crack motions during one of these step function incidents.
7 INFLUENCE OF BLAST DESIGN
Two principal factors determine peak particle ground velocities from blasting; maximum charge weight detonated per delay, and the distance to the source. These two parameters are combined by normalizing (dividing) the distance by the square root of the charge weight per delay. There are, however, many other factors that have lesser but not insignificant effect on other aspects of ground motion time histories and thus structural and crack response. These factors include, dominant frequency, number of significant pulses and their timing as well as air overpressures. These wave form descriptors are in turn influenced by the number of holes, initiation sequence, burden and propagation characteristics of the transmission medium.
This section describes differences in structural and crack responses that resulted from blasts at similar scaled distance or expected particle velocities. Interest in this investigation stems from the results of a previous study (Aimone, 2000) that involved measurement of structural and ground responses at the same quarry. This study concluded by suggesting the following modifications of blasting practices: increased stem length, increased front row burden, minimum 25 millisecond delay

time per hole, elimination of base primers, initiation north high walls, and design of blasts on south faces.of blast events from north to south for benches on
Figure 9. Offset crack response overwhelmed by changes produced by daily changes in temperature and humidity, which in turn are overwhelmed by the changes produced by passing weather fronts
Comparisons reported herein involve differences
in four components of blast design and initiation: 1) face geometry, 2) stemming depth, 3) frequency effects & 4) numbers of holes and delay timing. Four pairs of blasts and their respective ground and crack responses will be compared to describe these effects. Table 1 summarizes the pertinent information associated with the following events comparing differences in: • face geometry (Shot 1, narrow V, single face
versus Shot 9, wide V, two-face ) • stemming depth (Shot 8, shallow stemming
producing 132 db air overpressure versus Shot 15, 0.345 ips ground motion)
• frequency effects (Shot 14, 19 Hz versus Shot 22, 27 Hz in the L direction)
• number of holes and total shot time (Shot 18, 436ms total shot time with 59 holes versus Shot 19, 215ms total shot time with 37 total holes)
All blast events were approximately 762 m (2500 ft) from the instrumented structure. They were located on the same side of the quarry as the house on either south or east facing high-walls.
The long initiation times of these shots were taken into account in the calculation of scaled distances. As can be seen in the hole layout for shot 18 in Figure 10, the initiation time for the last delay is 486 ms. Since all holes are initiated with a 500 ms down hole delay, the 486 ms hole actually detonated 986 ms after the shot was initiated up hole. These long delay times may involve total delay time errors that are greater than the 8 ms deemed sufficient to
separate the delays. As a result all holes that were designed to detonate within 8ms or less of each other were assumed to be detonated simultaneously. For shot 18 the delays at 252 and 260 in the lower bench and that at 251 in the upper bench were assumed to have detonated simultaneously. Thus on Table 1, the charge per delay is 3 times the weight per hole.
Figure 10. Borehole geometry and delay timing patterns for shot 18 with a duration of 436 ms and shot 19 with a duration of 215 ms

The attenuation relationship for the longitudinal and vertical motions at this site are given in Figure 11. The assumption of simultaneity of shots detonated at or within 8 ms intervals is compared well with the upper bound of experience (Hendron and Oriard, 1972 ). These scaled distances or the peak particle velocity at the instrumented house were employed to identify the shot pairs to compare differences in ground motions, structural response or crack response.
Figure 11. Attenuation relationship for longitudinal PPV compared to upper bound of Oriard expectations.
7.1 Face geometry (Shot 1, narrow V, single face versus Shot 9, wide V, two-face)
Borehole layouts and timing patterns for shots 1 & 9 are shown in Figure 12. Both of these were standard production shots, and occurred at the same time of day. Shot 1 is a narrow V pattern opening to a single face and maximum shot delay of 352ms (plus 500ms down hole). Accounting for the 8ms timing error discussed previously, there were a maximum of 2 holes and 251 kg detonated per delay throughout the duration of the shot. Shot 9 is a wide V pattern with two open faces and a maximum shot delay of 428ms (with 500ms in hole). There are a maximum of 3 holes and 378 kg detonated delay.
As shown in Table 1, shot 1 produced higher peak particle velocities (PPV) in the L direction (but not in the V direction) and higher crack 1 response than shot 9 (4.6 versus 3.7 mm/s and 1.0 versus 0.73 µm ) even though it was designed with a higher scaled distance. It may be that shot 9 had higher relief because of the second free face which resulted in a more of the energy being consumed in moving the fragmented rock.
Clouding the issue is the source of the difference in the ceiling crack (1) response. Is it motion in the vertical or horizontal direction? This issue is most easily demonstrated by normalizing crack response through division by PPV as shown in the last column in Table 1. Crack 1 response is greater when normalized by the excitation level in the V direction
but not if normalized by the PPV in the L direction (0.71 versus 0.52 µm/mm/s in V but 0.21 and 0.19µm/mm/s in L ). There will be more discussion of this issue in the last section that compares component and crack responses.
Figure 12. Borehole geometry and delay timing patterns for shot 1 with a duration of 352 ms and shot 9 with a duration of 428 ms
7.2 Stemming depth (Shot 8, shallow stemming producing 132 db air overpressure versus Shot 15, 0.345 ips ground motion)
While the scaled distance for shot 8 was significantly larger, 53, than for shot 15, 39, short stemming in one group of holes in shot 8 produced a much higher structural and crack 1 response as shown in Table 1 and in Figure 13. This high response was the result of the high over pressure, which in turn resulted from the lack of confinement of shallow holes in part of blast 8. Shot 8 included a group of 16, 3.5” holes drilled to an eight-foot depth with only five feet of stemming. Conventional blasting design calls for stemming of approximately 30 times the diameter of the hole, or 7 to 8 feet for 3.5” holes.
In contrast shot 15, produced the maximum peak particle velocity of any recorded event, 20% higher than the next highest PPV, but did not have the smallest scaled distance. This shot was designed using with 4” holes drilled to 36 to 45 feet with 12 feet of stemming in a “V” pattern. It is possible that the “V”, which was pointed at the structure, lead to increased energy transfer to ground motions.
Figure 13 presents the time histories for shots 8 and 15. The 132 db air overpressure from shot 8
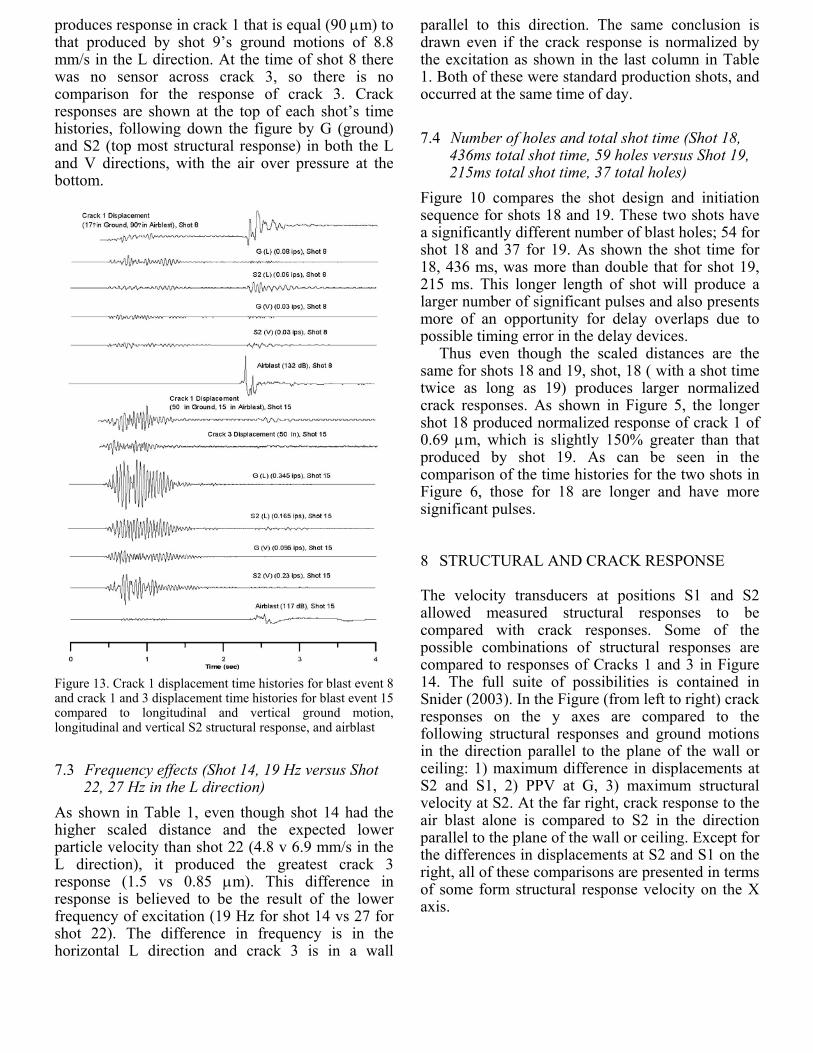
produces response in crack 1 that is equal (90 µm) to that produced by shot 9’s ground motions of 8.8 mm/s in the L direction. At the time of shot 8 there was no sensor across crack 3, so there is no comparison for the response of crack 3. Crack responses are shown at the top of each shot’s time histories, following down the figure by G (ground) and S2 (top most structural response) in both the L and V directions, with the air over pressure at the bottom.
Figure 13. Crack 1 displacement time histories for blast event 8 and crack 1 and 3 displacement time histories for blast event 15 compared to longitudinal and vertical ground motion, longitudinal and vertical S2 structural response, and airblast
7.3 Frequency effects (Shot 14, 19 Hz versus Shot 22, 27 Hz in the L direction)
As shown in Table 1, even though shot 14 had the higher scaled distance and the expected lower particle velocity than shot 22 (4.8 v 6.9 mm/s in the L direction), it produced the greatest crack 3 response (1.5 vs 0.85 µm). This difference in response is believed to be the result of the lower frequency of excitation (19 Hz for shot 14 vs 27 for shot 22). The difference in frequency is in the horizontal L direction and crack 3 is in a wall
parallel to this direction. The same conclusion is drawn even if the crack response is normalized by the excitation as shown in the last column in Table 1. Both of these were standard production shots, and occurred at the same time of day.
7.4 Number of holes and total shot time (Shot 18, 436ms total shot time, 59 holes versus Shot 19, 215ms total shot time, 37 total holes)
Figure 10 compares the shot design and initiation sequence for shots 18 and 19. These two shots have a significantly different number of blast holes; 54 for shot 18 and 37 for 19. As shown the shot time for 18, 436 ms, was more than double that for shot 19, 215 ms. This longer length of shot will produce a larger number of significant pulses and also presents more of an opportunity for delay overlaps due to possible timing error in the delay devices.
Thus even though the scaled distances are the same for shots 18 and 19, shot, 18 ( with a shot time twice as long as 19) produces larger normalized crack responses. As shown in Figure 5, the longer shot 18 produced normalized response of crack 1 of 0.69 µm, which is slightly 150% greater than that produced by shot 19. As can be seen in the comparison of the time histories for the two shots in Figure 6, those for 18 are longer and have more significant pulses.
8 STRUCTURAL AND CRACK RESPONSE
The velocity transducers at positions S1 and S2 allowed measured structural responses to be compared with crack responses. Some of the possible combinations of structural responses are compared to responses of Cracks 1 and 3 in Figure 14. The full suite of possibilities is contained in Snider (2003). In the Figure (from left to right) crack responses on the y axes are compared to the following structural responses and ground motions in the direction parallel to the plane of the wall or ceiling: 1) maximum difference in displacements at S2 and S1, 2) PPV at G, 3) maximum structural velocity at S2. At the far right, crack response to the air blast alone is compared to S2 in the direction parallel to the plane of the wall or ceiling. Except for the differences in displacements at S2 and S1 on the right, all of these comparisons are presented in terms of some form structural response velocity on the X axis.

Figure 14. Measured crack response (Y axis) compared to measures of structural response (S2), ground excitation (G) and airblast overpressures.
The most striking observation is that Crack 1
responds proportionally to the air blast over pressure and Crack 3 does not. Nor does Crack 3 respond highly. Crack 3 is located on a wall in the interior or the house whereas Crack 1 is located in the ceiling of the room(s) above the garage with the long span. The second observation is that Crack 1 is more sensitive to motion than is Crack 3. Sensitivity is proportional to the slope of the relationships in Figure 14. Crack 1’s slopes are steeper than those of Crack 3. This sensitivity may be related to Crack 1’s location over the long span garage. Finally, it is interesting to note that crack response is proportional to PPV. As can be seen from Table 1, normally the PPV is in the longitudinal direction. The correlation for Crack 3 response with PPV in the L direction is even higher than for the difference in displacement at S2 and S1. As indicated earlier, this lower correlation my result from the difference in materials for the lower and upper stories and the distant location of the measurement of S2 and S1.
9 CONCLUSIONS
Location of the structural response transducers is important when calculating in plane shearing displacements or strain. Two transducers are needed for each floor, especially if the there are construction differences.
Framing details contribute to differences in crack response to dynamic excitation as well as to long-term environmental effects.
Cracks that respond the most to long-term environmental effects also tend to respond the most to vibratory effects.
Air blast over pressures, especially those near regulatory limits can cause substantial structural and crack response.
While shot design and initiation can affect crack response, differences are still far smaller than differences in response caused by differences in long term environmental effects and PPV.
REFERENCES
Dowding, C. H. (1996) Construction Vibrations, Prentice Hall Inc., Englewood Cliffs, NJ, 620 pp.
Dowding, C.H. & Siebert, D (2000) “Control of Construction Vibrations with an Autonomous Crack Comparometer”, Explosives and Blasting Technique, R. Holmberg, Ed. , A.A. Balkema, pp 103-110, September 2000.
Hendron, A.J. and Oriard, L.L. (1972), Specifications for Controlled Blasting in Civil Engineering Projects,” Proc. First American Rapid Excavation and Tunneling Conference (RETC), SME, Littleton, CO, USA.
Louis, M (2001) "Field Authentication of Autonomous Crack Comparometer," M.S. Thesis, Department of Civil Engineering, Northwestern University, Evanston, IL, USA.
McKenna, L (2001) “Comparison of Measure Crack Response in Diverse Structures to Dynamic Events and Weather Phenomina,” M.S. Thesis, Department of Civil Engineering, Northwestern University, Evanston, IL, USA.
Miller, R (1989) Analysis of the Fracture Process in Mortar Using Laser Holographic Interferometry, PhD Thesis, Department of Civil Engineering, Northwestern University, Evanston, IL, USA.
Snider, M (2003) “Autonomous Crack Measurement of Construction Vibrations” M.S. Thesis, Department of Civil Engineering, Northwestern University, Evanston, IL, USA.