EE368 Project: Football Video Registration and Player ...yt916dh6570/Guillory_Mwangi... · EE368...
8
EE368 Project: Football Video Registration and Player Detection By Will Riedel, Devin Guillory, Tim Mwangi June 5, 2013 Abstract This paper focuses on methods that can be used in football analysis by showing our implementation and results of automatic football video registration and player detection. Some of the first methods we im- plemented like SIFT Feature detection for video regis- tration and background detection for player detection were not successful. However, we implemented more integrated methods like line mapping using hough transform and unique feature identification for video registration and optical flow and color filtering for player detection which were more successful but could still be improved. Introduction American Football is highly competitive and well fi- nanced sport in which the slightest advantage can be exploited for large gains. In high school, college, and professional levels of play, a substantial amount of time is dedicated to film study and analysis. Both players and coaches spend hours analyzing film in or- der to detect tendencies, strengths, and weaknesses of their opponents and themselves. A large portion of the work is simply data collection on metrics such as, plays run, formations used, and personnel involve- ment. Currently this collection is done through grad- uate assistants, assistant coaches, or even the head coaches if a team is strapped for money. We believe that automated image processing software would be to analyze the game film at accurately label plays and reduce the amount of human capital put into data collection tasks. Our method of player tracking can be broken into three primary sections: line mapping, unique fea- ture identification, and player detection. The first two processes are used to perform field registration which, when combined with a projective transforma- tion, produces an overhead map of player locations on the field. Methods Line Detection Performing a perspective transform requires an accu- rate map of the image to be transformed. In football gameplay footage, the field itself is the only station- ary object consistently in view. Previous work fo- cused on performing the transform based completely on unique features of the field, such as logos and end- zone text, and compared these points with a tem- plate of an overhead view of that field[3]. However, the fields that were tested in that case were particu- larly full of unique features. In many cases, few such features exist (Figure 1). Figure 1: Screenshot of gameplay footage with no unique features To improve adaptability, our method relies on field lines running sideline-to-sideline and the two sets of hash marks that run down the length of the field. The advantage of these features is that they are nearly al- ways visible in the film, and they have exact and con- sistent locations on field defined for the entire sport (there are some small changes between different lev- els, such as different hash widths between college and the NFL, but these can be easily taken into account). To detect the yard lines, the original image is con- verted to a binary image with rows along the top and bottom of the image removed as a crude filter of the sideline. Then regions are filtered to remove regions with large area, small major axis length, and orien- tations near horizontal (Figure 2, Below). From the 1
Transcript of EE368 Project: Football Video Registration and Player ...yt916dh6570/Guillory_Mwangi... · EE368...
EE368 Project: Football Video Registration and Player Detection
By Will Riedel, Devin Guillory, Tim Mwangi
June 5, 2013
Abstract
This paper focuses on methods that can be used infootball analysis by showing our implementation andresults of automatic football video registration andplayer detection. Some of the first methods we im-plemented like SIFT Feature detection for video regis-tration and background detection for player detectionwere not successful. However, we implemented moreintegrated methods like line mapping using houghtransform and unique feature identification for videoregistration and optical flow and color filtering forplayer detection which were more successful but couldstill be improved.
Introduction
American Football is highly competitive and well fi-nanced sport in which the slightest advantage can beexploited for large gains. In high school, college, andprofessional levels of play, a substantial amount oftime is dedicated to film study and analysis. Bothplayers and coaches spend hours analyzing film in or-der to detect tendencies, strengths, and weaknessesof their opponents and themselves. A large portionof the work is simply data collection on metrics suchas, plays run, formations used, and personnel involve-ment. Currently this collection is done through grad-uate assistants, assistant coaches, or even the headcoaches if a team is strapped for money. We believethat automated image processing software would beto analyze the game film at accurately label plays andreduce the amount of human capital put into datacollection tasks.
Our method of player tracking can be broken intothree primary sections: line mapping, unique fea-ture identification, and player detection. The firsttwo processes are used to perform field registrationwhich, when combined with a projective transforma-tion, produces an overhead map of player locationson the field.
Methods
Line Detection
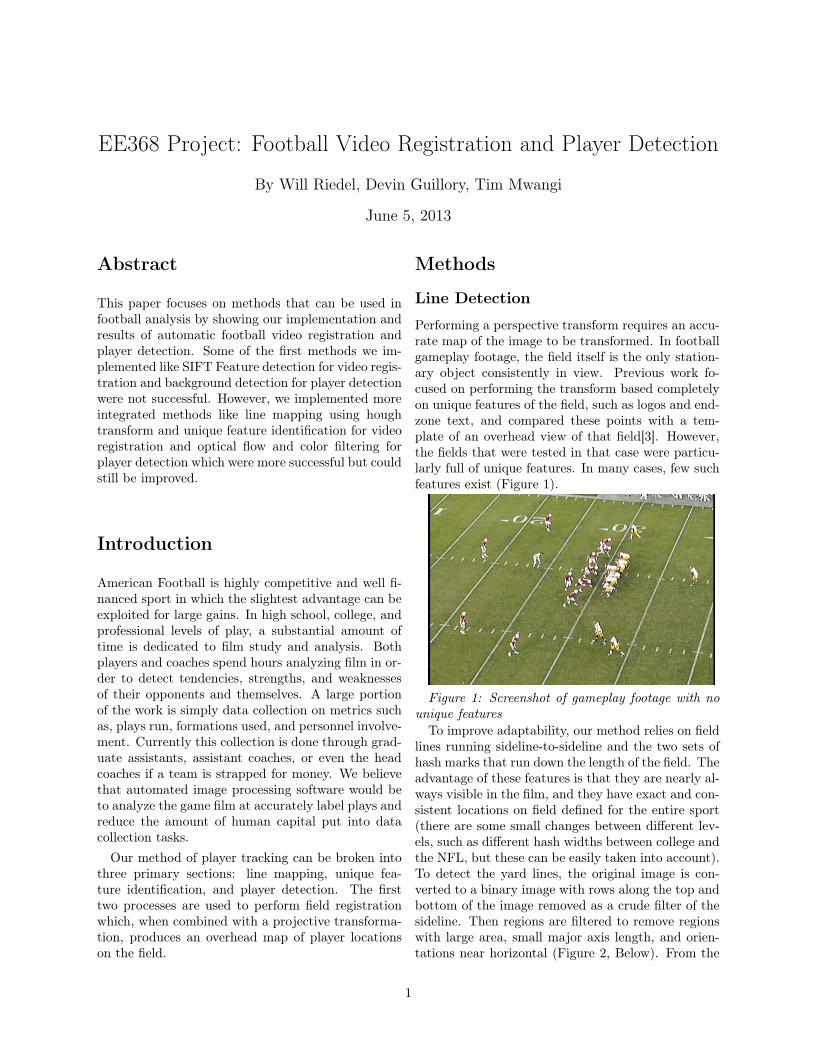
Performing a perspective transform requires an accu-rate map of the image to be transformed. In footballgameplay footage, the field itself is the only station-ary object consistently in view. Previous work fo-cused on performing the transform based completelyon unique features of the field, such as logos and end-zone text, and compared these points with a tem-plate of an overhead view of that field[3]. However,the fields that were tested in that case were particu-larly full of unique features. In many cases, few suchfeatures exist (Figure 1).
Figure 1: Screenshot of gameplay footage with nounique features
To improve adaptability, our method relies on fieldlines running sideline-to-sideline and the two sets ofhash marks that run down the length of the field. Theadvantage of these features is that they are nearly al-ways visible in the film, and they have exact and con-sistent locations on field defined for the entire sport(there are some small changes between different lev-els, such as different hash widths between college andthe NFL, but these can be easily taken into account).To detect the yard lines, the original image is con-verted to a binary image with rows along the top andbottom of the image removed as a crude filter of thesideline. Then regions are filtered to remove regionswith large area, small major axis length, and orien-tations near horizontal (Figure 2, Below). From the
1
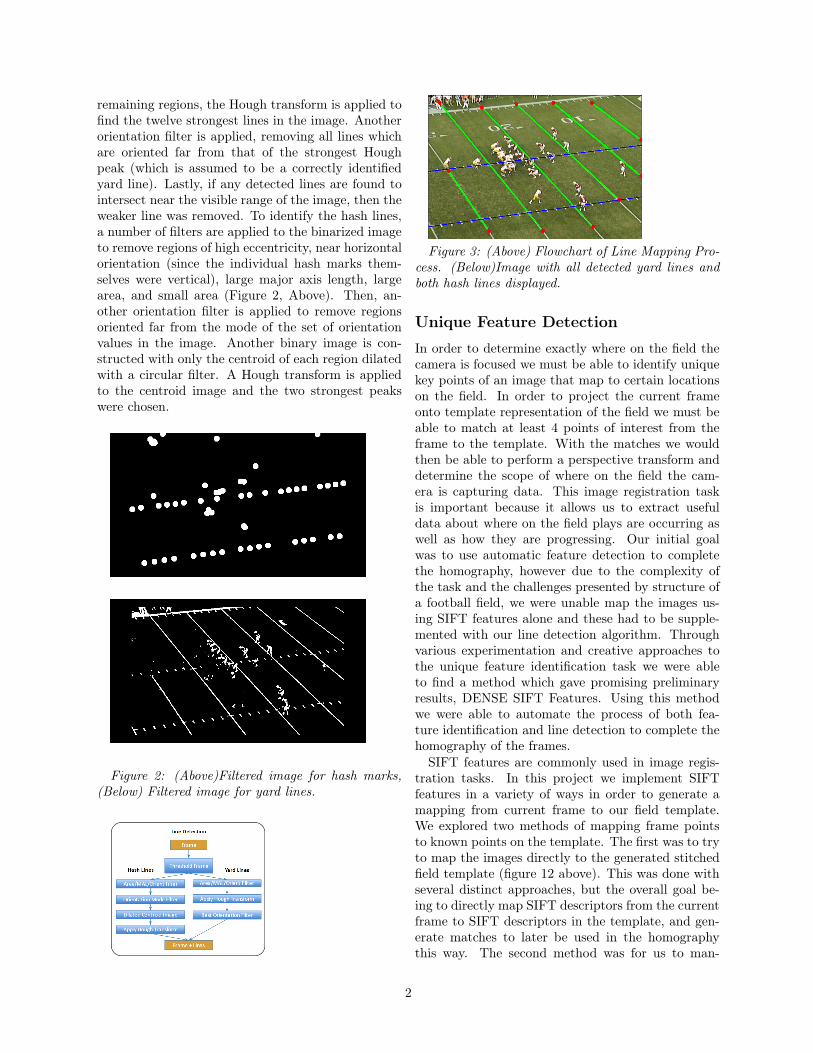
remaining regions, the Hough transform is applied tofind the twelve strongest lines in the image. Anotherorientation filter is applied, removing all lines whichare oriented far from that of the strongest Houghpeak (which is assumed to be a correctly identifiedyard line). Lastly, if any detected lines are found tointersect near the visible range of the image, then theweaker line was removed. To identify the hash lines,a number of filters are applied to the binarized imageto remove regions of high eccentricity, near horizontalorientation (since the individual hash marks them-selves were vertical), large major axis length, largearea, and small area (Figure 2, Above). Then, an-other orientation filter is applied to remove regionsoriented far from the mode of the set of orientationvalues in the image. Another binary image is con-structed with only the centroid of each region dilatedwith a circular filter. A Hough transform is appliedto the centroid image and the two strongest peakswere chosen.
Figure 2: (Above)Filtered image for hash marks,(Below) Filtered image for yard lines.
Figure 3: (Above) Flowchart of Line Mapping Pro-cess. (Below)Image with all detected yard lines andboth hash lines displayed.
Unique Feature Detection
In order to determine exactly where on the field thecamera is focused we must be able to identify uniquekey points of an image that map to certain locationson the field. In order to project the current frameonto template representation of the field we must beable to match at least 4 points of interest from theframe to the template. With the matches we wouldthen be able to perform a perspective transform anddetermine the scope of where on the field the cam-era is capturing data. This image registration taskis important because it allows us to extract usefuldata about where on the field plays are occurring aswell as how they are progressing. Our initial goalwas to use automatic feature detection to completethe homography, however due to the complexity ofthe task and the challenges presented by structure ofa football field, we were unable map the images us-ing SIFT features alone and these had to be supple-mented with our line detection algorithm. Throughvarious experimentation and creative approaches tothe unique feature identification task we were ableto find a method which gave promising preliminaryresults, DENSE SIFT Features. Using this methodwe were able to automate the process of both fea-ture identification and line detection to complete thehomography of the frames.
SIFT features are commonly used in image regis-tration tasks. In this project we implement SIFTfeatures in a variety of ways in order to generate amapping from current frame to our field template.We explored two methods of mapping frame pointsto known points on the template. The first was to tryto map the images directly to the generated stitchedfield template (figure 12 above). This was done withseveral distinct approaches, but the overall goal be-ing to directly map SIFT descriptors from the currentframe to SIFT descriptors in the template, and gen-erate matches to later be used in the homographythis way. The second method was for us to man-
2
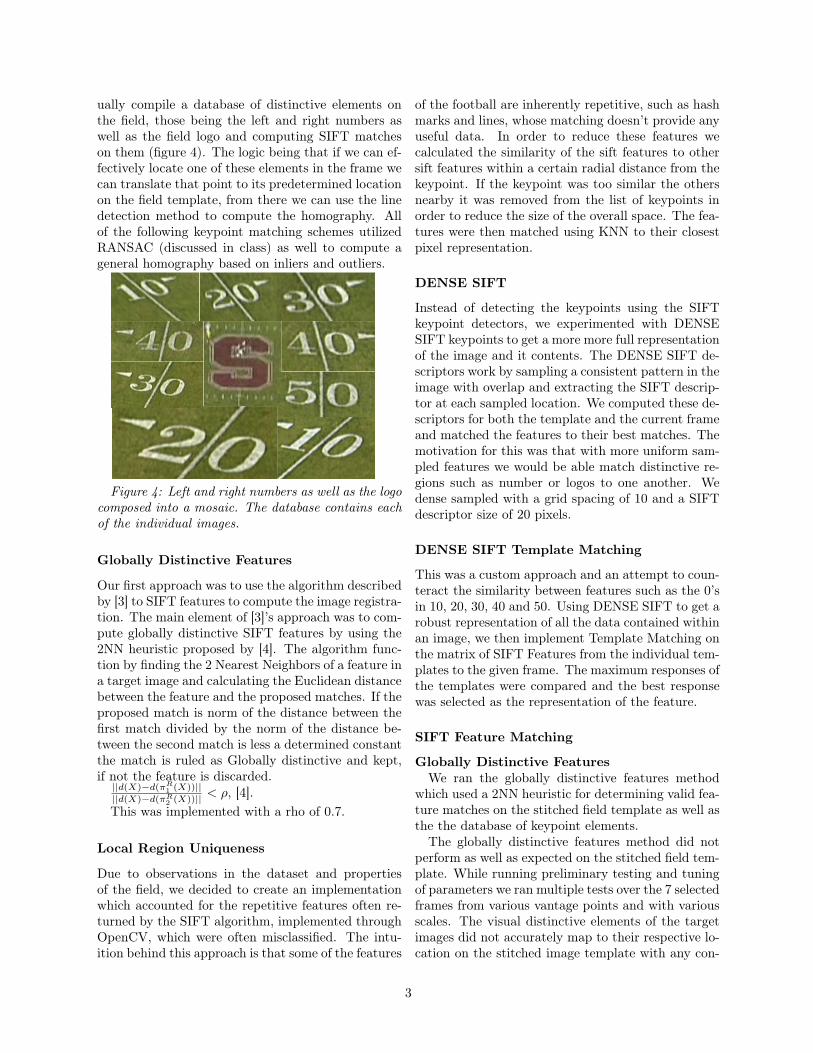
ually compile a database of distinctive elements onthe field, those being the left and right numbers aswell as the field logo and computing SIFT matcheson them (figure 4). The logic being that if we can ef-fectively locate one of these elements in the frame wecan translate that point to its predetermined locationon the field template, from there we can use the linedetection method to compute the homography. Allof the following keypoint matching schemes utilizedRANSAC (discussed in class) as well to compute ageneral homography based on inliers and outliers.
Figure 4: Left and right numbers as well as the logocomposed into a mosaic. The database contains eachof the individual images.
Globally Distinctive Features
Our first approach was to use the algorithm describedby [3] to SIFT features to compute the image registra-tion. The main element of [3]’s approach was to com-pute globally distinctive SIFT features by using the2NN heuristic proposed by [4]. The algorithm func-tion by finding the 2 Nearest Neighbors of a feature ina target image and calculating the Euclidean distancebetween the feature and the proposed matches. If theproposed match is norm of the distance between thefirst match divided by the norm of the distance be-tween the second match is less a determined constantthe match is ruled as Globally distinctive and kept,if not the feature is discarded.
||d(X)�d(⇡R
1 (X))||||d(X)�d(⇡R
2 (X))|| < ⇢, [4].This was implemented with a rho of 0.7.
Local Region Uniqueness
Due to observations in the dataset and propertiesof the field, we decided to create an implementationwhich accounted for the repetitive features often re-turned by the SIFT algorithm, implemented throughOpenCV, which were often misclassified. The intu-ition behind this approach is that some of the features
of the football are inherently repetitive, such as hashmarks and lines, whose matching doesn’t provide anyuseful data. In order to reduce these features wecalculated the similarity of the sift features to othersift features within a certain radial distance from thekeypoint. If the keypoint was too similar the othersnearby it was removed from the list of keypoints inorder to reduce the size of the overall space. The fea-tures were then matched using KNN to their closestpixel representation.
DENSE SIFT
Instead of detecting the keypoints using the SIFTkeypoint detectors, we experimented with DENSESIFT keypoints to get a more more full representationof the image and it contents. The DENSE SIFT de-scriptors work by sampling a consistent pattern in theimage with overlap and extracting the SIFT descrip-tor at each sampled location. We computed these de-scriptors for both the template and the current frameand matched the features to their best matches. Themotivation for this was that with more uniform sam-pled features we would be able match distinctive re-gions such as number or logos to one another. Wedense sampled with a grid spacing of 10 and a SIFTdescriptor size of 20 pixels.
DENSE SIFT Template Matching
This was a custom approach and an attempt to coun-teract the similarity between features such as the 0’sin 10, 20, 30, 40 and 50. Using DENSE SIFT to get arobust representation of all the data contained withinan image, we then implement Template Matching onthe matrix of SIFT Features from the individual tem-plates to the given frame. The maximum responses ofthe templates were compared and the best responsewas selected as the representation of the feature.
SIFT Feature Matching
Globally Distinctive FeaturesWe ran the globally distinctive features method
which used a 2NN heuristic for determining valid fea-ture matches on the stitched field template as well asthe the database of keypoint elements.
The globally distinctive features method did notperform as well as expected on the stitched field tem-plate. While running preliminary testing and tuningof parameters we ran multiple tests over the 7 selectedframes from various vantage points and with variousscales. The visual distinctive elements of the targetimages did not accurately map to their respective lo-cation on the stitched image template with any con-
3
sistency. The issue seems to be two-fold, one that theopencv SIFT detector was not classifying the samerespective elements as keypoints in the frames as itwas with the template image. We believe this wasbecause of the perspective transformations appliedto images in order to generate the template, as wellas the downsampling of the image to create an scalethat was easier to visualize and perform computationupon. The original stitched image was of size ~6000by ~4000 pixel and was computationally expensive tocompute globally distinct features. The second issuethat contributes to failure of this template match-ing is that unlike the Oregon State sample templatewhich contains 3 distinctive logos that appear in alarge portion of the given frames, the Stanford Sta-dium field was fairly uniform and didn’t contain thestrong or consistent globally distinctive elements ofOregon States Field and the few strong elements thatdid appear the midfield and endzone logos appearedfairly infrequently. Only 1 of the 7 test images suc-ceeded in classification. This was due to the fact thatone of the test image contained the Stanford S andwas thus easier to map to with the globally distinctivefeatures. This 14 percent accuracy is a bit mislead-ing because the majority of the film of the game willnot contain the Stanford S. Running this algorithmon sampling of 20 frames from play 1 lead to a 0%accuracy because no distinctive features are presentin the frames.
The results of this initial experiment prompted usto create a database of key elements within the im-age that could help us to determine what region ofthe field the frame was located in. Running the glob-ally distinctive feature method on the database pro-duced strong corresponding keypoints and accuratehomographic matches. As illustrated with this im-age the algorithm did well at identifying the regionson the frame which would contain the elements se-lected in the database. The algorithm however wasunable to effectively differentiate between differentnumbers. Due to the similarities of the elements inthe database, such as the zeros on the numbers.
The SIFT matching method did however performsurprisingly well at matching camera frames witheach other. This showed promise that perhaps futurework could include interactive keypoint labeling of asingle frame, from which successive SIFT matchingcould update our current position.
DENSE SIFT - ResultsThe DENSE SIFT method was used to better pick
up on features that might not be noticed in the tra-ditional sift implementation. This was also picked tobetter differentiate between numbers that share thecommon zero. Using the DENSE SIFT implementa-
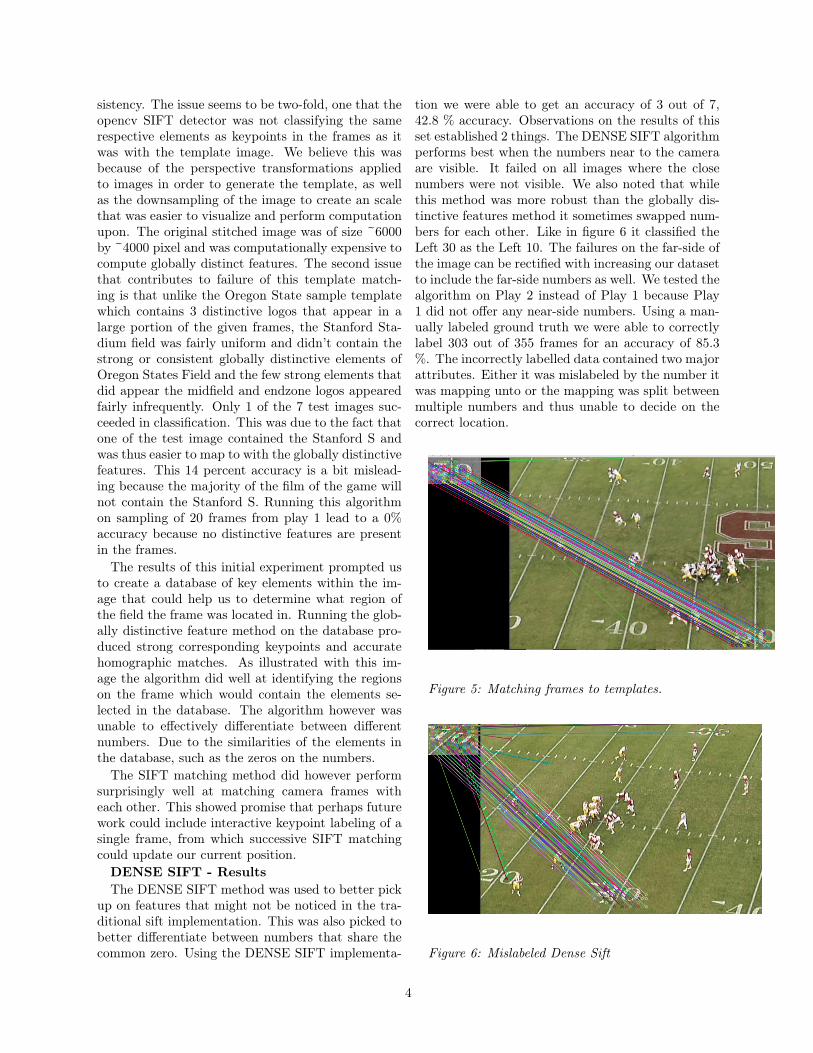
tion we were able to get an accuracy of 3 out of 7,42.8 % accuracy. Observations on the results of thisset established 2 things. The DENSE SIFT algorithmperforms best when the numbers near to the cameraare visible. It failed on all images where the closenumbers were not visible. We also noted that whilethis method was more robust than the globally dis-tinctive features method it sometimes swapped num-bers for each other. Like in figure 6 it classified theLeft 30 as the Left 10. The failures on the far-side ofthe image can be rectified with increasing our datasetto include the far-side numbers as well. We tested thealgorithm on Play 2 instead of Play 1 because Play1 did not offer any near-side numbers. Using a man-ually labeled ground truth we were able to correctlylabel 303 out of 355 frames for an accuracy of 85.3%. The incorrectly labelled data contained two majorattributes. Either it was mislabeled by the number itwas mapping unto or the mapping was split betweenmultiple numbers and thus unable to decide on thecorrect location.
Figure 5: Matching frames to templates.
Figure 6: Mislabeled Dense Sift
4
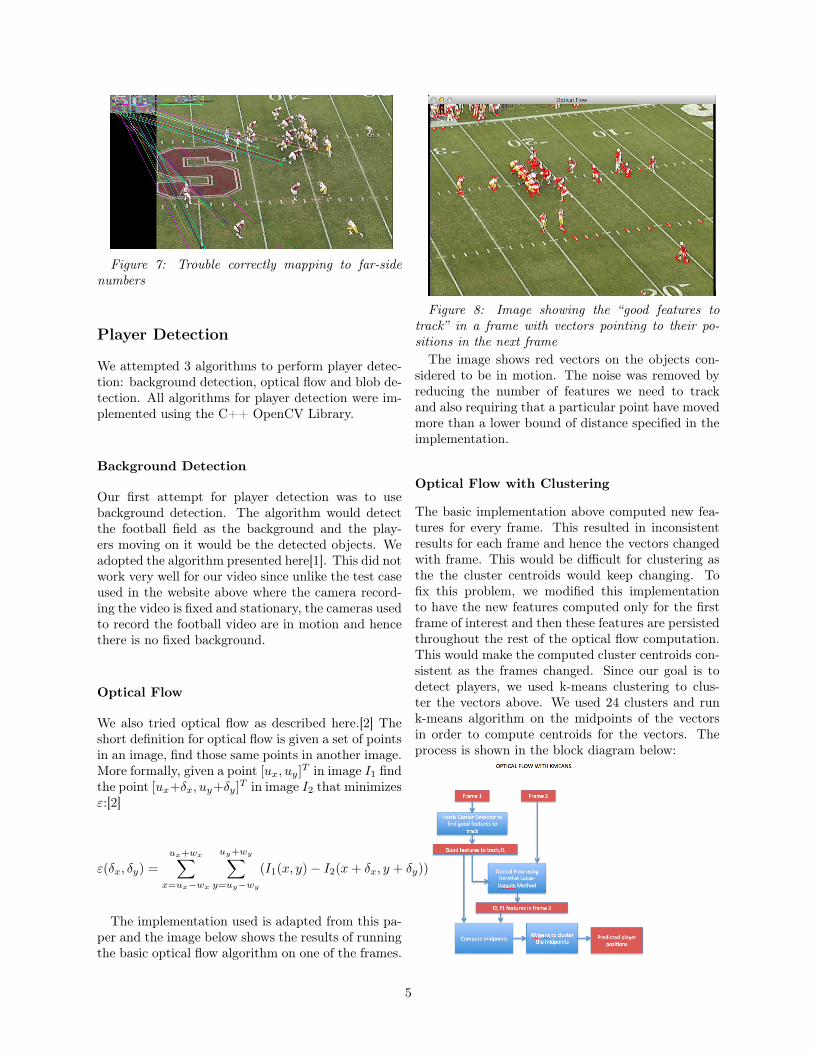
Figure 7: Trouble correctly mapping to far-sidenumbers
Player Detection
We attempted 3 algorithms to perform player detec-tion: background detection, optical flow and blob de-tection. All algorithms for player detection were im-plemented using the C++ OpenCV Library.
Background Detection
Our first attempt for player detection was to usebackground detection. The algorithm would detectthe football field as the background and the play-ers moving on it would be the detected objects. Weadopted the algorithm presented here[1]. This did notwork very well for our video since unlike the test caseused in the website above where the camera record-ing the video is fixed and stationary, the cameras usedto record the football video are in motion and hencethere is no fixed background.
Optical Flow
We also tried optical flow as described here.[2] Theshort definition for optical flow is given a set of pointsin an image, find those same points in another image.More formally, given a point [u
x
, u
y
]T in image I1 findthe point [u
x
+�
x
, u
y
+�
y
]T in image I2 that minimizes":[2]
"(�x
, �
y
) =u
x
+w
xX
x=u
x
�w
x
u
y
+w
yX
y=u
y
�w
y
(I1(x, y)� I2(x+ �
x
, y + �
y
))
The implementation used is adapted from this pa-per and the image below shows the results of runningthe basic optical flow algorithm on one of the frames.
Figure 8: Image showing the “good features totrack” in a frame with vectors pointing to their po-sitions in the next frame
The image shows red vectors on the objects con-sidered to be in motion. The noise was removed byreducing the number of features we need to trackand also requiring that a particular point have movedmore than a lower bound of distance specified in theimplementation.
Optical Flow with Clustering
The basic implementation above computed new fea-tures for every frame. This resulted in inconsistentresults for each frame and hence the vectors changedwith frame. This would be difficult for clustering asthe the cluster centroids would keep changing. Tofix this problem, we modified this implementationto have the new features computed only for the firstframe of interest and then these features are persistedthroughout the rest of the optical flow computation.This would make the computed cluster centroids con-sistent as the frames changed. Since our goal is todetect players, we used k-means clustering to clus-ter the vectors above. We used 24 clusters and runk-means algorithm on the midpoints of the vectorsin order to compute centroids for the vectors. Theprocess is shown in the block diagram below:
5
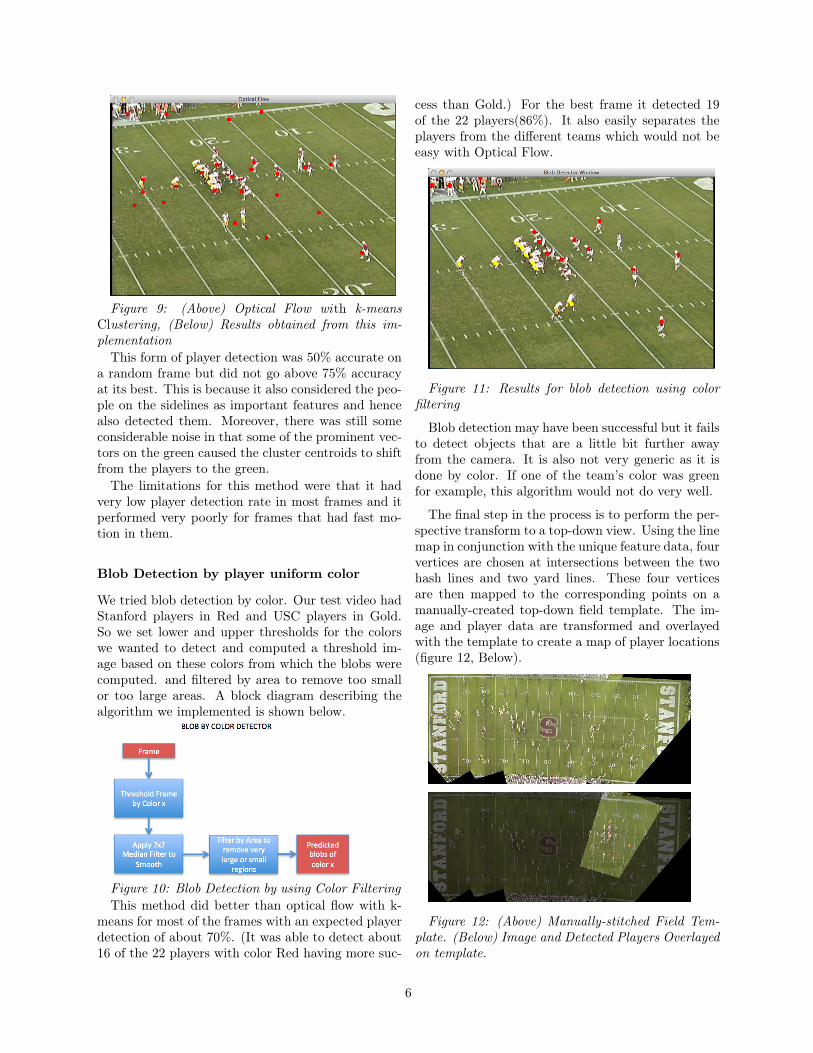
Figure 9: (Above) Optical Flow with k-meansClustering, (Below) Results obtained from this im-plementation
This form of player detection was 50% accurate ona random frame but did not go above 75% accuracyat its best. This is because it also considered the peo-ple on the sidelines as important features and hencealso detected them. Moreover, there was still someconsiderable noise in that some of the prominent vec-tors on the green caused the cluster centroids to shiftfrom the players to the green.
The limitations for this method were that it hadvery low player detection rate in most frames and itperformed very poorly for frames that had fast mo-tion in them.
Blob Detection by player uniform color
We tried blob detection by color. Our test video hadStanford players in Red and USC players in Gold.So we set lower and upper thresholds for the colorswe wanted to detect and computed a threshold im-age based on these colors from which the blobs werecomputed. and filtered by area to remove too smallor too large areas. A block diagram describing thealgorithm we implemented is shown below.
Figure 10: Blob Detection by using Color FilteringThis method did better than optical flow with k-
means for most of the frames with an expected playerdetection of about 70%. (It was able to detect about16 of the 22 players with color Red having more suc-
cess than Gold.) For the best frame it detected 19of the 22 players(86%). It also easily separates theplayers from the different teams which would not beeasy with Optical Flow.
Figure 11: Results for blob detection using colorfiltering
Blob detection may have been successful but it failsto detect objects that are a little bit further awayfrom the camera. It is also not very generic as it isdone by color. If one of the team’s color was greenfor example, this algorithm would not do very well.
The final step in the process is to perform the per-spective transform to a top-down view. Using the linemap in conjunction with the unique feature data, fourvertices are chosen at intersections between the twohash lines and two yard lines. These four verticesare then mapped to the corresponding points on amanually-created top-down field template. The im-age and player data are transformed and overlayedwith the template to create a map of player locations(figure 12, Below).
Figure 12: (Above) Manually-stitched Field Tem-plate. (Below) Image and Detected Players Overlayedon template.
6
Results and Discussion
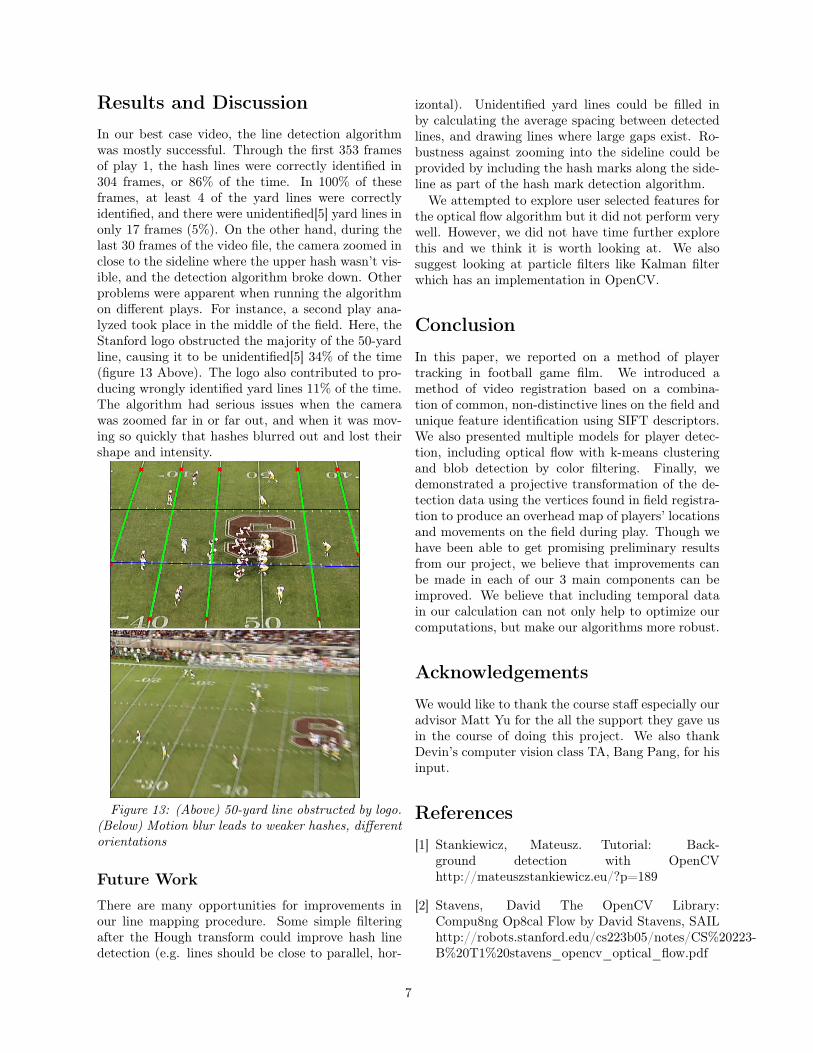
In our best case video, the line detection algorithmwas mostly successful. Through the first 353 framesof play 1, the hash lines were correctly identified in304 frames, or 86% of the time. In 100% of theseframes, at least 4 of the yard lines were correctlyidentified, and there were unidentified[5] yard lines inonly 17 frames (5%). On the other hand, during thelast 30 frames of the video file, the camera zoomed inclose to the sideline where the upper hash wasn’t vis-ible, and the detection algorithm broke down. Otherproblems were apparent when running the algorithmon different plays. For instance, a second play ana-lyzed took place in the middle of the field. Here, theStanford logo obstructed the majority of the 50-yardline, causing it to be unidentified[5] 34% of the time(figure 13 Above). The logo also contributed to pro-ducing wrongly identified yard lines 11% of the time.The algorithm had serious issues when the camerawas zoomed far in or far out, and when it was mov-ing so quickly that hashes blurred out and lost theirshape and intensity.
Figure 13: (Above) 50-yard line obstructed by logo.(Below) Motion blur leads to weaker hashes, differentorientations
Future Work
There are many opportunities for improvements inour line mapping procedure. Some simple filteringafter the Hough transform could improve hash linedetection (e.g. lines should be close to parallel, hor-
izontal). Unidentified yard lines could be filled inby calculating the average spacing between detectedlines, and drawing lines where large gaps exist. Ro-bustness against zooming into the sideline could beprovided by including the hash marks along the side-line as part of the hash mark detection algorithm.
We attempted to explore user selected features forthe optical flow algorithm but it did not perform verywell. However, we did not have time further explorethis and we think it is worth looking at. We alsosuggest looking at particle filters like Kalman filterwhich has an implementation in OpenCV.
Conclusion
In this paper, we reported on a method of playertracking in football game film. We introduced amethod of video registration based on a combina-tion of common, non-distinctive lines on the field andunique feature identification using SIFT descriptors.We also presented multiple models for player detec-tion, including optical flow with k-means clusteringand blob detection by color filtering. Finally, wedemonstrated a projective transformation of the de-tection data using the vertices found in field registra-tion to produce an overhead map of players’ locationsand movements on the field during play. Though wehave been able to get promising preliminary resultsfrom our project, we believe that improvements canbe made in each of our 3 main components can beimproved. We believe that including temporal datain our calculation can not only help to optimize ourcomputations, but make our algorithms more robust.
Acknowledgements
We would like to thank the course staff especially ouradvisor Matt Yu for the all the support they gave usin the course of doing this project. We also thankDevin’s computer vision class TA, Bang Pang, for hisinput.
References
[1] Stankiewicz, Mateusz. Tutorial: Back-ground detection with OpenCVhttp://mateuszstankiewicz.eu/?p=189
[2] Stavens, David The OpenCV Library:Compu8ng Op8cal Flow by David Stavens, SAILhttp://robots.stanford.edu/cs223b05/notes/CS%20223-B%20T1%20stavens_opencv_optical_flow.pdf
7

[3] R Hess, A Fern. Improved Video Registra-tion using Non-Distinctive Local Image Fea-tures http://eecs.oregonstate.edu/football/wp-content/papers/register- cvpr07.pdf
[4] Lowe, David G. Distinctive image features fromscale-invariant keypoints, International Journal ofComputer Vision, 60, 2 (2004), pp. 91-110
[5] “unidentified” defined here as undetected lineswith detected lines on both sides
Appendix
What we did:Will: Line Detection and HomographyDevin: Unique Feature IdentificationTim: Player Detection
8