Economical Electric School Bus (EESB) Final Project Report – June ...
Treball de Fi de Grau
Enginyeria en Tecnologies Industrials
ECONOMICAL STUDY OF ELECTRIC POWER TRANSMISSION WITH SUPERCONDUCTING
LINES FOR HVDC SYSTEMS.
MEMÒRIA
Autor: Ferran Prats Campmany Director: Marc Cheah Mañé Convocatòria: Juny 2021
Escola Tècnica Superior d’Enginyeria Industrial de Barcelona

Economical Study of Electric Power Transmission with SC for HVDC
2
Economical Study of Electric Power Transmission with SC for HVDC
3
Abstract With the continuous increase in electricity demand, the ever-growing production of renewable energy and the necessity to connect distant areas to consolidate a more interconnected grid, necessity for more efficient and less impactful means of electricity transportation are needed. For this reason, transmission using superconductors is called to be a candidate for future energy distribution. Superconductors are the perfect candidate for power electricity, given the lack of resistive losses power incurs when circulating through them, provided that sufficient cooling is provided. This bachelor thesis aims to estimate the cost of installing a superconducting line and to see whether it would fit, economically and viability wise, in the future European super grid. With the development of a technical-economic analysis of the characteristics of SCTL, this technology will be studied in depth to understand under which conditions it can be successfully applied. Models for cost and variables have been extracted from literature and previous works, when possible, and adapted to the concrete set of characteristics of this study. Whenever this has not been possible, regression equations from the available data have been used. Besides giving cost functions, the analysis is applied to a case study to draw a comparison between traditional transmission systems and SCTL. The case study will be the German Süd Link, one of the future arteries of electricity transmission that will connect Europe from the second half of the 2020’s.

Economical Study of Electric Power Transmission with SC for HVDC
4
Economical Study of Electric Power Transmission with SC for HVDC
5
Table of Contents ABSTRACT ........................................................................................................................................................... 3 LIST OF ACRONYMS ......................................................................................................................................... 7 1 INTRODUCTION .............................................................................................................................................. 8
1.1 POWER TRANSMISSION TECHNOLOGIES ........................................................................................................ 8 1.1.1 Overhead Lines (OHL) ......................................................................................................................... 9 1.2.2 Underground & Submarine Cables ...................................................................................................... 9
1.2 CURRENT FLOW ............................................................................................................................................ 9 2 SUPERCONDUCTORS .................................................................................................................................. 10
2.1 HISTORY ...................................................................................................................................................... 10 2.2 SUPERCONDUCTING TRANSMISSION LINES ................................................................................................. 11 2.3 ADVANTAGES OF SCTL .............................................................................................................................. 11 2.4 CURRENT SCTL PROJECTS .......................................................................................................................... 12
3 OBJECTIVES ................................................................................................................................................... 13 4 SCTL TECHNICAL BACKGROUND AND INFRASTRUCTURE .......................................................... 14
4.1 SC CABLE DESIGN ...................................................................................................................................... 14 4.1.2 Conductor ........................................................................................................................................... 16 4.1.3 Coolant ............................................................................................................................................... 17
4.2 TERMINATIONS ............................................................................................................................................ 17 4.3 JOINTS ......................................................................................................................................................... 18 4.3 COOLING SYSTEM ....................................................................................................................................... 19 4.4 END STATIONS, TRANSFORMERS AND CONVERTERS ................................................................................... 21 4.5 CABLE ARRANGEMENT ............................................................................................................................... 22
4.5.1 Directly Buried Cable Arrangement ................................................................................................... 22 4.5.2 Deep Bore Tunnels Cable Arrangement ............................................................................................. 23 4.5.3 Submarine Cable ................................................................................................................................ 24
4.6 SCTL EFFICIENCY ....................................................................................................................................... 24 4.6.1 HVDC vs HVAC .................................................................................................................................. 25
5 COST MODELLING ....................................................................................................................................... 27 5.1 SCTL VARIABLES AND MODELLING ........................................................................................................... 27 5.2 CAPITAL COSTS ...................................................................................................................................... 28
5.2.1 Cost of SC HVDC cable ...................................................................................................................... 28 5.2.1.1 Cost of Former ............................................................................................................................................... 28 5.2.1.2 Conductor ...................................................................................................................................................... 29 5.2.1.3 Insulation Cost ............................................................................................................................................... 29 5.2.1.4 Cryostat Cost ................................................................................................................................................. 31
5.2.2 Cost of Coolant ................................................................................................................................... 35 5.2.3 Cost of Cooling Stations ..................................................................................................................... 35 5.2.4 Joints and Terminations Cost ............................................................................................................. 37 5.2.5 Laying Costs and Right of Way (ROW) .............................................................................................. 38 5.2.6 Cost of Substations ............................................................................................................................. 39
5.2.6.1 Onshore Substation ........................................................................................................................................ 39 5.2.6.2 Offshore Substation ....................................................................................................................................... 40
5.3 POWER LOSSES ....................................................................................................................................... 41 5.3.1 Cooling Power Losses ........................................................................................................................ 41 5.3.2 Converter Losses ................................................................................................................................ 41
6 CASE STUDY ................................................................................................................................................... 43 6.1 ENTSO-E AND TYDP ................................................................................................................................. 43 6.2 CASE STUDY ....................................................................................................................................... 43
6.2.1 Cost Study for SCTL ........................................................................................................................... 45 6.2.2 Cost Study for Underground Lines ..................................................................................................... 47 6.2.3 Cost Study for OHL ............................................................................................................................ 48

Economical Study of Electric Power Transmission with SC for HVDC
6
6.3 CASE STUDY DISCUSSION ........................................................................................................................... 50 7 CONCLUSIONS ............................................................................................................................................... 52 REFERENCES .................................................................................................................................................... 53
Economical Study of Electric Power Transmission with SC for HVDC
7
List of Acronyms AC – Alternate Current
DC – Direct Current
HVDC – High Voltage Direct Current
HVAC – High Voltage Alternate Current
SCTL – Superconducting Transmission Line
XLPE – Cross Linked Polyethylene
SC – Superconductor
TL – Transmission Line
RES – Renewable Energy Sources
OHL – Overhead Line
ENTSO-E – European Network of Transmission System Operators for Electricity
TYDP – Ten Year Development Plan
LCC – Line Commuted Converter
VSC – Voltage Source Converter
ROW – Right of Way
TSO – Transmission Systems Operator
T&D – Transmission and Distribution
Economical Study of Electric Power Transmission with SC for HVDC
8
1 Introduction
As massive electrification and decarbonization become priorities for future energy networks, the need for more efficient means of electricity transmission will be paramount. Major grid systems, like the European energy network, will strive toward a higher level of connectivity between countries, permitting a fluid flow of energy in the attempt to make renewable energies the main source of power.
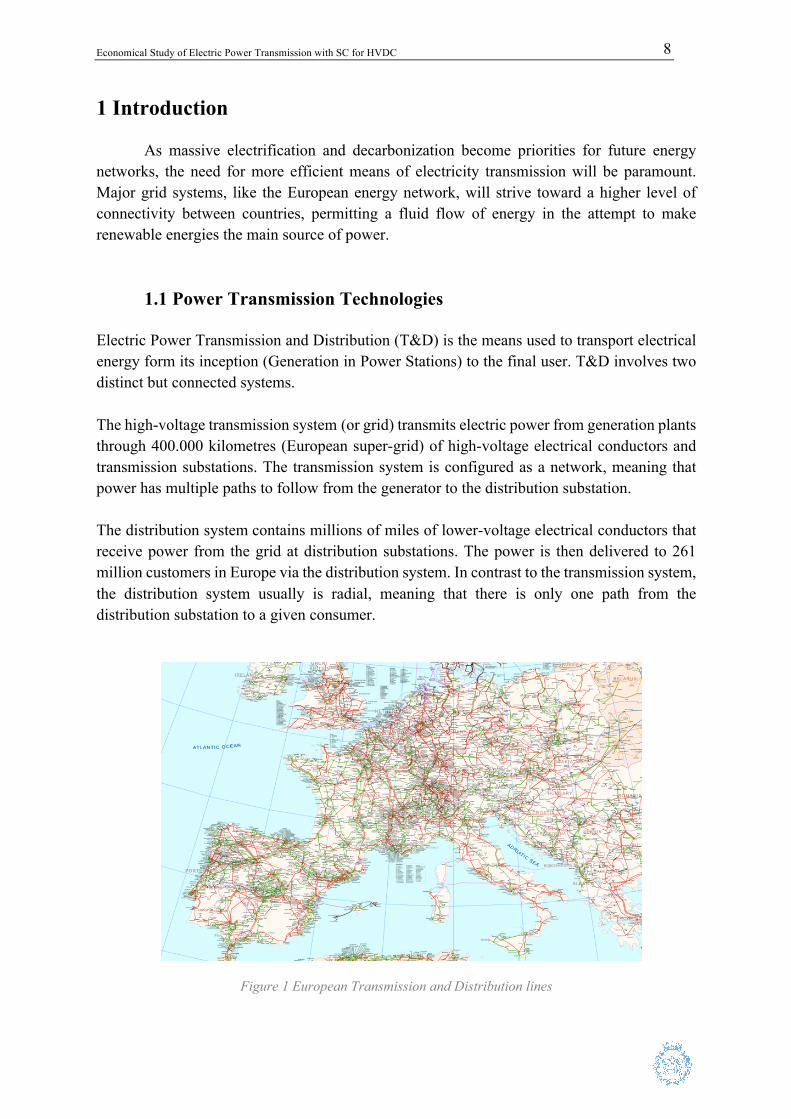
1.1 Power Transmission Technologies Electric Power Transmission and Distribution (T&D) is the means used to transport electrical energy form its inception (Generation in Power Stations) to the final user. T&D involves two distinct but connected systems. The high-voltage transmission system (or grid) transmits electric power from generation plants through 400.000 kilometres (European super-grid) of high-voltage electrical conductors and transmission substations. The transmission system is configured as a network, meaning that power has multiple paths to follow from the generator to the distribution substation. The distribution system contains millions of miles of lower-voltage electrical conductors that receive power from the grid at distribution substations. The power is then delivered to 261 million customers in Europe via the distribution system. In contrast to the transmission system, the distribution system usually is radial, meaning that there is only one path from the distribution substation to a given consumer.
Figure 1 European Transmission and Distribution lines
Economical Study of Electric Power Transmission with SC for HVDC
9
Transmission lines in their vast majority are either over-head, underground or submarine installations. Although all technologies are aimed toward electricity transport, each has its own advantages and disadvantages. 1.1.1 Overhead Lines (OHL) Overhead lines are the most common way of transferring energy from generation plants to customers, due to the low cost associated with their installation and maintenance. OHL are the most widely spread and cost-effective system for HVAC lines. OHL basically consist in supporting the cables through which electricity is transported with towers. The distance between towers, the tower design and cable sag are all variables considered at the time of designing and planning the line route. In Europe, OHL normally operate between 220 kV and 420 kV. The surrounding air provides the necessary insulation and heat dissipation. Despite multiple advantages regarding cost and ease of access for maintenance, OHL have several disadvantages when held against its counterparts. OHL are extremely exposed to weather phenomena and can lead to electrocution accidents much more easily. In addition, their visual and ecological impact can lead to negative public perception. 1.2.2 Underground & Submarine Cables Underground and submarine cable installations are a widespread alternative to Overhead lines. Among the main reasons for using such cables are space and environmental restrictions i.e., environmentally protected areas or high-density populated areas. Underground cables present a higher inductance and capacitance rates, thus making them more efficient with a greater energy density than OHL installations. Unlike OHL lines, however, underground lines cannot use the surrounding air for heat dissipation and must have built-in insulation.
1.2 Current Flow Electricity transmission is carried out either using alternating current (AC) or direct current (DC) flow. At the beginning of the 20th century, the previously common DC power transmission was replaced by AC to achieve efficient transmission of power over long distances at safe distribution voltages with the available conductors at the time. However, DC power was reinvigorated after efficient AC-DC conversion equipment was developed, since it is more desirable for long-range transmission [1]. Each power format will be briefly introduced in this chapter.
Economical Study of Electric Power Transmission with SC for HVDC
10
Alternating Current (AC) is electric current which periodically reverses direction and changes magnitude continuously through time, usually following a sine waveform (although not exclusively). It can either be transmitted in a Single-Phase or Three-Phase; the former found in most final customer appliances (two conductors) and the latter is the preferred AC transmission format. Three-Phase AC offers a much more stable power transmission and is more efficient at delivering large amounts of power over longer distances than its AC counterpart. From the generation station, the voltage is stepped up by a three-phase transformer, which allows the transmission of energy with lower power losses, and then stepped down again at the distribution side using three-phase transformer for medium or low voltage consumer-loads. Direct Current is the one-directional flow of electric charge, instead of the continually changing nature of alternating current (AC). DC is more efficient over long distances and reduces power losses due to the lack of induction and dielectric effects -present in HVAC systems- as well as offering a more stable transmission. The resulting lower losses can be attributed to the quasi-absence of dielectric, skin effects and reactive power. The power density in DC cables is also higher than its counterpart. It also allows to transmit power over unsynchronized AC grids, albeit DC transmission requires the use of rectifiers or inverters. Rectifiers are used to convert AC to DC whereas inverters do the opposite. HVDC transmission offer a higher control over the line, since they use thyristors, insulated-gate bipolar transistors and microprocessors. The main drawback associated to HVDC is the high cost of the transformation stations at the ends of the DC line, even if the overall cost in maintenance is lower than its counterpart. HVDC transmission lines can either be over-head installations or underground cables.
2 Superconductors
2.1 History In 1908, Heike Karmerling-Onnes from the University of Leiden succeeded in liquifying Helium at the incredibly low temperature of 4.2K, and soon after his laboratory began experiments with very low temperature on metals. To the researcher’s astonishment, mercury’s resistance totally disappeared at the boiling point of liquid helium, which set off the scientific pursuit and study of superconductivity [1].
Economical Study of Electric Power Transmission with SC for HVDC
11
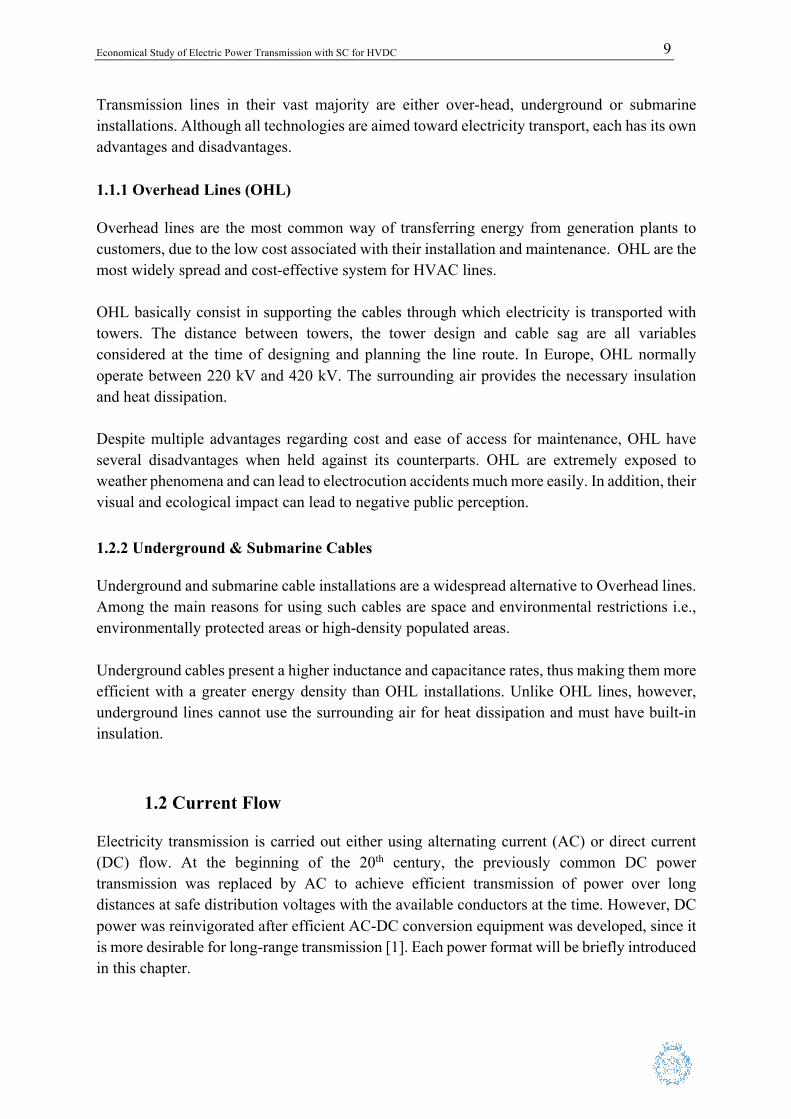
2.2 Superconducting Transmission Lines Super-Conducting Transmission Lines (SCTL) take advantage of superconducting materials to transmit power. Superconductivity or absolute perfect conductivity occurs in materials that display zero electrical resistance when cooled below a critic temperature (TC). This means that contrary to normal conductors the electric power flowing through a superconducting wire does not incur in any resistive losses, therefore making transmission much more efficient. Superconducting cables consist in a superconducting cable housed within a cryogenic envelope to keep the SC cooled below the TC. The design of SCTL shares many similarities with natural gas pipelines, insofar as carrying a highly pressurized medium and the need for refrigeration and compressor stations along the line. However, the line dimensions are much smaller, and the pressure of the coolant is lower.
Figure 2 SC cable from Nexans SCTL can work with either AC or DC format. However, DC transmission is usually the better alternative for long range power transmission. For example, two wires are used for DC rather than three and the conductor line does not need capacitive elements to cancel the inductive behaviour of AC lines, among another things. This results in fewer power losses associated with distance.
2.3 Advantages of SCTL
One of the main advantages of SCTL is the absence of resistive losses, which in case of conventional technologies transmission range from 2 to 5% for overhead lines and can be as high as 8% for underground cables (per 1000km at full load). Fewer losses would translate into increased profitability and less wasted energy.
Economical Study of Electric Power Transmission with SC for HVDC
12
When held against overhead lines, underground cables (both standard and superconducting) have several advantages [14]:
• Minimised visual impact on the landscape. • Lower exposure of the surrounding area to electromagnetic radiation. • Smaller ecological footprint. • No effect from natural phenomena such as wind or snow.
Moreover, SC cables also offer benefits that standard underground cables do not. Among them, SC cables allow for a much higher current density, meaning that for a given transmission the diameter of the SC cable can be smaller than for standard HVDC cables.
The latter also generate significant heat, which limits their maximum ampere capacity and makes additional cables necessary. SCTL cables are not affected by heat dissipation. The advantages of SC cables over standard HVDC cables can be summarised as follows:
• No heat leakage onto the surrounding soil, which is currently one of the arguments against the widespread use of standard underground cables.
• Smaller overall size for the same transmission capacity.
SC cables can transmit high currents, yet their voltage levels are flexible and can be tailored for optimal performance. Lower voltages equal simplified electrical insulation, and this can mean fewer transformer stations when the voltage of adjacent grids is matched.
2.4 Current SCTL Projects
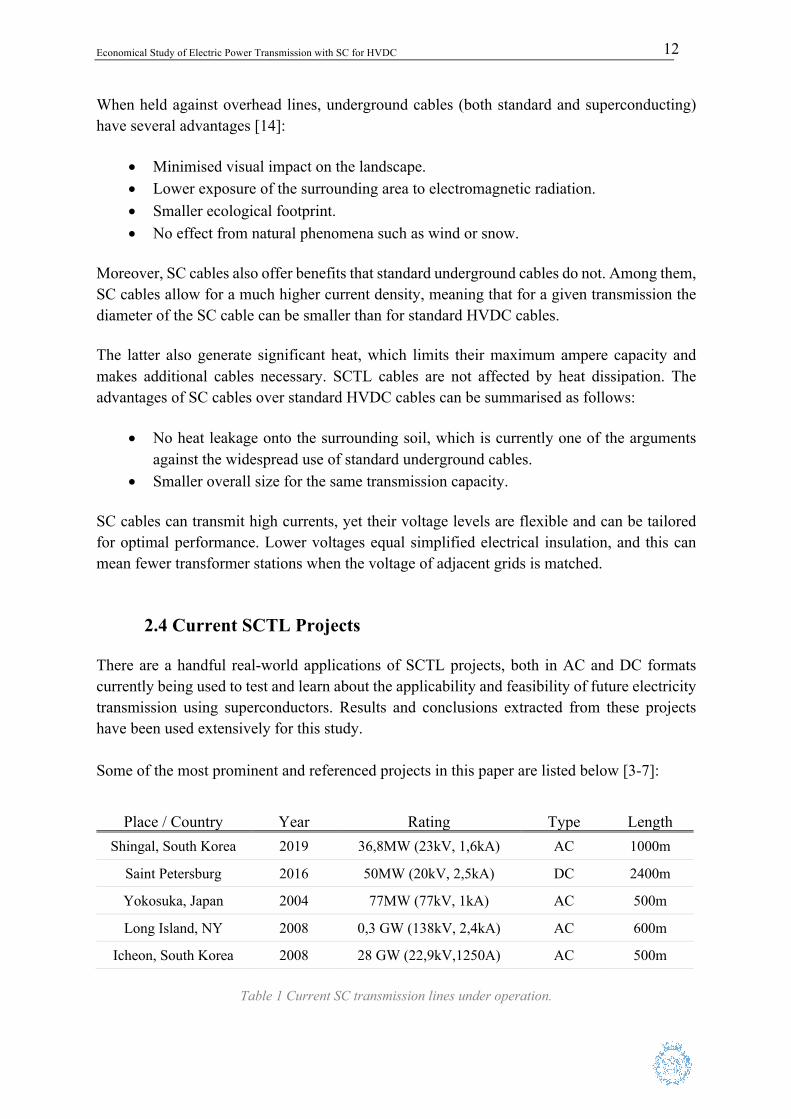
There are a handful real-world applications of SCTL projects, both in AC and DC formats currently being used to test and learn about the applicability and feasibility of future electricity transmission using superconductors. Results and conclusions extracted from these projects have been used extensively for this study. Some of the most prominent and referenced projects in this paper are listed below [3-7]:
Place / Country Year Rating Type Length Shingal, South Korea 2019 36,8MW (23kV, 1,6kA) AC 1000m
Saint Petersburg 2016 50MW (20kV, 2,5kA) DC 2400m
Yokosuka, Japan 2004 77MW (77kV, 1kA) AC 500m
Long Island, NY 2008 0,3 GW (138kV, 2,4kA) AC 600m
Icheon, South Korea 2008 28 GW (22,9kV,1250A) AC 500m
Table 1 Current SC transmission lines under operation.
Economical Study of Electric Power Transmission with SC for HVDC
13
3 Objectives
This project aims to provide an accurate cost model of superconducting technology implementation in electricity transmission lines, and whether such technology is feasible for future large-scale integration. The main objectives are the following:
• Develop and adjust an accurate cost analysis of the infrastructure surrounding a Superconducting Line Transmission from the available sources. The cost model must cater to different variables such as length, capacity, voltage, etc.
• Compare the cost between existing transmission technologies and superconducting
lines and see under which proposed scenarios the cost of the latter would be lower. • See if under a planned European grid development project from the TYDP 2020
Portfolio Superconducting lines would have lower cost than the alternatives. The thesis is divided in the subsequent chapters:
• Chapter 4: SCTL technical background and Infrastructure. The objective is to give a clear description of the technology behind SCTL and do a breakdown of the different parts involved in the total infrastructure associated.
• Chapter 5: Cost Modelling. In this chapter the aim is to provide an accurate cost approximation of the SC infrastructure considering the different variables unique to each installation.
• Chapter 6: Cost Comparison and Case study. This chapter will focus on the cost associated with the technologies currently in use and how they compare with SCTL through a case study taken from the TYDP future European super grid..
Economical Study of Electric Power Transmission with SC for HVDC
14
4 SCTL Technical Background and Infrastructure Superconducting technologies applied to power transmission have only recently been explored in a serious way and the experiments are few. Some specific solutions and designs are unique to each study, but common components can be found in all SCTL designs. This next chapter will provide a technical background and in detail explanation of each component. Multiple references will be provided, should the reader wish to further learn about a particular subject.
4.1 SC Cable Design
Superconductors are distinguished, first and foremost, by the temperature at which they operate. The operating temperature of a superconductor must always be lower (or equal) to its critic temperature (TC), which will ensure that the material always operates as a superconductor. The TC of a superconductor varies within a wide range, but we can classify superconductors into two main types [1],[8]:
• Low-Temperature Superconductors (LTS): The majority of LTS superconductors need to be cooled by helium, below the range of T=4.2 K.
• High-Temperature Superconductors (HTS): Most HTS can be cooled with liquid nitrogen (T=77 K), allowing for a simpler design of the cryogenic envelope.
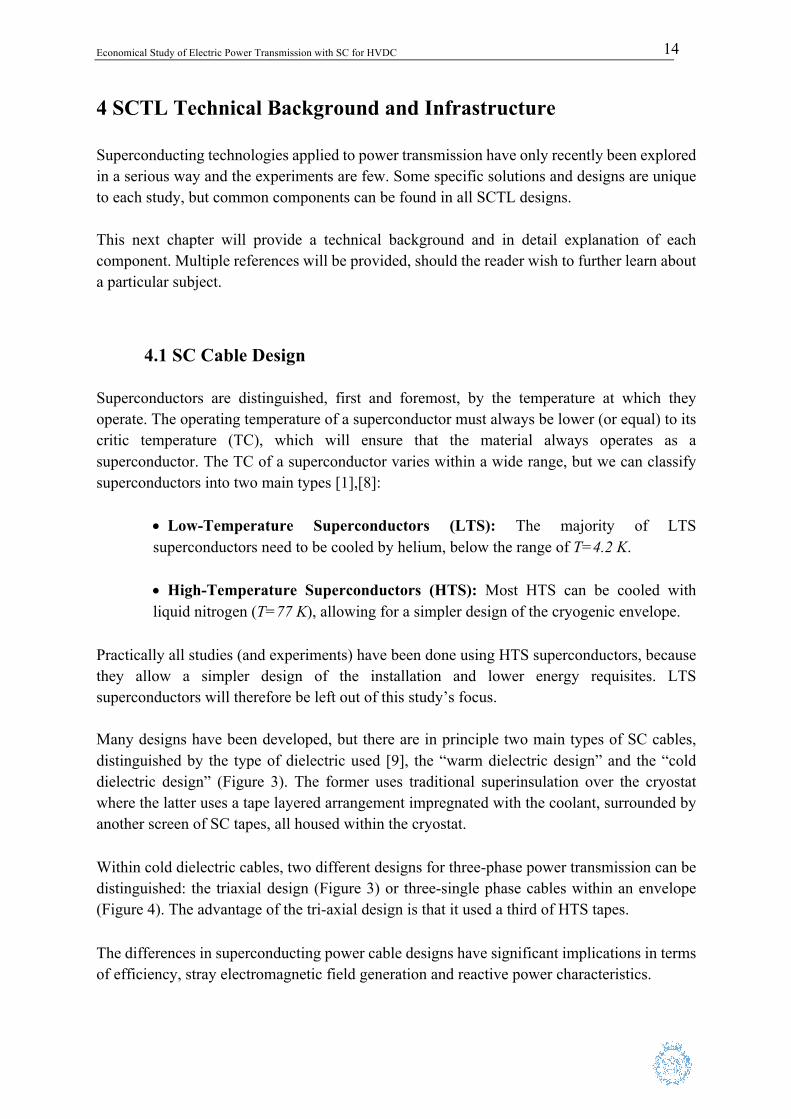
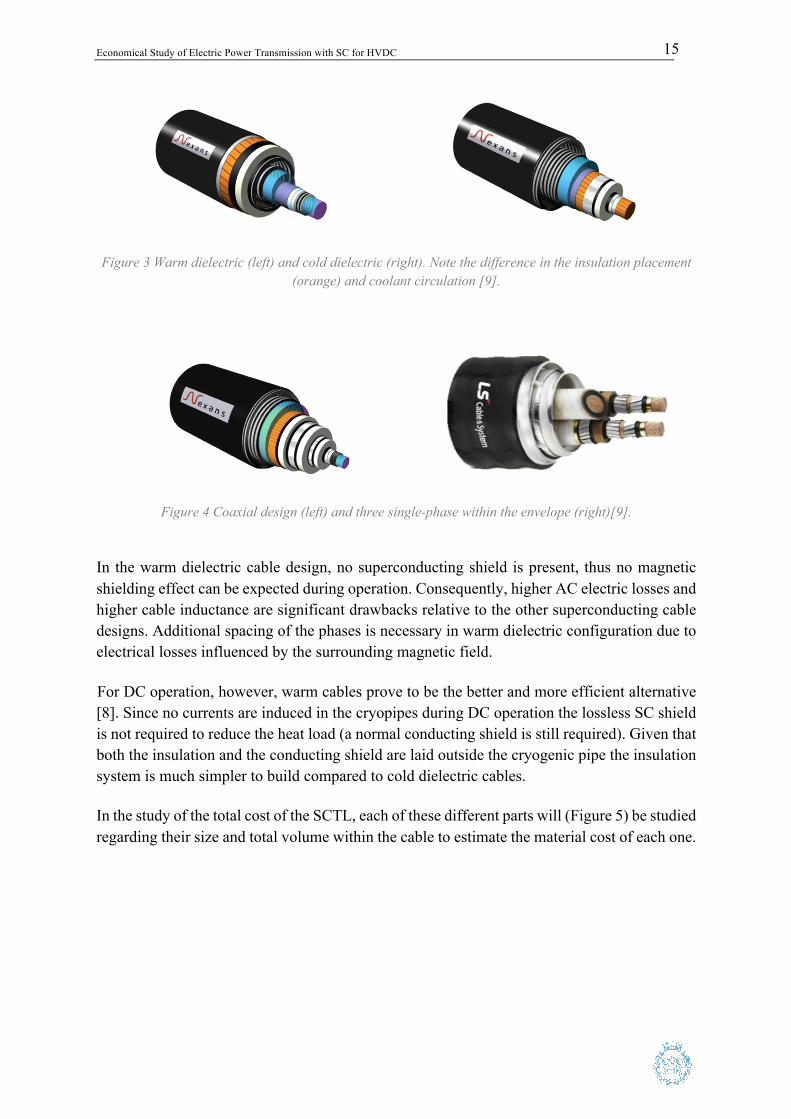
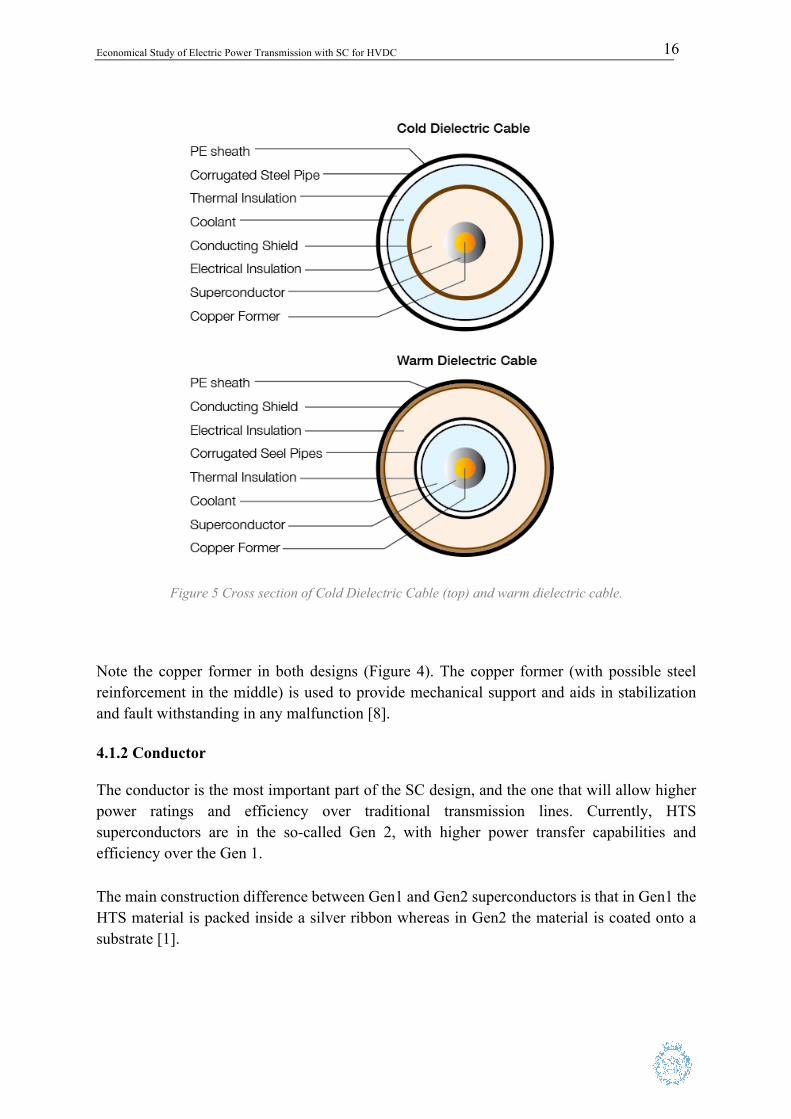
Practically all studies (and experiments) have been done using HTS superconductors, because they allow a simpler design of the installation and lower energy requisites. LTS superconductors will therefore be left out of this study’s focus. Many designs have been developed, but there are in principle two main types of SC cables, distinguished by the type of dielectric used [9], the “warm dielectric design” and the “cold dielectric design” (Figure 3). The former uses traditional superinsulation over the cryostat where the latter uses a tape layered arrangement impregnated with the coolant, surrounded by another screen of SC tapes, all housed within the cryostat. Within cold dielectric cables, two different designs for three-phase power transmission can be distinguished: the triaxial design (Figure 3) or three-single phase cables within an envelope (Figure 4). The advantage of the tri-axial design is that it used a third of HTS tapes. The differences in superconducting power cable designs have significant implications in terms of efficiency, stray electromagnetic field generation and reactive power characteristics.
Economical Study of Electric Power Transmission with SC for HVDC
15
Figure 3 Warm dielectric (left) and cold dielectric (right). Note the difference in the insulation placement (orange) and coolant circulation [9].
Figure 4 Coaxial design (left) and three single-phase within the envelope (right)[9].
In the warm dielectric cable design, no superconducting shield is present, thus no magnetic shielding effect can be expected during operation. Consequently, higher AC electric losses and higher cable inductance are significant drawbacks relative to the other superconducting cable designs. Additional spacing of the phases is necessary in warm dielectric configuration due to electrical losses influenced by the surrounding magnetic field.
For DC operation, however, warm cables prove to be the better and more efficient alternative [8]. Since no currents are induced in the cryopipes during DC operation the lossless SC shield is not required to reduce the heat load (a normal conducting shield is still required). Given that both the insulation and the conducting shield are laid outside the cryogenic pipe the insulation system is much simpler to build compared to cold dielectric cables.
In the study of the total cost of the SCTL, each of these different parts will (Figure 5) be studied regarding their size and total volume within the cable to estimate the material cost of each one.
Economical Study of Electric Power Transmission with SC for HVDC
16
Figure 5 Cross section of Cold Dielectric Cable (top) and warm dielectric cable.
Note the copper former in both designs (Figure 4). The copper former (with possible steel reinforcement in the middle) is used to provide mechanical support and aids in stabilization and fault withstanding in any malfunction [8].
4.1.2 Conductor The conductor is the most important part of the SC design, and the one that will allow higher power ratings and efficiency over traditional transmission lines. Currently, HTS superconductors are in the so-called Gen 2, with higher power transfer capabilities and efficiency over the Gen 1. The main construction difference between Gen1 and Gen2 superconductors is that in Gen1 the HTS material is packed inside a silver ribbon whereas in Gen2 the material is coated onto a substrate [1].
Economical Study of Electric Power Transmission with SC for HVDC
17
The superconducting materials commonly used in HTS Gen1 are based on the generic element BiSrCaCuO (BSCCO) with a transition temperature of 110K. Gen2 superconductors are mainly based on the materials Bi-2233 (Bi2Sr2Ca2Cu3O10) or YBCO (YBa2Cu3O7).
Some recent studies [8], [10], [11] have concluded that the affordable superconducting material magnesium diboride (MgB2) can be a better alternative to HTS SCTL, mainly due to much lower production costs [12],[8] and the abundance of raw materials in nature. MgB2 displays superconductivity below T=39 K and can be cooled either with gaseous helium or liquid hydrogen.
However, these lower costs and advantages could be offset by the fact that the cooling requirements for MgB2 can lead to higher energy losses and lower efficiency than a liquid nitrogen (LN2) cooled HTS, with a higher temperature. 4.1.3 Coolant The coolant contained in the cryostat must keep the superconductor within the desired temperature range, below the SC transition temperature. 2G-HTS superconductors are generally cooled by liquid nitrogen (LN2) at a temperature of 70K. Magnesium diboride (MgB2) requires cooling by liquid hydrogen (LH2) at a lower temperature of 25K [9]. A return line for the coolant must be implemented in every SC cable system, so that the coolant can be kept in a “closed-loop”. The return line can either be integrated within the cable cryostat (providing further insulation at the cost of a wider diameter) or run through a separate line.
4.2 Terminations The HTS cable terminations as part of the superconducting cable system provide the interface between the cable conductors at cryogenic temperature to a generator, transformer, or power transmission line at room temperature (300 K) and an interface to the cable cooling system at ground potential. The superconducting cable termination must therefore fulfill the following requirements:
• Manage the thermal gradient from cryogenic to ambient temperature. • Provide electrical field control across the interconnection. • Connect the superconducting cable to the cooling system. • Compensate the thermal shrinkage of the cable during cool down.
There are many designs each catering to the specific conditions of the cable, power rating, length, coolant, etc. Examples of the structure and materials used can be seen below.
Economical Study of Electric Power Transmission with SC for HVDC
18
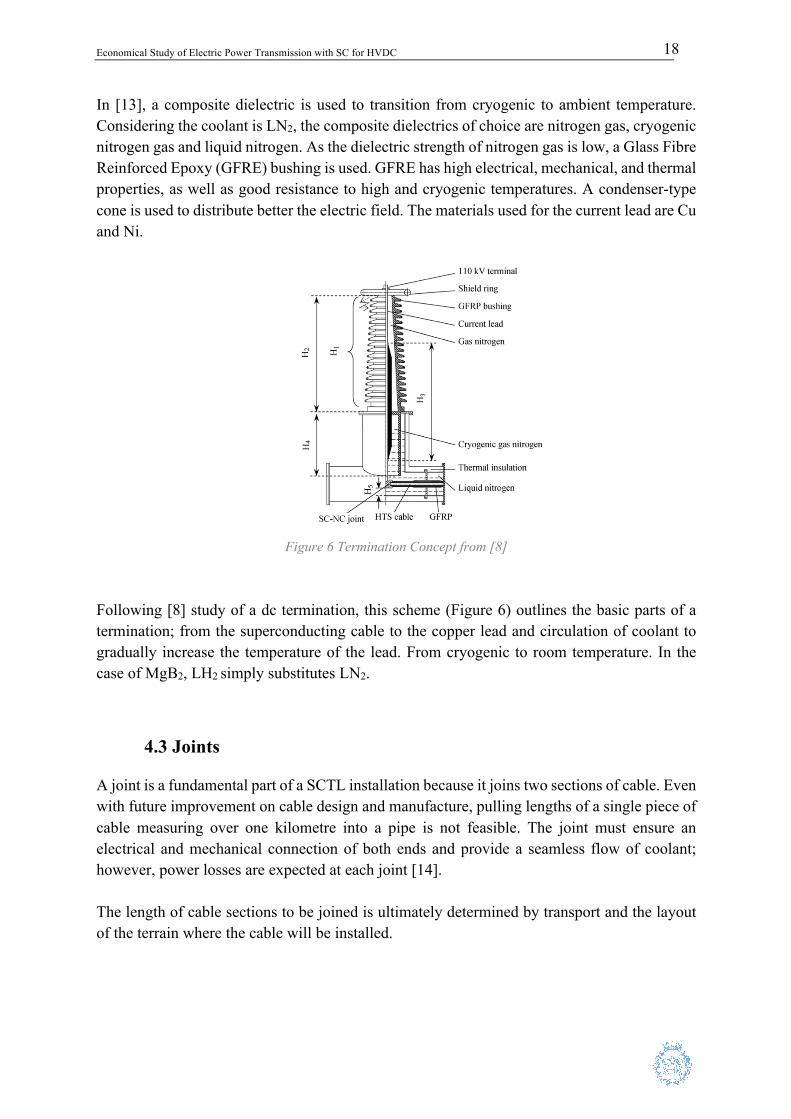
In [13], a composite dielectric is used to transition from cryogenic to ambient temperature. Considering the coolant is LN2, the composite dielectrics of choice are nitrogen gas, cryogenic nitrogen gas and liquid nitrogen. As the dielectric strength of nitrogen gas is low, a Glass Fibre Reinforced Epoxy (GFRE) bushing is used. GFRE has high electrical, mechanical, and thermal properties, as well as good resistance to high and cryogenic temperatures. A condenser-type cone is used to distribute better the electric field. The materials used for the current lead are Cu and Ni.
Figure 6 Termination Concept from [8] Following [8] study of a dc termination, this scheme (Figure 6) outlines the basic parts of a termination; from the superconducting cable to the copper lead and circulation of coolant to gradually increase the temperature of the lead. From cryogenic to room temperature. In the case of MgB2, LH2 simply substitutes LN2.
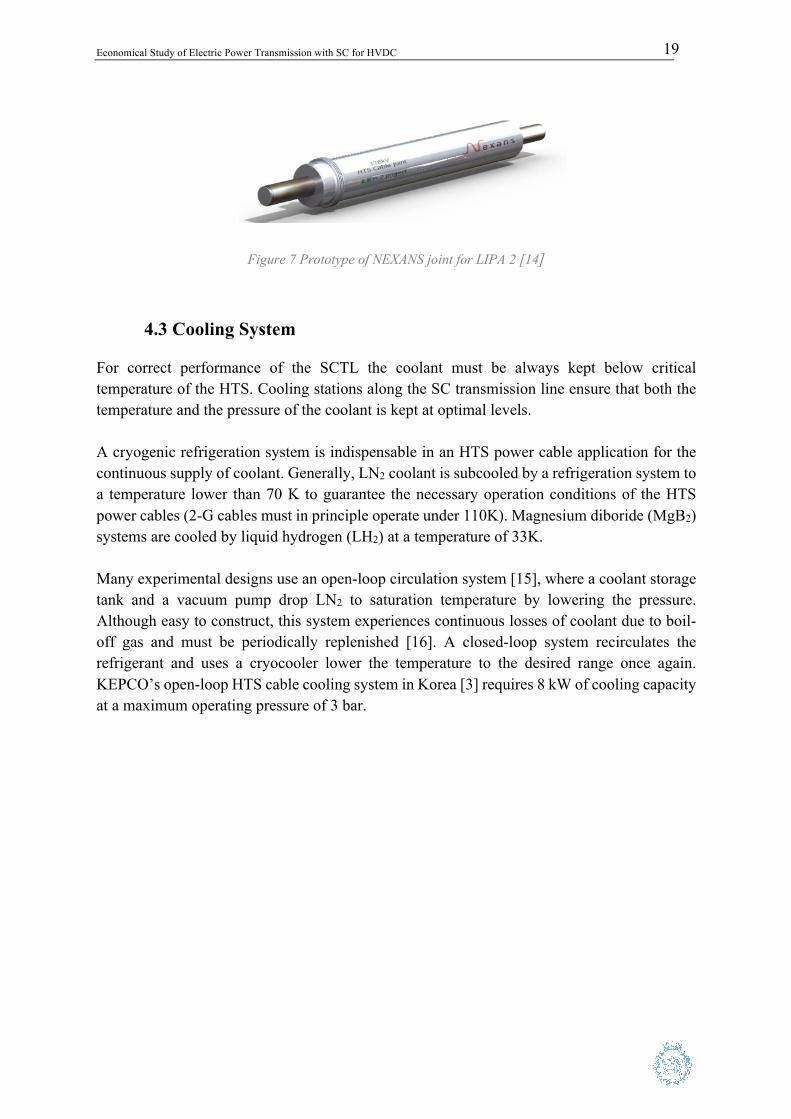
4.3 Joints A joint is a fundamental part of a SCTL installation because it joins two sections of cable. Even with future improvement on cable design and manufacture, pulling lengths of a single piece of cable measuring over one kilometre into a pipe is not feasible. The joint must ensure an electrical and mechanical connection of both ends and provide a seamless flow of coolant; however, power losses are expected at each joint [14]. The length of cable sections to be joined is ultimately determined by transport and the layout of the terrain where the cable will be installed.
Economical Study of Electric Power Transmission with SC for HVDC
19
Figure 7 Prototype of NEXANS joint for LIPA 2 [14]
4.3 Cooling System
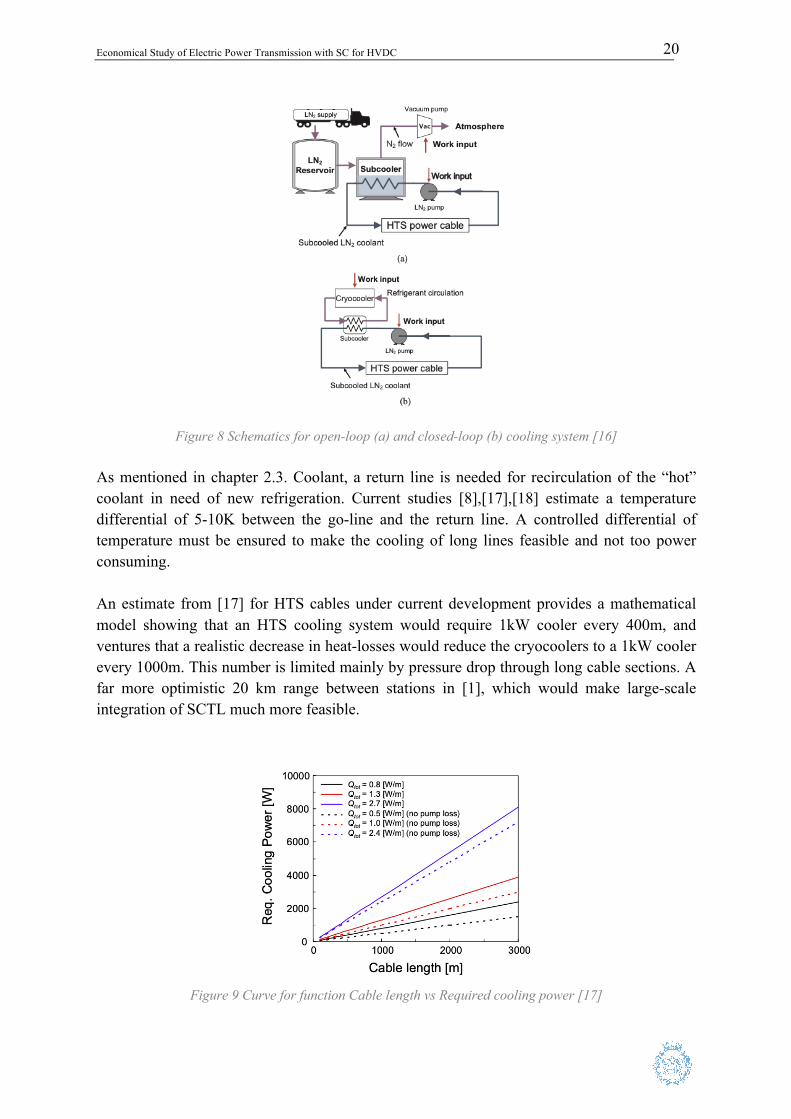
For correct performance of the SCTL the coolant must be always kept below critical temperature of the HTS. Cooling stations along the SC transmission line ensure that both the temperature and the pressure of the coolant is kept at optimal levels. A cryogenic refrigeration system is indispensable in an HTS power cable application for the continuous supply of coolant. Generally, LN2 coolant is subcooled by a refrigeration system to a temperature lower than 70 K to guarantee the necessary operation conditions of the HTS power cables (2-G cables must in principle operate under 110K). Magnesium diboride (MgB2) systems are cooled by liquid hydrogen (LH2) at a temperature of 33K. Many experimental designs use an open-loop circulation system [15], where a coolant storage tank and a vacuum pump drop LN2 to saturation temperature by lowering the pressure. Although easy to construct, this system experiences continuous losses of coolant due to boil-off gas and must be periodically replenished [16]. A closed-loop system recirculates the refrigerant and uses a cryocooler lower the temperature to the desired range once again. KEPCO’s open-loop HTS cable cooling system in Korea [3] requires 8 kW of cooling capacity at a maximum operating pressure of 3 bar.
Economical Study of Electric Power Transmission with SC for HVDC
20
Figure 8 Schematics for open-loop (a) and closed-loop (b) cooling system [16] As mentioned in chapter 2.3. Coolant, a return line is needed for recirculation of the “hot” coolant in need of new refrigeration. Current studies [8],[17],[18] estimate a temperature differential of 5-10K between the go-line and the return line. A controlled differential of temperature must be ensured to make the cooling of long lines feasible and not too power consuming.
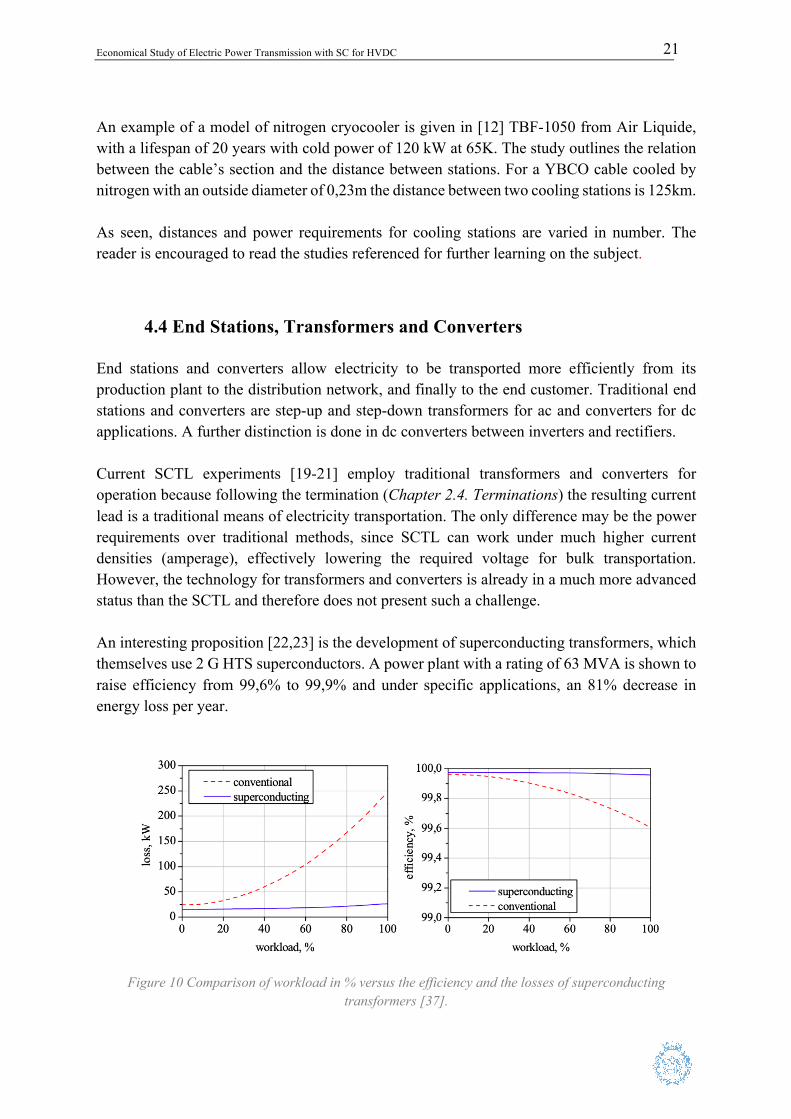
An estimate from [17] for HTS cables under current development provides a mathematical model showing that an HTS cooling system would require 1kW cooler every 400m, and ventures that a realistic decrease in heat-losses would reduce the cryocoolers to a 1kW cooler every 1000m. This number is limited mainly by pressure drop through long cable sections. A far more optimistic 20 km range between stations in [1], which would make large-scale integration of SCTL much more feasible.
Figure 9 Curve for function Cable length vs Required cooling power [17]
Economical Study of Electric Power Transmission with SC for HVDC
21
An example of a model of nitrogen cryocooler is given in [12] TBF-1050 from Air Liquide, with a lifespan of 20 years with cold power of 120 kW at 65K. The study outlines the relation between the cable’s section and the distance between stations. For a YBCO cable cooled by nitrogen with an outside diameter of 0,23m the distance between two cooling stations is 125km. As seen, distances and power requirements for cooling stations are varied in number. The reader is encouraged to read the studies referenced for further learning on the subject.
4.4 End Stations, Transformers and Converters End stations and converters allow electricity to be transported more efficiently from its production plant to the distribution network, and finally to the end customer. Traditional end stations and converters are step-up and step-down transformers for ac and converters for dc applications. A further distinction is done in dc converters between inverters and rectifiers.
Current SCTL experiments [19-21] employ traditional transformers and converters for operation because following the termination (Chapter 2.4. Terminations) the resulting current lead is a traditional means of electricity transportation. The only difference may be the power requirements over traditional methods, since SCTL can work under much higher current densities (amperage), effectively lowering the required voltage for bulk transportation. However, the technology for transformers and converters is already in a much more advanced status than the SCTL and therefore does not present such a challenge.
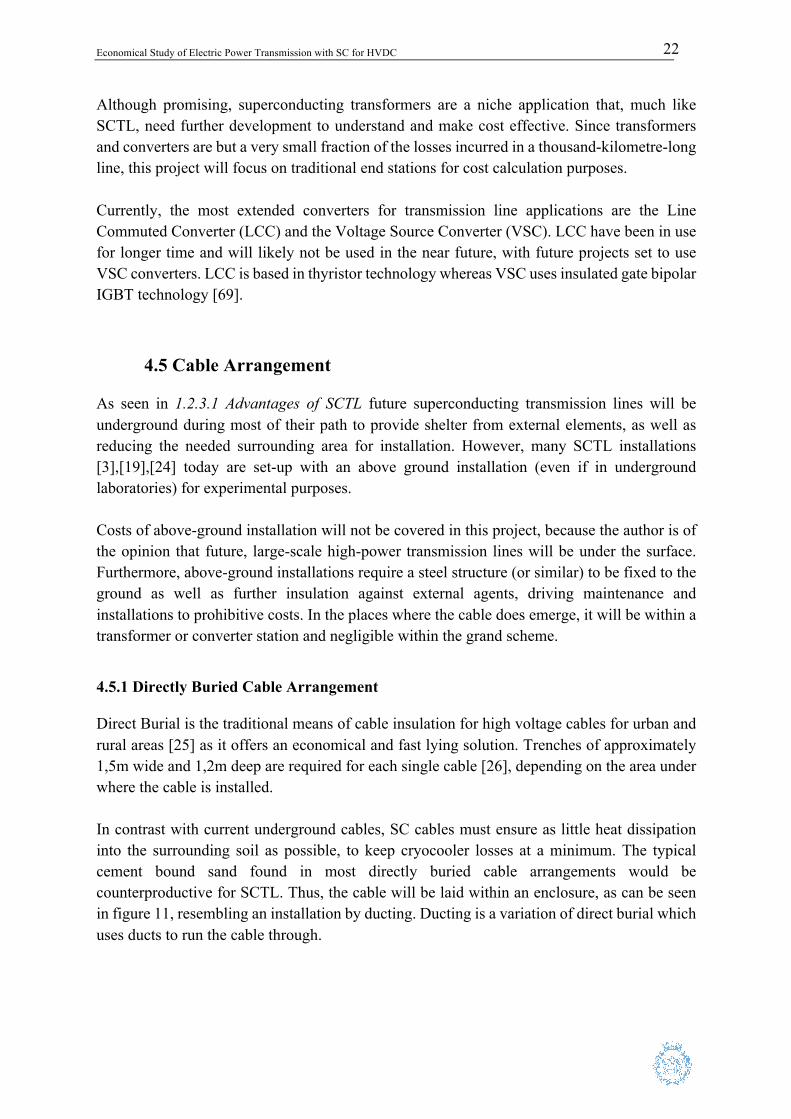
An interesting proposition [22,23] is the development of superconducting transformers, which themselves use 2 G HTS superconductors. A power plant with a rating of 63 MVA is shown to raise efficiency from 99,6% to 99,9% and under specific applications, an 81% decrease in energy loss per year.
Figure 10 Comparison of workload in % versus the efficiency and the losses of superconducting
transformers [37].
Economical Study of Electric Power Transmission with SC for HVDC
22
Although promising, superconducting transformers are a niche application that, much like SCTL, need further development to understand and make cost effective. Since transformers and converters are but a very small fraction of the losses incurred in a thousand-kilometre-long line, this project will focus on traditional end stations for cost calculation purposes. Currently, the most extended converters for transmission line applications are the Line Commuted Converter (LCC) and the Voltage Source Converter (VSC). LCC have been in use for longer time and will likely not be used in the near future, with future projects set to use VSC converters. LCC is based in thyristor technology whereas VSC uses insulated gate bipolar IGBT technology [69].
4.5 Cable Arrangement As seen in 1.2.3.1 Advantages of SCTL future superconducting transmission lines will be underground during most of their path to provide shelter from external elements, as well as reducing the needed surrounding area for installation. However, many SCTL installations [3],[19],[24] today are set-up with an above ground installation (even if in underground laboratories) for experimental purposes. Costs of above-ground installation will not be covered in this project, because the author is of the opinion that future, large-scale high-power transmission lines will be under the surface. Furthermore, above-ground installations require a steel structure (or similar) to be fixed to the ground as well as further insulation against external agents, driving maintenance and installations to prohibitive costs. In the places where the cable does emerge, it will be within a transformer or converter station and negligible within the grand scheme.
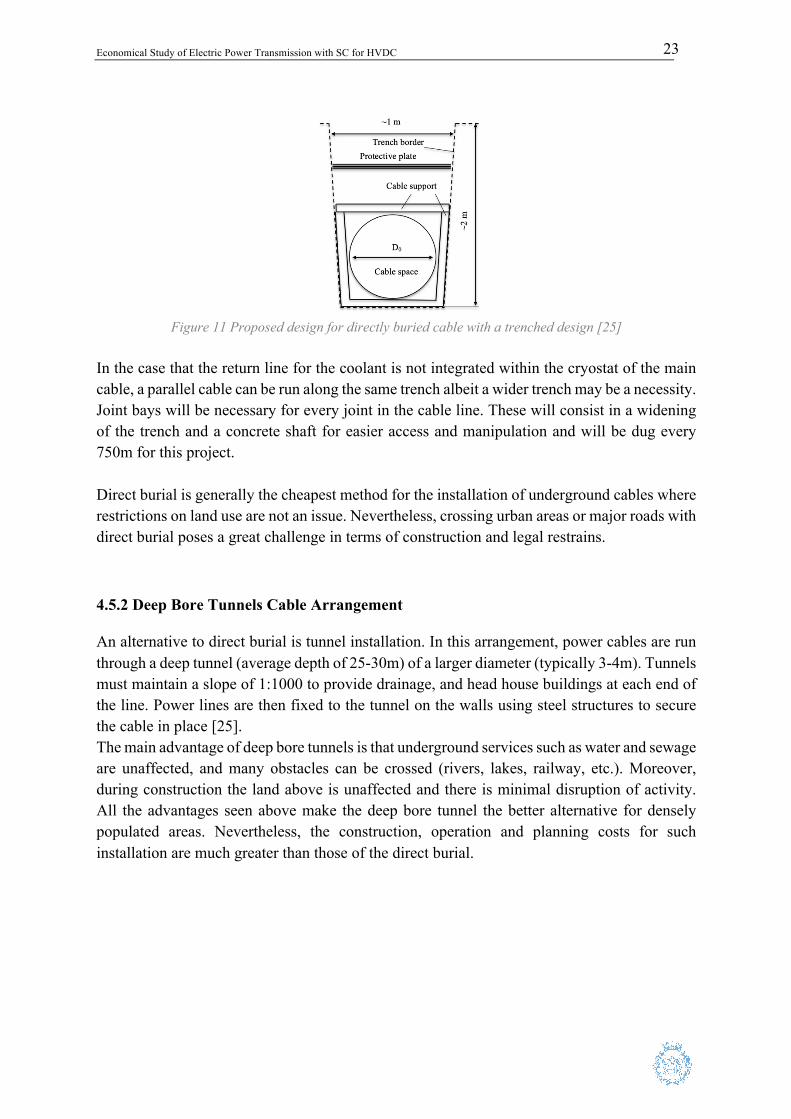
4.5.1 Directly Buried Cable Arrangement Direct Burial is the traditional means of cable insulation for high voltage cables for urban and rural areas [25] as it offers an economical and fast lying solution. Trenches of approximately 1,5m wide and 1,2m deep are required for each single cable [26], depending on the area under where the cable is installed. In contrast with current underground cables, SC cables must ensure as little heat dissipation into the surrounding soil as possible, to keep cryocooler losses at a minimum. The typical cement bound sand found in most directly buried cable arrangements would be counterproductive for SCTL. Thus, the cable will be laid within an enclosure, as can be seen in figure 11, resembling an installation by ducting. Ducting is a variation of direct burial which uses ducts to run the cable through.
Economical Study of Electric Power Transmission with SC for HVDC
23
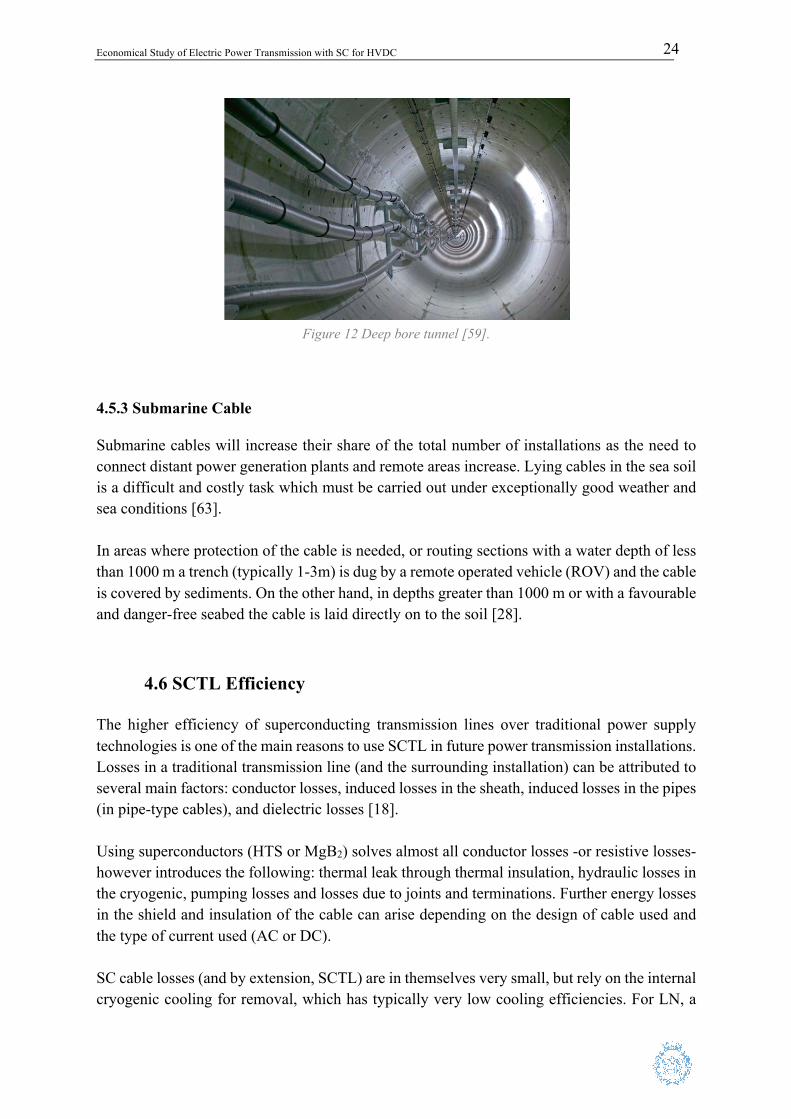
Figure 11 Proposed design for directly buried cable with a trenched design [25] In the case that the return line for the coolant is not integrated within the cryostat of the main cable, a parallel cable can be run along the same trench albeit a wider trench may be a necessity. Joint bays will be necessary for every joint in the cable line. These will consist in a widening of the trench and a concrete shaft for easier access and manipulation and will be dug every 750m for this project. Direct burial is generally the cheapest method for the installation of underground cables where restrictions on land use are not an issue. Nevertheless, crossing urban areas or major roads with direct burial poses a great challenge in terms of construction and legal restrains. 4.5.2 Deep Bore Tunnels Cable Arrangement An alternative to direct burial is tunnel installation. In this arrangement, power cables are run through a deep tunnel (average depth of 25-30m) of a larger diameter (typically 3-4m). Tunnels must maintain a slope of 1:1000 to provide drainage, and head house buildings at each end of the line. Power lines are then fixed to the tunnel on the walls using steel structures to secure the cable in place [25]. The main advantage of deep bore tunnels is that underground services such as water and sewage are unaffected, and many obstacles can be crossed (rivers, lakes, railway, etc.). Moreover, during construction the land above is unaffected and there is minimal disruption of activity. All the advantages seen above make the deep bore tunnel the better alternative for densely populated areas. Nevertheless, the construction, operation and planning costs for such installation are much greater than those of the direct burial.
Economical Study of Electric Power Transmission with SC for HVDC
24
Figure 12 Deep bore tunnel [59].
4.5.3 Submarine Cable Submarine cables will increase their share of the total number of installations as the need to connect distant power generation plants and remote areas increase. Lying cables in the sea soil is a difficult and costly task which must be carried out under exceptionally good weather and sea conditions [63]. In areas where protection of the cable is needed, or routing sections with a water depth of less than 1000 m a trench (typically 1-3m) is dug by a remote operated vehicle (ROV) and the cable is covered by sediments. On the other hand, in depths greater than 1000 m or with a favourable and danger-free seabed the cable is laid directly on to the soil [28].
4.6 SCTL Efficiency
The higher efficiency of superconducting transmission lines over traditional power supply technologies is one of the main reasons to use SCTL in future power transmission installations. Losses in a traditional transmission line (and the surrounding installation) can be attributed to several main factors: conductor losses, induced losses in the sheath, induced losses in the pipes (in pipe-type cables), and dielectric losses [18]. Using superconductors (HTS or MgB2) solves almost all conductor losses -or resistive losses- however introduces the following: thermal leak through thermal insulation, hydraulic losses in the cryogenic, pumping losses and losses due to joints and terminations. Further energy losses in the shield and insulation of the cable can arise depending on the design of cable used and the type of current used (AC or DC). SC cable losses (and by extension, SCTL) are in themselves very small, but rely on the internal cryogenic cooling for removal, which has typically very low cooling efficiencies. For LN, a
Economical Study of Electric Power Transmission with SC for HVDC
25
common value for cooling efficiency in a large cooling machine is expected to be between 7-14%. The final energy losses in a system will ultimately depend on the line’s load factor and power characteristics, as well as its length. SCTL advantages are apparent when making a comparison of electrical characteristics between a cold dielectric HTS, a conventional XLPE cable and an overhead line for a 120kV cable. XLPE cable (cross-linked polyethylene) is a widely used material in HVAC and HVDC applications.
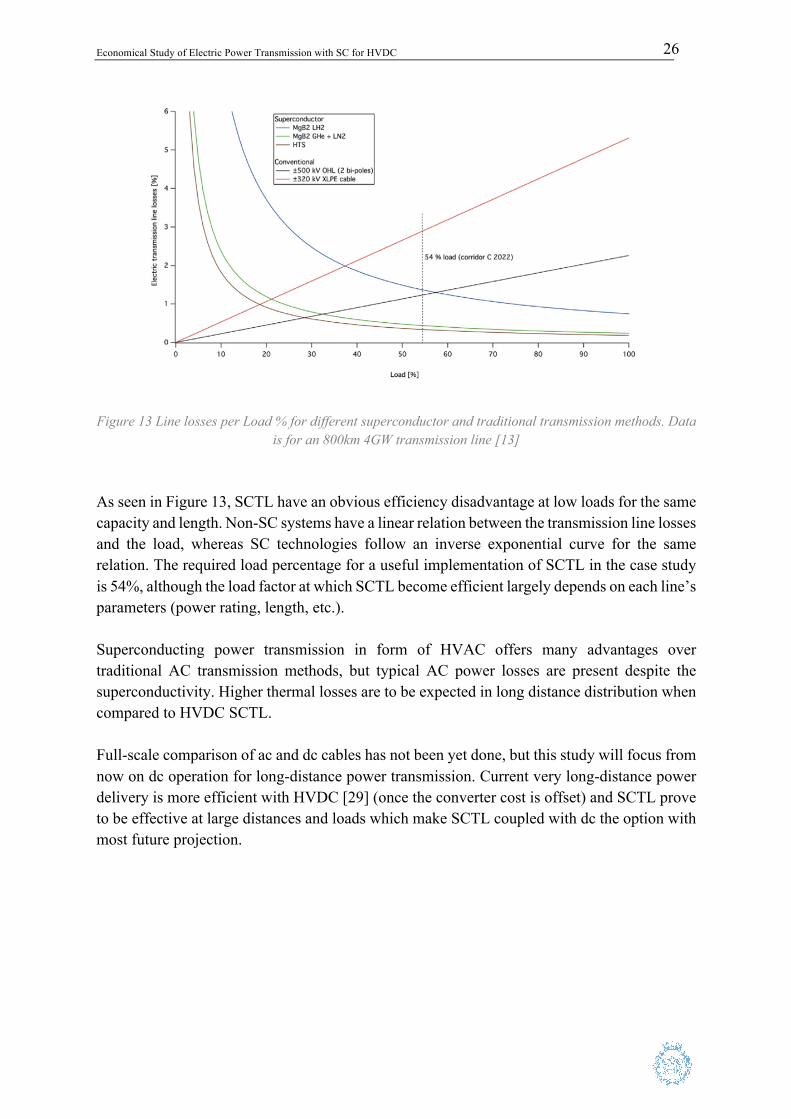
4.6.1 HVDC vs HVAC DC SCTL installations are void of the electric losses found in AC SCTL caused by the oscillating electro-magnetic field (largely dependent on the design of the cable). Therefore, HVDC SCTL are an extremely interesting choice for long-distance, high-capacity transmissions from remote sources or densely populated areas. SCTL have an extremely high current density resulting in a smaller sized superconductor compared to the outer diameter of the complete cryogenic system. Therefore, doubling the nominal current of a SCTL will not lead to the doubling of the outer diameter. The heat influx and electric power consumption to keep the cryogenic at its operating temperature is proportional to the outer diameter of the cooling system and mainly restricted by the necessary hydraulic diameters to ensure the required mass flow and heat transport. Moreover, distance between cooling stations and the type of cryogen also play a major role. Lower operating temperatures lead to a lower efficiency of the underlying thermodynamic cycle (Carnot) of the refrigeration system with subsequent higher electric power losses for cooling. To put SCTL efficiency into perspective a case study [12] for an 800 km, 4GW transmission line will be used. Three types of SC technology are studied: a MgB2 line cooled with liquid hydrogen (LH2), a MgB2 cooled by helium gas and liquid nitrogen and a HTS line. The SC systems will be compared to a 500 kV overhead line and a 320 kV XLPE underground cable with the same length and capacity.
Economical Study of Electric Power Transmission with SC for HVDC
26
Figure 13 Line losses per Load % for different superconductor and traditional transmission methods. Data
is for an 800km 4GW transmission line [13]
As seen in Figure 13, SCTL have an obvious efficiency disadvantage at low loads for the same capacity and length. Non-SC systems have a linear relation between the transmission line losses and the load, whereas SC technologies follow an inverse exponential curve for the same relation. The required load percentage for a useful implementation of SCTL in the case study is 54%, although the load factor at which SCTL become efficient largely depends on each line’s parameters (power rating, length, etc.).
Superconducting power transmission in form of HVAC offers many advantages over traditional AC transmission methods, but typical AC power losses are present despite the superconductivity. Higher thermal losses are to be expected in long distance distribution when compared to HVDC SCTL. Full-scale comparison of ac and dc cables has not been yet done, but this study will focus from now on dc operation for long-distance power transmission. Current very long-distance power delivery is more efficient with HVDC [29] (once the converter cost is offset) and SCTL prove to be effective at large distances and loads which make SCTL coupled with dc the option with most future projection.
Economical Study of Electric Power Transmission with SC for HVDC
27
5 Cost Modelling The main aim of this paper is to provide a breakdown of the costs associated with the implementation of SCTL and to study its economic viability. An accurate model predicting the exact cost of such projects is very challenging, since the amount of variables that need to be considered are vast and many are unique for each project. For this reason, cost estimations for such projects must be considered as an approximation of the actual final cost. The conclusions obtained can be used as a reference for future investors and stakeholders in SCTL, but it is paramount to understand that the scope of this study is limited by the scarce information available on this new technology. SCTL system costs can be divided into two main groups: capital cost and power losses cost. The former considers all costs associated with building the infrastructures and is a fixed cost related to the initial investment, whereas the latter is a variable cost, derived from power losses during the transportation of electricity. Cost modelling will only be done for HVDC operation due to the higher efficiency for long distance transportation. For HVDC SCTL capital costs will include:
• Converter, both Rectifier and Inverter (Off-shore/On-shore) • Superconducting Transmission Cables • Installation • Cooling Stations
The cost due to power loss will consider the same variables: losses before and after transportation (Converter and Transformers) and losses in the line. The final model will allow interested parties to introduce the main variables which the future project will have (type of current, length, load factor, capacity, etc.), and determine the associated costs for the entire project, as well as the cost for each component.
5.1 SCTL Variables and Modelling To cover the great amount of different scenarios in which the SCTL technology can be implemented, the variables which will have a significant influence on the final cost need to be selected. The main variables for determining the final cost will be nominal voltage (in kV) and capacity (in GW). Other important parameters not specified above such as cooling stations, terminations and joints depend on the total length and power requirements of the line, and therefore are implied when setting the other parameters. Models obtained from literature will be used whenever possible and adapted to the study, to offer a behaviour of the variables as close as is possible to reality. Statistical regression will be used to establish a relation between the technical variables and their cost which have not
Economical Study of Electric Power Transmission with SC for HVDC
28
been found in literature. The cost of each component will be estimated from budgets of both current and future projects. The criteria chosen to provide the regression is to minimise the sum of the mean square error.
𝑄(𝑏! , 𝑏") ='(𝑌# − 𝑦#)$%
#&"
Where Q is the function that is aimed to minimise, that is, the sum of all mean square error; Yi is a value from the same population, and yi is the theoretic value adjusted by a regression. The different adjustments may result in any of the following: exponential, logarithmical, polynomial, potential and linear.
0 ≤ 𝑅$ ≤ 1 To assess the quality of the regression adjustment, the parameter R2 will be used, the closer R2 is to 1 the better the adjustment to the regression.
5.2 CAPITAL COSTS 5.2.1 Cost of SC HVDC cable The election of the transmission capacity is one of the main choices when designing a transmission project and has a great influence on the final cost, along with the total length of the SCTL. In its turn, capacity is determined by the materials that form the different parts of the cable. 5.2.1.1 Cost of Former The copper former has an average diameter of 10-40 mm [1], [30-33], and is determined by the maximum fault current and the duration of it. However, a radius of the former of 30 mm will be assumed for cost calculation purposes. Since copper is an expensive material and must be considered in calculations, equation 2 is made to account for the cost of the former.
𝐶'!()*( =𝑆'!()*( · 𝐿 · 𝜌+, · 𝑃+, = 𝜋 · 7𝑅'!()*( · 10-.8$ · 𝐿 · 8940 · 𝑃+,
where, 𝐶'!()*(: Total Cost of the former [€]
𝑆'!()*(: Section of the former [m3]
𝐿: Length of the line [m]
𝜌+,: Density of copper [8940 kg m-3]
(1)
(2)
Economical Study of Electric Power Transmission with SC for HVDC
29
𝑃+,: Price of copper [€/kg]
𝑅'!()*(: radius of the former [mm]
5.2.1.2 Conductor The conducting materials found in the vast majority of HTS tapes are either YBCO or Bi-2223. Given that the tapes of either material vary very little in dimensions (around 4,2 mm x 0,25 mm), larger power transfer capabilities are attained by increasing the number of tapes wound into the cable [32]. Magnesium diboride has a smaller section compared to HTS tapes, at 3 x 0,5 mm2 [8]. The number of HTS tapes is found mainly considering the amperage at which the cable will operate, since density of current is one of the limiting factors of HTS (although much higher than traditional cables). Current HTS tapes -Gen 2- have critical currents (the maximum current at which the cable can operate maintaining superconductivity) much higher than its predecessors (Gen 1), because they can maintain superconductivity under much more intense magnetic fields. Determining the critical current of HTS tapes is a complex subject, and this project will use estimates to determine the final number and cost of the superconductor. Should the reader have further interest in the properties of critical current in HTS tapes, paper [34] is recommended. Superconductor’s cost is calculated using €/kAm and depends on the material that is used. The formula that will calculate the cost of the superconductor will be:
𝐶/!%0,/1!( = 𝐿 · 𝐴 · 𝑃2+ where, C345673849: Total cost of the conductor [€]
L: Total length of the line [m]
A: Amperage of the line [kA]
P:;: price of the superconducting material [€/kAm]
For price estimation of the case study the conservative price of 10€/kAm for YBCO will be used [19] and 5€/kAm for MgB2 [12]. 5.2.1.3 Insulation Cost No acceptable regression cost dependency has been found between transmission capacity and internal insulation for the dc projects consulted. Nevertheless, given the area of section used for insulation, the total cost of insulation is found using equation 4.
(3)
Economical Study of Electric Power Transmission with SC for HVDC
30
This is in most cases either some sort of composite widely used in electrical insulating applications (XLPE, PPLP) or LN2 impregnated paper. The thickness of insulation needed to withstand a rated voltage 𝑉0/ can be calculated through equation 4 from [48]
𝑇𝐻#%< = 7𝑅' + 𝑇𝐻</8 · (𝑒=!"
>?#@A$BCD%"E − 1) where, 𝑇𝐻#%<: thickness of insulation [mm]
𝑅': radius of the former [mm]
𝑇𝐻</: thickness of superconductor tape [mm]
𝑉0/: rated voltage [kV]
𝜂: safety margin
𝐸F: breakdown voltage of the insulation [kV mm-1]
A breakdown voltage of 𝐸F = 20𝑘𝑉𝑚𝑚-" for LH2/Paper insulation subject for dc operation can be used as an approximate for calculations, and a conservative safety value of 0,3 will be used in cost calculations. With the thickness calculated and given, costs for insulation are deduced using the equation below (5) with the radius of the former and the thickness.
𝐶#%<,GH1#!% = 2𝜋 · 𝑅' · 𝑇𝐻#%< · 𝐿 · 𝜌# · 𝑃# = 2𝜋 · 𝑅' · 𝑇𝐻#%< · 𝐿 · 𝜌# · 𝑃# where, 𝐶#%<,GH1#!%: Total cost of insulation [€]
𝑆/(I!<1H1: Total Section of the Cryostat [m3]
𝜌#: Density of Insulation [kg/m3]
𝑃#: Price of the insulator [€/kg]
𝐿: Total length of the Pipe [m]
𝑅': radius of the former [m]
Total cost estimations for the final conclusions and case study will be done considering XLPE as the insulation material.
(4)
(5)
Economical Study of Electric Power Transmission with SC for HVDC
31
5.2.1.4 Cryostat Cost
5.2.1.4.1 Cryostat Diameter Most proposed cable designs [1],[12],[35] use stainless steel covered with a composite layer for the outer sheath. Stainless steel provides structure to withstand any mechanical forces and pressure, as well as insulation against external agents such as sand, water, etc. The outer composite sheath furthers the stainless-steel protection to make the cable as impervious as possible. All cost calculations will be done using the stainless-steel alloy AISI 304, commonly used in electrical and pressurized applications. The outer sheath (or cryostat) will be corrugated steel. The composite sheath material chosen for cable insulation is polyethylene (PE). The outside diameter of the sheath is influenced by the allowable gradients of pressure and temperature and, therefore, the distance between cooling stations. The main objective of increasing the outer diameter (and therefore the hydraulic diameter) of the cryostat is to accommodate a higher flow rate of coolant through the pipe which will be crucial in long-distance lines. It is worth pointing out that the transport current of the cable and, consequently, the transmitted power and the operating voltage affect only (and very slightly) the thickness of superconductor needed. Thanks to this, the overall dimension of a dc SC cable is almost unaffected by changes in operating voltage and transmitted power [8]. An accurate model to determine the required diameter will be through the losses incurred through the line, and the necessary flow of coolant to keep the temperature and pressure gradient within desired limits. Heat leaks through the cryostat are assumed of 0.5 W/m for HTS + LN2 configurations and 2 W/m for MgB2 + LH2 [1],[12] [33]. Higher losses in the latter are due to the lower temperature of operation of liquid hydrogen. The following average temperature (7) and pressure (6) gradient equations are borrowed from [8].
(6)
(7)
Economical Study of Electric Power Transmission with SC for HVDC
32
where, ∆K∆L
: Gradient of Pressure [Pa m-1]
∆M∆L
: Gradient of Temperature [K m-1]
f : Friction factor
m: Mass flow rate [kg s-1]
cN: Specific heat [J kg-1 K-1]
ρ : Mass density [kg m-3]
DO: Outer Cryostat Diameter [m]
λ: Heat load per unit surface [W m-2]
𝐷#: internal diameter of the cryostat [m]
qPQ: heat load per unit length due to electromagnetic loss [W m-1]
Where m is the mass flow rate in kg/s, fis the friction factor of the cryostat, ρ is the density in kg m-3, and DO and DRare the outer and inner diameter of the cross section respectively. Values for specific heat cN, the density ρ and dynamic viscosity µwill be assumed constant 2 through the operating range of temperatures and pressure [8]. The second term of the equation 8 corresponds to the total heat load per unit length of the cable (Wm-1):
q = λπDO + qPQ Where λ (Table 3) is the heat load per unit surface (Wm-2 ) due to radiation and qPQ is the heat load per unit length due to electromagnetic loss occurring in the cable. In dc applications the latter (electromagnetic loss) can be neglected. From equations 6,7 we learn that two degrees of freedom are used to regulate the average pressure and temperature gradients of the cryostat, the outer diameter DO and the mass flow m. The inner diameter will be fixed by the intrinsic design of the cable’s core. The cable core, as seen in previous chapters of cable design, will be made of the former, the superconductor, and the insulation. To calculate the internal diameter equation 9 will be used.
𝐷# = 2𝑅' + 𝑇𝐻</ + 𝑇𝐻#%< Where, 𝐷#: internal diameter of the cryostat [mm]
𝑅': radius of the former [mm]
(8)
(9)
Economical Study of Electric Power Transmission with SC for HVDC
33
𝑇𝐻</: thickness of the SC [mm]
𝑇𝐻#%<: thickness of insulation [mm]
Table 2 mass density and specific heat of liquid nitrogen and liquid hydrogen [8]
T1, K T2, K λ, W m-2 Room temperature to LN2 300 77 1,195 Room temperature to LH2 300 21 1,235
Table 3 heat load per unit surface, in Wm-2 [8]
To extract the outer diameter of the cryostat a look at the characteristics of cooling stations will be needed. The cooling system for the 2400 m HTS DC project in St. Petersburg (50 MW, 20kV) [21] has a LN2 mass flow rate of up to 0,6 kg/s with maximum pressure drop of 0,4 MPa and a maximum temperature drop of 4,5 K. Using the data from the St. Petersburg project a friction factor f = 60 for the cryostat has been found and will be utilized for cost calculation, although this concrete project uses liquid nitrogen for cooling. Users of this tool are encouraged to use a more exact value tailored to their project specifications.
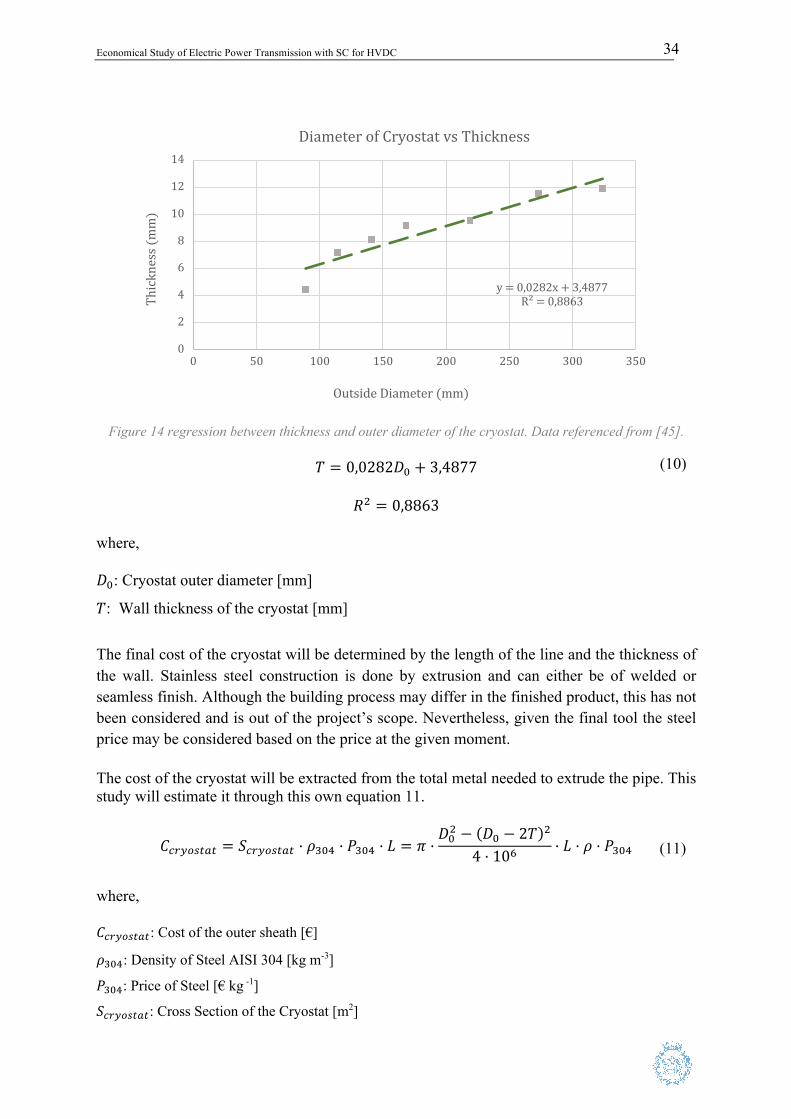
5.2.1.4.2 Cryostat Thickness The thickness of the cryostat is determined by the total diameter of the pipe used, the coolant flow and the mechanical stresses the cable must stand. Information on thickness of cryostats is scarce, and not noted on many of the projects used for research. The study [1] sets a standard 3.7 mm corrugated steel pipe for a 10GW, 140 mm cable application, and project [3] a thickness of 6 mm for a 13GW 145mm cable. To compensate for the lack of data on the subject, standard measurements for industrial ASISI 304 steel pipes have been used and extrapolated to obtain a regression model. For a more accurate prediction of the final price of the outer enclosure, it is recommended that the actual thickness of the model of pipe to be utilized is introduced (see with pipe provider). However, to aid first calculations and approximations the following regression model provides a base to estimate the thickness of the wall.
LN2 LH2 Mass density, kg m-3 839 72,23 Specific heat, J/kg K 2662 9169
Economical Study of Electric Power Transmission with SC for HVDC
34
Figure 14 regression between thickness and outer diameter of the cryostat. Data referenced from [45].
𝑇 = 0,0282𝐷O + 3,4877
𝑅$ = 0,8863 where, 𝐷O: Cryostat outer diameter [mm]
𝑇: Wall thickness of the cryostat [mm]
The final cost of the cryostat will be determined by the length of the line and the thickness of the wall. Stainless steel construction is done by extrusion and can either be of welded or seamless finish. Although the building process may differ in the finished product, this has not been considered and is out of the project’s scope. Nevertheless, given the final tool the steel price may be considered based on the price at the given moment. The cost of the cryostat will be extracted from the total metal needed to extrude the pipe. This study will estimate it through this own equation 11.
𝐶/(I!<1H1 = 𝑆/(I!<1H1 · 𝜌.OS · 𝑃.OS · 𝐿 = 𝜋 ·𝐷O$ − (𝐷O − 2𝑇)$
4 · 10T · 𝐿 · 𝜌 · 𝑃.OS
where, 𝐶!"#$%&'&: Cost of the outer sheath [€]
𝜌()*: Density of Steel AISI 304 [kg m-3]
𝑃()*: Price of Steel [€ kg -1]
𝑆!"#$%&'&: Cross Section of the Cryostat [m2]
y=0,0282x+3,4877R²=0,8863
0
2
4
6
8
10
12
14
0 50 100 150 200 250 300 350
Thickness(mm)
OutsideDiameter(mm)
Diameter of Cryostat vs Thickness
(10)
(11)
Economical Study of Electric Power Transmission with SC for HVDC
35
𝐷): Outside diameter of the Cryostat [mm]
𝑇: Thickness of the outer sheath [mm]
𝐿: Total length of the Pipe [m]
5.2.2 Cost of Coolant Coolant will constitute a large part in mass of the total SCTL installation. As seen in chapter 4.1.3 the considered elements for cooling are liquid nitrogen (LN2) for HTS SC and liquid nitrogen (LH2) for MgB2 SC. Coolant costs will be calculated using the hydraulic diameter of the cryostat and multiplied by a factor of two to account for the return line.
𝐶/!!GH%1 = 𝑆D · 𝜌/!!GH%1 · 𝑃/!!GH%1 · 2 · 𝐿 = 𝜋 ·(𝐷O − 2𝑇)$ − 𝐷#$
4 · 10T · 𝐿 · 𝑃/!!GH%1 · 2
where, 𝐶!$$+',&: total cost of coolant [€]
𝑆-: hydraulic section [mm2]
𝜌!$$+',&: coolant density [kg m-3]
𝑃!$$+',&: coolant price [€/kg]
𝐿: total length of the line [m]
𝐷): outer diameter of the cryostat [mm]
T: thickness of the cryostat [mm]
𝐷.: inner diameter of the cryostat [mm]
LN2 LH2 𝜌 , density [kg m-3] 804 71
Price [€/kg] 0,2 1,5
Table 4 density and price for liquid nitrogen and liquid hydrogen [8]
5.2.3 Cost of Cooling Stations Cooling stations are instrumental to the outline of the final design of a SCTL. As seen in the previous chapter, the dimensions of the SC cable depend on the cooling and pumping power of the cooling stations. They must ensure that temperature and pressure is always kept within the desired ranges otherwise power losses can be insurmountable.
(12)
Economical Study of Electric Power Transmission with SC for HVDC
36
The total power needed for cooling a dc cable with outer diameter D0 and mass flow m is given by the equation [8]:
𝑃/!!G#%U = 𝐶𝑂𝑃/(I!V#V*7𝜆𝜋𝐷O + 𝑞*) + 𝑞'(#/1#!%8𝐿G#%* where, 𝑃/!!G#%U: total power needed to cool the line [W]
𝐶𝑂𝑃/(I!V#V*: coefficient of performance of the cryopipe
𝑞*): heat load per unit length electromagnetic loss [W/kA]
𝑞'(#/1#!%: heat load per unit length due to friction [W/kA]
𝐷O: outer diameter of the cryostat [m]
𝜆: Heat load per unit surface [W m-2]
𝐿G#%*: length of the cable [m]
Losses due to electromagnetic loss and friction can be considered negligible [8] and COP for both coolants can be seen in table 5. Further study for power requirements is needed for terminations, which are left out of equation 13.
COP 300K to LN2 22 300K to LH2 140
Table 5 coefficient of performance of the cryostat for liquid hydrogen and liquid nitrogen [8]
Once established the required cooling capacity, refrigeration power determines the cost of each substation. Cost fitting equations 14 and 15 from [37] are borrowed to provide an accurate refrigeration-to-cost relation. The equations have been adjusted to € and according to inflation.
(20𝐾)𝐶$O = 10,1781(𝑃/!!G#%U𝑛<,F$O
)O,S"$
(77𝐾)𝐶XO = 1,983(𝑃/!!G#%U𝑛<,FXO
)O,YX
where, 𝐶$O: cost of cooling station 300K to 20K [k€]
𝑃/!!G#%U: total power needed to cool the line [W]
(13)
(14)
(15)
Economical Study of Electric Power Transmission with SC for HVDC
37
𝐿G#%*: length of the line [m]
𝑛<,F$O: number of substations 300K to 20K
𝑛<,FXO: number of substations 300K to 70K
The equations above provide an estimate of the cost of each refrigeration station given that a specified number of cooling stations are to be installed along the SCTL. A compromise must be reached between the length connecting cooling stations and the added cost that superior cooling power will require. The cost for the cooling system of a SCTL line is calculated through the equation:
𝐶/!!G#%U = 𝑛XOZ𝐶XO + 𝑛$OZ𝐶$O where, 𝐶/!!G#%U: Total cost of cooling [k€]
𝑛XOZ: Number of cooling stations 300K to 70K
𝐶XO: Cost of cooling 300K to 70K [k€]
𝑛$OZ: Number of cooling stations 300K to 20K
𝐶$O: Cost of cooling 300K to 20K [k€]
Theoretically, as power and pressure requirements are satisfied the distance between two cooling stations can be increased or decreased depending on the intrinsic nature of the installation. For instance, an offshore SCTL can have less, higher-power cooling stations to make installation at sea easier. 5.2.4 Joints and Terminations Cost As seen in chapter 4.3 Joints, the distance between cable joints varies from one project to the other. Since estimates go from 300 meters to 1 km, this study has found it reasonable to install a joint every 750 m to reduce the inevitable joint losses as much as possible. Given that joints consist of a wider cylindrical enclosure of stainless steel with superconducting material within, their material cost will be negligible in this study, treating them as a plain part of the cable. For a long distance, power-plant-to-consumer line, one termination is expected for each end of the line and two for each cooling station to access the inner flow of coolant. However, no conclusive information related to specific termination costs has been found. For this reason, cost of the terminations will not be included in this study.
(16)
Economical Study of Electric Power Transmission with SC for HVDC
38
5.2.5 Laying Costs and Right of Way (ROW) Right of way (ROW) relates to the corridor of land over which facilities like highways and other facility structures are built, and the right to pass over property owned by another party. For transmission lines, ROW usually includes the area of land where the TL are located, and the additional areas needed for operation and maintenance of the line [28]. ROW for HVDC SC cables is drastically reduced when compared to traditional XLPE underground cables. These require 0,6 m of spacing between each bipole to account for mutual heating and external thermal variations. Such problems are not found in SC transmission because both cables operate at the same temperature independently of soil and ambient conditions [8],[25]. HVDC Underground cable cost is used here for cost estimations even if final costs for SCTL are lower. ROW will be influenced to a certain extent by the maximum diameter of a cable (dc operation requires two cables for power transmission). Whenever the return line is not integrated within a single cable and must run parallel to the SCTL an increase in ROW will be made accordingly. Cost for ROW highly depends on the concrete conditions and areas where the cable will be laid, and precise estimations are difficult. [38] provides an estimate of 150k€/km for ROW in Germany which can be indicative of the high costs associated. Since currently no SCTL projects spanning hundreds of kilometres through private soil have been implemented, this value will be used. Data estimates from [39] placing the laying costs for underground and submarine cables as in table 6 are used, although SCTL will not have the same intrinsic costs as HVDC XLPE technology. Further study and projects must be implemented for a more accurate study of ROW and laying cost.
Cost [M€/km] HVDC Underground (Onshore) 0,66 HVDC Submarine (Offshore) 1,02
Table 6 costs for HVDC laying offshore and onshore [39]
Therefore, final cost for laying + ROW follows the equation:
𝐶+'#.,/0123 = 𝐶123 · 𝐻123 + 𝐶4'#.,/𝐿 where, 𝐶GHI#%UBA[\: Total cost for Laying and ROW [M€]
𝐶A[\: Cost per km of ROW (negligible in offshore installations) [€/km]
(17)
Economical Study of Electric Power Transmission with SC for HVDC
39
𝐶]HI#%U: Cost per km of Laying [M€/km]
𝐿: Length of the Line [km]
𝐻A[\: ROW area [km2]
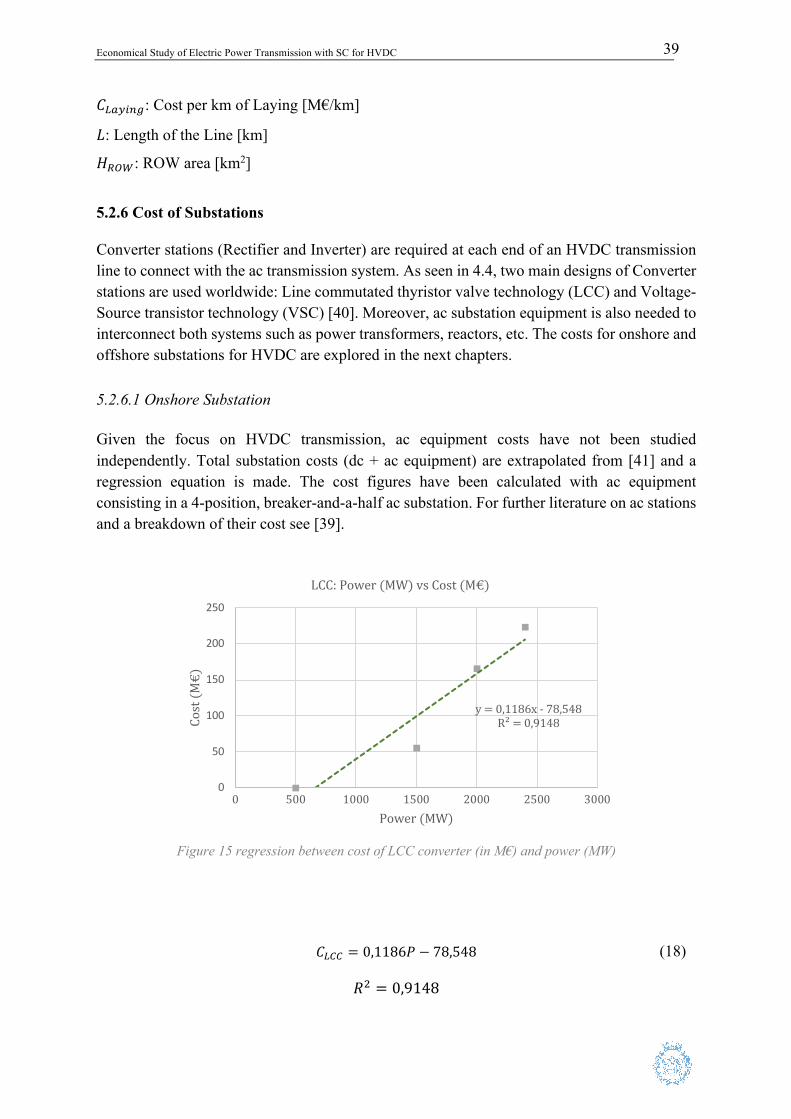
5.2.6 Cost of Substations Converter stations (Rectifier and Inverter) are required at each end of an HVDC transmission line to connect with the ac transmission system. As seen in 4.4, two main designs of Converter stations are used worldwide: Line commutated thyristor valve technology (LCC) and Voltage-Source transistor technology (VSC) [40]. Moreover, ac substation equipment is also needed to interconnect both systems such as power transformers, reactors, etc. The costs for onshore and offshore substations for HVDC are explored in the next chapters. 5.2.6.1 Onshore Substation Given the focus on HVDC transmission, ac equipment costs have not been studied independently. Total substation costs (dc + ac equipment) are extrapolated from [41] and a regression equation is made. The cost figures have been calculated with ac equipment consisting in a 4-position, breaker-and-a-half ac substation. For further literature on ac stations and a breakdown of their cost see [39].
Figure 15 regression between cost of LCC converter (in M€) and power (MW)
𝐶455 = 0,1186𝑃 − 78,548
𝑅$ = 0,9148
y=0,1186x- 78,548R²=0,9148
0
50
100
150
200
250
0 500 1000 1500 2000 2500 3000
Cost(M
€)
Power(MW)
LCC:Power(MW)vsCost(M€)
(18)
Economical Study of Electric Power Transmission with SC for HVDC
40
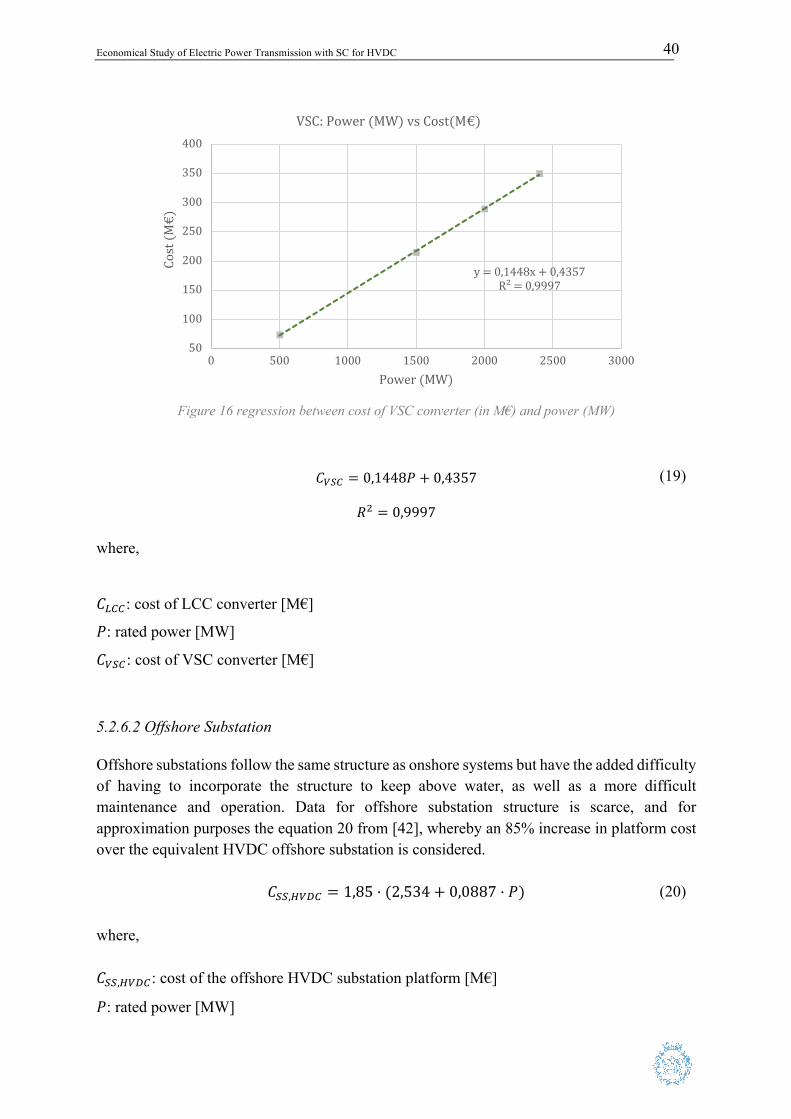
Figure 16 regression between cost of VSC converter (in M€) and power (MW)
𝐶675 = 0,1448𝑃 + 0,4357
𝑅8 = 0,9997 where, 𝐶]++: cost of LCC converter [M€]
𝑃: rated power [MW]
𝐶=2+: cost of VSC converter [M€] 5.2.6.2 Offshore Substation Offshore substations follow the same structure as onshore systems but have the added difficulty of having to incorporate the structure to keep above water, as well as a more difficult maintenance and operation. Data for offshore substation structure is scarce, and for approximation purposes the equation 20 from [42], whereby an 85% increase in platform cost over the equivalent HVDC offshore substation is considered.
𝐶22,D=^+ = 1,85 · (2,534 + 0,0887 · 𝑃) where, 𝐶22,D=^+: cost of the offshore HVDC substation platform [M€]
𝑃: rated power [MW]
y=0,1448x+0,4357R²=0,9997
50
100
150
200
250
300
350
400
0 500 1000 1500 2000 2500 3000
Cost(M
€)
Power(MW)
VSC:Power(MW)vsCost(M€)
(19)
(20)
Economical Study of Electric Power Transmission with SC for HVDC
41
5.3 POWER LOSSES 5.3.1 Cooling Power Losses Dc transmission lines are inherently void of losses due to reactive power, contrary to ac systems. However, some operation losses due to the resistivity and capacitance of the conductor are to be expected which are not found (ideally) on SCTL. For approximation of total losses, cooling power will be used as in 5.2.3 (equation 13 from [8]) and compared with current electricity cost.
𝑃/!!G#%U = 𝐶𝑂𝑃/(I!V#V*7𝜆𝜋𝐷O + 𝑞*) + 𝑞'(#/1#!%8𝐿/HFG* It is important to note that cooling losses will be (almost) constant, independently of the load on the line, as discussed in 4.6 because the SC must be always kept at the operating temperature regardless of power requirements. For this very same reason very high loads are encouraged for future SCTL where the cooling losses would represent a smaller percentage of the total capacity. Therefore, considering the line will work 365 days a year, the total working hours are 8760. The total cost in € for cooling a SCTL during a year is:
𝐶G!<<*<2+C] = 𝑃/!!G#%U · 10-T · 𝑇\ · 𝑃*%*(UI where, 𝐶G!<<*<2+C] : total cooling losses of a SCTL [€]
𝑃/!!G#%U: cooling power for a SCTL [MW]
𝐿D: length of the line [m]
𝐶*%*(UI: price of wholesale energy [€ MWh-1]
𝑇_: working hours per year [h]
The process above fails to consider cooling losses in the terminations and assumes a constant flow of coolant throughout the line, which is an almost impossible task. For reference, current price of wholesale energy is at 62€ MWh-1. 5.3.2 Converter Losses As discussed before, typical converter losses are at 1% of the converted power, and therefore will be calculated using that figure. Losses are estimated over the total power of the line and for the number of converters used (typically one at each end of the line).
(13)
(21)

Economical Study of Electric Power Transmission with SC for HVDC
42
𝑃/!%`*(1*(G!<<*< = 0,01 · 𝑃C]
where, 𝑃/!%`*(1*(G!<<*< : power of losses in the converter [MW]
𝑃C]: rated power of the converter [MW]
The cost of these losses is evaluated in equation 24.
𝐶/!%`*(1*(G!<<*< =𝑃/!%`*(1*(G!<<*< · 𝑇_ · 𝐶*%*(UI where, 𝐶/!%`*(1*(G!<<*< : cost of losses in the converter [€]
𝑃/!%`*(1*(G!<<*< : power losses in the converter [MW]
𝑇_: working hours per year [h]
𝐶*%*(UI: cost of energy [€ MWh-1]
(22)
(23)
Economical Study of Electric Power Transmission with SC for HVDC
43
6 Case Study
6.1 ENTSO-E and TYDP The ENTSO-E, the European Network of Transmission System Operators for Electricity, represents 42 electricity transmission system operators (TSOs) from 35 countries within Europe which share the objective of setting up the internal energy market and ensuring its optimal functioning, and of supporting the European energy and climate agenda [43]. ENTSO-E’s main objectives is the integration of a high degree of renewables in Europe’s energy system, development of flexibility, and a much more customer-centric approach than in the past [43]. It is committed to develop the responses to the challenge of the current power system while maintaining a steady supply. Innovation, a market-based approach, customer and stakeholder focus, security of supply, flexibility, and regional cooperation are key to ENTSO-E’s agenda. The Ten-Year Development Plan (TYDP) is the European electricity infrastructure development plan, enabling and complementing national grid development as well as looking at how power links and storage can be used to make energy transmission and transition happen in a cost-effective and efficient way.
This report is published every two years and presents the way in which the European grid will develop in the long run, to achieve energy distribution targets. In it, experts assess possible scenarios for 2030 and 2040 that will constitute the European network. The TYDP 2020 assessed more than 154 future transmission projects, equalling 46.000 km of lines or cables, and representing close to 90 GW of additional transmission capacity, that will enable the European grid a higher level of connectivity and power stability. It is through the TYDP that the future shape of the European grid and the different projects which will constitute the main arteries of energy transmission can be grasped and understood. Even though all programmed projects will make use of common and currently applied power transmission technologies, the projects will provide the framework within which this thesis will extrapolate the conclusions on the use of Superconductors for energy transmission. In particular, the project for the unification of power grids between northern and southern Germany will be studied next.
6.2 Case Study In an attempt to prove the feasibility of SCTL in long-distance power transmission requirements a case study will be done. As seen in 4.6 SCTL are superior in efficiency over traditional transmission methods when large loads and distances are considered. For this
Economical Study of Electric Power Transmission with SC for HVDC
44
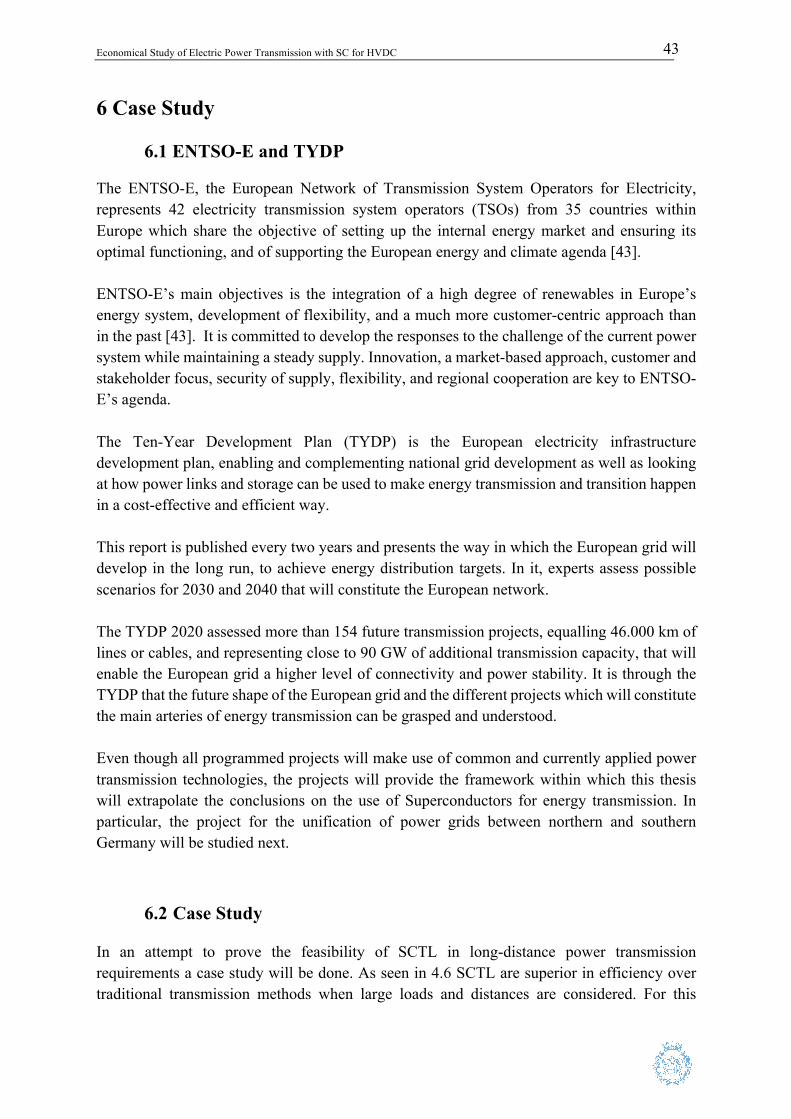
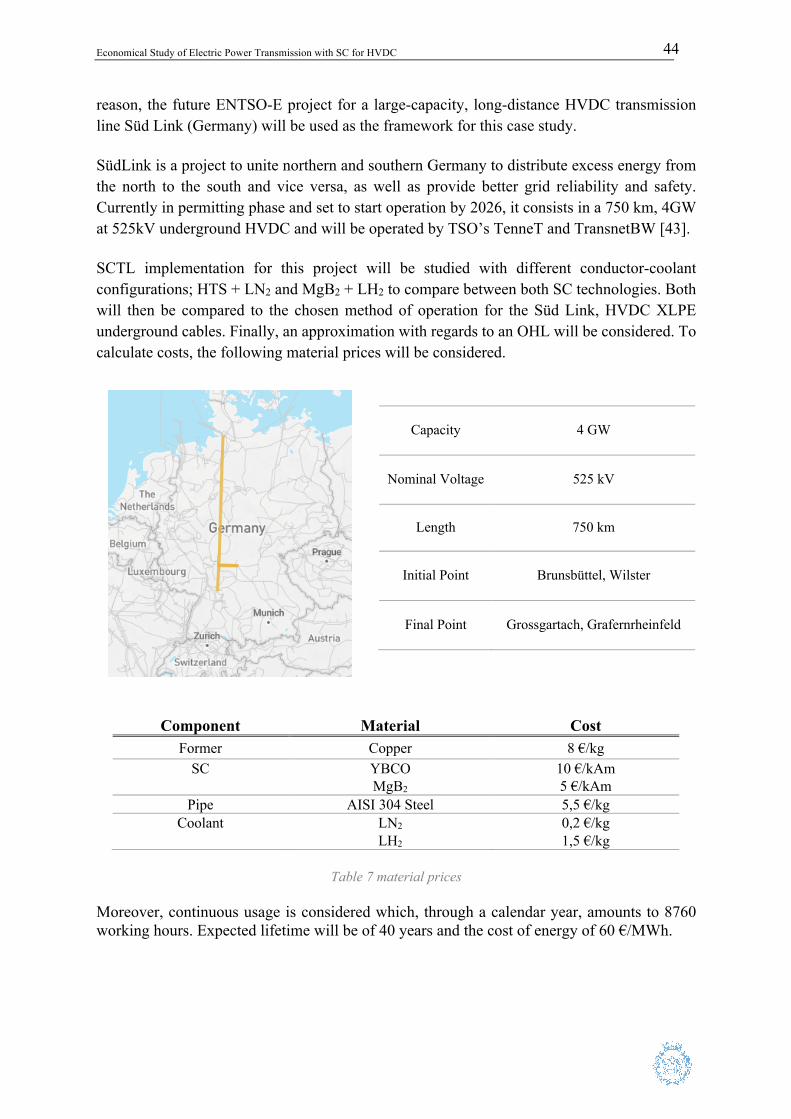
reason, the future ENTSO-E project for a large-capacity, long-distance HVDC transmission line Süd Link (Germany) will be used as the framework for this case study. SüdLink is a project to unite northern and southern Germany to distribute excess energy from the north to the south and vice versa, as well as provide better grid reliability and safety. Currently in permitting phase and set to start operation by 2026, it consists in a 750 km, 4GW at 525kV underground HVDC and will be operated by TSO’s TenneT and TransnetBW [43]. SCTL implementation for this project will be studied with different conductor-coolant configurations; HTS + LN2 and MgB2 + LH2 to compare between both SC technologies. Both will then be compared to the chosen method of operation for the Süd Link, HVDC XLPE underground cables. Finally, an approximation with regards to an OHL will be considered. To calculate costs, the following material prices will be considered.
Table 7 material prices
Moreover, continuous usage is considered which, through a calendar year, amounts to 8760 working hours. Expected lifetime will be of 40 years and the cost of energy of 60 €/MWh.
Capacity 4 GW
Nominal Voltage 525 kV
Length 750 km
Initial Point Brunsbüttel, Wilster
Final Point Grossgartach, Grafernrheinfeld
Component Material Cost Former Copper 8 €/kg
SC YBCO 10 €/kAm MgB2 5 €/kAm
Pipe AISI 304 Steel 5,5 €/kg Coolant LN2 0,2 €/kg
LH2 1,5 €/kg
Economical Study of Electric Power Transmission with SC for HVDC
45
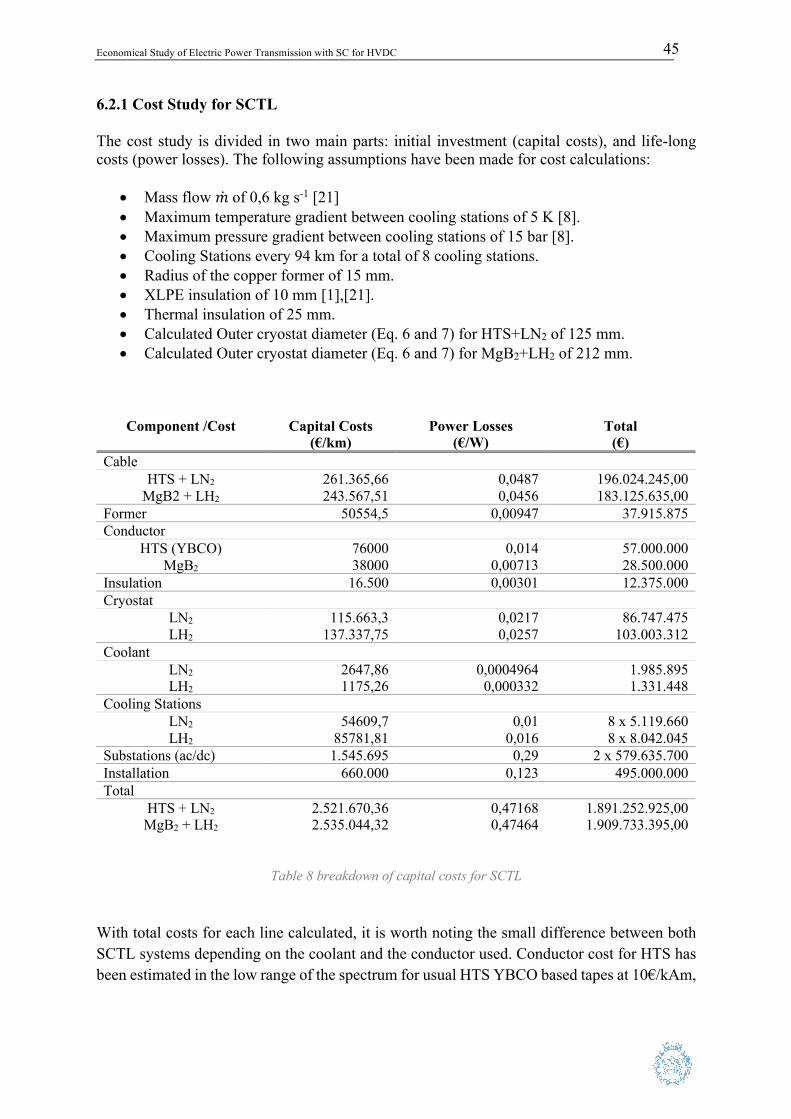
6.2.1 Cost Study for SCTL The cost study is divided in two main parts: initial investment (capital costs), and life-long costs (power losses). The following assumptions have been made for cost calculations:
• Mass flow ��of 0,6 kg s-1 [21] • Maximum temperature gradient between cooling stations of 5 K [8]. • Maximum pressure gradient between cooling stations of 15 bar [8]. • Cooling Stations every 94 km for a total of 8 cooling stations. • Radius of the copper former of 15 mm. • XLPE insulation of 10 mm [1],[21]. • Thermal insulation of 25 mm. • Calculated Outer cryostat diameter (Eq. 6 and 7) for HTS+LN2 of 125 mm. • Calculated Outer cryostat diameter (Eq. 6 and 7) for MgB2+LH2 of 212 mm.
Component /Cost Capital Costs
(€/km) Power Losses
(€/W) Total
(€) Cable
HTS + LN2 261.365,66 0,0487 196.024.245,00 MgB2 + LH2 243.567,51 0,0456 183.125.635,00
Former 50554,5 0,00947 37.915.875 Conductor
HTS (YBCO) 76000 0,014 57.000.000 MgB2 38000 0,00713 28.500.000
Insulation 16.500 0,00301 12.375.000 Cryostat
LN2 115.663,3 0,0217 86.747.475 LH2 137.337,75 0,0257 103.003.312
Coolant LN2 2647,86 0,0004964 1.985.895 LH2 1175,26 0,000332 1.331.448
Cooling Stations LN2 54609,7 0,01 8 x 5.119.660 LH2 85781,81 0,016 8 x 8.042.045
Substations (ac/dc) 1.545.695 0,29 2 x 579.635.700 Installation 660.000 0,123 495.000.000 Total
HTS + LN2 2.521.670,36 0,47168 1.891.252.925,00 MgB2 + LH2 2.535.044,32 0,47464 1.909.733.395,00
Table 8 breakdown of capital costs for SCTL With total costs for each line calculated, it is worth noting the small difference between both SCTL systems depending on the coolant and the conductor used. Conductor cost for HTS has been estimated in the low range of the spectrum for usual HTS YBCO based tapes at 10€/kAm,
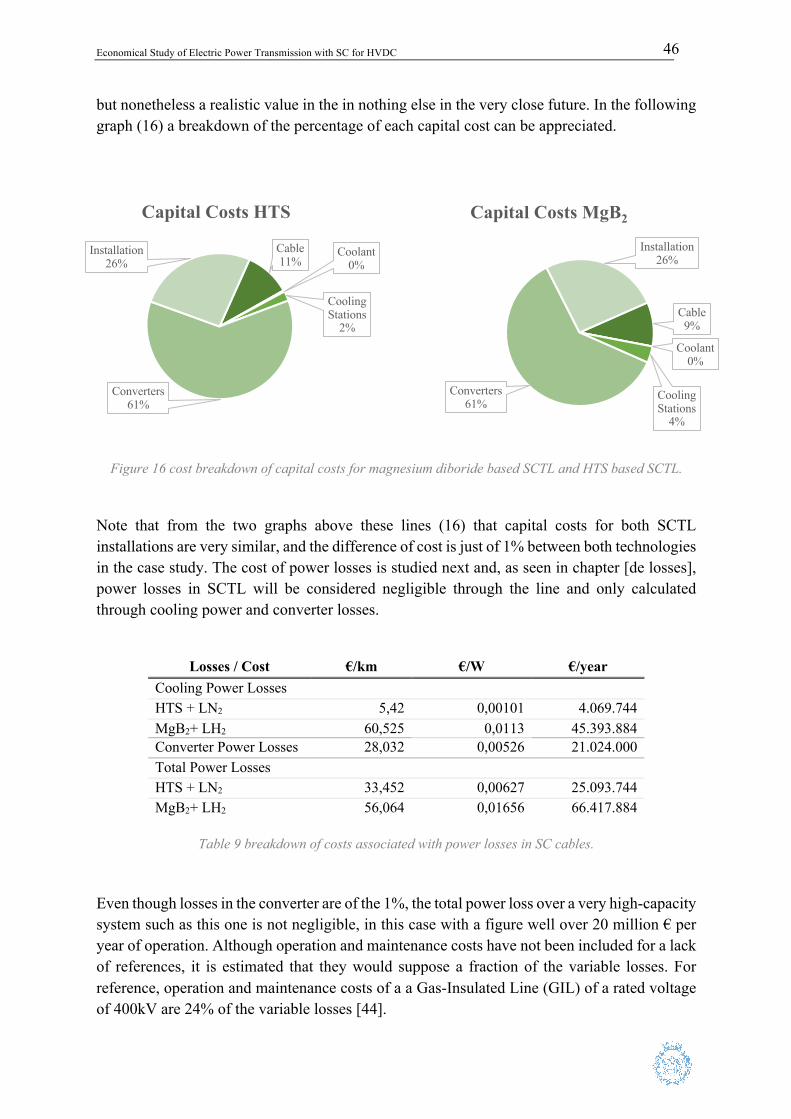
Economical Study of Electric Power Transmission with SC for HVDC
46
but nonetheless a realistic value in the in nothing else in the very close future. In the following graph (16) a breakdown of the percentage of each capital cost can be appreciated.
Figure 16 cost breakdown of capital costs for magnesium diboride based SCTL and HTS based SCTL. Note that from the two graphs above these lines (16) that capital costs for both SCTL installations are very similar, and the difference of cost is just of 1% between both technologies in the case study. The cost of power losses is studied next and, as seen in chapter [de losses], power losses in SCTL will be considered negligible through the line and only calculated through cooling power and converter losses.
Losses / Cost €/km €/W €/year Cooling Power Losses HTS + LN2 5,42 0,00101 4.069.744 MgB2+ LH2 60,525 0,0113 45.393.884 Converter Power Losses 28,032 0,00526 21.024.000 Total Power Losses HTS + LN2 33,452 0,00627 25.093.744 MgB2+ LH2 56,064 0,01656 66.417.884
Table 9 breakdown of costs associated with power losses in SC cables.
Even though losses in the converter are of the 1%, the total power loss over a very high-capacity system such as this one is not negligible, in this case with a figure well over 20 million € per year of operation. Although operation and maintenance costs have not been included for a lack of references, it is estimated that they would suppose a fraction of the variable losses. For reference, operation and maintenance costs of a a Gas-Insulated Line (GIL) of a rated voltage of 400kV are 24% of the variable losses [44].
Cable11%
Coolant0%
Cooling Stations
2%
Converters61%
Installation26%
Capital Costs HTS
Cable9%
Coolant0%
Cooling Stations
4%
Converters61%
Installation26%
Capital Costs MgB2
Cable9%
Coolant0%
Cooling Stations
4%
Converters61%
Installation26%
Capital Costs MgB2
Economical Study of Electric Power Transmission with SC for HVDC
47
6.2.2 Cost Study for Underground Lines Underground lines are the planned transmission system for the case study, Süd Link in Germany. This installation is of particular interest because underground XLPE cable transmission shares many common points with SCTL and where many projects could be updated to SCTL in a future. Both structures are similar in terms of civil and laying works. The underground cables that will be studied for this case will be HVDC XLPE cables. The cost of XLPE cables largely depends on the price of its raw materials, mainly copper of 2000-3000 mm2 of section and the extruded XLPE insulation. To determine the cost for HVDC cables the model used in [tfg lorca], adapted from [rebled] will be adopted. The model considers a bipole of HVDC cables which distribute power equally among them. The equation (X) approximates the cost from the rated power of the cable pair and the HVDC voltage level.
𝐶/HFG* = 0,652 + 0,00098 · 𝑃(H1*0/HFG* − 0,002363 · 𝑈D=^+ Where, 𝐶/HFG*: cost of the bipole [M€ km-1]
𝑃(H1*0/HFG*: rated power of the bipole [MW]
𝑈D=^+:HVDC voltage level [kV]
Both laying and substation cost will be calculated with the same method that has been used for SCTL cost modelling. This assumption is not accurate for the laying methods, since SCTL occupies a smaller area when installed. Nonetheless, given that traditional HVDC undergrounding costs have been used for the approximation of costs in the case of superconducting lines, laying costs will be in concordance with traditional cable HVDC budgets. Substation costs are also extracted with the method seen in previously because it will be an equally powered line with the same electricity characteristics. Converters are VSC type.
Component /Cost €/km €/W € Cable 3.331.425 0,62 2.498.568.750
Substations (ac+dc) 772.847 0,145 579.635.700
Installation 660.000 0,123 495.000.000
Total 4.764.272 0,888 3.573.204.450 Table 10 breakdown of the costs associated with underground conventional cables
Power losses for a copper based XLPE cable (Cu/XLPE) are calculated using the equation provided in [8] for the Joule losses in this sort of cable.
(24)
Economical Study of Electric Power Transmission with SC for HVDC
48
𝑃+, =2𝜌+,𝐽+,𝑉0/
𝑃𝑃%𝑃
where, 𝑃+,: joule loss of Cu/XLPE cable [W m-1]
𝜌+,: resistivity of copper [ Ω m]
𝐽+,: current density of copper [A m-2]
𝑉0/: rated voltage of the cable [V]
𝑃%: rated power of the cable [MVA]
𝑃: transmitted power [MVA]
Values of current density 𝐽+,=1 A mm-2 and resistivity 𝜌+,= 2,1 𝜇Ωcm are assumed. Since no technical details regarding the rated voltage have been found, the relation between rated and transmitted will be assumed of 0,7. Power factor for power calculation in MVA is assumed of 1. For a 750km, 4GW at 525kV HVDC Cu/XLPE underground line, the power losses are estimated of 224 kW km-1. The resulting costs are:
Component / Cost €/km €/W €/year Cu, XLPE Cable 117734,4 0,022 88.300.800
Table 11 costs of power losses for underground conventional cables
6.2.3 Cost Study for OHL Although it is very unlikely that large-scale energy transportation through densely populated areas, like much of Europe, will be done using OHL lines in the future, this system of transmission lines is the current standard and therefore of interest to compare against SCTL. Transmission through OHL is the most extended and widely used throughout the globe for its economic viability and ease of access for maintenance. Once again, the costs are calculated using data from [39]. The baseline cost for a HVDC OHL structure is calculated with;
𝐶D=^+ = 0,0019𝑈 + 0.1875 where, 𝐶D=^+: baseline cost for HVDC [M€ km-1]
𝑈: line voltage [kV]
(25)
(25)
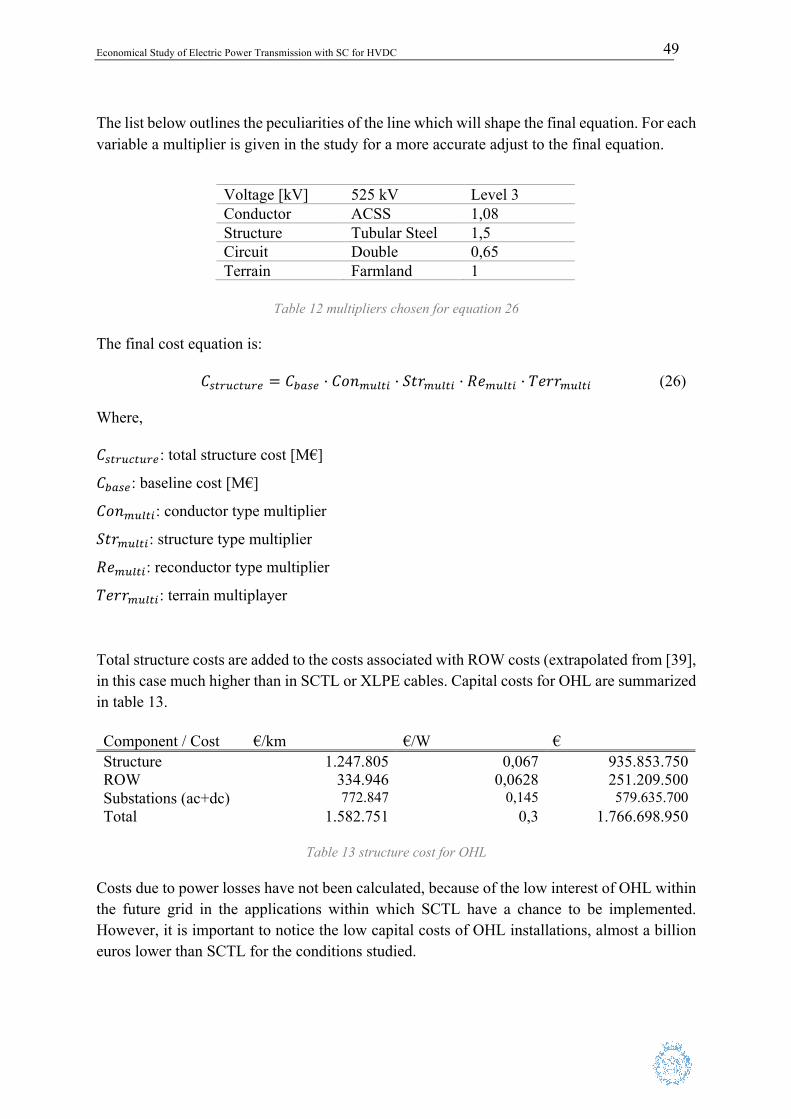
Economical Study of Electric Power Transmission with SC for HVDC
49
The list below outlines the peculiarities of the line which will shape the final equation. For each variable a multiplier is given in the study for a more accurate adjust to the final equation.
Table 12 multipliers chosen for equation 26
The final cost equation is:
𝐶<1(,/1,(* = 𝐶FH<* · 𝐶𝑜𝑛),G1# · 𝑆𝑡𝑟),G1# · 𝑅𝑒),G1# · 𝑇𝑒𝑟𝑟),G1# Where, 𝐶<1(,/1,(*: total structure cost [M€]
𝐶FH<*: baseline cost [M€]
𝐶𝑜𝑛),G1#: conductor type multiplier
𝑆𝑡𝑟),G1#: structure type multiplier
𝑅𝑒),G1#: reconductor type multiplier
𝑇𝑒𝑟𝑟),G1#: terrain multiplayer
Total structure costs are added to the costs associated with ROW costs (extrapolated from [39], in this case much higher than in SCTL or XLPE cables. Capital costs for OHL are summarized in table 13. Component / Cost €/km €/W € Structure 1.247.805 0,067 935.853.750 ROW 334.946 0,0628 251.209.500 Substations (ac+dc) 772.847 0,145 579.635.700 Total 1.582.751 0,3 1.766.698.950
Table 13 structure cost for OHL
Costs due to power losses have not been calculated, because of the low interest of OHL within the future grid in the applications within which SCTL have a chance to be implemented. However, it is important to notice the low capital costs of OHL installations, almost a billion euros lower than SCTL for the conditions studied.
Voltage [kV] 525 kV Level 3 Conductor ACSS 1,08 Structure Tubular Steel 1,5 Circuit Double 0,65 Terrain Farmland 1
(26)
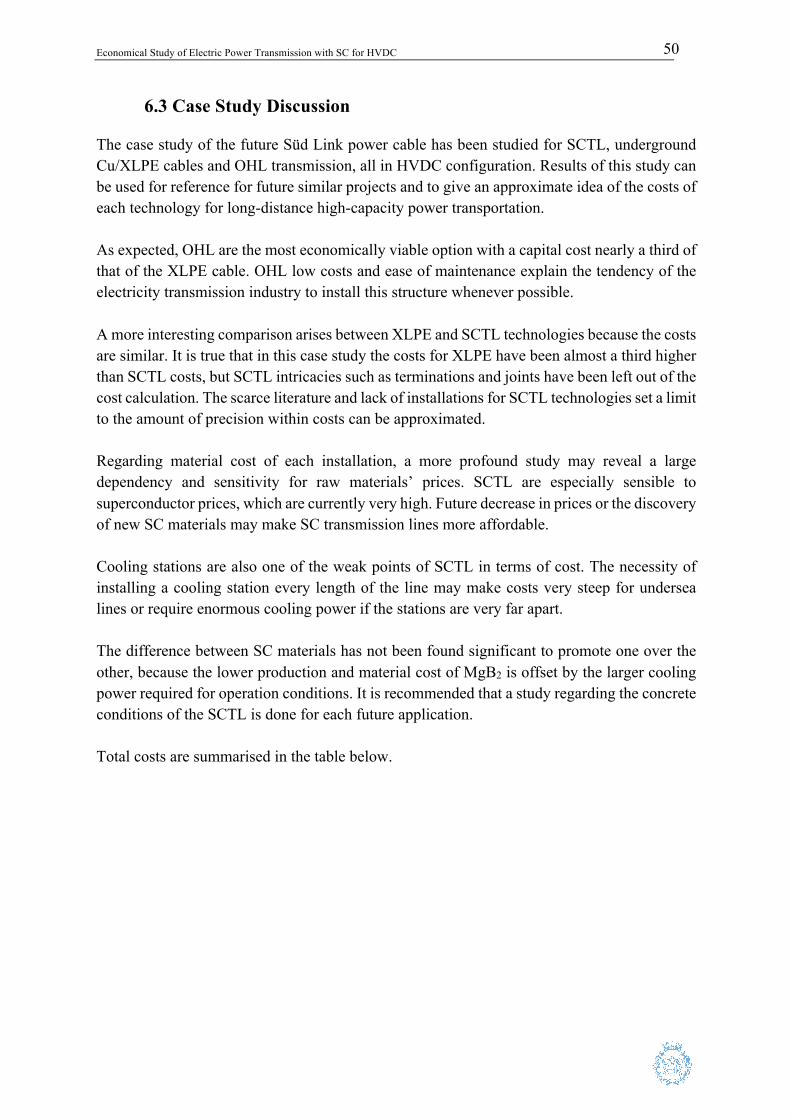
Economical Study of Electric Power Transmission with SC for HVDC
50
6.3 Case Study Discussion The case study of the future Süd Link power cable has been studied for SCTL, underground Cu/XLPE cables and OHL transmission, all in HVDC configuration. Results of this study can be used for reference for future similar projects and to give an approximate idea of the costs of each technology for long-distance high-capacity power transportation. As expected, OHL are the most economically viable option with a capital cost nearly a third of that of the XLPE cable. OHL low costs and ease of maintenance explain the tendency of the electricity transmission industry to install this structure whenever possible. A more interesting comparison arises between XLPE and SCTL technologies because the costs are similar. It is true that in this case study the costs for XLPE have been almost a third higher than SCTL costs, but SCTL intricacies such as terminations and joints have been left out of the cost calculation. The scarce literature and lack of installations for SCTL technologies set a limit to the amount of precision within costs can be approximated. Regarding material cost of each installation, a more profound study may reveal a large dependency and sensitivity for raw materials’ prices. SCTL are especially sensible to superconductor prices, which are currently very high. Future decrease in prices or the discovery of new SC materials may make SC transmission lines more affordable. Cooling stations are also one of the weak points of SCTL in terms of cost. The necessity of installing a cooling station every length of the line may make costs very steep for undersea lines or require enormous cooling power if the stations are very far apart. The difference between SC materials has not been found significant to promote one over the other, because the lower production and material cost of MgB2 is offset by the larger cooling power required for operation conditions. It is recommended that a study regarding the concrete conditions of the SCTL is done for each future application. Total costs are summarised in the table below.
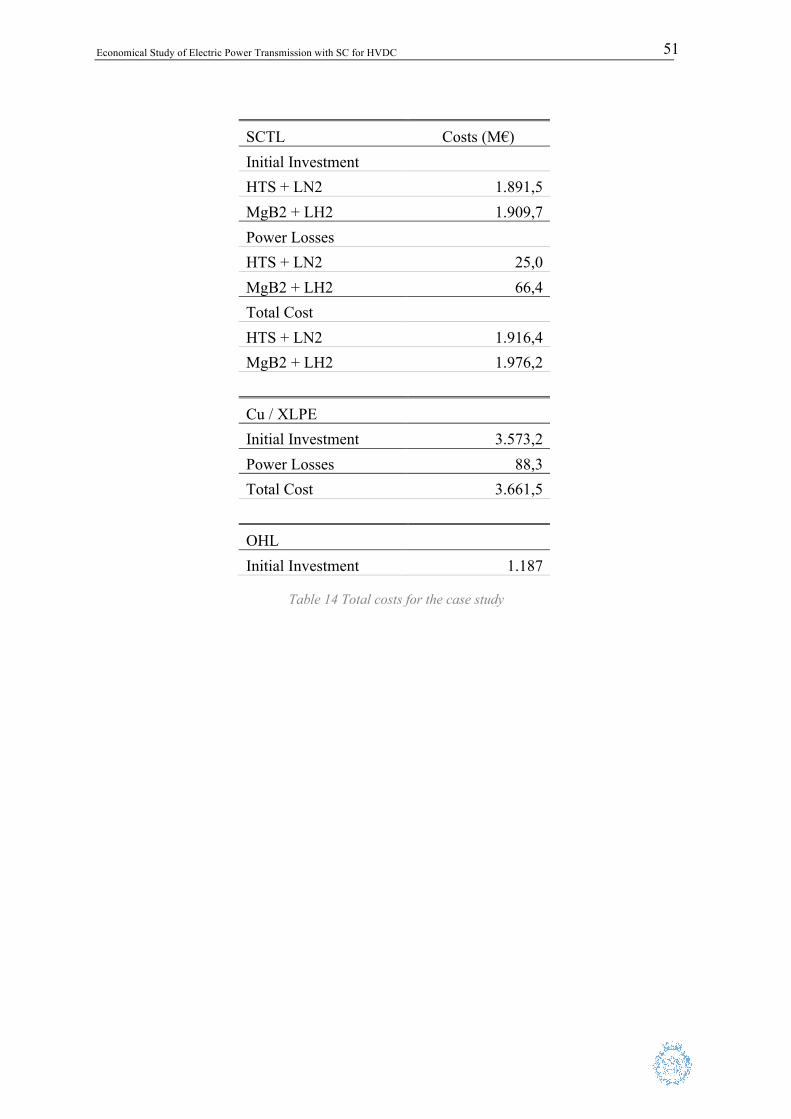
Economical Study of Electric Power Transmission with SC for HVDC
51
Table 14 Total costs for the case study
SCTL Costs (M€) Initial Investment HTS + LN2 1.891,5 MgB2 + LH2 1.909,7 Power Losses HTS + LN2 25,0 MgB2 + LH2 66,4
Total Cost HTS + LN2 1.916,4 MgB2 + LH2 1.976,2
Cu / XLPE Initial Investment 3.573,2 Power Losses 88,3 Total Cost 3.661,5 OHL Initial Investment 1.187
Economical Study of Electric Power Transmission with SC for HVDC
52
7 Conclusions The developed calculation tool uses data from experiments, real scenarios, and scientific studies to allow any interested person, institution, or company to estimate the capital costs and power losses that a superconducting transmission line requires. It must not be obviated that the costs derived from this tool are but an estimate of the real cost of a project of such magnitude. Many factors, such as the details of the terrain where the line must be installed, the countries it must go through, the civil work cost and an infinitude of other smaller details must not be forgotten, for they amount to a considerable cost at the end of the project. SCTL are a complex and (as of today) understudied method of energy transportation. The costs associated with the development of any new technology are enormous, which, coupled with the intrinsic cost of HVDC converters are prohibitive but to highly specific companies and investors. The author hopes that, with the tool developed in this study interested parties can attest to the feasibility of electricity transportation with superconducting materials for long-distance electricity transportation. Moreover, SCTL underground lines provide the opportunity of lowering the overall impact traditional power lines have been linked to and circulate through densely populated areas with no disturbance. The final case study has proved that, even with its many faults and omissions (such as terminations, civil work, etc) SCTL are not so far removed from XLPE cables. Many projects in the TYDP which are planned to be long distance and high capacity can be studied for superconducting transmission and, coupled with the ever-increasing share of renewables provide a greener, safer, and more efficient system of power delivery. The author acknowledges that some parts of the used models, calculations and assumptions have been made roughly and purely for estimation purposes. For this reason, future work can be done to improve this study:
• Creation of a model that can calculate transmission losses through the superconductor due to fluctuations in temperature, electric and magnetic field.
• Inclusion of terminations, joints, and SCTL specific equipment into the cost estimation.
• Study on the optimum range for cooling stations considering the line location and power requirements. Extrapolate the tool to see whether submarine superconducting transmission is a possibility.
Economical Study of Electric Power Transmission with SC for HVDC
53
References
[1] Program on Technology Innovation: a Superconducting DC Cable. EPRI, Palo Alto, CA: 2009. 1020458.
[2] Chervyakov, A., 2015. Superconducting Electric Lines.
[3] Sohn, S., Lim, J., Yang, B., Lee, S., Jang, H., Kim, Y., Yang, H., Kim, D., Kim, H., Yim, S., Won, Y. and Hwang, S., 2010. Design and development of 500m long HTS cable system in the KEPCO power grid, Korea. Physica C: Superconductivity and its Applications, 470(20), pp.1567-1571.
[4] Sytnikov, V., Bemert, S., Kopylov, S., Romashov, M., Ryabin, T., Shakaryan, Y. and Lobyntsev, V., 2015. Status of HTS Cable Link Project for St. Petersburg Grid. IEEE Transactions on Applied Superconductivity, 25(3), pp.1-4.
[5] Development of a High-Tc Superconducting Power Cable, Mukoyama, S.
[6] Maguire, J., Yuan, J., Romanosky, W., Schmidt, F., Soika, R., Bratt, S., Durand, F., King, C., McNamara, J. and Welsh, T., 2011. Progress and Status of a 2G HTS Power Cable to Be Installed in the Long Island Power Authority (LIPA) Grid. IEEE Transactions on Applied Superconductivity, 21(3), pp.961-966.
[7] Lim, J., Yang, H., Sohn, S., Oh, S., Kim, Y., Lee, G., Jang, H., Lee, S. and Hwang, S., 2012. Installation and performance test of cooling system for HTS cable in ICHEON substation.
[8] Morandi, A., 2015. HTS dc transmission and distribution: concepts, applications and benefits. Superconductor Science and Technology, 28(12), p.123001.
[9] SUPERCONDUCTING CABLES FOR POWER TRANSMISSION APPLICATIONS – A REVIEW, F. Schmidt.
[10] Bruzek, C., Ballarino, A., Escamez, G., Giannelli, S., Grilli, F., Lesur, F., Marian, A. and Tropeano, M., 2017. Cable Conductor Design for the High-Power MgB2 DC Superconducting Cable Project of BEST PATHS. IEEE Transactions on Applied Superconductivity, 27(4), pp.1-5.
[11] Thomas, H., Marian, A., Chervyakov, A., Stückrad, S. and Rubbia, C., 2021. Efficiency of superconducting transmission lines: An analysis with respect to the load factor and capacity rating.
[12] Chevtchenko, O., 2015. Future long distance electricity transmission using HTS HVDC cables.
[13] Li Ren, Yuejin Tang, Jing Shi and Fengshun Jiao, 2012. Design of a Termination for the HTS Power Cable. IEEE Transactions on Applied Superconductivity, 22(3), pp.5800504-5800504.
[14] Yeekin Tsui, E. Surrey. Soldered joints—an essential component of demountable high temperature superconducting fusion magnets.
Economical Study of Electric Power Transmission with SC for HVDC
54
[15] Lim, J., Sohn, S., Yang, H., Kim, D., Ryoo, H., Hwang, S., Weisend, J., Barclay, J., Breon, S., Demko, J., DiPirro, M., Kelley, J., Kittel, P., Klebaner, A., Zeller, A., Zagarola, M., Van Sciver, S., Rowe, A., Pfotenhauer, J., Peterson, T. and Lock, J., 2008. THE RESULTS OF COOLING TEST ON HTS POWER CABLE OF KEPCO. AIP Conference Proceedings,.
[16] Jin, L., Lee, C., Baek, S. and Jeong, S., 2018. Design of high-efficiency Joule-Thomson cycles for high-temperature superconductor power cable cooling. Cryogenics, 93, pp.17-25.
[17] Zajaczkowski, B., Giesbers, A., Holtrust, M., Haenen, E. and den Heijer, R., 2011. Feasibility of inline cooling in long distance HTS power line. Cryogenics, 51(4), pp.180-186.
[18] Fan, Y., Gong, L., Xu, X., Li, L., Zhang, L. and Xiao, L., 2005. Cryogenic system with the sub-cooled liquid nitrogen for cooling HTS power cable. Cryogenics, 45(4), pp.272-276.
[19] Maguire, J., Yuan, J., Schmidt, F., Soika, R., Bratt, S., King, C., McNamara, J., Welsh, T. and Weisend, J., 2010. OPERATIONAL EXPERIENCE OF THE WORLD’S FIRST TRANSMISSION LEVEL VOLTAGE HTS POWER CABLE.
[20] Charles Weber, Roger Farrell. High Temperature Superconducting Underground Power Cable.
[21] Sytnikov, V., Kashcheev, A., Dubinin, M., Karpov, V. and Ryabin, T., 2021. Test Results of the Full-Scale HTS Transmission Cable Line (2.4 Km) for the St. Petersburg Project. IEEE Transactions on Applied Superconductivity, pp.1-1.
[22] Leghissa, M., 2002. Development and application of superconducting transformers.
[23] Berger, A., Cherevatskiy, S., Noe, M. and Leibfried, T., 2010. Comparison of the efficiency of superconducting and conventional transformers. Journal of Physics: Conference Series, 234(3), p.032004.
[24] Yamaguchi, S., Kawahara, T., Hamabe, M., Watanabe, H., Ivanov, Y., Sun, J. and Iiyoshi, A., 2011. Experiment of 200-meter superconducting DC cable system in Chubu University. Physica C: Superconductivity and its Applications, 471(21-22), pp.1300-1303.
[25] n.d. Undergrounding high voltage electricity transmission lines.
[26] 2005. Power Cable Installation Guide.
[27] Ye, H., n.d. Review on HVDC Cable Terminations.
[28] Submarine Optical Cable Engineering, 2018. Installation of the Submarine Optical Cable. pp.161-193.
[29] Jordache Pillay, C., 2020. Transmission Systems: HVAC vs HVDC.
[30] Yamaguchi, S., Kawahara, T., Hamabe, M., Watanabe, H., Ivanov, Y., Sun, J. and Iiyoshi, A., 2011. Experiment of 200-meter superconducting DC cable system in Chubu
Economical Study of Electric Power Transmission with SC for HVDC
55
[31] Sytnikov, V., Kashcheev, A., Dubinin, M., Karpov, V. and Ryabin, T., 2021. Test Results of the Full-Scale HTS Transmission Cable Line (2.4 Km) for the St. Petersburg Project. IEEE Transactions on Applied Superconductivity, pp.1-1.
[32] Xuemin Liang, Shaotao Dai, Zhiyuan Gao, Naihao Song, Yinshun Wang, Dong Zhang, Zhifeng Zhang, Fengyuan Zhang, Zhiqin Zhu, Xi Xu, Tianbin Huang, Xiaochun Li, Zhicheng Cao, Yubao Lin, Liangzhen Lin and Liye Xiao, 2010. Design of a 380 m DC HTS Power Cable. IEEE Transactions on Applied Superconductivity, 20(3), pp.1259-1262.
[33] Trevisani, L., Fabbri, M. and Negrini, F., 2007. Long distance renewable-energy-sources power transmission using hydrogen-cooled MgB2 superconducting line. Cryogenics, 47(2), pp.113-120.
[34] Kiss, T., Inoue, M., Kuga, T., Ishimaru, M., Egashira, S., Irie, S., Ohta, T., Imamura, K., Yasunaga, M., Takeo, M., Matsushita, T., Iijima, Y., Kakimoto, K., Saitoh, T., Awaji, S., Watanabe, K. and Shiohara, Y., 2003. Critical current properties in HTS tapes. Physica C: Superconductivity, 392-396, pp.1053-1062.
[35] Pană, A., Băloi, A. and Molnar-Matei, F., 2019. Mathematical Explanations of a Paradox Observed in a HVAC (High Voltage Alternating Current) Untransposed Overhead Line. Energies, 12(4), p.734.
[36] Zhixuan Wang, Jie Qiu, Shuhong Wang. Design of Cold Dielectric HTS Power Cable
[37] Green, M., 2015. The cost of coolers for cooling superconducting devices at temperatures at 4.2 K, 20 K, 40 K and 77 K. IOP Conference Series: Materials Science and Engineering, 101, p.012001.
[38] Thomas, H., Marian, A., Chervyakov, A., Stückrad, S., Salmieri, D. and Rubbia, C., 2021. Superconducting transmission lines – Sustainable electric energy transfer with higher public acceptance?.
[39] Belevi Polanco, D., 2020. Cost Estimation of Transmission Lines For Future European Grid.
[40] Oni, O., Mbangula, K. and Davidson, I., 2016. A Review of LCC-HVDC and VSC-HVDC Technologies and Applications. Transactions on Environment and Electrical Engineering, 1(3), p.68.
[41] 2020. Transmission Cost Estimation Guide.
[42] Rebled Lluch, J., n.d. Power transmission systems for offshore wind farms: Technical-economic analysis.
[43] 2020. TYDP 2020.
[44] Llorca Ortolá, J., 2018. Technical-economic analysis of Gas Insulated Lines.
[45] www.navstarsteel.com

Economical Study of Electric Power Transmission with SC for HVDC
56