eCommerce expected to accelerate globally in 2014boletines.prisadigital.com/Global_ecommerce.pdf ·...
21
March 5, 2014 eCommerce expected to accelerate globally in 2014 Equity Research Raising Goldman Sachs global ecommerce forecasts Global ecommerce growth slows 170bps in 2013 Global ecommerce growth on a USD basis slowed by 170 bps in 2013 to 17.1% yoy vs. +18.8% in 2012 driven by a condensed U.S. holiday season, the higher U.S. payroll tax, a slower growing Europe, and currency deflation relative to the U.S. dollar in Japan, Latin America, and India. Despite this deceleration, 3 rd party data suggests that the rate of share shift from offline to online was stable globally at 61bps in 2013 vs. 64bps in 2012 according to Euromonitor and accelerated to 98bps from 84bps in the US. Expect macro-driven acceleration in 2014 Our global forecast suggests 2014 should reaccelerate to 17.9% from +17.1% in 2013 and in the U.S. to 16.1% from +15.9% in 2013, as faster growing international markets become a larger part of the mix, the U.S. economy improves with forecasted real GDP of +2.9% in 2014 vs. +1.9% in 2013, Euro Area real GDP rebounds to +1.2% in 2014 vs. -0.4% in 2013, and FX headwinds potentially ease. In addition, we believe mobile will continue to accelerate the shift online, aided by growth in curated commerce and the development of omnichannel opportunities, while the pace of share gains from store-based retail continues as retailers consolidate square footage and inventory in certain verticals and develop their own online businesses. Mobile remains key catalyst, particularly during the holidays Mobile is increasingly a catalyst for ecommerce as smartphones and tablets drive frequency and engagement, personalization, incremental transactions, and in-store price comparison, though store-based retailers are improving mobile savviness to drive in-store traffic and engagement. During the 4Q13 holiday season, more than half of Amazon’s consumers shopped with a mobile device while PayPal (eBay) saw 115%+ growth in total payment volume on Thanksgiving and Black Friday. Goldman Sachs ecommerce/retail recommendations Across our global coverage we believe the best opportunities in ecommerce and traditional retail well-positioned for ecommerce are in Amazon, eBay, Carter’s, Kinnevik, Naspers, Nordstrom, Ocado, PVH Corp., Ralph Lauren, RetailMeNot, VIPshop, Urban Outfitters, Yahoo (Alibaba exposure), Yahoo Japan, Yandex, and YOOX (Exhibits 1 & 2). Alternatively, we rate Bed Bath & Beyond, Genesco, Kohl’s, and MercadoLibre at Sell. Heath P. Terry, CFA (212) 3571849 [email protected] Goldman, Sachs & Co. Matthew J. Fassler (212) 902-6740 [email protected] Goldman, Sachs & Co. Piyush Mubayi +852-2978-1677 [email protected] Goldman Sachs (Asia) L.L.C. Alexander Balakhnin +7(495)645-4016 [email protected] OOO Goldman Sachs Bank Debra Schwartz (212) 902-1879 [email protected] Goldman, Sachs & Co. Weibo Hu +86(21)2401-8944 [email protected] Beijing Gao Hua Securities Company Limited Franklin Walding +44(20)7552-9446 [email protected] Goldman Sachs International Takashi Watanabe +81(3)6437-9894 [email protected] Goldman Sachs Japan Co., Ltd. Vera Rossi (212) 357-7448 [email protected] Goldman, Sachs & Co. Irma Sgarz +55(11)3371-0728 [email protected] Goldman Sachs do Brasil CTVM S.A. Lindsay Drucker Mann, CFA (212) 357-4993 [email protected] Goldman, Sachs & Co. Stephen Grambling, CFA (212) 902-7832 [email protected] Goldman, Sachs & Co. Goldman Sachs does and seeks to do business with companies covered in its research reports. As a result, investors should be aware that the firm may have a conflict of interest that could affect the objectivity of this report. Investors should consider this report as only a single factor in making their investment decision. For Reg AC certification and other important disclosures, see the Disclosure Appendix, or go to www.gs.com/research/hedge.html. Analysts employed by non-US affiliates are not registered/qualified as research analysts with FINRA in the U.S. The Goldman Sachs Group, Inc. Global Investment Research
Transcript of eCommerce expected to accelerate globally in 2014boletines.prisadigital.com/Global_ecommerce.pdf ·...
March 5, 2014
eCommerce expected to
accelerate globally in 2014
Equity Research
Raising Goldman Sachs global ecommerce forecasts
Global ecommerce growth slows 170bps in 2013
Global ecommerce growth on a USD basis slowed by 170 bps in 2013 to
17.1% yoy vs. +18.8% in 2012 driven by a condensed U.S. holiday season,
the higher U.S. payroll tax, a slower growing Europe, and currency
deflation relative to the U.S. dollar in Japan, Latin America, and India.
Despite this deceleration, 3rd party data suggests that the rate of share shift
from offline to online was stable globally at 61bps in 2013 vs. 64bps in 2012
according to Euromonitor and accelerated to 98bps from 84bps in the US.
Expect macro-driven acceleration in 2014
Our global forecast suggests 2014 should reaccelerate to 17.9% from
+17.1% in 2013 and in the U.S. to 16.1% from +15.9% in 2013, as faster
growing international markets become a larger part of the mix, the U.S.
economy improves with forecasted real GDP of +2.9% in 2014 vs. +1.9% in
2013, Euro Area real GDP rebounds to +1.2% in 2014 vs. -0.4% in 2013, and
FX headwinds potentially ease. In addition, we believe mobile will continue
to accelerate the shift online, aided by growth in curated commerce and the
development of omnichannel opportunities, while the pace of share gains
from store-based retail continues as retailers consolidate square footage
and inventory in certain verticals and develop their own online businesses.
Mobile remains key catalyst, particularly during the holidays
Mobile is increasingly a catalyst for ecommerce as smartphones and
tablets drive frequency and engagement, personalization, incremental
transactions, and in-store price comparison, though store-based retailers
are improving mobile savviness to drive in-store traffic and engagement.
During the 4Q13 holiday season, more than half of Amazon’s consumers
shopped with a mobile device while PayPal (eBay) saw 115%+ growth in
total payment volume on Thanksgiving and Black Friday.
Goldman Sachs ecommerce/retail recommendations
Across our global coverage we believe the best opportunities in
ecommerce and traditional retail well-positioned for ecommerce are in
Amazon, eBay, Carter’s, Kinnevik, Naspers, Nordstrom, Ocado, PVH Corp.,
Ralph Lauren, RetailMeNot, VIPshop, Urban Outfitters, Yahoo (Alibaba
exposure), Yahoo Japan, Yandex, and YOOX (Exhibits 1 & 2). Alternatively,
we rate Bed Bath & Beyond, Genesco, Kohl’s, and MercadoLibre at Sell.
Heath P. Terry, CFA (212) 3571849 [email protected] Goldman, Sachs & Co.
Matthew J. Fassler (212) 902-6740 [email protected] Goldman, Sachs & Co.
Piyush Mubayi +852-2978-1677 [email protected] Goldman Sachs (Asia) L.L.C.
Alexander Balakhnin +7(495)645-4016 [email protected] OOO Goldman Sachs Bank
Debra Schwartz (212) 902-1879 [email protected] Goldman, Sachs & Co.
Weibo Hu +86(21)2401-8944 [email protected] Beijing Gao Hua Securities Company Limited
Franklin Walding +44(20)7552-9446 [email protected] Goldman Sachs International
Takashi Watanabe +81(3)6437-9894 [email protected] Goldman Sachs Japan Co., Ltd.
Vera Rossi (212) 357-7448 [email protected] Goldman, Sachs & Co.
Irma Sgarz +55(11)3371-0728 [email protected] Goldman Sachs do Brasil CTVM S.A.
Lindsay Drucker Mann, CFA (212) 357-4993 [email protected] Goldman, Sachs & Co.
Stephen Grambling, CFA (212) 902-7832 [email protected] Goldman, Sachs & Co.
Goldman Sachs does and seeks to do business with companies covered in its research reports. As a result, investorsshould be aware that the firm may have a conflict of interest that could affect the objectivity of this report. Investorsshould consider this report as only a single factor in making their investment decision. For Reg AC certification and otherimportant disclosures, see the Disclosure Appendix, or go to www.gs.com/research/hedge.html. Analysts employed bynon-US affiliates are not registered/qualified as research analysts with FINRA in the U.S.
The Goldman Sachs Group, Inc. Global Investment Research

March 5, 2014 Global: Technology: Internet
Goldman Sachs Global Investment Research 2
PM summary: what to expect from ecommerce in 2014 3
Updating the Goldman Sachs global ecommerce forecast 6
Country/Region specific forecasts and highlights 11
Comscore shows continued acceleration in ecommerce share gains 14
Mcommerce led share gains particularly evident during the holidays 15
Disclosure Appendix 18
Heath P. Terry, CFA (212) 357‐1849 Verra Rossi (212) 357‐7448
Debra Schwartz (212) 902‐1879 Irma Sgarz +55(11)3371‐0728
Perry Gold (212) 357‐8280
Alexander Balakhin +7(495)645‐4016 Matthew J. Fassler (212) 902‐6740
Franklin Walding +44(20)7552‐9446 Lindsay Drucker Mann, CFA (212) 357‐4993
Markus Iwar +44(20)7552‐1264 Stephen Grambling, CFA (212) 902‐7832
Benjamin Moore, CFA +44(20)7774‐2365 Taposh Bari, CFA (212) 902‐9884
Piyush Mubayi +852‐2978‐1677
Weibo Hu +86(21)2401‐8944
Takashi Watanabe +81(3)6437‐9894
U.S Internet
European Internet & Retail
Latin American Internet & Retail
U.S. Retail
APAC Internet & Retail

March 5, 2014 Global: Technology: Internet
Goldman Sachs Global Investment Research 3
PM summary: what to expect from ecommerce in 2014
Global ecommerce growth on a USD basis slowed by 170 bps in 2013 to 17.1% yoy vs.
+18.8% in 2012 driven by a condensed U.S. holiday season, the higher U.S. payroll tax, a
slower growing Europe, and currency deflation relative to the U.S. dollar in Japan, Latin
America, and India. Despite this deceleration, 3rd party data suggests that the rate of share
shift from offline to online was stable globally at 61bps in 2013 vs. 64bps in 2012 according
to Euromonitor and accelerated to 98bps from 84bps in the US.
2014 should see reacceleration. We believe that 2014 should reaccelerate on a global
basis to 17.9% from +17.1% in 2013 and in the U.S. to 16.1% from +15.9% in 2013. In
aggregating our market by market estimates for ecommerce growth, our forecast for global
ecommerce growth in 2014-2016 increases by 6% on average. Growth should be led by:
An improving U.S. economy (GS forecasts real GDP growth of 2.9% in ’14 vs. 1.9%
in ’13),
A rebounding Euro Area (GS forecasts real GDP growth of 1.2% in ’14 vs. -0.4%
in ’13),
Easier comparisons from annualizing the U.S. payroll tax and shorter holiday
season,
Potentially easing FX headwinds (with GS forecasting JPY vs. USD depreciation of
4.5% from year end ’13 to ’14 vs. 21.7% from year end ’12 to ‘13),
Store-based retailers consolidating locations and square footage.
Growth in models like curated commerce and the development of omnichannel.
Mobile will remain a key catalyst. Mobile is increasingly a catalyst for ecommerce as
smartphones and tablets drive frequency and engagement, personalization, incremental
transactions, and in-store price comparison though store-based retailers are improving
mobile savviness to drive in-store traffic and engagement. During the 4Q13 holiday season,
more than half of Amazon’s consumers shopped with a mobile device while PayPal (eBay)
saw 115%+ growth in total payment volume on Thanksgiving and Black Friday. Mobile
currently accounts for 30% of ecommerce transactions in Japan and 7-10% of transactions
in Latin America.
Our new global ecommerce estimates increase 6% on average from 2014-16. Our new
ecommerce estimates from 2014-16 come as the result of improving U.S. and European
economies and individual market outperformance versus our prior estimates. On a market
by market basis, our estimate increases are most pronounced for India (27%), China (14%),
and the rest of Asia (29%) following stronger growth than we had prior forecast. Our
estimates decline for Brazil (21%) and to a lesser extent for Japan (4%) to factor the impact
of FX vs. the USD. For developed markets, our estimates for the U.S. and North America
increase 2% on average, while Western Europe increases 10%.
We believe worldwide ecommerce will grow at a 17.1% three-year annual growth
rate, driven by North America, China, and Western Europe. In the US, we believe
ecommerce will grow 16.1% in 2014 to $241 billion. We forecast a three-year 2013-2016
CAGR of 15.5%. Our 2014 US growth estimates, as well as our three-year CAGR, are ahead
of estimates from Euromonitor, Forrester, and eMarketer. Faster international growth of
17.9% over this period will be driven by growth in China (27.8%) and Russia (20.9%).

March 5, 2014 Global: Technology: Internet
Goldman Sachs Global Investment Research 4
Key investment ideas
We view both Amazon, in creating an ecosystem and leveraging significant
infrastructure and technology investment, and eBay, growing category share and
serving as an enabler of commerce, as among the best leveraged to this growth in
ecommerce.
Other ecommerce names we believe benefit from this growth, include Kinnevik,
Naspers, Ocado, RetailMeNot, VIPshop, Yahoo (exposure to private Alibaba group),
Yahoo Japan, Yandex, and YOOX (Exhibit 1). Alternatively, we rate MercadoLibre
at Sell.
Traditional retail names we believe are well positioned to benefit from ecommerce
growth and omnichannel retail include Carter’s, Nordstrom, PVH Corp., Ralph
Lauren, and Urban Outfitters. Retailers that we believe are vulnerable to
ecommerce include Sell-rated Bed Bath & Beyond, Genesco, and Kohl’s.
March 5, 2014 Global: Technology: Internet
Goldman Sachs Global Investment Research 5
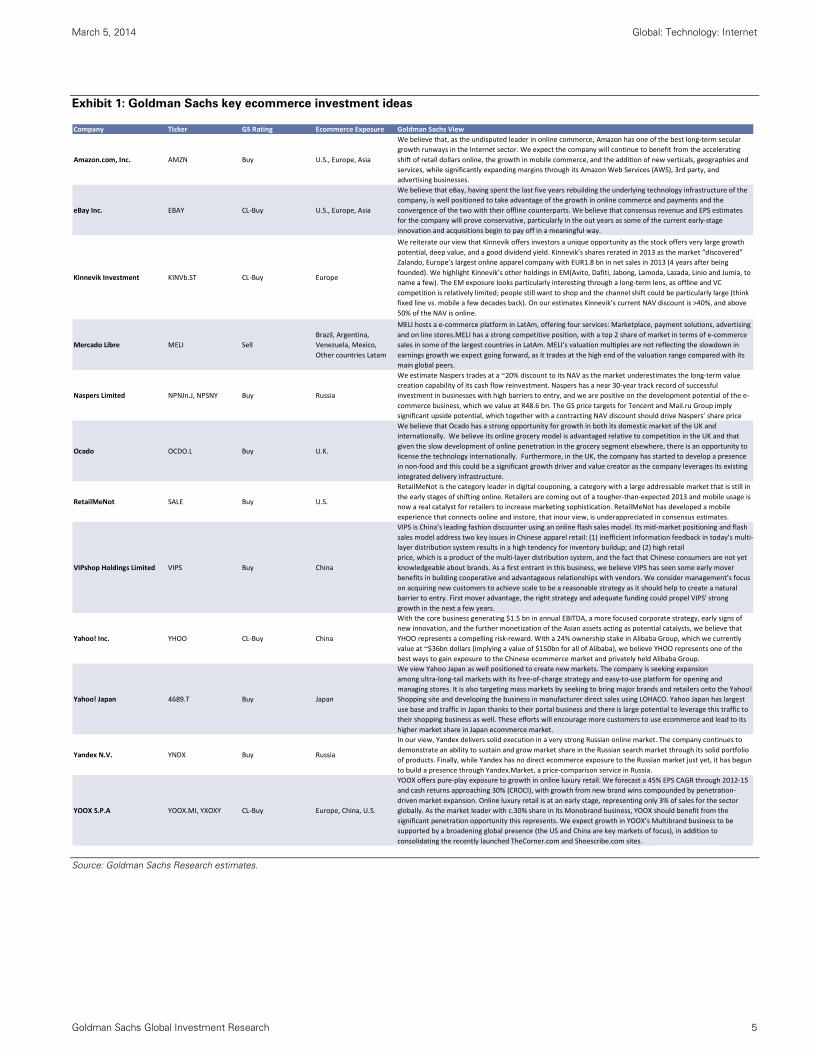
Exhibit 1: Goldman Sachs key ecommerce investment ideas
Source: Goldman Sachs Research estimates.
Company Ticker GS Rating Ecommerce Exposure Goldman Sachs View
Amazon.com, Inc. AMZN Buy U.S., Europe, Asia
We believe that, as the undisputed leader in online commerce, Amazon has one of the best long‐term secular
growth runways in the Internet sector. We expect the company will continue to benefit from the accelerating
shift of retail dollars online, the growth in mobile commerce, and the addition of new verticals, geographies and
services, while significantly expanding margins through its Amazon Web Services (AWS), 3rd party, and
advertising businesses.
eBay Inc. EBAY CL‐Buy U.S., Europe, Asia
We believe that eBay, having spent the last five years rebuilding the underlying technology infrastructure of the
company, is well positioned to take advantage of the growth in online commerce and payments and the
convergence of the two with their offline counterparts. We believe that consensus revenue and EPS estimates
for the company will prove conservative, particularly in the out years as some of the current early‐stage
innovation and acquisitions begin to pay off in a meaningful way.
Kinnevik Investment KINVb.ST CL‐Buy Europe
We reiterate our view that Kinnevik offers investors a unique opportunity as the stock offers very large growth
potential, deep value, and a good dividend yield. Kinnevik’s shares rerated in 2013 as the market “discovered”
Zalando, Europe’s largest online apparel company with EUR1.8 bn in net sales in 2013 (4 years after being
founded). We highlight Kinnevik’s other holdings in EM(Avito, Dafiti, Jabong, Lamoda, Lazada, Linio and Jumia, to
name a few). The EM exposure looks particularly interesting through a long‐term lens, as offline and VC
competition is relatively limited; people still want to shop and the channel shift could be particularly large (think
fixed line vs. mobile a few decades back). On our estimates Kinnevik’s current NAV discount is >40%, and above
50% of the NAV is online.
Mercado Libre MELI Sell
Brazil, Argentina,
Venezuela, Mexico,
Other countries Latam
MELI hosts a e‐commerce platform in LatAm, offering four services: Marketplace, payment solutions, advertising
and on line stores.MELI has a strong competitive position, with a top 2 share of market in terms of e‐commerce
sales in some of the largest countries in LatAm. MELI’s valuation multiples are not reflecting the slowdown in
earnings growth we expect going forward, as it trades at the high end of the valuation range compared with its
main global peers.
Naspers Limited NPNJn.J, NPSNY Buy Russia
We estimate Naspers trades at a ~20% discount to its NAV as the market underestimates the long‐term value
creation capability of its cash flow reinvestment. Naspers has a near 30‐year track record of successful
investment in businesses with high barriers to entry, and we are positive on the development potential of the e‐
commerce business, which we value at R48.6 bn. The GS price targets for Tencent and Mail.ru Group imply
significant upside potential, which together with a contracting NAV discount should drive Naspers’ share price
Ocado OCDO.L Buy U.K.
We believe that Ocado has a strong opportunity for growth in both its domestic market of the UK and
internationally. We believe its online grocery model is advantaged relative to competition in the UK and that
given the slow development of online penetration in the grocery segment elsewhere, there is an opportunity to
license the technology internationally. Furthermore, in the UK, the company has started to develop a presence
in non‐food and this could be a significant growth driver and value creator as the company leverages its existing
integrated delivery infrastructure.
RetailMeNot SALE Buy U.S.
RetailMeNot is the category leader in digital couponing, a category with a large addressable market that is still in
the early stages of shifting online. Retailers are coming out of a tougher‐than‐expected 2013 and mobile usage is
now a real catalyst for retailers to increase marketing sophistication. RetailMeNot has developed a mobile
experience that connects online and instore, that inour view, is underappreciated in consensus estimates.
VIPshop Holdings Limited VIPS Buy China
VIPS is China’s leading fashion discounter using an online flash sales model. Its mid‐market positioning and flash
sales model address two key issues in Chinese apparel retail: (1) inefficient information feedback in today’s multi‐
layer distribution system results in a high tendency for inventory buildup; and (2) high retail
price, which is a product of the multi‐layer distribution system, and the fact that Chinese consumers are not yet
knowledgeable about brands. As a first entrant in this business, we believe VIPS has seen some early mover
benefits in building cooperative and advantageous relationships with vendors. We consider management’s focus
on acquiring new customers to achieve scale to be a reasonable strategy as it should help to create a natural
barrier to entry. First mover advantage, the right strategy and adequate funding could propel VIPS' strong
growth in the next a few years.
Yahoo! Inc. YHOO CL‐Buy China
With the core business generating $1.5 bn in annual EBITDA, a more focused corporate strategy, early signs of
new innovation, and the further monetization of the Asian assets acting as potential catalysts, we believe that
YHOO represents a compelling risk‐reward. With a 24% ownership stake in Alibaba Group, which we currently
value at ~$36bn dollars (implying a value of $150bn for all of Alibaba), we believe YHOO represents one of the
best ways to gain exposure to the Chinese ecommerce market and privately held Alibaba Group.
Yahoo! Japan 4689.T Buy Japan
We view Yahoo Japan as well positioned to create new markets. The company is seeking expansion
among ultra‐long‐tail markets with its free‐of‐charge strategy and easy‐to‐use platform for opening and
managing stores. It is also targeting mass markets by seeking to bring major brands and retailers onto the Yahoo!
Shopping site and developing the business in manufacturer direct sales using LOHACO. Yahoo Japan has largest
use base and traffic in Japan thanks to their portal business and there is large potential to leverage this traffic to
their shopping business as well. These efforts will encourage more customers to use ecommerce and lead to its
higher market share in Japan ecommerce market.
Yandex N.V. YNDX Buy Russia
In our view, Yandex delivers solid execution in a very strong Russian online market. The company continues to
demonstrate an ability to sustain and grow market share in the Russian search market through its solid portfolio
of products. Finally, while Yandex has no direct ecommerce exposure to the Russian market just yet, it has begun
to build a presence through Yandex.Market, a price‐comparison service in Russia.
YOOX S.P.A YOOX.MI, YXOXY CL‐Buy Europe, China, U.S.
YOOX offers pure‐play exposure to growth in online luxury retail. We forecast a 45% EPS CAGR through 2012‐15
and cash returns approaching 30% (CROCI), with growth from new brand wins compounded by penetration‐
driven market expansion. Online luxury retail is at an early stage, representing only 3% of sales for the sector
globally. As the market leader with c.30% share in its Monobrand business, YOOX should benefit from the
significant penetration opportunity this represents. We expect growth in YOOX’s Multibrand business to be
supported by a broadening global presence (the US and China are key markets of focus), in addition to
consolidating the recently launched TheCorner.com and Shoescribe.com sites.

March 5, 2014 Global: Technology: Internet
Goldman Sachs Global Investment Research 6
Exhibit 2: Goldman Sachs key traditional retail investment ideas with significant ecommerce exposure
Source: Goldman Sachs Research estimates.
Updating the Goldman Sachs global ecommerce forecast
We present our updated Goldman Sachs global ecommerce forecast, broken down by
developed markets, BRIC nations, and other emerging economies (Exhibit 6). Our forecast
leverages Euromonitor historical ecommerce data, Euromonitor store-based retail forecasts,
iResearch data, and Goldman Sachs internal nominal GDP estimates. It’s worth noting that
Euromonitor regularly revises their historical estimates, impacting year to year growth rate
estimates. We examine historical rates of ecommerce gains as a % of store based retail
and as a % of nominal GDP by country/region in advanced Internet nations like South
Korea as a proxy for the potential in other regions. As a result:’
We believe worldwide ecommerce will grow at a 17.1% 3-year annual growth rate,
driven by North America, China, and Western Europe.
In the US specifically, we believe ecommerce will grow 16.1% in 2014 to $241
billion. We forecast a three-year 2013-2016 CAGR of 15.5%. Our 2014 growth
estimates, as well as our three-year CAGR, are all ahead of estimates from
Euromonitor, Forrester, and eMarketer (Exhibit 3).
Company Ticker GS Rating Ecommerce Exposure Goldman Sachs View
Bed Bath & Beyond, Inc. BBBY Sell U.S.
We believe BBBY is vulnerable to pressure related to ecommerce, on two fronts, contributing to our Sell rating.
First of all, it is priced substantially higher than Amazon on a basket of identical products in our latest pricing
studies, prior to considering coupons and shipping fees, suggesting the need to lower price and sustain ongoing
gross margin pressure given the price transparency of much of the category. Second, the company is investing in
both data analytics and omnichannel capabilities, having started a bit later than peers, contributing to ongoing
expense pressure. The company’s margins and returns remain high relative to peers, reflecting outstanding
store‐level execution, but also suggesting some vulnerability given its investment needs. These factors are in
addition to any share loss online, which we view as a less pressing issue.
Carter's, Inc. CRI Buy U.S.
CRI launched e‐commerce in 2010, one of the last apparel companies to do so. Since then, the company has had
amongst the fastest growing and best executed online businesses in the space. In 2013, growth was up 30%+
with an improving operating margin that's proving accretive to the overall company's profitability. Recent
distribution investments are set to further drive profitability and throughput for this growing omni‐ channel
retailer.
Genesco, Inc. GCO Sell U.S.
We believe that GCO, as a brick & mortar oriented business (over 2,500 stores), is amongst the most vulnerable
to online encroachment in our universe. The company's investment focus on new square footage in licensed
sports merchandise appears to be risky in light of intense competition from online pureplay Fanatics (which has
#1 share in the category). Finally, the companys dependence on 2H mall traffic, a season which is seeing the
greatest increases in online penetration, adds to the risk profile.
Kohl's Corp. KSS Sell U.S.
Kohl's has been a second‐mover online and faces structural margin pressures from the shift due to its lower
average price point vs. peers. As these factors continue to weigh on the top‐ and bottom‐line we would expect
weaker fundamentals to drive a re‐rating of the stock.
Nordstrom, Inc. JWN Buy U.S.
Nordstrom offers a combination of exposure to only the most attractive real estate, expansion potential in
smaller format off price retail, and a best in‐class omnichannel interface (mobile, desktop, in‐store, etc.). While
related investments depress cash flow and earnings in the near‐term, the company continues to position itself to
be on offense for the long‐term.
PVH Corp. PVH Buy U.S.
PVH sells leading apparel brands Calvin Klein and Tommy Hilfiger. The business mix today is largely wholesale,
with big box retailers as primary customers. PVH is positioned to win as consumers shift apparel spending dollars
online as the channel shift drives increased purchases direct from top of mind brands rather than through third
party retail. The benefits to PVH include: (1) higher dollar profit per garment (perhaps 2X) for wholesalers that
capture the downstream retail margin and (2) the opportunity to consolidate market share at the expense of
private label or low‐recognition brands, which have less consumer pull online.
Ralph Lauren Corporation RL Buy U.S.
RL is a leading apparel brand with largely US exposure and a skew towards men’s. Similar to PVH, RL is
positioned to win as consumers shift apparel spending dollars online as the channel shift drives increased
purchases direct from top of mind brands rather than through third party retail. The benefits to RL include: (1)
higher dollar profit per garment (perhaps 2X) for wholesalers that capture the downstream retail margin and (2)
the opportunity to consolidate market share at the expense of private label or low‐recognition brands, which
have less consumer pull online.
Urban Outfitters, Inc. URBN Buy U.S.
We see URBN well positioned to execute as apparel dollars shift online based on (1) its best‐in‐class apparel
brands (Urban Outfitters, Anthropologie, and Free People) , (2) peer‐leading ecommerce platform, with online
sales penetration at 25% versus the peer average of 10%, and (3) a superior real estate footprint insulated from
declining foot traffic at lower quality malls.
March 5, 2014 Global: Technology: Internet
Goldman Sachs Global Investment Research 7
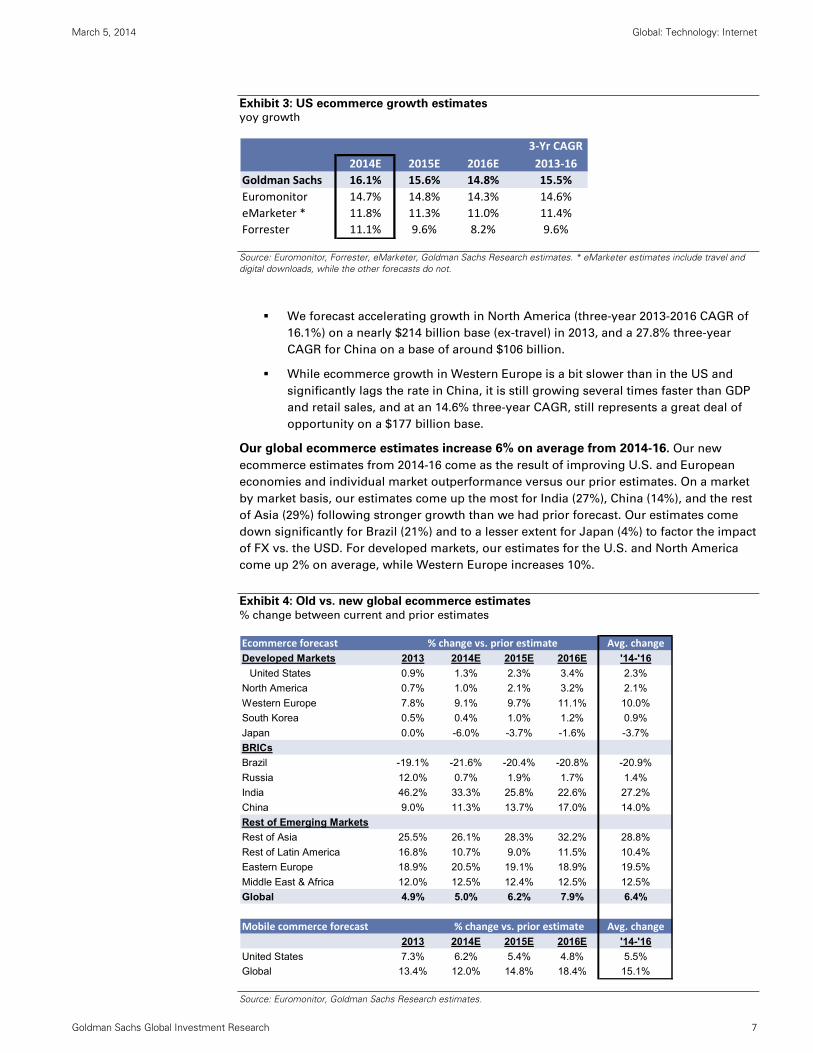
Exhibit 3: US ecommerce growth estimates yoy growth
Source: Euromonitor, Forrester, eMarketer, Goldman Sachs Research estimates. * eMarketer estimates include travel and digital downloads, while the other forecasts do not.
We forecast accelerating growth in North America (three-year 2013-2016 CAGR of
16.1%) on a nearly $214 billion base (ex-travel) in 2013, and a 27.8% three-year
CAGR for China on a base of around $106 billion.
While ecommerce growth in Western Europe is a bit slower than in the US and
significantly lags the rate in China, it is still growing several times faster than GDP
and retail sales, and at an 14.6% three-year CAGR, still represents a great deal of
opportunity on a $177 billion base.
Our global ecommerce estimates increase 6% on average from 2014-16. Our new
ecommerce estimates from 2014-16 come as the result of improving U.S. and European
economies and individual market outperformance versus our prior estimates. On a market
by market basis, our estimates come up the most for India (27%), China (14%), and the rest
of Asia (29%) following stronger growth than we had prior forecast. Our estimates come
down significantly for Brazil (21%) and to a lesser extent for Japan (4%) to factor the impact
of FX vs. the USD. For developed markets, our estimates for the U.S. and North America
come up 2% on average, while Western Europe increases 10%.
Exhibit 4: Old vs. new global ecommerce estimates
% change between current and prior estimates
Source: Euromonitor, Goldman Sachs Research estimates.
3‐Yr CAGR
2014E 2015E 2016E 2013‐16
Goldman Sachs 16.1% 15.6% 14.8% 15.5%
Euromonitor 14.7% 14.8% 14.3% 14.6%
eMarketer * 11.8% 11.3% 11.0% 11.4%
Forrester 11.1% 9.6% 8.2% 9.6%
Ecommerce forecast Avg. change
Developed Markets 2013 2014E 2015E 2016E '14-'16
United States 0.9% 1.3% 2.3% 3.4% 2.3%
North America 0.7% 1.0% 2.1% 3.2% 2.1%
Western Europe 7.8% 9.1% 9.7% 11.1% 10.0%
South Korea 0.5% 0.4% 1.0% 1.2% 0.9%
Japan 0.0% -6.0% -3.7% -1.6% -3.7%
BRICs
Brazil -19.1% -21.6% -20.4% -20.8% -20.9%
Russia 12.0% 0.7% 1.9% 1.7% 1.4%
India 46.2% 33.3% 25.8% 22.6% 27.2%
China 9.0% 11.3% 13.7% 17.0% 14.0%
Rest of Emerging Markets
Rest of Asia 25.5% 26.1% 28.3% 32.2% 28.8%
Rest of Latin America 16.8% 10.7% 9.0% 11.5% 10.4%
Eastern Europe 18.9% 20.5% 19.1% 18.9% 19.5%
Middle East & Africa 12.0% 12.5% 12.4% 12.5% 12.5%
Global 4.9% 5.0% 6.2% 7.9% 6.4%
Mobile commerce forecast Avg. change
2013 2014E 2015E 2016E '14-'16
United States 7.3% 6.2% 5.4% 4.8% 5.5%
Global 13.4% 12.0% 14.8% 18.4% 15.1%
% change vs. prior estimate
% change vs. prior estimate
March 5, 2014 Global: Technology: Internet
Goldman Sachs Global Investment Research 8
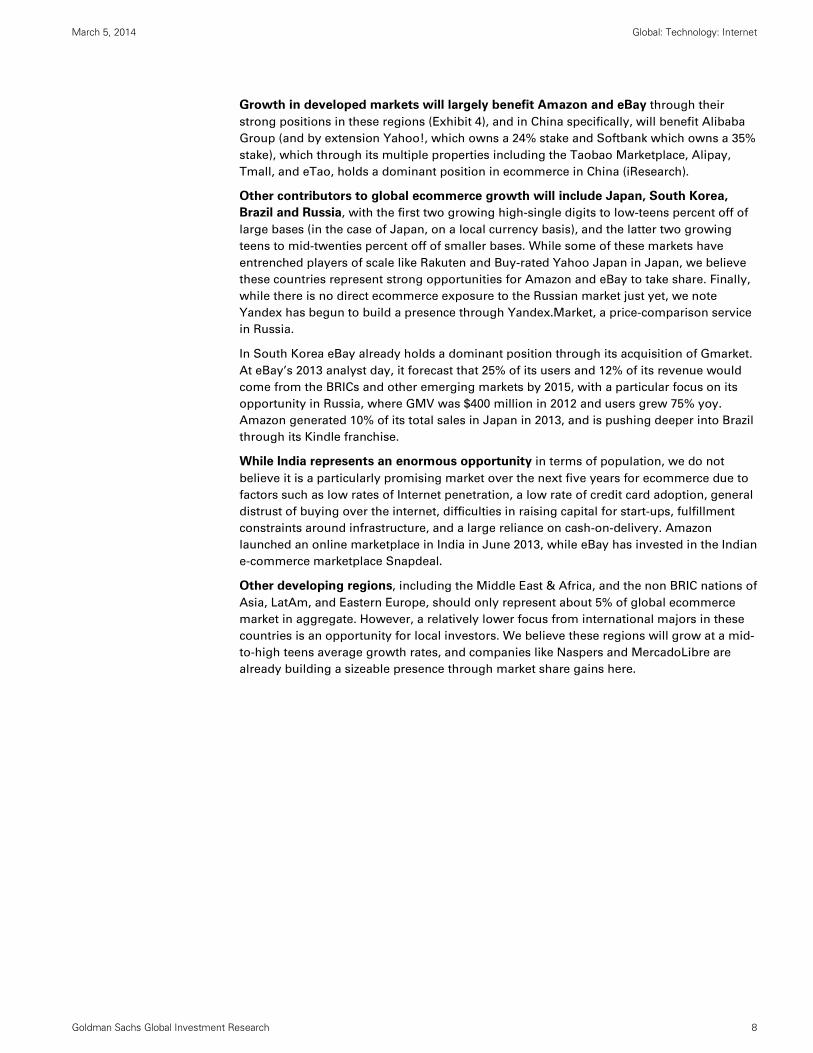
Growth in developed markets will largely benefit Amazon and eBay through their
strong positions in these regions (Exhibit 4), and in China specifically, will benefit Alibaba
Group (and by extension Yahoo!, which owns a 24% stake and Softbank which owns a 35%
stake), which through its multiple properties including the Taobao Marketplace, Alipay,
Tmall, and eTao, holds a dominant position in ecommerce in China (iResearch).
Other contributors to global ecommerce growth will include Japan, South Korea,
Brazil and Russia, with the first two growing high-single digits to low-teens percent off of
large bases (in the case of Japan, on a local currency basis), and the latter two growing
teens to mid-twenties percent off of smaller bases. While some of these markets have
entrenched players of scale like Rakuten and Buy-rated Yahoo Japan in Japan, we believe
these countries represent strong opportunities for Amazon and eBay to take share. Finally,
while there is no direct ecommerce exposure to the Russian market just yet, we note
Yandex has begun to build a presence through Yandex.Market, a price-comparison service
in Russia.
In South Korea eBay already holds a dominant position through its acquisition of Gmarket.
At eBay’s 2013 analyst day, it forecast that 25% of its users and 12% of its revenue would
come from the BRICs and other emerging markets by 2015, with a particular focus on its
opportunity in Russia, where GMV was $400 million in 2012 and users grew 75% yoy.
Amazon generated 10% of its total sales in Japan in 2013, and is pushing deeper into Brazil
through its Kindle franchise.
While India represents an enormous opportunity in terms of population, we do not
believe it is a particularly promising market over the next five years for ecommerce due to
factors such as low rates of Internet penetration, a low rate of credit card adoption, general
distrust of buying over the internet, difficulties in raising capital for start-ups, fulfillment
constraints around infrastructure, and a large reliance on cash-on-delivery. Amazon
launched an online marketplace in India in June 2013, while eBay has invested in the Indian
e-commerce marketplace Snapdeal.
Other developing regions, including the Middle East & Africa, and the non BRIC nations of
Asia, LatAm, and Eastern Europe, should only represent about 5% of global ecommerce
market in aggregate. However, a relatively lower focus from international majors in these
countries is an opportunity for local investors. We believe these regions will grow at a mid-
to-high teens average growth rates, and companies like Naspers and MercadoLibre are
already building a sizeable presence through market share gains here.

March 5, 2014 Global: Technology: Internet
Goldman Sachs Global Investment Research 9
Exhibit 5: Top web-only retailers by country Ranked by 2013 gross merchandise value
Source: Euromonitor, Goldman Sachs Research estimates. Note “(Kinnevik)” means Kinnevik owns the largest share of the given company.
Curated ecommerce gaining scale. We’re seeing an evolution in ecommerce from multi-
category ecommerce sites of scale that compete on price and delivery to vertically-focused,
brand led curated marketplaces. Companies like Zulily, Asos, Yoox, and VIPshop, as well
as private companies like Etsy, Zalando, and OneKingsLane, are enabling discovery for the
fragmented supplier base of small vendors, and driving regular engagement and improved
purchase frequency. Well-curated, entertainment-like experiences that leverage mobile are
serving as a further catalyst for ecommerce as retailers seek to differentiate themselves
from Amazon and eBay.
RetailMeNot, as an enabler of ecommerce, and increasingly foot traffic in store, through its
coupon marketplace, is a curated site benefiting from growth in ecommerce but also retail
marketer’s increased savviness in connecting with consumers. The company’s geo-fenced
mobile platform provides real-time offers redeemable online and increasingly in-store, and
data to retailers.
Region Americas Europe Europe Europe
Country U.S. France Germany Italy
1 Amazon.com Inc Amazon.com Inc Amazon.com Inc eBay Inc
2 eBay Inc eBay Inc eBay Inc Amazon.com Inc
3 Newegg.com Inc Vente‐privee.com SAS Zalando GmBH (Kinnevik) Privalia Venta Directa SL
4 Overstock.com Inc Showroomprive SARL Vente‐privee.com SAS Yoox Group
5 Kynetic LLC Zalando GmBH (Kinnevik) Rakuten Inc Vente‐privee.com SAS
Region Europe Europe LatAm APAC
Country U.K. Russia Brazil Australia
1 Amazon.com Inc Avito.ru (Kinnevik) Mercado Libre eBay Inc
2 eBay Inc Yandex B2W Amazon.com Inc
3 Ocado Group Plc Ulmart Novapontocom Auction Alliance Pty Ltd
4 Rakuten Inc (Play.com) Citilink Netshoes Comércio Ltda Catch of The Day Pty Ltd
5 Asos Plc eBay Inc Dafiti (Kinnevik) EziBuy Ltd
Region APAC APAC APAC APAC
Country China India Japan South Korea
1 Alibaba Group Flipkart Online Services Pvt Ltd Rakuten Inc eBay Inc (Gmarket)
2 JD.com Myntra.com Amazon.com Inc InterPark Corp
3 Tencent QQRocket Internet GmbH
(Jabong.com, Kinnevik)Yahoo! Japan Inc Amazon.com Inc
4 Suning Amazon.com Inc
5 Amazon.com Inc eBay Inc

March 5, 2014 Global: Technology: Internet
Goldman Sachs Global Investment Research 10
Exhibit 6: Goldman Sachs ecommerce ex-travel global sales forecast $ in millions
Source: Euromonitor, Goldman Sachs Research estimates.
3‐Yr. 5‐Yr.
Ecommerce Retail Value excl Sales Tax, US$ mn 2009 2010 2011 2012 2013 2014E 2015E 2016E 2017E 2018E 2013‐2016 2013‐2018
Developed Markets
United States $115,746 $133,557 $154,428 $179,137 $207,619 $241,076 $278,718 $319,917 $363,653 $409,610 15.5% 14.6%
% of North America 97.1% 97.0% 97.0% 97.1% 97.2% 97.2% 97.2% 97.2% 97.2% 97.2%
North America $119,220 $137,659 $159,169 $184,535 $213,695 $248,021 $286,747 $329,133 $374,129 $421,410 15.5% 14.5%
Western Europe $100,347 $115,382 $141,243 $153,854 $177,099 $204,431 $233,943 $266,756 $303,102 $342,021 14.6% 14.1%
South Korea $14,149 $18,754 $22,236 $24,381 $26,954 $30,248 $33,767 $37,106 $40,427 $43,691 11.2% 10.1%
Japan $31,949 $38,132 $46,550 $51,449 $46,755 $48,857 $54,989 $61,566 $68,638 $75,951 9.6% 10.2%
BRICs
Brazil $5,890 $8,248 $10,223 $10,102 $10,793 $12,450 $14,815 $17,182 $19,776 $22,613 16.8% 15.9%
Russia $4,947 $6,640 $9,125 $11,737 $14,839 $16,818 $21,209 $26,238 $32,092 $38,736 20.9% 21.2%
India $1,581 $2,004 $2,533 $2,657 $2,979 $3,382 $3,878 $4,509 $5,214 $5,987 14.8% 15.0%
China $6,607 $16,267 $40,007 $74,058 $106,154 $143,432 $180,542 $221,520 $265,846 $314,839 27.8% 24.3%
Rest of Emerging Markets
Rest of Asia $4,403 $5,971 $8,270 $9,630 $10,991 $12,561 $14,394 $16,555 $19,011 $21,752 14.6% 14.6%
Rest of Latin America $3,636 $5,496 $7,364 $9,435 $12,144 $13,339 $15,083 $17,590 $20,682 $24,445 13.1% 15.0%
Eastern Europe $6,398 $7,716 $9,485 $10,370 $12,368 $14,717 $17,299 $20,166 $23,236 $26,309 17.7% 16.3%
Middle East & Africa $1,617 $1,993 $2,336 $2,749 $3,387 $4,076 $4,842 $5,691 $6,659 $7,749 18.9% 18.0%
Total $300,743 $364,262 $458,541 $544,957 $638,157 $752,332 $881,508 $1,024,013 $1,178,812 $1,345,504 17.1% 16.1%
YoY Growth 2009 2010 2011 2012 2013 2014E 2015E 2016E 2017E 2018E
Developed Markets
United States 4.9% 15.4% 15.6% 16.0% 15.9% 16.1% 15.6% 14.8% 13.7% 12.6%
North America 4.7% 15.5% 15.6% 15.9% 15.8% 16.1% 15.6% 14.8% 13.7% 12.6%
Western Europe 6.3% 15.0% 22.4% 8.9% 15.1% 15.4% 14.4% 14.0% 13.6% 12.8%
South Korea ‐4.4% 32.5% 18.6% 9.7% 10.5% 12.2% 11.6% 9.9% 9.0% 8.1%
Japan 23.2% 19.4% 22.1% 10.5% ‐9.1% 4.5% 12.6% 12.0% 11.5% 10.7% * Related to deflation vs. USD
BRICs
Brazil 5.0% 40.0% 23.9% ‐1.2% 6.8% 15.4% 19.0% 16.0% 15.1% 14.3% * Related to deflation vs. USD
Russia ‐5.9% 34.2% 37.4% 28.6% 26.4% 13.3% 26.1% 23.7% 22.3% 20.7% * Related to deflation vs. USD
India 7.8% 26.7% 26.4% 4.9% 12.1% 13.6% 14.7% 16.3% 15.6% 14.8% * Related to deflation vs. USD
China 29.5% 146.2% 145.9% 85.1% 43.3% 35.1% 25.9% 22.7% 20.0% 18.4%
Rest of Emerging Markets
Rest of Asia 14.4% 35.6% 38.5% 16.5% 14.1% 14.3% 14.6% 15.0% 14.8% 14.4%
Rest of Latin America 20.6% 51.1% 34.0% 28.1% 28.7% 9.8% 13.1% 16.6% 17.6% 18.2% * Related to deflation vs. USD
Eastern Europe ‐5.3% 20.6% 22.9% 9.3% 19.3% 19.0% 17.5% 16.6% 15.2% 13.2%
Middle East & Africa 4.0% 23.2% 17.2% 17.7% 23.2% 20.3% 18.8% 17.5% 17.0% 16.4%
Total 6.8% 21.1% 25.9% 18.8% 17.1% 17.9% 17.2% 16.2% 15.1% 14.1%
Ecommerce as a % of Store‐based Retail 2009 2010 2011 2012 2013 2014E 2015E 2016E 2017E 2018E
Developed Markets
United States 5.1% 5.8% 6.5% 7.3% 8.3% 9.4% 10.5% 11.7% 12.9% 14.1%
North America 4.7% 5.2% 5.9% 6.7% 7.6% 8.6% 9.6% 10.6% 11.7% 12.8%
Western Europe 3.3% 3.8% 4.5% 5.2% 5.8% 6.6% 7.5% 8.4% 9.3% 10.3%
South Korea 11.7% 13.2% 14.0% 15.0% 16.1% 17.4% 18.9% 20.2% 21.4% 22.5%
Japan 3.1% 3.5% 3.9% 4.3% 4.7% 4.9% 5.5% 6.1% 6.7% 7.4%
BRICs
Brazil 2.5% 2.7% 2.9% 3.1% 3.3% 3.7% 4.2% 4.5% 4.9% 5.4%
Russia 1.5% 1.7% 2.1% 2.5% 2.9% 3.1% 3.5% 3.9% 4.4% 4.8%
India 0.5% 0.5% 0.6% 0.6% 0.7% 0.7% 0.8% 0.8% 0.9% 1.0%
China 0.6% 1.3% 2.8% 4.6% 6.0% 7.2% 8.3% 9.3% 10.2% 11.0%
Rest of Emerging Markets
Rest of Asia 0.7% 0.8% 1.0% 1.1% 1.2% 1.3% 1.4% 1.6% 1.7% 1.8%
Rest of Latin America 0.7% 0.9% 1.2% 1.4% 1.7% 1.8% 1.9% 2.2% 2.4% 2.8%
Eastern Europe 1.9% 2.4% 2.7% 3.1% 3.5% 3.9% 4.4% 4.9% 5.4% 5.9%
Middle East & Africa 0.3% 0.3% 0.3% 0.3% 0.4% 0.4% 0.4% 0.5% 0.5% 0.6%
Total 2.8% 3.2% 3.7% 4.3% 4.9% 5.5% 6.2% 6.9% 7.5% 8.2%
Ecommerce as a % of Nominal GDP 2009 2010 2011 2012 2013 2014E 2015E 2016E 2017E 2018E
Developed Markets
United States 0.80% 0.89% 0.99% 1.10% 1.24% 1.37% 1.52% 1.67% 1.81% 1.96%
North America 0.76% 0.83% 0.92% 1.02% 1.14% 1.29% 1.43% 1.57% 1.71% 1.85%
Western Europe 0.62% 0.70% 0.81% 0.92% 0.99% 1.09% 1.25% 1.48% 1.69% 1.91%
South Korea 1.70% 1.85% 1.99% 2.16% 2.23% 2.34% 2.53% 2.74% 2.86% 3.00%
Japan 0.64% 0.71% 0.80% 0.86% 1.01% 1.05% 1.23% 1.45% 1.59% 1.72%
BRICs
Brazil 0.36% 0.38% 0.42% 0.46% 0.49% 0.58% 0.68% 0.79% 0.89% 1.00%
Russia 0.40% 0.42% 0.51% 0.60% 0.71% 0.78% 0.90% 1.10% 1.39% 1.71%
India 0.13% 0.12% 0.14% 0.15% 0.16% 0.18% 0.18% 0.20% 0.21% 0.22%
China 0.12% 0.25% 0.50% 0.83% 1.08% 1.31% 1.48% 1.67% 1.83% 1.99%
Rest of Emerging Markets
Rest of Asia 0.33% 0.35% 0.42% 0.46% 0.51% 0.57% 0.57% 0.60% 0.63% 0.67%
Rest of Latin America 0.18% 0.24% 0.27% 0.33% 0.41% 0.47% 0.52% 0.59% 0.67% 0.76%
Eastern Europe 0.84% 0.96% 1.09% 1.28% 1.38% 1.59% 1.82% 2.10% 2.38% 2.66%
Middle East & Africa 0.04% 0.05% 0.05% 0.06% 0.07% 0.08% 0.10% 0.11% 0.12% 0.12%
Total 0.54% 0.60% 0.69% 0.81% 0.92% 1.04% 1.18% 1.33% 1.47% 1.61%
CAGR

March 5, 2014 Global: Technology: Internet
Goldman Sachs Global Investment Research 11
Country/Region specific forecasts and highlights
China: E-tailing competition to deepen in 2014; the top “1+3” oligopoly
We believe China’s overall online retailing competitive landscape is stable, and we view the
top 1 (Ali-group) + the next 3 (JD, Tencent and Suning) players as comprising an oligopoly.
Competition is becoming more comprehensive, with main platforms actively extending to
offline and derived businesses. Many major e-tailing platforms view O2O (online to offline
or vice versa) as a key strategy in 2014, and consider mobile internet and online payments
also as important battle fields. JD.com, China’s 2nd largest online platform has just filed to
raise $1.5 billion in its IPO in the US with 9M13 result showing modest positive profit. The
largest player Alibaba Group is also expected to file for listing this year. These events will
provide more transparent and handy opportunities for investors to participate in China’s
booming e-tailing market. In the near term, we believe the key indicators to watch include
each platforms’ logistics ability, progress of O2O strategy, ability to leverage mobile
internet and their contribution to traffic and sales growth.
Exhibit 7: Chinese ecommerce market share data Market share
Source: iResearch
Note: Coo8 and Gome online merged and were unified under the Gome online brand in 4Q13.
B2C market share 2011 2012 2012Q1 2012Q2 2012Q3 2013Q1 2013Q2 2013Q3Tmall 51.0% 56.7% 51.5% 57.1% 54.6% 51.3% 50.8% 51.1%JD.com 17.1% 19.6% 22.7% 20.1% 21.8% 17.5% 17.1% 17.5%Tecent ecommerce 2.9% 4.7% 3.2% 4.0% 4.5% 6.8% 5.6% 6.0%Suning.com 3.3% 5.5% 3.1% 3.8% 4.2% 4.5% 5.0% 4.4%Amazon 3.3% 2.7% 3.5% 2.7% 2.9% 1.9% 2.2% 2.6%Vipshop - 1.4% - 0.9% 0.9% 1.9% 2.0% 2.0%Dangdang 2.0% 1.9% 1.8% 1.3% 1.3% 2.6% 1.8% 2.0%Gome (incl Coo8) 1.2% 1.4% 1.2% 1.9% 2.1% 2.1% 1.9% 1.8%Yihaodian - 1.2% - - 1.2% 1.7% 1.4% 1.7%Vancl 1.9% 1.2% 1.3% 2.0% 1.8% 0.9% 0.7% 0.7%Others 13.6% 3.7% 9.4% 5.5% 4.0% 8.9% 11.6% 10.3%
Self-operated B2CMarket share 2011 2012 2012Q1 2012Q2 2012Q3 2013Q1 2013Q2 2013Q3JD.com 37.2% 49.0% 50.1% 50.2% 51.1% 43.4% 43.9% 45.0%Suning.com 7.1% 13.6% 6.8% 9.4% 9.9% 11.2% 12.9% 11.3%Amazon 7.2% 6.8% 7.8% 6.7% 6.7% 4.7% 5.5% 6.6%Yixun.com (Tecent) 2.9% 3.7% 3.4% 3.1% 3.9% 5.4% 5.4% 5.9%Dangdang 4.3% 4.8% 3.9% 3.3% 3.0% 6.5% 4.6% 5.0%Vipshop 3.5% 2.2% 2.2% 4.7% 5.1% 5.2%Yihaodian 3.3% 2.9% 2.8% 4.2% 3.6% 4.2%Coo8 (Gome) 2.5% 3.6% 2.7% 4.7% 5.0% 3.8% 3.9% 4.0%New egg 1.8% 1.7% 1.7% 1.9%Vancl 4.2% 2.9% 2.8% 5.0% 4.2% 2.3% 1.9% 1.8%Others 29.5% 9.2% 20.8% 13.7% 9.3% 13.7% 13.2% 11.1%
Share 2011 2012 2012Q1 2012Q2 2012Q3 2013Q1 2013Q2 2013Q3B2C 23.5% 29.7% 27.2% 33.3% 35.6% 34.1% 36.1% 36.6%C2C 76.5% 70.3% 72.8% 66.7% 64.4% 65.9% 63.9% 63.4%Total GMV 7846.5 13040.0 2578.4 3009.2 3193.4 3520.8 4371.3 4547.6
March 5, 2014 Global: Technology: Internet
Goldman Sachs Global Investment Research 12
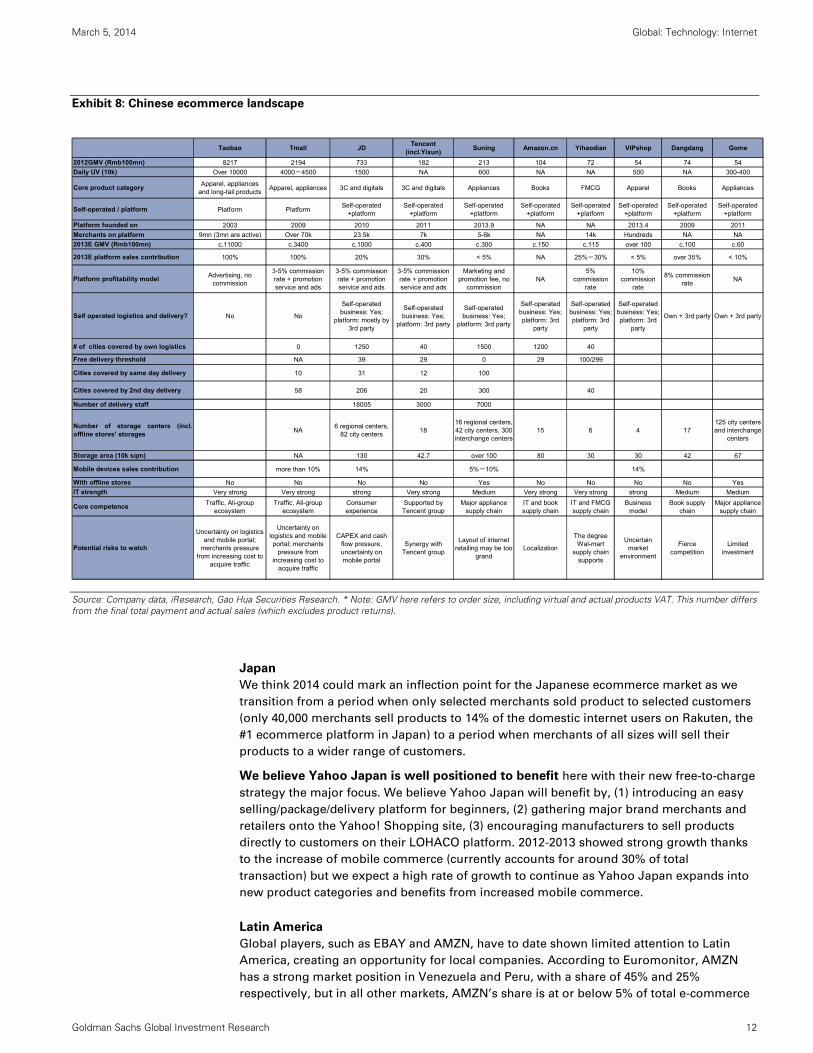
Exhibit 8: Chinese ecommerce landscape
Source: Company data, iResearch, Gao Hua Securities Research. * Note: GMV here refers to order size, including virtual and actual products VAT. This number differs from the final total payment and actual sales (which excludes product returns).
Japan
We think 2014 could mark an inflection point for the Japanese ecommerce market as we
transition from a period when only selected merchants sold product to selected customers
(only 40,000 merchants sell products to 14% of the domestic internet users on Rakuten, the
#1 ecommerce platform in Japan) to a period when merchants of all sizes will sell their
products to a wider range of customers.
We believe Yahoo Japan is well positioned to benefit here with their new free-to-charge
strategy the major focus. We believe Yahoo Japan will benefit by, (1) introducing an easy
selling/package/delivery platform for beginners, (2) gathering major brand merchants and
retailers onto the Yahoo! Shopping site, (3) encouraging manufacturers to sell products
directly to customers on their LOHACO platform. 2012-2013 showed strong growth thanks
to the increase of mobile commerce (currently accounts for around 30% of total
transaction) but we expect a high rate of growth to continue as Yahoo Japan expands into
new product categories and benefits from increased mobile commerce.
Latin America
Global players, such as EBAY and AMZN, have to date shown limited attention to Latin
America, creating an opportunity for local companies. According to Euromonitor, AMZN
has a strong market position in Venezuela and Peru, with a share of 45% and 25%
respectively, but in all other markets, AMZN’s share is at or below 5% of total e-commerce
Taobao Tmall JDTencent
(incl.Yixun)Suning Amazon.cn Yihaodian VIPshop Dangdang Gome
2012GMV (Rmb100mn) 8217 2194 733 182 213 104 72 54 74 54
Daily UV (10k) Over 10000 4000-4500 1500 NA 600 NA NA 500 NA 300-400
Core product categoryApparel, appliances
and long-tail productsApparel, appliances 3C and digitals 3C and digitals Appliances Books FMCG Apparel Books Appliances
Self-operated / platform Platform PlatformSelf-operated
+platformSelf-operated
+platformSelf-operated
+platformSelf-operated
+platformSelf-operated
+platformSelf-operated
+platformSelf-operated
+platformSelf-operated
+platform
Platform founded on 2003 2009 2010 2011 2013.9 NA NA 2013.4 2009 2011
Merchants on platform 9mn (3mn are active) Over 70k 23.5k 7k 5-6k NA 14k Hundreds NA NA
2013E GMV (Rmb100mn) c.11000 c.3400 c.1000 c.400 c.300 c.150 c.115 over 100 c.100 c.60
2013E platform sales contribution 100% 100% 20% 30% < 5% NA 25%-30% < 5% over 35% < 10%
Platform profitability modelAdvertising, no
commission
3-5% commission rate + promotion service and ads
3-5% commission rate + promotion service and ads
3-5% commission rate + promotion service and ads
Marketing and promotion fee, no
commissionNA
5% commission
rate
10% commission
rate
8% commission rate
NA
Self operated logistics and delivery? No No
Self-operated business: Yes;
platform: mostly by 3rd party
Self-operated business: Yes;
platform: 3rd party
Self-operated business: Yes;
platform: 3rd party
Self-operated business: Yes; platform: 3rd
party
Self-operated business: Yes; platform: 3rd
party
Self-operated business: Yes; platform: 3rd
party
Own + 3rd party Own + 3rd party
# of cities covered by own logistics 0 1250 40 1500 1200 40
Free delivery threshold NA 39 29 0 29 100/299
Cities covered by same day delivery 10 31 12 100
Cities covered by 2nd day delivery 58 206 20 300 40
Number of delivery staff 18005 3000 7000
Number of storage centers (incl.offline stores' storages
NA6 regional centers,
82 city centers18
16 regional centers, 42 city centers, 300 interchange centers
15 6 4 17125 city centers and interchange
centers
Storage area (10k sqm) NA 130 42.7 over 100 80 30 30 42 67
Mobile devices sales contribution more than 10% 14% 5%-10% 14%
With offline stores No No No No Yes No No No No Yes
IT strength Very strong Very strong strong Very strong Medium Very strong Very strong strong Medium Medium
Core competenceTraffic, Ali-group
ecosystemTraffic, Ali-group
ecosystemConsumer experience
Supported by Tencent group
Major appliance supply chain
IT and book supply chain
IT and FMCG supply chain
Business model
Book supply chain
Major appliance supply chain
Potential risks to watch
Uncertainty on logistics and mobile portal;
merchants pressure from increasing cost to
acquire traffic
Uncertainty on logistics and mobile portal; merchants
pressure from increasing cost to
acquire traffic
CAPEX and cash flow pressure, uncertainty on mobile portal
Synergy with Tencent group
Layout of internet retailing may be too
grandLocalization
The degree Wal-mart
supply chain supports
Uncertain market
environment
Fierce competition
Limited investment
March 5, 2014 Global: Technology: Internet
Goldman Sachs Global Investment Research 13
value. In Brazil, AMZN has a partnership with the third-largest e-commerce company, Nova
Pontocom (controlled by PCAR4.SA, Neutral), to distribute its Kindle, while its own site
only offers digital content, for now.
MELI is the largest e-commerce company in Latin America, based on gross
merchandise volume of US$7.0 bn per year. It has a strong presence in the region with
market share in the 20s in Brazil (23%), Argentina (24.4%) and Venezuela (20.7%), and a
12.9% share in Mexico. The large countries in which it has a relatively small presence are
Colombia and Chile.
B2W (BTOW3.SA, Neutral) is the leader in online retailing in Brazil, and with an
ecommerce market share of 21% it is close on the heels of marketplace MELI. Both B2W
and Nova Pontocom have recently launched marketplace operations, in an attempt to
accelerate scaling of their physical distribution platform. B2W’s recently announced
R$2.4bn (c.US$1bn) capital increase should strengthen the company’s balance sheet and
allow it to accelerate growth, while maintaining its ambitious plans to invest in regional
distribution centers.
E-commerce has been growing in the teens across the region in the last three years and we
expect this trend to continue. We forecast e-commerce revenue to grow at a 2013-16 CAGR
of 14.9% in Latin America on a USD basis, slightly below the 2010-13 CAGR of 18.6%,
which we believe mainly reflects the higher base. Across the region, store-based retailers
have heavily invested in omni-channel strategies: Chilean retailing conglomerate Falabella
is the market leader in Chile (c.20% share), Wal-Mart de Mexico is investing in Mexico and
Exito recently launched cdiscount.com.co in a joint venture with its controlling shareholder
Casino (CASP.PA, Neutral).
Russia
The Russian ecommerce market grew 26.4% in 2013. While the currency weakness worked
against the market (Ruble depreciated 3% in 2013) it was more than offset by a consumer
shift to online purchases on the back of efforts from both international and Russian
ecommerce properties.
Key Russian internet properties continued their steady development in 2013. Following the
merger with Naspers properties in early 2013, Avito kept cementing its leadership in
classified ecommerce. Yandex.Market launched the first phase of its’ platform reshuffle
and introduced a CPA monetization mechanism and will likely continue with further rollout
(expansion of number of merchants, integration of payment and logistics solutions)
throughout 2014. B2C category leaders (e.g. Ulmart and Svyaznoy in consumer electronics,
Lamoda, Wildberries and KupiVIP in Fashion and Apparel) continued their rapid business
expansion. Ozon, one of the leading properties in general B2C, is finalizing its’ financing
round which should help the property maintain business growth in 2014. We note Kinnevik
is the largest owner of both Avito and Lamodo.
2013 saw impressive growth of global ecommerce properties building presence in Russia.
eBay had US$400mn GMV in 2012 in Russian cross-border delivery, and we estimate this
number could be twice as high in 2013. PayPal was launched in 2013 locally, and eBay may
open a platform for domestic merchants leveraging its’ logistics capabilities benefiting
from fragmentation of the ecommerce landscape. In 2013, AliExpress made visible
progress in Russia as well: by some estimates, it has outpaced several leading Russian
domestic ecommerce properties by traffic and GMV.
In the beginning of 2014, the Russian Customs Service started tightening Custom clearance
rules (limitation of maximum value of parcel at €150, additional document requirements).
Although some of initially imposed restrictions were softened, the steps highlight a
growing concern of the Government with the size of cross-border tax-free import. On the
other hand, Russian Post had a management change in 1H13 and the new team is highly

March 5, 2014 Global: Technology: Internet
Goldman Sachs Global Investment Research 14
focused at resolving logistics bottlenecks (capacity upgrade, faster parcels processing)
which should help overall ecommerce development in the medium term.
Western Europe
Western Europe continues to demonstrate solid development of e-commerce in most
major retailing sectors. However, the penetration of the e-commerce channel varies
significantly across the continent with larger Northern European countries like the UK and
Germany significantly higher than the major southern European countries of Italy and
Spain.
In Grocery, the UK has seen the highest level of penetration at over 6% compared to the
rest of Europe average of below 1%. Whilst grocery has one of the lowest penetrations
overall, the UK has developed more quickly as 3 of the 4 major grocery players have
developed online delivery offerings and Ocado has developed a strong online-delivery
proposition.
In Apparel, we believe that online clothing in Europe will reach about 25% of the total
clothing market by 2030. By this time we expect the UK and Germany to have highest
penetration at 35% and Southern Europe to be 15%. Currently we estimate European online
clothing penetration to be about 7%. We believe ASOS and Kinnevik are best placed to
benefit from this trend in Europe.
Comscore shows continued acceleration in ecommerce share gains
U.S. ecommerce sales (ex-travel) grew 13% in 2013 according to comscore (which does not
include mobile commerce), representing some deceleration versus 15% growth in 2012.
2013 represents the first year where ecommerce growth has not accelerated since the
recession (Exhibit 9). We believe this was likely driven by a confluence of factors including
a condensed U.S. holiday season, a U.S. payroll tax, and 16-day government shutdown.
Exhibit 9: US ecommerce sales ex-travel and yoy growth (excludes mobile commerce)
$ in millions
Source: ComScore eCommerce Brief.
‐5%
0%
5%
10%
15%
20%
25%
30%
$0
$50,000
$100,000
$150,000
$200,000
$250,000
2003 2004 2005 2006 2007 2008 2009 2010 2011 2012 2013
Total ecommerce ex‐travel yoy growth
March 5, 2014 Global: Technology: Internet
Goldman Sachs Global Investment Research 15
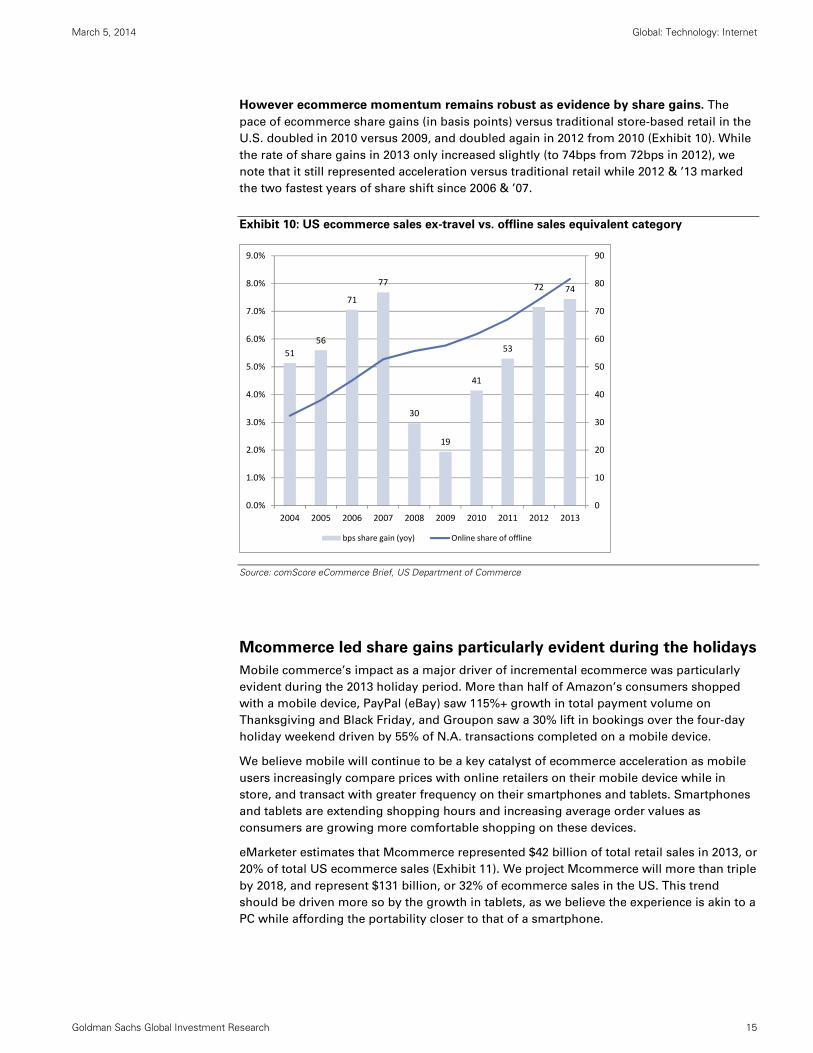
However ecommerce momentum remains robust as evidence by share gains. The
pace of ecommerce share gains (in basis points) versus traditional store-based retail in the
U.S. doubled in 2010 versus 2009, and doubled again in 2012 from 2010 (Exhibit 10). While
the rate of share gains in 2013 only increased slightly (to 74bps from 72bps in 2012), we
note that it still represented acceleration versus traditional retail while 2012 & ’13 marked
the two fastest years of share shift since 2006 & ’07.
Exhibit 10: US ecommerce sales ex-travel vs. offline sales equivalent category
Source: comScore eCommerce Brief, US Department of Commerce
Mcommerce led share gains particularly evident during the holidays
Mobile commerce’s impact as a major driver of incremental ecommerce was particularly
evident during the 2013 holiday period. More than half of Amazon’s consumers shopped
with a mobile device, PayPal (eBay) saw 115%+ growth in total payment volume on
Thanksgiving and Black Friday, and Groupon saw a 30% lift in bookings over the four-day
holiday weekend driven by 55% of N.A. transactions completed on a mobile device.
We believe mobile will continue to be a key catalyst of ecommerce acceleration as mobile
users increasingly compare prices with online retailers on their mobile device while in
store, and transact with greater frequency on their smartphones and tablets. Smartphones
and tablets are extending shopping hours and increasing average order values as
consumers are growing more comfortable shopping on these devices.
eMarketer estimates that Mcommerce represented $42 billion of total retail sales in 2013, or
20% of total US ecommerce sales (Exhibit 11). We project Mcommerce will more than triple
by 2018, and represent $131 billion, or 32% of ecommerce sales in the US. This trend
should be driven more so by the growth in tablets, as we believe the experience is akin to a
PC while affording the portability closer to that of a smartphone.
51
56
71
77
30
19
41
53
72 74
0
10
20
30
40
50
60
70
80
90
0.0%
1.0%
2.0%
3.0%
4.0%
5.0%
6.0%
7.0%
8.0%
9.0%
2004 2005 2006 2007 2008 2009 2010 2011 2012 2013
bps share gain (yoy) Online share of offline
March 5, 2014 Global: Technology: Internet
Goldman Sachs Global Investment Research 16
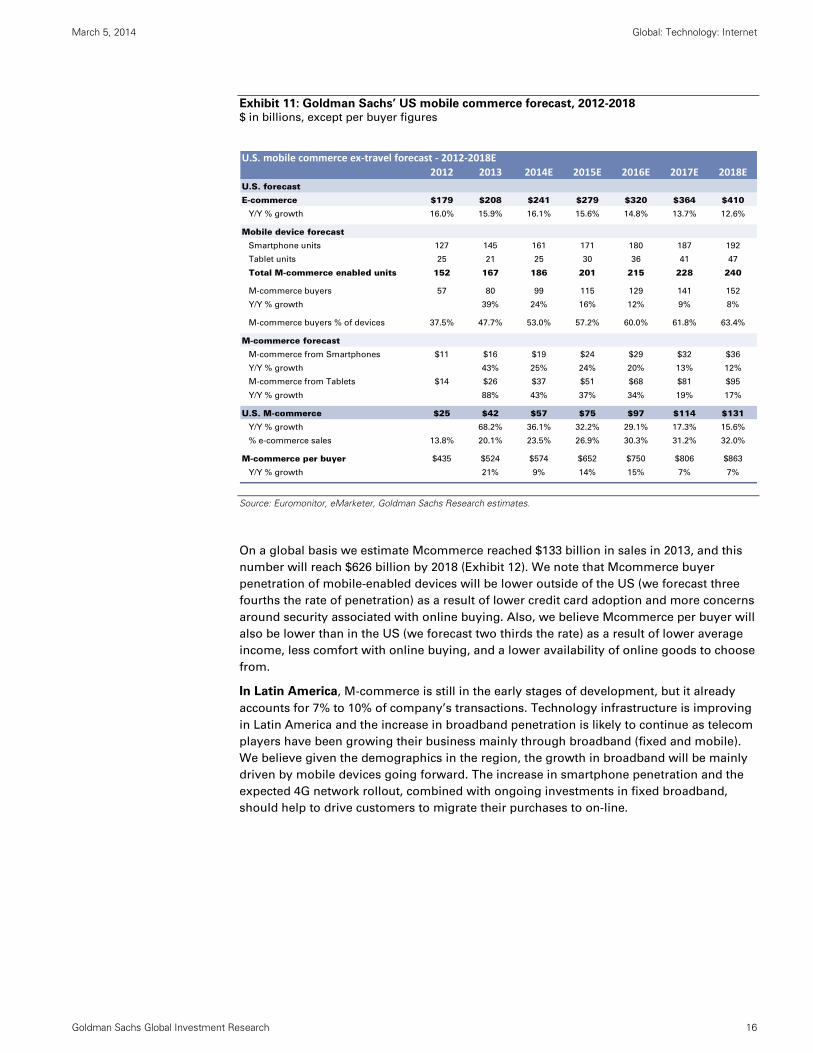
Exhibit 11: Goldman Sachs’ US mobile commerce forecast, 2012-2018 $ in billions, except per buyer figures
Source: Euromonitor, eMarketer, Goldman Sachs Research estimates.
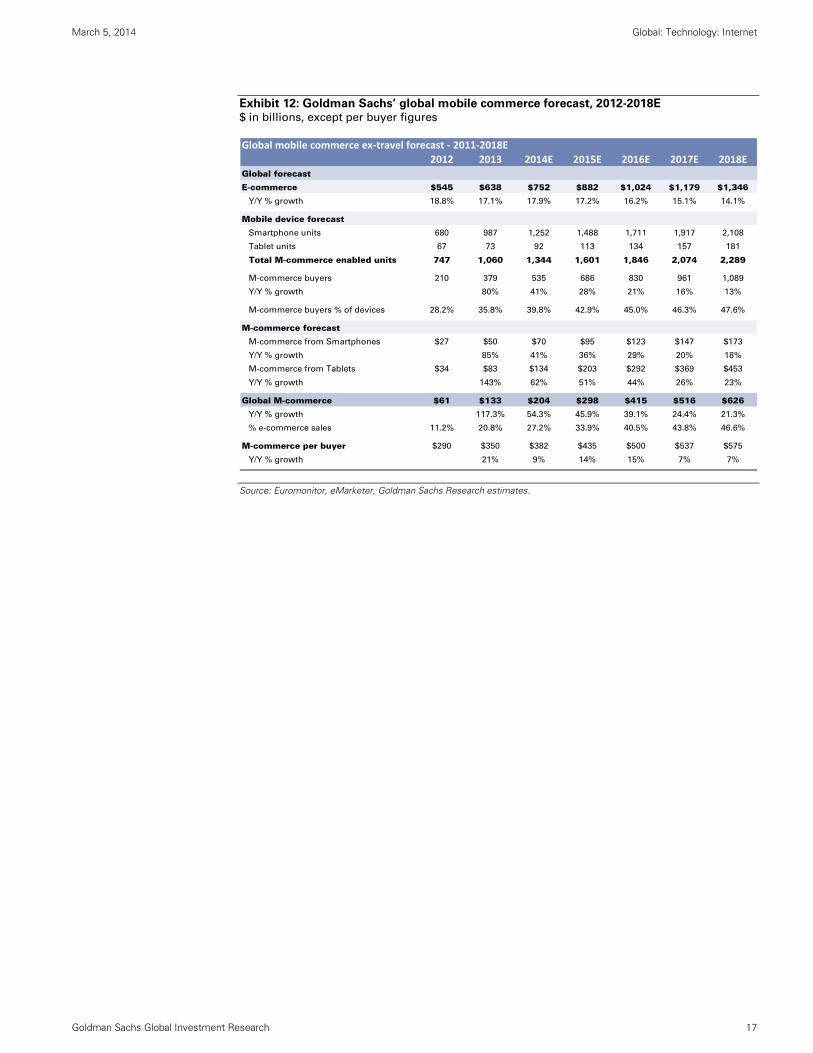
On a global basis we estimate Mcommerce reached $133 billion in sales in 2013, and this
number will reach $626 billion by 2018 (Exhibit 12). We note that Mcommerce buyer
penetration of mobile-enabled devices will be lower outside of the US (we forecast three
fourths the rate of penetration) as a result of lower credit card adoption and more concerns
around security associated with online buying. Also, we believe Mcommerce per buyer will
also be lower than in the US (we forecast two thirds the rate) as a result of lower average
income, less comfort with online buying, and a lower availability of online goods to choose
from.
In Latin America, M-commerce is still in the early stages of development, but it already
accounts for 7% to 10% of company’s transactions. Technology infrastructure is improving
in Latin America and the increase in broadband penetration is likely to continue as telecom
players have been growing their business mainly through broadband (fixed and mobile).
We believe given the demographics in the region, the growth in broadband will be mainly
driven by mobile devices going forward. The increase in smartphone penetration and the
expected 4G network rollout, combined with ongoing investments in fixed broadband,
should help to drive customers to migrate their purchases to on-line.
U.S. mobile commerce ex‐travel forecast ‐ 2012‐2018E
2012 2013 2014E 2015E 2016E 2017E 2018EU.S. forecast
E-commerce $179 $208 $241 $279 $320 $364 $410
Y/Y % growth 16.0% 15.9% 16.1% 15.6% 14.8% 13.7% 12.6%
Mobile device forecast
Smartphone units 127 145 161 171 180 187 192
Tablet units 25 21 25 30 36 41 47
Total M-commerce enabled units 152 167 186 201 215 228 240
M-commerce buyers 57 80 99 115 129 141 152
Y/Y % growth 39% 24% 16% 12% 9% 8%
M-commerce buyers % of devices 37.5% 47.7% 53.0% 57.2% 60.0% 61.8% 63.4%
M-commerce forecast
M-commerce from Smartphones $11 $16 $19 $24 $29 $32 $36
Y/Y % growth 43% 25% 24% 20% 13% 12%
M-commerce from Tablets $14 $26 $37 $51 $68 $81 $95
Y/Y % growth 88% 43% 37% 34% 19% 17%
U.S. M-commerce $25 $42 $57 $75 $97 $114 $131
Y/Y % growth 68.2% 36.1% 32.2% 29.1% 17.3% 15.6%
% e-commerce sales 13.8% 20.1% 23.5% 26.9% 30.3% 31.2% 32.0%
M-commerce per buyer $435 $524 $574 $652 $750 $806 $863
Y/Y % growth 21% 9% 14% 15% 7% 7%
March 5, 2014 Global: Technology: Internet
Goldman Sachs Global Investment Research 17
Exhibit 12: Goldman Sachs’ global mobile commerce forecast, 2012-2018E $ in billions, except per buyer figures
Source: Euromonitor, eMarketer, Goldman Sachs Research estimates.
Global mobile commerce ex‐travel forecast ‐ 2011‐2018E
2012 2013 2014E 2015E 2016E 2017E 2018EGlobal forecast
E-commerce $545 $638 $752 $882 $1,024 $1,179 $1,346
Y/Y % growth 18.8% 17.1% 17.9% 17.2% 16.2% 15.1% 14.1%
Mobile device forecast
Smartphone units 680 987 1,252 1,488 1,711 1,917 2,108
Tablet units 67 73 92 113 134 157 181
Total M-commerce enabled units 747 1,060 1,344 1,601 1,846 2,074 2,289
M-commerce buyers 210 379 535 686 830 961 1,089
Y/Y % growth 80% 41% 28% 21% 16% 13%
M-commerce buyers % of devices 28.2% 35.8% 39.8% 42.9% 45.0% 46.3% 47.6%
M-commerce forecast
M-commerce from Smartphones $27 $50 $70 $95 $123 $147 $173
Y/Y % growth 85% 41% 36% 29% 20% 18%
M-commerce from Tablets $34 $83 $134 $203 $292 $369 $453
Y/Y % growth 143% 62% 51% 44% 26% 23%
Global M-commerce $61 $133 $204 $298 $415 $516 $626
Y/Y % growth 117.3% 54.3% 45.9% 39.1% 24.4% 21.3%
% e-commerce sales 11.2% 20.8% 27.2% 33.9% 40.5% 43.8% 46.6%
M-commerce per buyer $290 $350 $382 $435 $500 $537 $575
Y/Y % growth 21% 9% 14% 15% 7% 7%

March 5, 2014 Global: Technology: Internet
Goldman Sachs Global Investment Research 18
Disclosure Appendix
Reg AC
I, Heath P. Terry, CFA, hereby certify that all of the views expressed in this report accurately reflect my personal views about the subject company or
companies and its or their securities. I also certify that no part of my compensation was, is or will be, directly or indirectly, related to the specific
recommendations or views expressed in this report.
Investment Profile
The Goldman Sachs Investment Profile provides investment context for a security by comparing key attributes of that security to its peer group and
market. The four key attributes depicted are: growth, returns, multiple and volatility. Growth, returns and multiple are indexed based on composites
of several methodologies to determine the stocks percentile ranking within the region's coverage universe.
The precise calculation of each metric may vary depending on the fiscal year, industry and region but the standard approach is as follows:
Growth is a composite of next year's estimate over current year's estimate, e.g. EPS, EBITDA, Revenue. Return is a year one prospective aggregate
of various return on capital measures, e.g. CROCI, ROACE, and ROE. Multiple is a composite of one-year forward valuation ratios, e.g. P/E, dividend
yield, EV/FCF, EV/EBITDA, EV/DACF, Price/Book. Volatility is measured as trailing twelve-month volatility adjusted for dividends.
Quantum
Quantum is Goldman Sachs' proprietary database providing access to detailed financial statement histories, forecasts and ratios. It can be used for
in-depth analysis of a single company, or to make comparisons between companies in different sectors and markets.
GS SUSTAIN
GS SUSTAIN is a global investment strategy aimed at long-term, long-only performance with a low turnover of ideas. The GS SUSTAIN focus list
includes leaders our analysis shows to be well positioned to deliver long term outperformance through sustained competitive advantage and
superior returns on capital relative to their global industry peers. Leaders are identified based on quantifiable analysis of three aspects of corporate
performance: cash return on cash invested, industry positioning and management quality (the effectiveness of companies' management of the
environmental, social and governance issues facing their industry).
Disclosures
Coverage group(s) of stocks by primary analyst(s)
Heath P. Terry, CFA: America-Internet. Matthew J. Fassler: America-Retail: Specialty Hardlines. Piyush Mubayi: Asia Pacific Media, Asia Pacific
Telecoms. Alexander Balakhnin: EMEA New Markets-Media, EMEA New Markets-Telecoms. Debra Schwartz: America-Internet. Weibo Hu: Hong
Kong/China Consumer. Franklin Walding: Europe-Food Retail, Europe-General Retail. Takashi Watanabe: Japan Internet, Games & Media, Japan-
Consumer Electronics, Japan-Electronic Components. Vera Rossi: Latin America-Technology, Latin America-Telecom. Irma Sgarz: Latin America-
Education, Latin America-Retail & Consumer Goods. Lindsay Drucker Mann, CFA: America-Specialty Apparel Retailers. Stephen Grambling, CFA:
America- Off-the-Mall Broadline Retailers, America-On-the-Mall Broadlines Retail, America-Retail Supermarkets. Taposh Bari, CFA: America -
Footwear, America-SMID Apparel, America-SMID Consumer Discretionary. Markus Iwar: Europe-Multi-Sector Holdings. Benjamin Moore, CFA:
Europe-Small & Mid Cap.
America - Footwear: Crocs, Inc., Deckers Outdoor Corporation, Foot Locker Inc., Steven Madden, Ltd., The Finish Line Inc., Wolverine World Wide, Inc..
America- Off-the-Mall Broadline Retailers: Burlington Stores, Inc, Dollar General Corporation, Dollar Tree Stores, Inc., Family Dollar Stores, Inc., Five
Below, Inc., Kohl's Corp., Ross Stores, Inc., The TJX Companies, Inc..
America-Internet: AOL Inc., Amazon.com Inc., Bankrate, Inc., Conversant, Inc., Demand Media, Inc., Endurance International Group Inc, Expedia Inc.,
Groupon, Inc., HomeAway, Inc., IAC/InterActiveCorp, LinkedIn Corporation, Millennial Media, Inc., Netflix, Inc., OpenTable, Inc., Orbitz Worldwide, Inc.,
Pandora Media, Inc., Priceline.com Incorporated, RetailMeNot, Inc., Rocket Fuel Inc, Shutterfly, Inc., TripAdvisor, Inc., Trulia, Inc., Twitter Inc., WebMD
Health Corp., Yahoo! Inc., Yelp Inc., Zillow, Inc., Zulily Inc, Zynga Inc., comScore, Inc., eBay Inc..
America-On-the-Mall Broadlines Retail: J.C. Penney Company, Macy's Inc., Nordstrom, Inc..
America-Retail Supermarkets: Casey's General Stores, Inc., Kroger Company, SUPERVALU Inc., Safeway Inc., Sprouts Farmers Market, Inc., The
Fresh Market, Inc., United Natural Foods, Inc., Whole Foods Market, Inc..
America-Retail: Specialty Hardlines: Advance Auto Parts Inc., AutoZone Inc., Bed Bath & Beyond, Inc., Best Buy Company, Inc., CarMax Inc., Costco
Wholesale, Dick's Sporting Goods, Ethan Allen Interiors, Inc., GNC Holdings, Inc., Genuine Parts Co., KAR Auction Services, Inc., Lowe's Companies,
Inc., Lumber Liquidators Holdings, Inc., O'Reilly Automotive, Inc., Office Depot, PETsMART, Inc., RadioShack Corp., Restoration Hardware Holdings,
Inc., Staples, Inc., Target Corporation, The Home Depot, Inc., Tractor Supply Company, Ulta Salon, Cosmetics & Fragrance, Inc., Vitamin Shoppe, Inc.,
Wal-Mart Stores, Inc., Williams-Sonoma, Inc..
America-SMID Apparel: Ascena Retail Group, Inc., Carter's Inc., Gildan Activewear Inc, Gildan Activewear Inc., Hanesbrands Inc., The Children's Place
Retail Stores, Inc..
America-SMID Consumer Discretionary: DSW Inc., Genesco, Inc., Jarden Corp., Newell Rubbermaid, Inc., Quiksilver, Inc., Sally Beauty Holdings, Inc.,
The Men's Wearhouse, Inc..
America-Specialty Apparel Retailers: ANN Inc., Abercrombie & Fitch, Aeropostale, American Eagle Outfitters Inc., Chico's FAS, Inc., Coach, Inc.,
Columbia Sportswear Company, Express, Inc., Francesca's Holdings Corporation, Gap Inc., Michael Kors Holdings Ltd, Nike, Inc., PVH Corp., Ralph
Lauren Corporation, Tiffany & Company, Tilly's, Inc., Tumi Holdings, Inc., Under Armour, Inc., Urban Outfitters Inc., VF Corp., Vince Holding Corp,
lululemon athletica inc..
Asia Pacific Media: Astro Malaysia Holdings Berhad, Autohome Inc, Baidu.com, Inc., CJ E&M Corporation, Changyou.com, Ctrip.com International,
Daum Communications, Dish TV India, NAVER Corporation, NCSOFT, New Oriental Education & Technology Group Inc. (ADR), Qihoo 360
Technology Co. Ltd., Qunar.com, SINA Corporation, Sohu.com, SouFun Holdings Limited, Sun TV Network, TAL Education Group, Television
Broadcasts, Tencent Holdings, Vipshop Holdings Limited, Xueda Education Group, Youku Tudou Inc., Zee Entertainment Enterprises.
Asia Pacific Telecoms: Advanced Info Service PCL, Axiata Group Bhd, Bharti Airtel, Bharti Infratel Ltd, Chunghwa Telecom, Digi.com, Far EasTone,
Globe Telecom, HKT Trust, Hutchison Telecommunications Hong Kong Holdings, Idea Cellular, Indosat, Intouch Group, KT Corp, KT Corp (ADR), LG
UPlus, M1 Ltd, Maxis Berhad, PCCW Limited, PT XL Axiata, Philippine Long Distance, Philippine Long Distance (ADR), Reliance Communications, SK
March 5, 2014 Global: Technology: Internet
Goldman Sachs Global Investment Research 19
Telecom, SK Telecom (ADR), Singapore Telecommunications, SmarTone, StarHub, Taiwan Mobile, Tata Communications, Telekom Malaysia,
Telekomunikasi Indonesia, Total Access Communications, Tower Bersama Infrastructure Tbk PT, True Corp.
EMEA New Markets-Media: CTC Media, Central European Media Enterprises, Mail.ru Group Ltd., Naspers Ltd., TVN S.A., Yandex N.V..
EMEA New Markets-Telecoms: Bezeq, Cellcom Israel Ltd., Global Telecom Holding. S.A.E., MTN Group, Magyar Telekom, Maroc Telecom, MegaFon,
Mobile Telesystems, OTE, Ooredoo, Orange Polska SA, Partner, Rostelecom (Ord), Sistema JSFC (GDR), Telecom Egypt, Telefonica CR, Telkom SA,
Turk Telekom, Turkcell (ADR), VimpelCom Ltd., Vodacom, Zain.
Europe-Food Retail: Ahold, Booker Group PLC, Carrefour, Casino, Colruyt, Delhaize, J Sainsbury, Jeronimo Martins, Metro, Morrison (Wm), Ocado
Group PLC, Sligro, Tesco.
Europe-General Retail: ASOS plc, Brunello Cucinelli, Burberry, Debenhams, Essilor, Geox, Hennes & Mauritz, Hermes International, Hugo Boss AG,
Inditex, Kering, Kingfisher, LVMH Moet-Hennessy Louis Vuitton, Luxottica (Italy), Marks & Spencer, Moleskine SpA, Moncler S.p.A, Mulberry Group
Plc, Next, Pandora, Prada SpA, Puma, Richemont, Salvatore Ferragamo SpA, Signet Jewelers, Sports Direct International Plc, Ted Baker, The Swatch
Group (Bearer share), Tod's, adidas.
Europe-Multi-Sector Holdings: Aker ASA, Christian Dior, Compagnie Industriali Riunite Spa, Corporacion Financiera Alba, Eurazeo, Exor SpA, Groupe
Bruxelles Lambert, Heineken Holding, Industrivarden AB (A), Investor AB (B), Italmobiliare S.p.A., Italmobiliare S.p.A. (Savings), KBC Ancora,
Kinnevik Investment AB (B), L E Lundbergforetagen AB, Orkla ASA, Pargesa Holding S.A., Rallye, Ratos AB, Reinet, Sacyr SA, Schibsted ASA,
Semapa, Societe FFP, Sonae SGPS SA, Wendel.
Europe-Small & Mid Cap: Aalberts, Amer Sports, Andritz AG, Arrow Global Group, BAM Groep, BBA Aviation PLC, Barco NV, Barratt Developments,
Barry Callebaut, Bauer AG, Bellway Plc, Berkeley Group Holdings, Bourbon, Bovis Homes Group, Bucher Industries, Burckhardt Compression Holding
AG, Cargotec, Carillion, Countrywide PLC, Crest Nicholson Holdings plc, D S Smith, Danieli, Danieli (Savings), De La Rue Plc, Deutz, Devro Plc.,
Dignity Plc, Diploma, Domino Printing Sciences, Domino's Pizza, Dufry, Fenner, Fluidra SA, Forbo, Fuchs Petrolub, Genus, Georg Fischer,
Gerresheimer AG, Grafton Group Plc, Greggs, Groupe SEB SA, HellermannTyton Group Plc, Holmen B, Huhtamaki, Hunting Plc, IG Group Holdings,
IPSOS, ITE Group, Indesit Co SpA, International Personal Finance, Jungheinrich, KION GROUP AG, KUKA, KWS SAAT AG, Keller Group, Kier Group,
Kingspan Group, Konecranes, Krones AG, LSL Property Services PLC, Manitou, Marshalls Plc, Matas, Mayr-Melnhof, Melrose, Metsa Board
Corporation, Mondi Group, NORMA Group AG, Neopost, Northgate, Oxford Instruments, Palfinger AG, Persimmon, Pfeiffer Vacuum Technology AG,
Premier Foods, Provident Financial, Rational AG, Redrow, Renishaw Plc, Rexam, Rightmove Plc, Rockwool International A/S, Rotork PLC, Royal
Boskalis Westminster N.V., Royal Vopak, Rubis, SIG, Savills PLC, Schoeller-Bleckmann, Sika, Smurfit Kappa Group, Société BIC, Spectris, Speedy Hire,
Stora Enso, Sulzer AG, TT Electronics, Taylor Wimpey, Tomra Systems, Topps Tiles, Trevi Finanziaria Spa, UPM-Kymmene, Uponor OYJ, VTG,
Vilmorin & Cie, Viscofan, Vossloh AG, Wacker Neuson, Wincor Nixdorf, World Duty Free Group, YOOX, Zardoya Otis, Zumtobel.
Hong Kong/China Consumer: Anta Sports Products, Beijing Hualian Hypermarket Co., Belle International Holdings, Better Life Commercial Chain
Share Co., Bosideng International Holdings, Chow Sang Sang Holdings International Ltd., Chow Tai Fook Jewellery Group, Daphne International
Holdings, Esprit Holdings, Fujian New Hua Du Supercenter Co., Golden Eagle Retail Group, Gome Electrical Appliances Holding, Hengdeli Holdings
Ltd., Intime Retail (Group) Company Limited, Lao Feng Xiang Co., Li & Fung, Li Ning Company, Lifestyle International Holdings, Luk Fook Holdings
International Ltd., Maoye International Holdings, New World Department Store China, Parkson Retail Group, Renrenle Commercial Group Co.,
Samsonite International SA, Sanjiang Shopping Club Co., Suning Commerce Group Co Ltd., Trinity Ltd., Yonghui Superstores, Zhejiang Ming
Jewelry Co., Zhongbai Holdings Group Co..
Japan Internet, Games & Media: Capcom, CyberAgent, DeNA Co., Gree, Kakaku.com, Konami, Namco Bandai Holdings, Nexon, Nintendo, Rakuten,
Sega Sammy Holdings, Square Enix Holdings, Yahoo Japan, mixi.
Japan-Consumer Electronics: Asahi Glass, Funai Electric, GS Yuasa, Nippon Electric Glass, Panasonic Corporation, Sharp, Sony.
Japan-Electronic Components: Alps Electric, Hirose Electric, Ibiden, Japan Aviation Electronics Industry, Kyocera, Mabuchi Motor, Minebea, Mitsumi
Electric, Murata Mfg., NGK Insulators, NGK Spark Plug, Nichicon, Nidec, Nippon Chemi-Con, Nitto Denko, Shinko Electric Industries, TDK, Taiyo
Yuden.
Latin America-Education: SER Educacional.
Latin America-Retail & Consumer Goods: Arezzo & Co., B2W, Brazil Pharma SA, CBD (Pão de Açúcar), Cencosud, Cia Hering, Falabella, Hypermarcas,
Lojas Americanas, Lojas Renner, Magazine Luiza, Marisa Lojas, Natura, Raia Drogasil, Restoque, Soriana, Technos, Via Varejo SA, Wal-Mart de
Mexico.
Latin America-Technology: MercadoLibre, Inc..
Latin America-Telecom: America Movil, Axtel, Entel, Grupo Televisa, Megacable, NII Holdings, Oi S.A., Oi S.A. (ADR), TIM Participacoes S.A., TIM
Participacoes S.A. (ADR), Telecom Argentina, Telefonica Brasil SA.
Company-specific regulatory disclosures
Compendium report: please see disclosures at http://www.gs.com/research/hedge.html. Disclosures applicable to the companies included in this
compendium can be found in the latest relevant published research
Distribution of ratings/investment banking relationships
Goldman Sachs Investment Research global coverage universe
Rating Distribution Investment Banking Relationships
Buy Hold Sell Buy Hold Sell
Global 32% 54% 14% 53% 45% 36%
As of January 1, 2014, Goldman Sachs Global Investment Research had investment ratings on 3,637 equity securities. Goldman Sachs assigns stocks
as Buys and Sells on various regional Investment Lists; stocks not so assigned are deemed Neutral. Such assignments equate to Buy, Hold and Sell
for the purposes of the above disclosure required by NASD/NYSE rules. See 'Ratings, Coverage groups and views and related definitions' below.
Price target and rating history chart(s)
Compendium report: please see disclosures at http://www.gs.com/research/hedge.html. Disclosures applicable to the companies included in this
compendium can be found in the latest relevant published research

March 5, 2014 Global: Technology: Internet
Goldman Sachs Global Investment Research 20
Regulatory disclosures
Disclosures required by United States laws and regulations
See company-specific regulatory disclosures above for any of the following disclosures required as to companies referred to in this report: manager
or co-manager in a pending transaction; 1% or other ownership; compensation for certain services; types of client relationships; managed/co-
managed public offerings in prior periods; directorships; for equity securities, market making and/or specialist role. Goldman Sachs usually makes a
market in fixed income securities of issuers discussed in this report and usually deals as a principal in these securities.
The following are additional required disclosures: Ownership and material conflicts of interest: Goldman Sachs policy prohibits its analysts,
professionals reporting to analysts and members of their households from owning securities of any company in the analyst's area of
coverage. Analyst compensation: Analysts are paid in part based on the profitability of Goldman Sachs, which includes investment banking
revenues. Analyst as officer or director: Goldman Sachs policy prohibits its analysts, persons reporting to analysts or members of their
households from serving as an officer, director, advisory board member or employee of any company in the analyst's area of coverage. Non-U.S. Analysts: Non-U.S. analysts may not be associated persons of Goldman, Sachs & Co. and therefore may not be subject to NASD Rule 2711/NYSE
Rules 472 restrictions on communications with subject company, public appearances and trading securities held by the analysts.
Distribution of ratings: See the distribution of ratings disclosure above. Price chart: See the price chart, with changes of ratings and price targets in
prior periods, above, or, if electronic format or if with respect to multiple companies which are the subject of this report, on the Goldman Sachs
website at http://www.gs.com/research/hedge.html.
Additional disclosures required under the laws and regulations of jurisdictions other than the United States
The following disclosures are those required by the jurisdiction indicated, except to the extent already made above pursuant to United States laws
and regulations. Australia: Goldman Sachs Australia Pty Ltd and its affiliates are not authorised deposit-taking institutions (as that term is defined in
the Banking Act 1959 (Cth)) in Australia and do not provide banking services, nor carry on a banking business, in Australia. This research, and any
access to it, is intended only for "wholesale clients" within the meaning of the Australian Corporations Act, unless otherwise agreed by Goldman
Sachs. In producing research reports, members of the Global Investment Research Division of Goldman Sachs Australia may attend site visits and
other meetings hosted by the issuers the subject of its research reports. In some instances the costs of such site visits or meetings may be met in part
or in whole by the issuers concerned if Goldman Sachs Australia considers it is appropriate and reasonable in the specific circumstances relating to
the site visit or meeting. Brazil: Disclosure information in relation to CVM Instruction 483 is available at
http://www.gs.com/worldwide/brazil/area/gir/index.html. Where applicable, the Brazil-registered analyst primarily responsible for the content of this
research report, as defined in Article 16 of CVM Instruction 483, is the first author named at the beginning of this report, unless indicated otherwise at
the end of the text. Canada: Goldman Sachs Canada Inc. is an affiliate of The Goldman Sachs Group Inc. and therefore is included in the company
specific disclosures relating to Goldman Sachs (as defined above). Goldman Sachs Canada Inc. has approved of, and agreed to take responsibility for,
this research report in Canada if and to the extent that Goldman Sachs Canada Inc. disseminates this research report to its clients. Hong Kong: Further information on the securities of covered companies referred to in this research may be obtained on request from Goldman Sachs
(Asia) L.L.C. India: Further information on the subject company or companies referred to in this research may be obtained from Goldman Sachs
(India) Securities Private Limited. Japan: See below. Korea: Further information on the subject company or companies referred to in this research
may be obtained from Goldman Sachs (Asia) L.L.C., Seoul Branch. New Zealand: Goldman Sachs New Zealand Limited and its affiliates are neither
"registered banks" nor "deposit takers" (as defined in the Reserve Bank of New Zealand Act 1989) in New Zealand. This research, and any access to it,
is intended for "wholesale clients" (as defined in the Financial Advisers Act 2008) unless otherwise agreed by Goldman Sachs. Russia: Research
reports distributed in the Russian Federation are not advertising as defined in the Russian legislation, but are information and analysis not having
product promotion as their main purpose and do not provide appraisal within the meaning of the Russian legislation on appraisal
activity. Singapore: Further information on the covered companies referred to in this research may be obtained from Goldman Sachs (Singapore)
Pte. (Company Number: 198602165W). Taiwan: This material is for reference only and must not be reprinted without permission. Investors should
carefully consider their own investment risk. Investment results are the responsibility of the individual investor. United Kingdom: Persons who
would be categorized as retail clients in the United Kingdom, as such term is defined in the rules of the Financial Conduct Authority, should read this
research in conjunction with prior Goldman Sachs research on the covered companies referred to herein and should refer to the risk warnings that
have been sent to them by Goldman Sachs International. A copy of these risks warnings, and a glossary of certain financial terms used in this report,
are available from Goldman Sachs International on request.
European Union: Disclosure information in relation to Article 4 (1) (d) and Article 6 (2) of the European Commission Directive 2003/126/EC is available
at http://www.gs.com/disclosures/europeanpolicy.html which states the European Policy for Managing Conflicts of Interest in Connection with
Investment Research.
Japan: Goldman Sachs Japan Co., Ltd. is a Financial Instrument Dealer registered with the Kanto Financial Bureau under registration number Kinsho
69, and a member of Japan Securities Dealers Association, Financial Futures Association of Japan and Type II Financial Instruments Firms
Association. Sales and purchase of equities are subject to commission pre-determined with clients plus consumption tax. See company-specific
disclosures as to any applicable disclosures required by Japanese stock exchanges, the Japanese Securities Dealers Association or the Japanese
Securities Finance Company.
Ratings, coverage groups and views and related definitions
Buy (B), Neutral (N), Sell (S) -Analysts recommend stocks as Buys or Sells for inclusion on various regional Investment Lists. Being assigned a Buy
or Sell on an Investment List is determined by a stock's return potential relative to its coverage group as described below. Any stock not assigned as
a Buy or a Sell on an Investment List is deemed Neutral. Each regional Investment Review Committee manages various regional Investment Lists to a
global guideline of 25%-35% of stocks as Buy and 10%-15% of stocks as Sell; however, the distribution of Buys and Sells in any particular coverage
group may vary as determined by the regional Investment Review Committee. Regional Conviction Buy and Sell lists represent investment
recommendations focused on either the size of the potential return or the likelihood of the realization of the return.
Return potential represents the price differential between the current share price and the price target expected during the time horizon associated
with the price target. Price targets are required for all covered stocks. The return potential, price target and associated time horizon are stated in each
report adding or reiterating an Investment List membership.
Coverage groups and views: A list of all stocks in each coverage group is available by primary analyst, stock and coverage group at
http://www.gs.com/research/hedge.html. The analyst assigns one of the following coverage views which represents the analyst's investment outlook
on the coverage group relative to the group's historical fundamentals and/or valuation. Attractive (A). The investment outlook over the following 12
months is favorable relative to the coverage group's historical fundamentals and/or valuation. Neutral (N). The investment outlook over the
following 12 months is neutral relative to the coverage group's historical fundamentals and/or valuation. Cautious (C). The investment outlook over
the following 12 months is unfavorable relative to the coverage group's historical fundamentals and/or valuation.

March 5, 2014 Global: Technology: Internet
Goldman Sachs Global Investment Research 21
Not Rated (NR). The investment rating and target price have been removed pursuant to Goldman Sachs policy when Goldman Sachs is acting in an
advisory capacity in a merger or strategic transaction involving this company and in certain other circumstances. Rating Suspended (RS). Goldman
Sachs Research has suspended the investment rating and price target for this stock, because there is not a sufficient fundamental basis for
determining, or there are legal, regulatory or policy constraints around publishing, an investment rating or target. The previous investment rating and
price target, if any, are no longer in effect for this stock and should not be relied upon. Coverage Suspended (CS). Goldman Sachs has suspended
coverage of this company. Not Covered (NC). Goldman Sachs does not cover this company. Not Available or Not Applicable (NA). The
information is not available for display or is not applicable. Not Meaningful (NM). The information is not meaningful and is therefore excluded.
Global product; distributing entities
The Global Investment Research Division of Goldman Sachs produces and distributes research products for clients of Goldman Sachs on a global
basis. Analysts based in Goldman Sachs offices around the world produce equity research on industries and companies, and research on
macroeconomics, currencies, commodities and portfolio strategy. This research is disseminated in Australia by Goldman Sachs Australia Pty Ltd
(ABN 21 006 797 897); in Brazil by Goldman Sachs do Brasil Corretora de Títulos e Valores Mobiliários S.A.; in Canada by either Goldman Sachs
Canada Inc. or Goldman, Sachs & Co.; in Hong Kong by Goldman Sachs (Asia) L.L.C.; in India by Goldman Sachs (India) Securities Private Ltd.; in
Japan by Goldman Sachs Japan Co., Ltd.; in the Republic of Korea by Goldman Sachs (Asia) L.L.C., Seoul Branch; in New Zealand by Goldman Sachs
New Zealand Limited; in Russia by OOO Goldman Sachs; in Singapore by Goldman Sachs (Singapore) Pte. (Company Number: 198602165W); and in
the United States of America by Goldman, Sachs & Co. Goldman Sachs International has approved this research in connection with its distribution in
the United Kingdom and European Union.
European Union: Goldman Sachs International authorised by the Prudential Regulation Authority and regulated by the Financial Conduct Authority
and the Prudential Regulation Authority, has approved this research in connection with its distribution in the European Union and United Kingdom;
Goldman Sachs AG and Goldman Sachs International Zweigniederlassung Frankfurt, regulated by the Bundesanstalt für
Finanzdienstleistungsaufsicht, may also distribute research in Germany.
General disclosures
This research is for our clients only. Other than disclosures relating to Goldman Sachs, this research is based on current public information that we
consider reliable, but we do not represent it is accurate or complete, and it should not be relied on as such. We seek to update our research as
appropriate, but various regulations may prevent us from doing so. Other than certain industry reports published on a periodic basis, the large
majority of reports are published at irregular intervals as appropriate in the analyst's judgment.
Goldman Sachs conducts a global full-service, integrated investment banking, investment management, and brokerage business. We have
investment banking and other business relationships with a substantial percentage of the companies covered by our Global Investment Research
Division. Goldman, Sachs & Co., the United States broker dealer, is a member of SIPC (http://www.sipc.org).
Our salespeople, traders, and other professionals may provide oral or written market commentary or trading strategies to our clients and our
proprietary trading desks that reflect opinions that are contrary to the opinions expressed in this research. Our asset management area, our
proprietary trading desks and investing businesses may make investment decisions that are inconsistent with the recommendations or views
expressed in this research.
The analysts named in this report may have from time to time discussed with our clients, including Goldman Sachs salespersons and traders, or may
discuss in this report, trading strategies that reference catalysts or events that may have a near-term impact on the market price of the equity
securities discussed in this report, which impact may be directionally counter to the analyst's published price target expectations for such stocks. Any
such trading strategies are distinct from and do not affect the analyst's fundamental equity rating for such stocks, which rating reflects a stock's
return potential relative to its coverage group as described herein.
We and our affiliates, officers, directors, and employees, excluding equity and credit analysts, will from time to time have long or short positions in,
act as principal in, and buy or sell, the securities or derivatives, if any, referred to in this research.
This research is not an offer to sell or the solicitation of an offer to buy any security in any jurisdiction where such an offer or solicitation would be
illegal. It does not constitute a personal recommendation or take into account the particular investment objectives, financial situations, or needs of
individual clients. Clients should consider whether any advice or recommendation in this research is suitable for their particular circumstances and, if
appropriate, seek professional advice, including tax advice. The price and value of investments referred to in this research and the income from them
may fluctuate. Past performance is not a guide to future performance, future returns are not guaranteed, and a loss of original capital may occur.
Fluctuations in exchange rates could have adverse effects on the value or price of, or income derived from, certain investments.
Certain transactions, including those involving futures, options, and other derivatives, give rise to substantial risk and are not suitable for all investors.
Investors should review current options disclosure documents which are available from Goldman Sachs sales representatives or at
http://www.theocc.com/about/publications/character-risks.jsp. Transaction costs may be significant in option strategies calling for multiple purchase
and sales of options such as spreads. Supporting documentation will be supplied upon request.
All research reports are disseminated and available to all clients simultaneously through electronic publication to our internal client websites. Not all
research content is redistributed to our clients or available to third-party aggregators, nor is Goldman Sachs responsible for the redistribution of our
research by third party aggregators. For research or data available on a particular security, please contact your sales representative or go to
http://360.gs.com.
Disclosure information is also available at http://www.gs.com/research/hedge.html or from Research Compliance, 200 West Street, New York, NY
10282.
© 2014 Goldman Sachs.
No part of this material may be (i) copied, photocopied or duplicated in any form by any means or (ii) redistributed without the prior written consent of The Goldman Sachs Group, Inc.