Expectations Are High for Continued and Impressive Earnings Growth

Copyright © 2018 FactSet Research Systems Inc. All rights reserved. FactSet Research Systems Inc. www.factset.com 1
All data published in this report is available on FactSet. Please contact [email protected] or 1-877-FACTSET for more information.
Key Metrics • Earnings Growth: For Q1 2018, the estimated earnings growth rate for the S&P 500 is 17.1%. If 17.1% is the actual growth
rate for the quarter, it will mark the highest earnings growth since Q1 2011 (19.5%).
• Earnings Revisions: On December 31, the estimated earnings growth rate for Q1 2018 was 11.3%. Ten sectors have higher growth rates today (compared to December 31) due to upward revisions to estimates, led by the Energy sector.
• Earnings Guidance: For Q1 2018, 52 S&P 500 companies have issued negative EPS guidance and 53 S&P 500 companies have issued positive EPS guidance.
• Valuation: The forward 12-month P/E ratio for the S&P 500 is 16.5. This P/E ratio is above the 5-year average (16.1) and above the 10-year average (14.3).
• Earnings Scorecard: For Q1 2018 (with 23 companies in the S&P 500 reporting actual results for the quarter), 16 S&P 500 companies have reported a positive EPS surprise and 17 have reported a positive sales surprise.
To receive this report via e-mail, please go to www.factset.com/data/news_research/researchdesk
To view other market stories with FactSet content, please go to www.factset.com/insight
John Butters, Senior Earnings Analyst
April 6, 2018
Media Questions/Requests

Copyright © 2018 FactSet Research Systems Inc. All rights reserved. FactSet Research Systems Inc. www.factset.com 2
Topic of the Week: 1
Record Number of S&P 500 Companies issuing Positive EPS Guidance for Q1, Led By Tech
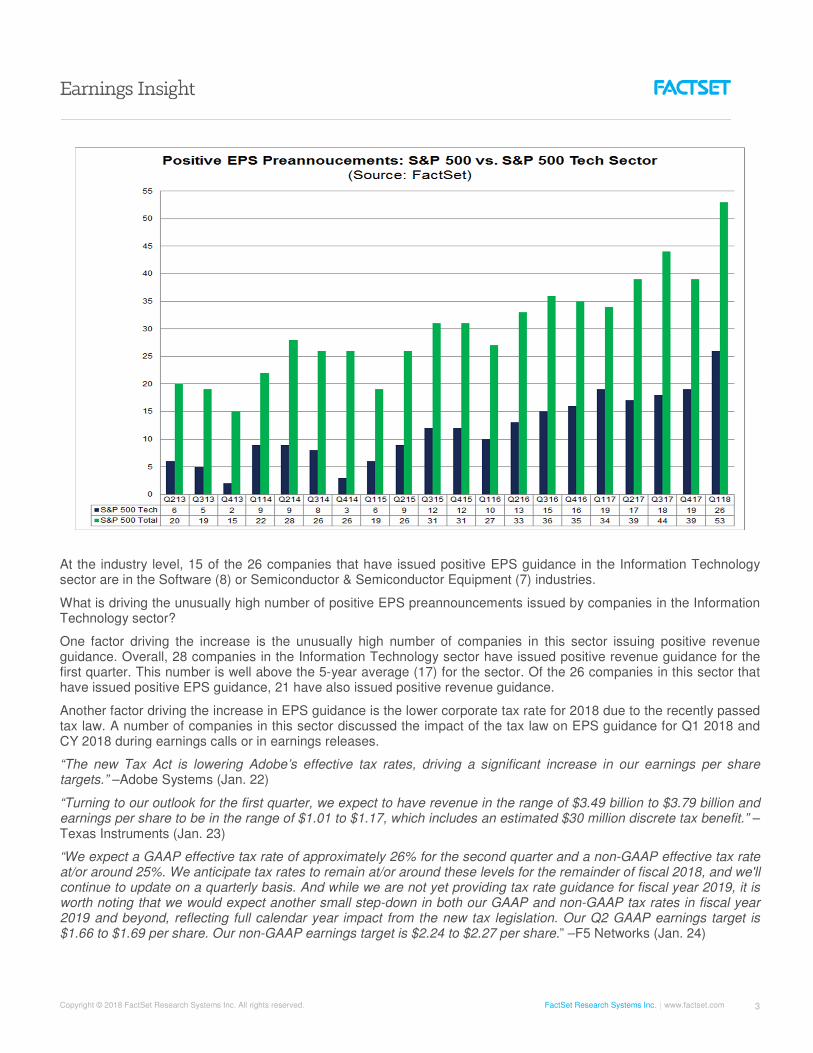
For the first quarter, 52 companies in the S&P 500 have issued negative EPS guidance and 53 companies in the S&P 500 have issued positive EPS guidance. The number of companies issuing negative EPS guidance is well below the 5-year average (80), while the number of companies issuing positive EPS guidance is well above the 5-year average (28).
If 53 is the final number for the quarter, it will mark the highest number of S&P 500 companies issuing positive EPS guidance for a quarter since FactSet began tracking this metric in Q2 2006. The current record for the number of S&P 500 companies issuing positive EPS guidance in a quarter is 47, which was set in Q2 2010.
At the sector level, the Information Technology (38) and Consumer Discretionary (24) sectors have the highest number of companies issuing EPS guidance for the first quarter. This is not surprising, as these two sectors have historically had the highest number of companies providing quarterly EPS guidance on average. What is surprising, however, is the unusually high number of companies issuing positive EPS guidance in the Information Technology sector.
The number of companies issuing positive EPS guidance in the Information Technology sector for Q1 2018 is 26, which is well above the 5-year average (11) for the sector.
If the final number for the quarter is 26, it will mark the highest number of companies issuing positive EPS guidance in the Information Technology sector since FactSet began tracking EPS guidance in Q2 2006. The current record is 21, which set in Q3 2010.
Copyright © 2018 FactSet Research Systems Inc. All rights reserved. FactSet Research Systems Inc. www.factset.com 3
At the industry level, 15 of the 26 companies that have issued positive EPS guidance in the Information Technology sector are in the Software (8) or Semiconductor & Semiconductor Equipment (7) industries.
What is driving the unusually high number of positive EPS preannouncements issued by companies in the Information Technology sector?
One factor driving the increase is the unusually high number of companies in this sector issuing positive revenue guidance. Overall, 28 companies in the Information Technology sector have issued positive revenue guidance for the first quarter. This number is well above the 5-year average (17) for the sector. Of the 26 companies in this sector that have issued positive EPS guidance, 21 have also issued positive revenue guidance.
Another factor driving the increase in EPS guidance is the lower corporate tax rate for 2018 due to the recently passed tax law. A number of companies in this sector discussed the impact of the tax law on EPS guidance for Q1 2018 and CY 2018 during earnings calls or in earnings releases.
“The new Tax Act is lowering Adobe’s effective tax rates, driving a significant increase in our earnings per share targets.” –Adobe Systems (Jan. 22)
“Turning to our outlook for the first quarter, we expect to have revenue in the range of $3.49 billion to $3.79 billion and earnings per share to be in the range of $1.01 to $1.17, which includes an estimated $30 million discrete tax benefit.” –Texas Instruments (Jan. 23)
“We expect a GAAP effective tax rate of approximately 26% for the second quarter and a non-GAAP effective tax rate at/or around 25%. We anticipate tax rates to remain at/or around these levels for the remainder of fiscal 2018, and we'll continue to update on a quarterly basis. And while we are not yet providing tax rate guidance for fiscal year 2019, it is worth noting that we would expect another small step-down in both our GAAP and non-GAAP tax rates in fiscal year 2019 and beyond, reflecting full calendar year impact from the new tax legislation. Our Q2 GAAP earnings target is $1.66 to $1.69 per share. Our non-GAAP earnings target is $2.24 to $2.27 per share.” –F5 Networks (Jan. 24)

Copyright © 2018 FactSet Research Systems Inc. All rights reserved. FactSet Research Systems Inc. www.factset.com 4
“Before I turn the call over to Adam, I would like to make a brief comment relative to our 2018 earnings guidance. As mentioned earlier, our 2018 diluted EPS guidance reflects an estimated one point benefit on our 2018 effective tax rate from the Tax Act, or approximately 25.5%, which compares to our 2017 adjusted effective tax rate of 26.5%. On that basis, we anticipate diluted EPS of $0.78 to $0.80 for the first quarter of 2018 or 13% to 16% growth versus the first quarter 2017 adjusted diluted EPS. For the full year 2018, we anticipate diluted EPS of $3.39 to $3.47, which represents a 9% to 11% growth versus full year 2017 adjusted diluted EPS.” –Amphenol (Jan. 25)
“For 2018, the company is forecasting a non-GAAP income tax rate of 16 percent, down from 23 percent used in fiscal 2017, primarily resulting from the tax rate reduction.” –Cadence Design Systems (Jan. 31)
“And with the overall revenue and spend configuration I just outlined, we expect Q1 non-GAAP EPS in the range of $0.67 to $0.70. This EPS guidance assumes taxes of $34 million to $36 million based on an estimated quarterly non-GAAP tax rate of 23%, which is down five points from 2017 levels due to the impact of U.S. tax reform.” –Akami Technologies (Feb. 6)
“To summarize, we delivered a record quarter for revenue and non-GAAP earnings. Based on our excellent Q1 performance and strong 2018 outlook, amplified by favorable tax reform, we're raising our guidance for 2018.” –Synopsys (Feb. 21)
“As a result of our performance in Q1, as well as continued benefits from a lower tax rate, we are raising our fiscal year 2018 non-GAAP EPS outlook to $1.35 to $1.45 from our previously provided outlook of $1.15 to $1.25.” –Hewlett Packard Enterprise (Feb. 22)
“With all that in mind, we expect Q2 2018 non-GAAP diluted net earnings per share is in the range of $0.45 to $0.49, including the $0.02 net benefit from the U.S. tax reform. Q2 2018 GAAP diluted net earnings per share is in the range of $0.42 to $0.46. We are raising our full year fiscal 2018 non-GAAP diluted net earnings per share by $0.15 including the $0.10 net benefit from U.S. tax reform. The range is now $1.90 to $2. And our full year fiscal 2018 GAAP diluted net earnings per share is in the range of $2.53 to $2.63.” –HP Inc. (Feb. 22)
The term “guidance” (or “preannouncement”) is defined as a projection or estimate for EPS provided by a company in advance of the company reporting actual results. Guidance is classified as negative if the estimate (or mid-point of a range estimates) provided by a company is lower than the mean EPS estimate the day before the guidance was issued. Guidance is classified as positive if the estimate (or mid-point of a range of estimates) provided by the company is higher than the mean EPS estimate the day before the guidance was issued.

Copyright © 2018 FactSet Research Systems Inc. All rights reserved. FactSet Research Systems Inc. www.factset.com 5
Topic of the Week: 2
Industry Analysts Project 16% Price Increase for S&P 500 Over the Next 12 Months
During the first quarter, the S&P 500 index recorded a decrease in value (-1.2%) for the first time since Q3 2015. During the past twelve months (March 31, 2017 to March 31, 2018), the S&P 500 recorded an increase in value of 11.8%. Where do industry analysts believe the price of the index will go from here?
Industry analysts in aggregate predict the S&P 500 will see a 16.2% increase in price over the next twelve months. This percentage is based on the difference between the bottom-up target price and the closing price for the index as of yesterday (April 5). The bottom-up target price is calculated by aggregating the median target price estimates (based on company-level estimates submitted by industry analysts) for all the companies in the index. On April 5, the bottom-up target price for the S&P 500 was 3094.05, which was 16.2% above the closing price of 2662.84.
At the sector level, the Health Care (+18.8%), Information Technology (+18.2%), and Energy (+18.0%) sectors are expected to see the largest price increases, as these sectors had the largest upside differences between the bottom-up target price and the closing price on April 5. On the other hand, the Utilities (+4.8%) sector is expected to see the smallest price increase, as this sector had the smallest upside difference between the bottom-up target price and the closing price on April 5.
How accurate have the industry analysts been in predicting the future value of the S&P 500?
Over the past 5 years, the average difference between the bottom-up target price estimate at the end of the month and the closing price 12 months later has been -0.2%. In other words, industry analysts have underestimated the price of the index 12 months in advance by 0.2% on average during the previous five years (using month-end values).
Over the past 10 years, the average difference between the bottom-up target price estimate at the end of the month and the closing price 12 months later has been 11.6%. Over the past 15 years, the average difference between the bottom-up target price estimate at the end of the month and the closing price 12 months later has been 10.5%. In other words, industry analysts have overestimated the price of the index 12 months in advance by 11.6% on average over the past 10 years (using month-end values) and by 10.5% on average over the past 15 years (using month-end values).

Copyright © 2018 FactSet Research Systems Inc. All rights reserved. FactSet Research Systems Inc. www.factset.com 6
Copyright © 2018 FactSet Research Systems Inc. All rights reserved. FactSet Research Systems Inc. www.factset.com 7
Q1 2018 Earnings Season: By the Numbers
Overview
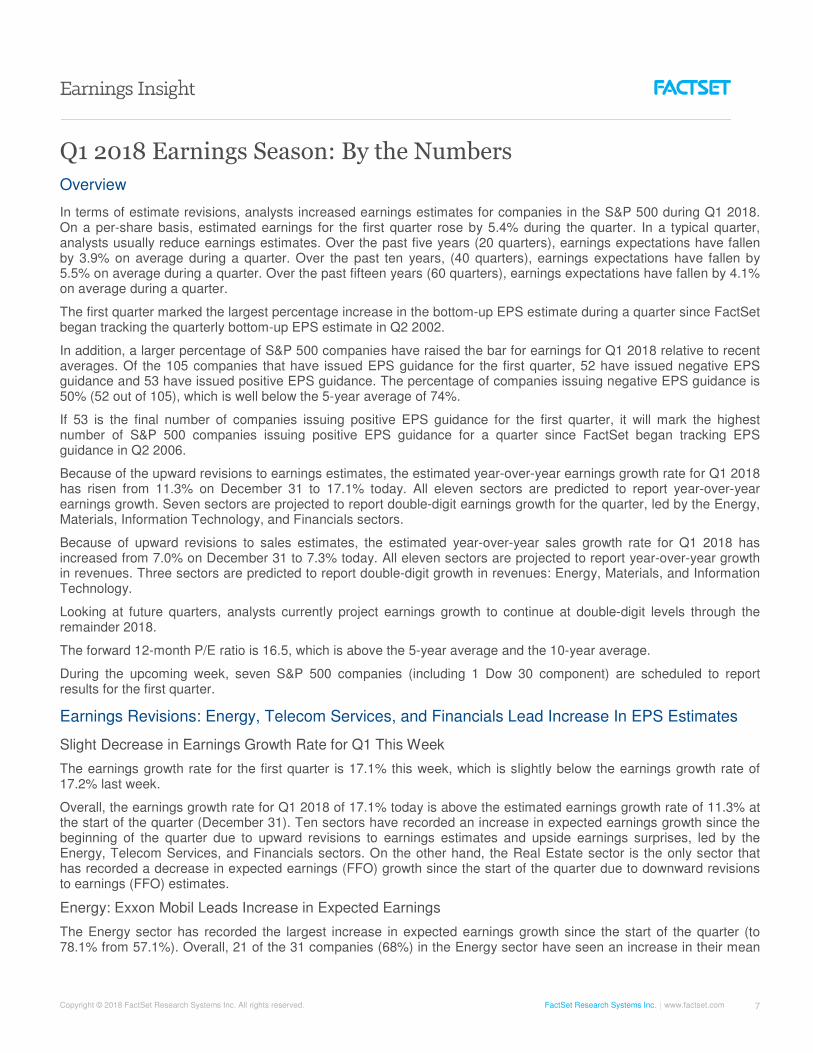
In terms of estimate revisions, analysts increased earnings estimates for companies in the S&P 500 during Q1 2018. On a per-share basis, estimated earnings for the first quarter rose by 5.4% during the quarter. In a typical quarter, analysts usually reduce earnings estimates. Over the past five years (20 quarters), earnings expectations have fallen by 3.9% on average during a quarter. Over the past ten years, (40 quarters), earnings expectations have fallen by 5.5% on average during a quarter. Over the past fifteen years (60 quarters), earnings expectations have fallen by 4.1% on average during a quarter.
The first quarter marked the largest percentage increase in the bottom-up EPS estimate during a quarter since FactSet began tracking the quarterly bottom-up EPS estimate in Q2 2002.
In addition, a larger percentage of S&P 500 companies have raised the bar for earnings for Q1 2018 relative to recent averages. Of the 105 companies that have issued EPS guidance for the first quarter, 52 have issued negative EPS guidance and 53 have issued positive EPS guidance. The percentage of companies issuing negative EPS guidance is 50% (52 out of 105), which is well below the 5-year average of 74%.
If 53 is the final number of companies issuing positive EPS guidance for the first quarter, it will mark the highest number of S&P 500 companies issuing positive EPS guidance for a quarter since FactSet began tracking EPS guidance in Q2 2006.
Because of the upward revisions to earnings estimates, the estimated year-over-year earnings growth rate for Q1 2018 has risen from 11.3% on December 31 to 17.1% today. All eleven sectors are predicted to report year-over-year earnings growth. Seven sectors are projected to report double-digit earnings growth for the quarter, led by the Energy, Materials, Information Technology, and Financials sectors.
Because of upward revisions to sales estimates, the estimated year-over-year sales growth rate for Q1 2018 has increased from 7.0% on December 31 to 7.3% today. All eleven sectors are projected to report year-over-year growth in revenues. Three sectors are predicted to report double-digit growth in revenues: Energy, Materials, and Information Technology.
Looking at future quarters, analysts currently project earnings growth to continue at double-digit levels through the remainder 2018.
The forward 12-month P/E ratio is 16.5, which is above the 5-year average and the 10-year average.
During the upcoming week, seven S&P 500 companies (including 1 Dow 30 component) are scheduled to report results for the first quarter.
Earnings Revisions: Energy, Telecom Services, and Financials Lead Increase In EPS Estimates
Slight Decrease in Earnings Growth Rate for Q1 This Week
The earnings growth rate for the first quarter is 17.1% this week, which is slightly below the earnings growth rate of 17.2% last week.
Overall, the earnings growth rate for Q1 2018 of 17.1% today is above the estimated earnings growth rate of 11.3% at the start of the quarter (December 31). Ten sectors have recorded an increase in expected earnings growth since the beginning of the quarter due to upward revisions to earnings estimates and upside earnings surprises, led by the Energy, Telecom Services, and Financials sectors. On the other hand, the Real Estate sector is the only sector that has recorded a decrease in expected earnings (FFO) growth since the start of the quarter due to downward revisions to earnings (FFO) estimates.
Energy: Exxon Mobil Leads Increase in Expected Earnings
The Energy sector has recorded the largest increase in expected earnings growth since the start of the quarter (to 78.1% from 57.1%). Overall, 21 of the 31 companies (68%) in the Energy sector have seen an increase in their mean

Copyright © 2018 FactSet Research Systems Inc. All rights reserved. FactSet Research Systems Inc. www.factset.com 8
EPS estimate during this time. Of these 21 companies, 20 have recorded an increase in their mean EPS estimate of more than 10%, led by Marathon Oil (to $0.12 from $0.01), Noble Energy (to $0.23 from $0.04), and Anadarko Petroleum (to $0.31 from -$0.09). However, the increase in the mean EPS estimate for Exxon Mobil (to $1.13 from $1.02) has been the largest contributor to the increase in expected earnings for this sector since December 31.
Telecom Services: AT&T and Verizon Lead Increase in Estimated Earnings
The Telecom Services sector has recorded the second largest increase in expected earnings growth since the start of the quarter (to 16.6% from 3.2%). Overall, 2 of the 3 companies (67%) in the Telecom Services sector have seen an increase in their mean EPS estimate during this time: AT&T (to $0.87 from $0.75) and Verizon (to $1.11 from $0.97). These two companies have also been the largest contributors to the increase in expected earnings for this sector since December 31.
Financials: JPMorgan Chase and Bank of America Lead Increase in Projected Earnings
The Financials sector has recorded the third largest increase in expected earnings growth since the start of the quarter (to 19.8% from 8.7%). Overall, 62 of the 68 companies (91%) in the Financials sector have seen an increase in their mean EPS estimate during this time. Of these 62 companies, 32 have recorded an increase in their mean EPS estimate of 10% or more, led by Aon (to $2.77 from $1.78), Progressive (to $1.17 from $0.77), and CME Group (to $1.83 from $1.32). However, the increase in the mean EPS estimates for JPMorgan Chase (to $2.27 from $1.95) and Bank of America (to $0.59 from $0.51) have been the largest contributors to the increase in expected earnings for this sector since December 31.
Index-Level (Bottom-Up) EPS Estimate: Record-High Increase
The Q1 bottom-up EPS estimate (which is an aggregation of the median earnings estimates for all 500 companies in the index and can be used as a proxy for the earnings for the index) increased by 5.4% (to $36.22 from $34.37) during the quarter. In a typical quarter, analysts usually reduce earnings estimates. Over the past five years (20 quarters), earnings expectations have fallen by 3.9% on average during a quarter. Over the past ten years, (40 quarters), earnings expectations have fallen by 5.5% on average during a quarter. Over the past fifteen years (60 quarters), earnings expectations have fallen by 4.1% on average during a quarter.
The first quarter marked the largest percentage increase in the bottom-up EPS estimate during a quarter since FactSet began tracking the quarterly bottom-up EPS estimate in Q2 2002.
Earnings Guidance: Record-High Number of Companies Issuing Positive EPS Guidance
The term “guidance” (or “preannouncement”) is defined as a projection or estimate for EPS provided by a company in advance of the company reporting actual results. Guidance is classified as negative if the estimate (or mid-point of a range estimates) provided by a company is lower than the mean EPS estimate the day before the guidance was issued. Guidance is classified as positive if the estimate (or mid-point of a range of estimates) provided by the company is higher than the mean EPS estimate the day before the guidance was issued.
At this point in time, 105 companies in the index have issued EPS guidance for Q1 2018. Of these 105 companies, 52 have issued negative EPS guidance and 53 have issued positive EPS guidance. The percentage of companies issuing negative EPS guidance is 50% (52 out of 105), which is well below the 5-year average of 74%.
If 53 is the final number of companies issuing positive EPS guidance for the first quarter, it will mark the highest number of S&P 500 companies issuing positive EPS guidance for a quarter since FactSet began tracking EPS guidance in Q2 2006. Please see pages 2 through 4 for more details on guidance.
Highest Earnings Growth (17.1%) Since Q1 2011
The estimated (year-over-year) earnings growth rate for Q1 2018 is 17.1%. If 17.1% is the final growth rate for the quarter, it will mark the highest earnings growth reported by the index since Q1 2011 (19.5%). It will also mark the fourth time in the past five quarters that the index has reported double-digit earnings growth. All eleven sectors are expected to report year-over-year growth in earnings. Seven sectors are expected to report double-digit earnings growth, led by the Energy, Materials, Information Technology, and Financials sectors.

Copyright © 2018 FactSet Research Systems Inc. All rights reserved. FactSet Research Systems Inc. www.factset.com 9
Energy: Highest Earnings Growth on Easy Comparison to Low Year-Ago Earnings
The Energy sector is expected to report the highest (year-over-year) earnings growth of all eleven sectors at 78.1%. At the sub-industry level, all six sub-industries in the sector are predicted to report earnings growth for the quarter: Oil & Gas Drilling (N/A due to year-ago loss), Oil & Gas Exploration & Production (2,721%), Oil & Gas Equipment & Services (94%), Oil & Gas Refining & Marketing (84%), Oil & Gas Storage & Transportation (50%), and Integrated Oil & Gas (32%).
The unusually high growth rate for the sector is due to both a significant year-over-year increase in oil prices and a comparison to unusually low earnings in the year-ago quarter. The average price of oil in Q1 2018 ($62.89) was 21.5% higher than the average price of oil in Q1 2017 ($51.78). On a dollar-level basis, the Energy sector is projected to report earnings of $14.2 billion in Q1 2018, compared to earnings of $8.0 billion in Q1 2017. The only sector with lower dollar-level earnings in the year-ago quarter is the Materials sector ($7.3 billion).
Materials: DowDuPont Leads Growth on Easy Comparison to Standalone EPS for Dow Chemical
The Materials sector is expected to report the second highest (year-over-year) earnings growth of all eleven sectors at 40.7%. At the industry level, three of the four industries in the sector are predicted to report earnings growth: Metals & Mining (92%), Chemicals (36%), and Containers & Packaging (34%).
At the company level, DowDuPont is predicted to be the largest contributor to earnings growth for the sector. However, the estimated earnings for Q1 2018 ($2.5 billion) reflect the combined DowDuPont company, while the actual earnings for Q1 2017 ($1.3 billion) reflect the standalone Dow Chemical company. This apple-to-orange comparison is the main reason DowDuPont is projected to be the largest contributor to earnings growth for the sector. If this company were excluded, the estimated earnings growth rate for the sector would fall to 27.9% from 40.7%.
Information Technology: 5 of 7 Industries Expected to Report Double-Digit Earnings Growth
The Information Technology sector is expected to report the third highest (year-over-year) earnings growth of all eleven sectors at 22.0%. At the industry level, all seven of the industries in this sector are predicted to report earnings growth. Five of these seven industries are predicted to report double-digit earnings growth: Semiconductor & Semiconductor Equipment (31%), Technology Hardware, Storage, & Peripherals (24%), Internet Software & Services (23%), Software (21%), and IT Services (18%).
Financials: 4 of 5 Industries Expected to Report Double-Digit Earnings Growth
The Financials sector is expected to report the fourth highest (year-over-year) earnings growth of all eleven sectors at 19.8%. At the industry level, four of the five industries in this sector are predicted to report double-digit growth in earnings: Diversified Financial Services (34%), Consumer Finance (27%), Banks (24%), and Capital Markets (17%).
Revenue Growth: 7.3%
The estimated (year-over-year) revenue growth rate for Q1 2018 is 7.3%. All eleven sectors are expected to report year-over-year growth in revenues. Three sectors are predicted to report double-digit growth in revenues: Materials, Energy, and Information Technology.
Materials: DowDuPont Leads Growth on Easy Comparison to Standalone Revenue for Dow Chemical
The Materials sector is expected to report the highest (year-over-year) revenue growth of all eleven sectors at 20.7%. At the industry level, all four industries in this sector are expected to report revenue growth, led by the Chemicals (25%) and Metals & Mining (25%) industries.
At the company level, DowDuPont is predicted to be the largest contributor to revenue growth for the sector. However, the estimated revenues for Q1 2018 ($21.3 billion) reflect the combined DowDuPont company, while the actual revenues for Q1 2017 ($13.2 billion) reflect the standalone Dow Chemical company. This apple-to-orange comparison is the main reason DowDuPont is projected to be the largest contributor to revenue growth for the sector. If this company were excluded, the estimated revenue growth rate for the sector would fall to 12.1% from 20.7%.

Copyright © 2018 FactSet Research Systems Inc. All rights reserved. FactSet Research Systems Inc. www.factset.com 10
Energy: 5 of 6 Sub-Industries Expected to Report Double-Digit Growth
The Energy sector is expected to report the second highest (year-over-year) revenue growth of all eleven sectors at 15.5%. At the sub-industry level, all six sub-industries in the sector are predicted to report revenue growth: Oil & Gas Drilling (39%), Oil & Gas Equipment & Services (30%), Oil & Gas Refining & Marketing (22%), Oil & Gas Storage & Transportation (16%), Integrated Oil & Gas (11%), and Oil & Gas Exploration & Production (7%).
Information Technology: 5 of 7 Industries Expected to Report Double-Digit Growth
The Information Technology sector is expected to report the third highest (year-over-year) revenue growth of all eleven sectors at 14.2%. At the industry level, all seven industries in this sector are predicted to report revenue growth. Five of these seven industries are projected to report double-digit revenue growth: Internet Software & Services (24%), IT Services (16%), Semiconductor & Semiconductor Equipment (15%), Technology Hardware, Storage, & Peripherals (12%), and Software (10%).

Copyright © 2018 FactSet Research Systems Inc. All rights reserved. FactSet Research Systems Inc. www.factset.com 11
Looking Ahead: Forward Estimates and Valuation
Double-Digit Earnings Growth Expected For All of 2018
For the first quarter, analysts are expecting companies to report earnings growth of 17.1% and revenue growth of 7.3%. Analysts currently expect earnings to grow at double-digit levels for the remainder 2018.
For Q2 2018, analysts are projecting earnings growth of 19.1% and revenue growth of 7.7%.
For Q3 2018, analysts are projecting earnings growth of 20.9% and revenue growth of 6.4%.
For Q4 2018, analysts are projecting earnings growth of 17.0% and revenue growth of 5.6%.
For all of 2018, analysts are projecting earnings growth of 18.4% and revenue growth of 6.7%.
Valuation: Forward P/E Ratio is 16.5, above the 10-Year Average (14.3)
The forward 12-month P/E ratio is 16.5. This P/E ratio is above the 5-year average of 16.1 and above the 10-year average of 14.3. It is also above the forward 12-month P/E ratio of 16.4 recorded at the start of the second quarter (March 31). Since the start of the second quarter, the price of the index has increased by 0.8%, while the forward 12-month EPS estimate has remained flat (0.0%).
At the sector level, the Consumer Discretionary (19.9) and Energy (19.8) sectors have the highest forward 12-month P/E ratios, while the Telecom Services (10.6) and Financials (13.1) sectors have the lowest forward 12-month P/E ratios. Nine sectors have forward 12-month P/E ratios that are above their 10-year averages, led by the Information Technology (18.0 vs. 14.5) sector. The Telecom Services (10.6 vs. 14.1) sector is the only sector with a forward 12-month P/E ratio below the 10-year average.
Targets & Ratings: Analysts Project 16% Increase in Price Over Next 12 Months
The bottom-up target price for the S&P 500 is 3094.05, which is 16.2% above the closing price of 2662.84. At the sector level, the Health Care (+18.8%), Information Technology (+18.2%), and Energy (+18.0%) sectors are expected to see the largest price increases, as these sectors have the largest upside differences between the bottom-up target price and the closing price. On the other hand, the Utilities (+4.8%) sector is expected to see the smallest price increase, as this sector has the smallest upside difference between the bottom-up target price and the closing price. For more details on target prices, please see pages 5 through 6.
Overall, there are 11,136 ratings on stocks in the S&P 500. Of these 11,136 ratings, 52.6% are Buy ratings, 42.6% are Hold ratings, and 4.8% are Sell ratings. At the sector level, the Information Technology (60%), Energy (59%), and Health Care (59%) sectors have the highest percentages of Buy ratings, while the Telecom Services (35%) and Utilities (41%) sectors have the lowest percentages of Buy ratings.
Companies Reporting Next Week: 7
During the upcoming week, seven S&P 500 companies (including 1 Dow 30 component) are scheduled to report results for the first quarter.

Copyright © 2018 FactSet Research Systems Inc. All rights reserved. FactSet Research Systems Inc. www.factset.com 12
Q1 2018: Scorecard

Copyright © 2018 FactSet Research Systems Inc. All rights reserved. FactSet Research Systems Inc. www.factset.com 13
Q1 2018: Scorecard

Copyright © 2018 FactSet Research Systems Inc. All rights reserved. FactSet Research Systems Inc. www.factset.com 14
Q1 2018: Scorecard

Copyright © 2018 FactSet Research Systems Inc. All rights reserved. FactSet Research Systems Inc. www.factset.com 15
Q1 2018: Scorecard
Copyright © 2018 FactSet Research Systems Inc. All rights reserved. FactSet Research Systems Inc. www.factset.com 16
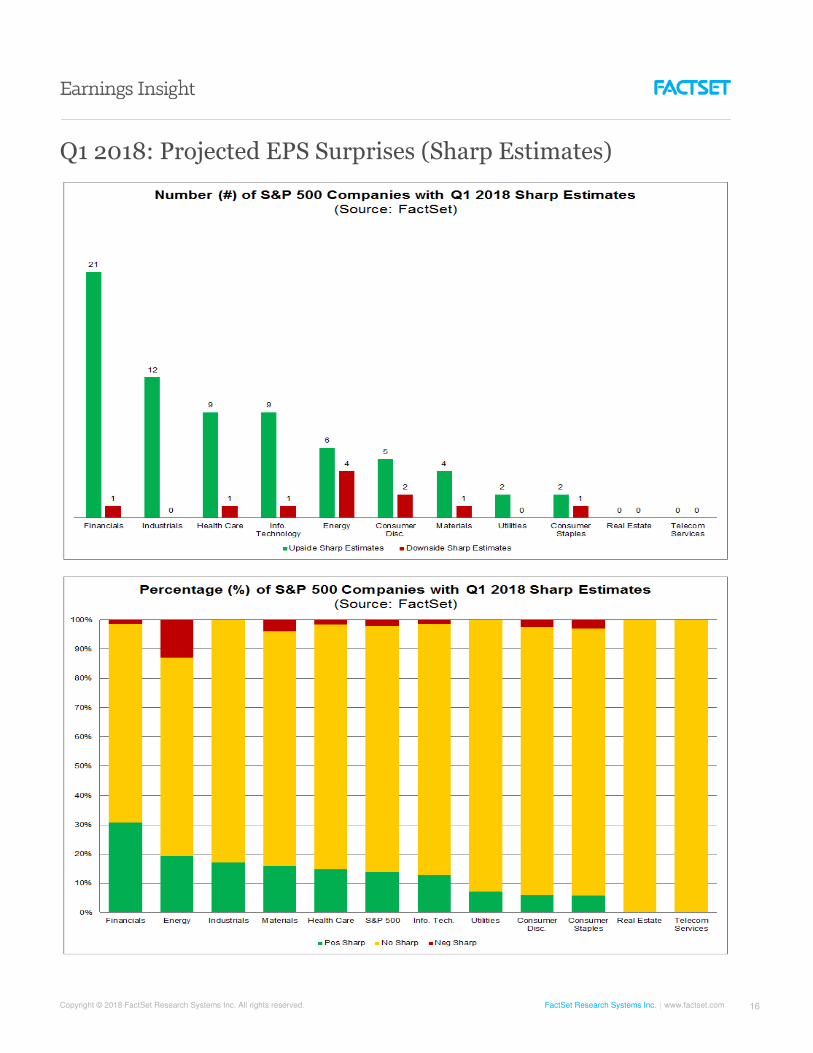
Q1 2018: Projected EPS Surprises (Sharp Estimates)

Copyright © 2018 FactSet Research Systems Inc. All rights reserved. FactSet Research Systems Inc. www.factset.com 17
Q1 2018: Growth

Copyright © 2018 FactSet Research Systems Inc. All rights reserved. FactSet Research Systems Inc. www.factset.com 18
Q1 2018: Net Profit Margin

Copyright © 2018 FactSet Research Systems Inc. All rights reserved. FactSet Research Systems Inc. www.factset.com 19
Q2 2018: Guidance

Copyright © 2018 FactSet Research Systems Inc. All rights reserved. FactSet Research Systems Inc. www.factset.com 20
Q2 2018: EPS Revisions

Copyright © 2018 FactSet Research Systems Inc. All rights reserved. FactSet Research Systems Inc. www.factset.com 21
Q2 2018: Growth

Copyright © 2018 FactSet Research Systems Inc. All rights reserved. FactSet Research Systems Inc. www.factset.com 22
CY 2018: Growth

Copyright © 2018 FactSet Research Systems Inc. All rights reserved. FactSet Research Systems Inc. www.factset.com 23
CY 2019: Growth

Copyright © 2018 FactSet Research Systems Inc. All rights reserved. FactSet Research Systems Inc. www.factset.com 24
Geographic Revenue Exposure

Copyright © 2018 FactSet Research Systems Inc. All rights reserved. FactSet Research Systems Inc. www.factset.com 25
Bottom-up EPS Estimates: Revisions

Copyright © 2018 FactSet Research Systems Inc. All rights reserved. FactSet Research Systems Inc. www.factset.com 26
Bottom-up EPS Estimates: Current & Historical

Copyright © 2018 FactSet Research Systems Inc. All rights reserved. FactSet Research Systems Inc. www.factset.com 27
Forward 12M P/E Ratio: Sector Level

Copyright © 2018 FactSet Research Systems Inc. All rights reserved. FactSet Research Systems Inc. www.factset.com 28
Forward 12M P/E Ratio: Long-Term Averages

Copyright © 2018 FactSet Research Systems Inc. All rights reserved. FactSet Research Systems Inc. www.factset.com 29
Trailing 12M P/E Ratio: Long-Term Averages

Copyright © 2018 FactSet Research Systems Inc. All rights reserved. FactSet Research Systems Inc. www.factset.com 30
Targets & Ratings
Copyright © 2018 FactSet Research Systems Inc. All rights reserved. FactSet Research Systems Inc. www.factset.com 31
Important Notice
The information contained in this report is provided “as is” and all representations, warranties, terms and conditions, oral or written, express or implied (by common law, statute or otherwise), in relation to the information are hereby excluded and disclaimed to the fullest extent permitted by law. In particular, FactSet, its affiliates and its suppliers disclaim implied warranties of merchantability and fitness for a particular purpose and make no warranty of accuracy, completeness or reliability of the information. This report is for informational purposes and does not constitute a solicitation or an offer to buy or sell any securities mentioned within it. The information in this report is not investment advice. FactSet, its affiliates and its suppliers assume no liability for any consequence relating directly or indirectly to any action or inaction taken based on the information contained in this report.
FactSet aggregates and redistributes estimates data and does not conduct any independent research. Nothing in our service constitutes investment advice or FactSet recommendations of any kind. Estimates data is provided for information purposes only.
FactSet has no relationship with creators of estimates that may reasonably be expected to impair its objective presentation of such estimate or recommendation. FactSet redistributes estimates as promptly as reasonably practicable from research providers.
About FactSet
FactSet (NYSE:FDS | NASDAQ:FDS) delivers superior analytics, service, content, and technology to help more than 66,000 users see and seize opportunity sooner. We are committed to giving investment professionals the edge to outperform, with fresh perspectives, informed insights, and the industry-leading support of our dedicated specialists. We're proud to have been recognized with multiple awards for our analytical and data-driven solutions and repeatedly ranked as one of Fortune's 100 Best Companies to Work For and a Best Workplace in the United Kingdom and France. Subscribe to our thought leadership blog to get fresh insight delivered daily at insight.factset.com. Learn more at www.factset.com and follow on Twitter: www.twitter.com/factset.