E DOI10.1186/13007-017-0191-5 et al. Plant Methods 2 …gmail.com...
13
Eissa et al. Plant Methods (2017) 13:41 DOI 10.1186/s13007-017-0191-5 RESEARCH Developing transgenic wheat to encounter rusts and powdery mildew by overexpressing barley chi26 gene for fungal resistance Hala F. Eissa 1,2* , Sameh E. Hassanien 1 , Ahmed M. Ramadan 1,3 , Moustafa M. El‑Shamy 4 , Osama M. Saleh 5,6 , Ahmed M. Shokry 1 , Mohamed Abdelsattar 1 , Yasser B. Morsy 1 , Maher A. El‑Maghraby 7 , Hussien F. Alameldin 1,8 , Sabah M. Hassan 3,9 , Gamal H. Osman 1,10* , Hesham T. Mahfouz 11 , Gharib A. Gad El‑Karim 1 , Magdy A. Madkour 12 and Ahmed Bahieldin 3,9* Abstract Background: The main aim of this study was to improve fungal resistance in bread wheat via transgenesis. Trans‑ genic wheat plants harboring barley chitinase (chi26) gene, driven by maize ubi promoter, were obtained using biolistic bombardment, whereas the herbicide resistance gene, bar, driven by the CaMV 35S promoter was used as a selectable marker. Results: Molecular analysis confirmed the integration, copy number, and the level of expression of the chi26 gene in four independent transgenic events. Chitinase enzyme activity was detected using a standard enzymatic assay. The expression levels of chi26 gene in the different transgenic lines, compared to their respective controls, were deter‑ mined using qRT‑PCR. The transgene was silenced in some transgenic families across generations. Gene silencing in the present study seemed to be random and irreversible. The homozygous transgenic plants of T4, T5, T6, T8, and T9 generations were tested in the field for five growing seasons to evaluate their resistance against rusts and powdery mildew. The results indicated high chitinase activity at T0 and high transgene expression levels in few transgenic fami‑ lies. This resulted in high resistance against wheat rusts and powdery mildew under field conditions. It was indicated by proximate and chemical analyses that one of the transgenic families and the non‑transgenic line were substantially equivalent. Conclusion: Transgenic wheat with barley chi26 was found to be resistant even after five generations under artificial fungal infection conditions. One transgenic line was proved to be substantially equivalent as compared to the non‑ transgenic control. Keywords: Transgenesis, Southern, qPCR, Chitinase activity, qRT‑PCR, Substantial equivalence © The Author(s) 2017. This article is distributed under the terms of the Creative Commons Attribution 4.0 International License (http://creativecommons.org/licenses/by/4.0/), which permits unrestricted use, distribution, and reproduction in any medium, provided you give appropriate credit to the original author(s) and the source, provide a link to the Creative Commons license, and indicate if changes were made. The Creative Commons Public Domain Dedication waiver (http://creativecommons.org/ publicdomain/zero/1.0/) applies to the data made available in this article, unless otherwise stated. Open Access Plant Methods *Correspondence: [email protected]; [email protected]; [email protected] 1 Agricultural Genetic Engineering Research Institute (AGERI), Agriculture Research Center (ARC), Giza 12619, Egypt 3 Department of Biological Sciences, Faculty of Science, King Abdulaziz University, P.O. Box 80141, Jeddah 21589, Saudi Arabia 10 Department of Biology, Faculty of Applied Sciences, Umm Al‑Qura University, Makkah 21955, Saudi Arabia Full list of author information is available at the end of the article
-
Upload
nguyenkhue -
Category
Documents
-
view
215 -
download
0
Transcript of E DOI10.1186/13007-017-0191-5 et al. Plant Methods 2 …gmail.com...
Eissa et al. Plant Methods (2017) 13:41 DOI 10.1186/s13007-017-0191-5
RESEARCH
Developing transgenic wheat to encounter rusts and powdery mildew by overexpressing barley chi26 gene for fungal resistanceHala F. Eissa1,2*, Sameh E. Hassanien1, Ahmed M. Ramadan1,3, Moustafa M. El‑Shamy4, Osama M. Saleh5,6, Ahmed M. Shokry1, Mohamed Abdelsattar1, Yasser B. Morsy1, Maher A. El‑Maghraby7, Hussien F. Alameldin1,8, Sabah M. Hassan3,9, Gamal H. Osman1,10*, Hesham T. Mahfouz11, Gharib A. Gad El‑Karim1, Magdy A. Madkour12 and Ahmed Bahieldin3,9*
Abstract
Background: The main aim of this study was to improve fungal resistance in bread wheat via transgenesis. Trans‑genic wheat plants harboring barley chitinase (chi26) gene, driven by maize ubi promoter, were obtained using biolistic bombardment, whereas the herbicide resistance gene, bar, driven by the CaMV 35S promoter was used as a selectable marker.
Results: Molecular analysis confirmed the integration, copy number, and the level of expression of the chi26 gene in four independent transgenic events. Chitinase enzyme activity was detected using a standard enzymatic assay. The expression levels of chi26 gene in the different transgenic lines, compared to their respective controls, were deter‑mined using qRT‑PCR. The transgene was silenced in some transgenic families across generations. Gene silencing in the present study seemed to be random and irreversible. The homozygous transgenic plants of T4, T5, T6, T8, and T9 generations were tested in the field for five growing seasons to evaluate their resistance against rusts and powdery mildew. The results indicated high chitinase activity at T0 and high transgene expression levels in few transgenic fami‑lies. This resulted in high resistance against wheat rusts and powdery mildew under field conditions. It was indicated by proximate and chemical analyses that one of the transgenic families and the non‑transgenic line were substantially equivalent.
Conclusion: Transgenic wheat with barley chi26 was found to be resistant even after five generations under artificial fungal infection conditions. One transgenic line was proved to be substantially equivalent as compared to the non‑transgenic control.
Keywords: Transgenesis, Southern, qPCR, Chitinase activity, qRT‑PCR, Substantial equivalence
© The Author(s) 2017. This article is distributed under the terms of the Creative Commons Attribution 4.0 International License (http://creativecommons.org/licenses/by/4.0/), which permits unrestricted use, distribution, and reproduction in any medium, provided you give appropriate credit to the original author(s) and the source, provide a link to the Creative Commons license, and indicate if changes were made. The Creative Commons Public Domain Dedication waiver (http://creativecommons.org/publicdomain/zero/1.0/) applies to the data made available in this article, unless otherwise stated.
Open Access
Plant Methods
*Correspondence: [email protected]; [email protected]; [email protected] 1 Agricultural Genetic Engineering Research Institute (AGERI), Agriculture Research Center (ARC), Giza 12619, Egypt3 Department of Biological Sciences, Faculty of Science, King Abdulaziz University, P.O. Box 80141, Jeddah 21589, Saudi Arabia10 Department of Biology, Faculty of Applied Sciences, Umm Al‑Qura University, Makkah 21955, Saudi ArabiaFull list of author information is available at the end of the article

Page 2 of 13Eissa et al. Plant Methods (2017) 13:41
BackgroundWheat, rice, and maize are the most important food crops, as they contribute to 60% of the food consumed in the world [1]. Food security depends upon our ability to increase the production of cereals concomitant with the growing population [2]. Rust diseases, including leaf rust (Puccinia recondite Eriks), yellow or stripe rust (Puccinia striiformis Westend), and stem rust (Puccinia graminis Pers.: Pers) are the most important foliar diseases in wheat [3], causing yield losses of up to 20% [4]. Plants respond to fungal infection by complex mechanisms. The production of pathogenesis-related (PR) proteins [5–7], such as chitinase and β-1,3-glucanase, is one of the most effective strategies involved in plant immune response [8]. Chitinase (poly[1,4-N-acetyl-β-d-glucosamine] gly-can hydrolase, EC 3.2.1.14) catalyzes the hydrolysis of β1-4-linkages of N-acetylglucosamine of chitin result-ing in N-acetyl glucosamine oligomers [9]. Chitin is the major component of fungal cell walls [9]; therefore, the ability of chitinase to hydrolyze fungal cell wall can be employed to inhibit the growth of fungal hyphal tips [10, 11]. Resistant wheat cultivars can be obtained via genetic transformation, and deployed to reduce yield losses and protect seed quality deteriorated by rust and powdery mildew diseases. Molecular breeding and transgenesis are two main approaches of developing disease resist-ant crops [12]. The expression of chitinase gene has been found to enhance the resistance against fungal diseases in many plant species via genetic transformation, for instance, the expression of a class II chitinase in Bras-sica juncea could successfully provide protection against Alternaria leaf spot disease [13]. A high chitinase activ-ity along with improved β-1,3-glucanase activity in trans-genic grapevines enhanced the resistance against downy mildew [14]. The introduction of rice chitinase (RC7) in Indica rice bestowed considerable resistance against sheath blight [15]. The AFP-CHI transgenic oriental
melons could resist the infection of Rhizoctonia solani and Fusarium oxysporum [16]. Earlier studies in wheat indicated that the constitutive expression of class II bar-ley chitinase could enhance resistance against Erysiphe graminis [17] and Fusarium graminearum [18, 19]. The aim of the present work was to evaluate transgenic wheat lines, harboring the barley chi26 gene for resistance against rust and powdery mildew diseases. The T4, T5, T6, T8, and T9 generations of the four transgenic lines were assayed using artificial infection in the field over five growing seasons. The most promising transgenic family was analyzed in contrast to the non-transgenic controls to substantiate the resistance.
MethodsGenetic transformationThe plasmid pBarley/chi/bar (Fig. 1) harboring the full-length barley chi26 and bar genes [20] was used to transform immature embryos of bread wheat (Triticum aestivum L.) cv. Hi-Line. The tissue culture and trans-formation were carried out as reported previously by Sivamani et al. [21]. The obtained primary transformants were transferred to the biocontainment facility at Agri-cultural Genetic Engineering Research Institute (AGERI), Agriculture Research Center (ARC), Giza, Ministry of Agriculture, Egypt, and assayed using leaf painting with 1 g/L of Basta™ (Bayer Crop Science PVT Ltd). Biosafety measures and guidelines were followed across the nine growing and testing seasons of the transgenic lines and their families.
Polymerase chain reaction (PCR)Genomic DNA was extracted from putative transgenic plants, which were resistant to the herbicide Basta™, and the non-transgenic (cv. Hi-Line) control, using the DNeasy™ Plant Mini kit (Qiagen, cat no. 69104). Using PCR, chi26 (800 bp) as well as bar (485 bp) gene
Probe (~2 kb)
Genomic DNA digeson sites
934 bpHigh-molecular-weight DNA fragments with variable sizes
Fig. 1 Restriction map of the plant expression vector pBarley/chi/bar. H, HindIII; B, BamHI; E, EcoRI; N, NcoI. Sites of probe and genomic DNA diges‑tions are indicated by red solid and/or dotted lines

Page 3 of 13Eissa et al. Plant Methods (2017) 13:41
fragments were amplified using gene-specific prim-ers (Additional file 1: Table S1). The reaction conditions were optimized in a mixture (50 μL total volume) com-posed of dNTPs (0.2 mM), MgCl2 (1.5 mM), 1× buffer, primers (0.2 μM), template DNA (100 ng), and Taq DNA polymerase (2 units). The amplification was carried out in a Hybaid PCR Express system. The system was pro-grammed for 40 cycles as follows: 94 °C for 4 min (1 cycle); 94 °C for 1 min, 58 °C for 1 min (for chi26 gene) or 55 °C for 1 min (for bar gene), 72 °C for 2 min (38 cycles); 72 °C for 8 min (1 cycle); 4 °C (overnight). The amplified products were resolved on an agarose gel (1.2%). Quick-Load 100 bp DNA ladder (New England Biolabs) was used as a DNA standard. Electrophoresis was performed at 80 V and DNA bands were visualized on a UV-transil-luminator and documented by a digital camera.
Southern blot hybridizationSouthern hybridization was performed as described by Sambrook et al. [22] using 32P random labeling method for the four selected transgenic lines (CHI 7, CHI 14, CHI 47, and CHI 71) at T0 generation and for the non-trans-genic parent (cv. Hi-Line). The genomic DNA of each line (30 µg) was digested with NcoI so that a fragment of the plasmid with 934 bp, a high-molecular-weight (HMW) fragment including a portion of the plasmid, and a por-tion of the genomic DNA with unknown sizes based on the location of the insertion (Fig. 1) could be obtained. After this, the digested DNA preparations of differ-ent transgenic lines were analyzed by 0.8% agarose gel electrophoresis. The blot was probed with the BamHI fragment of pBarley/chi/bar containing the maize ubi promoter and ubi intron1 (~2 kb) (Fig. 1).
qPCRIn order to detect chi26 gene copy number in different transgenic lines, qPCR was carried on the leaf samples of 6-week-old T0 plantlets. The following standard equation was used to determine the number of chi26 transgene copies in wheat haploid genome per microliter:
The genomic DNA samples were serially diluted to obtain the final quantity as 186, 93 and 18.6 ng, which were equal to 10,000, 5000 and 1000 haploid genomes/μL, respectively. qPCR was performed using 1000 copy number (18.6 ng) to be considered in the standard curve. The same quantification equation was used to gener-ate standard curves for the absolute quantification of chi26 transgene. The pBarley/chi/bar DNA was serially
No. copies (genomes/µL) =DNAconcentration (g/L)
Molecular weight (g/mol)
× Avogadro’s no.× 10−6
diluted to obtain the final quantity as 8.6, 0.86, 0.086 and 0.0086 ng, which were equal to 100,000, 10,000, 1000 and 100 copies/μL, respectively. All qPCRs were performed in triplets by using the gene-specific primers. The final reaction volume was 20 µL containing 1 µL DNA, 10 µL of 2× Fast SYBR Green Master Mix (Life technologies, USA), and 1 µL of 500 nM of each primer. The reactions were carried out on an Mx3005P qPCR System (Strata-gene), employing following conditions: 10 min at 95 °C, 40 cycles of 30 s at 95 °C, 60 s at 60 °C, 20 s at 72 °C and 10 min at 72 °C. The optimal threshold lines were auto-matically determined by Mx3005p software (Agilent Technologies, Santa Clara, CA). The efficiencies of qPCR for each gene were determined by the following equation (E = (10−1/m − 1) × 100) according to Radonić et al. [23], where E is the PCR efficiency; m is the slope of the log-transformed DNA quantities versus Ct values accord-ing to the equation (y (Ct) = m log(x) + b (y-intercept)). Standard deviation (SD) and coefficient of variance (CV) were estimated in MS Excel.
Chitinase enzyme assayChitinase enzyme assay was performed to compare the enzyme activities in different T0 transgenic lines with that of non-transgenic parental line (cv. Hi-Line) that was recovered from tissue culture with growth condi-tions similar to those used to generate different trans-genic lines. Total proteins were extracted from leaf tissues (0.5 g), and protein concentrations were meas-ured according to Bradford method [24]. The chitinase enzyme assay is based on a colorimetric method [25] where colloidal chitin is used as a substrate. The sub-strate was prepared from crab shell chitin (Sigma) [26] and N-acetylglucosamine (GlcNAc) was used as the standard. The enzyme activity is defined as µmol Glc-NAc min−1 mg−1 protein at 37 °C. Standard error (SE) was determined of three replicates using MS Excel.
qRT‑PCRTotal RNA was extracted from leaf tissues of selected transgenic lines at T0 and their families using TRIZOL reagent (Invitrogen, cat. 15596–018). The extracted RNA samples were treated with DNase IRQ1 RNase-free DNase (Promega, cat. no. M6101) to remove genomic DNA contamination. The expression of the integrated transgene was tested from the extracted RNA in the T0 transgenic lines that showed positive results of Basta™ resistance and expected PCR outcome. The expres-sion of chi26 gene was also tested for transgenic lines for T3–T9 generations. For each sample, 2 µg of total RNA was used to synthesize first strand cDNA with oligo(dT) using Revert Aid Premium Reverse Tran-scriptase (Thermo Scientific™ cat. no. EP0451), and chi26

Page 4 of 13Eissa et al. Plant Methods (2017) 13:41
gene-specific primers (designed by GenScript Real-time PCR Primer Design, www.genscript.com/ssl-bin/app/primer) (Additional file 2: Table S2). The templates were normalized to amplify a 196-bp fragment using actin gene primers (Additional file 2: Table S2) for the wheat actin (AY663392) gene, which was used as the internal reference qRT-PCR was done in a total volume of 25-µL, which contained 1 µL cDNA, 12.5 µL 2× BIO-RAD iQTMSYBR®GreenSupermix, 0.75 μL ROX reference dye (1:500 diluted), and 1 µL 500 nM of each primer. All reac-tions were performed in triplicate. An Mx3005P qPCR System (Stratagene) was used with following reaction conditions: 5 min at 95 °C, 40 cycles of 30 s at 95 °C, 60 s at 60 °C, 20 s at 72 °C and 10 min at 72 °C. PCR prod-ucts were examined by melt curve analysis. The actin expression level was quantified in each of the transgenic events and families as well as in the non-transgenic par-ents as the reference house-keeping gene. The amplicons obtained from the actin gene attained saturation between 18 and 22 cycles. The expression level of chi26 gene rela-tive to the actin gene was calculated using MxPro QPCR Software v4.10 package, which compares reaction takeoff points (cycle number). Relative mRNA abundance in each transgenic line was compared to the non-transgenic line (cv. Hi-Line) using the comparative Ct (2−ΔΔCt) method [27] with following equation: relative fold change in gene expression = 2−ΔΔCt, where ΔΔCt = ΔCt transgenic − ΔCtnon-transgenic, and ΔCt = Ct target gene − Ct reference gene.
Data were statistically analyzed using the analysis of variance (ANOVA) via MSTATC program and multiple comparisons were made following Duncan’s Multiple Range test [28].
Field evaluationFive field experiments were conducted over five growing seasons (2009–2010, 2010–2011, 2011–2012, 2013–2014, and 2014–2015) to evaluate the transgenic wheat fami-lies at T4, T5, T6, T8 and T9 generations, respectively. These transgenic families harbor the barley chi26 gene conferring resistance against wheat rusts, i.e., leaf rust (Puccinia recondita), stem rust (Puccinia graminis), yel-low rust (Puccinia striiformis) and powdery mildew (Blumeria graminis). The experimental field (Gemmiza Research Station, Gharbia Governorate, Egypt, Latitude 30°47′21.98″, Longitude 31°7′33.97″) was located at a place with suitable environmental conditions in terms of temperature and humidity for the infection of the fungi. The field was surrounded by a border of a mix-ture of highly susceptible genotypes to wheat rusts and powdery mildew, i.e., Giza 160, Morocco and Triticum spelta. At booting stage, the transgenic plants were arti-ficially exposed to an inoculum containing the mixture of the highest virulent isolates of powdery mildew, leaf,
yellow, and stem rust pathotypes [29] to ensure early epidemic by rusts. The disease severity of leaf rust was scored according to the scale described by Peterson et al. [30] (where 0 = no infection, R = resistant, Tr = traces, MR = moderately resistant, MS = moderately sus-ceptible and S = susceptible) with different intensities (5–100). In a similar vein, the disease severity of powdery mildew was recorded according to the scale described by Leath and Heun [31] (where 0 = immune, no vis-ible signs or symptoms; 1 = highly resistant, small flecks only; 2 = resistant, chlorotic flecks evident; 3 = resistant, large flecks with chlorosis and necrosis; 4 = intermedi-ate, mycelium and conidia barely detectable; 5 = moder-ately susceptible, small to moderate-sized pustules and conidia present; 6 = moderately susceptible, predomi-nance of moderate-sized pustules and conidia present; 7 = susceptible, at least 50% of the leaf covered with large pustules and conidia; 8 = susceptible, 75–80% of the leaf covered with large pustules and conidia; and 9 = suscep-tible, 100% of the leaf segment covered with large pus-tules and conidia). A randomized complete block design with three replicates was applied for all the experiments. However, the experiments were different on the grounds of the availability of plant materials and the selection for the stable and more resistant transgenics. During the cultivation season of 2009–2010, twenty seeds each of 33 transgenic T4 families as well as the non-transgenic parental line (cv. Hi-Line) were planted in rows (40 cm apart), 1 m each. During the cultivation season of 2010–2011, transgenic families as well as the non-transgenic cv. Hi-Line were sown in plots (1.2 × 3.0 m) consisting of six rows. The seeds of selected single plants were sown in each plot in five replicates. The seeds of transgenic wheat families of subsequent generations during the following seasons were sown in plots (20 m × 2.4 m) as a demon-stration experiment in five replicates. The seeds were sown at the rate of 123 kg/Ha as adopted by the National Wheat program in Egypt and all the standard agricultural practices were properly followed.
In silico transgene toxicity and computational analysesThe protein sequences of the inserted genes) i.e., chi26 and bar) in transgenic family CHI 14/6 were aligned to the toxicity database (Toxin and Toxin Target Database, T3DB, www.t3db.org) and to the structural database of allergenic proteins (SDAP, http://fermi.utmb.edu/cgi-bin/SDAP/sdap_14). The same transgenic family was selected for compositional analysis as compared to the non-trans-genic cv. Hi-Line. Other analyses were carried out at the Regional Center for Food and Feed (RCFF), Agriculture Research Center (ARC), Giza, Egypt. Proximate com-positions, such as moisture, energy, crude fiber, crude protein, crude fat, and ash content, of the investigated
Page 5 of 13Eissa et al. Plant Methods (2017) 13:41
whole-wheat flour samples were carried out according to the AOAC (2006). The vitamin contents were deter-mined using HPLC (Danish Official, HPLC method No. AB 189.2 (1996), National food Agency of Denmark). The official method of analysis of AOAC International no. 969.33, Chapter 41, P. 19–20, 18th ed. (2006) was used to analyze the fatty acid compositions. The amino acid con-tents were analyzed using the official methods of analysis of AOAC International no. 994.12, Chapter 4, pp. 17–19, 18th Edition (2005).
ResultsWheat transformation and recovery of transgenic familiesThe plant expression vector pBarley/chi/bar (Fig. 1) containing the barley chi26 gene was transfected to the immature embryos of wheat cultivar Hi-Line by particle bombarding. Putative transgenics were screened using the herbicide Basta (1 g/L). Of the 72 transgenic lines, 14 were identified and their transgenic seeds were planted individually to obtain T1 generation. An offspring gen-erated from a seed was considered a separate transgenic family. To facilitate the tracing of the different transgenic families across generations, nomenclature starting at the T1 generation was employed by adding new number to the original T0 identifier, e.g., CHI 14/6 refers to the T1 plant no. 6 generated from T1 seed no. 6 of the original
transgenic line CHI 14. The plants obtained indifferent generations were allowed only to self pollinate.
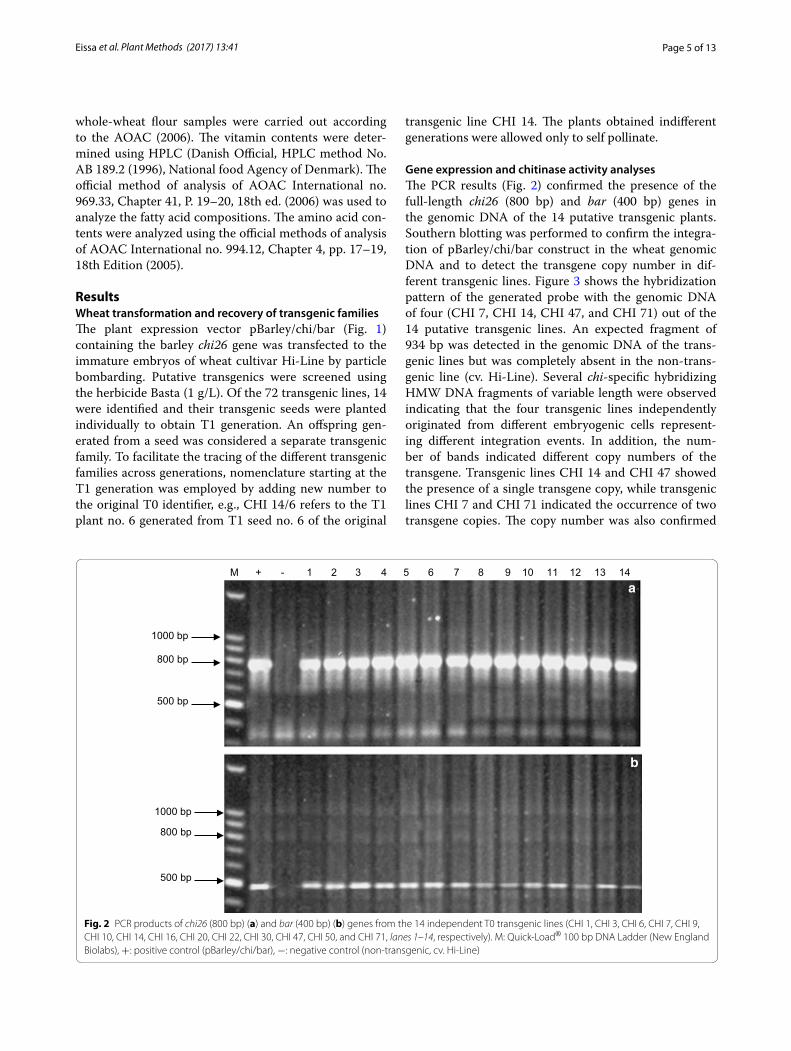
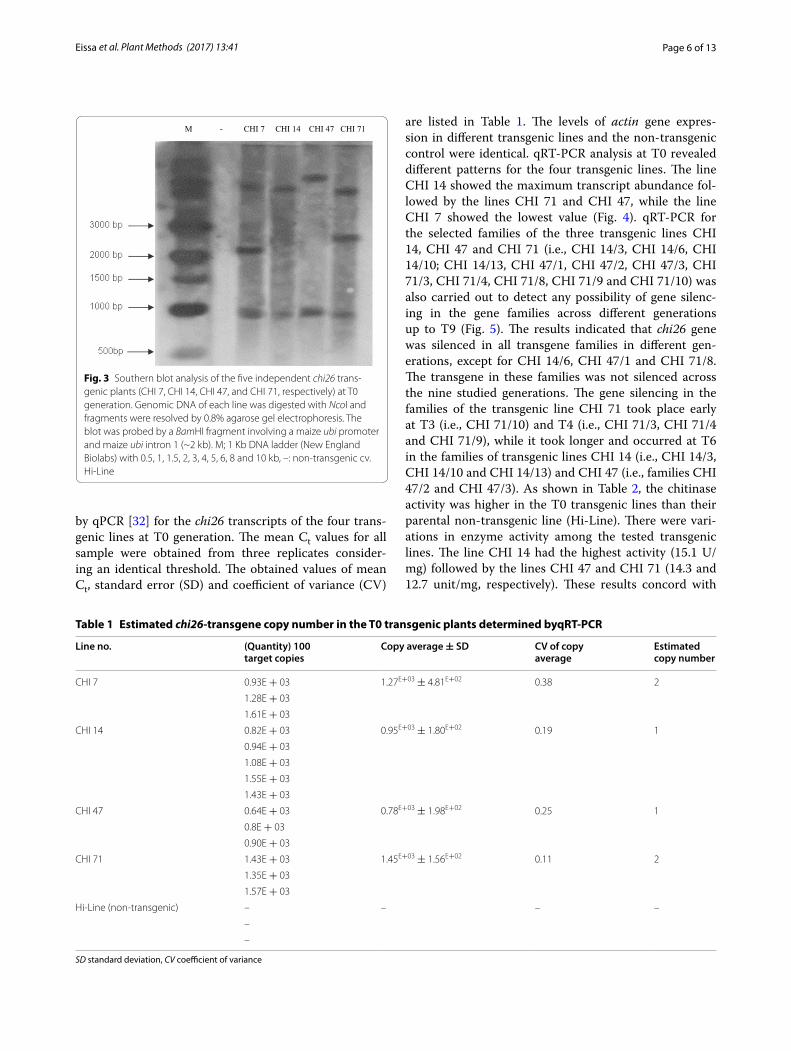
Gene expression and chitinase activity analysesThe PCR results (Fig. 2) confirmed the presence of the full-length chi26 (800 bp) and bar (400 bp) genes in the genomic DNA of the 14 putative transgenic plants. Southern blotting was performed to confirm the integra-tion of pBarley/chi/bar construct in the wheat genomic DNA and to detect the transgene copy number in dif-ferent transgenic lines. Figure 3 shows the hybridization pattern of the generated probe with the genomic DNA of four (CHI 7, CHI 14, CHI 47, and CHI 71) out of the 14 putative transgenic lines. An expected fragment of 934 bp was detected in the genomic DNA of the trans-genic lines but was completely absent in the non-trans-genic line (cv. Hi-Line). Several chi-specific hybridizing HMW DNA fragments of variable length were observed indicating that the four transgenic lines independently originated from different embryogenic cells represent-ing different integration events. In addition, the num-ber of bands indicated different copy numbers of the transgene. Transgenic lines CHI 14 and CHI 47 showed the presence of a single transgene copy, while transgenic lines CHI 7 and CHI 71 indicated the occurrence of two transgene copies. The copy number was also confirmed
M + - 1 2 3 4 5 6 7 8 9 10 11 12 13 14
1000 bp
800 bp
500 bp
1000 bp
800 bp
500 bp
a
b
Fig. 2 PCR products of chi26 (800 bp) (a) and bar (400 bp) (b) genes from the 14 independent T0 transgenic lines (CHI 1, CHI 3, CHI 6, CHI 7, CHI 9, CHI 10, CHI 14, CHI 16, CHI 20, CHI 22, CHI 30, CHI 47, CHI 50, and CHI 71, lanes 1–14, respectively). M: Quick‑Load® 100 bp DNA Ladder (New England Biolabs), +: positive control (pBarley/chi/bar), −: negative control (non‑transgenic, cv. Hi‑Line)
Page 6 of 13Eissa et al. Plant Methods (2017) 13:41
by qPCR [32] for the chi26 transcripts of the four trans-genic lines at T0 generation. The mean Ct values for all sample were obtained from three replicates consider-ing an identical threshold. The obtained values of mean Ct, standard error (SD) and coefficient of variance (CV)
are listed in Table 1. The levels of actin gene expres-sion in different transgenic lines and the non-transgenic control were identical. qRT-PCR analysis at T0 revealed different patterns for the four transgenic lines. The line CHI 14 showed the maximum transcript abundance fol-lowed by the lines CHI 71 and CHI 47, while the line CHI 7 showed the lowest value (Fig. 4). qRT-PCR for the selected families of the three transgenic lines CHI 14, CHI 47 and CHI 71 (i.e., CHI 14/3, CHI 14/6, CHI 14/10; CHI 14/13, CHI 47/1, CHI 47/2, CHI 47/3, CHI 71/3, CHI 71/4, CHI 71/8, CHI 71/9 and CHI 71/10) was also carried out to detect any possibility of gene silenc-ing in the gene families across different generations up to T9 (Fig. 5). The results indicated that chi26 gene was silenced in all transgene families in different gen-erations, except for CHI 14/6, CHI 47/1 and CHI 71/8. The transgene in these families was not silenced across the nine studied generations. The gene silencing in the families of the transgenic line CHI 71 took place early at T3 (i.e., CHI 71/10) and T4 (i.e., CHI 71/3, CHI 71/4 and CHI 71/9), while it took longer and occurred at T6 in the families of transgenic lines CHI 14 (i.e., CHI 14/3, CHI 14/10 and CHI 14/13) and CHI 47 (i.e., families CHI 47/2 and CHI 47/3). As shown in Table 2, the chitinase activity was higher in the T0 transgenic lines than their parental non-transgenic line (Hi-Line). There were vari-ations in enzyme activity among the tested transgenic lines. The line CHI 14 had the highest activity (15.1 U/mg) followed by the lines CHI 47 and CHI 71 (14.3 and 12.7 unit/mg, respectively). These results concord with
M - CHI 7 CHI 14 CHI 47 CHI 71
Fig. 3 Southern blot analysis of the five independent chi26 trans‑genic plants (CHI 7, CHI 14, CHI 47, and CHI 71, respectively) at T0 generation. Genomic DNA of each line was digested with NcoI and fragments were resolved by 0.8% agarose gel electrophoresis. The blot was probed by a BamHI fragment involving a maize ubi promoter and maize ubi intron 1 (~2 kb). M; 1 Kb DNA ladder (New England Biolabs) with 0.5, 1, 1.5, 2, 3, 4, 5, 6, 8 and 10 kb, –: non‑transgenic cv. Hi‑Line
Table 1 Estimated chi26-transgene copy number in the T0 transgenic plants determined byqRT-PCR
SD standard deviation, CV coefficient of variance
Line no. (Quantity) 100 target copies
Copy average ± SD CV of copy average
Estimated copy number
CHI 7 0.93E + 03 1.27E+03 ± 4.81E+02 0.38 2
1.28E + 03
1.61E + 03
CHI 14 0.82E + 03 0.95E+03 ± 1.80E+02 0.19 1
0.94E + 03
1.08E + 03
1.55E + 03
1.43E + 03
CHI 47 0.64E + 03 0.78E+03 ± 1.98E+02 0.25 1
0.8E + 03
0.90E + 03
CHI 71 1.43E + 03 1.45E+03 ± 1.56E+02 0.11 2
1.35E + 03
1.57E + 03
Hi‑Line (non‑transgenic) – – – –
–
–

Page 7 of 13Eissa et al. Plant Methods (2017) 13:41
those of qRT-PCR for chi26 transcript abundance (Fig. 4) in different transgenic lines.
Field evaluation of rusts and powdery mildew disease resistanceThe resistance of the selected transgenic wheat fami-lies against two wheat rusts, leaf rust (Puccinia recon-dita) and yellow rust(Puccinia striiformis), and powdery mildew (Blumeria graminis), was evaluated in five field experiments through five growing seasons (2009–2010, 2010–2011, 2011–2012, 2013–2014 and 2014–2015) at
Gemmiza Research Station, Egypt. As shown in Table 3, the degree of resistance varied among the transgenic families against the combined infection of the three fungi across different seasons. In addition, the resistance level against different fungi in a given generation varied among the families of the same transgenic event. During cultivation season of 2009–2010, 25 CHI families belong-ing to four independent homozygous transgenic lines (CHI 7, CHI 14, CHI 47 and CHI 71) were evaluated. In this season, the environmental conditions at Gemmiza station were not suitable for the growth of yellow rust, as there were no yellow rust symptoms on the cultivars grown on the susceptible border, but the conditions were optimal for leaf rust and powdery mildew infections. All the families of transgenic line CHI 14 were considerably resistant to leaf rust and powdery mildew infections. In contrast, all the families of line CHI 7 were susceptible to the infection of leaf rust and powdery mildew; these line, therefore, were not proceeded to field testing for further generations. Three families of line 47 (CHI 47/1, CHI 47/2, and CHI 47/3) and one family of line CHI 71 (CHI 71/8) were resistant to leaf rust and powdery mil-dew both (Table 3). The other families of the line CHI 47 were highly susceptible to the two fungi, so were excluded from field testing in further generations. The families of line CHI 71 ranged from being moderately resistant to highly susceptible to leaf rust and being sus-ceptible to highly susceptible to powdery mildew, during this and the following four seasons. The highly suscepti-ble family CHI 71/10 was used in field-testing for further generations, as a chi26 non-expressing transgenic family in addition to the wild type. The data recorded during the 2010–2011 season for the selected 12 transgenic families were similar to those obtained in the first season against the two fungi. The resistance levels against yellow rust were parallel to those were against leaf rust. In the sea-son 2011–2012, high susceptibility against the three fungi started to arise in the five (CHI 14/3, CHI 14/10, CHI 14/13, CHI 47/2 and CHI 47/3) of the eight resistant fam-ilies. The results obtained during the seasons 2013–2014
0
2
4
6
8
10
12
CHI 7 CHI 14 CHI 47 CHI 71
Rela
�ve
abun
danc
e (L
og2 R
Q)
Transgenic eventFig. 4 qRT‑PCR analysis of relative transcript abundance of chi26 transgene in transgenic wheat lines (CHI 7, CHI 14, CHI 47 and CHI 71) at T0 generation. Data were statistically analyzed and multiple com‑parisons were made following Duncan’s multiple range test [28]
0
2
4
6
8
10
12
T3 T4 T5 T6 T8 T9
Rela
�ve
abun
danc
e (L
og2
RQ)
Genera�on
14/3 14/6 14/10 14/13 47/1 47/247/3 71/3 71/4 71/8 71/9 71/10
Fig. 5 qRT‑PCR analysis of relative transcript abundance of chi26 transgene in T3–T9 transgenic wheat families (CHI 14/3, CHI 14/6, CHI 14/10, CHI 14/13, CHI 47/1, CHI 47/2, CHI 47/3, CHI 71/3, CHI 71/4, CHI 71/8, CHI 71/9 and CHI 71/10) belonging to three transgenic lines CHI 14 (filled circles), CHI 47 (filled triangles) and CHI 71 (filled diamonds). Data were statistically analyzed and multiple comparisons were made following Duncan’s multiple range test [28]
Table 2 Mean chitinase activity in T0 transgenic wheat plants with barley chi26 gene
The values are expressed as mean ± standard error (SE) of three technical replicates
Transgenic line Mean chitinase activity (U/mg of protein) ± SE
CHI 7 3.7 ± 0.5
CHI 14 15.1 ± 1.6
CHI 47 14.3 ± 0.8
CHI 71 12.7 ± 1.8
Hi‑Line (non‑transgenic) 3.0 ± 0.75
Page 8 of 13Eissa et al. Plant Methods (2017) 13:41
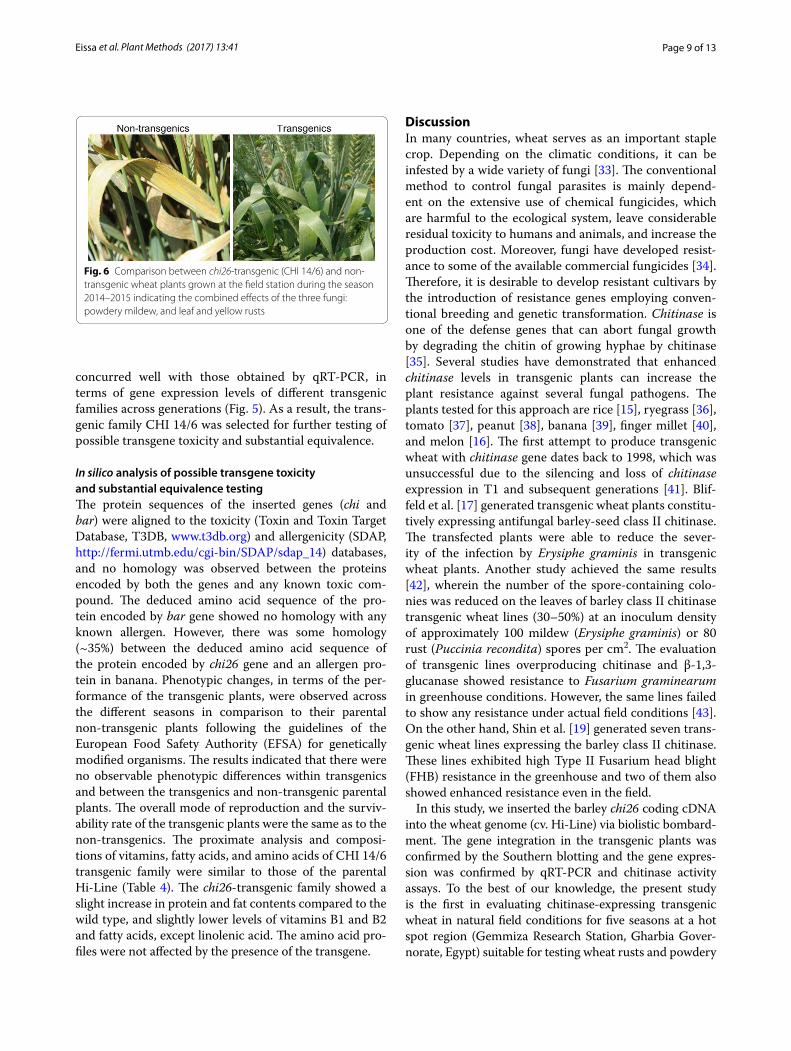
and 2014–2015 for the 12 families were almost similar to those obtained during 2011–2012 for the selected 12 families. The results for the season 2009–2010 indi-cated that selective transgene silencing occurred in ear-lier generations for the family lines, CHI 7 and CHI 71, but excepting CHI 71/8. The results obtained during the season 2014–2015 and two following growing sea-sons indicated possible occurrence of gene silencing in the families of the lines CHI 14 and CHI 47, except CHI 14/6 and CHI 47/1. The performance of chi26-expressing transgenic line (e.g., CHI 14/6) versus non-transgenic line
under combined infection is shown in Fig. 6. This obser-vation is also supported by a video captured at the field station during the last season to indicate the performance of the co-existing transgenic and non-transgenic plants during the season 2014–2015 (Additional file 3: Movie 1). Regarding stem rust (Puccinia graminis), the parental cultivar Hi-Line was natively resistant to the pathotypes available at the research station. Therefore, the effect of chi26 gene towards stem rust resistance could not be evaluated through the field experiments carried out. The data presented in Table 3 for the field experiments
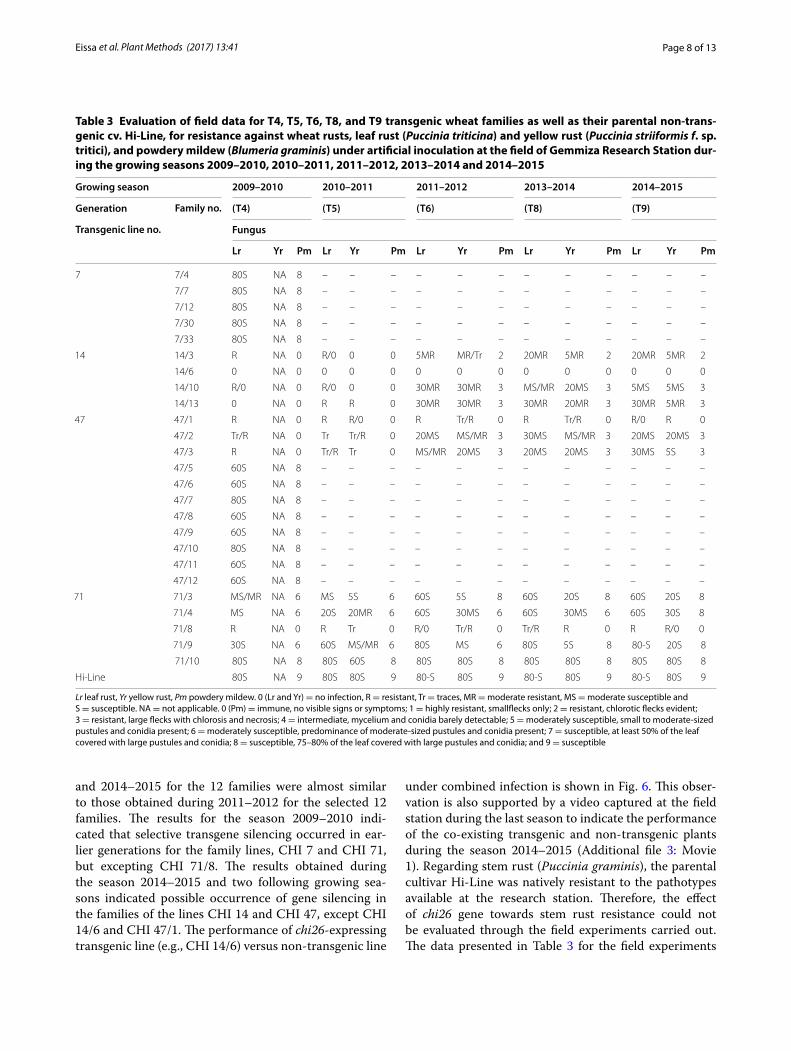
Table 3 Evaluation of field data for T4, T5, T6, T8, and T9 transgenic wheat families as well as their parental non-trans-genic cv. Hi-Line, for resistance against wheat rusts, leaf rust (Puccinia triticina) and yellow rust (Puccinia striiformis f. sp. tritici), and powdery mildew (Blumeria graminis) under artificial inoculation at the field of Gemmiza Research Station dur-ing the growing seasons 2009–2010, 2010–2011, 2011–2012, 2013–2014 and 2014–2015
Lr leaf rust, Yr yellow rust, Pm powdery mildew. 0 (Lr and Yr) = no infection, R = resistant, Tr = traces, MR = moderate resistant, MS = moderate susceptible and S = susceptible. NA = not applicable. 0 (Pm) = immune, no visible signs or symptoms; 1 = highly resistant, smallflecks only; 2 = resistant, chlorotic flecks evident; 3 = resistant, large flecks with chlorosis and necrosis; 4 = intermediate, mycelium and conidia barely detectable; 5 = moderately susceptible, small to moderate-sized pustules and conidia present; 6 = moderately susceptible, predominance of moderate-sized pustules and conidia present; 7 = susceptible, at least 50% of the leaf covered with large pustules and conidia; 8 = susceptible, 75–80% of the leaf covered with large pustules and conidia; and 9 = susceptible
Growing season 2009–2010 2010–2011 2011–2012 2013–2014 2014–2015
Generation Family no. (T4) (T5) (T6) (T8) (T9)
Transgenic line no. Fungus
Lr Yr Pm Lr Yr Pm Lr Yr Pm Lr Yr Pm Lr Yr Pm
7 7/4 80S NA 8 – – – – – – – – – – – –
7/7 80S NA 8 – – – – – – – – – – – –
7/12 80S NA 8 – – – – – – – – – – – –
7/30 80S NA 8 – – – – – – – – – – – –
7/33 80S NA 8 – – – – – – – – – – – –
14 14/3 R NA 0 R/0 0 0 5MR MR/Tr 2 20MR 5MR 2 20MR 5MR 2
14/6 0 NA 0 0 0 0 0 0 0 0 0 0 0 0 0
14/10 R/0 NA 0 R/0 0 0 30MR 30MR 3 MS/MR 20MS 3 5MS 5MS 3
14/13 0 NA 0 R R 0 30MR 30MR 3 30MR 20MR 3 30MR 5MR 3
47 47/1 R NA 0 R R/0 0 R Tr/R 0 R Tr/R 0 R/0 R 0
47/2 Tr/R NA 0 Tr Tr/R 0 20MS MS/MR 3 30MS MS/MR 3 20MS 20MS 3
47/3 R NA 0 Tr/R Tr 0 MS/MR 20MS 3 20MS 20MS 3 30MS 5S 3
47/5 60S NA 8 – – – – – – – – – – – –
47/6 60S NA 8 – – – – – – – – – – – –
47/7 80S NA 8 – – – – – – – – – – – –
47/8 60S NA 8 – – – – – – – – – – – –
47/9 60S NA 8 – – – – – – – – – – – –
47/10 80S NA 8 – – – – – – – – – – – –
47/11 60S NA 8 – – – – – – – – – – – –
47/12 60S NA 8 – – – – – – – – – – – –
71 71/3 MS/MR NA 6 MS 5S 6 60S 5S 8 60S 20S 8 60S 20S 8
71/4 MS NA 6 20S 20MR 6 60S 30MS 6 60S 30MS 6 60S 30S 8
71/8 R NA 0 R Tr 0 R/0 Tr/R 0 Tr/R R 0 R R/0 0
71/9 30S NA 6 60S MS/MR 6 80S MS 6 80S 5S 8 80‑S 20S 8
71/10 80S NA 8 80S 60S 8 80S 80S 8 80S 80S 8 80S 80S 8
Hi‑Line 80S NA 9 80S 80S 9 80‑S 80S 9 80‑S 80S 9 80‑S 80S 9
Page 9 of 13Eissa et al. Plant Methods (2017) 13:41
concurred well with those obtained by qRT-PCR, in terms of gene expression levels of different transgenic families across generations (Fig. 5). As a result, the trans-genic family CHI 14/6 was selected for further testing of possible transgene toxicity and substantial equivalence.
In silico analysis of possible transgene toxicity and substantial equivalence testingThe protein sequences of the inserted genes (chi and bar) were aligned to the toxicity (Toxin and Toxin Target Database, T3DB, www.t3db.org) and allergenicity (SDAP, http://fermi.utmb.edu/cgi-bin/SDAP/sdap_14) databases, and no homology was observed between the proteins encoded by both the genes and any known toxic com-pound. The deduced amino acid sequence of the pro-tein encoded by bar gene showed no homology with any known allergen. However, there was some homology (~35%) between the deduced amino acid sequence of the protein encoded by chi26 gene and an allergen pro-tein in banana. Phenotypic changes, in terms of the per-formance of the transgenic plants, were observed across the different seasons in comparison to their parental non-transgenic plants following the guidelines of the European Food Safety Authority (EFSA) for genetically modified organisms. The results indicated that there were no observable phenotypic differences within transgenics and between the transgenics and non-transgenic parental plants. The overall mode of reproduction and the surviv-ability rate of the transgenic plants were the same as to the non-transgenics. The proximate analysis and composi-tions of vitamins, fatty acids, and amino acids of CHI 14/6 transgenic family were similar to those of the parental Hi-Line (Table 4). The chi26-transgenic family showed a slight increase in protein and fat contents compared to the wild type, and slightly lower levels of vitamins B1 and B2 and fatty acids, except linolenic acid. The amino acid pro-files were not affected by the presence of the transgene.
DiscussionIn many countries, wheat serves as an important staple crop. Depending on the climatic conditions, it can be infested by a wide variety of fungi [33]. The conventional method to control fungal parasites is mainly depend-ent on the extensive use of chemical fungicides, which are harmful to the ecological system, leave considerable residual toxicity to humans and animals, and increase the production cost. Moreover, fungi have developed resist-ance to some of the available commercial fungicides [34]. Therefore, it is desirable to develop resistant cultivars by the introduction of resistance genes employing conven-tional breeding and genetic transformation. Chitinase is one of the defense genes that can abort fungal growth by degrading the chitin of growing hyphae by chitinase [35]. Several studies have demonstrated that enhanced chitinase levels in transgenic plants can increase the plant resistance against several fungal pathogens. The plants tested for this approach are rice [15], ryegrass [36], tomato [37], peanut [38], banana [39], finger millet [40], and melon [16]. The first attempt to produce transgenic wheat with chitinase gene dates back to 1998, which was unsuccessful due to the silencing and loss of chitinase expression in T1 and subsequent generations [41]. Blif-feld et al. [17] generated transgenic wheat plants constitu-tively expressing antifungal barley-seed class II chitinase. The transfected plants were able to reduce the sever-ity of the infection by Erysiphe graminis in transgenic wheat plants. Another study achieved the same results [42], wherein the number of the spore-containing colo-nies was reduced on the leaves of barley class II chitinase transgenic wheat lines (30–50%) at an inoculum density of approximately 100 mildew (Erysiphe graminis) or 80 rust (Puccinia recondita) spores per cm2. The evaluation of transgenic lines overproducing chitinase and β-1,3-glucanase showed resistance to Fusarium graminearum in greenhouse conditions. However, the same lines failed to show any resistance under actual field conditions [43]. On the other hand, Shin et al. [19] generated seven trans-genic wheat lines expressing the barley class II chitinase. These lines exhibited high Type II Fusarium head blight (FHB) resistance in the greenhouse and two of them also showed enhanced resistance even in the field.
In this study, we inserted the barley chi26 coding cDNA into the wheat genome (cv. Hi-Line) via biolistic bombard-ment. The gene integration in the transgenic plants was confirmed by the Southern blotting and the gene expres-sion was confirmed by qRT-PCR and chitinase activity assays. To the best of our knowledge, the present study is the first in evaluating chitinase-expressing transgenic wheat in natural field conditions for five seasons at a hot spot region (Gemmiza Research Station, Gharbia Gover-norate, Egypt) suitable for testing wheat rusts and powdery
Fig. 6 Comparison between chi26‑transgenic (CHI 14/6) and non‑transgenic wheat plants grown at the field station during the season 2014–2015 indicating the combined effects of the three fungi: powdery mildew, and leaf and yellow rusts
Page 10 of 13Eissa et al. Plant Methods (2017) 13:41
mildew. According to the field data obtained, it can be concluded that some transgenic wheat families with chi26 gene showed high resistance to rust diseases, including leaf rust (Puccinia recondita), yellow rust (Puccinia striiformis) and powdery mildew (Blumeria graminis) (Table 3). There were some variations in the resistance in the field among the families of the same transgenic event in a given season (Table 3). This behavior could also be supported by the data of the transgene expression level obtained by qRT-PCR for different families across different seasons (Fig. 5). The results indicated that transcription of chi26 was silenced in several families at T3, T4, and T6 generations. This con-clusion is supported by the data generated during field-testing. Stability in transgene expression was observed at T7 up to T9. The phenomenon of gene silencing has also been reported earlier [41], where the authors found that the majority of the T1 progeny showed very limited or almost no chitinase gene expression despite carrying an intact transgene. They ascribed this behavior to the use of CaMV–35S promoter driving the transgene. Transgene silencing has also been reported by other investigators [44, 45], with this as well other promoters, e.g., CaMV–35S [45, 46], Act1D [44], and maize ubi1 [43, 47], with different transformation methods, such as Agrobacterium-mediated
transformation of oilseed rape [48, 49] and microprojec-tile bombardment for wheat [43, 47]. These reports and the current study support the conclusion that transgene silencing is not correlated to any specific promoter or transformation method used. The high frequency of gene silencing might occur via homology-dependent silencing [50], tandem insertions, or genomic DNA could be inter-spersed between transgenic sequences [51–53]. Another explanation is the occurrence of promoter methylation, where expression level can be largely linked to the degree of promoter methylation [43, 47]. The results of the cur-rent study are in agreement with the latter possibility because we found fluctuations in chi26 expression in sub-sequent generations for families generated from the same transgenic event. In addition, we observed no direct corre-lation between the transgene copy number and the silenc-ing level, where CHI 14 and CHI 47 were found to have one transgene copy, while CHI 71 was having two. Simi-larly, Rooke et al. [54] found no correlation between the expression of the HMW glutenin subunit gene and its copy number. Despite the occurrence of transgene silencing, there was an overall stability in the degree of resistance in a given transgenic event across all tested generations (Table 3). If a given transgenic line could escape silencing
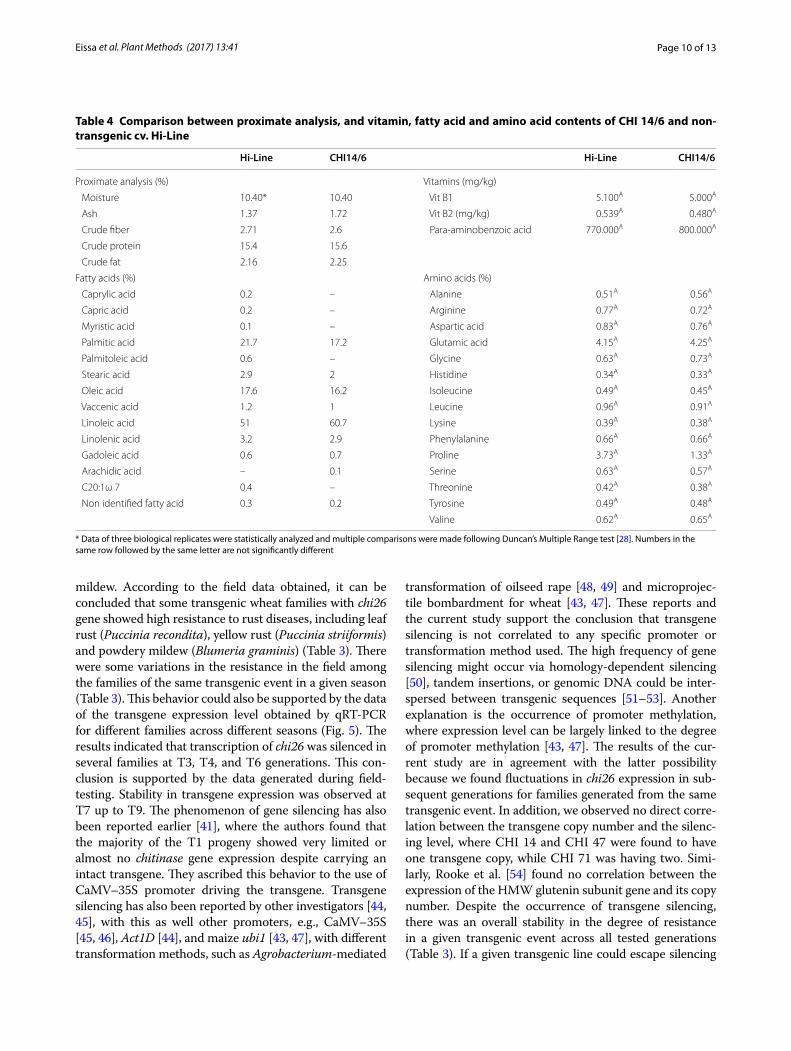
Table 4 Comparison between proximate analysis, and vitamin, fatty acid and amino acid contents of CHI 14/6 and non-transgenic cv. Hi-Line
* Data of three biological replicates were statistically analyzed and multiple comparisons were made following Duncan’s Multiple Range test [28]. Numbers in the same row followed by the same letter are not significantly different
Hi‑Line CHI14/6 Hi‑Line CHI14/6
Proximate analysis (%) Vitamins (mg/kg)
Moisture 10.40* 10.40 Vit B1 5.100A 5.000A
Ash 1.37 1.72 Vit B2 (mg/kg) 0.539A 0.480A
Crude fiber 2.71 2.6 Para‑aminobenzoic acid 770.000A 800.000A
Crude protein 15.4 15.6
Crude fat 2.16 2.25
Fatty acids (%) Amino acids (%)
Caprylic acid 0.2 – Alanine 0.51A 0.56A
Capric acid 0.2 – Arginine 0.77A 0.72A
Myristic acid 0.1 – Aspartic acid 0.83A 0.76A
Palmitic acid 21.7 17.2 Glutamic acid 4.15A 4.25A
Palmitoleic acid 0.6 – Glycine 0.63A 0.73A
Stearic acid 2.9 2 Histidine 0.34A 0.33A
Oleic acid 17.6 16.2 Isoleucine 0.49A 0.45A
Vaccenic acid 1.2 1 Leucine 0.96A 0.91A
Linoleic acid 51 60.7 Lysine 0.39A 0.38A
Linolenic acid 3.2 2.9 Phenylalanine 0.66A 0.66A
Gadoleic acid 0.6 0.7 Proline 3.73A 1.33A
Arachidic acid – 0.1 Serine 0.63A 0.57A
C20:1ω 7 0.4 – Threonine 0.42A 0.38A
Non identified fatty acid 0.3 0.2 Tyrosine 0.49A 0.48A
Valine 0.62A 0.65A

Page 11 of 13Eissa et al. Plant Methods (2017) 13:41
up to T6 generation, then it is highly possible that the sub-sequent generations will exhibit stable expression levels. Transgene silencing in wheat is a random process and has no correlation with promoter, transgene copy number, or even position effect [43]. However, further investigation is indispensable to understand the mechanism of transgene silencing. In accordance to the possible correlation between chitinase activity and fungal disease resistance, several studies have claimed that transgenic plants with higher levels of chitinase transcript accumulation show higher levels of disease resistance and chitinase activity [36]. On the other hand, some studies carried out in rice, tobacco, and cotton, have reported that the level of chi-tinase activity does not always correlate with the degree of fungal resistance [55, 56]. More recently, a simple method namely WAC, based upon the specific binding of the plant lectin wheat germ agglutinin to fungal chitin, was used to detect disease resistance against Puccinia graminis f. sp. Tritici [57]. World Health Organization (WHO), Food and Agriculture Organization (FAO), and Organization for Economic Cooperation and Development (OECD) follow the principle of the “substantial equivalence” for geneti-cally modified food safety assessment [49]. In the current study, a comparative analysis between chi26 transgenic line and its parental non-transgenic genotype (cv. Hi-Line) was performed. None of the transgenic plants exhibited any morphological change as compared to the non-transgenic parental genotype. They were self-fertile and had normal seed setting. In addition, no significant differences in agro-nomic traits between the transgenic and non-transgenic families were observed under normal conditions (Addi-tional file 4: Table S3). One of the transgenic families (CHI 14/6) showed stable resistance across the studied genera-tions, and consequently, was chosen for subsequent proxi-mate and nutritional analyses(Additional file 5: Figure S1). Moisture content is one of the most important considera-tions while evaluating the quality of wheat for long terms to rage and milling quality of the grain [48]. The moisture content in the commercial lots of wheat ranges between 8 and 18%, depending on the prevalent weather at the time of harvest [57, 58]. The moisture content of CHI14/6 and Hi-Line was the same (Table 4). In addition, the ash, pro-tein, and fat percentages were also similar. The slight varia-tion in fatty acid and amino acid profiles is within naturally occurring variability range and thus acceptable [49].
ConclusionOur results indicate that the resistance against wheat rusts and powdery mildew can be achieved via transgen-esis with the use of the barley chi26 gene. The recovered transgenic family CHI 14/6 can be utilized in breed-ing programs towards the production of wheat cultivars resistant to rusts and powdery mildew.
AbbreviationsG168: Giza 168; ELISA: enzyme linked‑immunosorbent assay.
Authors’ contributionsHFE AB: Designed the study. AMR and HTM: Constructed the vector. HFE, AMR, SHE and OMS: Carried out wheat transformation. SMH, MTA and YBM: Carried out PCR and RT‑PCR. AMS: Determined chitinase activity. HAF: Carried out Southern blotting. HFE, MME, MM and GGE: Carried out field evaluation and data collection. HFE, GHO, AB, MM and AMR: Drafted the manuscript. All authors read and approved the final manuscript.
Author details1 Agricultural Genetic Engineering Research Institute (AGERI), Agriculture Research Center (ARC), Giza 12619, Egypt. 2 Faculty of Biotechnology, Misr University for Science and Technology (MUST), Post Box 77, 6th October City, Egypt. 3 Department of Biological Sciences, Faculty of Science, King Abdulaziz University, P.O. Box 80141, Jeddah 21589, Saudi Arabia. 4 Plant Pathology Research Institute (PPRI), Agriculture Research Center (ARC), Giza 12619, Egypt. 5 National Centre for Radiation Research and Technology (NCRRT), Cairo 11781, Egypt. 6 Department of Biotechnology, Faculty of Applied Medical Science, Taif University, Turrabah 21995, Saudi Arabia. 7 Field Crops Research Institute, Agriculture Research Center (ARC), Giza 12619, Egypt. 8 Plant Soil and Microbial Sciences Department, Michigan State University, East Lansing, MI 48824, USA. 9 Department of Genetics, Faculty of Agriculture, Ain Shams University, Cairo 11566, Egypt. 10 Department of Biology, Faculty of Applied Sciences, Umm Al‑Qura University, Makkah 21955, Saudi Arabia. 11 Department of Pomology, The Horticulture Research Institute (HRI), Agri‑culture Research Center (ARC), Giza 12619, Egypt. 12 Arid Lands Agricultural Research Institute (ALARI), Faculty of Agriculture, Ain Shams University, P.O. Box 68, Hadayek Shoubra, Cairo 11241, Egypt.
AcknowledgementsWe are grateful to Prof. Dr. Subbaratnam Muthukrishnan, Kansas State University, USA for revising and editing the manuscript and making valuable suggestions.
Competing interestsThe authors declare that they have no competing interests.
Availability of data and materialsAll data generated or analyzed during this study are included in this published article.
FundingThis project was funded by the Science and Technology Development Fund (STDF), Ministry for Scientific Research, Egypt, under Grant No. (265).
Additional files
Additional file 1: Table S1. Specific primers to amplify chi26 and bar genes.
Additional file 2: Table S2. Specific primers to amplify chi26 and actin genes for qPCR.
Additional file 3: Movie 1. The performances of chi26 transgenics versus non‑transgenics under combined infection with rusts and powdery mildew.
Additional file 4: Table S3. Means of yield related traits of the T4 transgenic families as well as their parental non‑transgenic genotype (cv Hi‑Line) under field conditions in cultivated seasons 2009/2010.
Additional file 5: Fig. S1. Whole figure for Genomic Southern blot analysis of the five independent chi26 transgenic plants CHI 7, CHI 30, CHI 14, CHI 47 and CHI 71, respectively) at the T0 generation. Genomic DNA of each line was digested with NcoI and fragmented by 0.8% agarose gel electrophoresis. The blot was probed with a BamHI fragment involving a maize ubi promoter and maize ubi intron 1 (~2 kb). M; 1 Kb DNA ladder (New England Biolabs) with 0.5, 1, 1.5, 2, 3, 4, 5, 6, 8 and 10 kb, –; non‑transgenic cv. Hi‑Line.

Page 12 of 13Eissa et al. Plant Methods (2017) 13:41
Publisher’s NoteSpringer Nature remains neutral with regard to jurisdictional claims in pub‑lished maps and institutional affiliations.
Received: 5 November 2016 Accepted: 15 May 2017
References 1. Todorovska E, Christova N, Slavova S, Christovaa P, Vassileva D. Biotic
stress resistance in wheat: breeding and genomic selection implications. Biotechnol Biotechnol Equip. 2009;23:1417–26.
2. Muthukrishnan S, Liang GH, Trick HN, Gill BS. Pathogenesis‑related proteins and their genes in cereals. Plant Cell Tissue Organ Cult. 2001;64:93–114.
3. Hulbert SH, Bai J, Fellers JP, Pacheco MG, Bowden RL. Gene expression patterns in near isogenic lines for wheat rust resistance gene lr34/yr18. Phytopathology. 2007;97:1083–93.
4. Oerke EC, Dehne HW. Global crop production and the efficacy of crop protection: current situation and future trends. Eur J Plant Pathol. 1997;103:203–15.
5. Linthorst HJM, Van Loon LC. Pathogenesis‑related proteins of plants. Crit Rev Plant Sci. 1991;10:123–50.
6. Colditz F, Niehaus K, Krajinski F. Silencing of PR‑10‑like proteins in Medicago truncatula results in an antagonistic induction of other PR proteins and in an increased tolerance upon infection with the oomycete Aphanomyces euteiches. Planta. 2007;226:57–71.
7. Choi DS, Hwang IS, Hwang BK. Requirement of the cytosolic interac‑tion between pathogenesis‑related protein 10 and leucine‑rich repeat protein1 for cell death and defense signaling in pepper. Plant Cell. 2012;24:1675–90.
8. Saito S, Odagiri M, Furuya S, Suzuki S, Takayanagi T. Inhibitory effect of chitinases isolated from Semillon grapes (Vitis vinifera) on growth of grapevine pathogens. J Plant Biochem Biotechnol. 2011;20:47–54.
9. Mauch F, Mauch‑Mani B, Boller T. Antifungal hydrolyses in Pea tissue 1. Plant Physiol. 1988;88:936–42.
10. Adams DJ. Fungal cell wall chitinases and glucanases. Microbiology. 2004;150:2029–35.
11. Schlumbaum A, Mauch F, Vögeli U, Boller T. Plant chitinases are potent inhibitors of fungal growth. Nature. 1986;324:365–7.
12. Kaur J, Sagaram US, Shah D. Can plant defensins be used to engineer durable commercially useful fungal resistance in crop plants? Fungal Biol Rev. 2011;25:128–35.
13. Chhikara S, Chaudhury D, Dhankher OP, Jaiwal PK. Combined expression of a barley class II chitinase and type I ribosome inactivating protein in transgenic Brassica juncea provides protection against Alternaria brassicae. Plant Cell Tissue Organ Cult. 2012;108:83–9.
14. Nookaraju A, Agrawal DC. Enhanced tolerance of transgenic grapevines expressing chitinase and β‑1,3‑glucanase genes to downy mildew. Plant Cell Tissue Organ Cult. 2012;111:15–28.
15. Datta K, Tu J, Oliva N, Ona I, Velazhahan R, Mew TW, Muthukrishnan S, Datta SK. Enhanced resistance to sheath blight by constitutive expression of infection‑related rice chitinase in transgenic elite indica rice cultivars. Plant Sci. 2001;160:405–14.
16. Bezirganoglu I, Hwang SY, Fang TJ, Shaw JF. Transgenic lines of melon (Cucumismelo L. var. makuwa cv. “Silver Light”) expressing antifungal protein and chitinase genes exhibit enhanced resistance to fungal patho‑gens. Plant Cell Tissue Organ Cult. 2013;112:227–37.
17. Bliffeld M, Mundy J, Potrykus I, Fütterer J. Genetic engineering of wheat for increased resistance to powdery mildew disease. Theor Appl Genet. 1999;98:1079–86.
18. Anand A, Trick HN, Gill BS, Muthukrishnan S. Stable transgene expression and random gene silencing in wheat. Plant Biotechnol J. 2003;1:241–51.
19. Shin S, Mackintosh CA, Lewis J, Heinen SJ, Radmer L, Dill‑Macky R, Baldridge GD, Zeyen RJ, Muehlbauer GJ. Transgenic wheat expressing a barley class II chitinase gene has enhanced resistance against Fusarium graminearum. J Exp Bot. 2008;59:2371–8.
20. Hassanein SE, Abdel‑Tawab FM, Fahmy EM, Gad El‑Karim G, Alniemi T, Abdelsalam M, Mostafa S, Ramadan AM, Saleh OM, Eissa HF, Bahieldin A.
Molecular assessment of chitinase activity in transgenic wheat, Egypt. J Genet Cytol. 2009;38:207–20.
21. Sivamani E, Bahieldin A, Wraith JM, Al‑Niemi T, Dyer WE, Ho TD, Qu R. Improved biomass productivity and water use efficiency under water deficit conditions in transgenic wheat constitutively expressing the barley HVA1 gene. Plant Sci. 2000;155:1–9.
22. Sambrook J, Fritsch EF, Maniatis T. Molecular cloning: a laboratory manual. Cold Spring Harbor: Cold Spring Harbor Laboratory Press; 1989.
23. Radonić A, Thulke S, Mackay IM, Landt O, Siegert W, Nitsche A. Guideline to reference gene selection for quantitative real‑time PCR. Biochem Biophys Res Commun. 2004;313:856–62.
24. Bradford MM. A rapid and sensitive method for the quantitation of micro‑gram quantities of protein utilizing the principle of protein‑dye binding. Anal Biochem. 1976;72:248–54.
25. Reissig JL, Strominger JL, Leloir LF. A modified colorimetric method for the estimation of N‑acetylamino sugars. J Biol Chem. 1955;217:959–66.
26. Hsu SC, Lockwood JL. Powdered chitin agar as a selective medium for enumeration of actinomycetes in water and soil. Appl Microbiol. 1975;29:422–6.
27. Livak KJ, Schmittgen TD. Analysis of relative gene expression data using real‑time quantitative PCR and the 2‑ΔΔCT method. Methods. 2001;25:402–8.
28. Duncan DB. Multiple range and multiple F‑tests. Biometrics. 1955;11:1–42. 29. Tervet I, Cassel RC. The use of cyclone in the race identification of micro‑
scopic particles. Phytopathology. 1951;41:282–5. 30. Peterson RF, Campbell AB, Hannah AE. A diagrammatic scale for
estimating rust intensity on leaves and stems of cereals. Can J Res. 1948;26C:496–500.
31. Leath S, Heun M. Identification of powdery mildew resistance genes in cultivars of soft red winter‑wheat. Plant Dis. 1990;74:747–52.
32. Rutledge RG, Côté C. Mathematics of quantitative kinetic PCR and the application of standard curves. Nucleic Acids Res. 2003;31:e93.
33. Roelfs AP. Estimated losses caused by rust in small grain cereals in the United States 1918–1976, Publ. United States. Agric Res Serv. 1978;1363:1–85.
34. Avila‑Adame C, Olayo G, Wolfram K. Characterization of Colletotrichum graminicola isolates resistant to atrobilurin‑related QoI fungicides. Plant Dis. 2003;87:1426–32.
35. Leah R, Tommerup H, Svendsen I, Mundy J. Biochemical and molecular characterization of three barley seed proteins with antifungal properties. J Biol Chem. 1991;266:1564–73.
36. Takahashi W, Fujimori M, Miura Y, Komatsu T, Nishizawa Y, Hibi T, Takamizo T. Increased resistance to crown rust disease in transgenic Italian ryegrass (Lolium multiflorum Lam.) expressing the rice chitinase gene. Plant Cell Rep. 2005;23:811–8.
37. Girhepuje PV, Shinde GB. Transgenic tomato plants expressing a wheat endochitinase gene demonstrate enhanced resistance to Fusarium oxysporum f. sp. lycopersici. Plant Cell Tissue Organ Cult. 2011;105:243–51.
38. Iqbal MM, Nazir F, Ali S, Asif MA, Zafar Y, Iqbal J, Ali GM. Over expression of rice chitinase gene in transgenic peanut (Arachis hypogaea L.) improves resistance against leaf spot. Mol Biotechnol. 2012;50:129–36.
39. Kovács G, Sági L, Jacon G, Arinaitwe G, Busogoro JP, Thiry E, Strosse H, Swennen R, Remy S. Expression of a rice chitinase gene in transgenic banana (“Gros Michel”, AAA genome group) confers resistance to black leaf streak disease. Transgenic Res. 2013;22:117–30.
40. Ignacimuthu S, Ceasar SA. Development of transgenic finger millet (Eleusine coracana (L.) Gaertn.) resistant to leaf blast disease. J Biosci. 2012;37:135–47.
41. Chen WP, Gu X, Liang GH, Muthukrishnan S, Chen PD, Liu DJ, Gill BS. Introduction and constitutive expression of a rice chitinase gene in bread wheat using biolistic bombardment and the bar gene as a selectable marker. Theor Appl Genet. 1998;97:1296–306.
42. Oldach KH, Becker D, Lörz H. Heterologous expression of genes mediat‑ing enhanced fungal resistance in transgenic wheat. Molecular Plant Microbe Interactions. 2001;14:832–8.
43. Anand A, Zhou T, Trick HN, Gill BS, Bockus WW, Muthukrishnan S. Greenhouse and field testing of transgenic wheat plants stably express‑ing genes for thaumatin‑like protein, chitinase and glucanase against Fusarium graminearum. J Exp Bot. 2003;54:1101–11.
44. Demeke T, Hucl P, Båga M, Caswell K, Leung N, Chibbar RN. Transgene inheritance and silencing in hexaploid spring wheat. Theor Appl Genet. 1999;99:947–53.

Page 13 of 13Eissa et al. Plant Methods (2017) 13:41
• We accept pre-submission inquiries
• Our selector tool helps you to find the most relevant journal
• We provide round the clock customer support
• Convenient online submission
• Thorough peer review
• Inclusion in PubMed and all major indexing services
• Maximum visibility for your research
Submit your manuscript atwww.biomedcentral.com/submit
Submit your next manuscript to BioMed Central and we will help you at every step:
45. Melander M, Kamnert I, Happstadius I, Liljeroth E, Bryngelsson T. Stabil‑ity of transgene integration and expression in subsequent genera‑tions of doubled haploid oilseed rape transformed with chitinase and β‑1,3‑glucanase genes in a double‑gene construct. Plant Cell Rep. 2006;25:942–52.
46. Tang J, Scarth R, Mcvetty PBE. Stability of the expression of Acyl‑ACP thioesterase transgenes in oilseed rape doubled haploid lines. Crop Sci. 2004;44:732–40.
47. Howarth JR, Jacquet JN, Doherty A, Jones HD, Cannell ME. Molecular genetic analysis of silencing in two lines of Triticum aestivum trans‑formed with the reporter gene construct pAHC25. Ann Appl Biol. 2005;146:311–20.
48. Rasper VF, Walker CE. Quality evaluation of cereals and cereal products. In: Hulp K, Ponte JG, editors. Handbook of cereal science and technology. New York: Marcel Deker Inc.; 2000. p. 505–37.
49. Venneria E, Fanasca S, Monastra G, Finotti E, Ambra R, Azzini E, Durazzo A, Foddai MS, Maiani G. Assessment of the nutritional values of geneti‑cally modified wheat, corn, and tomato crops. J Agric Food Chem. 2008;56:9206–14.
50. Meyer P, Saedler H. Homology‑dependent gene silencing in plants. Annu Rev Plant Physiol Plant Mol Biol. 1996;47:23–48.
51. Kohli A, Leech M, Vain P, Laurie DA, Christou P. Transgene organization in rice engineered through direct DNA transfer supports a two‑phase
integration mechanism mediated by the establishment of integration hot spots. Proc Natl Acad Sci USA. 1998;95:7203–8.
52. Salomon S, Puchta H. Capture of genomic and T‑DNA sequences during double‑strand break repair in somatic plant cells. EMBO J. 1998;17:6086–95.
53. Jackson SA, Zhang P, Chen WP, Phillips RL, Friebe B, Muthukrishnan S, Gill BS. High‑resolution structural analysis of biolistic transgene integration into the genome of wheat. Theor Appl Genet. 2001;103:56–62.
54. Rooke L, Steele S, Barcelo P, Shewry PR, Lazzeri PA. Transgene inheritance, segregation and expression in bread wheat. Euphytica. 2003;129:301–9.
55. Nishizawa Y, Nishio Z, Nakazono K, Soma M, Nakajima E, Ugaki M, Hibi T. Enhanced resistance to blast (Magnaporthe grisea) in transgenic Japonica rice by constitutive expression of rice chitinase. Theor Appl Genet. 1999;99:383–90.
56. Emani C, Garcia JM, Lopata‑Finch E, Pozo MJ, Uribe P, Kim DJ, Sunikumar G, Cook DR, Kenerley CM, Rathore KS. Enhanced fungal resistance in transgenic cotton expressing an endochitinase gene from Trichoderma virens. Plant Biotech J. 2003;1:321–36.
57. Ayliffe M, Periyannan SK, Feechan A, Dry I, Schumann U, Lagudah E, Pryor A. Simple quantification of in planta fungal biomass. Methods Mol Biol. 2014;1127:159–72.
58. Belderock B. Development in bread making processing. Plant Food Hum Nutr. 2000;55:1–8.


![[XLS] · Web viewSheet1 POSBUS 12619 BRANDWAG 9324 BARDENINA ANNA KATHRINE 8410/04 10 Dec 1971 7112105242081 MEV. M. J. VAN VUUREN WILLEM STEAD WEG 75 MARGARETHA JACOMINA VAN VUUREN](https://static.fdocuments.in/doc/165x107/5b2e646f7f8b9a55208beb1c/xls-web-viewsheet1-posbus-12619-brandwag-9324-bardenina-anna-kathrine-841004.jpg)