Dynamics Modeling and Loads Analysis of an Offshore ...
45
Jason Jonkman Jason Jonkman IEA Annex XXIII OC3 Meeting IEA Annex XXIII OC3 Meeting September 7, 2007 September 7, 2007 Dynamics Modeling and Loads Analysis Dynamics Modeling and Loads Analysis of an Offshore Floating Wind Turbine of an Offshore Floating Wind Turbine
Transcript of Dynamics Modeling and Loads Analysis of an Offshore ...

Jason JonkmanJason Jonkman
IEA Annex XXIII OC3 MeetingIEA Annex XXIII OC3 Meeting
September 7, 2007September 7, 2007
Dynamics Modeling and Loads AnalysisDynamics Modeling and Loads Analysis
of an Offshore Floating Wind Turbineof an Offshore Floating Wind Turbine

2IEA Annex XXIII OC3 Meeting
IntroductionBackground — The Big Picture
Some wind turbines have been installed
in shallow water; none in deepwater
A vast deepwater wind resource
represents a potential to use offshore
floating wind turbines to power much of
the world
Numerous platform concepts have been
proposed
Simulation tools for modeling the
dynamic responses needed to be
developed & verified
The technical feasibility must be
demonstrated by characterizing the
dynamic response and identifying critical
loads & instabilitiesGE Wind Energy 3.6-MW Turbine

3IEA Annex XXIII OC3 Meeting

4IEA Annex XXIII OC3 Meeting
IntroductionPrevious Research
Henderson
et al
Fulton et al
Withee
Nielsen et al
Zambrano et al
Bulder et al
Lee
Wayman et al
Vijfhuizen
ResearchersResearchers
Limited capabilities:
– simple hydrodynamic
models
– simple aerodynamic
models
– concept-specific tools
Limited simulations in
analysis
Nonlinear representation
of wind turbine & platform
Transient events included
Flexible wind turbine
Controls included
Analysis requires many
simulations
No nonlinear
characteristics
No transient events
Rigid wind turbine
No controls
Many tools available from
offshore O&G industry
Linearized representation
of wind turbine
Analysis presented in
summary form (RAOs,
response statistics)
LimitationsLimitationsCharacteristicsCharacteristics
Fre
qu
en
cy
Do
ma
inF
req
ue
nc
y D
om
ain
Tim
e D
om
ain
Tim
e D
om
ain

5IEA Annex XXIII OC3 Meeting
IntroductionObjectives & Scope
My objectives:
– to develop a comprehensive simulation tool for modeling the
coupled dynamic response of offshore floating wind turbines
– to verify the simulation capability through model-to-model
comparisons
– to apply the simulation tool to an integrated loads analysis
for one of the promising system concepts
These objectives are important in that they:
– address the primary limitations of previous research
– are fundamental for determining the most technically-
attractive & economically-feasible design
Not included:
– economics, manufacturing, installation, optimization

6IEA Annex XXIII OC3 Meeting
Outline of Presentation
Introduction
Development of Simulation Capability:
– Overview
– Support Platform Kinematics & Kinetics
– Hydrodynamics
– Mooring System
Design Basis & Wind Turbine Model
Verification of Simulation Capability
Loads Analysis
Influence of Control on Barge Pitch
Conclusions & Recommendations

7IEA Annex XXIII OC3 Meeting
Simulation Capability DevelopmentOverview — Modeling Requirements
Fully coupled aero-hydro-servo-elastic interaction
Wind-Inflow:–discrete events
–turbulence
Waves:–regular
–irregular
Aerodynamics:–induction
–rotational augmentation
–skewed wake
–dynamic stall
Hydrodynamics:–diffraction
–radiation
–hydrostatics
Structural dynamics:–gravity / inertia
–elasticity
–foundations / moorings
Control system:–yaw, torque, pitch

8IEA Annex XXIII OC3 Meeting
Simulation Capability DevelopmentCombining Computational Methodologies
Land -Based
Wind Turbines
Characteristics :
_ Flexible & dynamically active
_ Controllable
_ Nonlinear time -domain
aero-servo -elastic analysis
Simulation Tools :
_ FAST with AeroDyn
_ MSC.ADAMS© with
A2AD & AeroDyn
Sea-Based
Oil & Gas Platforms
Characteristics :
_ Rigid & static
_ Passive
_ Linear frequency -domain
hydrodynamic analysis
Simulation Tools :
_ SWIM-MOTION -LINES
_ WAMIT©
Offshore Floating
Wind Turbines
Characteristics :
_ Flexible & dynamically active
_ Controllable
_ Coupling between turbine &
platform motions
_ Nonlinear time -domain
aero-hydro -servo-elastic
analysis needed
Simulation Development Approach :
_Start with FAST with AeroDyn &
MSC.ADAMS with A 2AD & AeroDyn
_Add support -platform DOFs
_Develop hydrodynamics module with
interface to SWIM & WAMIT
_Develop mooring -system module

9IEA Annex XXIII OC3 Meeting
Simulation Capability DevelopmentFully-Coupled Aero-Hydro-Servo-Elastics

10IEA Annex XXIII OC3 Meeting
Simulation Capability DevelopmentSupport Platform Kinematics & Kinetics
Support-platform DOFs introduced to
FAST & ADAMS:
– translational: surge, sway, heave
– rotational: roll, pitch, yaw
(assumed small rotations)
Dynamic couplings between motions
of turbine & platform included:
– all position, velocity, and acceleration
expressions are now affected by the
platform DOFs
– the wind turbine’s response to wind and
wave excitation is fully coupled through
the structural dynamics
ZY
X
Heave
Yaw
RollSurge
Sway
Pitch
Wind
ZY
X
Heave
Yaw
RollSurge
Sway
Pitch
Wind
Support Platform DOFs

11IEA Annex XXIII OC3 Meeting
Simulation Capability DevelopmentHydrodynamics Module
Time -Domain Hydrodynamics (H ydroDyn )
Wave Spectrum
& Direction
Radiation Kernel
Incident -Wave
Excitation
Plat form
Mot ions
Hydrod ynamic
For cing Lo ads
Added -Ma ss Matrix
(Radiation Problem )
Damping Matrix
(Radiation Problem )
Impu lsive
Added Mass
Restoring Matrix
(Hydrostatic Problem )
Wave-Excitation Force
(Diffraction Problem )
White G aussian
No ise
Infinite -Freq.
Limit
Cosine
Transform
Inverse FFT
Box-Muller
Method
Seed for
RNG
Platform
Geometry
Sea
Current
Time
Convolution
Buoyancy
Calculation
Sum Forces
Memory
Effect
Buoy ancy
Morison’s
Equation
Viscous
Drag
Frequency -Domain Radiation / Diffraction
Hydrodynamics Preprocessor (SWIM or WAMIT)
Incid ent -Wave
Kin ematics

12IEA Annex XXIII OC3 Meeting
Simulation Capability DevelopmentMooring-System Module
Fx
Fz
s
( )x s
( )z s
( )eT s
FH
FV
AH
AV
Fairlead
Anchor
BL, ,EA,C
Fx
Fz
s
( )x s
( )z s
( )eT s
FH
FV
AH
AV
Fairlead
Anchor
BL, ,EA,C
Mooring Lin e Properties
( , , , )
Quasi -Static Mooring -System Module (Calculations Shown for Each Line )
Newton -Raphson Iteration to
Find Fairlead TensionGlobal -to-Local
Transformation
Compute
Anchor
Tension
Compute Configuration of ,
& Tensions Within , Line
Fairlead Location Relative
to Anchor ( , )
Fairlead Tension ( , )
Local -to-Global
Transformation &
Sum Tensions
Platform Position
Mooring Restoring
Anchor Tension
( , )
Configu ration of ,
& Tensions Within , Line
[ , , ]
Fx
Fz
L
EA
BC
FH
FV

13IEA Annex XXIII OC3 Meeting
Outline of Presentation
Introduction
Development of Simulation Capability
Design Basis & Wind Turbine Model:
– NREL 5-MW Baseline Wind Turbine
– ITI Energy Barge & MIT / NREL Barge
– Reference-Site Data
Verification of Simulation Capability
Loads Analysis
Influence of Control on Barge Pitch
Conclusions & Recommendations

14IEA Annex XXIII OC3 Meeting
Design Basis & Wind Turbine ModelNREL 5-MW Baseline Wind Turbine
Specifications developedfor a representative multi-megawatt wind turbine
Heavily influenced by theREpower 5M prototype &DOWEC project turbines
Properties developed:– blade structural &
aerodynamic properties
– nacelle & hub
– drivetrain
– tower
– control system:
• generator torque
• blade pitch
REpower 5M Wind Turbine
Gross Properties Chosen for the Baseline TurbineRating 5 MW
Rotor Orientation , Con figuration Upwind , 3 Blades
Control Variable Speed, Collective Pitch
Drivetrain High Speed, Multiple Stage Gearbox
Rotor Diameter 126 m
Hub Height 90 m
Cut-In, Rated, Cut -Out Wind Speed 3 m/s, 11.4 m/s, 25 m/s
Cut-In, Rated Rotor Speed 6.9 rpm, 12.1 rpm
Rated Tip Speed 80 m/s
Overhang, Shaft Tilt, Precone 5 m, 5º, 2.5º
Rotor Mass 110,000 kg
Nacelle Mass 240,000 kg
Tower Mass 347,460 kg
Coordinate Location of Overall CM (-0.2 m, 0.0 m, 64.0 m)

15IEA Annex XXIII OC3 Meeting
Design Basis & Wind Turbine Model5-MW Baseline Control-System Properties
Low-Pass
Filter
Gene rator
Spe ed
Torque-Speed
Look-Up Table
Determine
Control Region
Control Region
(1, 1_ , 2, 2_ , or 3)
Gene rator
Tor que
Torque Limit
Saturation
Torque Rate
Saturation
Generator
Torque
+Rated
Speed
Filtered
Speed
-
Spe edErr or
Integrator
Integr ated
Speed Error
Saturate
Integral
Gain
Schedule Integral
Gain
Proportional
GainGain
Factor
+
Inte gralTe rm
Propo rtionalTe rm
Pitch Limit
Saturation
Pitch Rate
Saturation
Rotor-C ollective
Blade-Pit ch Angle
Rotor-Collective
Blade-Pitch Angle
+
++
Integr ated
Speed Error
Rotor-C ollective
Blade-Pit ch Angle
Gene rator
Tor que

16IEA Annex XXIII OC3 Meeting
Design Basis & Wind Turbine ModelFloating Platforms
ITI Energy Barge
Sponsored by ITI Energy, Scotland
Developed by the Universities of
Glasgow & Strathclyde (NAME)
Square barge with central moonpool
& oscillating water column (OWC)
Eight slack, catenary lines
MIT / NREL Barge
Developed by MIT for NREL
Cylindrical barge
Four pairs of taut lines
NREL 5-MW Turbine on ITI Energy Barge
Barge concepts chosen for simplicity in design, fabrication, & installation

17IEA Annex XXIII OC3 Meeting
Design Basis & Wind Turbine ModelReference-Site Data
Data purchased from http://www.waveclimate.com/:
– JPD of wind speed, wave height & wave period
– extreme wave-height data with 1- & 50-yr recurrence
IEC class IB values assumed for data not measured
Reference Site Location (61.3º N, 0.0º E)
0
5
10
15
20
25
3 5 7 9 11 13 15 17 19 21 23 25
Hub-Height Wind Speed, m/s
Expected Significant Wave Height, m Peak-Spectral Period Range, s

18IEA Annex XXIII OC3 Meeting
Outline of Presentation
Introduction
Development of Simulation Capability
Design Basis & Wind Turbine Model
Verification of Simulation Capability:
– Hydrodynamics Module
– Mooring-System Module
– Time Versus Frequency Domain
Loads Analysis
Influence of Control on Barge Pitch
Conclusions & Recommendations

19IEA Annex XXIII OC3 Meeting
Outline of Presentation
Introduction
Development of Simulation Capability
Design Basis & Wind Turbine Model
Verification of Simulation Capability
Loads Analysis:
– Design Load Case Table
– Results & Discussion
Influence of Control on Barge Pitch
Conclusions & Recommendations

20IEA Annex XXIII OC3 Meeting
Loads AnalysisDesign Load Case Table
Summary of Selected Design Load Cases from IEC61400-1 & -3
DLC Controls / Events Load
Model Speed Model Height Direction Factor
1.1 NTM Vin < V hub < V out NSS Hs = E[H s|V hub ] _ = 0º Normal operation 1.25*1.2
1.3 ETM Vin < V hub < V out NSS Hs = E[H s|V hub ] _ = 0º Normal operation 1.35
1.4 ECD Vhub = V r, V r±2m/s NSS Hs = E[H s|V hub ] _ = 0º Normal operation ; ± wind dir 'n. 1.35
1.5 EWS Vin < V hub < V out NSS Hs = E[H s|V hub ] _ = 0º Normal operation ; ± ver . & hor. shr . 1.35
1.6a NTM Vin < V hub < V out ESS Hs = 1.09*H s50 _ = 0º Normal operation 1.35
2.1 NTM Vhub = V r, V out NSS Hs = E[H s|V hub ] _ = 0º Pitch runaway _ Shutdown 1.35
2.3 EOG Vhub = V r, V r±2m/s, Vout NSS Hs = E[H s|V hub ] _ = 0º Loss of load _ Shutdown 1.10
6.1a EWM Vhub = 0.95*V 50 ESS Hs = 1.09*H s50 _ = 0º, ±30 º Yaw = 0º, ±8º 1.35
6.2a EWM Vhub = 0.95*V 50 ESS Hs = 1.09*H s50 _ = 0º, ±30 º Loss of grid _ -180 º < Yaw < 180 º 1.10
6.3a EWM Vhub = 0.95*V 1 ESS Hs = 1.09*H s1 _ = 0º, ±30 º Yaw = 0º, ±20 º 1.35
7.1a EWM Vhub = 0.95*V 1 ESS Hs = 1.09*H s1 _ = 0º, ±30 º Seized blade ; Yaw = 0º, ±8º 1.10
6) Parked (Idling)
7) Parked (Idling) and Fault
Winds Waves
1) Power Production
2) Power Production Plus Occurrence of Fault

21IEA Annex XXIII OC3 Meeting
Loads AnalysisResults & Discussion — Overview
Compared land- & sea-based ultimate loads
Problems with both land- & sea-based concepts were
identified:
– land: tower S-S instability when idling with loss of grid
– sea: platform yaw instability when idling with fault
– sea: susceptibility of barge to extreme waves
These problems dominate the load results
To make a fair comparison, the results are split into
groups & presented separately:
– normal operation load cases
– all other load cases:
• idling, faults, & 1- & 50-yr events

22IEA Annex XXIII OC3 Meeting
Loads AnalysisNormal Operation — DLC 1.1 Statistics

23IEA Annex XXIII OC3 Meeting
Loads AnalysisNormal Operation — DLC 1.1 Statistics (cont)

24IEA Annex XXIII OC3 Meeting
Loads AnalysisNormal Operation — Extreme Events Tables
Extreme Events for Blade 1 Root Moments — Land
Extreme Events for Blade 1 Root Moments — Sea
Blade Root
Coordinate System

25IEA Annex XXIII OC3 Meeting
Loads AnalysisNormal Operation — DLC 1.1 Animation

26IEA Annex XXIII OC3 Meeting
Loads AnalysisNormal Operation — Sea-to-Land Ratios
0
1
2
3
4
5
RootFMxy1 RootFzc1 RootMMxy1 RootMzc1
Rati
o o
f S
ea t
o L
an
d
0
1
2
3
4
5
GenPwr GenTq GenSpeed RotSpeed
Rati
o o
f S
ea t
o L
an
d
0
1
2
3
4
5
OoPDefl1 IPDefl1 TTDspFA TTDspSS
Rati
o o
f S
ea t
o L
an
d
5.6
0
1
2
3
4
5
TwrBsFMxy TwrBsFzt TwrBsMMxy TwrBsMzt
Rati
o o
f S
ea t
o L
an
d
6.0
6.4

27IEA Annex XXIII OC3 Meeting
Loads AnalysisNormal Operation — Effect of Wave Height
0
1
2
3
4
5
GenPwr GenTq GenSpeed RotSpeed
Rati
o o
f S
ea t
o L
an
d
0
1
2
3
4
5
OoPDefl1 IPDefl1 TTDspFA TTDspSS
Rati
o o
f S
ea t
o L
an
d
5.6
0
1
2
3
4
5
RootFMxy1 RootFzc1 RootMMxy1 RootMzc1
Rati
o o
f S
ea t
o L
an
d
0
1
2
3
4
5
TwrBsFMxy TwrBsFzt TwrBsMMxy TwrBsMzt
Rati
o o
f S
ea t
o L
an
d
6.0
6.4
100% - Original 75% 50% 25% 0% - Still Water

28IEA Annex XXIII OC3 Meeting
-4
-2
0
2
4
0 100 200 300 400 500 600
Time, s
S-S
T-T
De
fl,
m
No Brake
Brake
Brake Engaged
Loads AnalysisOther Load Cases — DLC 6.2a S-S Instability
Problem: energy absorption exceeds tower S-S damping
Conditions:
– 50-yr wind event for land-based turbine
– idling + loss of grid; all blades = 90º; nacelle yaw error = ±(20º to
40º)
– S-S instability diminished by compliance of barge
Possible solutions:
– modify airfoils to reduce energy absorption
– apply brake to keep rotor away from critical azimuths
29IEA Annex XXIII OC3 Meeting
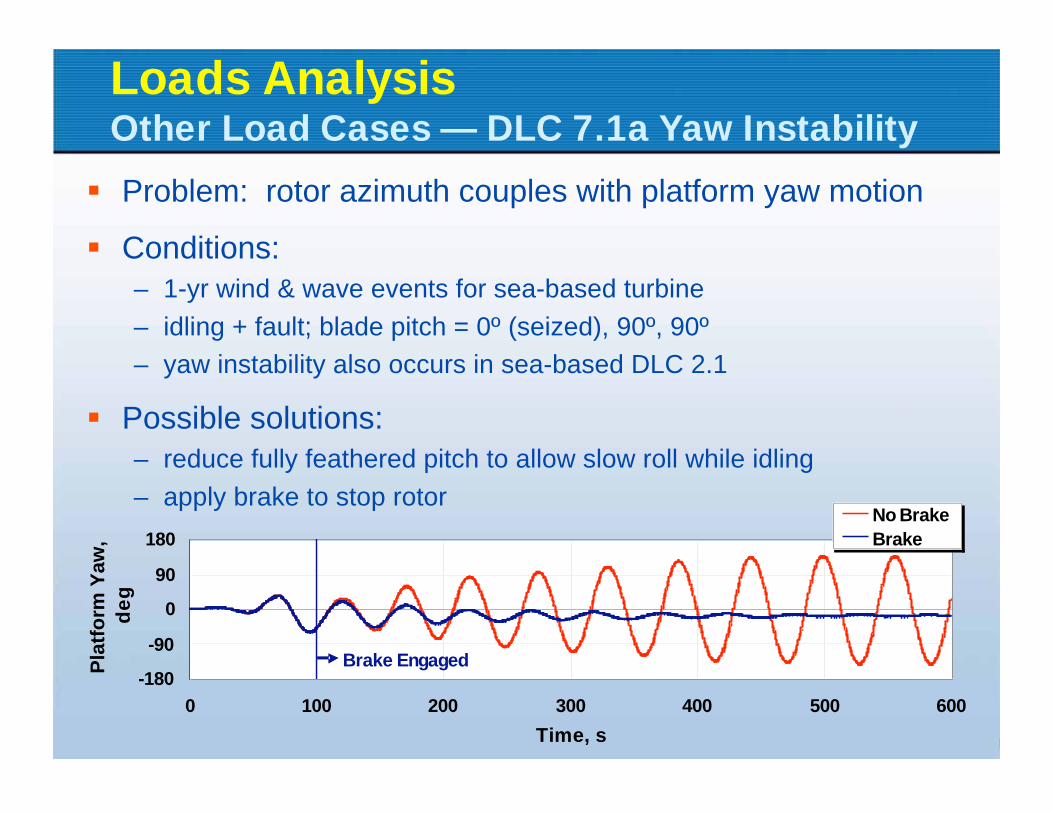
Loads AnalysisOther Load Cases — DLC 7.1a Yaw Instability
Problem: rotor azimuth couples with platform yaw motion
Conditions:
– 1-yr wind & wave events for sea-based turbine
– idling + fault; blade pitch = 0º (seized), 90º, 90º
– yaw instability also occurs in sea-based DLC 2.1
Possible solutions:
– reduce fully feathered pitch to allow slow roll while idling
– apply brake to stop rotor
-180
-90
0
90
180
0 100 200 300 400 500 600
Time, s
Pla
tfo
rm Y
aw
,
de
g
No Brake
Brake
Brake Engaged

30IEA Annex XXIII OC3 Meeting
Loads AnalysisOther Load Cases — 1- & 50-yr Events
Problem: large / steep waves lead
to large barge pitching
Conditions:
– 1- & 50-yr wind & wave events
– power production or idling
Linear hydrodynamic theory is
violated:
– will the real response be better or worse?
Possible solutions:
– streamline barge shape
– add pitch & roll dampers
– install barge only at less severe sites
ITI Energy Concept Moments
Before an Extreme Wave Event

31IEA Annex XXIII OC3 Meeting
Outline of Presentation
Introduction
Development of Simulation Capability
Design Basis & Wind Turbine Model
Verification of Simulation Capability
Loads Analysis
Influence of Control on Barge Pitch:
– Overview of Pitch-Damping Problem
– Influence of Conventional Turbine Control
Conclusions & Recommendations

32IEA Annex XXIII OC3 Meeting
In Region 3 pitch-to-feather speed regulation:
tilt into wind wind speed blade pitch thrust tilt more?
tilt out of wind wind speed blade pitch thrust tilt more?
May introduce negative damping of barge-pitch & large loads
Influence of Control on Barge PitchOverview of Pitch-Damping Problem
0
200
400
600
800
1,000
3 5 7 9 11 13 15 17 19 21 23 25
Wind Speed, m/s
Ro
tor
Th
rust,
kN
Region 1_ 2 2_ 3

33IEA Annex XXIII OC3 Meeting
Influence of Control on Barge PitchOverview of Pitch-Damping Problem (cont)
Hydrodynamic radiation damping, BRadiation
:
– BRadiation
depends on frequency of oscillation:
• damping actually described by time convolution
– instead, damping chosen at natural pitch frequency
Thrust sensitivity to wind speed, :
– two methods for estimating:
• ideal, closed-loop: compute as slope of S-S thrust vs. wind speed curve
“ideal” because there is no rotor-speed error
• open-loop method: perturb wind speed & quantify change in thrust
“open loop” because pitch isn’t varied with wind speed
T V
( ) ( ) ( )Mass Radiation Radiation Viscous Hydrostatic Lines HHI A B B C C L T+ + + + + =&& &
x x x
Hydrostatic LinesMass Radiation Radiation Viscous02 2 2
HH HH HH
M C K
C CI A B B Tx x x T
L L V L
++ ++ + + =�� �
� � � � � � � � � � � � � � � � �� � � �� � � � ��
x
xn
x
K
M=
x
x
x x
C
2 K M=
HHx L=
0
TT T x
V= �+( ) ( ) ( )Mass Radiation Radiation Viscous Hydrostatic Lines HHI A B B C C L T+ + + + + =�� � +

34IEA Annex XXIII OC3 Meeting
Influence of Control on Barge PitchOverview of Pitch-Damping Problem (cont)
-0.15
-0.10
-0.05
0.00
0.05
0.10
0.15
0.20
0.25
0.30
3 5 7 9 11 13 15 17 19 21 23 25
Wind Speed, m/s
Ba
rge
-Pit
ch
Da
mp
ing
Ra
tio
, -
Open-Loop
Ideal Closed-Loop

35IEA Annex XXIII OC3 Meeting
Feedback of Tower-Top Acceleration
Append speed controller with tower-feedback (TFB) loop:
TFB gains tested for x = 0.05 & 0.5
Active Pitch-to-Stall Speed Regulation
Pitch-to-feather S-S thrust with wind speed
Pitch-to-stall S-S thrust with wind speed
Speed controller redeveloped for pitch-to-stall & tested
May require adaptation of airfoils to get large thrust augmentation
Detuning of the Pitch-to-Feather Gains
Reduce pitch-to-feather gains to make system behave more open-loop
Gains chosen to reduce target response frequency
Upper bound to amount of attainable improvement
Influence of Control on Barge PitchInfluence of Conventional Turbine Control
0
T TT T x
V= +� + Px
K x=� ��Px
x
x x
K T
2 K M
=

36IEA Annex XXIII OC3 Meeting
Influence of Control on Barge PitchFeedback of Tower-Top Acceleration
0
2,000
4,000
6,000
8,000
Time (sec)
Ge
nP
wr,
kW
Baseline Baseline+TFB
0
500
1,000
1,500
2,000
Time (sec)
Gen
Sp
eed
, rp
m
-40
-20
0
20
40
Time (sec)
BlP
itc
h1
, º
-10
-5
0
5
10
0 50 100 150 200 250 300
Simulation Time, s
Ptf
mP
itc
h,
º

37IEA Annex XXIII OC3 Meeting
Influence of Control on Barge PitchActive Pitch-to-Stall Speed Regulation
0
2,000
4,000
6,000
8,000
Time (sec)
Ge
nP
wr,
kW
Baseline (Pitch-to-Feather) Pitch-to-Stall
0
500
1,000
1,500
2,000
Time (sec)
Gen
Sp
eed
, rp
m
-30
-15
0
15
30
Time (sec)
BlP
itch
1, º
-20
-10
0
10
20
0 50 100 150 200 250 300
Simulation Time, s
Ptf
mP
itch
, º

38IEA Annex XXIII OC3 Meeting
Influence of Control on Barge PitchActive Pitch-to-Stall Speed Regulation (cont)
-0.15
-0.10
-0.05
0.00
0.05
0.10
0.15
0.20
0.25
0.30
3 5 7 9 11 13 15 17 19 21 23 25
Wind Speed, m/s
Ba
rge
-Pit
ch
Da
mp
ing
Ra
tio
, -
Pitch-to-Feather - Open-Loop
Pitch-to-Feather - Ideal Closed-Loop
Pitch-to-Stall - Open-Loop
Pitch-to-Stall - Ideal Closed-Loop

39IEA Annex XXIII OC3 Meeting
Influence of Control on Barge PitchDetuning of the Pitch-to-Feather Gains
0
2,000
4,000
6,000
8,000
Time (sec)
Ge
nP
wr,
kW
Baseline Detuned Gains
0
500
1,000
1,500
2,000
Time (sec)
Gen
Sp
eed
, rp
m
0
6
12
18
24
Time (sec)
BlP
itc
h1
, º
-10
-5
0
5
10
0 50 100 150 200 250 300
Simulation Time, s
Ptf
mP
itc
h,
º

40IEA Annex XXIII OC3 Meeting
Influence of Control on Barge PitchDetuning of the Pitch-to-Feather Gains (cont)
0
1
2
3
4
5
GenPwr GenTq GenSpeed RotSpeed
Rati
o o
f S
ea t
o L
an
d
0
1
2
3
4
5
OoPDefl1 IPDefl1 TTDspFA TTDspSS
Rati
o o
f S
ea t
o L
an
d
5.6
0
1
2
3
4
5
RootFMxy1 RootFzc1 RootMMxy1 RootMzc1
Rati
o o
f S
ea t
o L
an
d
0
1
2
3
4
5
TwrBsFMxy TwrBsFzt TwrBsMMxy TwrBsMzt
Rati
o o
f S
ea t
o L
an
d
6.0
6.4
Baseline Detuned Gains

41IEA Annex XXIII OC3 Meeting
Outline of Presentation
Introduction
Development of Simulation Capability
Design Basis & Wind Turbine Model
Verification of Simulation Capability
Loads Analysis
Influence of Control on Barge Pitch
Conclusions & Recommendations:
– Conclusions
– Recommendations for IEC Annex XXIII OC3

42IEA Annex XXIII OC3 Meeting
Conclusions & RecommendationsConclusions
Developed fully-coupled simulation capability:
– started with FAST & ADAMS with AeroDyn
– added support-platform DOFs
– developed time-domain hydrodynamics (HydroDyn)
• interfaced SWIM & WAMIT
– developed quasi-static mooring-system module
Verified novel model features:
– hydrodynamics module
– mooring-system module
– time versus frequency domain
– all results were favorable
– gave confidence to perform more rigorous analyses
Dutch Tri-Floater

43IEA Annex XXIII OC3 Meeting
Conclusions & RecommendationsConclusions (cont)
Performed loads analysis for ITI Energy:– floating concept has similar mean loads, but larger
load excursions than the wind turbine on land
– platform motions affect the blades least, tower most
– improved loads at less severe sites
– barge mitigates S-S instability of idling turbine on land
– barge exhibits yaw instability while idling with fault
– barge susceptible to extreme waves
Examined influence of conventional control:– feedback of tower-top acceleration leads to increased
excursions in rotor speed & power
– active pitch-to-stall leads to increased barge pitching
– detuning of the pitch-to-feather gains leads to reducedbarge pitch, but limited improvement is attainable
Design changes required for technical feasibility

44IEA Annex XXIII OC3 Meeting
Conclusions & RecommendationsRecommendations for IEA Annex XXIII OC3
Simulate Spar-buoy:– “Hywind” or SWAY concept?
Define:– mass, CM location, & inertia
– diameter, draft, & water depth
– mooring system:• geometry of lines & distributed mass & stiffness or
• equivalent mooring system linear restoring matrix
– hydrodynamic parameters:• linear hydrostatic restoring matrix
• radiation / diffraction or
• equivalent Morison’s formulation
Choose load cases:– full-system natural frequencies
– NTM + NSS + normal operation
– EWM + ESS + idling
– EWM + ESS + seized blade
Identify output parameters:– typical wind turbine parameters
– platform displacements
– mooring line tensions
Spar Concept by SWAY

45IEA Annex XXIII OC3 Meeting