Dugdale, S. B. (2014). Probing the Fermi surface by...
13
Dugdale, S. B. (2014). Probing the Fermi surface by positron annihilation and Compton scattering. Low Temperature Physics, 40(4), 426-438. DOI: 10.1063/1.4869588 Publisher's PDF, also known as Version of record Link to published version (if available): 10.1063/1.4869588 Link to publication record in Explore Bristol Research PDF-document The following article appeared in Dugdale, S. B. (2014). Probing the Fermi surface by positron annihilation and Compton scattering. Fizika Nizkikh Temperatur, 40(4), 426-438 and may be found at http://dx.doi.org/10.1063/1.4869588. Copyright 2014 American Institute of Physics. This article may be downloaded for personal use only. Any other use requires prior permission of the author and the American Institute of Physics. University of Bristol - Explore Bristol Research General rights This document is made available in accordance with publisher policies. Please cite only the published version using the reference above. Full terms of use are available: http://www.bristol.ac.uk/pure/about/ebr-terms
Transcript of Dugdale, S. B. (2014). Probing the Fermi surface by...

Dugdale, S. B. (2014). Probing the Fermi surface by positron annihilationand Compton scattering. Low Temperature Physics, 40(4), 426-438. DOI:10.1063/1.4869588
Publisher's PDF, also known as Version of record
Link to published version (if available):10.1063/1.4869588
Link to publication record in Explore Bristol ResearchPDF-document
The following article appeared in Dugdale, S. B. (2014). Probing the Fermi surface by positron annihilation andCompton scattering. Fizika Nizkikh Temperatur, 40(4), 426-438 and may be found athttp://dx.doi.org/10.1063/1.4869588.
Copyright 2014 American Institute of Physics. This article may be downloaded for personal use only. Any otheruse requires prior permission of the author and the American Institute of Physics.
University of Bristol - Explore Bristol ResearchGeneral rights
This document is made available in accordance with publisher policies. Please cite only the publishedversion using the reference above. Full terms of use are available:http://www.bristol.ac.uk/pure/about/ebr-terms

Probing the Fermi surface by positron annihilation and Compton scatteringS. B. Dugdale Citation: Low Temperature Physics 40, 328 (2014); doi: 10.1063/1.4869588 View online: http://dx.doi.org/10.1063/1.4869588 View Table of Contents: http://scitation.aip.org/content/aip/journal/ltp/40/4?ver=pdfcov Published by the AIP Publishing Articles you may be interested in Photon-induced positron annihilation lifetime spectroscopy using ultrashort laser-Compton-scattered gamma-raypulses Rev. Sci. Instrum. 84, 053305 (2013); 10.1063/1.4807701 Strong quantum size effects in transition metal silicide ultrathin films: Critical role of Fermi surface nesting J. Appl. Phys. 112, 104313 (2012); 10.1063/1.4766304 Orbital characters and near two-dimensionality of Fermi surfaces in NaFe 1 − x Co x As Appl. Phys. Lett. 101, 202601 (2012); 10.1063/1.4767374 Fermiology via the electron momentum distribution (Review Article) Low Temp. Phys. 35, 599 (2009); 10.1063/1.3224712 Study on the Enhanced Contribution in Noble Metals from Positron Annihilation AIP Conf. Proc. 888, 294 (2007); 10.1063/1.2711123
This article is copyrighted as indicated in the article. Reuse of AIP content is subject to the terms at: http://scitation.aip.org/termsconditions. Downloaded to IP: 137.222.249.42
On: Wed, 22 Apr 2015 07:10:52
Probing the Fermi surface by positron annihilation and Compton scattering
S. B. Dugdalea)
H.H. Wills Physics Laboratory, University of Bristol, Tyndall Avenue, Bristol BS8 1TL, United Kingdom(Submitted December 2, 2013)
Fiz. Nizk. Temp. 40, 426–438 (April 2014)
Positron annihilation and Compton scattering are important probes of the Fermi surface. Relying on
conservation of energy and momentum, being bulk sensitive and not limited by short electronic
mean-free-paths, they can provide unique information in circumstances when other methods fail.
Using a variety of examples, their contribution to knowledge about the electronic structure of a
wide range of materials is demonstrated. VC 2014 AIP Publishing LLC.
[http://dx.doi.org/10.1063/1.4869588]
1. Introduction
Positron annihilation and Compton scattering are two
closely related experimental techniques which can be used
to investigate the Fermi surface topologies of materials.
Relying only on the conservation of energy and momentum,
these methods are not restricted by short electronic mean-
free-paths and probe the bulk (as opposed to the surface)
which means that they can provide vital information about
the electronic structure of materials in which quantum oscil-
latory (for example, via the de Haas-van Alphen (dHvA)
effect) measurements or angle-resolved photoemission spec-
troscopy (ARPES) experiments have had limited (or even
no) success. The precision with which the Fermi surface can
be determined using either positron annihilation or Compton
scattering is, however, significantly lower than that afforded
by either an angle-resolved photoemission experiment or the
measurement of quantum oscillations, and doesn’t provide
any further complementary information (for example, con-
cerning quasiparticle masses, or the band structure disper-
sion) which is available by these methods. Nevertheless, in
circumstances where these other methods are precluded (for
example, in substitutionally disordered alloys, high tempera-
ture phases or materials which do not easily cleave or in
which the surface is not representative of the bulk) then posi-
tron annihilation and Compton scattering provide an impor-
tant viable alternative.
Rather than being an exhaustive review of the field, this
paper aims to showcase the positron and Compton techni-
ques with an emphasis on what complementary information
they can bring to the field of Fermi surface measurements
across a diverse range of materials.
2. Electron momentum densities and the measurementof the Fermi surface
The electron momentum distribution (EMD), qðpÞ, can
be expressed as
qðpÞ ¼X
occ:k;j
����ð
drwk;jðrÞexpð�ip:rÞ����2
¼X
occ:k;j;G
jBjðkþGÞj2dðp� k�GÞ;
where wk;jðrÞ is the wave function of an electron in band j,and BjðkþGÞ are the Fourier coefficients of the electron
wavefunction, and the d function expresses the conservation
of crystal momentum.
This EMD is a single-centre distribution in p-space
which just has the point symmetry of the crystal. It can, how-
ever, be transformed into a distribution which has the trans-
lational invariance of the underlying reciprocal lattice using
the so-called Lock–Crisp–West (LCW) theorem1 which pre-
scribes a further sum over reciprocal lattice vectors:
XG0
qðpþG0Þ ¼X
G0
Xocc:k;G;j
jBjðkþGÞj2dðp� k�GþG0Þ:
There is now a double summation over reciprocal lattice vec-
tors which allows us to regroup the various terms which
involve the same vector G00 ¼ G�G0. The d-function,
which originally redistributed the information in the first
Brillouin zone out into higher zones, now has the effect of
producing the same distribution about each reciprocal lattice
point, i.e.,
XG0
qðpþG0Þ ¼XG00
Xocc:k;G;j
jBjðkþGÞj2dðp� k�G00Þ:
Since the the electron wavefunctions are normalized,
XG
jBjðkþGÞj2 ¼ 1;
and therefore in the first Brillouin zone we can write
qðkÞ ¼X
j
njðkÞ:
The shape of the Fermi surface can straightforwardly be
inferred from the changes in the occupation function, njðkÞacross the Brillouin zone.
3. Two-photon momentum densities and the measurementof the Fermi surface
The two-photon momentum density (TPMD), q2cðpÞ,sometimes referred to as the electron–positron momentum
density, can be expressed as
q2cðpÞ ¼X
occ:k;j
����ð
drffiffiffiffiffiffiffifficðrÞ
pwk;jðrÞwþðrÞexpð�ip:rÞ
����2
;
1063-777X/2014/40(4)/11/$32.00 VC 2014 AIP Publishing LLC328
LOW TEMPERATURE PHYSICS VOLUME 40, NUMBER 4 APRIL 2014
This article is copyrighted as indicated in the article. Reuse of AIP content is subject to the terms at: http://scitation.aip.org/termsconditions. Downloaded to IP: 137.222.249.42
On: Wed, 22 Apr 2015 07:10:52

where wk;jðrÞ and wþðrÞ are the electron and positron wave
functions, respectively, G is a reciprocal lattice vector, and
cðrÞ is the so-called enhancement factor which takes account
of electron–positron correlations (and would be unity in the
independent particle model (IPM)).2 The problem of dealing
with enhancement is an important one (and one which is still
the subject of current studies3,4), but a proper treatment is
beyond the scope of this review and discussions can be
found elsewhere.2,5,6
The application of the LCW theorem becomes
XG0
q2cðpþG0Þ ¼XG00
Xocc:k;G;j
jCjðkþGÞj2dðp� k�G00Þ;
where the CjðkþGÞ are the Fourier coefficients of the
electron-positron wave function product. Writing vjðkÞ¼ jCjðkþGÞj2, within the first Brillouin zone,
q2cðkÞ ¼X
j
njðkÞvjðkÞ:
Therefore, in the case of positron with a k-dependent
wavefunction, the electron occupancy is smoothly modu-
lated by the vjðkÞ function. Since these smoothly varying
modulations are quite different from the relatively large and
sudden changes in occupancy when a band crosses the Fermi
energy, the effect of the positron wavefunction is to slightly
impede, but not prevent the measurement of Fermi surfaces.
4. Positron annihilation and Compton scattering
As we have seen from the previous section, both the elec-
tron and the two-photon momentum densities contain informa-
tion about the Fermi surface. The three-dimensional densities
are not themselves measured directly. Experimentally, the
EMD is accessed via 1D projections known as Compton pro-
files (J(pz))
JðpzÞ ¼ð ð
dpxdpyqðpÞ :
Compton profiles are obtained from the energy distribu-
tion of inelastically scattered photons (typically, x-rays
from a synchrotron source). A variety of designs for high-
resolution spectrometers have existed, but a description of a
typical spectrometer, located at the SPring-8 synchrotron can
be found in Refs. 7 and 8.
In a Two Dimensional Angular Correlation of positron
Annihilation Radiation (2D-ACAR) experiment, the angu-
lar distribution of c-photons emanating from the electron–
positron annihilation in the sample being studied is
measured. The deviation from anti-collinearity of the two
photons is measured by a pair of position-sensitive detec-
tors which are located either side of the sample chamber,
and this deviation is proportional to the momentum compo-
nents of the annihilated electron-positron pair in the plane
perpendicular to the spectrometer (detector–sample–detector)
axis. The third momentum component would be expressed as
a Doppler shift in the energy of the photons, but this is not
usually measured. Therefore, the measured distribution,
Nðpx; pyÞ, is an integration of the TPMD over this
component.
Nðpx; pyÞ ¼ð
dpzq2cðpÞ:
Different technologies have been used for the position sensi-
tive detectors and descriptions of the detection systems in
spectrometers currently in use (including the latest develop-
ments) can be found in Refs. 9–11.
5. Three dimensional reconstruction
Although a positron measurement yields a 2D projection
(integration over one momentum component) of the underly-
ing momentum density, and a Compton profile represents a
1D projection (integration over two momentum compo-
nents), it is possible to use tomographic methods to recon-
struct the full three dimensional density. In this context, the
work of Kontrym–Sznajd deserves special mention. Building
on the work of Cormack,12,13 Kontrym–Sznajd championed
the so-called modified Cormack method of reconstruction,14
which has facilitated high-fidelity reconstructions of the
Fermi surfaces of a variety of materials.
Measurement of sufficiently different 2D-ACAR projec-
tions or Compton profiles has to be balanced against the real
time available to collect the data. The compromise is usually
to settle, in the case of a positron experiment, for typically
�5 projections measured down different crystallographic
directions. While there is much to be gained from measuring
some special directions,15 in practice a mixture of high-
symmetry and some lower symmetry directions are often
measured. In this section some examples of three-
dimensional reconstructions are presented, with the particu-
lar materials chosen to illustrate the quality of information
which can be extracted.
5.1. Helical ordering in the rare-earths
The role of the so-called “webbing” Fermi surface16 in
driving the magnetic order in the heavy rare earths is, today,
well established.17 Positron annihilation was used right from
the beginning of such investigations, with early calculations
by Loucks including a calculation of the positron wavefunc-
tion.18 In a series of positron annihilation experiments on Y
and its alloys with Gd,19–21 Dugdale et al. were able to
experimentally establish the existence of this webbing, show
that the size of the vector which spanned the webbing could
be linked with the magnetic ordering vectors when small
amounts of rare earth were alloyed into Y,22 and monitor its
evolution under doping.
In Fig. 1, this evolution is shown for pure Y and two dif-
ferent Gd–Y alloys. The webbing can be identified as the flat
sections perpendicular to the c* axis. Subsequent Compton
scattering experiments by Kontrym-Sznajd et al. in Y (Ref.
23) were in agreement with the earlier positron results.
5.2. ZrZn2
At the time, the observation of superconductivity in
ZrZn2 (Refs. 24 and 25) caused great excitement, following
so soon after the discovery of triplet superconductivity in
UGe2.26 The shape of the Fermi surface was the focus of
much attention,27,28 and measurements of de Haas–van
Alphen oscillations in the ferromagnetic phase29 and the par-
amagnetic Fermi surface by positron annihilation24 revealed
Low Temp. Phys. 40 (4), April 2014 S. B. Dugdale 329
This article is copyrighted as indicated in the article. Reuse of AIP content is subject to the terms at: http://scitation.aip.org/termsconditions. Downloaded to IP: 137.222.249.42
On: Wed, 22 Apr 2015 07:10:52

four separate sheets of Fermi surface (see Fig. 2) which were
in excellent agreement with the predictions of band structure
calculations. Although it was later found to be due to the
spark erosion which led to superconductivity in a
Zn-depleted surface layer,30 the paper of Major et al.24 is an
excellent example of the high quality information which can
be extracted.
5.3. Compositional short-range order in Cu1–xPdx alloys
Diffuse scattering in x-ray and electron diffraction pat-
terns measured in substitutionally disordered Cu–Pd
alloys31,32 has its origins in the nesting of the Fermi surface.
Inspired by the calculations of Gyorffy and Stocks33 which
made a direct connection between the size and shape of the
Fermi surface and the positions of the diffuse spots,
Wilkinson et al. made a series of positron annihilation meas-
urements in order to reconstruct the Fermi surface and inves-
tigate its nesting propensities.34
The experimentally measured Fermi surface of Cu0.6Pd0.4
is shown in Fig. 3, and in Fig. 4 some slices through the meas-
ured Fermi surfaces are shown for the two different alloy con-
centrations, together with the theoretical predictions. It should
be noticed how the Fermi surface of Cu0.6Pd0.4 has larger flat
areas than Cu0.72Pd0.28, which make it better nested.
That the Fermi surface of Cu0.6Pd0.4 is much more
nested than Cu0.72Pd0.28 explains not only the location of the
diffuse scattering peaks32 but also their relative intensity.
Interestingly, the calculations which are performed within
the mean-field coherent potential approximation,35 while not
able to perfectly predict the real Fermi surfaces (for exam-
ple, in the calculations they predict that the necks, familiar
from the pure Cu Fermi surface, along the h111i directions
are still present), are able to accurately predict both qualita-
tively and quantitatively the trends under doping. A similar
FIG. 1. Positron annihilation measurements of the FS topologies in pure Y
(top left), Gd0.62Y0.38 (top right) and Gd0.70Y0.30 (bottom).
FIG. 2. Positron annihilation measurements of the Fermi surface topology
of paramagnetic ZrZn2. The band numbering refers to the original paper24
and note that all four sheets are clearly revealed.
FIG. 3. The Fermi surface of Cu0.6Pd0.4, reconstructed from 2D-ACAR
projections.
FIG. 4. (100) (left hand side) and (110) (right hand side) planes through the
Fermi surface of Cu0.72Pd0.28 (top) and Cu0.6Pd0.4 (bottom). The solid lines
represent the experimental data and the dashed lines the KKR–CPA calcula-
tion; the boundary and selected symmetry points of the first BZ are also
shown.
330 Low Temp. Phys. 40 (4), April 2014 S. B. Dugdale
This article is copyrighted as indicated in the article. Reuse of AIP content is subject to the terms at: http://scitation.aip.org/termsconditions. Downloaded to IP: 137.222.249.42
On: Wed, 22 Apr 2015 07:10:52
conclusion was reached on the basis of a reconstruction from
28 directional Compton profiles in a Cu0.75Pd0.25 measured
by Matsumoto et al.36
6. Charge and spin-density waves
Charge- and spin-density wave systems have proven a
fertile ground for positron annihilation experiments. In the
presence of a density wave modulation, there will be an
additional smearing (proportional to the size of the energy
gap) in the momentum density discontinuity at the wave-
vector centred on the energy gap induced by the new peri-
odic modulation.37 This contribution, however, is of the
order of, or even much smaller than, the smearing due to the
instrumental resolution. The consequence, therefore, is that
one is able to “see” the ungapped Fermi surface and thus
investigate the role of the Fermi surface in the formation of
that density wave.
6.1. Charge density waves in the tri-tellurides
It is almost half a century since Peierls pointed out that a
one-dimensional metal coupled to its lattice was unstable.38
The pioneering work of Wilson et al. in studying the connec-
tion between Fermi surface nesting and CDW formation in
layered structures (e.g., Ref. 39) was instrumental in laying
the foundations for investigations of ever more electronically
complex materials (such as Lu5Ir4Si10 (Ref. 40) or RNiC2
(Ref. 41)). More recently, Johannes and Mazin have care-
fully studied the connection between Fermi surface nesting
and CDW formation in real materials, and emphasised that
Fermi surface nesting is unlikely to be solely responsible in
most cases.42 Moreover, they emphasised the importance of
verifying that peaks in the imaginary part of the generalized
susceptibility carry through into the real part at the correct
wavevector if the Fermi surface is to be held accountable.
The work of Laverock et al. in 2H-TaSe2 which combined
ARPES with a tight-binding band structure fitted to the data,
has shown just how subtle (and unconventional) the role of
the Fermi surface can be.43
The rare-earth tritellurides (RTe3) have, over the past
decade, become an important prototype system for the study
of charge-density waves (CDWs), and are an excellent
example of a material where important information can be
obtained from positron annihilation. With the compounds
stable for rare earths from La to Tm, they represent a model
system for studying the interactions between the electrons
and the lattice, for example, by using chemical pressure.44
Moreover, angle-resolved photoemission is unable to see the
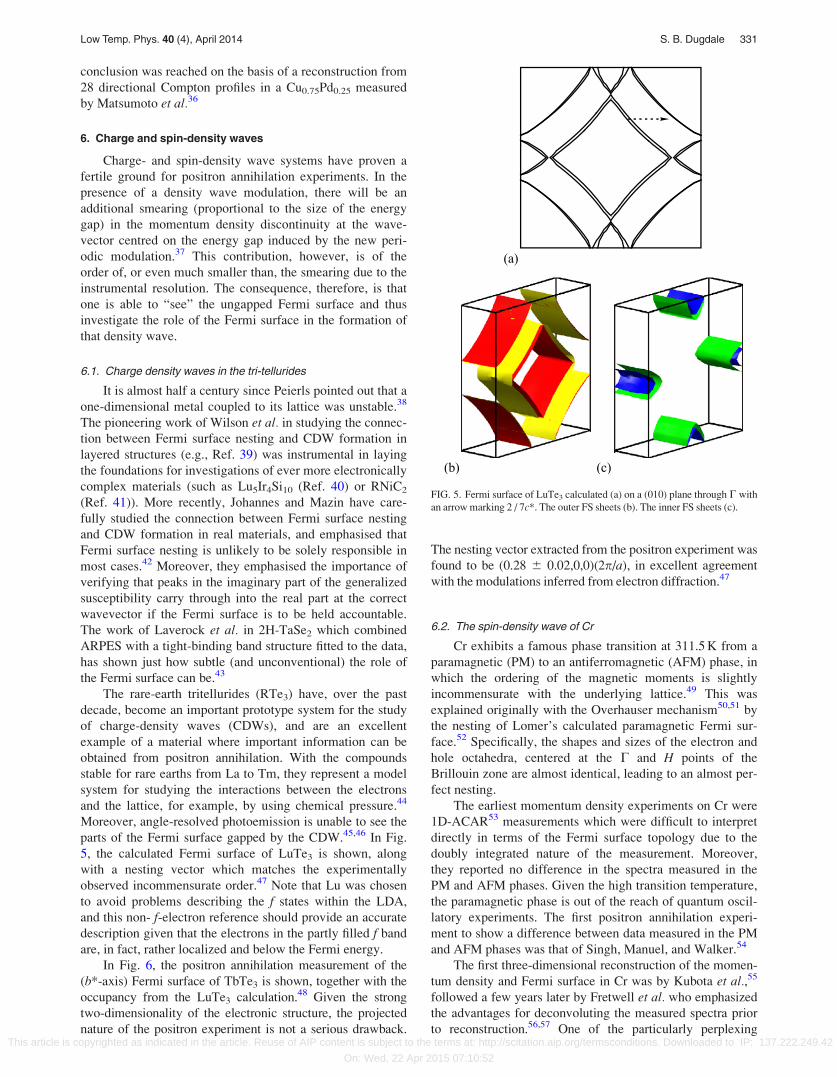
parts of the Fermi surface gapped by the CDW.45,46 In Fig.
5, the calculated Fermi surface of LuTe3 is shown, along
with a nesting vector which matches the experimentally
observed incommensurate order.47 Note that Lu was chosen
to avoid problems describing the f states within the LDA,
and this non- f-electron reference should provide an accurate
description given that the electrons in the partly filled f band
are, in fact, rather localized and below the Fermi energy.
In Fig. 6, the positron annihilation measurement of the
(b*-axis) Fermi surface of TbTe3 is shown, together with the
occupancy from the LuTe3 calculation.48 Given the strong
two-dimensionality of the electronic structure, the projected
nature of the positron experiment is not a serious drawback.
The nesting vector extracted from the positron experiment was
found to be (0.28 6 0.02,0,0)(2p/a), in excellent agreement
with the modulations inferred from electron diffraction.47
6.2. The spin-density wave of Cr
Cr exhibits a famous phase transition at 311.5 K from a
paramagnetic (PM) to an antiferromagnetic (AFM) phase, in
which the ordering of the magnetic moments is slightly
incommensurate with the underlying lattice.49 This was
explained originally with the Overhauser mechanism50,51 by
the nesting of Lomer’s calculated paramagnetic Fermi sur-
face.52 Specifically, the shapes and sizes of the electron and
hole octahedra, centered at the C and H points of the
Brillouin zone are almost identical, leading to an almost per-
fect nesting.
The earliest momentum density experiments on Cr were
1D-ACAR53 measurements which were difficult to interpret
directly in terms of the Fermi surface topology due to the
doubly integrated nature of the measurement. Moreover,
they reported no difference in the spectra measured in the
PM and AFM phases. Given the high transition temperature,
the paramagnetic phase is out of the reach of quantum oscil-
latory experiments. The first positron annihilation experi-
ment to show a difference between data measured in the PM
and AFM phases was that of Singh, Manuel, and Walker.54
The first three-dimensional reconstruction of the momen-
tum density and Fermi surface in Cr was by Kubota et al.,55
followed a few years later by Fretwell et al. who emphasized
the advantages for deconvoluting the measured spectra prior
to reconstruction.56,57 One of the particularly perplexing
FIG. 5. Fermi surface of LuTe3 calculated (a) on a (010) plane through C with
an arrow marking 2 / 7c*. The outer FS sheets (b). The inner FS sheets (c).
Low Temp. Phys. 40 (4), April 2014 S. B. Dugdale 331
This article is copyrighted as indicated in the article. Reuse of AIP content is subject to the terms at: http://scitation.aip.org/termsconditions. Downloaded to IP: 137.222.249.42
On: Wed, 22 Apr 2015 07:10:52

issues was that the comparison of the experimental Cr spectra
with theory, for both the positron annihilation measure-
ments58 and later Compton scattering,59,60 was always sub-
stantially less favorable than the comparison between
measurement and theory in Sec. V. Positron measurements in
Mo, which being isoelectronic to Cr was thought to possess a
very similar Fermi surface, conversely agreed very well with
theoretical predictions.58 The eventual explanation for this
came much more recently, when Laverock et al. showed that
the discrepancy came from a combination of inadequacies in
the description of the electron-positron interaction (the so-
called enhancement) and a real difference in the band struc-
ture.4 Laverock et al. were also able to show (Fig. 7) that a
band structure tuned to the experimental data was able to pre-
dict a peak in the generalized susceptibility at a wavevector
which matched the small incommensurability of the spin-
density wave in Cr, highlighting both the role of the Fermi
surface and the power of the positron technique in being able
to deliver such precise information.4
The power of the technique for revealing evolutionary
trends in the topology of the Fermi surface under different
dopings in substitutionally disordered alloys was demon-
strated in the work of Hughes et al.61 The primary objective
of that work was to identify which particular part of
the Fermi surface was responsible for mediating (via an
RKKY-type interaction) the oscillatory exchange coupling
in the non-magnetic spacer layers in magnetic multi-
layers.62,63 These spacer layers included Cr and its alloys
with V and, on the basis of an extensive measurement pro-
gramme, it was possible to reveal that the N-hole Fermi sur-
face pockets evolved with doping in a manner consistent
with the observed oscillation periods.
7. Heavy fermions
The question of the degree of f-electron localization in
rare-earth compounds is intimately connected with the
strength of electron–electron correlations. From the perspec-
tive of density-functional theory, and in particular the com-
monly used local density approximation (LDA) to the
exchange-correlation functional, accurate descriptions of the
electronic structure of f electron systems pose a challenge.
One of the important questions in heavy fermion physics is
whether the f electrons become itinerant and contribute to
the Fermi surface below some temperature characteristic of
the heavy fermion state, known as the coherence tempera-
ture. With its ability to probe as a function of temperature,
and its insensitivity to the quasiparticle mass (in contrast to
quantum oscillations, where heavy orbits are more difficult
to see, needing high magnetic fields), positron annihilation
has been able to shed some light on this problem.
FIG. 7. The real (top) and imaginary (bottom) parts of the static susceptibil-
ity, v0ðqÞ, of paramagnetic Cr, calculated for the raw band LMTO calcula-
tions as well as the results of the rigid-band fit to the data with the
independent particle model (IPM), Jarlborg-Singh (JS,2) and state-
dependent (SD,4) models of enhancement. The dashed vertical line repre-
sents the peak in the real part of the susceptibility. The inset shows a slice of
the FS through the (001) plane, with the arrow depicting the nesting that
gives rise to the peak in Im v0ðqÞ between the hole (outer) and electron
(inner) FS sheets.
FIG. 6. Occupancy within the Brillouin zone obtained (a) from the LuTe3
calculation, and (b) from the positron experiment on TbTe3. White repre-
sents high occupancy and black represents low occupancy.
332 Low Temp. Phys. 40 (4), April 2014 S. B. Dugdale
This article is copyrighted as indicated in the article. Reuse of AIP content is subject to the terms at: http://scitation.aip.org/termsconditions. Downloaded to IP: 137.222.249.42
On: Wed, 22 Apr 2015 07:10:52
7.1. CeIn3
The value of the positron annihilation technique in
heavy fermion physics is typified by the comprehensive
study of the three-dimensional antiferromagnetic supercon-
ductor CeIn3 in its paramagnetic phase by Biasini et al.64
Five separate spectra were collected with integration direc-
tions between the [100] and [110] crystallographic direc-
tions, and these were then used to tomographically
reconstruct the three dimensional momentum density, and
LCW-folded occupancies within the first Brillouin zone. The
theoretical model in which the f electrons were treated as
localized core states produced a Fermi surface which was
unambiguously more consistent with the positron experi-
ment. When their 3D data were LCW-folded according the
AF until cell (to simulate what might be observed in the AF
phase), a Fermi surface emerges which is consistent with
dHvA measurements65 in the antiferromagnetic phase, lead-
ing Biasini et al. to conclude that the f electrons remain
localized. This conclusion has, however, been challenged by
recent (dynamical mean field theory, DMFT) calculations.66
7.2. CeRu2Si2 and LaRu2Si2
Comparisons between Ce-containing heavy fermions
and their non- f La counterparts can be very useful in isolat-
ing the behavior of the f electrons. CeRu2Si2 is often consid-
ered to be the archetypal heavy fermion system,67 and
Monge et al.68 performed positron annihilation experiments
in both that compound and LaRu2Si2. De Haas–van Alphen
experiments in CeRu2Si2 (Ref. 69) at temperatures well
below the Kondo temperature (TK � 20 K) seemed to indi-
cate that the f electrons were itinerant. As in CeIn3, five pro-
jections were measured at a temperature of 60 K (above TK)
with integration directions between the [100] and [110] crys-
tallographic directions prior to tomographic reconstruction
of the 3D momentum densities and then Fermi surfaces in
both compounds. By comparing their data for the Ce com-
pound with LDA calculations in which the f electrons were
either localized or itinerant, and with LaRu2Si2, they were
able to determine that the localized description was appropri-
ate. This careful comparison further showed that a rigid
upward shift of the Fermi energy by 11mRy (�0.15 eV) was
necessary to bring the theoretical calculation for LaRu2Si2into agreement with experiment. This kind of shift (albeit for
individual bands, rather than a global shift) was found to be
necessary recently in Fermi surface measurements in the
Fe-pnictide superconductors on the basis of quantum oscilla-
tions70 and Compton scattering,71 and has also been found to
be necessary to accurately reproduce Fermi surfaces in other
materials.72,73 As Monge et al. pointed out, however, if such
shifts are necessary even without the complexities intro-
duced by f electrons, it does call into question the assertion,
based on such LDA calculations and dHvA data,69,74 that the
f electrons are itinerant in the heavy fermion state.
7.3. CeCu2Si2
In contrast to the localized f-electron picture in CeRu2Si2,
the positron annihilation experiments of Vasumathi et al.which probed the Fermi surface of CeCu2Si2 indicated that
f-electrons are itinerant, but to a lesser extent than predicted
by LDA calculations.75 By shifting the f bands relative to the
Fermi energy they found a better agreement between calcula-
tion and experiment, and the effect of the band shift was to
decrease the f-electron population.
8. Confined positrons in precipitates
It is possible to take full advantage of the positron’s
preference for a particular annihilation environment (its so-
called affinity, defined as the difference between the internal
electron and positron chemical potentials76) to create a
powerful probe in which the positrons behave like “magic
bullets”. Simply put, in some heterostructure made from dif-
ferent components, the positron affinity will indicate the
preference for the positron for one component over another.
Thus, if the positron affinity is greater for a precipitate rather
than the host matrix, then the positron will show a preference
for annihilation within the precipitate. This has been referred
to as an affinity-induced quantum-dot-like state.77 Early
positron experiments showed that positrons could indeed be
confined within nano-, and even subnanosized particles of
Cu embedded within a dilute Fe–Cu alloy, and that these
ultrafine particles had the momentum distribution very simi-
lar to bulk Cu.78 Subsequent 2D-ACAR experiments on Cu
nanocrystals embedded in Fe, prepared by the thermal aging
of a single crystal of a Fe–1.0 wt. % Cu alloy, were able to
reveal the Fermi surface of bcc Cu with necks reaching out
to the {110} Brillouin zone boundaries.84 Inspired by the
classical Hume–Rothery rules which come from the interac-
tion of the Fermi surface with the Brillouin zone boundary,
essential idea of Nagai et al. was that a given precipitate will
adopt whatever lattice structure avoids it having to occupy
the electronic states which are in the higher energy band,
which means that a stable precipitate in a given matrix struc-
ture will adopt its chemical composition to give an opti-
mized electron per atom ratio. The formation of Fermi
surface necks will, quite generally, cause a reduction in the
total electronic energy due to the interaction of the electronic
states with the zone boundary (the so-called “bandgap”
effect). Nagai et al. went on to outline a general approach
for predicting the chemical composition of solute nanoclus-
ters which are coherent to a matrix with nearly free electrons
(such as Al, for example).79 Using Ag-rich and Zn nanoclus-
ters within an Al matrix as examples, and with ab initio cal-
culations of the anisotropies of the momentum distributions
of possible chemical compositions with different structures
(e.g., fcc Zn, L12 Al3Ag, L10 AlAg, L1 2 AlAg3) they were
able to show that examining the experimental data for the
presence of Fermi surface necks was the key to identifying
the chemical composition. Toyama et al. were able to use
the additional smearing of the Fermi surface due to
finite-size effects to estimate the size of embedded
nano-precipitates.80
Owing to their technological use in aerospace applica-
tions, Al alloys have a special importance. Alloying with
small amounts of Li (in the range of 5–25%) results in a
stronger, lighter alloy with the formation of metastable d0
precipitates. These precipitates are in fact highly ordered
L12 Al3Li which is coherent with the parent fcc Al matrix
with only a small lattice mismatch.81,82 Using the positron’s
affinity for the precipitates, the Fermi surface of Al3Li was
determined using positron annihilation on an Al–9 at. % Li
Low Temp. Phys. 40 (4), April 2014 S. B. Dugdale 333
This article is copyrighted as indicated in the article. Reuse of AIP content is subject to the terms at: http://scitation.aip.org/termsconditions. Downloaded to IP: 137.222.249.42
On: Wed, 22 Apr 2015 07:10:52

sample by Laverock et al.83 Four different crystallographic
projections were measured (see Fig. 8) and, informed by abinitio calculations Laverock et al. were able to determine
that all positrons were trapped within and annihilated from
the Al3Li d0 precipitates. The data presented in Fig. 8, where
comparison is made with theoretical calculations made
within the independent particle model, and within the empir-
ical state-dependent enhancement approach developed by
Laverock et al.,4 are compatible with the Fermi surface pre-
dicted by the band structure of Guo et al.84
9. Shape memory alloys
The shape memory phenomenon is associated with a
martensitic transformation, a diffusionless solid–solid phase
transition which itself is often associated with a soft phonon
mode. When the martensitic transformation occurs as a func-
tion of temperature, pre-martensitic phenomena (for exam-
ple, an incomplete softening of a phonon mode) are
sometimes observed at substantially higher temperatures,
and there is considerable evidence that Fermi surface nesting
is responsible. Moreover, these premartensitic phenomena
are considered to be precursors of the soon-to-be incipient
martensitic transition.
Although substitutional disorder makes the observation
of quantum oscillations very difficult (or even impossible),
de Haas–van Alphen measurements have been able to make
important contributions in the ordered AuZn.85,86 However,
many of the alloys are substitutionally disordered, or
experiments are excluded because the relevant phase occurs
at high temperature. Furthermore, positron annihilation
experiments are made more difficult, but not excluded (see
the Ni2MnGa results below) by single crystals which seem
to be more prone to higher vacancy concentrations (which
trap the positrons and suppress the signal).
9.1. Ni1–xAlx
Kohn anomalies87 driven by nestable regions on the
Fermi surface impacting on the electronic screening (and
hence on the electron–phonon coupling) were initially sug-
gested as the origin of the premartensitic phenomena (such
as premartensitic phonon softening88) by Zhao and
Harmon.89 Given the disordered nature of the alloys, the
degree to which the Fermi surface remains a well-defined,
sharp entity is an important consideration. KKR–CPA calcu-
lations90 indicate, however, that the nested part in Ni1–xAlx,
identified by Zhao and Harmon, remains relatively sharp.
From an experiment which involved the measurement of 24
Compton profiles of a Ni0.68Al0.32 single crystal along direc-
tions which were specially chosen to be particularly efficient
for the Jacobi-polynomial-based reconstruction method,15,91
Watts et al. were able to obtain the Fermi surface.90 In Fig.
9, the Fermi surface predicted by KKR calculations is com-
pared with the experimentally obtained one. The agreement
is rather good, with the exception of a neck which appears to
touch the Brillouin zone at the X point which is not present
FIG. 8. Positron annihilation data in the first BZ for Al–9 at. % Li, shown in
the right panel of each figure, projected along the [100] (a), the [110] (b),
the [111] (c) and the [210] (d) crystallographic directions. The high-
symmetry points in projection have been labelled for each direction, and the
projected BZ is marked in (c). In the bottom left panel, the independent par-
ticle model electron-positron momentum density from the LMTO calcula-
tion is shown, and the tuned calculation (see Refs. 4 and 83) is presented in
the top left panel. All theoretical distributions have been convoluted with
the experimental resolution function.
FIG. 9. Ni0.62Al0.38. Fermi surface predicted by KKR–CPA calculations
(top left) and that reconstructed from a Compton scattering experiment90
(top right). The occupation density through a (001) plane at kz ¼ 0.48 (p/a),
where brighter shades represent a higher occupation is shown (bottom) to-
gether with a contour of this occupation density at the level corresponding
to the Fermi energy.
334 Low Temp. Phys. 40 (4), April 2014 S. B. Dugdale
This article is copyrighted as indicated in the article. Reuse of AIP content is subject to the terms at: http://scitation.aip.org/termsconditions. Downloaded to IP: 137.222.249.42
On: Wed, 22 Apr 2015 07:10:52

by the theory. Importantly for the nesting hypothesis, how-
ever, the nested region of the Fermi surface, which is most
easily observed in a (100) plane at kz ¼ 0.48 (p/a) (also
shown in Fig. 9), is very well predicted by the KKR–CPA
theory. Given that the CPA is a mean-field theory, it is per-
haps not too surprising that the agreement is not perfect, and
non- local-CPA calculations might prove interesting.92
9.2. Ni1–xTix
NiTi is unequivocally the most technologically exploited
shape-memory alloy. Inelastic neutron scattering in the high-
temperature phase found a temperature-dependent softening
of the TA2 [110] phonon branch near a q vector of 1/3 [110]
2p/a,93,94 this being a nesting vector in the Fermi surface cal-
culated by Zhao and Harmon95 (and which gives rise to an
instability in their calculated phonon spectrum). By meas-
uring Compton profiles along 28 different crystallographic
directions in a single crystal of Ni0.515Ti0.485, and then recon-
structing them using a direct Fourier method,96 Shiotani et al.were able to infer the Fermi surface.97 In contrast to Ni1–xAlx,
the nested regions of Fermi surface are harder to see directly,
and while the overall Fermi surface topology is very close to
that predicted by Zhao and Harmon, they do point out some
discrepancies (which could be due to the treatment, or rather
the lack of treatment of the substitutional disorder).
9.3. Ni2MnGa
Heating and cooling through an martensitic transforma-
tion is often too slow for non-magnetic shape-memory materi-
als to be used as actuators. This has led to an intense search for
and development of materials, such as Ni2MnGa, where struc-
tural changes can be induced by an external magnetic field.98
Stoichiometric Ni2MnGa is ferromagnetic below TC � 380 K
and undergoes a transition from the cubic L21 phase to a modu-
lated tetragonal structure with c/a¼ 0.97 at TM� 220 K.99,100
There has been substantial theoretical work on the role
of the Fermi surface in this material. Velikokhatnyi and
Naumov101 studied the Fermi surface of Ni2MnGa for nest-
ing instabilities and identified a number of possible nesting
vectors which could play roles in the martensitic and premar-
tensitic transitions. But, as pointed out by Lee et al., within a
simple Stoner picture of the magnetism, the exchange split-
ting, magnetic moment and Fermi surface is evolving with
temperature, below the Curie temperature.102 Using this sim-
ple picture, they were able to make calculations of the gener-
alized susceptibility as a function of magnetization (and thus
temperature) and show that at the temperature of the premar-
tensitic transition, there was substantial Fermi surface nest-
ing.102 First principles calculations of the lattice instabilities
were performed by Bungaro and Rabe,103 but some vectors
identified in the Fermi surface topology do not appear to be
proper nesting vectors.
A positron annihilation study by Haynes et al.104 has
helped to clarify the Fermi surface topology. Haynes et al.were able to make a full three-dimensional reconstruction of
the Fermi surface at 300 K from six measured projections. A
visualization of the resulting Fermi surface is shown in Fig.
10, together with that from theoretical calculations. A careful
analysis of the experimental densities, and comparison with
the corresponding theoretical ones helped Haynes et al.
identify the nested sheets of Fermi surface suggested by
Entel et al.105 and Lee et al.102
10. Organic conductors
Tetrathiafulvalere–tetracyan/quinodimethan (TTF–TCNQ)
is an organic conductor.106 Although the traditional LCW
analysis could not resolve a Fermi surface due to the finite
resolution, large unit cell (and therefore small Brillouin
zone), or possible trapping due to defects created by the
radiation, Ishibashi et al. used Compton scattering to study
the momentum density in Ref. 107 and demonstrated the
sensitivity of the Compton technique to the differences in
the descriptions of the electronic wavefunctions used in the
molecular orbital calculations. Reasonable agreement was
demonstrated between the measured anisotropy in the
Compton profiles along different crystallographic directions
and molecular orbital calculations in which TTF and TCNQ
were treated as separate molecules and their results super-
posed, but the best agreement was with a band structure
calculation.
In bis-tetramethyl-tetraselenofulvalene perchlorate
((TMTSF)2ClO4, where TMSF is (CH3)4C6Se4) Ishibashi
et al. were able to resolve a step-like structure in their
LCW-folded data,108 but they were not able to unambigu-
ously determine whether this was a Fermi surface or not.
11. Superconductors
Both positron annihilation and Compton scattering have
been able to make substantial contributions to our under-
standing of the electronic structure of superconductors.
11.1. High-temperature superconductors
Already with the A15 materials, (Nb3Sn,109 V3Si (Refs.
110 and 111)) positron annihilation was beginning to emerge
FIG. 10. Experiment and theory for Ni2MnGa. (a) and (b) show isosurfaces
of the 3D tomographic reconstructions of 2D-ACAR data, determined from
discontinuities in the 3D momentum density. (c) and (d) display the
expected contours from the theory, which were extracted in the same way as
the experimental contours and includes the expected Fermi broadening.
Low Temp. Phys. 40 (4), April 2014 S. B. Dugdale 335
This article is copyrighted as indicated in the article. Reuse of AIP content is subject to the terms at: http://scitation.aip.org/termsconditions. Downloaded to IP: 137.222.249.42
On: Wed, 22 Apr 2015 07:10:52

as an important tool for Fermi surface studies in superconduc-
tors. There was a tremendous surge of activity following the
discovery of high-temperature superconductivity in the cup-
rates, as discussed in the comprehensive review by Peter
et al.112 One of the significant challenges encountered in the
experiments on YBa2Cu3O7 was the unavoidable (Coulomb-
driven) preference of the positron for the Cu–O chains over
the Cu–O2 planes. Sampling all electrons equally, Compton
scattering does not suffer from this drawback, and has
recently been used to probe the orbital character of holes
doped into La2xSrxCuO4.113 In a combined experimental and
theoretical tour de force, Sakurai et al. were able to show that
on the underdoped side of the phase diagram, the holes were
primarily in the O 2px/py orbitals, but on the overdoped side
they mostly dope into the Cu d orbitals. Robust from surface
effects, defects or impurities, Compton scattering was shown
to be a powerful probe of the orbital character of dopants in
electronically complex materials.
11.2. Hydrated Na cobaltates
The discovery114 of superconductivity at 5 K in hydrated
NaxCoO2 was quickly followed by theoretical speculation
about the role of Fermi surface nesting,115 and a series of
attempts to measure the Fermi surface (see, for example,
Refs. 116–118). A controversy quickly emerged regarding
the possible existence of e0g pockets (which were not
observed in the ARPES experiments) but which were pre-
dicted by LDA calculations.119,120 A bulk measurement was
therefore highly desirable and Laverock et al. made a series
of Compton scattering measurements in samples with
different hole concentrations, including a sample which had
been hydrated and was of a composition which exhibited
superconductivity.121
They were able to show (Fig. 11) that at lower Na con-
centrations (lower x) in a bulk Fermi surface measurement,
that the small e0g pockets did indeed exist, raising the strong
possibility that the surfaces of these materials are not repre-
sentative of the bulk.
12. Concluding remarks
When looking for a bulk Fermi surface spectroscopy for
materials where the electronic mean-free-paths are too short
for the observation of quantum oscillations (due to substitu-
tional disorder, high temperature phases etc.) positron anni-
hilation and Compton scattering are viable techniques.
Accessing the Fermi surface through the underlying electron
momentum distribution, these techniques have revealed elec-
tronic structure of a diverse range of materials and provided
unique insight into a variety of phenomena ranging from
aspects of superconductivity through density-waves to heavy
fermions.
a)Email: [email protected]
1D. G. Lock, V. H. C. Crisp, and R. N. West, J. Phys. F 3, 561 (1973).2T. Jarlborg and A. K. Singh, Phys. Rev. B 36, 4660 (1987).3N. D. Drummond, P. Lopez Rios, R. J. Needs, and C. J. Pickard, Phys.
Rev. Lett. 107, 207402 (2011).4J. Laverock, T. D. Haynes, M. A. Alam, and S. B. Dugdale, Phys. Rev. B
82, 125127 (2010).5B. Barbiellini, M. J. Puska, T. Korhonen, A. Harju, T. Torsti, and R. M.
Nieminen, Phys. Rev. B 53, 16201 (1996).6J. Mitroy and B. Barbiellini, Phys. Rev. B 65, 235103 (2002).7N. Hiraoka, M. Itou, T. Ohata, M. Mizumaki, Y. Sakurai, and N. Sakai,
J. Synchrotron Radiat. 8, 26 (2001).8Y. Sakurai and M. Itou, J. Phys. Chem. Solids 65, 2061 (2004).9S. B. Dugdale, J. Laverock, C. Utfeld, M. A. Alam, T. D. Haynes, D.
Billington, and D. Ernsting, J. Phys.: Conf. Ser. 443, 012083 (2013).10R. N. West, J. Mayers, and P. A. Walters, J. Phys. E 14, 478 (1981).11M. Leitner, H. Ceeh, and J.-A. Weber, New J. Phys. 14, 123014 (2012).12A. M. Cormack, J. Appl. Phys. 35, 2908 (1964).13A. M. Cormack, J. Appl. Phys. 34, 2722 (1963).14G. Kontrym-Sznajd, Phys. Status Solidi A 117, 227 (1990).15G. Kontrym-Sznajd, A. Jura, and M. Samsel-Czekala, Appl. Phys. A 74,
605 (2002).16W. E. Evenson and S. H. Liu, Phys. Rev. 178, 783 (1969).17I. D. Hughes, M. Daene, A. Ernst, W. Hergert, M. Lueders, J. Poulter, J.
B. Staunton, A. Svane, Z. Szotek, and W. M. Temmerman, Nature 446,
650 (2007).18T. L. Loucks, Phys. Rev. 144, 504 (1966).19S. B. Dugdale, H. M. Fretwell, M. A. Alam, G. Kontrym-Sznajd, R. N.
West, and S. Badrzadeh, Phys. Rev. Lett. 79, 941 (1997).20H. M. Fretwell, S. B. Dugdale, M. A. Alam, D. C. R. Hedley, A.
Rodriguez-Gonzalez, and S. B. Palmer, Phys. Rev. Lett. 82, 3867 (1999).21S. J. Crowe, S. B. Dugdale, Z. Major, M. A. Alam, J. A. Duffy, and S. B.
Palmer, Europhys. Lett. 65, 235 (2004).22W. C. Koehler, J. Appl. Phys. 36, 1078 (1965).23G. Kontrym-Sznajd, M. Samsel-Czekala, A. Pietraszko, H. Sormann, S.
Manninen, S. Huotari, K. Hamalainen, J. Laukkanen, R. N. West, and W.
Sch€ulke, Phys. Rev. B 66, 155110 (2002).24Z. Major, S. B. Dugdale, R. J. Watts, G. Santi, M. A. Alam, S. M.
Hayden, J. A. Duffy, J. W. Taylor, T. Jarlborg, E. Bruno, D. Benea, and
H. Ebert, Phys. Rev. Lett. 92, 107003 (2004).25C. Pfleiderer, M. Uhlarz, S. Hayden, R. Vollmer, H. von Lohneysen, N.
Bernhoeft, and G. Lonzarich, Nature 412, 58 (2001).
FIG. 11. The experimental Fermi surface of NaxCoO2 for (a) x ¼ 0.74, (b)
0.51, (c) 0.38, and (d) for Na0.35CoO2�1.3D2O obtained from the reconstruc-
tion of five Compton profiles for each composition. The boundary of the first
Brillouin zone is indicated.
336 Low Temp. Phys. 40 (4), April 2014 S. B. Dugdale
This article is copyrighted as indicated in the article. Reuse of AIP content is subject to the terms at: http://scitation.aip.org/termsconditions. Downloaded to IP: 137.222.249.42
On: Wed, 22 Apr 2015 07:10:52

26S. Saxena, P. Agarwal, K. Ahilan, F. Grosche, R. Haselwimmer, M.
Steiner, E. Pugh, I. Walker, S. Julian, P. Monthoux, G. Lonzarich, A.
Huxley, I. Sheikin, D. Braithwaite, and J. Flouquet, Nature 406, 587 (2000).27D. Fay and J. Appel, Phys. Rev. B 22, 3173 (1980).28G. Santi, S. B. Dugdale, and T. Jarlborg, Phys. Rev. Lett. 87, 247004
(2001).29S. J. C. Yates, G. Santi, S. M. Hayden, P. J. Meeson, and S. B. Dugdale,
Phys. Rev. Lett. 90, 057003 (2003).30E. A. Yelland, S. M. Hayden, S. J. C. Yates, C. Pfleiderer, M. Uhlarz, R.
Vollmer, H. v. L€ohneysen, N. R. Bernhoeft, R. P. Smith, S. S. Saxena,
and N. Kimura, Phys. Rev. B 72, 214523 (2005).31S. C. Moss, Phys. Rev. Lett. 22, 1108 (1969).32M. Rodewald, K. Rodewald, P. De Meulenaere, and G. Van Tendeloo,
Phys. Rev. B 55, 14173 (1997).33B. L. Gyorffy and G. M. Stocks, Phys. Rev. Lett. 50, 374 (1983).34I. Wilkinson, R. J. Hughes, Z. Major, S. B. Dugdale, M. A. Alam, E.
Bruno, B. Ginatempo, and E. S. Giuliano, Phys. Rev. Lett. 87, 216401
(2001).35P. Soven, Phys. Rev. 156, 809 (1967).36I. Matsumoto, H. Kawata, and N. Shiotani, Phys. Rev. B 64, 195132
(2001).37J. Friedel and M. Peter, Europhys. Lett. 8, 79 (1989).38R. E. Peierls, Quantum Theory of Solids (Oxford University, New
York/London, 1955).39J. A. Wilson, F. J. Di Salvo, and S. Mahajan, Adv. Phys. 50, 1171 (2001).40B. Mansart, M. J. G. Cottet, T. J. Penfold, S. B. Dugdale, R. Tediosi, M.
Chergui, and F. Carbone, Proc. Natl. Acad. Sci. 109, 5603 (2012).41J. Laverock, T. D. Haynes, C. Utfeld, and S. B. Dugdale, Phys. Rev. B
80, 125111 (2009).42M. D. Johannes and I. I. Mazin, Phys. Rev. B 77, 165135 (2008).43J. Laverock, D. Newby, E. Abreu, R. Averitt, K. E. Smith, R. P. Singh,
G. Balakrishnan, J. Adell, and T. Balasubramanian, Phys. Rev. B 88,
035108 (2013).44N. Ru, C. L. Condron, G. Y. Margulis, K. Y. Shin, J. Laverock, S. B.
Dugdale, M. F. Toney, and I. R. Fisher, Phys. Rev. B 77, 035114 (2008).45V. Brouet, W. L. Yang, X. J. Zhou, Z. Hussain, N. Ru, K. Y. Shin, I. R.
Fisher, and Z. X. Shen, Phys. Rev. Lett. 93, 126405 (2004).46V. Brouet, W. L. Yang, X. J. Zhou, Z. Hussain, R. G. Moore, R. He, D.
H. Lu, Z. X. Shen, J. Laverock, S. B. Dugdale, N. Ru, and I. R. Fisher,
Phys. Rev. B 77, 235104 (2008).47E. DiMasi, M. C. Aronson, J. F. Mansfield, B. Foran, and S. Lee, Phys.
Rev. B 52, 14516 (1995).48J. Laverock, S. B. Dugdale, Z. Major, M. A. Alam, N. Ru, I. R. Fisher, G.
Santi, and E. Bruno, Phys. Rev. B 71, 085114 (2005).49E. Fawcett, Rev. Mod. Phys. 60, 209 (1988).50A. W. Overhauser, Phys. Rev. Lett. 4, 462 (1960).51A. W. Overhauser, Phys. Rev. 128, 1437 (1962).52W. M. Lomer, Proc. Phys. Soc. 80, 489 (1962).53N. Shiotani, T. Okada, H. Sekizawa, S. Wakoh, and Y. Kubo, J. Phys.
Soc. Jpn. 43, 1229 (1977).54A. K. Singh, A. A. Manuel, and E. Walker, Europhys. Lett. 6, 67 (1988).55T. Kubota, H. Kondo, H. Nakashima, Y. Murakami, and S. Tanigawa,
Phys. Status Solidi B 168, 179 (1991).56S. B. Dugdale, M. A. Alam, H. M. Fretwell, M. Biasini, and D. Wilson,
J. Phys.: Condens. Matter 6, L435 (1994).57H. M. Fretwell, S. B. Dugdale, M. A. Alam, M. Biasini, L. Hoffmann,
and A. A. Manuel, Europhys. Lett. 32, 771 (1995).58S. B. Dugdale, H. M. Fretwell, D. C. R. Hedley, M. A. Alam, T. Jarlborg,
G. Santi, R. M. Singru, V. Sundararajan, and M. J. Cooper, J. Phys.:
Condens. Matter 10, 10367 (1998).59S. B. Dugdale, H. M. Fretwell, K. J. Chen, Y. Tanaka, A. Shukla, T.
Buslaps, C. Bellin, G. Loupias, M. A. Alam, A. A. Manuel, P. Suortti,
and N. Shiotani, J. Phys. Chem. Solids 61, 361 (2000).60Y. Tanaka, K. J. Chen, C. Bellin, G. Loupias, H. M. Fretwell, A.
Rodrigues-Gonzalez, M. A. Alam, S. B. Dugdale, A. A. Manuel, A.
Shukla, T. Buslaps, P. Suortti, and N. Shiotani, J. Phys. Chem. Solids 61,
365 (2000).61R. J. Hughes, S. B. Dugdale, Z. Major, M. A. Alam, T. Jarlborg, E.
Bruno, and B. Ginatempo, Phys. Rev. B 69, 174406 (2004).62P. Gr€unberg, R. Schreiber, Y. Pang, M. B. Brodsky, and H. Sowers, Phys.
Rev. Lett. 57, 2442 (1986).63S. S. P. Parkin, N. More, and K. P. Roche, Phys. Rev. Lett. 64, 2304
(1990).64M. Biasini, G. Ferro, and A. Czopnik, Phys. Rev. B 68, 094513 (2003).65T. Ebihara, I. Umehara, A. Albessard, K. Satoh, and Y. Onuki, Physica B
186–188, 123 (1993).
66O. Sakai and H. Harima, J. Phys. Soc. Jpn. 81, 024717 (2012).67M. J. Besnus, J. P. Kappler, P. Lehmann, and A. Meyer, Solid State
Commun. 55, 779 (1985).68M. A. Monge, M. Biasini, G. Ferro, M. Gemmi, G. Satta, S. Massidda, P.
Lejay, and A. Continenza, Phys. Rev. B 65, 035114 (2002).69Y. Onuki, I. Umehara, A. K. Albessard, T. Ebihara, and K. Satoh,
J. Phys. Soc. Jpn. 61, 960 (1992).70A. I. Coldea, J. D. Fletcher, A. Carrington, J. G. Analytis, A. F. Bangura,
J.-H. Chu, A. S. Erickson, I. R. Fisher, N. E. Hussey, and R. D.
McDonald, Phys. Rev. Lett. 101, 216402 (2008).71C. Utfeld, J. Laverock, T. D. Haynes, S. B. Dugdale, J. A. Duffy, M. W.
Butchers, J. W. Taylor, S. R. Giblin, J. G. Analytis, J.-H. Chu, I. R.
Fisher, M. Itou, and Y. Sakurai, Phys. Rev. B 81, 064509 (2010).72Z. Major, S. B. Dugdale, R. J. Watts, J. Laverock, J. J. Kelly, D. C. R.
Hedley, and M. A. Alam, J. Phys. Chem. Solids 65, 2011 (2004).73C. Utfeld, S. R. Giblin, J. W. Taylor, J. A. Duffy, C. Shenton-Taylor, J.
Laverock, S. B. Dugdale, M. Manno, C. Leighton, M. Itou, and Y.
Sakurai, Phys. Rev. Lett. 103, 226403 (2009).74F. S. Tautz, S. R. Julian, G. J. McMullan, and G. G. Lonzarich, Physica B
206–207, 29 (1995).75D. Vasumathi, B. Barbiellini, A. A. Manuel, L. Hoffmann, T. Jarlborg, R.
Modler, C. Geibel, F. Steglich, and M. Peter, Phys. Rev. B 55, 11714
(1997).76M. J. Puska, P. Lanki, and R. M. Nieminen, J. Phys.: Condens. Matter 1,
6081 (1989).77Y. Nagai, T. Chiba, Z. Tang, T. Akahane, T. Kanai, M. Hasegawa, M.
Takenaka, and E. Kuramoto, Phys. Rev. Lett. 87, 176402 (2001).78Y. Nagai, M. Hasegawa, Z. Tang, A. Hempel, K. Yubuta, T. Shimamura,
Y. Kawazoe, A. Kawai, and F. Kano, Phys. Rev. B 61, 6574 (2000).79Y. Nagai, T. Toyama, Z. Tang, K. Inoue, T. Chiba, M. Hasegawa, S.
Hirosawa, and T. Sato, Phys. Rev. B 79, 201405 (2009).80T. Toyama, Z. Tang, K. Inoue, T. Chiba, T. Ohkubo, K. Hono, Y. Nagai,
and M. Hasegawa, Phys. Rev. B 86, 104106 (2012).81M. Sluiter, D. de Fontaine, X. Q. Guo, R. Podloucky, and A. J. Freeman,
Phys. Rev. B 42, 10460 (1990).82K. Mahalingam, B. P. Gu, G. L. Liedl, and T. H. Sanders, Jr., Acta
Metall. 35, 483 (1987).83J. Laverock, S. B. Dugdale, M. A. Alam, M. V. Roussenova, J. R.
Wensley, J. Kwiatkowska, and N. Shiotani, Phys. Rev. Lett. 105, 236401
(2010).84X.-Q. Guo, R. Podloucky, J.-h. Xu, and A. J. Freeman, Phys. Rev. B 41,
12432 (1990).85P. A. Goddard, J. Singleton, R. D. McDonald, N. Harrison, J. C. Lashley,
H. Harima, and M.-T. Suzuki, Phys. Rev. Lett. 94, 116401 (2005).86R. D. McDonald, P. A. Goddard, J. Lashley, N. Harrison, C. H. Mielke, J.
Singleton, H. Harima, and M.-T. Suzuki, J. Phys. Chem. Solids 67, 2100
(2006).87W. Kohn, Phys. Rev. Lett. 2, 393 (1959).88S. M. Shapiro, B. X. Yang, Y. Noda, L. E. Tanner, and D. Schryvers,
Phys. Rev. B 44, 9301 (1991).89G. L. Zhao and B. N. Harmon, Phys. Rev. B 45, 2818 (1992).90S. B. Dugdale, R. J. Watts, J. Laverock, Z. Major, M. A. Alam, M.
Samsel-Czekala, G. Kontrym-Sznajd, Y. Sakurai, M. Itou, and D. Fort,
Phys. Rev. Lett. 96, 046406 (2006).91G. Kontrym-Sznajd and M. Samsel-Czekala, Appl. Phys. A 70, 89 (2000).92A. Marmodoro and J. B. Staunton, J. Phys.: Conf. Ser. 286, 012033
(2011).93H. Tietze, M. M€ullner, and B. Renker, J. Phys. C 17, L529 (1984).94P. Moine, J. Allain, and B. Renker, J. Phys. F 14, 2517 (1984).95G. L. Zhao and B. N. Harmon, Phys. Rev. B 48, 2031 (1993).96R. Suzuki, M. Osawa, S. Tanigawa, M. Matsumoto, and N. Shiotani,
J. Phys. Soc. Jpn. 58, 3251 (1989).97N. Shiotani, I. Matsumoto, H. Kawata, J. Katsuyama, M. Mizuno, H.
Araki, and Y. Shirai, J. Phys. Soc. Jpn. 73, 1627 (2004).98K. Ullakko, J. K. Huang, C. Kantner, R. C. OHandley, and V. V.
Kokorin, Appl. Phys. Lett. 69, 1966 (1996).99P. J. Webster, K. R. A. Ziebeck, S. L. Town, and M. S. Peak, Philos.
Mag. B 49, 295 (1984).100A. Zheludev, S. M. Shapiro, P. Wochner, and L. E. Tanner, Phys. Rev. B
54, 15045 (1996).101O. Velikokhatnyi and I. Naumov, Phys. Solid State 41, 617 (1999).102Y. Lee, J. Y. Rhee, and B. N. Harmon, Phys. Rev. B 66, 054424 (2002).103C. Bungaro, K. M. Rabe, and A. D. Corso, Phys. Rev. B 68, 134104
(2003).104T. D. Haynes, R. J. Watts, J. Laverock, Z. Major, M. A. Alam, J. W.
Taylor, J. A. Duffy, and S. B. Dugdale, New J. Phys. 14, 035020 (2012).
Low Temp. Phys. 40 (4), April 2014 S. B. Dugdale 337
This article is copyrighted as indicated in the article. Reuse of AIP content is subject to the terms at: http://scitation.aip.org/termsconditions. Downloaded to IP: 137.222.249.42
On: Wed, 22 Apr 2015 07:10:52

105P. Entel, A. Dannenberg, M. Siewert, H. Herper, M. Gruner, D.
Comtesse, H.-J. Elmers, and M. Kallmayer, Metall. Mater. Trans. A 43,
2891 (2012).106S. Ishibashi, A. A. Manuel, L. Hoffmann, and K. Bechgaard, Phys. Rev.
B 55, 2048 (1997).107S. Ishibashi, A. A. Manuel, D. Vasumathi, A. Shukla, P. Suortti, M.
Kohyama, and K. Bechgaard, J. Phys.: Condens. Matter 11, 9025 (1999).108S. Ishibashi, A. A. Manuel, M. Kohyama, M. Tokumoto, and H. Anzai,
Phys. Rev. B 60, R 3747 (1999).109L. Hoffmann, A. K. Singh, H. Takei, and N. Toyota, J. Phys. F 18, 2605
(1988).110A. A. Manuel, Phys. Rev. Lett. 49, 1525 (1982).111T. Jarlborg, A. A. Manuel, and M. Peter, Phys. Rev. B 27, 4210 (1983).112M. Peter, A. A. Manuel, and A. Erb, Int. J. Mod. Phys. B 12, 3187 (1998).113Y. Sakurai, M. Itou, B. Barbiellini, P. E. Mijnarends, R. S. Markiewicz, S.
Kaprzyk, J.-M. Gillet, S. Wakimoto, M. Fujita, S. Basak, Y. J. Wang, W.
Al-Sawai, H. Lin, A. Bansil, and K. Yamada, Science 332, 698 (2011).114K. Takada, H. Sakurai, E. Takayama-Muromachi, F. Izumi, R. Dilanian,
and T. Sasaki, Nature 422, 53 (2003).
115I. Mazin and M. Johannes, Nat. Phys. 1, 91 (2005).116M. Z. Hasan, Y.-D. Chuang, D. Qian, Y. W. Li, Y. Kong, A. Kuprin, A.
V. Fedorov, R. Kimmerling, E. Rotenberg, K. Rossnagel, Z. Hussain, H.
Koh, N. S. Rogado, M. L. Foo, and R. J. Cava, Phys. Rev. Lett. 92,
246402 (2004).117H.-B. Yang, S.-C. Wang, A. K. P. Sekharan, H. Matsui, S. Souma, T.
Sato, T. Takahashi, T. Takeuchi, J. C. Campuzano, R. Jin, B. C. Sales, D.
Mandrus, Z. Wang, and H. Ding, Phys. Rev. Lett. 92, 246403 (2004).118H.-B. Yang, Z.-H. Pan, A. K. P. Sekharan, T. Sato, S. Souma, T.
Takahashi, R. Jin, B. C. Sales, D. Mandrus, A. V. Fedorov, Z. Wang, and
H. Ding, Phys. Rev. Lett. 95, 146401 (2005).119D. J. Singh, Phys. Rev. B 61, 13397 (2000).120K.-W. Lee, J. Kune�s, and W. E. Pickett, Phys. Rev. B 70, 045104 (2004).121J. Laverock, S. B. Dugdale, J. A. Duffy, J. Wooldridge, G. Balakrishnan,
M. R. Lees, G.-q. Zheng, D. Chen, C. T. Lin, A. Andrejczuk, M. Itou,
and Y. Sakurai, Phys. Rev. B 76, 052509 (2007).
This article was published in English in the original Russian journal.
Reproduced here with stylistic changes by AIP Publishing.
338 Low Temp. Phys. 40 (4), April 2014 S. B. Dugdale
This article is copyrighted as indicated in the article. Reuse of AIP content is subject to the terms at: http://scitation.aip.org/termsconditions. Downloaded to IP: 137.222.249.42
On: Wed, 22 Apr 2015 07:10:52