DRIVERS OF ENTREPRENEURSHIP: LINKING WITH … Rasool Ahmed Gulzar and Shaheen Naseer.pdfGrowth...
32
-1- DRIVERS OF ENTREPRENEURSHIP: LINKING WITH ECONOMIC GROWTH AND EMPLOYMENT GENERATION (A Panel Data Analysis) Farhat Rasool Ahmed Gulzar Shaheen Naseer Abstract The need for entrepreneurship for economic development has always been crucial in the history of successful nations and developed economies because entrepreneurs are the leaders who invent innovative ideas that give spark to economic activities. Entrepreneurship is a key determinant of sustainable growth in modern times. Mostly jobs are produced by small businesses started by entrepreneurial mind persons, many of them set up large companies. Entrepreneurship is frequently expressed in terms of higher self esteem, to exercise creative freedoms, and an overall greater sense of control over their own lives. Many economists and educators believe that these types of experienced entrepreneurs foster the robust entrepreneurial culture that exploit personal and communal economic and social success at sub-national, national, and international level. A strand of literature explains different categories of entrepreneurship, which are of paramount importance in explaining the economic growth, employment and population. The task of this study is to identify those factors along with the role of education, Research and Development activities which significantly explain the entrepreneurial potential and skills and at the second stage, to examine the impact of those entrepreneurial skills on economic growth and employment. To complete the task, micro panel data approach with different economic models and econometric estimation techniques (i.e. Stepwise Least Square with Forward Selection method and Pooled Least Square without random and fixed effects) is used. The panel data includes the observations on eight upper middle and lower middle income countries over the period ranging from 2005 to 2011. JEL Classifications: D31, E23, E24, J21, J28, J31, L26, M13, O10, O11, O 17 O30, O34, Keywords: Drivers of Entrepreneurship, Economic Growth, Employment Generation, Institutions, government stability Phd fellow at Pakistan Institute of Development Economics, Islamabad. [Email: [email protected]] Research Officer in National Transport Research Officer (NTRC), Ministry of Communications and Research Scholar at Pakistan Institute of Development Economics (PIDE), Islamabad [Email: [email protected]] Research Scholar at Pakistan Institute of Development Economics (PIDE), Islamabad. [Email: [email protected] ] Author Note: The views in this paper are those of the author(s) and not those of the institutions, they attached with. Authors are responsible for any error and emission. Finally feedback/comments are strongly welcomed. Acknowledgments: Authors would like to thank Dr.Musleh Ud Din (Joint Director PIDE) and Dr. Ejaz Ghani on their kind support and various policy group discussions especially on relationship among entrepreneurship, economic growth and employment generation.
Transcript of DRIVERS OF ENTREPRENEURSHIP: LINKING WITH … Rasool Ahmed Gulzar and Shaheen Naseer.pdfGrowth...

-1-
DRIVERS OF ENTREPRENEURSHIP: LINKING WITH ECONOMIC
GROWTH AND EMPLOYMENT GENERATION (A Panel Data Analysis)
Farhat Rasool
Ahmed Gulzar
Shaheen Naseer
Abstract
The need for entrepreneurship for economic development has always been crucial in the history of
successful nations and developed economies because entrepreneurs are the leaders who invent
innovative ideas that give spark to economic activities. Entrepreneurship is a key determinant of
sustainable growth in modern times. Mostly jobs are produced by small businesses started by
entrepreneurial mind persons, many of them set up large companies. Entrepreneurship is frequently
expressed in terms of higher self esteem, to exercise creative freedoms, and an overall greater sense
of control over their own lives. Many economists and educators believe that these types of
experienced entrepreneurs foster the robust entrepreneurial culture that exploit personal and
communal economic and social success at sub-national, national, and international level. A strand of
literature explains different categories of entrepreneurship, which are of paramount importance in
explaining the economic growth, employment and population. The task of this study is to identify
those factors along with the role of education, Research and Development activities which
significantly explain the entrepreneurial potential and skills and at the second stage, to examine the
impact of those entrepreneurial skills on economic growth and employment. To complete the task,
micro panel data approach with different economic models and econometric estimation techniques
(i.e. Stepwise Least Square with Forward Selection method and Pooled Least Square without random
and fixed effects) is used. The panel data includes the observations on eight upper middle and lower
middle income countries over the period ranging from 2005 to 2011.
JEL Classifications: D31, E23, E24, J21, J28, J31, L26, M13, O10, O11, O 17 O30, O34,
Keywords: Drivers of Entrepreneurship, Economic Growth, Employment Generation, Institutions, government
stability
Phd fellow at Pakistan Institute of Development Economics, Islamabad.
[Email: [email protected]]
Research Officer in National Transport Research Officer (NTRC), Ministry of Communications and Research Scholar at
Pakistan Institute of Development Economics (PIDE), Islamabad
[Email: [email protected]]
Research Scholar at Pakistan Institute of Development Economics (PIDE), Islamabad.
[Email: [email protected] ]
Author Note: The views in this paper are those of the author(s) and not those of the institutions, they attached with. Authors are
responsible for any error and emission. Finally feedback/comments are strongly welcomed.
Acknowledgments: Authors would like to thank Dr.Musleh Ud Din (Joint Director PIDE) and Dr. Ejaz Ghani on their kind
support and various policy group discussions especially on relationship among entrepreneurship, economic growth and
employment generation.

-2-
1. INTRODUCTION
The need for entrepreneurs for economic development has always been crucial in the in history
because they are the leaders who invent innovative ideas that give spark to economic activities.
They are responsible for the combination of factors of production by capital formation, creating
employment opportunities, wealth distribution that facilitates development and growth. A well
explained definition of entrepreneurship in the words of Wennekers and Thurik (1999) that
successfully makes the functional roles of entrepreneurs is:
"…the manifest ability and willingness of individuals, on their own, in teams within and outside
existing organizations, to perceive and create new economic opportunities (new products, new
production methods, new organizational schemes and new product-market combinations) and to
introduce their ideas in the market, in the face of uncertainty and other obstacles, by making
decisions on location, form and the use of resources and institutions." (46–47)
High and sustained economic growth is the fundamental objective of every developed or
developing country’s governmental policy. Economic growth is a long term expansion of the
productive potential of the economy. It generates employment in the economy and raises the
living standards of the nation. Economic growth promotes business activities in private sector,
increases company profits and enhances investor confidence..
Growth process, in general, of the country is profoundly influenced by entrepreneurial activities
at different levels. Entrepreneurship is a key determinant of sustainable growth in modern time.
Mostly jobs are produced by small businesses started by entrepreneurial mind persons, many of
them set up large companies. Entrepreneurship is frequently expressed in terms of higher self

-3-
esteem, to exercise creative freedoms, and an overall greater sense of control over their own
lives. Many economists and educators believe that these types of experienced entrepreneurs
foster the robust entrepreneurial culture that exploit personal and communal economic and social
success at sub-national, national, and international level.
Education starting from elementary school to degree programs and learning activities develop
the Standards for supporting Performance Indicators in students. More the challenging
educational activities and experiences; more will be the discoveries, innovations ideas that
enable individuals to develop the insight needed to discover and create entrepreneurial
opportunities. These results in high expertise to start and manage own businesses to take
advantage of these opportunities. The need for entrepreneurship for sustainable growth becomes
more important for Asia as this region is the home of sixty percent of the world population with
rich natural resources. Almost in all Asian economies entrepreneurial opportunities are low
because of narrow industrial zones, limited export sector (except China), weak private sector and
limited internal markets. So to promote the entrepreneurial education, trainings and seminars is
crucial for Asia.
Entrepreneurial education can certainly impact an apprentice at all levels in a variety of manners.
But there are some other factors like govt. stability, patent rights, institutions, research
&development socio economic conditions, investment profile and consumption factors that can
influenced the growth process.
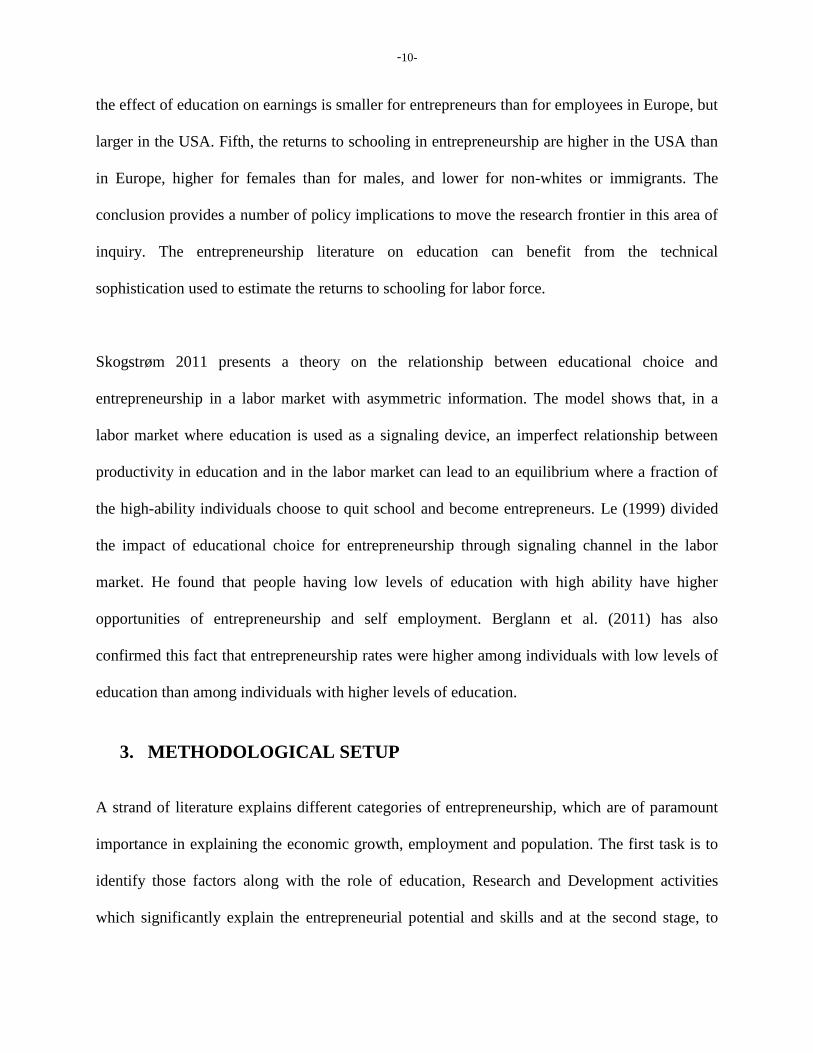
In current years policy makers have publicized increasing interest in the role of Entrepreneurship
to promote economic growth and development. This has been stimulated by the rapid growth of
the business sector in Asian Economies such as China, Brazil and India. As shown in the figure

-4-
below, there are structural, economic, institutional and geographical factors which generate and
promote entrepreneurship at its different stages: Necessity Based Entrepreneurship, Improvement
Driven Entrepreneurship and Growth Led Entrepreneurship. Further, it explains the way those
factors affect economic growth and employment generation indirectly through promoting
entrepreneurship or directly.
The task of this study is to identify those factors along with the role of education, Research and
Development activities which significantly explain the entrepreneurial potential and skills and at
the second stage, to examine the impact of those entrepreneurial skills on economic growth and
employment. To complete the task, micro panel data approach with different economic models
and econometric estimation techniques (i.e. Stepwise Least Square with Forward Selection
method and Pooled Least Square without random and fixed effects) is used. The panel data
includes the observations on eight upper middle and lower middle income countries over the
period ranging from 2005 to 2011.
The organization of the paper is as follows; section 2 deals with the relevant review of literature,
section 3 explains the methodological setup, section 4 explains data type and estimation
technique, section 5 deals with the results and interpretations, section 6 includes conclusion and
policy recommendations.

-5-
Structural Factors Structural Factors Structural Factors
Entrepreneurship
Necessity Driven Entrepreneurship
Improvement Driven Entrepreneurship
Growth Oriented Entrepreneurship
Factors include
educational levels
and systems, Socio-
economic
conditions, Govt.
stability etc.
Income Level Employment Generation Population Growth

-6-
2. REVIEW OF RELEVANT LITERATURE
Richard Cantillion (1955) introduces the term entrepreneur first time in the pages of economic
literature. According to Van de Klundert and Smulders, (1992) entrepreneurship is a “creative
destruction”. The different historical arguments of an economist give an expanded perspective on
the term “Entrepreneurship” as it is a fundamental agent in most production, distribution and
Growth theories. A lot of studies have been done about connection between entrepreneurship and
economic growth. The new classical economist focused that steady state equilibrium is only
possible under the umbrella of strong entrepreneurship for they are the innovator and the founder
of economics of innovation. Now question is that what are the forces and basic circumstances
that imprint strong entrepreneurship.
Solow & Swan (1970) believed that these are the labor and capital which contribute in the
process of economic expansion. Technological change remaines as exogenous (Manna from
Heaven). The basic idea in endogenous growth theory was that these are the endogenous
variables that effect productivity growth through entrepreneurship. The new classical axioms of
perfect competition are strongly restricted incentive for innovative opportunities. The models of
general equilibrium do not talk about dynamics of entrepreneurship. In Romer’s (1990) version
research sector is tank engine of growth by assuming increasing returns to scale as it provides the
monopolist the justification of monopolistic competition. The blue prints of new Varity of capital
goods that are produced and used in goods producing sector (Chamberlin 1933). Lucas, (1978)
explored the fact that Education increases managerial abilities and thus the propensity to become
an entrepreneur to handle with complex business environment.

-7-
Throughout intellectual history, the entrepreneur has worn many faces and fulfilled many roles.
A lot of distinct roles for the entrepreneur have been identified in the economic literature (Hébert
1982).
Shultz (1980) thought quantity and quality both need to be addressed for economic growth that
are controlled through the abilities of entrepreneurs. Therefore it is the entrepreneur who is
responsible for restoring equilibrium of economic growth. But endogenous growth theory is
silent on the underlying conditions needed for entrepreneurship and innovation.
Peretto (1999) found that growth is driven by the process of technological advance and
knowledge accumulation brought about by R&D efforts brought by owners of the firms.
Baumol (1990) has mentioned several forms of entrepreneurship. He further explains that
entrepreneur is an individual who is creative enough to add his own wealth and prestige. But
overall environment is tremendous importance in determination of innovative entrepreneurial
process.
Different dimension of entrepreneurship has been studied by economists: Lucas is of the opinion
that entrepreneurial attitude is the deterministic element between the worker and employer.
Calvo and Wellisz (1980) extended the Lucas’ paper and examined the role of individual
capability, age, and knowledge on entrepreneurial allocation. Gordon (1998) analyzed the impact
of fiscal policy especially govt. stability, socio-economic conditions, tax burden and incentives
in the U.S. economy. Kihlstrom and Laffont (1979) study risk aversion and Van Praag and
Cramer (2001) extend it to include individual abilities, subsidies and investment strategy to the
engine of entrepreneurial activity.
Eakin et al. (1994) and Quadrini (2000) have mentioned the financial constraints on
entrepreneurship especially liquidity and savings.

-8-
Blanchflower (2000) found that self-employment is high for those at the tail of the education
distribution. Individuals with the least education have the highest probability of being self-
employed which also confirm the views of Le (1999).
Acs et al. (2005) using country-level data for the years 1981-1998 has empirically examined
through fixed effect and a simultaneous model. They have introduced variables such as
investment in research and development, self employment rate and level of entrepreneurship.
They concluded that countries with higher degree of education entrepreneurial activity and
training are on higher steady state.
Audretsch and Keilbach (2005) introduced the concept of entrepreneurship capital, referring to
society’s capacity to create entrepreneurial activity specifically to generate new firms. Their
study measured the impact of entrepreneurship on regional labor productivity and on the regional
growth of labor productivity and employment generation in Germany. Entrepreneurship capital
was measured using the number of startup enterprises relative to the region’s population. In
additions they involve R&D as well as greater financial risks. The results revealed that
entrepreneurship capital significantly affect a region’s labor productivity. However, the growth
of labor productivity significant effects only for R&D based industries.
Van Stel and Suddle (2005) inspect the relationship between new firm configuration and change
in regional employment for the Netherlands. They have measured the time and sector wise the

-9-
degree of urbanization. The results showed the employment growth as the dependent variable
regressed against the startup rate, wage growth, and population density. To check asymmetry
data was divided into two time periods and that confirmed the impact of new firm’s growth to
employment growth has been stable and was the same in both periods.
Camp (2005) had examined the efficiency of entrepreneurial regions and least entrepreneurial
regions in the U.S. and reported that the former had 109 percent higher productivity, 125 percent
higher employment growth and 58 percent higher wage growth as compared to the later. This
study also chains the view that entrepreneurship is the link between innovation and regional
economic growth that ultimately is road map to economic development. The results exposed
significant coefficients for entrepreneurship activity, and high levels of expected variation in
growth
Henderson (2006) studied the effect of entrepreneurship activity and economic growth for urban
and rural areas. The empirical results imply that entrepreneurial activity is positively affecting
employment growth. Considering the analysis between metropolitan and non-metropolitan areas,
the study found that employment growth was stronger in urban areas rather than in rural areas.
However, there is no significant difference on the relationship between high growth business
startups and employment growth between urban and rural areas.
Vijverberg (2008) provides a meta-analysis of empirical studies into the impact of formal
schooling on entrepreneurship selection and performance in developed countries. Five main
conclusions result from this meta-analysis. First, the impact of education on selection into
entrepreneurship is insignificant. Second, the effect of education on performance is positive and
significant. Third, the return to a marginal year of schooling is 6.1% for an entrepreneur. Fourth,
-10-
the effect of education on earnings is smaller for entrepreneurs than for employees in Europe, but
larger in the USA. Fifth, the returns to schooling in entrepreneurship are higher in the USA than
in Europe, higher for females than for males, and lower for non-whites or immigrants. The
conclusion provides a number of policy implications to move the research frontier in this area of
inquiry. The entrepreneurship literature on education can benefit from the technical
sophistication used to estimate the returns to schooling for labor force.
Skogstrøm 2011 presents a theory on the relationship between educational choice and
entrepreneurship in a labor market with asymmetric information. The model shows that, in a
labor market where education is used as a signaling device, an imperfect relationship between
productivity in education and in the labor market can lead to an equilibrium where a fraction of
the high-ability individuals choose to quit school and become entrepreneurs. Le (1999) divided
the impact of educational choice for entrepreneurship through signaling channel in the labor
market. He found that people having low levels of education with high ability have higher
opportunities of entrepreneurship and self employment. Berglann et al. (2011) has also
confirmed this fact that entrepreneurship rates were higher among individuals with low levels of
education than among individuals with higher levels of education.
3. METHODOLOGICAL SETUP
A strand of literature explains different categories of entrepreneurship, which are of paramount
importance in explaining the economic growth, employment and population. The first task is to
identify those factors along with the role of education, Research and Development activities
which significantly explain the entrepreneurial potential and skills and at the second stage, to

-11-
examine the impact of those entrepreneurial skills on economic growth and employment. Eliss &
William (2011) explain different types of entrepreneurship. The categories of entrepreneurship
in quantifiable terms are as follows;
nnnn EEEE 321 ,,
Where
En = Total Entrepreneurial Activity
E1n = Necessity Driven Entrepreneurship Activity
E2n = Improvement Driven Opportunity Entrepreneurial Activity
E3n = Growth Expectations of Entrepreneurial Activity
At first stage, we select those factors which explain all types of entrepreneurial activities and
skills to make the analysis more policy oriented. The functional forms made below are consistent
with the Eliss and William (2011). Our contribution is that we incorporated other economic and
structural factors and redefined these variables.
nnnn EEEE 321 ,,
),,&,,,,,,,,( TOInvDERGSSEmSEInsPRPGpggfEn (1)
),,&,,,,,,,,(1 TOInvDERGSSEmSEInsPRPGpggfE n (2)
),,&,,,,,,,,(2 TOInvDERGSSEmSEInsPRPGpggfE n (3)
),,&,,,,,,,,(3 TOInvDERGSSEmSEInsPRPGpggfE n (4)
Where;
PR= Socio-economic conditions and
Ins. =Institutions

-12-
SE = Secondary Education
Em = Employment rate
GS = Govt. Consumption Expenditures
R&DE = Research and Development Expenditure
Inv = Investment Profile
TO = Government Stability
PG= Population Growth
g = GDP Growth
pg = Per capita Growth
The equation represents the general functional form of production function that exhibit constant
elasticity of substitution equal unity everywhere and is linear homogeneous. The statistical forms
of equations are as follows for estimation.
nnnn
nnnnnnnnnn
TOInvDER
GSSEmSEInsPRPGpggE
&
,,,
(5)
nnnn
nnnnnnnnnn
TOInvDER
GSSEmSEInsPRPGpggE
1111
1111111111
&
,,,
(6)
nnnnn
nnnnnnnnn
TOInvDERGS
SEmSEInsPRPGpggE
22222
222222222
&
,,,
(7)
nnnnn
nnnnnnnnn
TOInvDERGS
SEmSEInsPRPGpggE
33333
333333333
&
,,,
(8)

-13-
The model used for estimation at the second stage by incorporating explained and unexplained
factors of different types of entrepreneurial activities (i.e ESSEn E1n E2n E3n, RSSEn, E1n, E2n, E3n )
along with other factors which explain the changes in employment, per capita income and
population while maintaining an economic relationship among population (P), employment (E),
and income (I). The basic idea of incorporating ESS and RSS of entrepreneurial activities as
independent variables is to separate the institutional, structural and economic impact of
entrepreneurial activities from their geographical, traditional and regional specific impact on
dependent variables. The model is near consistent with Deller et al. (2001), Nzaku and Bukenya
(2005), and Deller (2007), Mojica, et’ al (2009).The general form of the three-equation model is:
)/*,*,(* *PIEfP (9)
)/*,*,(* *EIPgE (10)
)/*,*,(* *IEPhI (11)
Where
P*, E*and I* represent the equilibrium levels of population, employment, and per capita income,
respectively, and P* E*
I* are a set of variables describing initial conditions, explained and
unexplained variations of different types entrepreneurial activity (ESSEn E1n E2n E3n, RSSEn, E1n, E2n,
E3n) for example GDP Growth, socio economic conditions, government stability, R & D
expenditures, secondary education, investment profile, per capita growth, employment and
population and other variables that are traditionally linked to economic growth, employment and
population. A simple linear relationship as quoted Mojica-Howell et al (2012) has been coined
here. This framework explains the relationship of variables in the equilibrium setup such as.

-14-
P
IPPPP IEP *** 210 (12)
E
IEEEE IPE *** 210 (13)
I
IEIII EPI *** 210 (14)
Mills and Price, (1984) and Mojica Hoval (2009) narrated that by incorporating the initial
conditions, the variables of the equilibrium framework (population, employment and income)
will adjust accordingly. The considerations are incorporated as distributed lag adjustments and
are expressed as;
)*( 11 tPtt PPPP (15)
)*( 11 tEtt EEEE (16)
)*( 11 tItt IIII (17)
Population, Employment and Per capita Income depend on initial conditions and (Pt-1, Et-1, and It-
1) respectively and speed of change (γP, γE, and γI) coefficients. The larger the values the faster
growth rate is claimed. As suggested by Mojica, et’ al (2009), current employment, population
and income levels are functions of their initial conditions and the change between the
equilibrium values and initial conditions at their respective values of speed of adjustment (γ).
Substituting equations15, 16, and 17 into equations12, 13 and 14 and rearranging the terms gives
the model to be estimated and expressed as:

-15-
P
IPPPtPtPtPpit IbEbIbEbPbP*
541312110 (16)
E
IEEEtEtEtEEit IbPbIbEbPbE*
541312110 (17)
I
EPIItItItIIit PbEbIbEbPbI*
541312110 (18)
The regional changes in population, employment and per capita income by ΔP, ΔE, ΔI
respectively. To investigate the relationship between entrepreneurship and economic growth,
entrepreneurship and employment, entrepreneurship and population, the set of equations is
treated as individual linear equations where changes in population, employment, and per capita
income are regressed individually against explained and unexplained variations of different types
entrepreneurial activity (ESSEn E1n E2n E3n, RSSEn, E1n, E2n, E3n) and other factors including socio
economic conditions, government stability, R & D expenditures, secondary education,
investment profile, per capita growth, employment and population influencing change in per
capita income, change in employment and change in population. These linear equations are as
follows:
P
P
IPPP *
0 (19)
E
E
IEEE * (20)
I
I
IIII *
0 (21)
Where
IbEbIbEbPb PPtPtPtPP 54131211 (22)
IbPbIbEbPb EEtEtEtEE 54131211 (23)
PbEbIbEbPb IItItItII 54131211 (24)

-16-
4. DATA TYPE AND ESTIMATION TECHNIQUE
The variables used in this study are explained in annexure. We used the panel data for eight
Asian Countries for the period of 2005-2011. The sample economies have been segregated into
upper middle income ($1,006 to $3,975) and lower middle income ($1,005 or below it) grouped
by World Bank gross national income (GNI) 20111 calculated by World Bank Atlas Method.
Upper Middle income economies include China, Thailand, Turkey and Malaysia. And the lower
middle income economies include India, Indonesia, Pakistan and Philippine.
The variables used in the study have been collected by different sources such as different types
of entrepreneurial activities (Necessity Driven, Opportunity/Improvement Driven and Growth
Oriented), GDP growth, per capita income, population Growth, R&D Secondary Education,
Employment rate, Govt. Consumption Expenditures, Research and Development Expenditure
have been taken from World Development Indicators (WDI) 2012 whereas Investment Profile
and Government Stability have been taken from International Country Risk Guide (ICRG).
Global Entrepreneurship Monitor, GEM has captured three types of entrepreneurial activities/self
employment in the market such as necessity driven, opportunity and growth oriented. These are
the entrepreneurs of small, medium and large level enterprises. The necessity driven
entrepreneurs are not by choice but by necessity based due to lack of wage employment. The
opportunity driven self-employment is by choice, in order to make use of some perceived market
opportunity.
1 http://data.worldbank.org/about/country-classifications

-17-
We have employed the panel step-wise least square forward selection method for the estimation
of equations 5, 6, 7 and 8 and employed pooled least square method to estimate the equations 19,
20 and 21.
5. RESULTS AND DISCUSSION
As shown in table1, Population growth, government stability and R&D expenditures explain
significantly the variation in total entrepreneurial activity while the impact of socio-economic
conditions, govt. consumption expenditures, secondary education and investment profile come
out to be insignificant. The impact factor of government stability is the highest. The economic
rationale of it is that the government stability ensures the secured opportunities for investment
and to start new ventures where the R&D expenditures play its role in garnish the potential
faculty of entrepreneurship. Population growth is an important determinant of the demand side of
the economy. Capital rush to the country where demand and ultimately market for the product is
available. Government stability has significant and encouraging effect on institutional quality
that ultimately give boost to entrepreneurial activities Qureshiet al, (2010) and Khan and Saqib
(2011) Adnan et.al(2011) where government stability means government is not in crises and
there are less cabinet changes. Furthermore Govt expenditures have externalities that enter as a
direct input in production function. If Govt is giving importance to more productivity enhancing
expenditures it will give boost to entrepreneurial activities. (Stephen J. Turnovsky 2004).
As shown in table2, the variables like population growth, government stability, R&D
expenditures, government consumption expenditures, secondary education and investment
profile explain significantly the variation in Necessity Driven Entrepreneurship. The point to be

-18-
noted here that along with other variables, the government consumption expenditures drive
Necessity Based Entrepreneurship through meso type economic policies. While at secondary
level education, most of the students involve starting their own business or involve themselves in
family business at small scale. This gives the generation and spreading of household business,
cottage industries and small scale enterprises- the glaring feature of upper middle and lower
middle income economies.
As shown in table3, the variables like population growth, government stability, socio-eco
conditions, govt. consumption expenditures and secondary education explain significantly the
variation in Improvement Driven Entrepreneurship while the impact factors of government
stability, govt. consumption expenditures and secondary education are the highest respectively.
This phenomenon explain that if these three crucial factors remain playing their role then it
changes the necessity based entrepreneurship into improvement driven entrepreneurship which is
more sustainable and plays important role in long run economic growth and stability. As shown
in table4, the variables like socio-economic conditions and govt. stability still play their
significant role to transform improvement entrepreneurship into growth oriented and
employment led entrepreneurship.
As shown in table5, the variables like explained entrepreneurial activity, R&D expenditures,
socio-economic conditions explain significantly the variation in change in per capita income,
where the impact factor of R &D is the highest. The results explain that R&D activities affect
economic growth both by building up entrepreneurial potentials and skills and by having direct

-19-
impact by increasing the value added of economic activities on large scale (i.e. large scale
industries, firms etc.)
As shown in table 6, explained necessity based entrepreneurship along with R&D expenditures
and socio-economic conditions explain variation in change in per capita income. The impact of
improvement driven and growth oriented entrepreneurship activities have insignificant impact on
change in per capita income. It explains the fact that the major economic activities in upper
middle and lower middle income countries are based on necessity based entrepreneurship
activities and skills, with the first objective of wining the bread for survival.
As shown in table 7, the variables like explained entrepreneurship, and population growth affect
change in employment, where the impact factor of the earlier independent variable is
significantly high. While other variables like secondary education, R&D expenditures, govt.
stability, per capita growth have indirect impact on change in employment through explained
entrepreneurship activities.
As shown in table 8, the variable unexplained growth entrepreneurship significantly explains the
variation in change in employment; while the other variables like necessity based and
improvement driven entrepreneurship activities have insignificant impact on change in
employment.
As shown in table9, the variables like explained entrepreneurial activity and govt. stability have
significant impact on change in population, while in table 10, it is shown that only explained
necessity based entrepreneurship have significant impact on change in population. This fact is

-20-
also backed by the general phenomenon in lower middle income and occasionally in upper
middle income countries that in low paid or low earned families, the number of children is high
than average.
6. CONCLUSION AND POLICY RECOMMENDATIONS:
On the basis of analysis made in this study, the drivers of entrepreneurship in descending order
in terms of their importance are shown in table 11. As shown in the table, Government stability
plays crucial role at all stages of entrepreneurial activity: total, need based, improvement led and
growth oriented: Any country should take measures to ensure government stability because this
factor builds up the confidence among the general public about the continuity of policies
especially relating to small scale or large scale economic (business) activities. These policies
include investment policy, tax policy, and the policy of establishment of industrial cities etc.
Govt. consumption expenditures turn out to be the second important driver of entrepreneurial
activities. This factor again plays a key role at all stages of entrepreneurial activities. The
government should initiate such policies which increases govt. consumption expenditures. These
policies include meso economic policies, youth entrepreneurship program initiated recently in
Pakistan, Loan scheme with small amounts to encourage household business, cottage industries
and small scale industries. The impact of government consumption expenditure increases, if it is
used through micro-finance schemes.
In upper middle and lower middle income countries, the R&D expenditures help in searching
new avenues of establishing new businesses with small amount in shortest span of time and help

-21-
in generating employment level. Secondary education helps both in generating need based
entrepreneurial activities and then still plays pivotal role in transforming need based
entrepreneurial activities into improvement led activities. Socio-economic conditions help to
generate in improvement led entrepreneurial activities and then to transform them into growth
oriented entrepreneurial activities.
Taking from the aspects of generating and continuing of entrepreneurial activities, to generate
need based entrepreneurial activities and then to transform those into improvement led activities,
the drivers include government stability, government consumption expenditures and secondary
education and investment profile. To generate improvement led activities and then to transform
them into growth oriented entrepreneurial activities, the drivers include government stability,
government consumption secondary education and socio-economic activities. While to generate
and continue growth led entrepreneurial activities, the drivers include government stability,
government expenditures and socio-economic activities.
Table 11:
Sr
# Drivers
Entrepreneurial Activity
Total
Need
Based
Improvement
Led
Growth
Oriented
1 Govt. Stability
2
Govt. Consumption
Exp.
3 R&D Expenditures
4 Secondary Education
5
Socio-economic
condition
6 Investment Profile
Further, it is found in this study that the variables like explained entrepreneurial activity,
explained necessity based entrepreneurial activates, R&D expenditures, socio-economic

-22-
conditions explain significantly the variation in change in per capita income, where the impact
factor of R &D is the highest. The results explain that R&D activities affect economic growth
both by building up entrepreneurial potentials and skills and by having direct impact by
increasing the value added of economic activities on large scale (i.e. large scale industries, firms
etc.). The impact of improvement driven and growth oriented entrepreneurship activities have
insignificant impact on change in per capita income. It explains the fact that the major economic
activities in upper middle and lower middle income countries are based on necessity based
entrepreneurship activities and skills, with the first objective of wining the bread for survival.
It is also found that the variables like explained entrepreneurship, and population growth affect
change in employment, where the impact factor of the earlier independent variable is
significantly high. While other variables like secondary education, R&D expenditures, govt.
stability, per capita growth have indirect impact on change in employment through explained
entrepreneurship activities. The unexplained growth entrepreneurship significantly explains the
variation in change in employment; while the other variables like necessity based and
improvement driven entrepreneurship activities have insignificant impact on change in
employment.
Further investigation deduced that the variables like explained entrepreneurial activity, necessity
based entrepreneurial activities and govt. stability have significant impact on change in
population. This fact is also backed by the general phenomenon in lower middle income and
occasionally in upper middle income countries that in low paid or low earned families, the
number of children is high than average.

-23-
REFERENCES
Acs, Z. J., B. Carlsson and Ch. Karlsson, 1999, ‘The Linkages Among Entrepreneurship,
SMEs and the Macroeconomy’, in Z. J. Acs, B. Carlsson and Ch. Karlsson (eds.),
Entrepreneurship, Small and Medium-Sized Enterprises and the Macroeconomy,
Cambridge, U.K.: Cambridge University Press.
Audretsch, D. B., 1995, Innovation and Industry Evolution, Discussion paper. FS IV 93-
26, Berlin: Wissenschaftszentrum. Cambridge, MA: MIT Press.
Audretsch, D. B. and A. R. Thurik, 1997, Sources of Growth: the Entrepreneurial versus
the Managed Economy, Discussion paper TI97-109/3, Tinbergen Institute, Erasmus
University Rotterdam.
Audretsch, D. B. and A. R. Thurik, 1998, The Knowledge Society, Entrepreneurship and
Unemployment, Research Report 9801/E, Zoetermeer: EIM.
Audretsch, D. B. and A. R. Thurik, 1999, ‘Capitalism and Democracy in the 21st
Century: From the Managed to the Entrepreneurial Economy’, Journal of Evolutionary
Economics, forthcoming.
Blanchflower, D. and Meyer, B. (1994) A longitudinal analysis of the young self-
employed in Australia and the United States. Small Business Economics 6(1): 1–19.
Blanchflower, D., Oswald, A. and Stutzer, A. (2001) “Latent entrepreneurship across
nations”. European Economic Review 45: 680–691.
Baumol, W. J., 1993b, ‘Formal Entrepreneurship Theory in Economics: Existence and
Bounds’, Journal of Business Venturing 8, 197–210
Baumol, W. J., 1990, ‘Entrepreneurship: Productive, Unproductive, and Destructive’,
Journal of Political Economy 98, 893–921.
Baumol, W. J., 1993a, Entrepreneurship, Management and the Structure of Payoffs,
Cambridge, MA: MIT-Press.
Schmitz, Jr., J. A., 1989, ‘Imitation, Entrepreneurship, and Long-Run Growth’, Journal of
Political Economy 97, 721–739.
David G. Blanchower. Self-employment in OECD Countries. Labor Economics, 7(5):471
{505, 2000. ISSN 0927-5371. DOI:10.1016/ S0927-5371(00)00011-7.
Gary S. Becker. Human Capital: A Theoretical and Empirical Analysis, with Special
Reference to Education, 2nd ed. Number beck75-1 in NBER Books. National Bureau of
Economic Research, Inc, January 1975. URL http:// ideas.repec.org/b/nbr/nberbk/beck75-
1.html.
Haider,Adnan and Musleh ud din Ghani Ijaz“Consequences of Political Instability,
Governance and Bureaucratic Corruption on Inflation and Growth: The Case of
Pakistan”published in Pakistan development review PDR (2011)

-24-
Hébert, R. F. and A. N. Link, (1982), The Entrepreneur, New York: Praeger.
Hébert, R. F. and A. N. Link, 1989, ‘In Search of the Meaning of Entrepreneurship’,
Small Business Economics 1, 39–49
Le, A. (1999) Empirical studies of self-employment. Journal of Economic Surveys 13(4):
381–416.
Khan, S. U., and Saqib, O. F. (2011), Political Instability and Inflation in Pakistan.
Journal of Asian Economics, in forthcoming issue, doi: 10.1016/j.asieco.2011.08.006
Klundert, Th. van de and S. Smulders (1992), ‘Reconstructing Growth Theory: A
Survey’, De Economist 140, 177–203.
Qureshi, M. N., Ali, K., and Khan, I. R. (2010). Political Instability and Economic
Development: Pakistan Time-Series Analysis. International Research Journal of Finance
and Economics, 56: 179 – 192.
Stephen J. Turnovsky ”The Transitional Dynamics of Fiscal Policy: Long-Run Capital
Accumulation and Growth” Reviewed work(s):Source: Journal of Money, Credit and
Banking, Vol. 36, No. 5 (Oct., 2004), pp. 883-910 Published by: Ohio State University
Press
Solow, R. M., 1970, Growth Theory: An Exposition, Oxford, U.K.: Oxford University
Press
Kihlstrom, R.E. and Laffont, J.J. (1979). A general equilibrium entrepreneurial theory of
new firm formation based on risk aversion. Journal of Political Economy, 87, 304-16
Robert E. Lucas (1978). On the size distribution of business _rms. Bell Journal of
Economics, 9(2):508{523, Autumn 1978
Romer, P. M., 1990, ‘Endogenous Technical Change’, Journal of Political Economy 98,
71–102.
Schultz, T. W., 1980, ‘Investment in Entrepreneurial Ability’, Scandinavian Journal of
Economics 82, 437–448.
Taylor, M. (1996) Earnings, independence, or unemployment: why become self
employed? Oxford Bulletin of Economics and Statistics 58(2): 253–266.
Taylor, M. (1999) Survival of the fittest? An analysis of self-employment duration in
Britain. Economic Journal 109(454): c140–c155.
Taylor, M. (2001) Self-employment and windfall gains in Britain: evidence from panel
data. Economica 68: 539–565.
Vijverberg, Wim(2008) “Education And Entrepreneurship Selection And Performance: A
Review of the Empirical Literature”. Journal of Economic Surveys (2008) Vol. 22, No. 5,
pp. 795–841 University of Texas at Dallas & IZA

-25-
Van der Sluis, J. and Van Praag, M. (2007) Identifying the difference in returns to
education for entrepreneurs and employees: identification by means of changes in
compulsory schooling laws. Working Paper, University of Amsterdam

-26-
Appendix
Variables Definitions
1. Entrepreneurship
We develop a list of possible support to entrepreneurship initiatives and variation that
address the particular constraints to entrepreneurship based on literature review. This list
is intended to be illustrative of the types of interventions that can be used to address
context specific constraints, rather than being an exhaustive collection of all types of
possible entrepreneurship support initiatives and adaptations.
Recognizing the importance of entrepreneurship initiatives that have been adapted to the
specific needs of the (potential) entrepreneurs, we further disaggregate by entrepreneurial
profile focusing on three types of entrepreneurs based on their enthusiasm for entering
into entrepreneurial activity.
Necessity driven entrepreneurs: entrepreneurs who have few or no other income
generation or employment opportunities, and thus become entrepreneurs to sustain their
livelihood by necessity rather than choice;
Opportunity driven entrepreneurs: entrepreneurs who pursue a perceived market
opportunity and choose to start their own business, despite having the option of
generating an income through employment elsewhere at the time of starting a business.
Growth oriented entrepreneurs: entrepreneurs who have a relatively higher job
creation potential (which may also be an indication of greater international market reach
and/or a higher degree of innovation in products and services offered).
Total early-stage Entrepreneurial Activity rates
Percentage of 18-64 population who are either a nascent entrepreneur or owner-manager of a
new business
1. GDP growth (annual %)
The Annual percentage growth rate of GDP at market prices is based on constant local
currency. Aggregates are based on constant 2000 U.S. dollars.
2. Secondary education, pupils
Secondary education pupils are the total number of pupils enrolled at secondary level in
public and private schools.
3. Secondary education, general pupils
Secondary general pupils are the number of secondary students enrolled in general
education programs, including teacher training
4. Self-employed, total (% of total employed)

-27-
Patent applications are worldwide patent applications filed through the Patent
Cooperation Treaty procedure or with a national patent office for exclusive rights for an
invention--a product or process that provides a new way of doing something or offers a
new technical solution to a problem. A patent provides protection for the invention to the
owner of the patent for a limited period, generally 20 years.
5. Expense (% of GDP)
Expense is cash payments for operating activities of the government in providing goods
and services. It includes compensation of employees (such as wages and salaries), interest
and subsidies, grants, social benefits, and other expenses such as rent and dividends.
6. Research and development expenditure (% of GDP)
Expenditures for research and development are current and capital expenditures (both
public and private) on creative work undertaken systematically to increase knowledge,
including knowledge of humanity, culture, and society, and the use of knowledge for new
applications. R&D covers basic research, applied research, and experimental
development.
7. Population growth (annual %)
Annual population growth rate for year t is the exponential rate of growth of midyear
population from year t-1 to t, expressed as a percentage. Population is based on the de
facto definition of population, which counts all residents regardless of legal status or
citizenship--except for refugees not permanently settled in the country of asylum, which
are generally considered part of the population of the country of origin.
8. Government Stability
A measure of the government's ability to stay in office and carry out its declared
program(s), depending upon such factors as the type of governance, cohesion of the
government and governing parties, approach of an election, and command of the
legislature.
9. Socio economic Conditions
An estimate of the general public's satisfaction or dissatisfaction with the government's
economic policies, covering a broad spectrum of factors ranging from infant mortality
and medical provision to housing and interest rates. Different weights are applied in
different societies, depending upon the relative political impact.
10. Investment Profile
A measure of the government's attitude toward inward investment as determined by four
components: the risk to operations, taxation, repatriation, and labor costs.

-28-
Table1: Dependent Variable: Total Entrepreneurial Activity
Variable Coefficient Std. Error t-Statistic Prob.*
Constant 57.071 13.199 4.324 0.000
Population Growth 1.605 0.707 2.270 0.000
Government Stability 10.652 2.387 4.462 0.006
R & D exp. (% of GDP) 1.255 0.315 3.988 0.005
Socio-eco conditions 1.000 0.000 1.989 0.119
Govt. Consumption exp. 0.956 0.718 1.331 0.250
Secondary edu. Pupil 0.842 0.969 0.869 0.634
Investment Profile 0.225 0.330 0.683 0.742
R-squared 0.514087 Mean dependent var 8.557
Adjusted R-squared 0.4385 S.D. dependent var 5.740
Table2: Dependent Variable: Necessity Driven Entrepreneurship Activity
Variable Coefficient Std. Error t-Statistic Prob.*
Constant 30.316 7.827 3.873 0.000
Population Growth 9.402 1.539 6.109 0.000
Government Stability 1.332 0.471 2.828 0.007
R & D exp. (% of GDP) 1.813 0.608 2.981 0.005
Socio-eco conditions 0.785 0.630 1.247 0.219
Govt. Consumption exp. 0.565 0.184 3.063 0.004
Secondary edu. Pupil 1.000 0.000 3.073 0.004
Investment Profile 1.228 0.587 2.092 0.042
R-squared 0.668 Mean dependent var 8.557
Adjusted R-squared 0.616 S.D. dependent var 5.740
Table3:Dependent Variable: Improvement Driven Entrepreneurship Activity
Variable Coefficient Std. Error t-Statistic Prob.*
Constant 108.123 18.061 5.987 0.000
Population Growth 0.000 0.000 3.984 0.000
Government Stability 18.342 4.125 4.447 0.000
R & D exp. (% of GDP) 1.611 1.394 1.156 0.254
Socio-eco conditions 1.343 0.490 2.742 0.009
Govt. Consumption exp. 5.079 1.577 3.221 0.002
Secondary edu. Pupil 4.065 1.413 2.878 0.006
Investment Profile 0.286 0.490 0.584 0.562
R-squared 0.419842 Mean dependent var 45.01852
Adjusted R-squared 0.331557 S.D. dependent var 11.72723

-29-
Table4: Dependent Variable: Growth Oriented Entrepreneurship Activity
Variable Coefficient Std. Error t-Statistic Prob.*
Govt. consumption 0.855 0.200 4.277 0.000
Socio-eco conditions 1.714 0.755 2.270 0.028
Govt. stability 1.006 0.540 1.862 0.068
R & exp (% of GDP) 0.893 0.793 1.125 0.266
GDP growth 2.478 1.541 1.608 0.114
R-squared 0.29006 Mean dependent var 9.636364
Adjusted R-squared 0.233265 S.D. dependent var 6.337319
Table 5: Dependent Variable: Change in Per Capita income
Variable Coefficient Std. Error t-Statistic Prob.
Constant 6893.919 11433.95 0.602934 0.55
Explained Entreprenurial Activity Rate 91.19462 46.13344 1.976758 0.055
Unexplained Entreprenurial Activity Rate -37.8073 74.76522 -0.50568 0.6159
Secondary education pupil 1.16E-05 8.11E-06 1.426223 0.1616
R & D exp. 1389.393 302.3845 4.594789 0
Socio-economic conditions 813.9676 301.0349 2.703897 0.01
population growth 112.0886 766.1413 0.146303 0.8844
Employment rate -85.9998 100.1598 -0.85863 0.3957
Government stability -316.667 243.3225 -1.30143 0.2006
Investment Profile 103.6366 308.1218 0.33635 0.7384
R-squared 0.385882 Mean dependent var -144.834
Adjusted R-squared 0.247706 S.D. dependent var 1915.183

-30-
Table 6: Dependent Variable: Change in Per Capita Income
Variable Coefficient Std. Error t-Statistic Prob.
Constant 7191.83 11285.07 0.637287 0.5276
Explained Necessity Based Entre. 127.2231 59.02128 2.155547 0.0372
Unexplained Necessity Based Entre -89.6379 159.7353 -0.56117 0.5778
Secondary education pupil 7.89E-06 8.07E-06 0.977165 0.3344
R & D exp. 1447.226 315.5883 4.585806 0
Socio-economic conditions 817.8054 299.0224 2.734931 0.0093
population growth 229.186 804.7749 0.284783 0.7773
Employment rate -89.0467 97.76737 -0.9108 0.3679
Government stability -274.453 236.3555 -1.16119 0.2524
Investment Profile 29.28781 320.5133 0.091378 0.9276
R-squared 0.40441 Mean dependent var -144.834
Adjusted R-squared 0.270402 S.D. dependent var 1915.183
Table 7:Dependent Variable: Change in Employment
Variable Coefficient Std. Error t-Statistic Prob.
Constant -7.24038 2.646284 -2.73605 0.0089
Explained Entre. Activity 0.114165 0.055037 2.074348 0.0438
Unxplained Entre. Activity 0.118377 0.09468 1.250286 0.2177
Secondary education, pupil 8.97E-09 1.15E-08 0.777134 0.4411
R & D exp. 0.013378 0.362329 0.036922 0.9707
Govt. Stability 0.342108 0.306915 1.114667 0.2709
Population Growth 1.673903 0.833021 2.009436 0.0505
Per capita growth 0.015095 0.134503 0.11223 0.9111
R-squared 0.218566 Mean dependent var -0.18491
Adjusted R-squared 0.09701 S.D. dependent var 2.2428

-31-
Table8: Dependent Variable: Change in Employment
Variable Coefficient Std. Error t-Statistic Prob.
Constant -7.52558 3.371695 -2.23199 0.0304
Explained Growth Entre. 0.049292 0.103707 0.475306 0.6368
Unexplained Growth Entre. 0.189776 0.108965 1.741619 0.0881
Secondary education, pupil 1.70E-08 1.15E-08 1.480515 0.1454
R & D exp. -0.18713 0.353052 -0.53004 0.5986
Govt. Stability 0.421205 0.319056 1.32016 0.1932
Population Growth 2.502124 0.974723 2.567009 0.0135
Per capita growth -0.04365 0.113066 -0.38607 0.7012
R-squared 0.156902 Mean dependent var -0.12364
Adjusted R-squared 0.031334 S.D. dependent var 2.22677
Table9: Dependent Variable: Change in Population
Variable Coefficient Std. Error t-Statistic Prob.
Constant 5.80E-13 8.85E-14 6.551954 0
Explained Entre. Activity 7.93E-16 4.16E-16 1.905551 0.0633
unexplained Entre. Activity 3.45E-16 6.89E-16 0.501154 0.6188
Secondary education pupil 1.36E-22 8.67E-23 1.574212 0.1226
R & D exp. -6.47E-16 2.64E-15 -0.24457 0.8079
Govt. Stability 3.92E-15 2.27E-15 1.728271 0.091
Per capita growth -1.10E-15 9.90E-16 -1.10638 0.2746
Employment rate 5.73E-15 8.69E-16 6.600376 0
R-squared 0.6 Mean dependent var 1.292925
Adjusted R-squared 0.57 S.D. dependent var 0.473767

-32-
Table 10: Dependent Variable: Change in Pouplation
Variable Coefficient Std. Error t-Statistic Prob.
Constatnt 2.99E-13 4.55E-14 6.576773 0
Explained Necessity Entre. 4.96E-16 2.87E-16 1.725536 0.0914
Unexplained Necessity Entre 5.65E-16 7.20E-16 0.784072 0.4372
Secondary education pupil 7.93E-23 4.54E-23 1.748056 0.0874
R & D exp. 7.12E-16 1.44E-15 0.494135 0.6237
Govt. Stability 2.98E-15 1.20E-15 2.489074 0.0167
Per capita growth -5.46E-16 4.98E-16 -1.09585 0.2791
Employment rate 2.87E-15 4.46E-16 6.44645 0
R-squared 0.65 Mean dependent var 1.292925
Adjusted R-squared 0.6 S.D. dependent var 0.473767