Draft Piezoelectric Dissertation
43
1 | Page HERIOT-WATT UNIVERISTY Piezoelectric Micro Power Generator Mechanical Engineering BEng(Hons) Matthew Gary Nesbitt 4/15/2011 [Type the abstract of the document here. The abstract is typically a short summary of the contents of the document. Type the abstract of the document here. The abstract is typically a short summary of the contents of the document.]
-
Upload
matthew-gary-nesbitt -
Category
Documents
-
view
142 -
download
2
description
Draft final report
Transcript of Draft Piezoelectric Dissertation

1 | P a g e
HERIOT-WATT UNIVERISTY
Piezoelectric Micro Power Generator
Mechanical Engineering BEng(Hons)
Matthew Gary Nesbitt
4/15/2011
[Type the abstract of the document here. The abstract is typically a short summary of the
contents of the document. Type the abstract of the document here. The abstract is typically a
short summary of the contents of the document.]

2 | P a g e
1 Contents
2 Introduction ................................................................................................................... 4
3 Aim ............................................................................................................................... 4
3.1 Objective ................................................................................................................ 4
4 Background ................................................................................................................... 5
4.1 Materials ................................................................................................................. 5
4.1.1 Crystals ............................................................................................................ 5
4.1.2 Ceramics .......................................................................................................... 5
4.2 Application ............................................................................................................. 6
4.2.1 Example of Piezoelectric Applications in Automotive industry ........................ 6
4.2.2 How piezoelectric materials are applied in Energy Harvesting ......................... 6
4.3 Piezoelectric Theory ............................................................................................... 6
5 Literature Review .......................................................................................................... 9
6 Experimental Testing of Original Design ..................................................................... 11
6.1 Method ................................................................................................................. 11
6.2 Results .................................................................................................................. 12
6.3 Discussion............................................................................................................. 12
6.4 Conclusion and follow up...................................................................................... 13
7 Sine Square wave form comparison ............................................................................. 14
7.1 Method and Expectations ...................................................................................... 14
7.2 Results .................................................................................................................. 14
7.3 Discussion............................................................................................................. 14
7.4 Conclusion ............................................................................................................ 15
8 Direct application of bending force .............................................................................. 15
8.1 Method and Expectations ...................................................................................... 15
8.2 Results .................................................................................................................. 15
8.3 Discussion............................................................................................................. 16
8.4 Conclusion ............................................................................................................ 16
9 Mass loading ............................................................................................................... 17
9.1 Method and expectations ....................................................................................... 17
9.2 Results .................................................................................................................. 17
9.3 Discussion............................................................................................................. 17
9.4 Conclusion ............................................................................................................ 18
10 Parallel Rewiring ......................................................................................................... 18
10.1 Generators Old state .............................................................................................. 18
10.2 Generators New state ............................................................................................ 18

3 | P a g e
11 Parallel Testing............................................................................................................ 19
11.1 Method and expectations ....................................................................................... 19
11.2 Problems encountered and Results ........................................................................ 19
12 Conclusion .................................................................................................................. 19
13 Looking at efficiency of energy conversion ................................................................. 19
14 Conclusion .................................................................................................................. 21
15 Future Work ................................................................................................................ 21
16 Acknowledgements ..................................................................................................... 22
17 References ................................................................................................................... 22

4 | P a g e
2 Introduction With smaller and smaller electronics
coming into day to day usage, it is
necessary to develop a method of reliable
power for these devices. The usual small
device is powered by a
replaceable/rechargeable battery, but with
batteries comes a problem. What to do
when they are depleted? Usually it is just a
simple matter of swapping out/recharging
the battery. Sometimes though it is not
possible to replace a depleted battery due
to its location within the world or maybe
the battery itself is integrated into the
structure of the device, either way it seems
that the only method of restoring power
left is to recharge the existing battery.
The problem though still exists
when recharging a battery. With devices
that are in hard to reach places; be they
devices in geographical situations, devices
in inhospitable environments or even
devices implanted into animals or humans,
it is not possible to physically go in
remove these batteries and then replace the
fully charged battery back into the device.
A method of deriving power from the
surrounding environment must be devised,
so that these devices are continuously
powered on site, and could possibly last
for a lifetime without further physical
contact, or at least none relating to any
power issue.
This method of drawing power
from the surrounding environment is
called energy harvesting.
There are many forms of Energy
Harvesting in existence, electrostatic and
electromagnetic to names just two, but the
most promising form of Energy Harvesting
is by the use of piezoelectric materials to
absorb vibrations. The reason for
piezoelectric systems being the most
promising is because of the simplicity of
the idea; A material that through being put
under strain will directly generate
electricity without the use of an external
power source. The simplicity of these
materials means that they can be made on
the microscopic scale and integrated into
other micro systems.
So the idea is, to have an energy
harvesting system generating enough
power to drive a small electronic device
such as an Mp3 player or remote sensor, or
possibly a system that could be integrated
into the human body to recharge a battery
while on the move.
3 Aim The aim of this project is to continue the
construction of a micro power generator,
started by the years previous, and to
improve on their design by analysing data
from electrical output tests and
determining where flaws exist, if any, and
eliminating them by modifying and
improving the design.
3.1 Objective 1. Test previous design
2. Test parallel circuitry over current
series circuitry
“Energy harvesting is the conversion of
ambient energy into electricity to drive small or mobile electronic and electrical devices.” http://www.energyharvestingjournal.com/ Fig.1 Micro Mechanical
System

5 | P a g e
3. Review possible new piezoelectric
materials
4. Test new materials
5. Design a Micro power generator that
will successfully recharge a battery in
an acceptable time frame
4 Background 1(Inman 2004) Power harvesting devices
work in many ways but one of the most
popular methods is a system that uses
mechanical vibration to apply mechanical
strain to a piezoelectric material. This type
system often uses ambient vibration
around the power harvesting device and
then converts it into a useful electrical
energy.
As described in the introduction materials
that generate a current when undergoing
strain are called piezoelectric materials,
but that is not all they do. They also do the
opposite, the material will strain when a
current is passed through it, these effects
are called direct piezoelectric and converse
piezoelectric respectively. With these two
effects a piezoelectric material can be used
as both a sensor and an actuator.
4.1 Materials Piezoelectric materials are divided into 3
categories; crystals, ceramics and others.
4.1.1 Crystals2 Quartz (SiO2) – one of the most common
crystals on the earth’s surface and shows a
strong piezoelectric effect perpendicular to
the prism axis.
Berlinite – structure is identical to that of
quartz but rarely forms crystals.
Gallium orthophosphate (GaPO4) – not
found in nature, has to be synthesised, but
it has twice the piezoelectricity of Quartz.
1 A Review of power harvesting from vibration using piezoelectric materials – Henry A. Sodano
and Daniel J. Inman 2 www.piezomaterials.com
Tourmaline – commonly black but can
range in colour, shows piezoelectric
qualities.
4.1.2 Ceramics Barium Titanate (BATiO3) – used as a
piezoelectric material for microphones.
Lead zirconate titanate (PZT) – considered
the most economical piezoelectric
material.
(Henry Sodano) The most common
material used is PZT and it comes in many
differing forms. All these forms exist
because they are all designed to suit
slightly different purposes. There are three
main types of PZT sold; Hard, Soft and
custom and there are many different types
of each. In the appendix is an extract from
a catalogue supplied by Morgan Electro
ceramics.
6 | P a g e
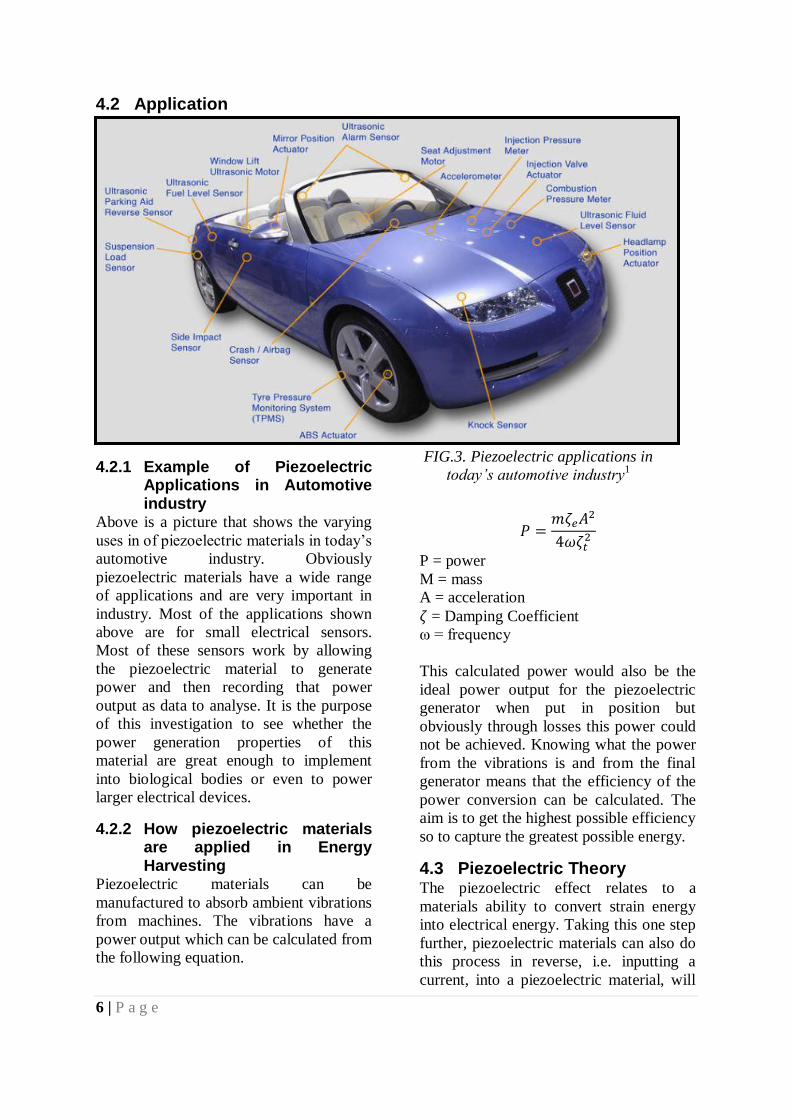
4.2 Application
4.2.1 Example of Piezoelectric Applications in Automotive industry
Above is a picture that shows the varying
uses in of piezoelectric materials in today’s
automotive industry. Obviously
piezoelectric materials have a wide range
of applications and are very important in
industry. Most of the applications shown
above are for small electrical sensors.
Most of these sensors work by allowing
the piezoelectric material to generate
power and then recording that power
output as data to analyse. It is the purpose
of this investigation to see whether the
power generation properties of this
material are great enough to implement
into biological bodies or even to power
larger electrical devices.
4.2.2 How piezoelectric materials are applied in Energy Harvesting
Piezoelectric materials can be
manufactured to absorb ambient vibrations
from machines. The vibrations have a
power output which can be calculated from
the following equation.
P = power
M = mass
A = acceleration
= Damping Coefficient
ω = frequency
This calculated power would also be the
ideal power output for the piezoelectric
generator when put in position but
obviously through losses this power could
not be achieved. Knowing what the power
from the vibrations is and from the final
generator means that the efficiency of the
power conversion can be calculated. The
aim is to get the highest possible efficiency
so to capture the greatest possible energy.
4.3 Piezoelectric Theory The piezoelectric effect relates to a
materials ability to convert strain energy
into electrical energy. Taking this one step
further, piezoelectric materials can also do
this process in reverse, i.e. inputting a
current, into a piezoelectric material, will
FIG.3. Piezoelectric applications in
today’s automotive industry1

7 | P a g e
cause it to deform in a specific way. This
is called the converse piezoelectric effect
or sometimes the electromechanical effect.
There are few materials that are truly
piezoelectric but of the few that are they
are mostly crystal or ceramic. A crystal
usually has a random polar axis resulting
from the charge of each individual atom
that makes up the whole, to make the polar
axis useful they must first be aligned and
this is done by heating up the crystal and
then applying a strong electrical field
which forces all of the dipoles to line up
and face the same general direction.
Fig.2.2. Polarization of Ceramic Material
to Generate Piezoelectric Effect3
If the above material is under compression
it will produce a voltage of the same
polarity as the poling voltage while if it is
under tension an opposite polarity would
be produced, conversely if a voltage is
applied on the material with the opposite
polarity as the poling voltage the material
will deform, in this case expanding
outward. Finally if an AC supply was to be
attached the material would vibrate to the
same frequency as the AC.
3 PZT APPLICATION MANUAL
4Once a piezoelectric material is poled as
above its properties are unstable. The
longer the time period after poling the
more stable the materials becomes. The
values given for certain constants (i.e.
dielectric and piezoelectric) by the
manufacturer can only be specified for a
standard time after poling.
An electro ceramic can age more rapidly if
its limitations are exceeded in one of the
following areas.
4.3.1.1 Temperature The Piezoelectric performance of electro
ceramics decrease as the operating
temperature increases. This eventually
leads to complete de-poling of the ceramic
at the Curie point. The Curie point is the
maximum exposure temperature for any
piezoelectric ceramic. Every ceramic has
its own individual Curie point usually
given by the manufacturer. It is
recommended not to exceed half of the
Curie point to reduce ageing due to
temperature. The closer a material operates
to its Curie point the more rapidly it ages
due to the temperature.
4.3.1.2 Voltage A strong voltage applied in the opposite
direction to the poling voltage can lead to
de-poling of the ceramic. How rapidly it
affects the ceramic is dependent on the
material, duration of the applied voltage
and the operating temperature. It should be
considered that alternating voltage will
also have the same aging effect for the half
cycle it is opposite the poling voltage.
4.3.1.3 Mechanical Stress High mechanical stress can depolarise an
electro ceramic but it is dependent of the
type of ceramic and duration of the applied
stress in much the same way as the
voltage.
4 MORGAN ELECTRO CERAMICS
8 | P a g e
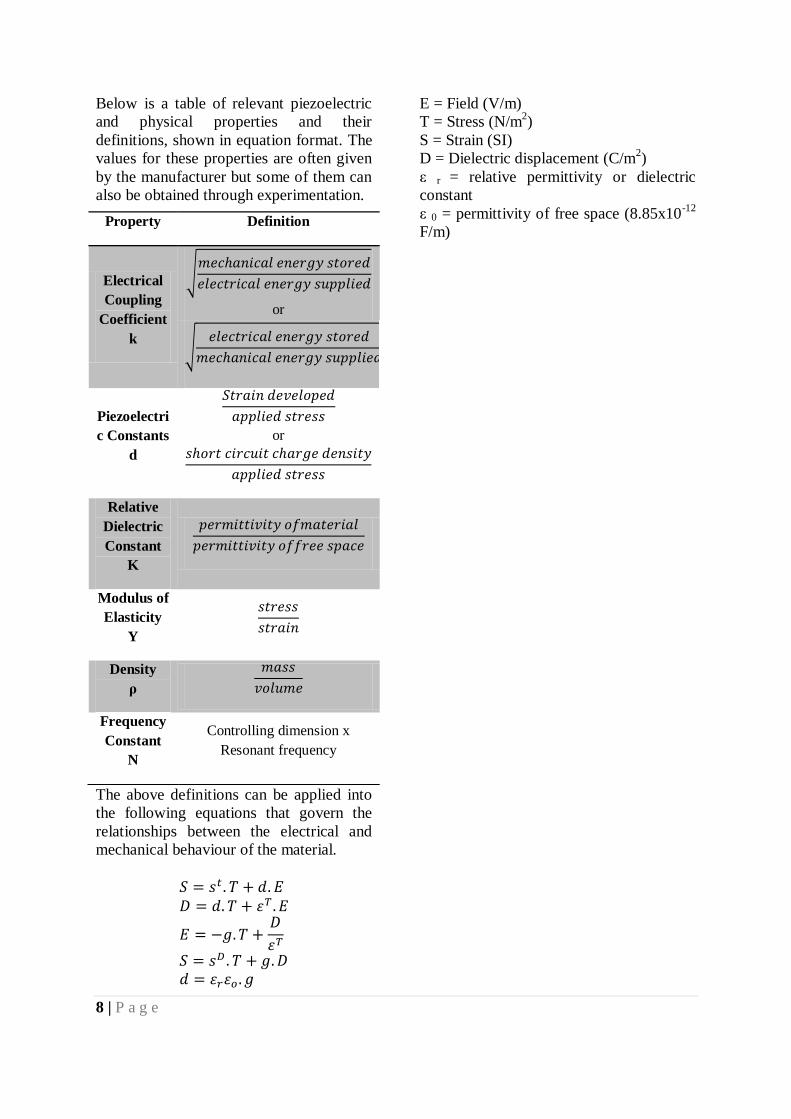
Below is a table of relevant piezoelectric
and physical properties and their
definitions, shown in equation format. The
values for these properties are often given
by the manufacturer but some of them can
also be obtained through experimentation.
The above definitions can be applied into
the following equations that govern the
relationships between the electrical and
mechanical behaviour of the material.
E = Field (V/m)
T = Stress (N/m2)
S = Strain (SI)
D = Dielectric displacement (C/m2)
ε r = relative permittivity or dielectric
constant
ε 0 = permittivity of free space (8.85x10⁻¹²
F/m)
Property Definition
Electrical
Coupling
Coefficient
k
or
Piezoelectri
c Constants
d
or
Relative
Dielectric
Constant
K
Modulus of
Elasticity
Y
Density
ρ
Frequency
Constant
N
Controlling dimension x
Resonant frequency
9 | P a g e
5 Literature Review 1. “A Review of Power Harvesting from
Vibration using Piezoelectric
Materials” Henry A.Sodano and
Daniel J.Inman 2004
This is a paper reviewing other papers that
are evaluating the use of piezoelectric
materials in energy harvesting systems, so
to understand whether or not they would
be viable to use in everyday life. The paper
talks about the theory and methods behind
the preparation of piezoelectric materials
i.e. poling. It also confirms that the battery
has better storage capabilities than the
capacitor. One of the final parts of the
paper discusses the possibility of
incorporating piezoelectric materials into
clothes and biological systems, then going
on to look deeply into the power generated
through walking. The damping effect
caused by the energy extraction is looked
at and found to resemble the damping of a
shunt system but with the energy being
stored instead of lost.(A J Fleming)5
Finally the paper discusses the future of
piezoelectric materials saying that the
harvesting devices are producing energy
too small to power current technology and
the future may lie in advances in low
power electronics
Definition
Shunt Damping: Piezoelectric shunt
damping systems reduce structural
vibration by shunting an attached
piezoelectric transducer with electrical
impedance
Other material suggested by paper:
Papers
Crawly and de Luis 1987, Crawly and
Anderson 1990, Hagood et al 1990, Smits
and Choi 1991, Smits et al 1991, Near and
Craig 1996, Inman and Cudney 2000,
Niezrecki et al 2001.
5 Adaptive piezoelectric shunt damping, A
J Fleming1 and S O R Moheimani
Books
Ghandi and Thompson 1992, Ikeda 1996,
Banks et al 1996, Culshaw 1996, Clark et
al 1998, Srinivasan and Mcfarland 2001,
Worden et al 2003
2. “Comparison of Piezoelectric Energy
Harvesting Devices for Recharging
Batteries” (J.Inman 2005)
This is a report comparing the
piezoelectric materials PZT, MFC and QP,
and their ability to convert vibration
energy into electrical energy, to power
simple electronics. Using their own
conclusions from other reports, shown in
“review 1”, Sodano and Inman continue
their investigation into power generation
through piezoelectric materials. Setting up
each material as a cantilever beam to
absorb vibrations, they were tested for the
time period taken to fully recharge a
battery. Efficiency of each system was also
calculated.
V= voltage drop across load resistance
R= Resistance
F= force applied to base of plate
D= displacement of plate
T= time
N= data point index
M=total number of total points
It is found from experimentation that the
QP performs better at resonant frequencies
but the PZT performs better at random
frequencies while the MFC doesn’t
perform well in any situation. PZT and QP
were then brought on for the battery
charging experiment which showed that
while the QP was good at charging smaller
batteries at its resonant frequency, as the
battery sized increased the performance
fell off. This results in the PZT being the
better choice of material for power
generation and random and resonant
frequencies.
Definition
PZT: Lead Zirconate Titanate

10 | P a g e
MFC: Macro Fibre Composite
QP: Quick Pack
3. “Human Powered Wearable
Computing” Thad Starner,
Massachusetts Institute of
Technology (Starner)
In this paper Starner discusses in depth the
amount of energy expended in actions
undertaken by the human body. After
discussing many methods of energy
recovery from human movement he finally
discusses the possibility of using
piezoelectric materials in clothing. He
states that it is the most promising and
least obstructive of the ideas previously
discussed in his paper but also points out
that the materials that could be used are, at
the moment, to inefficient to fully utilise
the power available. Also in the paper
power requirements for electronic systems
are discussed and they are analysed to see
which could be powered by the day to day
movements of the human body. Also
discussed where the current trends in
electrical goods and battery sizes and life
spans. In conclusion of his paper he states
that the next step is to develop a
piezoelectric generator for testing of
energy harvesting through something as
natural as walking.
“Increasing Electrical Power
Generation for a Piezoelectric Power
Harvester” (Garnett E. Simmers Jr)
This short paper shows the power
generation abilities of piezoelectric
actuators. It shows that piezoelectric
cantilevers do have the potential to
recharge a battery when connected
electrically in parallel rather than in series,
which was usually the case. They also
show that that to obtain the maximum
energy output then the beams must be
turned to resonate in the same frequency
range as the ambient vibrations expected.
A picture of their experimental set up was
also included in the short report.
Fig.3. the mobile power harvester
attached to a shaker for experimentation

11 | P a g e
6 Experimental Testing of Original Design
Below is an image of the generator from
the previous year. It is a small black block
hollowed out with a screw hole in the
bottom so it can be attached to a
mechanical shaker. There are 3
piezoelectric beams over the hollowed out
area supported by small screws and then
connected electrically in series just beyond
that.
The generator works on the premise that
the beams will vibrate with the whole
generator and bend with their own inertia,
although this is not the most efficient
method of energy production a small
improvement was to add masses to the end
of the beams adding to their inertia and
bending them much more with the
vibrations.
Although the generator worked well
through testing during last year’s
experimentation the addition of a
rectifying circuit before completion of the
project effectively broke the device. The
circuit contained a chip that only activated
once voltage reached a constant 5V and
currently the generator peaked just below
that output meaning that no power output
at all. This circuit was removed and has
been scrapped as it isn’t of much use.
As the rectifying circuit was scrapped the
output from any testing will be an
alternating result. This being the case it
was decided that the program Lab View
would be used to record the results. Below
is a list of the apparatus used in the first
experiment.
Apparatus
Amplifier
Frequency Generator
Mechanical Shaker
Computer with Lab View program
Piezoelectric Generator
6.1 Method
Below is picture showing the general set
up of the experiment. The signal generator
puts out a variable frequency and wave
form of this frequency can be altered to
represent a sine wave, square wave or even
a triangular wave form. This signal is then
run through the amplifier which allows the
amplitude at which the mechanical shaker
to be controlled. To begin with the
amplitude will be set to 1 and depending
on results may be increased upon from
there. Then of course the generator is
attached to the top of the mechanical
shaker.
The generator will be shaking a varying
frequencies starting from 5 Hertz and
increasing in 5 Hertz intervals until 50
Hertz is reached and at the amplitude set to
1. The output of the generator will then be
measured for current and voltage and the
results will be analysed for maximum
power output and efficiency at reaching
maximum power. The results are shown on
graphs on the following page.

12 | P a g e
6.2 Results A full set of results can be found on page 4
of the appendix, only a summarised set of
results are shown here.
Below are the current, voltages and power
graphs from the experiment at increasing
frequencies from 5- 50Hz.
6.3 Discussion
It is impossible to compare the current and
therefore the power results from the
previous year to the results obtained for
this test as there was no discernable
current output from that test. This might be
put down to a loose connection during that
test or the measuring device used for the
recording the results. The student from last
year used a multimeter to record all his
results but this year a multimeter was only
used to record the voltage output while the
current was recorded using Lab view
software which allowed for a much more
accurate reading of the peak current output
and even allowed for the varying current to
be plotted on sine wave form graphs
(shown in appendix).
The results shown on this page
though show the peak current, voltage and
power output for each frequency tested,
the power been calculated was the
maximum power output from the generator
when the voltage and current at their
maximum points using the power equation
shown below.
Even with the results for this test not being
comparable with the results from last year
an analysis can still be carried out.
Firstly, from looking at the graphs
and then looking at the data provided in
the tables, that form the graphs, it can be
seen that there is a flaw with the lab view
software used to obtain the results. A few
tables show this flaw more obvious than
others, graphs 4 and 5. It can be seen that
there is a gap in the data obtained, a small
0.02-0.03 second interval that occurs at
almost the same point for each test. It
becomes more obvious during the tests
with higher frequency vibrations but it is
also present during the lower frequency
testing.
Next thing noticed which may be
obvious, is that power generation increases
as frequency increases until it reaches a
0
0.05
0.1
0.15
0.2
0.25
0.3
0.35
0.4
0 20 40 60
C
u
r
r
e
n
t
Frequency
0
0.05
0.1
0.15
0.2
0.25
0.3
0.35
0.4
0 20 40 60
Volt
age
Frequency
0
0.001
0.002
0.003
0.004
0.005
0 20 40 60
Pow
er
Frequency

13 | P a g e
maximum at 25Hz and then falls unevenly
again. On the next page is a table that
shows the maximum peak height against
frequency.
Although high current generation is key
for recharging a battery effectively the
efficiency at reaching a high current is also
a factor. It can be seen from the graphs, in
the appendix, that although the highest
current generation occurred at 25Hz the
generator was much more efficient at
higher frequencies as shown by the graph
below which displays the generators
ability to reach 90% of its peak output at
each frequency.
6.4 Conclusion and follow up Although the testing went as planned and
the results obtained are expected they are
not exactly desirable if the final
application of this generator is to be
incorporated in biological systems with
low frequencies. As the error value of lab
view is 0.0003 Amps this meant that
values obtained for 5Hz where possibly
wrong due to the low values shown.
The next experiment will be to test
a theory that different wave forms will
affect the output. It will be a direct
comparison between a sine and square
wave form. The hope is that the square
wave will increase the power output at
lower frequencies but also keep the same
output at higher frequencies as at higher
frequencies all wave forms begin to look
similar.
Frequency Max. Peak Current
5 0.000138
10 0.001241
15 0.008815
20 0.001845
25 0.011775
30 0.004415
35 0.003
40 0.002214
45 0.003084
50 0.002903
14 | P a g e
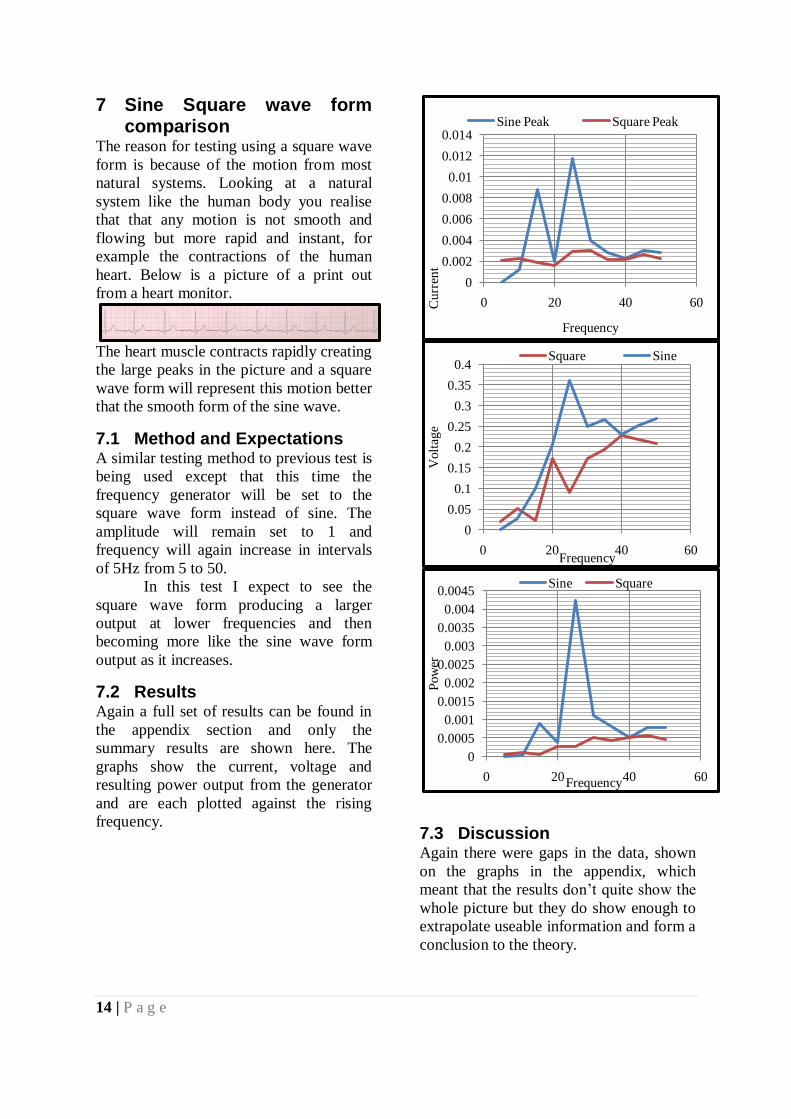
7 Sine Square wave form comparison
The reason for testing using a square wave
form is because of the motion from most
natural systems. Looking at a natural
system like the human body you realise
that that any motion is not smooth and
flowing but more rapid and instant, for
example the contractions of the human
heart. Below is a picture of a print out
from a heart monitor.
The heart muscle contracts rapidly creating
the large peaks in the picture and a square
wave form will represent this motion better
that the smooth form of the sine wave.
7.1 Method and Expectations A similar testing method to previous test is
being used except that this time the
frequency generator will be set to the
square wave form instead of sine. The
amplitude will remain set to 1 and
frequency will again increase in intervals
of 5Hz from 5 to 50.
In this test I expect to see the
square wave form producing a larger
output at lower frequencies and then
becoming more like the sine wave form
output as it increases.
7.2 Results Again a full set of results can be found in
the appendix section and only the
summary results are shown here. The
graphs show the current, voltage and
resulting power output from the generator
and are each plotted against the rising
frequency.
7.3 Discussion Again there were gaps in the data, shown
on the graphs in the appendix, which
meant that the results don’t quite show the
whole picture but they do show enough to
extrapolate useable information and form a
conclusion to the theory.
0
0.002
0.004
0.006
0.008
0.01
0.012
0.014
0 20 40 60Curr
ent
Frequency
Sine Peak Square Peak
0
0.05
0.1
0.15
0.2
0.25
0.3
0.35
0.4
0 20 40 60
Volt
age
Frequency
Square Sine
0
0.0005
0.001
0.0015
0.002
0.0025
0.003
0.0035
0.004
0.0045
0 20 40 60
Pow
er
Frequency
Sine Square

15 | P a g e
7.4 Conclusion For higher frequencies it turns out the
square wave form does not increase the
output but instead decreases the overall
output but it can also be seen that the two
waves closely resemble each other which
does at least prove half of the theory.
On the other hand the output at
lower frequencies is increased. When
looking at the graphs, ignoring all the
minor variations as these could be down to
the errors and interference in the line.
Instead focus on the large peaks in output,
these peaks show increased output over the
regular sine wave. This increase could be
put down to the large increase in the rate
of change, in position, from sine to square
wave. At lower frequencies a sine wave is
very smooth and while this amplitude (if
applied directly to the beams) will generate
an output, on this design it will not
because of little to no deflection of the
beams relative to the generator. With this
in mind it is worth testing to see what
effect applying the bending force directly
to the beams will have.
The application of the bending
force directly to the beams is not a new
idea on this project, it was originally
designed to work that way but during the
previous year the student redesigned the
generator to work without it which reduced
the efficiency of energy transfer at lower
frequencies but increased it at higher
frequencies. The reason for this change
was never made clear so the aim of the
next experiment is to determine exactly
why this change was made and establish
whether this was the best course of action.
8 Direct application of bending force
This experiment is a test to determine
whether applying the bending force
directly to the beams will increase or
decrease the power output from the
generator.
8.1 Method and Expectations For this test the set up of the generator has
to be changed, instead of bolting the
generator to the mechanical shaker and
relying on the inertia of the beams to bend
them, a small aluminium plate with a hole
centred at one end will be secured to the
shaker and the beams will rest on top of
that. The generator of course has to be
lifted to the right height so that the beams
rest on the plate in their datum position
(unbent) and the generator will be secured
down so that no energy is lost through the
movement of the generator during testing.
A picture taken of the experimental set up
is shown below.
Again the generator will be tested at
varying frequencies from 5 to 50 Hertz and
the amplitude will remain at one to keep
the testing method consistent throughout
all experiments.
The results expected from this test
will hopefully show a direct relationship
between frequency input and power output
as the beams will no longer rely on their
own resonance frequency to vibrate
efficiently.
8.2 Results The graph that follows shows the peak
current output for this experiment at the
increasing frequencies.
16 | P a g e
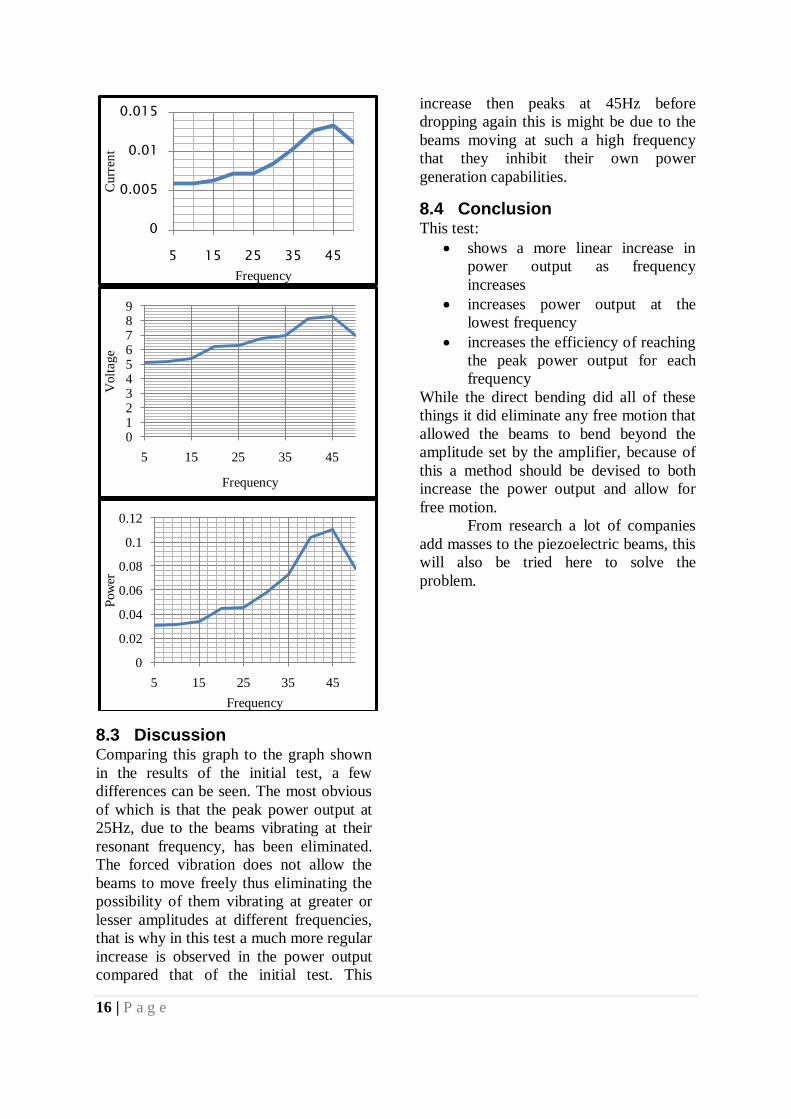
8.3 Discussion Comparing this graph to the graph shown
in the results of the initial test, a few
differences can be seen. The most obvious
of which is that the peak power output at
25Hz, due to the beams vibrating at their
resonant frequency, has been eliminated.
The forced vibration does not allow the
beams to move freely thus eliminating the
possibility of them vibrating at greater or
lesser amplitudes at different frequencies,
that is why in this test a much more regular
increase is observed in the power output
compared that of the initial test. This
increase then peaks at 45Hz before
dropping again this is might be due to the
beams moving at such a high frequency
that they inhibit their own power
generation capabilities.
8.4 Conclusion This test:
shows a more linear increase in
power output as frequency
increases
increases power output at the
lowest frequency
increases the efficiency of reaching
the peak power output for each
frequency
While the direct bending did all of these
things it did eliminate any free motion that
allowed the beams to bend beyond the
amplitude set by the amplifier, because of
this a method should be devised to both
increase the power output and allow for
free motion.
From research a lot of companies
add masses to the piezoelectric beams, this
will also be tried here to solve the
problem.
0
0.005
0.01
0.015
5 15 25 35 45
Curr
ent
Frequency
0123456789
5 15 25 35 45
Volt
age
Frequency
0
0.02
0.04
0.06
0.08
0.1
0.12
5 15 25 35 45
Pow
er
Frequency

17 | P a g e
9 Mass loading In this experiment three 5 gram masses
where loaded on the end of the beams.
These masses will provide added force
during vibration making the beams bend
more than they normally would when
subjected to a vibrating source.
9.1 Method and expectations The experimental setup for this test is the
same as the previous tests, before the
direct bending experiment. The generator
is secured to the top of the mechanical
shaker which is again connected to the
frequency generator, amplifier and
measuring equipment. From this
experimental setup the results should show
an increase in power for each frequency
especially at lower frequencies. There is
also the possibility that at higher
frequencies the beams move so fast that
the masses barely move in relation.
9.2 Results Again a full set of results is shown in the
appendix section of this report.
9.3 Discussion Before discussing the results there was an
observations made during the testing. You
may have seen that the frequency doesn’t
go higher that 35Hz during this test, this is
because during the test the beams were
observed to bend a great distance. There
was a chance that the beams could have
broken with further testing so the test was
finished prematurely.
This being the case looking the
results shows a definite downward trend
towards the end of the graph, so even if the
test had carried on with increasing
0
0.01
0.02
0.03
0.04
10 15 20 25 30 35
Current
Frequency
0
2
4
6
8
10
12
0 10 20 30 40
Volt
age
Frequency
0
0.05
0.1
0.15
0.2
0.25
0.3
0.35
10 20 30
Pow
er
Frequency

18 | P a g e
frequencies there may not have been any
further increase in power output.
The graphs show that the power for
each frequency is increased over the
original design tested at the same
amplitudes which satisfies the aim of his
test, but can further power be produced
from using this generator by modifying it
another way.
During the literature review I came
across a 1 page paper that displayed the
advantages of wiring the generator in
parallel over wiring it in series. It stated
that when wired in parallel their generator
produced 4 times the power it did when
wired in series. If the same could be done
with this generator it could be possible to
push the maximum power output of the
unit over 1W.
9.4 Conclusion The addition of masses has increased the
power output at each frequency
dramatically by forcing the beams to
deflect greater distances while being tested
at the same amplitude level. Now to see if
more power can be created another way
the circuit will be rewired from series to
parallel to test a claim from a report
covered in the literature review which
stated that the power output would
increase again.
10 Parallel Rewiring
10.1 Generators Old state
The picture in the next column shows the
generator as it appeared before the changes
with clips around the beams allowing for
all connections to be made across the top
for ease of access. Each beam is connected
positive to negative.
10.2 Generators New state
In these images the positive connections
are blue and the negative is red, also in the
first diagram the connections between
beams are black. The second diagram
shows the new state of the generator with
the all the positive connections joined and
all the negative connections joined.
In series when a beam deflects the energy
produced has to travel through the
remaining beams in the circuit, and as
piezoelectric materials are governed by
both direct and converse piezoelectric laws
any energy input could be used to bend the
next beam in the series. As all the beams
are joined to the same generator they are
all subjected to the same bending force so
any energy input won’t affect bending too
much but there still could be losses in the
beam itself, so connecting the beams in
parallel allows for all the energy from each
beam to be collected with only losses in
the connecting wires to take into account.
19 | P a g e
11 Parallel Testing Like stated in the previous section the aim
of this experiment is to determine whether
the theory that states that wiring the
generator in parallel will increase the
power output dramatically over the same
generator wired in series.
11.1 Method and expectations This test is set up identical to the initial
test, the only difference being the
generator has been rewired. The generator
will be tested without masses to see the
original increase in power output before
further testing.
11.2 Problems encountered and Results
During testing of the design a serious
problem occurred, during initial testing the
substrate within two of the three beams
cracked meaning that any results obtained
could not be comparable with any past
results. For all intensive purposes the
generator at this point is considered
damaged and unusable.
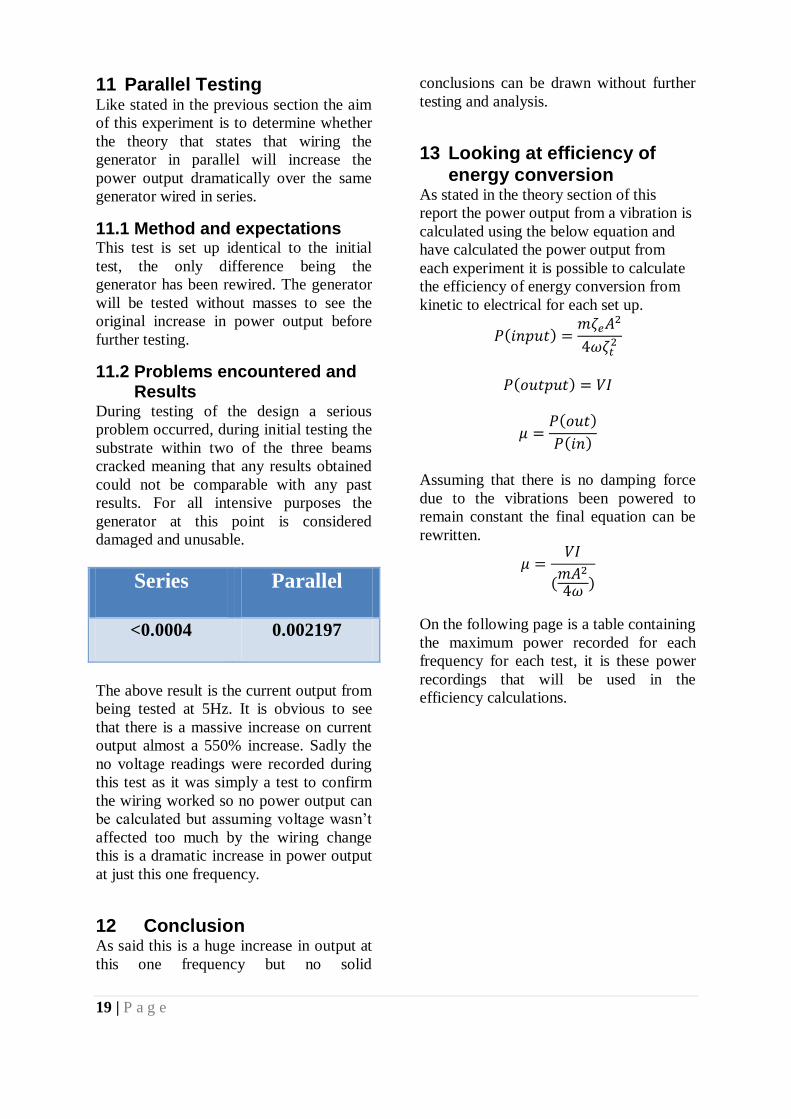
Series Parallel
<0.0004 0.002197
The above result is the current output from
being tested at 5Hz. It is obvious to see
that there is a massive increase on current
output almost a 550% increase. Sadly the
no voltage readings were recorded during
this test as it was simply a test to confirm
the wiring worked so no power output can
be calculated but assuming voltage wasn’t
affected too much by the wiring change
this is a dramatic increase in power output
at just this one frequency.
12 Conclusion As said this is a huge increase in output at
this one frequency but no solid
conclusions can be drawn without further
testing and analysis.
13 Looking at efficiency of
energy conversion As stated in the theory section of this
report the power output from a vibration is
calculated using the below equation and
have calculated the power output from
each experiment it is possible to calculate
the efficiency of energy conversion from
kinetic to electrical for each set up.
Assuming that there is no damping force
due to the vibrations been powered to
remain constant the final equation can be
rewritten.
On the following page is a table containing
the maximum power recorded for each
frequency for each test, it is these power
recordings that will be used in the
efficiency calculations.

20 | P a g e
The next table shows the final result of using the equation and calculating the efficiency of
the tests.
Efficiency %
Initial Square Direct Masses Parallel
0.005819 0.006817 5.070862 0.365268
0.00291 0.009144 2.576996 3.657671
0.048769 0.002161 1.884255 16.84745
0.015794 0.011222 1.8704 8.936355
0.139657 0.008645 1.529572 8.246386
0.030481 0.014409 1.607159 0.526483
0.019001 0.010094 1.733831 0.380018
0.010599 0.010391 2.140569
0.014224 0.010714 2.032039
0.012968 0.007814 1.296811
From this table it can be clearly seen that the mass loading gives the highest overall
efficiency reaching a maximum of 16.8% but if you look closely there is a dramatic increase
in efficiency from the initial design in series to the new design in parallel. This could mean
that if the new design was to be tested with masses an even greater efficiency could possibly
be the resultant.
Power Out
Frequency Power In Initial Square Direct Masses Parallel
5 0.601476 3.50E-05 4.10E-05 0.0305
0.002197
10 1.202951 3.50E-05 1.10E-04 0.031 0.044
15 1.804427 8.80E-04 3.90E-05 0.034 0.304
20 2.405903 3.80E-04 2.70E-04 0.045 0.215
25 3.007378 4.20E-03 2.60E-04 0.046 0.248
30 3.608854 1.10E-03 5.20E-04 0.058 0.019
35 4.210329 8.00E-04 4.25E-04 0.073 0.016
40 4.811805 5.10E-04 5.00E-04 0.103
45 5.413281 7.70E-04 5.80E-04 0.11
50 6.014756 7.80E-04 4.70E-04 0.078

21 | P a g e
14 Conclusion The aim of this project was to further develop a micro power generator by modifying a
current macro scale generator to better its electrical output and increase it to the point where
it could be at a useful level for electronics and also analyse the power conversion efficiency.
Through general improvements and minor additions to the design the power output has
improved somewhat from its original state. Initially the generator failed to output any power
at frequencies below 10Hz. Now, with testing, it is apparent that if the generator was
implemented in a situation which allowed the vibration force to be applied directly to the
beams a power output can be seen. If the force cannot be applied directly to the beams then
the addition of masses will increase the efficiency of the generator.
Also it is apparent from the results that if the generator where to be wired in parallel over the
original state series the power would increase even more at lower frequencies and make it
even more efficient.
Although all these improvements have been made the main problem with piezoelectric
materials is that power generation is never constant. Even under vibration at the same
frequency the power output is always fluctuating, that is why I believe that the best
application currently for these materials is to charge batteries rather than being a direct power
source for any electronic device that has to be on longer than a few seconds.
Also as the highest power output recorded in all the tests was only 0.25W I believe a more
efficient form of piezoelectric material needs to be developed so that it may be applied to
technology today or it could be applied to future low power electronics.
15 Future Work If a chance was provided to continue working on this project the generator would need to be
fixed. There are more recent piezoelectric materials been made all the time and the beams
used for these tests where at least 2 years old before this report was started, if a newer
material was selected and tested I would expect to see an increase in power output.
The testing of the parallel circuitry should be repeated with the new materials and also with
mass loadings.
Also smaller beams should be tested. It is apparent from reading relevant material that
piezoelectric materials become more efficient the smaller they are, this should be tested and
applied to the generator is true.

22 | P a g e
16 Acknowledgements
I would like to thank Dr. R. Fu, Professor B. Richards and Mohammad Ghaleeh for all their
support and help in this project, without which I could not have understood this project fully
or set up successful experiments.
17 References
A J Fleming, S. O. R. M. "Adaptive Piezoelectric Shunt Damping."
Garnett E. Simmers Jr, H. A. S. "Increasing Electrical Power Generation for a Piezoelectric
Power Harvester." Center for Intelligent Materials Systems and Structures, Virginia Tech.
Henry Sodano, E. A. M., Gyuhae Park, Daniel J. Inman "Electric Power Generation using
Piezoelecric Devices." Virginia Polytechnic Institute and State Univeristy.
Inman, H. A. S. a. D. J. (2004). "A Review of Power Harvesting from Vibration using
Piezoelectric Materials." The Shock and Vibration Digest 36(3): 197-205.
J.Inman, H. A. S. a. D. (2005). "Comparison of Piezoelectic Energy Harvesting Devices for
Recharging Batteries." Journal of Intelligent Material Systems and Structures 16(10): 799-
807.
Starner, T. "Human Powered Wearable Computing." Massachussetts Institute of Technology.

23 | P a g e
Appendix
18 Contents
19 Morgan Electro Ceramics Catalogue Information ........................................................ 24
20 Results ........................................................................................................................ 26
20.1 Testing of Original Design .................................................................................... 26
20.2 Sine/Square wave comparison ............................................................................... 28
20.3 Direct Bending ...................................................................................................... 34
20.4 Mass Loading ....................................................................................................... 39
20.5 Parallel Wiring ...................................................................................................... 42

24 | P a g e
19 Morgan Electro Ceramics Catalogue Information
HIGH POWER “HARD” MATERIALS
High power or “hard” ceramics can withstand high levels of electrical excitation and
mechanical stress. These materials are suited for high voltage or high power generators and
transducers.
PZT400 SERIES (NAVY TYPE I)
This material is ideally suited for ultrasonic cleaning, sonar, and other high power acoustic
radiation applications. PZT400 Series is a Lead Zirconate Titanate material capable of
producing large mechanical drive amplitudes while maintaining low mechanical and
dielectric losses. In addition, it can be used under both constant and repetitive conditions. See
page 30 for more specific material properties.
PZT800 SERIES (NAVY TYPE III)
This material is used in high power applications; even though its piezoelectric activity level is
slightly lower than PZT400 Series. With an extremely low loss factor, PZT800 Series has the
ultimate power handling capability. See page 32 for more specific material properties.
HIGH SENSITIVITY “SOFT” MATERIALS
High sensitivity or “soft” ceramics feature high sensitivity and permittivity, but under high
drive conditions are susceptible to self-heating beyond their operating temperature range.
These materials are used in various sensors, low-power motor type transducers, receivers, and
low-power generators.
PZT5A SERIES (NAVY TYPE II)
This material is used as the receiver or generator element in hydrophones, accelerometers,
and vibration sensors. PZT5A Series is a Lead Zirconate Titanate with a high sensitivity,
permittivity, and time stability. See page 31 for more specific material properties.
PZT5J1 (NAVY TYPE V)
This material is used in fuses, hydrophones, and other applications that require a combination
of high energy and high voltage output. PZT5J1 is a Lead Zirconate Titanate with a high
permittivity and a high piezoelectric voltage constant. See page 33 for more specific material
properties.
PZT5H SERIES (NAVY TYPE VI)
This material is used in sensitive receivers and applications requiring fine movement control.
It has been used in a wide range of applications from hydrophones to ink jet printers. PZT5H
Series provides extremely high permittivity, coupling, and piezoelectric constant. It has the
lowest Curie temperature of the “soft” materials (or PZT500 Series family), which restricts its
operating temperature range. It has lower time stability. See page 33 for more specific
material properties.
CUSTOM MATERIALS
Morgan Electro Ceramics manufacture a number of materials that do not fall within the
Department of Defence (DOD) standards that are often used to define PZT materials.
PZT501 – PZT506 (SOFT)
These materials are all “soft” and fall between DOD Categories II and V. They range in Curie
temperatures from 270°C to 350°C. All the materials have similar dielectric constants, but
have been optimised for charge constants or coupling coefficients for specific applications.

25 | P a g e
PZT502 is used as an alternative to PZT5A Series when higher sensitivity is required.
PZT502 has high acoustic sensitivity, and high coupling, while maintaining a high
permittivity. See page 34 for more specific material properties.
PZT507 (SOFT)
This material is an improved PZT5H Series, developed specifically for bimorph applications.
See page 34 for more specific material properties.
PZT601 (HARD)
This material was designed for transducer applications requiring reduced dielectric constant,
high Qm, low dielectric losses and improved electromechanical coupling coefficients. See
page 35 for more specific material properties.
PZT508 (SOFT)
This material has been developed to surpass the electrical performance of PZT5H Series
materials while improving the temperatures characteristics by raising the Curie temperature
to 220°C. See page 34 for more specific material properties.
PZT5K SERIES (SOFT)
This material outperforms PZT5H Series and PZT508 while at the expense of Curie
temperature. This material has very high “d” coefficients and permittivity.
See page 36 for more specific material properties.
PZT700 SERIES (SOFT)
These materials have been developed for a number of property optimisations. The materials
have a combination of property stability, good sensitivity and have found use in a variety of
sensor applications. See page 35 for more specific material properties.
PZT407 (HARD)
This material was developed for its specific combination of permittivity, loss and “d”
coefficient. The material in many aspects is similar to materials PZT400 Series, but falls
outside the Navy I classification. See page 35 for more specific material properties.
PT1
This material is a Lead Titanate. Unlike PZT it has low radial mode coupling coefficients,
which therefore provides excellent hydrostatic properties and has the highest (figure of merit)
for any Morgan Electro Ceramic materials. See page 35 for more specific material properties.
PMN-PT28/30
This new single crystal piezoelectric material has been designed for use in transducer and
actuator devices. It has been formulated to exhibit very large electromechanical coupling
coefficients and also offers high dielectric constants and low dielectric losses.

26 | P a g e
20 Results
20.1 Testing of Original Design
0
0.0002
0.0004
0.0006
0.0008
0.001
0.0012
0.0014
0 0.5 1 1.5 2 2.5 3
Cu
rren
t (a
mp
s)
Time (secs)
5-10Hz5
0
0.001
0.002
0.003
0.004
0.005
0.006
0.007
0.008
0.009
0.01
0 0.2 0.4 0.6 0.8 1 1.2 1.4
Cu
rren
t (a
mp
s)
Time (secs)
15-20Hz1

27 | P a g e
0
0.002
0.004
0.006
0.008
0.01
0.012
0.014
0 0.2 0.4 0.6 0.8 1 1.2 1.4 1.6 1.8 2
Cu
rren
t (a
mp
s)
Time (secs)
25-30Hz2…3…
0
0.0005
0.001
0.0015
0.002
0.0025
0.003
0.0035
0 0.05 0.1 0.15 0.2 0.25 0.3 0.35
Cu
rren
t (a
mp
s)
Time (secs)
35-40Hz34

28 | P a g e
20.2 Sine/Square wave comparison
0
0.0005
0.001
0.0015
0.002
0.0025
0.003
0.0035
0 0.05 0.1 0.15 0.2 0.25 0.3 0.35
Cu
rren
t (a
mp
s)
Time (secs)
45-50Hz4…
0
0.0005
0.001
0.0015
0.002
0.0025
0 0.05 0.1 0.15 0.2 0.25 0.3 0.35
Cu
rren
t (a
mp
s)
Time (secs)
5HzSquare 5Hz
Sine 5Hz

29 | P a g e
0
0.0005
0.001
0.0015
0.002
0.0025
0 0.05 0.1 0.15 0.2 0.25 0.3 0.35
Cu
rren
t (a
mp
s)
Time (secs)
10HzSine 10Hz Square 10Hz
0
0.001
0.002
0.003
0.004
0.005
0.006
0.007
0.008
0.009
0 0.05 0.1 0.15 0.2 0.25 0.3 0.35
Cu
rren
t (a
mp
s)
Time (secs)
15HzSine 15Hz
Square 15Hz

30 | P a g e
0
0.0002
0.0004
0.0006
0.0008
0.001
0.0012
0.0014
0.0016
0.0018
0.002
0 0.05 0.1 0.15 0.2 0.25 0.3 0.35
Cu
uren
t (a
mp
s)
Time (secs)
20HzSine 20Hz
Square 20Hz
0
0.002
0.004
0.006
0.008
0.01
0.012
0.014
0 0.05 0.1 0.15 0.2 0.25 0.3 0.35
Cu
rren
t (a
mp
s)
Time (secs)
25HzSine 25Hz
Square 25Hz

31 | P a g e
0
0.0005
0.001
0.0015
0.002
0.0025
0.003
0.0035
0.004
0.0045
0 0.05 0.1 0.15 0.2 0.25 0.3 0.35
Cu
rren
t (a
mp
s)
Time (secs)
30HzSine 30Hz
Sqaure 30Hz
0
0.0005
0.001
0.0015
0.002
0.0025
0.003
0.0035
0 0.05 0.1 0.15 0.2 0.25 0.3 0.35
Cu
rren
t (a
mp
s)
Time (secs)
35HzSine 35Hz
Square 35Hz

32 | P a g e
0
0.0005
0.001
0.0015
0.002
0.0025
0 0.05 0.1 0.15 0.2 0.25 0.3 0.35
Cu
rren
t (a
mp
s)
Time (secs)
40HzSine 40Hz
Square 40Hz
0
0.0005
0.001
0.0015
0.002
0.0025
0.003
0.0035
0 0.05 0.1 0.15 0.2 0.25 0.3 0.35
Cu
rren
t (a
mp
s)
Time (secs)
45HzSine 45Hz
Square 45Hz

33 | P a g e
0
0.0005
0.001
0.0015
0.002
0.0025
0.003
0.0035
0 0.05 0.1 0.15 0.2 0.25 0.3 0.35
Cu
rren
t (a
mp
s)
Time (secs)
50HzSine 50Hz
Square 50Hz

34 | P a g e
20.3 Direct Bending
-0.006
-0.004
-0.002
0
0.002
0.004
0.006
0.008
2 2.5 3 3.5 4 4.5 5 5.5 6
5
-0.006
-0.004
-0.002
0
0.002
0.004
0.006
0.008
2 2.5 3 3.5 4 4.5 5
10

35 | P a g e
-0.006
-0.004
-0.002
0
0.002
0.004
0.006
0.008
2 2.2 2.4 2.6 2.8 3 3.2 3.4 3.6 3.8 4
15
-0.006
-0.004
-0.002
0
0.002
0.004
0.006
0.008
0.01
2 2.1 2.2 2.3 2.4 2.5 2.6 2.7 2.8 2.9 3
20

36 | P a g e
-0.008
-0.006
-0.004
-0.002
0
0.002
0.004
0.006
0.008
0.01
2 2.1 2.2 2.3 2.4 2.5 2.6 2.7 2.8 2.9 3
25
-0.01
-0.008
-0.006
-0.004
-0.002
0
0.002
0.004
0.006
0.008
0.01
2 2.2 2.4 2.6 2.8 3 3.2 3.4 3.6 3.8 4
30

37 | P a g e
-0.015
-0.01
-0.005
0
0.005
0.01
0.015
2 2.2 2.4 2.6 2.8 3 3.2 3.4 3.6 3.8 4
35
-0.015
-0.01
-0.005
0
0.005
0.01
0.015
3 3.1 3.2 3.3 3.4 3.5 3.6 3.7 3.8 3.9 4
40
38 | P a g e
-0.015
-0.01
-0.005
0
0.005
0.01
0.015
3 3.2 3.4 3.6 3.8 4
45
-0.015
-0.01
-0.005
0
0.005
0.01
0.015
3 3.1 3.2 3.3 3.4 3.5 3.6 3.7 3.8 3.9 4
50

39 | P a g e
20.4 Mass Loading
0.02004
-0.025
-0.02
-0.015
-0.01
-0.005
0
0.005
0.01
0.015
0.02
0.025
0 0.1 0.2 0.3 0.4 0.5 0.6
10
0.029866
-0.04
-0.03
-0.02
-0.01
0
0.01
0.02
0.03
0.04
0 0.1 0.2 0.3 0.4 0.5 0.6 0.7
15

40 | P a g e
0.024571
-0.03
-0.02
-0.01
0
0.01
0.02
0.03
0 0.1 0.2 0.3 0.4 0.5 0.6 0.7
20
0.027199
-0.05
-0.04
-0.03
-0.02
-0.01
0
0.01
0.02
0.03
0.04
0 0.1 0.2 0.3 0.4 0.5 0.6 0.7
25

41 | P a g e
0.004785
-0.008
-0.006
-0.004
-0.002
0
0.002
0.004
0.006
0 0.1 0.2 0.3 0.4 0.5 0.6 0.7
30
0.004342
-0.004
-0.003
-0.002
-0.001
0
0.001
0.002
0.003
0.004
0.005
0.006
0 1 2 3 4 5 6
35

42 | P a g e
20.5 Parallel Wiring
0.002197
-0.0025
-0.002
-0.0015
-0.001
-0.0005
0
0.0005
0.001
0.0015
0.002
0.0025
0 0.5 1 1.5 2 2.5 3 3.5 4
Parallel

43 | P a g e