Dr Chris Ellis - gpcme.co.nz Sun 0920 Ellis... · Dr Chris Ellis Cardiologist Green Lane CVS...
58
Dr Chris Ellis Consultant Cardiologist Auckland
Transcript of Dr Chris Ellis - gpcme.co.nz Sun 0920 Ellis... · Dr Chris Ellis Cardiologist Green Lane CVS...
Dr Chris Ellis Consultant Cardiologist
Auckland
CVD Risk Prevention in NZ
2013 & Beyond:
The Clinicians View
Dr Chris Ellis
Cardiologist
Green Lane CVS Service,
Cardiology Department,
Auckland City Hospital
& Auckland Heart Group, Mercy Hospital, Auckland

Cause of NZ Deaths
CVS Disease 40%
Cancer 30%
‘Other’ Cause 30%
CVS Disease: Is it a Major Problem in New Zealand?

Chris’s Talk (Summarised)
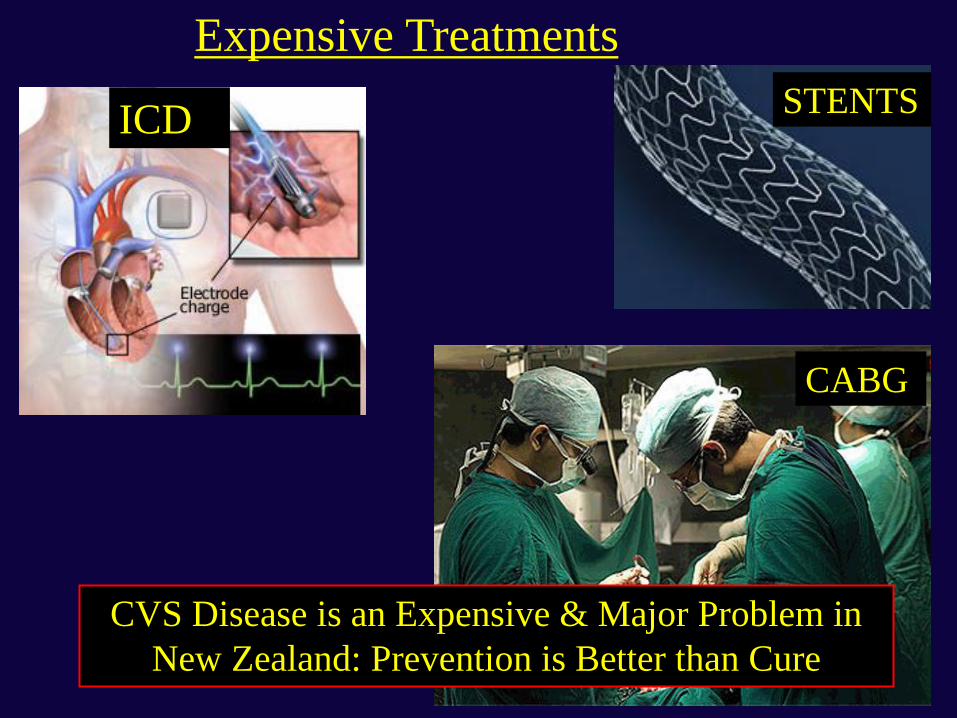
Expensive Treatments
STENTS
CABG
ICD
CVS Disease is an Expensive & Major Problem in
New Zealand: Prevention is Better than Cure
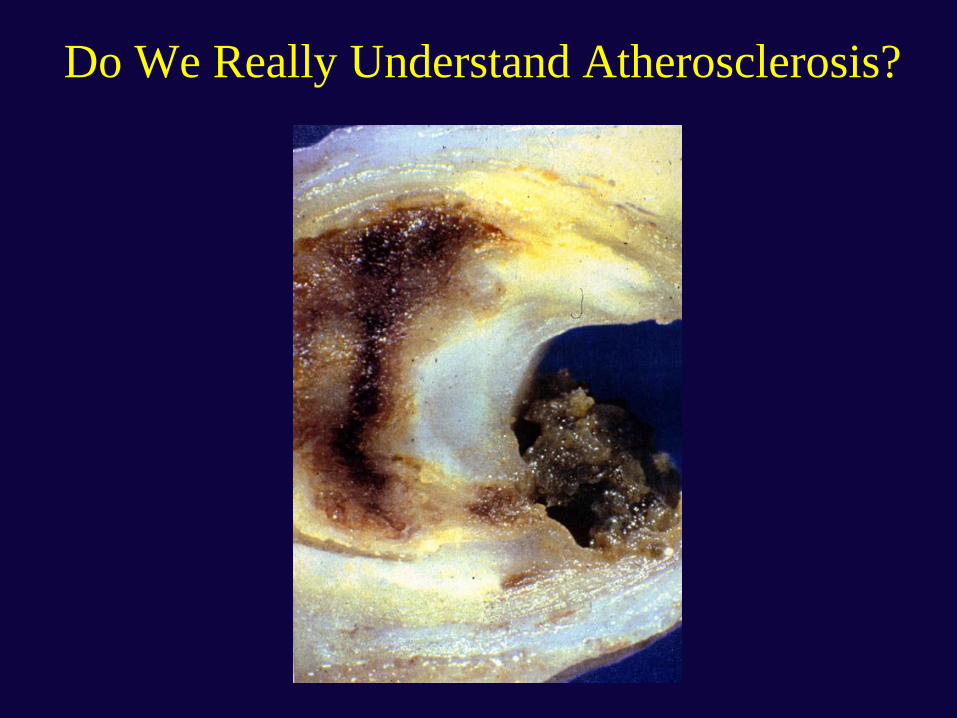
Do We Really Understand Atherosclerosis?

Atherosclerosis is a Highly Complex Ageing of the Arteries
Atherosclerosis is Poorly understood: but is
driven by lifestyle and genetic factors
Lifestyle Genetic

Atherosclerosis: A Complex Ageing/Disease Process
How Do We Assess CVS Risk in New Zealand?

Framingham-Based Risk Tables

Framingham-Based CVS Risk Tables:
Risk Factors Used in NZ
• Age (decades)
• Gender
• Diabetes Status (Y/N)
• Hypertension
• Smoker (Y/N)
• Total Cholesterol/HDL
Ratio

Family history of premature CHD or ischaemic stroke: • In a first-degree male relative before the age of 55 years or • In a first-degree female relative before the age of 65 years
Maori
Pacific peoples or people from the Indian subcontinent
People with both diabetes and microalbuminuria
People who have had type 2 diabetes mellitus: • For more than 10 years or • Who have an HbA1c consistently greater than 8%
(People with the metabolic syndrome) GONE 2009
IF Total Cholesterol > 8 then risk > 15%
if Total Cholesterol/ HDL > 8 then risk> 15%
if BP consistently > 170/100 then risk > 15%
Additional 5% CVS Risk Factors (2003/2009 NZ Guidelines)
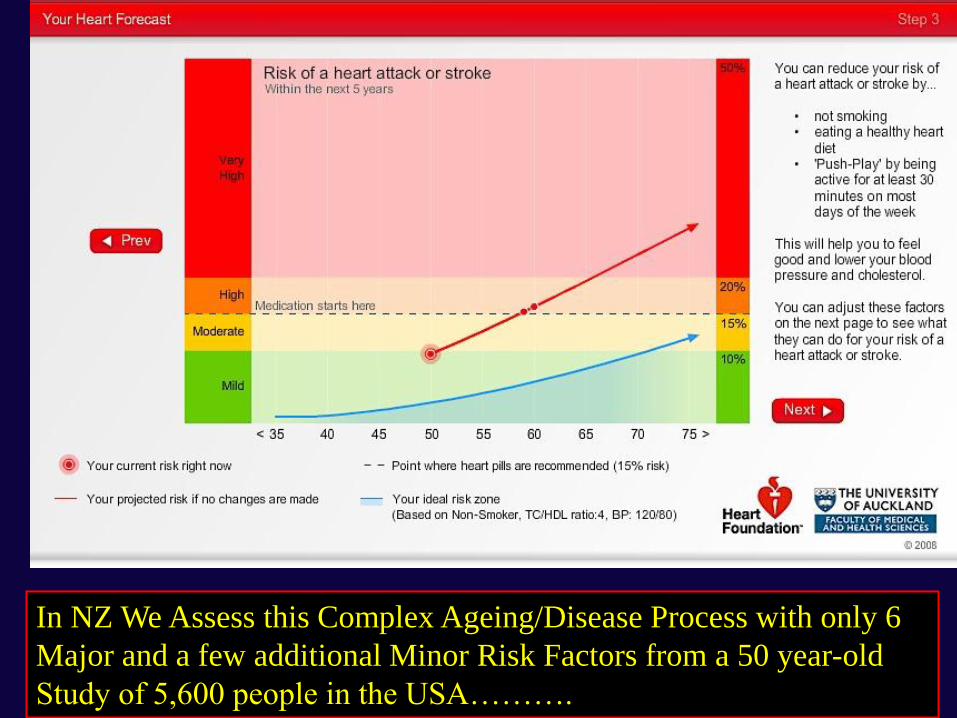
In NZ We Assess this Complex Ageing/Disease Process with only 6
Major and a few additional Minor Risk Factors from a 50 year-old
Study of 5,600 people in the USA……….

“Your current risk right now”……….[Really?!]

Can the USA Framingham Tables Really Predict CVS
Risk: in Acute Coronary Syndrome Patients in NZ?
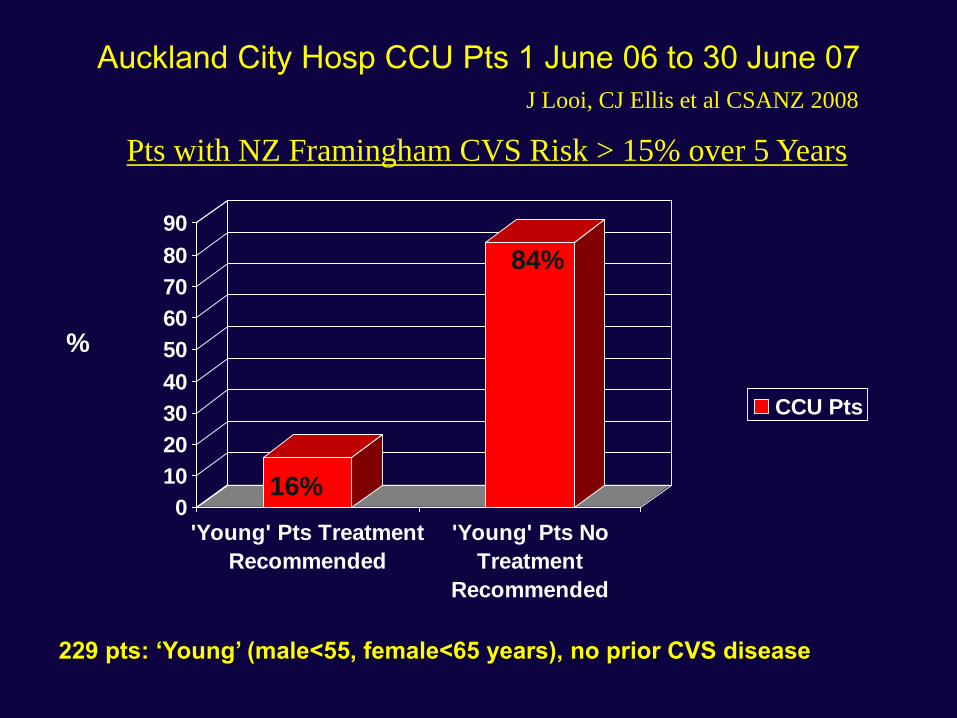
Auckland City Hosp CCU Pts 1 June 06 to 30 June 07
0
10
20
30
40
50
60
70
80
90
'Young' Pts Treatment
Recommended
'Young' Pts No
Treatment
Recommended
CCU Pts
229 pts: ‘Young’ (male<55, female<65 years), no prior CVS disease
%
16%
84%
Pts with NZ Framingham CVS Risk > 15% over 5 Years
J Looi, CJ Ellis et al CSANZ 2008
%
Pa
tie
nts
History of MI FRS > 15% FRS < 15%0
20
40
60
80
Treatment Recomended No Treatment
Recomended
15%20%
65%
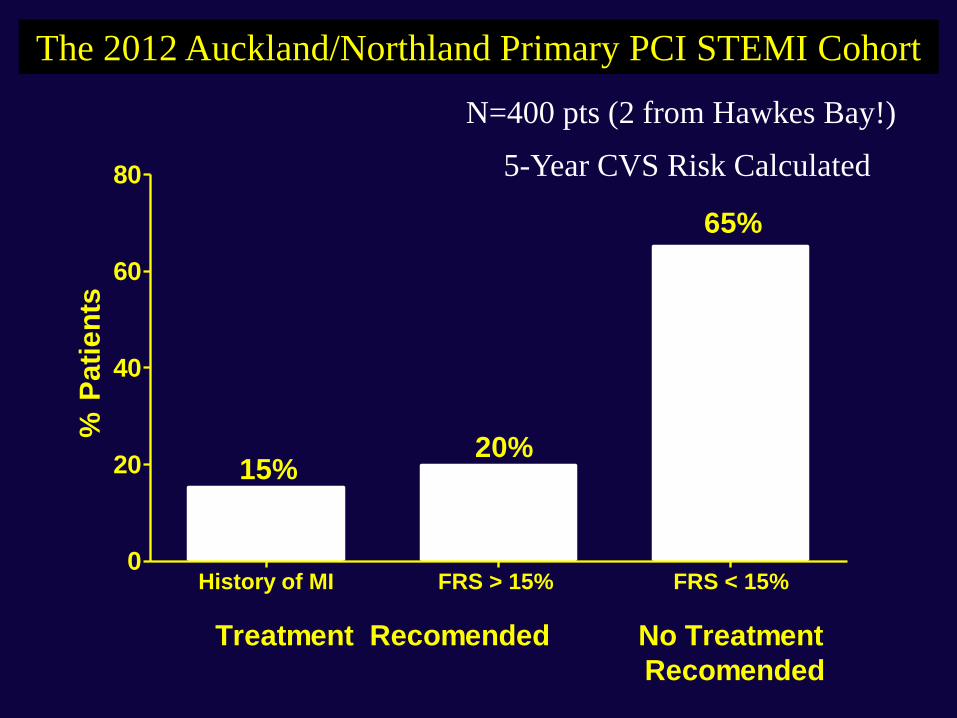
The 2012 Auckland/Northland Primary PCI STEMI Cohort
N=400 pts (2 from Hawkes Bay!)
5-Year CVS Risk Calculated
The NZ Framingham Guideline Tables
Cannot Predict CVS Risk in Acute
Coronary Syndrome Patients in NZ
We will soon have the ‘PREDICT’
New Zealand Data, so we won’t need
to use Framingham Tables
[Unfortunately Wrong]
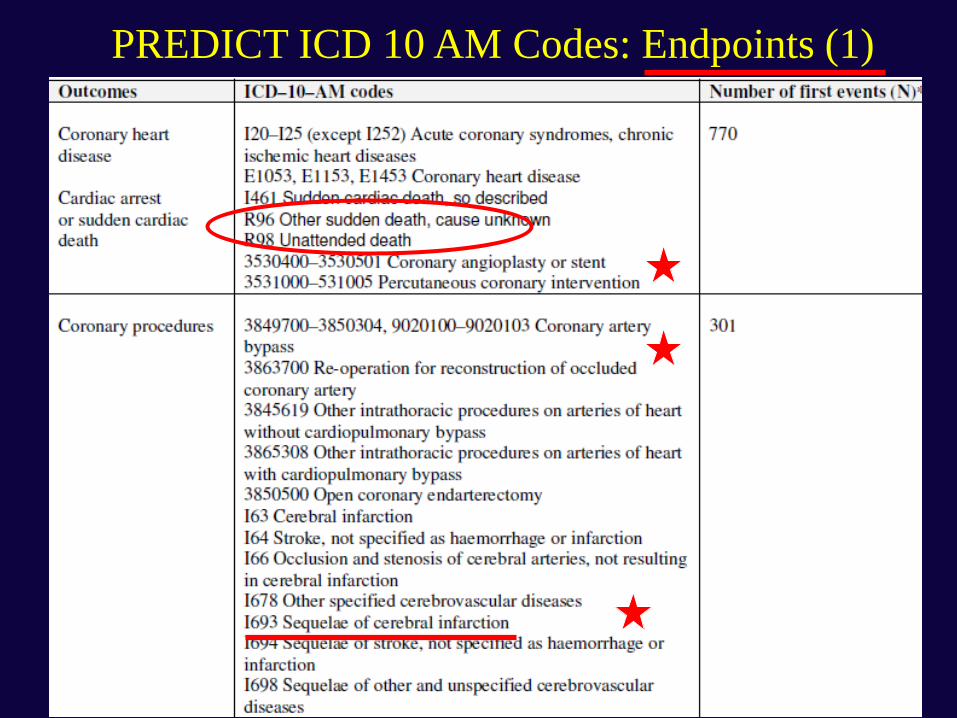
PREDICT ICD 10 AM Codes: Endpoints (1)
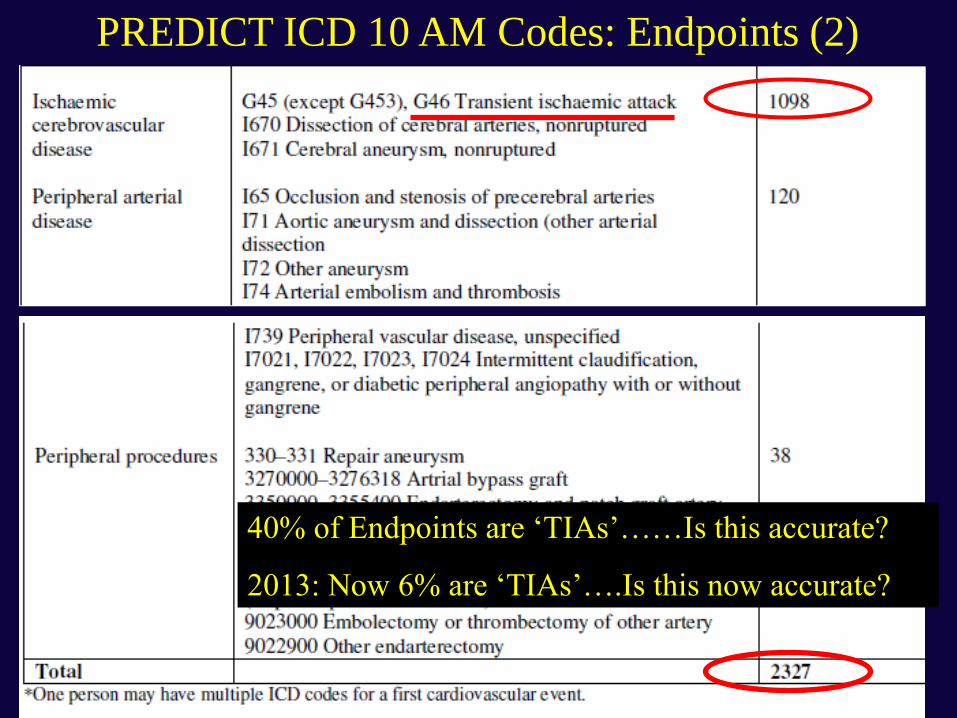
PREDICT ICD 10 AM Codes: Endpoints (2)
40% of Endpoints are ‘TIAs’……Is this accurate?
2013: Now 6% are ‘TIAs’….Is this now accurate?

Some Problems with PREDICT 10 Comparison Study:
“Framingham vs. New Zealand Data” (1)
• Framingham data collected by careful FU with Research Nurse [expensive study]
– Probably fairly accurate endpoints
– (although never fully published)
• PREDICT cohort is based on public hospital admissions linked to deaths & readmissions [cheap study]
– House surgeon & coder dependent
– Endpoint accuracy uncertain

Some Problems with PREDICT 10 Comparison Study:
“Framingham vs. New Zealand Data” (2)
• Other Inaccuracies:
– Which of the ‘eligible’ patients were enrolled
– How many? Which type: low risk/ high risk?
– Silent MI, UAP, TIAs (in community): not recorded
– Private hospital admissions: not recorded
• PCIs/CABGs: not recorded
• MIs/ UAP/PVD: not recorded
• Heart failure admissions etc.: not recorded
• Effect of Pt Treatment on baseline & endpoints
• Social Deprivation not collected

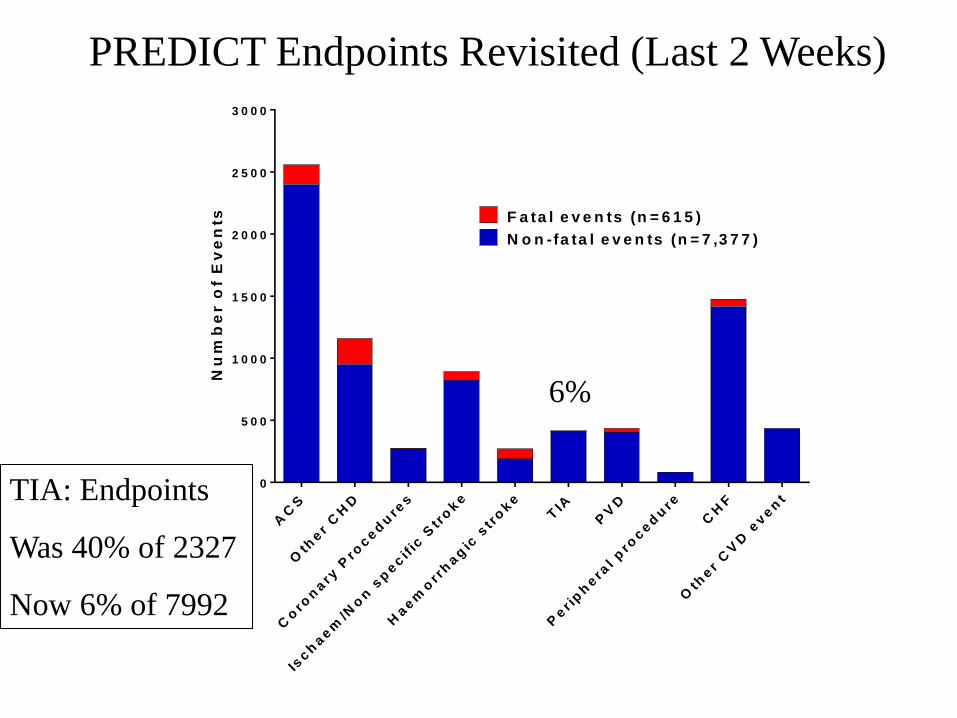
PREDICT ICD 10 AM Codes: Endpoints (3)
Gold Standard?
Nu
mb
er o
f E
ve
nts
AC
S
Oth
er
CH
D
Co
ron
ary
Pro
ced
ure
s
Isch
aem
/No
n s
pecif
ic S
tro
ke
Haem
orr
hag
ic s
tro
ke
TIA
PV
D
Per i
ph
era
l p
roced
ure
CH
F
Oth
er
CV
D e
ven
t0
5 0 0
1 0 0 0
1 5 0 0
2 0 0 0
2 5 0 0
3 0 0 0
N o n -fa ta l e v e n ts (n = 7 ,3 7 7 )
F a ta l e v e n ts (n = 6 1 5 )
6%
PREDICT Endpoints Revisited (Last 2 Weeks)
TIA: Endpoints
Was 40% of 2327
Now 6% of 7992
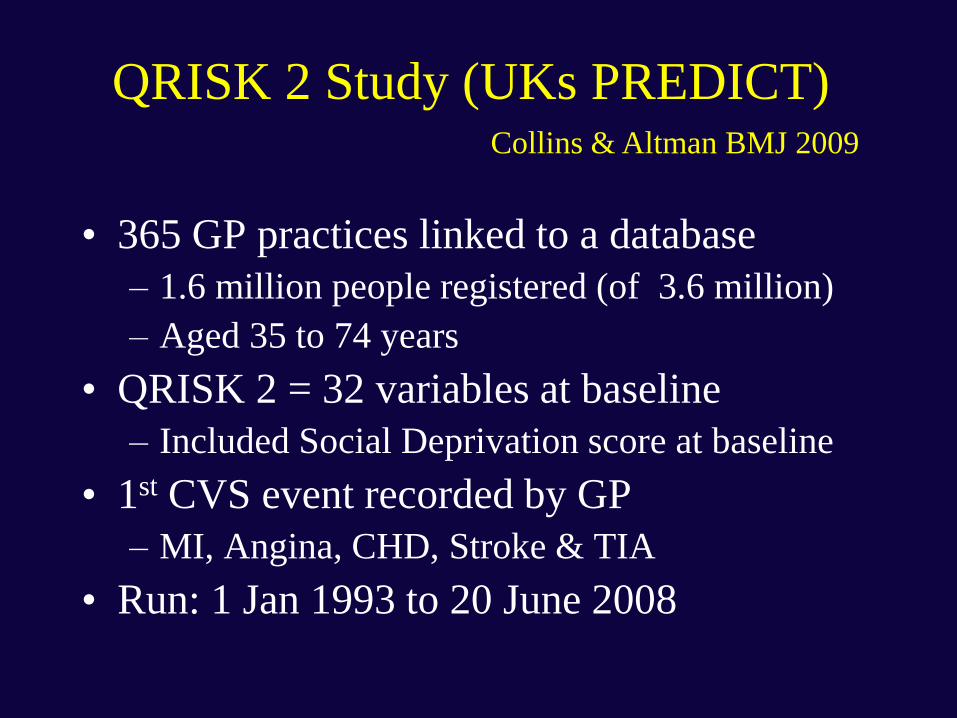
QRISK 2 Study (UKs PREDICT)
• 365 GP practices linked to a database
– 1.6 million people registered (of 3.6 million)
– Aged 35 to 74 years
• QRISK 2 = 32 variables at baseline
– Included Social Deprivation score at baseline
• 1st CVS event recorded by GP
– MI, Angina, CHD, Stroke & TIA
• Run: 1 Jan 1993 to 20 June 2008
Collins & Altman BMJ 2009
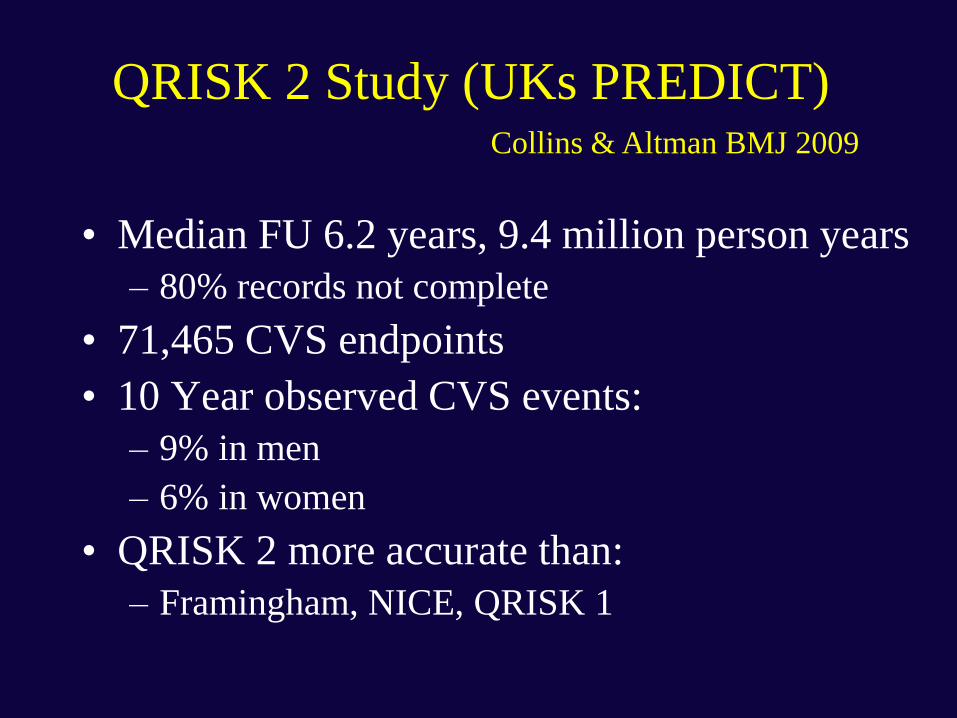
QRISK 2 Study (UKs PREDICT)
• Median FU 6.2 years, 9.4 million person years
– 80% records not complete
• 71,465 CVS endpoints
• 10 Year observed CVS events:
– 9% in men
– 6% in women
• QRISK 2 more accurate than:
– Framingham, NICE, QRISK 1
Collins & Altman BMJ 2009

QRISK 2 UK CVS Prediction BMJ 2009
Gold Standard?
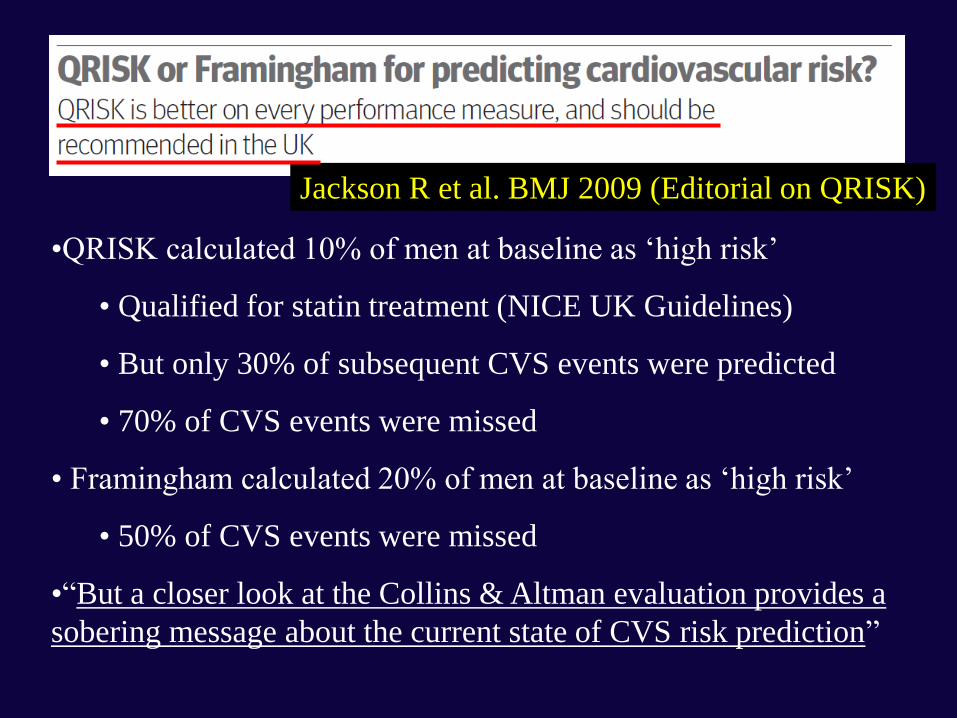
•QRISK calculated 10% of men at baseline as ‘high risk’
• Qualified for statin treatment (NICE UK Guidelines)
• But only 30% of subsequent CVS events were predicted
• 70% of CVS events were missed
• Framingham calculated 20% of men at baseline as ‘high risk’
• 50% of CVS events were missed
•“But a closer look at the Collins & Altman evaluation provides a
sobering message about the current state of CVS risk prediction”
Jackson R et al. BMJ 2009 (Editorial on QRISK)

Jackson R et al. BMJ 2009 (Editorial on QRISK)
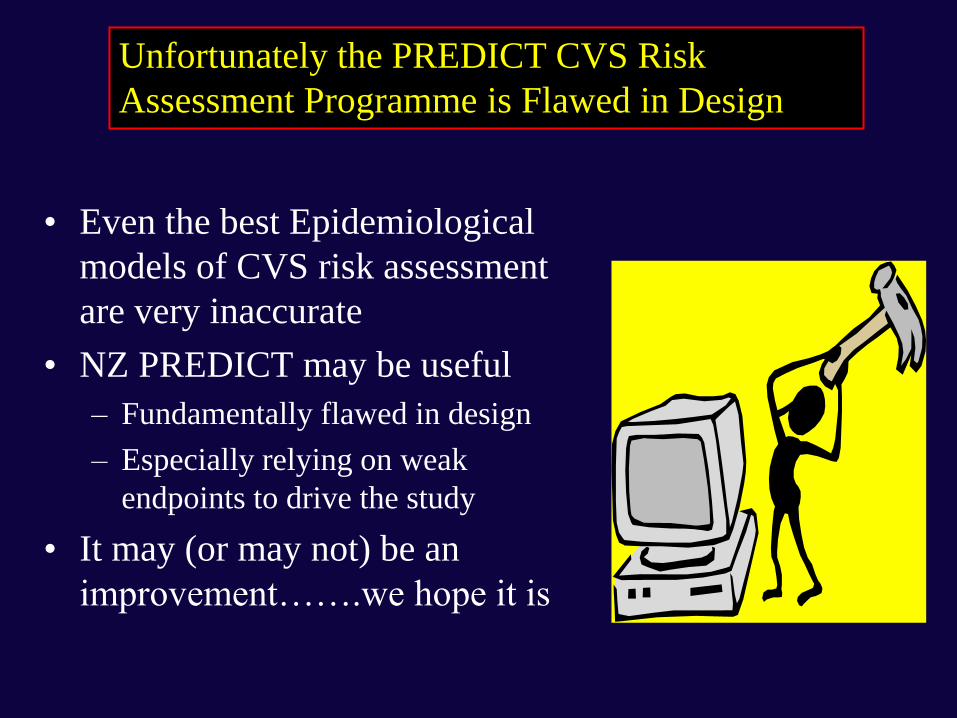
• Even the best Epidemiological
models of CVS risk assessment
are very inaccurate
• NZ PREDICT may be useful
– Fundamentally flawed in design
– Especially relying on weak
endpoints to drive the study
• It may (or may not) be an
improvement…….we hope it is
Unfortunately the PREDICT CVS Risk
Assessment Programme is Flawed in Design

Background: Are We Surprised that
Epidemiological Studies Struggle to Accurately
Detect CVS Risk for Individuals in New Zealand?

Illogical Process?
In Other Areas of Medicine, we ‘Look for Disease’
• Breast Cancer: Mammogram
• Colon Cancer: Colonoscopy
BUT
• Coronary Artery Disease: ‘Coloured Charts’ or Equations of Risk Factors?
What happens if we ‘Look for Disease’ in Coronary Artery Disease?
• Calcium Scoring

Calcified Coronary Arteries
• Intuitive for CVS Risk
– Look for disease
– Concept used elsewhere
• Calcified Atherosclerosis
– The ‘End Product’ of all CVS risk factors [known or unknown]
• The extent of coronary atherosclerosis:
– The strongest predictor of CVS events
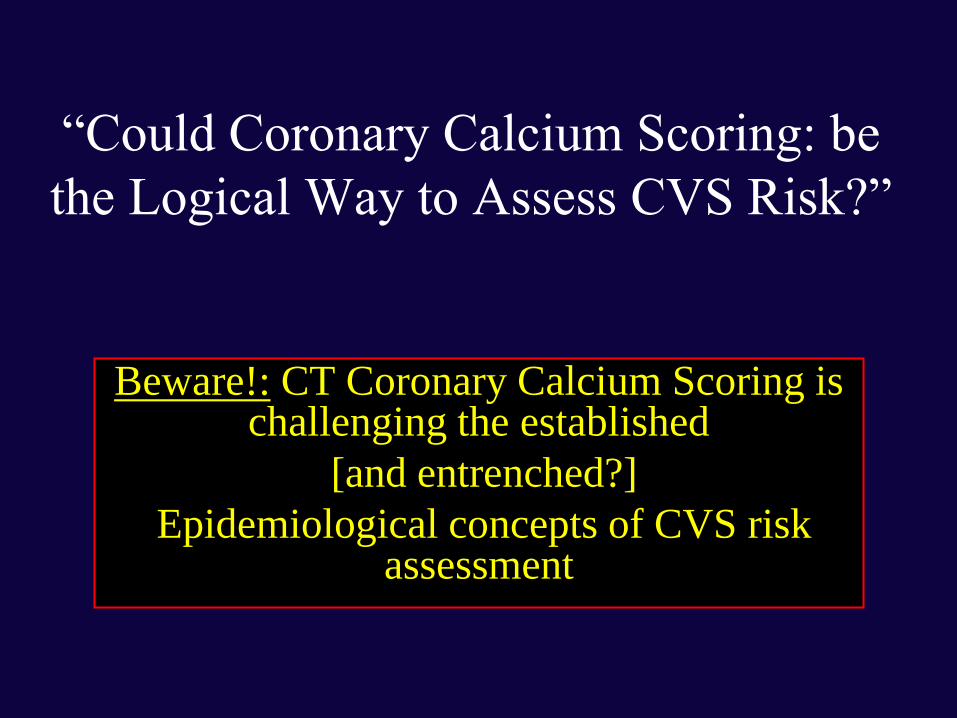
“Could Coronary Calcium Scoring: be
the Logical Way to Assess CVS Risk?”
Beware!: CT Coronary Calcium Scoring is challenging the established
[and entrenched?]
Epidemiological concepts of CVS risk assessment

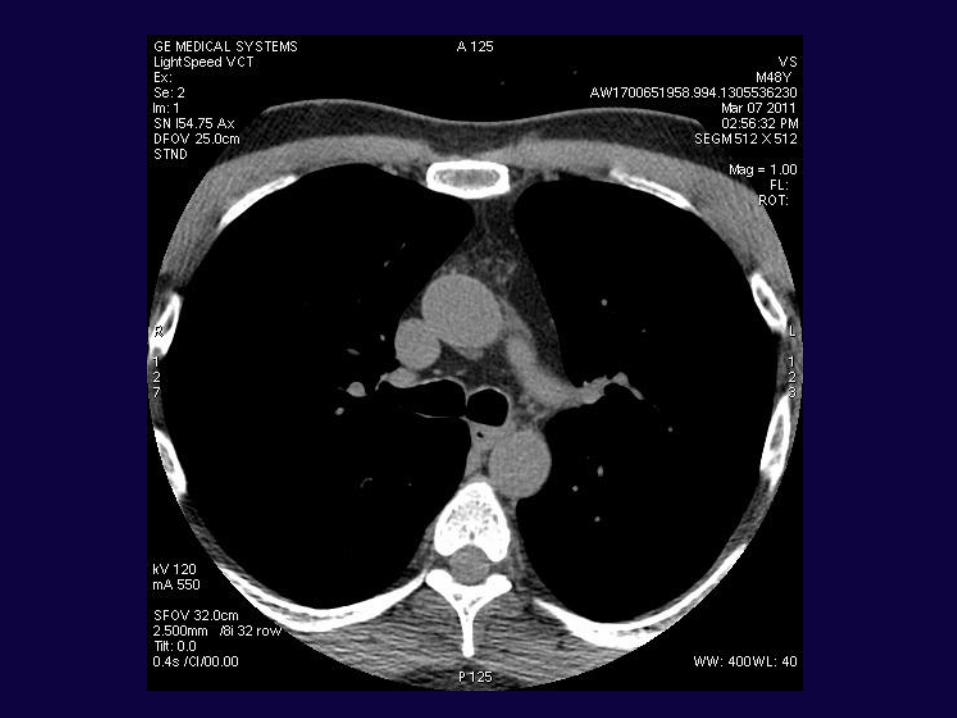
Coronary Artery Scanning
u SEVERECALCIFICATION
What is a CT Calcium Score Test?
•X-Ray ‘slices’ of the heart
•3mm Intervals
•About 50 cardiac slices per scan
•Computer-assisted algorithm
•Score relates to volume and density of
calcium in the coronary arteries
•“Agatston” Units
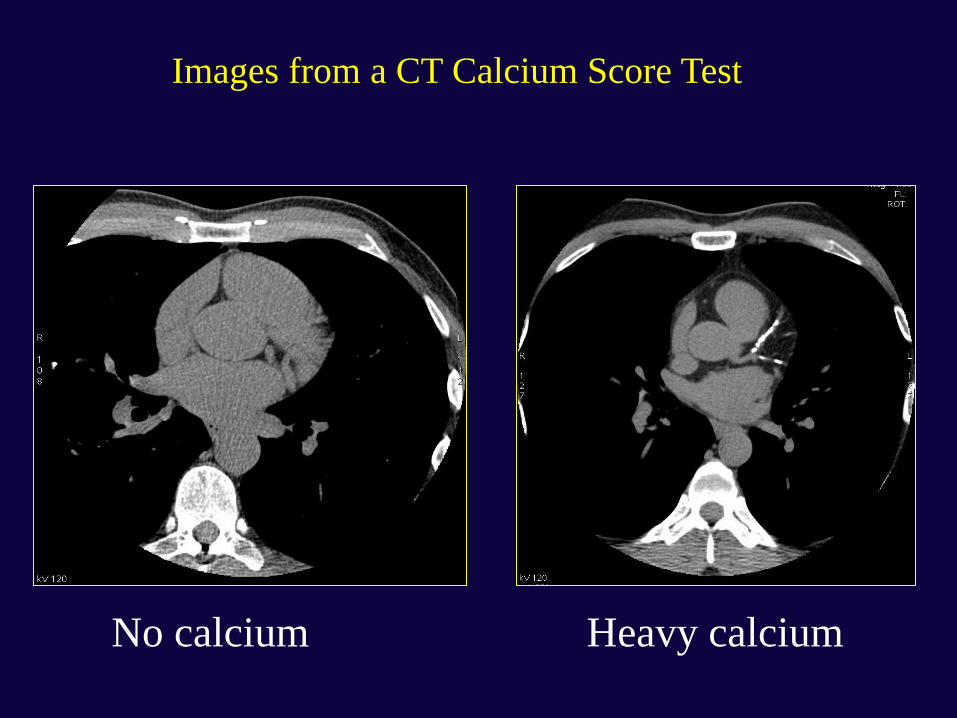
No calcium Heavy calcium
Images from a CT Calcium Score Test


Coronary Ca Score: Males
0
1000
2000
25th 50th 75th 90th 100th
Ca S
core (
Agats
ton
)
Percentile
>74
70-74
60-64
65-69
55-59
50-54
45-49
40-44
<40
Top 10%
Top 25%
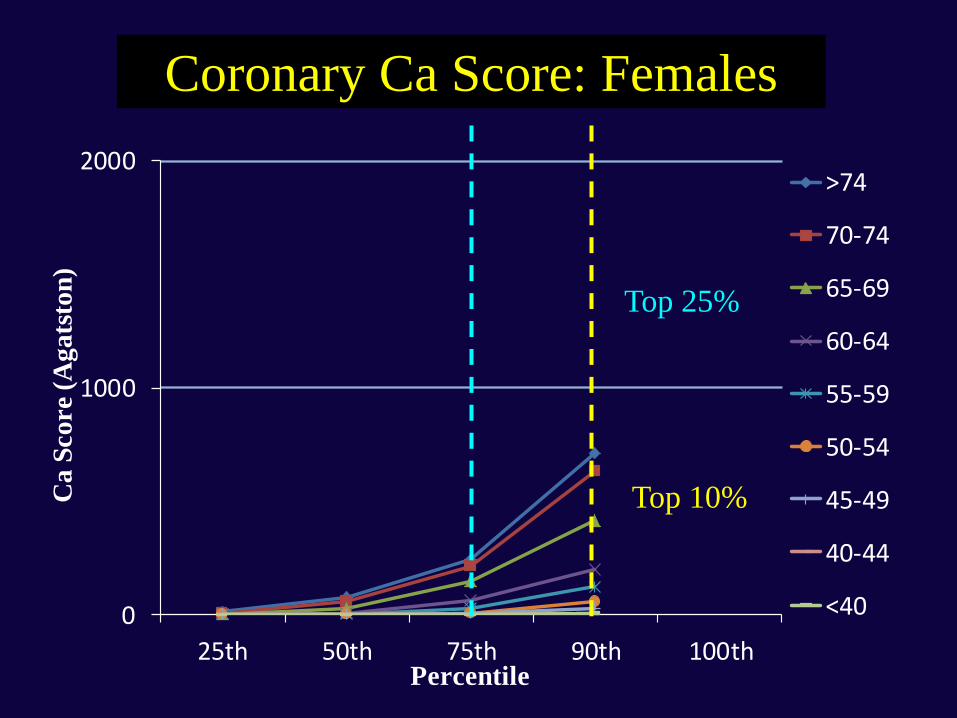
Coronary Ca Score: Females
0
1000
2000
25th 50th 75th 90th 100th
Ca
Sco
re (
Ag
ats
ton
)
Percentile
>74
70-74
65-69
60-64
55-59
50-54
45-49
40-44
<40
Top 10%
Top 25%
Coronary Artery Scanning
u SEVERECALCIFICATION
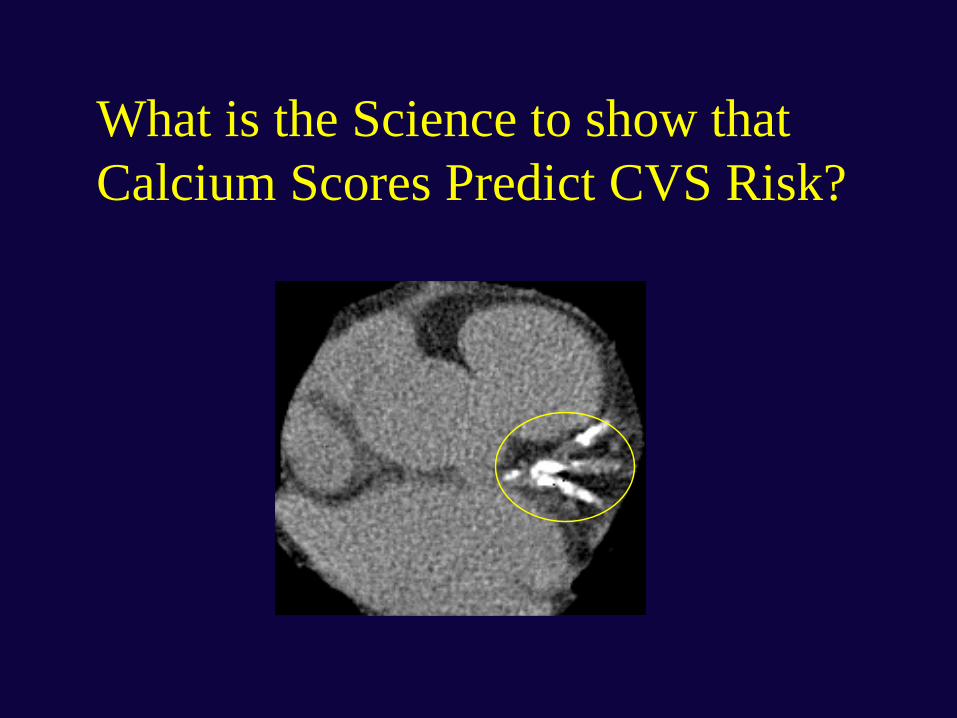
What is the Science to show that
Calcium Scores Predict CVS Risk?

St Francis Heart Study [of 4,613 Asymptomatic People] Arad et al. JACC 2005;46: 158-65, 166-72.
A Coronary Calcium Score of > 100 Agatston units
• x 10 times increase risk of a CVS events
The Coronary Calcium Score
– Was superior to the Framingham Risk Equation
(Receiver-operator curve 0.79 + 0.03 vs 0.69 + 0.03,
p=0.0006)
– Enhanced stratification of Framingham Risk
categories, low, intermediate, high risk (p<0.0001)

St Francis Heart Study: Coronary Event Rates as a function
of Calcium Score within Framingham Risk Groups
0
0.5
1
1.5
2
2.5
3
3.5
4
Low: < 10 Intermediate:
10-20
High: > 20
1st Tertile
2nd Tertile
3rd Tertile
% per 10 Years (Predicted)
% per year (CVS Events) Arad JACC 2005;46:158-65

Calcium Score & Any Coronary Events:
MESA Study NEJM 2008;358:1336-45
P<0.001


0-10 10-15 15+0
200
400
600
800
1000
1200
1400
1600
1800
2000
0
>0-100
>100-400
Ca Score
>400-1000
> 1000
Framingham CVS 5 Year Risk Estimate %
(Incorporating 2009 NZGG Adjustments)
22% (CI 20-24)of patients predictedto be at low 5 year
CVS risk haveCa scores > 100
}n
First 3600 Consecutive CTAL AHG Patients(123 had a prior history of definite CHD so have
been excluded from this analysis)Results: Agatston Calcium Score by Band of 5-Year CVS Risk
Estimated by the NZ Guidelines Group 2009 ‘Adjusted’
(Anderson) Framingham Equation
N=3477 pts
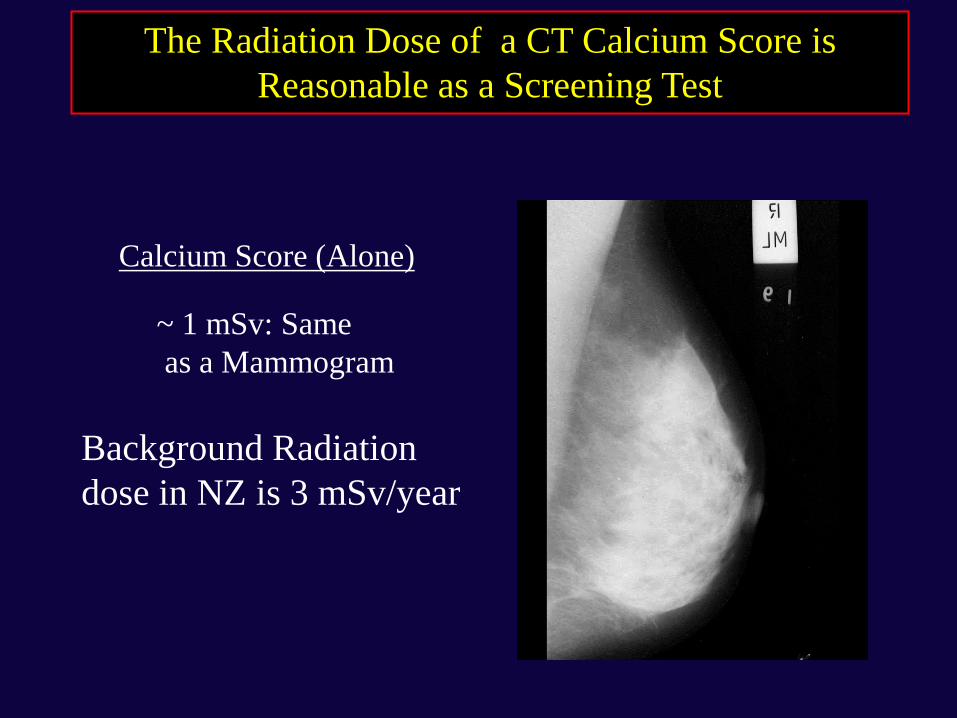
Calcium Score (Alone)
~ 1 mSv: Same
as a Mammogram
The Radiation Dose of a CT Calcium Score is
Reasonable as a Screening Test
Background Radiation
dose in NZ is 3 mSv/year
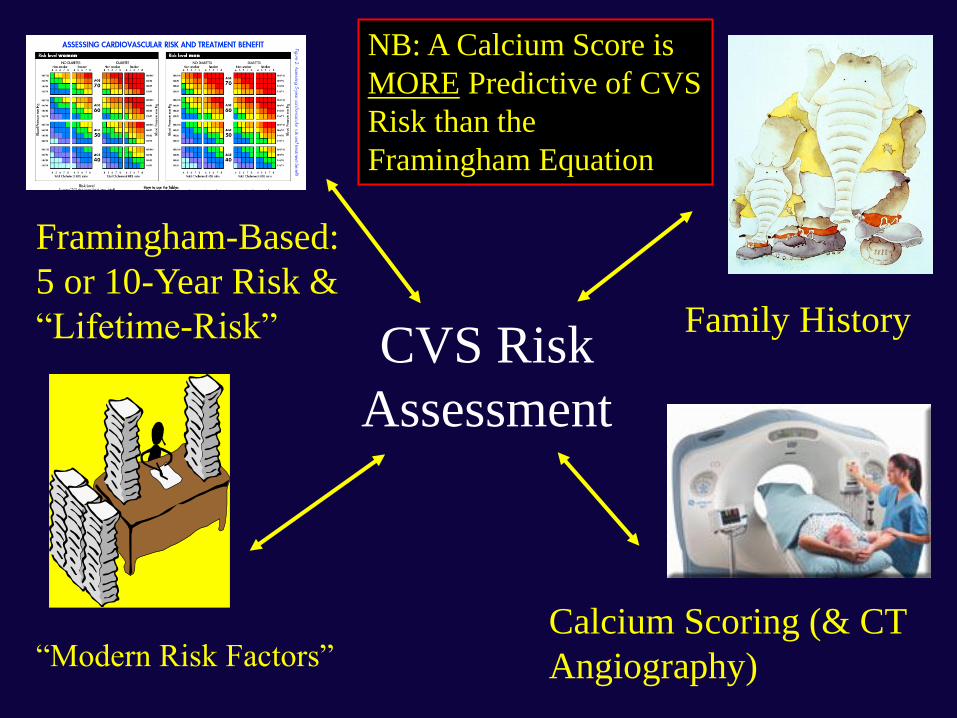
CVS Risk
Assessment
Framingham-Based:
5 or 10-Year Risk &
“Lifetime-Risk” Family History
Calcium Scoring (& CT
Angiography) “Modern Risk Factors”
NB: A Calcium Score is
MORE Predictive of CVS
Risk than the
Framingham Equation

Potential Identification of more High & Low-
Risk Individuals using Calcium Scoring
Estimated 10-
Year AND
Long-Term Risk
High: > 20%
Intermediate:
10% - 20%
Low: < 10%
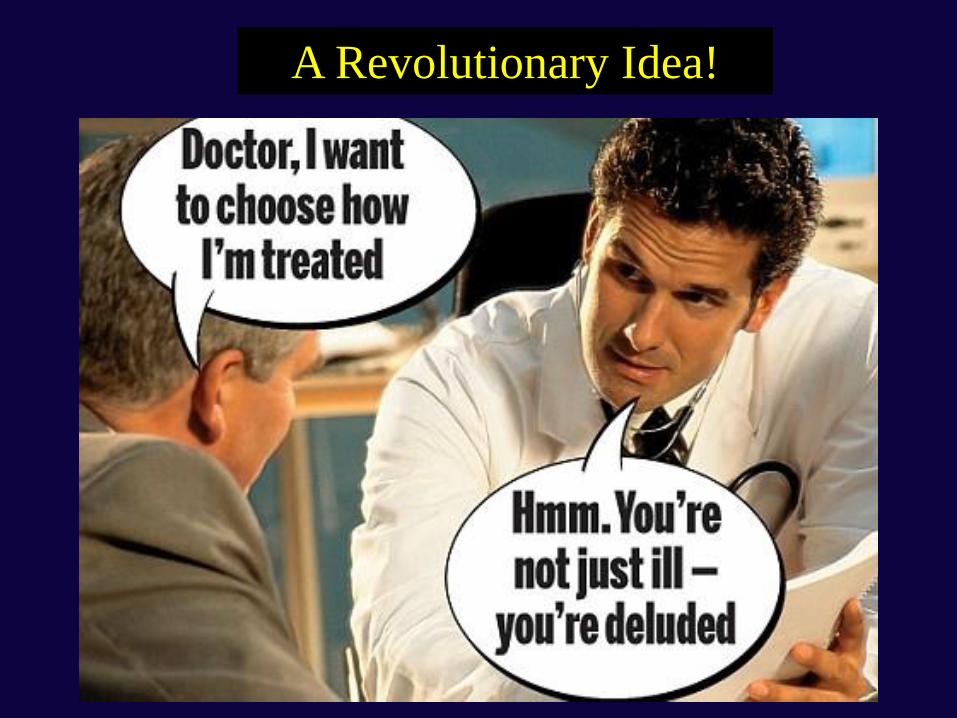
Professor Les Toop (GP): Presented at the NZ
Cardiac Society Annual Meeting
• Focussed on the ‘folly’ of epidemiological
absolute risk
– Highlighted the need to treat more younger pts who
were “train-wrecks waiting to happen”
– Highlighted the need to keep the pt at the centre of
the discussion of treatment & risk
• Revolutionary thinking!
• (Too conservative in treatment views for me!)
CVD Risk Prevention in NZ 2013 & Beyond: The
Clinicians View – Conclusions (1)
• CVS risk assessment is difficult & inaccurate
– Clinicians should use all ‘clues’ available
– Don’t just rely on Epidemiology studies
• The 5-Year risk idea is just ludicrous
– Suggest you consider a pts ‘lifetime’ risk
CVD Risk Prevention in NZ 2013 & Beyond: The
Clinicians View – Conclusions (2)
• Many middle-aged pts would benefit from treatment
– Generic ACE-Inhibitors & Diuretics are cheap & effective
– Generic Statins & Aspirin are cheap & effective
– Strokes & MIs are expensive & disabling for a patient
• Remain a Clinician to your patient
– Maintain your independent thoughts!
– Your patient relies on you to look after them