My research and My favourite student project Alistair Edwards alistair.
Upload
duongxuyenCategory
view
214download
0
Dr Alistair HumphreyMedical Officer of Health
Canterbury District Health Board
Christchurch
16:55 - 17:20 What Do GPs Need to Know About Drinking Water?
Drinking Water:
What GPs need to know
Alistair Humphrey MPH FRACGP FAFPHM
10th August 2017
This presentation
• What is the burden of water borne disease?
• How does NZ reduce the risk from drinking water?
• Algal blooms
• Nitrates
• Microbial contamination and a few outbreaks
• Conclusions

Raw water
Infection Pathway
X% removal
Y% removal
Finished
water
Human disease
Process 1
Process 2
Treatment Plant
Disease reservoir

Monitoring, compliance and the law
Health (Drinking Water) Amendment Act 2007
Ministry of Health, Public Health Units,
Territorial Authorities, Water suppliers
Building Act 2004Resource Management Act 2013
Ministry for the Environment, Regional Councils
Groundwater
2. Treatment
Building inspectors
Source to tap approach
Rivers
1. Drinking Water Source
RMA Tools
Council Officers
NZ Drinking Water Standards,
Ministry of Health
Risk Management Plans
Drinking water assessors
3. Supply
Territorial Authorities
Key health issues wrt water
• Cyanobacteria – toxic blooms
• Elevated nitrates
• Microbiological contaminants

Cyanobacteria toxic bloom
• Cyanobacteria bloom development in
response to reduced river flows,
increasing temperatures, nutrients.
• Diverting water may transfer contaminants
from one water body to another.

Health effects of cyanobacteria
• Microcystins (hepatoxic)
• Anacystin A (neurotoxic)
• Symptoms:
– stomach pains, vomiting, diarrhea, and skin rashes
• Signs:
– Nerve and liver damage after long term exposure
• Dogs die quickly as they chew the algae

Cyanobacteria contd..
• River catchments impacted by
cyanobacterial blooms include:
Selwyn, Ashley, Waiau, Ashburton,
Pareora, Opihi rivers.
• A number of these rivers have
water intakes for community and
private water supplies.
• Nutrient discharge has to be
carefully monitored and managed.
Eg. Land & Water Regional Plan

• What is Blue Baby Syndrome?
• What causes Blue baby syndrome?
• Why are New Zealand babies more at risk now?
• Can Midwives and other LMCs mitigate this risk?• Understanding some basic drinking water science
• Assisting their clients to test their drinking water
• Newborns must avoid nitrates
Nitrates and Blue Baby Syndrome

The physiology of blue baby syndrome
NAD
Haemoglobin2+Methaemoglobin3+
OxidisedReduced Cytochrome b5
Reductase
Nitrates Nitrites
Gut
NADH

Why are babies < 6/12 more susceptible
to methaemoglobinaemia?
• Fetal hemoglobin oxidizes more easily than adult hemoglobin
• The level of NADH reductase is low at birth and increases with age; it reaches adult levels by age 4 months
• Higher gastric pH in infants may facilitate bacterial proliferation, resulting in increased conversion of dietary nitrates to nitrites
• Diarrhoea causes acidosis in infants (due to loss of bicarbonate in stool). Acidosis further impairs immature methaemoglobin reductase
1. Chocolate brown (Methaemoglobinaemia 70%)
2. Chocolate brown (Methaemoglobinaemia 70%)
3. Methaemoglobinaemia 20%
4. Normal blood

Physical Findings of
Methaemoglobinaemia
Methaemoglobin fraction
• 0-3% - Normal range – Normal Baby
• 3-15% - Slight discoloration
(eg, pale, grey, blue) of the skin
• 15-20% - Cyanosis,
though patients may be relatively asymptomatic
• 25-50% - Headache, dyspnoea, light headedness*
and syncope, weakness, confusion, palpitations,
chest pain (symptoms reported by adults)
• 50-70% - Abnormal cardiac rhythms; altered
mental status, delirium, seizures, coma; profound
acidosis
• >70% - Usually, death
Physical signs
• Discoloration of the skin, mucous
membranes, and blood (the most striking
physical finding)
• Cyanosis - This occurs with the presence of
greater than 1.5 g/dL of methaemoglobin
(compared with 5 g/dL of deoxygenated
haemoglobin)
• Pallor of the skin or conjunctiva suggests
anaemia which can mask cyanosis.
• Seizures
• Coma
• Cardiac dysrhythmias
(bradyarrhythmia or ventricular dysrhythmia)
• Acidosis
• Symptoms associated with cardiac and/or
neurologic ischemia
* Associated with nitrite’s conversion to
nitric oxide and its effect on smooth muscle

Breast is Best
• Even when mothers consume water with
high nitrate concentration (100ppm)
nitrate is not excreted in breast milk
• Lactobacillus species (in the guts of
breast-fed infants) do not reduce nitrate to
nitrite
• Beans, carrots, spinach and beets contain
high levels of nitrate – solid foods are not
necessary before six months of age
Greer FR, Shannon M; Infant methemoglobinemia: the role of dietary nitrate in food and water. Pediatrics 2005;116(3):784-6.

Nitrates
• Emerging issue throughout Canterbury in the 2000s
• Trend for increasing nitrate levels in ground water

http://www.parliament.nz/en-nz/parl-support/research-papers/00PLEcoC51261/freshwater-quality-in-new-zealand
The biggest source of nitrogen in New Zealand’s waterways is urine from farm
animals
Parliamentary Commissioner for the Environment
Water quality in New Zealand (2013):
Land use change and nutrient pollution
Declining water quality is attributed to dairy farming:
1. Intensification:
More cows per hectare
2. Expansion:
More hectares for cows
Dr. Jan Wright – Parliamentary Commissioner for the Environment

Dairy intensification
• Irrigation
• Nitrogen fertilisers
• Palm kernel
Orphaned Orang-utan
© CS Ling

…as an aside…
• Palm kernel is expensive -
• More cows does not mean more profit…
• ...but it does mean more nitrate…
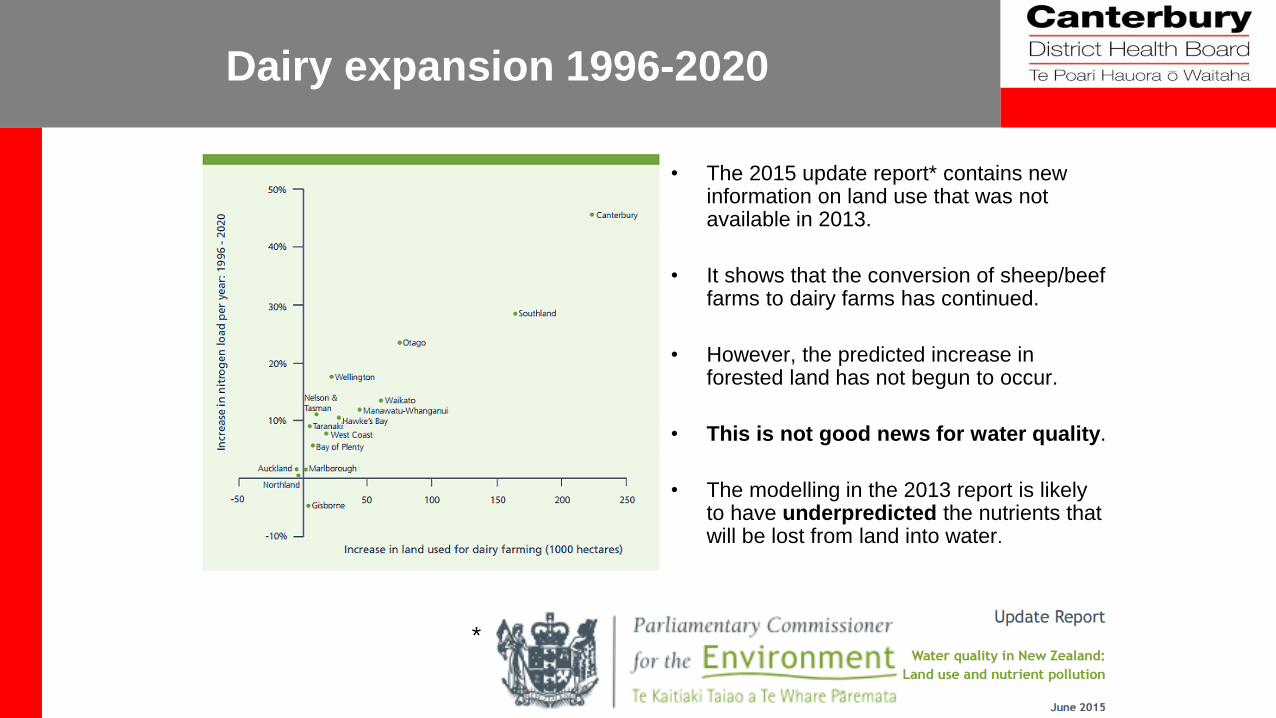
Dairy expansion 1996-2020
• The 2015 update report* contains new information on land use that was not available in 2013.
• It shows that the conversion of sheep/beef farms to dairy farms has continued.
• However, the predicted increase in forested land has not begun to occur.
• This is not good news for water quality.
• The modelling in the 2013 report is likely to have underpredicted the nutrients that will be lost from land into water.
*

‘standard’ mitigation was not enough
to keep nitrogen losses constant,
let alone reduce them

Nitrate-Nitrogen
in the Ealing Hinds area
0
2
4
6
8
10
12
14
16
18
20
1991 1993 1995 1997 1999 2001 2003 2005 2007 2009 2011 2013 2015
Nit
rate
nit
roge
n c
on
cen
trat
ion
(m
g/L
)
K37/0234
K37/0243
K37/0245
K37/0562
K37/2036
MAV
Samples with E. coli also detected:
How are nitrate levels set?
• The Maximum acceptable value (MAV) for nitrate in drinking water was set in the US in the early 1960s based on 214 human cases of methaemoglobinaemia
• The value was based on no observed adverse effect level (NOAEL)
• No margin of error was required under the Risk Assessment Information System (RAIS) as the risks were considered to be well understood so no safety factor was built in.
• This level is set by the World Health Organisation and the New Zealand Drinking Water Standards as 50mg/l nitrate, or 11.3 mg/l nitrate nitrogen
• Consumption of drinking water below this level has resulted in no recorded cases of methaemoglobinaemia
• The US still experiences sporadic cases of methaemoglobinaemia in bottle-fed infants on private bores where the nitrate MAV has been exceeded
• Levels of nitrate in groundwater in New Zealand are increasing, and are now exceeding the MAV in many parts of Canterbury and elsewhere
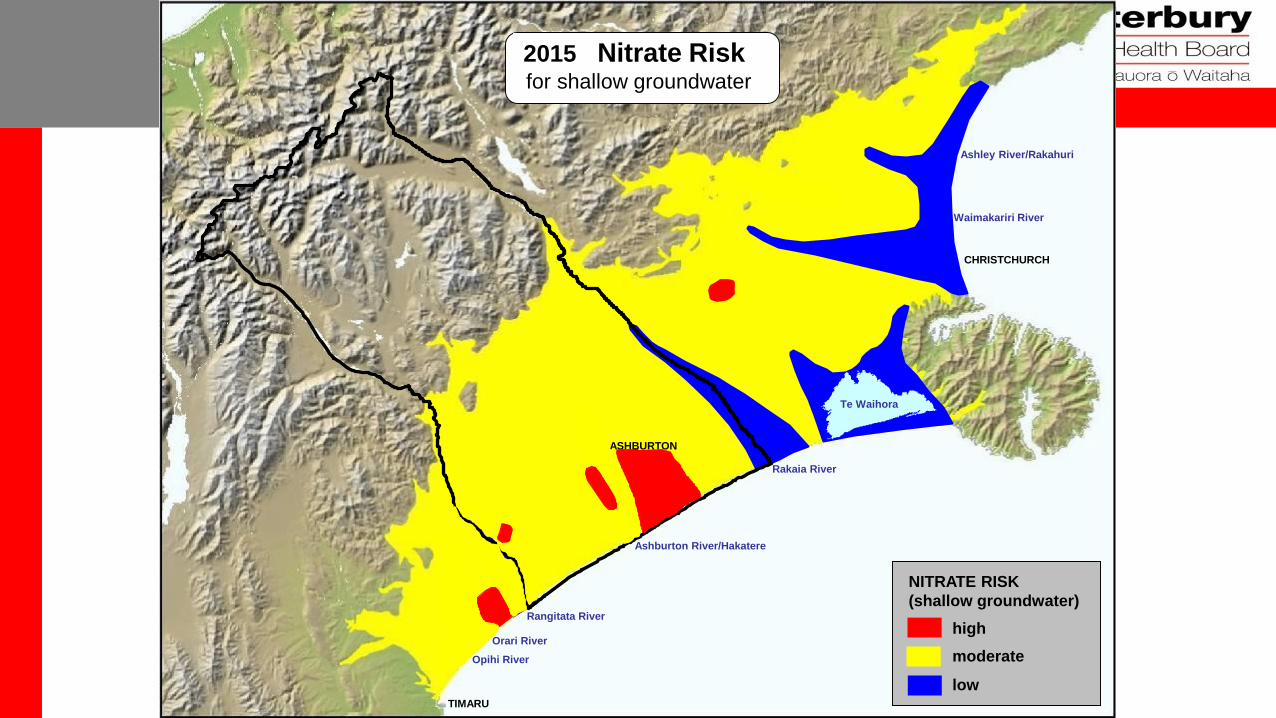
Te Waihora
CHRISTCHURCH
TIMARU
ASHBURTON
Rangitata River
Rakaia River
Ashburton River/Hakatere
Waimakariri River
Ashley River/Rakahuri
Opihi River
Orari River
NITRATE RISK
(shallow groundwater)
high
moderate
low
2011 Nitrate Riskfor shallow groundwater
2015

How is our drinking water protected?
• Monitoring by ECAN and suppliers
• Oversight by Public Health Drinking Water Assessors
(a collaborative approach)
• Legal framework
• New Zealand Drinking water standards
• The system works well for community supplies, but private
supplies tend not to be well monitored
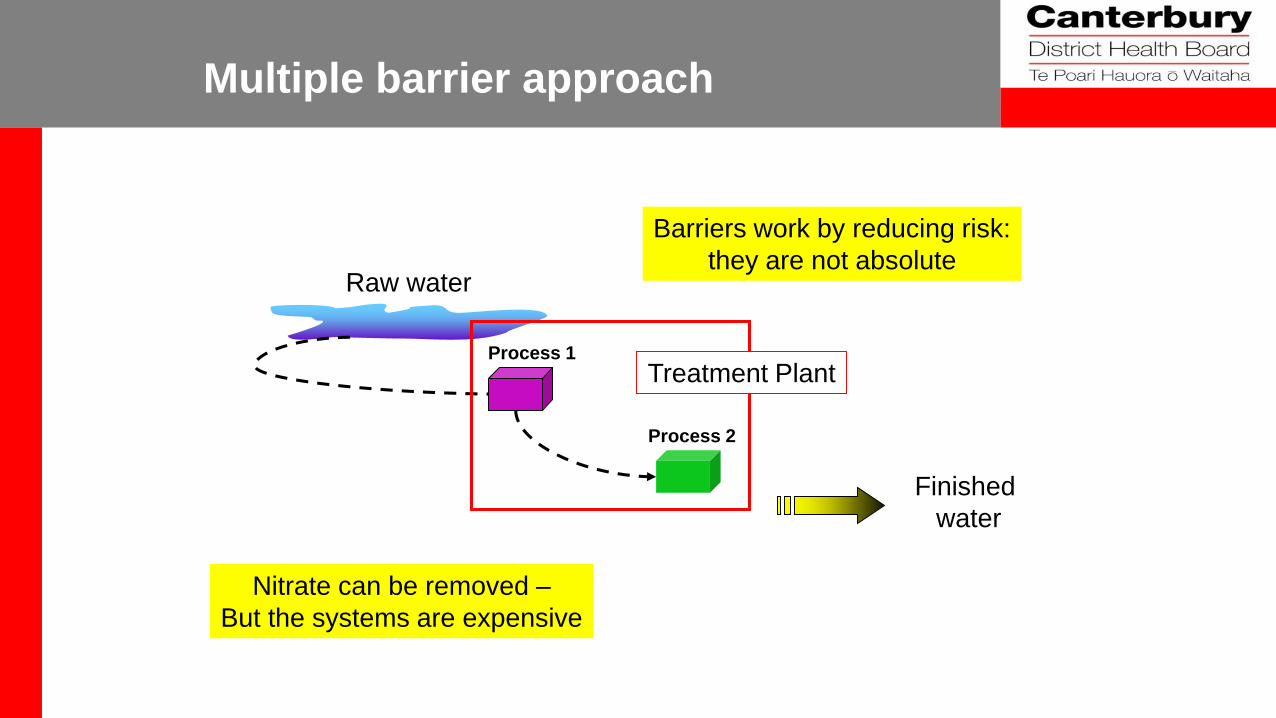
Raw water
Multiple barrier approach
Finished
water
Barriers work by reducing risk:
they are not absolute
Process 1
Process 2
Treatment Plant
Nitrate can be removed –
But the systems are expensive

Canterbury Water
Management Strategy (CWMS)

CWMS: Drinking Water Targets vs
Irrigated Land Area Targets

2017:
9 wells (4%)
showed a decrease
55 wells (25%)
showed an increase
160 wells (71%)
showed no decrease
Progress?
A demonstrable decrease in nitrate concentrations in shallow groundwater by 2020 (CWMS Target)

Canterbury Water Management Strategy:
Targets by 2040
• Average annual nitrate levels in all groundwater wells are below 50% of MAV for drinking water.
• 850,000 hectares of irrigated land
So what is the solution to pollution
for rural Cantabrian babies?
Ministry for the Environment
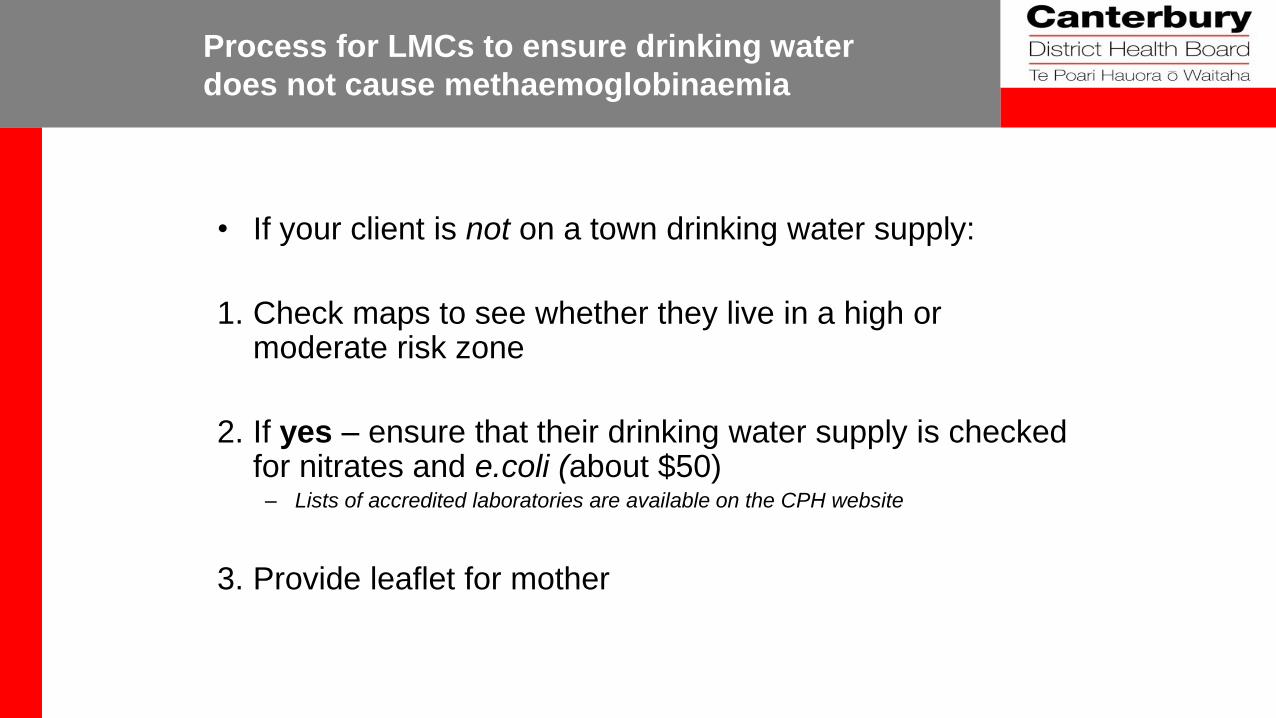
Process for LMCs to ensure drinking water
does not cause methaemoglobinaemia
• If your client is not on a town drinking water supply:
1. Check maps to see whether they live in a high or moderate risk zone
2. If yes – ensure that their drinking water supply is checked for nitrates and e.coli (about $50)
– Lists of accredited laboratories are available on the CPH website
3. Provide leaflet for mother

Nitrate in Drinking Water:
Pamphlet
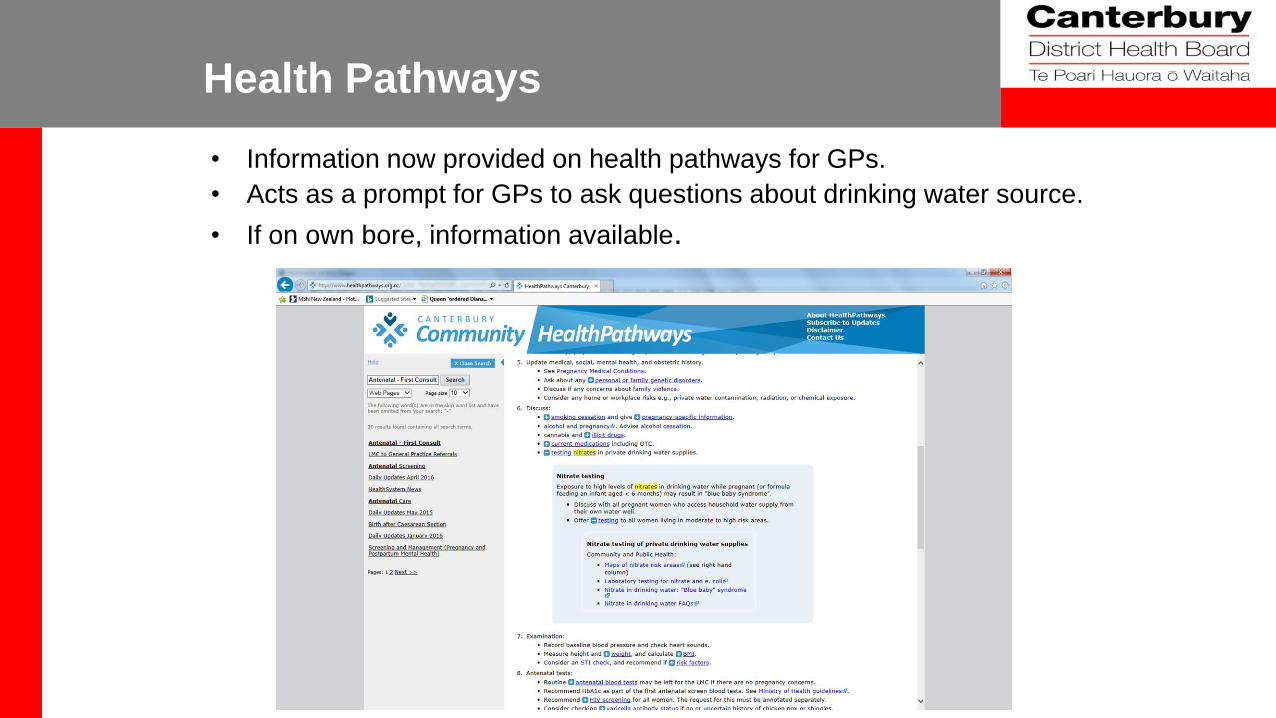
Health Pathways
• Information now provided on health pathways for GPs.
• Acts as a prompt for GPs to ask questions about drinking water source.
• If on own bore, information available.
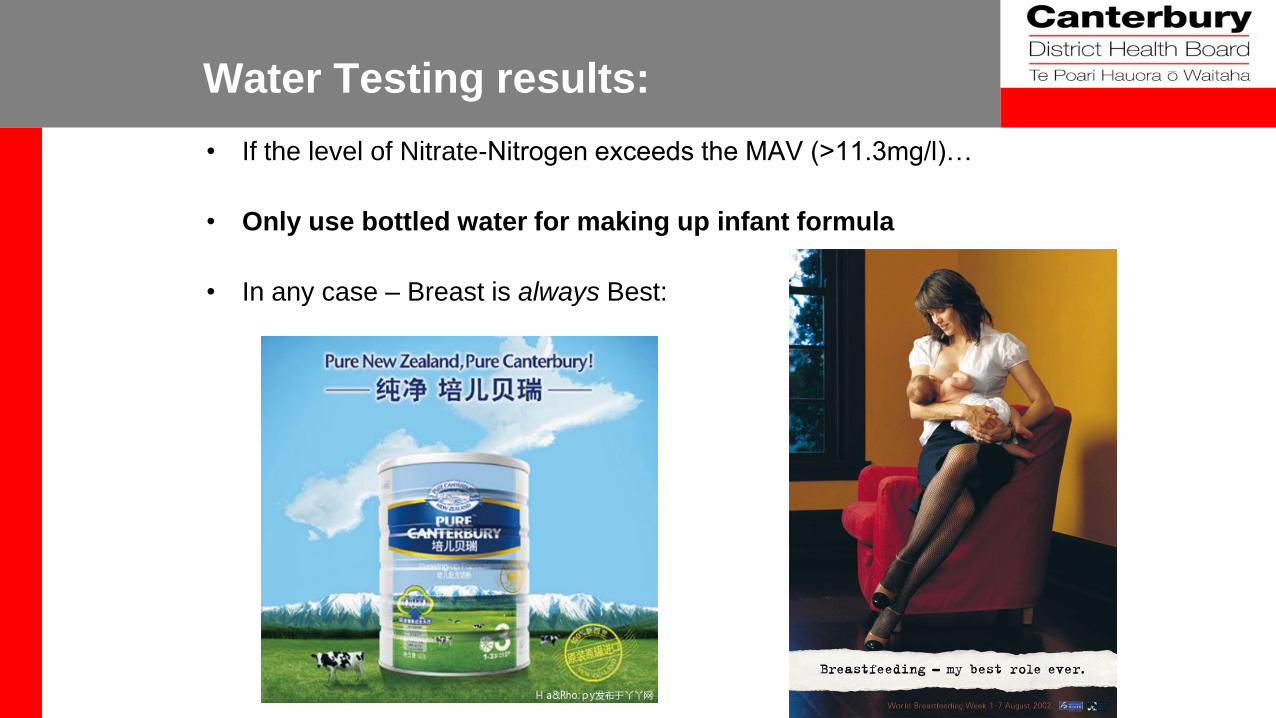
Water Testing results:
• If the level of Nitrate-Nitrogen exceeds the MAV (>11.3mg/l)…
• Only use bottled water for making up infant formula
• In any case – Breast is always Best:
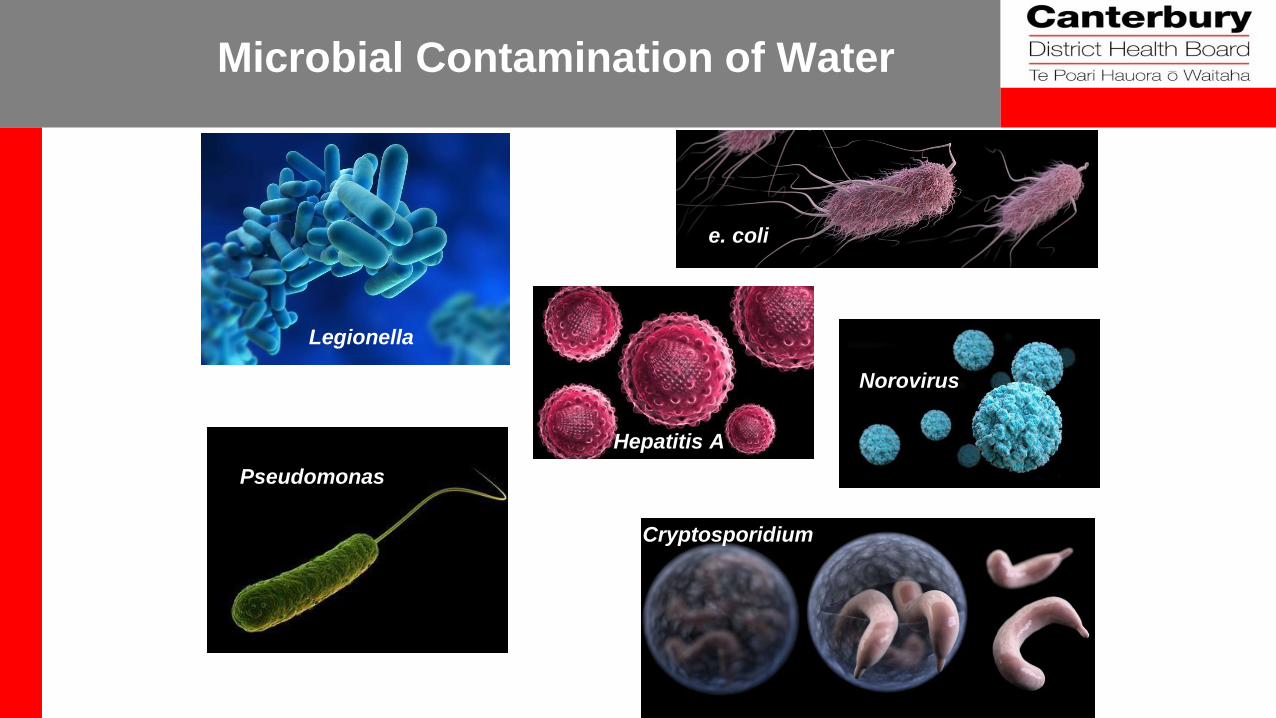
Microbial Contamination of Water
Legionella
Cryptosporidium
e. coli
Hepatitis A
Pseudomonas
Norovirus

The burden of water borne
disease in New Zealand
• Wide estimates: 18,000 to 34,000 an underestimate
• People with gastro do not always visit their GP
• Not all cases are notified – STEC, Giardia, Crypto, Hep A, Campylobacter should be

Campylobacteriosis rates for four regions
included in Regional Implementation Plan
Average Annual Rates of Campylobacteriosis in Ashburton, Selwyn,
Hurunui, Waimakariri and New Zealand By Age Rates: 2007 - 2011
0
155
310
465
620
0-4 5-9 10-14 15-19 20-29 30-39 40-49 50-59 60-69 70+
Age Group (yrs)
Rat
es (
per
100,
000
popu
latio
n)
Ashburton,
Hurunui,
Selw yn and
Waimakariri
New Zealand

The Walkerton Tragedy
• >2,300 cases of gastroenteritis (E coli and campylobacter)
in a town of 5,000 people
• 7 deaths
• Boil water notice for 6 months
• Business suffered,
real estate values dropped
• Stigma
• Direct economic impact $64,000,000
• An opportunity for us to learn from others’ mistakes

Betty Trushinksi
She died in the hospital away from her home,
hooked up to machines and tubes in a coma.
She suffered terribly for ten days.
She never had a chance to understand her illness.
She couldn’t put her affairs in order or say goodbye.
There was no time.
She just got sicker and sicker … and we were always ten steps behind the illness.
Her dreams of her retirement with Dad and travelling were stolen,
all because the water was unsafe and nobody told her.
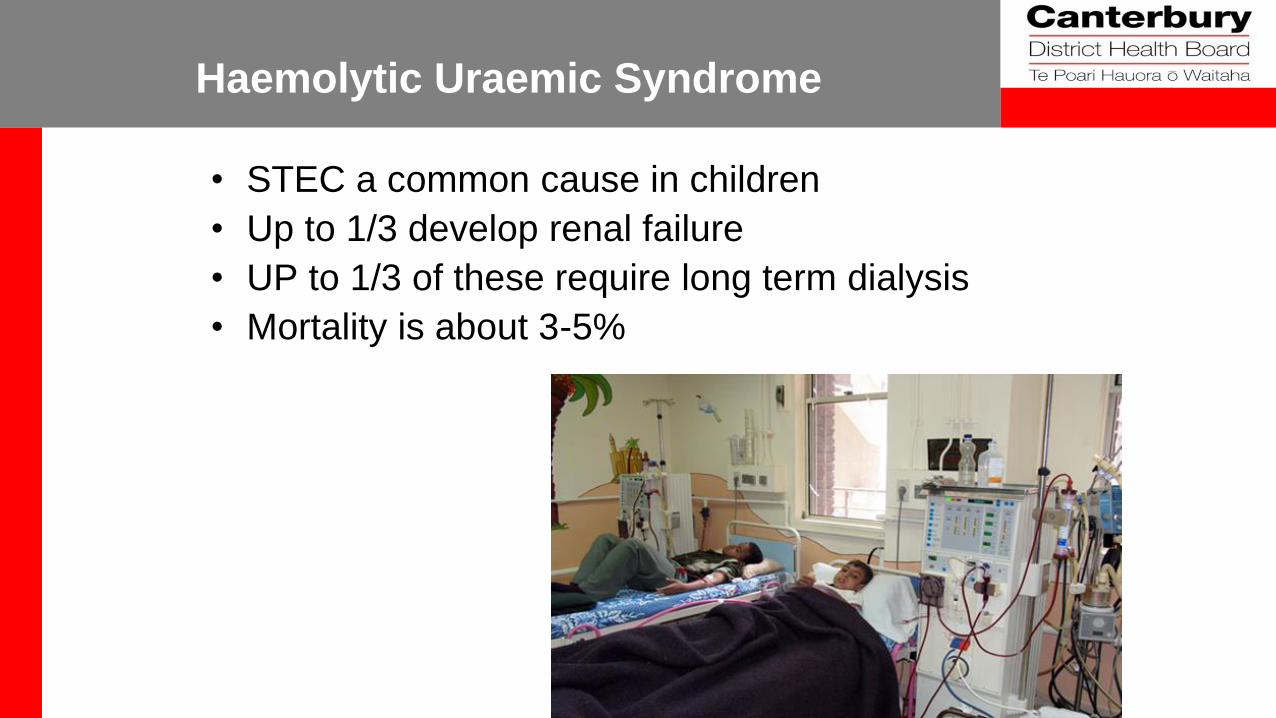
Haemolytic Uraemic Syndrome
• STEC a common cause in children
• Up to 1/3 develop renal failure
• UP to 1/3 of these require long term dialysis
• Mortality is about 3-5%
Darfield Outbreak, August 2012
• 118 cases of gastro – 29 Campylobacter
• Infiltration gallery water supply
• Failure of chlorine analyser
• Flooding

Dunsandel Contamination 2009
• E.coli transgressions
• Animal source
• 70M well
Springston Outbreak, February 2008
• Nearly 50% of township affected
• Most cases identified as campylobacter
• At least one case e.coli 0157
• Cracked bore with intensive farming

Havelock North August 2016
• 5500/14000 residents infected
• 45 hospitalizations with 3-5 deaths
• Two bores implicated
• Campylobacter from sheep faeces
“Drinking Water Assessors were too hands-off in applying
the Drinking-water Standards. They should have been
stricter in ensuring the District Council complied with its
responsibilities”
Health Act 1956

Conclusions
• Be aware of general water quality in your area, particularly if you live in a rural area
• Notify on suspicion (all notifiable diseases!)
• Encourage nitrate and e.coli testing of private bores on booking for pregnancy

Questions?