download the publication (PDF, 13 MB)
123
CLIMATE CHANGE Scientific Assessment and Policy Analysis WAB 500102 021 Fossil Fuel Deposit Fires Occurrence Inventory, design and assessment of Instrumental Options
Transcript of download the publication (PDF, 13 MB)

CLIMATE CHANGE
Scientific Assessment and Policy Analysis
WAB 500102 021
Fossil Fuel Deposit Fires
Occurrence Inventory, design and assessment of Instrumental Options
Report 500102 021
Authors P.M. van Dijk C. Kuenzer
J. Zhang K.H.A.A. Wolf
J. Wang
September 2009
CLIMATE CHANGE
SCIENTIFIC ASSESSMENT AND POLICY ANALYSIS
Fossil Fuel Deposit Fires
Occurrence Inventory, design and assessment of Instrumental Options
This study has been performed within the framework of the Netherlands Research Programme on Scientific Assessment and Policy Analysis for Climate Change (WAB), for the project Fossil Fuel
Deposit Fires; Occurrence Inventory, Design and Assessment of Instrumental Options.

Page 2 of 121 WAB 500102 032
Wetenschappelijke Assessment en Beleidsanalyse (WAB) Klimaatverandering Het programma Wetenschappelijke Assessment en Beleidsanalyse Klimaatverandering in opdracht van het ministerie van VROM heeft tot doel: • Het bijeenbrengen en evalueren van relevante wetenschappelijke informatie ten behoeve
van beleidsontwikkeling en besluitvorming op het terrein van klimaatverandering; • Het analyseren van voornemens en besluiten in het kader van de internationale
klimaatonderhandelingen op hun consequenties. De analyses en assessments beogen een gebalanceerde beoordeling te geven van de stand van de kennis ten behoeve van de onderbouwing van beleidsmatige keuzes. De activiteiten hebben een looptijd van enkele maanden tot maximaal ca. een jaar, afhankelijk van de complexiteit en de urgentie van de beleidsvraag. Per onderwerp wordt een assessment team samengesteld bestaande uit de beste Nederlandse en zonodig buitenlandse experts. Het gaat om incidenteel en additioneel gefinancierde werkzaamheden, te onderscheiden van de reguliere, structureel gefinancierde activiteiten van de deelnemers van het consortium op het gebied van klimaatonderzoek. Er dient steeds te worden uitgegaan van de actuele stand der wetenschap. Doelgroepen zijn de NMP-departementen, met VROM in een coördinerende rol, maar tevens maatschappelijke groeperingen die een belangrijke rol spelen bij de besluitvorming over en uitvoering van het klimaatbeleid. De verantwoordelijkheid voor de uitvoering berust bij een consortium bestaande uit PBL, KNMI, CCB Wageningen-UR, ECN, Vrije Universiteit/CCVUA, UM/ICIS en UU/Copernicus Instituut. Het MNP is hoofdaannemer en fungeert als voorzitter van de Stuurgroep. Scientific Assessment and Policy Analysis (WAB) Climate Change The Netherlands Programme on Scientific Assessment and Policy Analysis Climate Change (WAB) has the following objectives: • Collection and evaluation of relevant scientific information for policy development and
decision–making in the field of climate change; • Analysis of resolutions and decisions in the framework of international climate negotiations
and their implications. WAB conducts analyses and assessments intended for a balanced evaluation of the state-of-the-art for underpinning policy choices. These analyses and assessment activities are carried out in periods of several months to a maximum of one year, depending on the complexity and the urgency of the policy issue. Assessment teams organised to handle the various topics consist of the best Dutch experts in their fields. Teams work on incidental and additionally financed activities, as opposed to the regular, structurally financed activities of the climate research consortium. The work should reflect the current state of science on the relevant topic. The main commissioning bodies are the National Environmental Policy Plan departments, with the Ministry of Housing, Spatial Planning and the Environment assuming a coordinating role. Work is also commissioned by organisations in society playing an important role in the decision-making process concerned with and the implementation of the climate policy. A consortium consisting of the Netherlands Environmental Assessment Agency (PBL), the Royal Dutch Meteorological Institute, the Climate Change and Biosphere Research Centre (CCB) of Wageningen University and Research Centre (WUR), the Energy research Centre of the Netherlands (ECN), the Netherlands Research Programme on Climate Change Centre at the VU University of Amsterdam (CCVUA), the International Centre for Integrative Studies of the University of Maastricht (UM/ICIS) and the Copernicus Institute at Utrecht University (UU) is responsible for the implementation. The Netherlands Environmental Assessment Agency (PBL), as the main contracting body, is chairing the Steering Committee. For further information: Netherlands Environmental Assessment Agency PBL, WAB Secretariat (ipc 90), P.O. Box 303, 3720 AH Bilthoven, the Netherlands, tel. +31 30 274 3728 or email: [email protected]. This report in pdf-format is available at www.pbl.nl

WAB 500102 032 Page 3 of 121
Preface This report presents factors that influence the quantification of green house gas (GHG) emissions released by uncontrolled fossil fuel deposit fires (mostly coal seam fires, hence often abbreviated to ‘coal fires’). The major unanswered question in fossil fuel deposit fire research is “How much global-warming relevant GHG is released by coal fires on a local, regional, country-wide, and global scale?” The answer to this question is of economic interest because uncontrolled fossil fuel deposit fire- related emission minimization could contribute to certified emissions trading under the Clean Development Mechanism (CDM) of the Kyoto Protocol and protocols to follow. We indicate why the topic of fossil fuel deposit fire emission quantification is highly sensitive and present several reasons why reliable global coal fire quantification has not yet been achieved. This report focuses on the numerous obstacles in the quantification of coal fire emissions that have to be overcome to publish reasonable and scientifically sound numbers. Key parameters that complicate GHG emission quantification include variations in coal petrography, heterogeneities in coal layering, differences in overburden bedrock characteristics, varying crack and vent pathway densities above the burning seam, variations in the degree of combustion, uncertainties in measuring techniques, as well as the problem of spatial, and especially timely, transfer of results. Despite these challenges, we present an outlook on options for the future quantification of coal fires. In this study we have concentrated on field- and laboratory studies of combustion of organic shales (as current results are available and comparable to coal seam fires), we present three case studies on coal fire-related GHG emission quantification on provincial scale in China, and we propose an integrated quantification option aimed at the joint analyses of local knowledge, geophysical data, and remote sensing data with the objective to retrieve numbers that are unbiased by economic and political interferences. As a first estimate, we conclude that the emissions of GHGs from coal fires in China account for well less than 0.4% of all human-induced global annual CO2 emissions, most likely even less than 0.1%. This is much less than the previously estimated 2-3%.

Page 4 of 121 WAB 500102 032
This report has been produced by: Dr. Paul van Dijk, Wang Jun1) , Prasun Gangopadhyay International Institute for Geo-Information Science and Earth Observation (ITC), Department of Earth Systems Analysis Dr. Karl-Heinz Wolf TU-Delft, Faculty Civil Engineering and Geosciences, Section Applied Geophysics & Petrophysics Dr. Claudia Kuenzer2), Dr. Jianzhong Zhang2) TU-Vienna, Institute of Photogrammetry and Remote Sensing (IPF) 1) Ningxia Coalfield Fire-fighting Project Management Department, Shenhua Ningxia Coal
Industry Co. Ltd. 2) In 2008 as private consultants Name, address of corresponding author: Paul van Dijk International Institute for Geo-Information Science and Earth Observation (ITC) Department of Earth Systems Analysis (ESA) P.O.Box 6 7500 AA Enschede http://www.itc.nl E-mail: [email protected] Disclaimer
Statements of views, facts and opinions as described in this report are the responsibility of the author(s).
Copyright © 2009, Netherlands Environmental Assessment Agency
All rights reserved. No part of this publication may be reproduced, stored in a retrieval system or transmitted in any form or by any means, electronic, mechanical, photocopying, recording or otherwise without the prior written permission of the copyright holder.
WAB 500102 021 Page 5 of 121
Contents
Executive Summary 9 Samenvatting 13 1 Introduction 17
1.1 Scope of the report 17 1.2 Relation to Kyoto protocol and CDM 18 1.3 Challenges for coal fire related emission quantification 19
1.3.1 Difficult to approach and measure 21 1.3.2 Variability in degree of combustion 21 1.3.3 Surface temperature patterns and coal fire-related energy release 22 1.3.4 The challenge of timely predictions 23 1.3.5 The challenge of extrapolation to other areas 23 1.3.6 Difference in estimated CO2 emission from coal fires 23
2 Previous Research 25 2.1 Borehole methods 25 2.2 Geophysical methods 25 2.3 Inventory of the global scope of fossil fuel fires by remote sensing 26
3 Modelling Fossil Fuel Fires: Spontaneous combustion of organic shales: Fieldwork, laboratory observations and modelling 29
3.1 Introduction – Geology 29 3.2 Field data and literature 30 3.3 Geophysical exploration 33 3.4 Laboratory experiments and results 35 3.5 Experimental results 36
3.5.3 Matrix permeability 38 3.6 The combustion and convection model 39
3.6.1 Model explanation 39 3.6.2 Parameter definition 40
3.7 Results and discussion 41 3.7.1 Notes: 43
3.8 Conclusions 43 4 Case study: Rujigou syncline, Ningxia, China 45
4.1 Location and history of coal fires in Ningxia 45 4.2 Impacts of the coal fires 47 4.3 Coal fire fighting methods in Ningxia 49 4.4 Monitoring coal fire in Ningxia 52
4.4.1 Temperature measurements 52 4.4.2 Gas content analysis 52 4.4.3 Remote sensing approach 53 4.4.4 Monitoring coal fires using geophysics and geochemistry methods 53
5 Case study: Wuda syncline, Inner Mongolia, China 57 5.1 Location and history of coal fires in Wuda 57 5.2 Impacts of the coal fires in Wuda 59 5.3 Coal fire fighting methods in Wuda 60 5.4 Figures for coal loss in Inner Mongolia 60 5.5 Satellite monitoring of coal fires in Wuda 60 5.6 Monitoring coal fire extent and intensity using thermal photos in Wuda 62
6 Case study of a province: Xinjiang autonomous region, China. 63 6.1 Location and history of coal fires in Xinjiang 63 6.2 Impacts of the coal fires in Xinjiang 65 6.3 Coal fire fighting methods in Xinjiang 66 6.4 Monitoring coal fires in Xinjiang 66
7 Automated detection of thermal anomalies due to fossil fuel fires 69 7.1 Theory of Algorithms for Coal Fire Risk Area Demarcation and Thermal
Anomaly detection 69 7.1.1 Automated delineation of coal fire risk areas 69

Page 6 of 121 WAB 500102 021
7.2 Application of Algorithms for Coal Fire Risk Area Demarcation and Thermal Anomaly detection based on Landsat, MODIS and ASTER data 77 7.2.1 Combination of algorithm synergetic effects: Experiments with Landsat data 77 7.2.2 Detection of unknown fires: Field survey in September 2003 80 7.2.3 Detection of unknown fires: Field survey in June 2004 81 7.2.4 Thermal anomaly extraction based on MODIS and ASTER data 82 7.2.5 Data (pre-) analyses 84 7.2.6 Multi band extraction results 86 7.2.7 Multi diurnal extraction results 88 7.2.8 Multi temporal extraction results (different years) 92 7.2.9 Comparison results with high resolution TIR data 93
7.3 Discussion and conclusions 98 8 Estimation of GHG emission due to fossil fuel fires 99
8.1 Proposed method to approximate coal fire-related emissions 99 8.1.1 Method for local GHG emission estimation of a single coal fire 99 8.1.2 Method for regional GHG emission estimation of one coal fire area 100 8.1.3 Estimation of GHG emissions for Ningxia 100 8.1.4 Estimation of GHG emissions for the Wuda coal mining region, and other
occurrences in Inner Mongolia 100 8.1.5 Estimation of GHG emissions for the Xinjiang province 103
8.2 Method for national GHG emission estimation (province or country) 103 8.2.1 Conclusions 105
8.3 Global estimation of GHG emission from fossil fuel deposit fires. 105 9 Technical options of (future) satellite derived CO2 quantifications 107
9.1 Introduction 107 9.2 Theoretical options and limitations for CO2 anomaly detection 108
References 109 List of Tables 1 Difficulties for direct in situ measurements of the three quantitative coal fire
parameters: amount of burning coal, amount of energy release, amount of emitted gasses 20
2 Interrelationships of public, political and economic pressures with regard to low or high estimates of coal fire related GHG emission 24
3 Heating and temperature profile of the core samples 36 4 Mineral content by XRF-analysis of in-situ sample 37 5 Overview of weight loss at different temperatures 37 6 Porosity measurements 38 7 Permeability vs. temperatures 38 8 Main parameters convection and combustion model 41 9 Parameter variation versus maximum temperature 42 10 Coal fire statistics in Ningxia province, China 46 11 Atmospheric quality standard (mg/m3), above they ‘standard value’ conditions for
the inhabitants are considered harmful 48 12 Atmospheric monitoring measurements (autumn) 48 13 Atmospheric monitoring measurements (winter) 49 14 Sensor characteristics 53 15 Coal fires statistics in Xinjiang (shaded names appear in the text and/or
illustrations) 64 16 Coal classification in China 65 17 Coal fire risk area delineation supporting the exclusion of false alarms 78 18 Specifications of MODIS images used in this study 83 19 Thermal anomaly extraction in data from 4 different times of the day as extracted
from the thermal band 32 91 20 Thermal anomaly extraction in data from 4 different times of the day as extracted
from the ratio band (20/32) 91 21 Coal fire emissions in Wuda as estimated from reported burning coal volume and
remote sensing. 104

WAB 500102 021 Page 7 of 121
22 Coal fire emissions in China as estimated from reported and assumed burning coal volume. 104
List of Figures 1 Strong gas emission through sinkhole above a subsurface coal fire (left) and coal
fire induced bedrock collapse (right), both in Wuda, Inner Mongolia, China. 18 2 Relationship between the three major quantitative coal fire parameters: amount of
burning coal, amount of gasses emitted, and amount of energy released (Kuenzer et al. 2007d) 20
3 Complex system of a shallow subsurface coal fire. Numerous influences in a near chaotic system hamper the quantification of burned coal and related gaseous emissions. (Kuenzer et al. 2007d) 21
4 Coal fire related energy release 22 5 A: Location map. B: View of the cliff from Kimmeridge bay to St’ Aldhelms head. 30 6 A and B: Details of Burnt Cliff 31 7 A. Major fault system in the cliff, consisting of extension faults 32 8 Location of the geophysical lines for Induced Resistivity (red) and TDEM (blue)
measurements, starting ca. 20 m from the cliff head 33 9: Resistivity measurements of line 1; perpendicular to the cliff face. 34 10 Resistivity measurements of line 3; parallel to the cliff face 35 11 Porosity (A) and volume loss (B) as a function of temperature after thermal
treament 37 12 A: Permeability versus temperature, including minimum and maximum values and
the standard deviation. B Log permeability as a function of the porosity. 39 13 Model domains for the Kimmeridge cliffs, as an adaption to the original model of
Wolf (2006) 40 14 Convection model result: Oxygen concentration [%], flow [m3/(m/s)] 42 15 Coal fire distribution map for Rujigou coal mining area 45 16 a and b Fire fighting by water supply (a) and drilling to inject synthetic foam (b) 50 17 a and b: large excavation operation at Beishan coal fire area to remove entire
burning coal layer. c and d: Coal fire at Nanyi (a) taken in 1997, (b) taken in 2002 after excavation and rehabilitation. e and f: Coverage of coal fire outcrop at a cliff above the village of Rujigou, with a pond for extra protection (e), and coverage of coal fire with overburden, note new cracks developing near the cliff face (f) 51
18 A 19 month Gas content analysis from a monitoring borehole. Pink: temperature in °C; blue: Oxygen content in %; yellow: CO in ppm 52
19 Electro-magnetic field measurements in Rujigou area 54 20 Thermal photos of the Beishan coal fire 55 21 Wuda syncline. Background image: Landsat 7 ETM+, optical colour composite
(nir, red, green; bands 4,3,2) 57 22 Location of the Wuda coalmine area 58 23 Wuda syncline as seen in panchromatic (black-and-white) 60 cm high-resolution
Quickbird satellite imagery 61 24 A: Coal fire #7 in Wuda coal mining syncline. B: Daytime, and C: Nighttime
thermal camera field photo 62 25 A Chinese map of Xinjiang coal fire areas distribution (red dots are coal fires) 63 26 A: Multiple incised river terraces along the Totunhue river, near Kelazha, Xinjiang.
B: Red colored pyrometamorphic rock (‘klinker’) along Totunhue river scarp, with cracks due to coal fire related subsidence on foreground. 65
27 A: Qitaibeishan open pit mining with coal fire. B: Inspection of borehole in sand/gravel covered coal fire at Qitaibeishan (1995) 66
28 Overview Xinjiang. Location: latitude 42°31' to 42°50, longitude 81°19 to 81°S34', 67 29 Fire fighting techniques at Xiaolongkao/xiaohuangshan coal fire in Dahuanshan
coal mining area (Number 17 in Table 15), Xinjiang, illustrating a combined effort of covering coal fires with overburden, and injection if water/mud in the hot zone. 68
30 Delineating the area, in which coal fire related thermal anomalies can be expected 69

Page 8 of 121 WAB 500102 021
31 Radiometrically corrected Landsat-7 ETM+ spectra for different surfaces. (here: 6=mid infrared, 7=thernak infrared to present channels in the correct wavelengths range) 70
32 Summarized workflow of the knowledge based test sequence 73 33 A moving window filter of varying size (11*11 to 35 * 35) investigated the thermal
data set 74 34 Histogram for thermal anomalous areas on a night-time ETM+ image acquired in
2002 76 35 Sequence of the algorithm for automated thermal anomaly extraction 77 36 Synergy of spectral test sequence (coal fire risk area delineation) and thermal
algorithm: rejection of false alarms outside the delineated risk areas 79 37 Coal fire risk areas superimposed on the panchromatic band of Landsat 7 ETM+
scene of 21.09.2002 79 38 Thermal clusters extracted with the automated detection algorithm based on
Landsat 7 ETM+ night-time data from 28.09.2002 superimposed on the panchromatic band of Landsat ETM+ daytime data from 21.09.2002 80
39 Newly detected coal fire in the valleys of Hulusitai and Shitanjing about 30km northeast of Rujigou 81
40 Newly detected coal fire in the valley east of the Yellow River about 27 km southeast of Wuda city 82
41 Comparison of MODIS radiant temperatures in band 20 (b) and band 32 (c), and ratio image (d) for pre-dawn data of February 17, 2005 85
42 Thermal clusters extracted with the automated detection algorithm based on MODIS ratioed pre-dawn data from 02.02.2005 86
43 Thermal anomaly extraction for the MODIS predawn subset of February 17th 2005 87
44 Number of anomalies extracted from band 20, band 32 and a ratio-band of bands 20 and 32 for MODIS pre-dawn data on February 17th 2005 88
45 Thermal anomalies extracted from band 32 (TIR) of a morning (a), afternoon (b), evening (c) and a pre-dawn scene (d) 89
46 Thermal anomalies extracted the ratio band (20/32) of a morning (a), afternoon (b), evening (c) and a pre-dawn scene (d) 90
47 Statistics of multi-diurnal thermal anomaly extraction for morning, afternoon, evening and pre-dawn data from the MODIS thermal band 32 92
48 Multi-temporal comparison of anomaly extraction for an evening dataset of November 2001 (left side) and an evening dataset of 2005 (right side) for band 20, 32 and the ratio band. The MODIS subset has an extent of 172 km x 85 km. 93
49 a: Thermal anomalous clusters extracted from ASTER band 14 (orange), MODIS warm areas from band 32 (grey) and MODIS hottest zones from the ratio image (white) in February/March 2005 95
50 MODIS hot spot anomalies from pre-dawn ratio data (white) and extracted daytime thermal anomalies from LANDSAT band 6 data (orange) overlain on a multispectral LANDSAT subset of Jharia coal field 96
51 Two coal mining and storage areas 150 km west (a) and 50 km west (b) of Jharia. 97 52 Coal fire mapping result in Wuda syncline for the year 2003 (top) and for a newly
occurring fire in 2003 (bottom left) and in 2004 (bottom right) 102

WAB 500102 021 Page 9 of 121
Executive Summary
Introduction This project brings together existing knowledge on the problem of combustion of in-situ fossil fuel deposits, in particular coal occurrences. It links the physical properties of coal and its combustion emission products to detection and monitoring options with state-of-the-art earth observation techniques, and with an outlook to future methods, including improved sensors and (semi)automated detection algorithms. Concerning fire extinguishing it focuses on the technical difficulties of monitoring and auditing aspects of reduction schemes (like CDM), with an inventory of current fire fighting techniques. The report can be summarized in four main parts: • In-situ and laboratory modeling of combustion (Chapter 3 on Kimmeridge organic shales). • 3 case studies in China, with detailed tables on coal loss in mines for the provinces Ningxia,
Inner Mongolia and Xinjiang (Chapters 4, 5 and 6). • The potential of automated detection of thermal anomalies in readily available remote
sensing data (Chapter 7). • An estimation of GHG emission (Chapter 8), based on the data in the previous chapters. In addition, Chapter 9 explores the option of CO2 emission quantification from point sources (like fossil fuel deposit fires, but also industry and urban areas) through satellite observations; a theoretical option that is still out of reach with present day technology. Theoretically, a remote sensing and radiative transfer based model that estimates CO2 concentration can be made for a given plume height of a geo-natural event such as coal fire. However, the proposed model would deal with uncertainties that can not be resolved as yet. Problem setting The problem of quantification of GHG emission from fossil fuel deposit fires can be approached from 3 sides (see Figure 2): 1) The measurement of direct emission of CO2 into the atmosphere; 2) The measurement of exact amount of coal lost in combustion (referred to as ‘coal burnt’),
multiplied by factors for carbon content and CO2 (and possibly CH4) generation; 3) The measurement of energy release from the combustion, and recalculation to amount of
fuel and subsequently CO2 (and possibly CH4) generated. As the first option is not feasible with the present technology, as stated above, and the third contains still too much uncertainty with regards to modeling energy transfer and coupling to remote sensing observations (besides the very dynamic and rapidly fluctuating nature of deposit fires), the present study is based on the most reliable figures of coal lost and coal burnt that are provided by the Chinese coal mining authorities. The main constituents of the report are summarized in the next sections. In-situ and laboratory modeling of combustion (Chapter 3 on Kimmeridge organic shales). The convection and combustion model applied to simulate combustion of an oil shale cliff near Kimmeridge Bay, Southern England, provides a good perception of the in-situ behaviour. On one hand, observations at burning cliff and laboratory experiments were essential to get the requested parameters as input for modelling. On the other hand, the model provided explanations for the pyrometamorphical behaviour as observed at the outcrops. The model proved to be applicable at lower temperatures. Therefore, it also can be used in areas where low caloric coals are being subject to coal fires. It can be concluded that the maximum combustion temperature (800 K) hardly changes with the thickness of the combustion zone, and this is of direct importance to the thermal modelling of combustion in remotely sensing. The permeability of the rubble zone (or scree) in the model is of greater importance for changing of

Page 10 of 121 WAB 500102 021
the maximum temperature, which is in agreement with the perceived importance of cracks and vents in the case of subsurface coal fires. The oxygen concentration in the model shows that in all cases the oxidation process consumes all oxygen and that temperature is permeability dependent. Translation of the results to other regions in the world and to coal deposits is only possible when local geological conditions and petrophysical parameters are known. In addition, local climate is also an important factor. Therefore, it remains complicated to estimate a world wide CO2 contribution of fossil fuel deposits. Hence, an inventory based on occurrence and climate is essential. Estimation of the world wide CO2 contribution of (low grade) coals and oil shales is only possible when climate conditions and the occurrence of (seasonal) coal fires are correlated and quantified. Case studies in 3 provinces of China (Chapters 4 on Ningxia, 5 on Inner Mongolia and 6 on Xinjiang). In these chapters an overview is given of coal fire related research over the last 2 decades. In addition, new tables are presented that are compiled by the Chinese mining authorities. The tables contain the best possible estimation of the amount of coal lost through fires, and are made by the coal mining companies. A distinction needs to be made clear between coal lost trough burning (‘coal burnt’), and in addition coal lost because the reserves are not (economical) recoverable any more (‘coal lost’ = burnt coal + uneconomical rest of coal that is not (completely) burnt). Even though there is still a limited chance of over-estimation (by local mines in order to be eligible to receive more financing for fire extinguishing), we believe that these figures are subjected to mutual internal review and therefore can be used as a reasonable estimation base. In the province of Ningxia 37 coal fires occur of which 14 are extinguished. The Rujigou coal mining area is used as case study for Ningxia (it contains 27 of the 37 coal fire locations, of which 12 are extinguished). The total coal lost is estimated at 50 Mt (up to end of 2007, seeTable 10 ). It is estimated that about 2 million tons of coal is burned out per year. Between 11.6 and 7 million tons of CO2 are generated annually accordingly (resp. with and without contribution from CH4). For Inner Mongolia no detailed figures per location are available. The known coal fire regions are: Wuda, Gulaben, Zhozi Shan and Er Duo Si. Note Gulaben is located west of Rujigou (province Ningxia), and in fact the continuation of the same synclinal deposit. The Wuda coal field is used as case study, and forms the most important mining area with the most severe coal fire problem. The total amounts for the entire province are estimated at 64 individual coal fires, totaling 2280 * 10,000 m2 and 4.5 Mt coal burnt per year. The upper limit for annual emission is 20.25 Mt CO2 equivalent (incl. CH4) and the lower limit is 10 Mt CO2. The coal fires in Xinjiang make up for 435 Mt of coal loss per year (Table 15). However, this includes the coal that is remaining inaccessible afterwards (‘coal lost’). It is estimated that there is about 13.5 Mt of coal directly burnt out per year. The Xinjiang coal fire fighting team has already extinguished 8 coal fire fields during the last 50 years, and presently is working on 31 coal fires. 13.5 Mt of coal per year burnt from coal fire in Xinjiang generates between 67.5 (incl. CH4) and 36 million tons of CO2. In 1995, the Xinjiang coal fire fighting team made a plan to extinguish all the coal fires in Xinjiang by the year of 2015, instead of the 2020 in the previous plan. The potential of automated detection of thermal anomalies in remote sensing data (Chapter 7). The algorithm for automated detection of thermal anomalies due to fossil fuel fires using remote sensing data includes two steps. One step is automated delineation of coal fire risk areas using multi-optical bands. The other step is to automatic detection of the thermal anomalies using thermal band data. This algorithm was developed based on the known coal fires in the Wuda

WAB 500102 021 Page 11 of 121
mining area. Later it is used to detect unknown fires in China, and in India. It is established that the method is feasible by using the data from Landsat-7, ASTER, and MODIS. Night-time thermal data have the best contrast for detection thermal anomalies due to fossil fuel fires from the background. In principle it is possible to use this algorithm to generate a world fossil fuel fires distribution map (however that is a very large assignment). The area of a thermal anomaly extracted by the algorithm varies when data from different times or different source satellites are used. This is because the thermal anomaly on the earth surface varies with its surrounding conditions. When the surrounding temperature is high, such as in summer and/or during the day, the anomaly has a smaller area. When the surrounding temperature is low, such as in winter and/or at night, the same coal fire forms an anomaly with a bigger area. More research is needed for comparing anomalies from different times. At present, there is still not a feasible way to quantify the development of fossil fuel fires by using remote sensing data, but it is feasible to tell the existence and relative size of a fossil fuel fire. The conclusion is that the link between in-situ fossil fuel fire models (such as presented in Chapter 3) and remote sensing monitoring cannot be made yet. An estimation of GHG emission (Chapter 8). China The reported total burnt coal in Xinjiang, Ningxia, and Inner Mongolia is 13.5+2+4.5 = 20 million tons, which we take as an upper limit for the annual total uncontrolled combustion of coal in China, because this concerns an upper estimate with considerable margins, and in other provinces the problem is much less. In the most conservative approach (assuming each ton releasing 2.7 tons of CO2 and 0.1 tons of CH4), this would lead to an annual emission of 100 Mt CO2 equivalent (including methane) and 54 Mt without methane. It is very unlikely that the upper limit is realistic, because complete combustion will not give any CH4, and incomplete combustion will leave uncombusted remants of coal in the ground. Furthermore we cannot completely rule out some exaggeration in view of government subsidy for extinghuising. We conclude that coal fire-related emissions in China accounts for well less than 0.4% of all human-induced global annual CO2 emissions, probably even less than 0.1% (5-10 Mt coal burnt/year). Global estimation Unfortunately, no reliable figures (or even estimates) for global in-situ combustion from fossil fuel deposits exist. Therefore it is very hard to estimate the GHG emission due to the fossil fuel fires. However, taking into account the global coal reserves and coal production figures, as well as the climate conditions, we assume that the global CO2 emission due to uncontrolled combustion can not be more than 4 times the probable emission from China. The upper limit is 100 Mt (192 Mt with possible CH4 included), which amounts to 0.4% (0.7% with methane included) of the global annual human-induced CO2 budget. A more reliable inventory of global CO2 emission from uncontrolled combustion of fossil fuel deposits needs to be elaborated, and could not be fitted within the time and resources of the present project.

Page 12 of 121 WAB 500102 021
Key findings
The most important results can be summarized as follows: About methodology and technical options: • Using earth observation data for direct detection of CO2 from point sources, though
theoretically possible, is beyond the present technical options. The gap, both in signal strength and spatial resolution (from km2 to m2), is still too large and is not expected to be closed in the near future.
• Routine detection of thermal anomalies in areas prone to fossil fuel fires is proven to be feasible with operational satellites, and can be achieved globally with sufficient support of sensor availability and processing capacity, as well as an outline of coal bearing sedimentary basins (approx. 1:500,000 scale).
• A quantitative link between thermal anomalies to amount of fuel burnt and CO2 emitted depends on further work on the thermal models of fossil fuels and its coupling to remote sensing data, also provided that limited ground truth is available.
About quantification with presently available data: • China: Based on the detailed data on coal burnt in the 3 most seriously affected
provinces of China, we estimate a maximum emission of 100 Mt CO2 equivalent (including methane, calculated at 23x CO2). This would be in the order of 0.1-0.4% of total human-induced global annual CO2 emission.
• Global: Due to a lack of a reliable inventory of fossil fuel fires and annual losses due to combustion, we can only make a rough estimation. Given the various uncertainties we estimate it to be in the range of 0.4-0.7 % of human-induced global annual CO2emission.
• Further study to constrain these estimations is necessary to get a more reliable outcome.

WAB 500102 021 Page 13 of 121
Samenvatting
Introductie Dit project inventariseert bestaande kennis betreffende het probleem van ontbranding van in-situ fossiele brandstof voorkomens, in het bijzonder steenkool afzettingen. De fysische eigenschappen van steenkool en de gassen die bij verbranding vrijkomen worden in verband gebracht met de technische mogelijkheden van detectie en monitoring met behulp van hedendaagse aardobservatie technieken, evenals te verwachten toekomstige ontwikkelingen, inclusief verbeterde sensoren en (semi-)automatische detectie algorithmen. Wat betreft het bestrijden van de branden worden de technische problemen van het vastleggen en verantwoorden van emissie reductie (zoals CDM) besproken, inclusief een invertarisatie van huidige brandbestrijdingstechnieken. Het rapport kan samengevat worden in 4 hoofdthema’s: • In-situ en laboratorium modellering van verbranding van fossiele brandstoffen (Hoofdstuk 3
over Kimmeridge organische schalies). • 3 case studies in China, met gedetailleerde tabellen over het verlies van steenkool in de
mijnen van de provincies Ningxia, Inner Mongolia en Xinjiang (Hoofdstuk 4, 5 en 6). • De mogelijkheid van automatische detectie van thermale anomaliën in normal verkrijgbare
remote sensing data (Hoofdstuk 7). • Een schatting van broeikasgas emissie (Hoofdstuk 8), gebaseerd op de data uit de
voorgaande hoofdstukken. Hiernaast geeft Hoofdstuk 9 een overzicht van de mogelijkheid om CO2 uitstoot uit puntbronnen te kwantificeren (zoals van fossiele brandstof voorkomens, maar ook industrie en urbane gebieden) door middel van satelliet observatie; een theoretische optie die nog buiten bereik van de hedendaagse technologie ligt. In theorie kan een op remote sensing gebaseerd stralingsinteractie model de CO2 concentratie schatten van een bepaalde hoogte van een natuurlijk fenomeen zoals een kolenbrand. Echter zo‘n model zou met onzekerheden te maken hebben die nog niet opgehelderd zouden kunnen worden. Probleemstelling Het probleem van de kwantificatie van broeikasgas (GHG) emissie van fossiele brandstof voorkomens kan van 3 kanten benaderd worden (zie Figuur Figure 2): 1) Het meten van de directe emissie van CO2 in de atmosfeer; 2) Het bepalen van de exacte hoeveelheid steenkool die verloren gaat door ontbranding,
vermenigvuldigd met de factoren voor koolstof gehalte en CO2 (en evt. CH4) ontstaan; 3) Het vaststellen van de energie ontwikkeling door de verbranding, en herleiding tot de
hoeveelheid brandstof en vervolgens de ontstane CO2. Omdat de eerste optie niet haalbaar is met de huidige stand van de technologie, zoals hierboven aangegeven, en de derde mogelijkheid nog teveel onzekerheid bevat ten aanzien van het modeleren van energie overdracht en koppeling aan aardobservatie (nog afgezien van de zeer dynamische en snel fluctuerende aard van de branden), is de huidige studie gebaseerd op de meest betrouwbare cijfers van steenkool verlies door verbranding die door de Chinese kolenmijn autoriteiten verstrekt is. De belangrijkste bevindingen van het rapport worden in de volgende paragrafen samengevat. In-situ en laboratorium modellering van verbranding (Hoofdstuk 3 over Kimmeridge organische schalies). Het convectie en verbrandingsmodel dat werd ontwikkeld om de verbranding van een olieschalie klif in de buurt van Kimmeridge Bay (Zuid Engeland) te simuleren, geeft een goed inzicht in het in-situ gedrag. Aan de ene kant waren de observaties aan de brandende klif en de laboratorium experimenten essentieel om de gewenste parameters als invoer voor het model te

Page 14 of 121 WAB 500102 021
verkrijgen. Aan de andere kant gaf het model verklaringen voor het pyro-metamorf gedrag van het gesteente zoals waargenomen in de klif. Het model bleek ook toepasbaar bij lagere temperaturen. Daarom kan het ook gebruikt worden in gebieden waar laag-calorische steenkool aan kolenbranden ten prooi valt. Er kan geconcludeerd worden dat de maximale verbrandingstemperatuur (800 K) nauwelijks veranderd met de dikte van de brandende laag, en dit is van direct belang voor de thermische modellering van brandhaarden in remote sensing. De permeabiliteit van de puin zone (of steenslag) in het model is van groter belang voor de variatie in de maximum temperatuur, wat in overeenstemming is met het veronderstelde belang van scheuren en openingen in het geval van onderaardse steenkool branden. De zuurstof concentratie in het model laat zien dat in alle gevallen het oxidatie proces alle beschikbare zuurstof consumeert, en de temperatuur in feite van de permeabiliteit afhangt. Toepassing van deze resultaten op andere regio’s in de wereld, en op steenkool voorkomens is alleen mogelijk als lokale geologische condities en petrofysische parameters bekend zijn. Daarnaast is het lokale klimaat ook een belangrijke factor. Derhalve blijft het zeer moeilijk om tot een wereldwijde schatting van de CO2 bijdrage van brandende fossiele brandstof voorkomens te komen. Om deze reden is het noodzakelijk om tot een gezamenlijke inventarisatie van steenkool voorkomens en klimaat zones te komen. Schatting van de bijdrage aan de wereldwijde uitstoot van CO2 door brandende fossiele koolwaterstof voorkomens is alleen mogelijk als zowel de klimaat omstandigheden als de (seizoensgebonden) branden gecorreleerd en gekwantificeerd worden. Case studies in 3 provincies van China (Hoofdstukken 4 over Ningxia, 5 over Inner Mongolia en 6 over Xinjiang). In deze hoofdstukken wordt een overzicht gegeven over onderzoek gerelateerd aan spontane steenkoolbranden over de laatste 2 decennia. Daarnaast worden nieuwe tabellen gepresenteerd die zijn samengesteld door de Chinese steenkoolmijn autoriteiten. De tabellen bevatten de best mogelijke schatting van de hoeveelheid steenkool die verloren is gegaan door branden, gemaakt door de mijnbouw bedrijven zelf. Hierbij moet een verschil worden gemaakt tussen verloren gegaan door verbranding (‘coal burnt’), en verloren gegaan doordat de steenkool niet meer (economisch) winbaar is (‘coal lost’ = verbrande steenkool + niet economisch winbare resterende (gedeeltelijk) onverbrande steenkool). Het is niet onmogelijk dat hier een element van te hoge schattingen in zit (door lokale mijnen om meer fondsen voor bluswerkzaamheden te verkrijgen), wij gaan er echter van uit dat deze cijfers door middel van onderlinge vergelijking en controle redelijk betrouwbaar zijn als basis voor betrouwbare schattingen. Er bevinden zich 37 steenkoolbranden in de provincie Ningxia, 14 hiervan zijn geblust. Als voorbeeld studie wordt het Rujigou steenkool mijngebied gebruikt (het bevat 27 van de 37 steenkoolbrand locaties, waarvan er 12 zijn geblust). De totale hoeveelheid verbrande steenkool (coal burnt) wordt geraamd op 50 Mt (miljoen ton; tot eind 2007, zie Table 10). Naar schatting ongeveer 2 Mt steenkool wordt verbrand per jaar. Als gevolg hiervan wordt jaarlijks tussen de 11.6 and 7 miljoen ton CO2 gegenereerd (resp. met en zonder CH4). Er zijn geen gedetailleerde cijfers per locatie bekend voor Inner Mongolia. De bekende steenkool mijngebieden zijn: Wuda, Gulaben, Zhozi Shan en Er Duo Si. Het zij vermeldt dat Gulaben zich ten westen van Rujigou (provincie Ningxia) bevindt, en in feite de voortzetting van dezelfde synclinale afzetting is. Het Wuda steenkool veld wordt gebruikt als voorbeeldstudie; het vormt het belangrijkste mijngebied met het ernstigste probleem van steenkoolbranden. De totale hoeveelheden voor de hele provincie worden geschat op 64 individuele steenkool branden, over een gebied van 2280 * 10,000 m2 met een verlies (coal burnt) van 4.5 Mt steenkool per jaar. De bovengrens voor jaarlijkse emissie is 20.25 Mt CO2 equivalent (incl. CH4) en de ondergrens is 10 Mt CO2. De steenkoolbranden in Xinjiang hebben 435 Mt verlies aan steenkool per jaar tot gevolg (‘coal lost’;Table 15). Echter, dit is inclusief de niet-winbare steenkool die achterblijft. Naar schatting verbrandt ongeveer 13.5 Mt steenkool per jaar (‘coal burnt’). Het steenkoolbrand

WAB 500102 021 Page 15 of 121
bestrijdingsteam in Xinjiang heeft tot nu toe 8 steenkool brandhaarden gestopt in de laatste 50 jaar, en op dit moment werkt men aan 31 steenkoolbranden. De 13.5 Mt steenkool (‘coal burnt’) per jaar van de branden in Xinjiang veroorzaakt tussen de 67.5 (incl. CH4) en 36 Mt CO2 uitstoot. Het steenkoolbrand bestrijdingsteam in Xinjiang heeft in 1995 een plan gemaakt om alle steenkoolbranden tegen 2015 te beëindigen (en niet 2020 zoals in het vorige plan). De mogelijkheden van automatische detectie van thermale anomalieën in remote sensing data (Hoofdstuk 7). Het algoritme voor automatische detectie van temperatuur anomalieën als gevolg van steenkoolbranden met aardobservatie data bevat twee stappen. De eerste is de automatische afbakening van risico gebieden voor steenkoolbranden met behulp van multi-optische banden. De tweede stap is het automatisch detecteren van temperatuur anomalieën met behulp van de data uit de thermale banden. Het algoritme is ontwikkeld op basis van de bekende steenkool-branden in het Wuda mijngebied. Daarna is het gebruikt om nog onbekende brandhaarden in China en India op te sporen. Hieruit blijkt dat deze methode bruikbaar is met data van Landsat-7, ASTER en MODIS. Nachtelijek opnamen in het thermale gedeelte van het spectrum hebben het beste contrast voor de detectie van temperatuur anomalieën als gevolg van steenkoolbranden ten opzichte van de achtergrond. Het is in principe mogelijk dit algoritme te gebruiken om een wereldwijde inventarisatie van steenkoolbranden te maken (dit is zou echter een zeer omvangrijke taak zijn). Het oppervlakte van een temperatuur anomalie die door het algoritme wordt bepaald kan variëren omdat data van verschillende satellieten, en van verschillende opname tijden, wordt gebruikt. Dit komt omdat de temperatuurs anomalie op het aardoppervlakte varieërt met verschillende omgevings condities. Als de omgevingstemperatuur hoog is, zoals in de zomer en/of overdag, heeft de anomalie een kleinere omvang. Als de omgevingstemperatuur laag is, zoals in de winter en/of in de nacht, vormt dezelfde steenkoolbrand een anomalie van grotere omvang. Meer onderzoek is noodzakelijk om de anomalieën van verschillende omvang en opnametijd te vergelijken. Op dit moment is er nog geen goede methode om de ontwikkeling van steenkoolbranden te kwantificeren met behulp van aardobservatie, maar het is wel mogelijk het bestaan en de relative grootte te bepalen. De conclusie is dat de koppeling tussen fysische modellen van in-situ steenkoolbrand (zoals gepresenteerd in hoofdstuk 3) en monitoring met behulp van aardobservatie nog niet gemaakt kan worden. Schatting van broeikasgas uitstoot (Hoofdstuk 8). China De gedocumenteerde totale hoeveelheid verloren steenkool (‘coal burnt’) in Xinjiang, Ningxia, en Binnen Mongolië is 13.5+2+4.5 = 20 miljoen ton. Dit bedrag wordt aangenomen als bovengrens van de totale jaarlijkse hoeveelheid ongecontroleerde verbranding van steenkool in China, omdat we spreken over een bovengrens met ruime marge, en dit probleem in andere provincies veel geringer in omvang is. In de meest conservatieve schatting (waarin aange-nomen wordt dat iedere ton steenkool 2,7 ton CO2 en 0,1 ton CH4 oplevert) zou dit een jaarlijke uitstoot geven van 100 Mt CO2 equivalent (inclusief methaan) and 54 Mt zonder methaan. Het is erg onwaarschijnlijk dat de bovenlimiet realistisch is, omdat volledige verbranding geen methaan meer zou opleveren, en onvolledige verbranding nog restanten onverbrande steenkool in de grond zou overlaten. Bovendien kunnen we niet geheel uitsluiten dat enige overdrijving heeft plaatsgevonden met het oog op het verkrijgen van overheids subsidie voor bestrijden van de branden. Wij concluderen dat de steenkoolbrand gerelateerde uitstoot in China voor veel minder dan 0,4% bijdraagt aan de jaarlijkse wereldwijde hoeveelheid van alle menslijk veroorzaakte CO2 uitstoot, waarschijnlijk zelfs minder dan 0,1% (5-10 Mt ‘coal burnt’/jaar).

Page 16 of 121 WAB 500102 021
Wereldwijde schatting Helaas bestaan er geen betrouwbare gegevens (of zelfs maar schattingen) voor wereldwijde in-situ verbranding van fossiele brandstof voorkomens. Derhalve is het erg moeilijk om tot een schatting van de broeikasgas uitstoot van deze branden te komen. Echter, uitgaande van de wereldwijde steenkool reserves en steenkoolproductie cijfers, en tevens van de klimaatzones, nemen wij aan dat de wereldwijde uitstoot van CO2 ten gevolge van ongecontroleerde verbranding niet meer kan zijn dan 4 maal de waarschijnlijke uitstoot in China. Deze bovengrens is 100 Mt (192 Mt inclusief mogelijke CH4), wat overeenkomt met 0,4% (0,7% inclusief methaan) van het wereldwijde jaarlijkse menselijk veroorzaakte CO2 budget. Een betrouwbaardere inventarisatie van de wereldwijde uitstoot van CO2 door ongecontroleerde verbranding van fossiele brandstof moet nog ontwikkeld worden, en ligt niet binnen de mogelijkheden qua tijd en beschikbare middelen van dit project. Samenvatting op hoofdlijnen
De meest belangrijke resultaten kunnen als volgt worden samengevat: Wat betreft de methodologie en technische mogelijkheden: • Het gebruik van aardobservatie data voor de directe detectie van CO2 vanuit
puntbronnen, alhoewel theoretisch mogelijk, ligt buiten de huidige technische mogelijk-heden. Het verschil, zowel in signaalsterkte als in ruimtelijk oplossend vermogen (van km2 naar m2), is nog steeds te groot en het wordt niet verwacht dat dit in de nabije toekomst overbrugd zal worden.
• Routinematige detectie van temperatuur anomalieën in risico gebieden voor ontbranding van fossiele brandstofvoorkomens is mogelijk gebleken met operationele satelliet-gegevens, en zou wereldwijd bereikt kunnen worden met voldoende beschikbaarheid van sensoren en dataverwerkingscapaciteit. Tevens is daarvoor de wereldwijde configuratie van steenkoolhoudende sedimentaire bekkens noodzakelijk (plm. 1:500.000 schaal).
• Een kwantitatief verband tussen temperatuurs anomalieën aan de oppervlakte en de hoeveelheid verloren gegane brandstof en gerelateerde CO2 uitstoot kan pas gelegd worden na verder onderzoek aan de thermische modellen van fossiele brandstof en de koppeling hiervan aan aardobservatiegegevens, met beperkte beschikbaarheid van grondverificatie.
Wat betreft kwantificatie met de huidige beschikbare gegevens: • China: Gebaseerd op de gedetailleerde gegevens met betrekking tot verloren gegane
steenkool (“coal burnt”) in de drie provincies van Chian waar dit probleem het ernstigste is, schatten wij een maximum uitstoot van 100 Mt CO2 equivalent (inclusief methaan bijdrage, gesteld op 23x CO2). Dit zou in de orde van 0,1-0,4% van de totale menselijk veroorzaakte jaarlijkse wereldwijde CO2 uitstoot zijn.
• Wereld: Wegens een gebrek aan betrouwbare inventarisatie van spontane branden in fossiele brandstof voorkomens, en daarmee gepaard gaande jaarlijkse verliezen aan brandstof, kunnen we alleen een ruwe schatting maken. Gegeven de verschillende onzekerheden schatten wij de bijdrage hiervan aan de totale jaarlijkse menselijk veroorzaakte CO2 uitstoot in de orde van 0,4-0,7%.
• Verder onderzoek om deze schattingen beter te begrenzen is noodzakelijk om een meer betrouwbare uitkomst te verkrijgen.

WAB 500102 021 Page 17 of 121
1 Introduction
1.1 Scope of the report Fossil fuel deposit fires are an environmental and economic threat and have been researched by numerous investigators from various disciplines (Bylo, 1960; Greene et al., 1969; Lapham et al., 1980; Banerjee, 1982; Bhattacharya and Reddy, 1994; Zhang, 1996; Rosema et al., 1999; Prakash and Gupta, 1999; Zhang, J., et al., 2004; Zhang, X., et al., 2004; Zhang, J., 2004; Zhang J. et al. 2007, Zhang and Kuenzer 2007, Litschke et al., 2005; Lohrer et al., 2005; Wessling et al., 2008; Kuenzer et al., 2005; Kuenzer et al., 2007a/b/c/d; Kuenzer and Stracher, 2008, Kuenzer et al. 2008). In this report we mainly deal with uncontrolled combustion of coal and organic shale deposits. Other hydrocarbon sources are excluded, such as natural gas and oil leakage from underground reservoirs, coalbed methane leakage (Kuenzer et al. 2007a), and submarine gas hydrates (containing both CO2 and CH4). Organic shales are also known to be prone to spontaneous combustion (UK, Middle East, North Africa). A continuum exists from forest fires through peat fires to lignite and coal fires, for example in Kalimantan, Indonesia. Our estimation does not take into account the forest and peat-fires. We refer to a coal fire as a burning or smoldering coal seam or coal waste that has been ignited by spontaneous combustion. Coal fires are reported from China, India, the United States, Australia, Indonesia, Venezuela, South Africa, Russia, Croatia, and other countries. Coal fires can ignite naturally or through human influence, whereas the latter is the cause in most cases of coal fire ignition. Coal ignites though a process called spontaneous combustion. The reaction of carbon in the coal with oxygen in the air is an exothermal process. This means during the reaction of carbon (C) and oxygen (O) to CO2 heat is released. If this heat cannot be released from the inner surfaces of a coal volume the coal can ignite at temperatures as low as 80°C. Conditions, which favor the process of spontaneous combustion are a large coal volume, insufficient ventilation, hot outside temperatures, low coal quality (high volatile content), large outer and inner surface of the coal particles (e.g. through expansion and shrinking in case of repeated wetting and drying) and mining activity. Although paleo-coal fires burning for hundreds of years, and as early as Pleistocene, are known that prove the existence of naturally occurring coal fires, most coal fires existing nowadays are related to mining activities. Mining leads to the exposure of formerly covered coal volumes to the outside air. Mining furthermore leads to the extension of the inner surface of coal volumes and exposes the coal to the anthropogenic risk of accidental ignition through open fire (negligent acts: technical accidents, cigarettes, coal burning for cooking and heating) (Kuenzer, 2005; Zhang, 2004; Rosema et al. 1999; van Genderen and Guan, 1997). Coal fires lead to the loss of the economic resource (coal), uncontrolled land subsidence due to the volume loss underground, the deterioration of vegetation, and most important, the emission of green house-relevant and toxic gasses (see Figure 1 ). Detailed analyses of the environmental impacts of coal fires can be found in Kuenzer and Voigt (2003) and Kuenzer et al. (2007b). This report focuses on green house gasses (GHGs) released by coal fires. Carbon dioxide (CO2) and methane (CH4) are the only gasses released by coal fires that are considered GHGs by the Kyoto Protocol. In this report we concentrate on CO2 emissions, given the fact that CH4 emissions are minor compared to CO2 and CH4 has a limited atmospheric residence time, although its greenhouse effect is 23x1 that of CO2. However in the final estimation, we do include a figure including CH4 as well. Several other detrimental (environmental) effects of natural coal fires are: - useless consumption of a non-renewable energy resource, increase of aerosols in the local atmosphere, coaldust and ashes are usually deposited in the nearby agricultural fields and housing areas, and toxic elements (like As, F, Hg, Se) can contaminate water resources and enter the food chain (Finkelman et al., 2001).
1 In this report a multiplication factor of 23 for methane versus CO2 is used whereas in more recent IPCC
guidelines this factor was reduced to 21.

Page 18 of 121 WAB 500102 021
Numerous authors have addressed the problem of coal fires based on geologic, mineralogical, geophysical and remote sensing based research. While the first research group is mainly interested in the formation of new minerals around coal fire induced cracks and vents and investigates chemical changes of the coal and surrounding bedrock or facilitates bore hole drillings and geologic / geomorphologic mapping to date age, depth and progression of a fire (Lapham et al., 1980; Coates et al., 2005, Masalehdani et al. 2005, Kuenzer and Stracher 2008) the second group employs methods such as gas sample analysis, electromagnetic profile measurements, geophysical modeling, temperature measurements, micro seismic, and geo-electrics to quantitatively analyze, locate and predict the coal fires and their development (Lohrer et al., 2005; Wessling et al. 2008, Litschke et al., 2005). Kuenzer et al. (2005) focussed on coal fires dynamic behaviour based in in-situ repeated mapping of coal fires in China over a course of five years. Remote sensing based coal fire research has mainly focused on coal fire related thermal anomaly detection, the detection of land cover changes in the mining environments, the detection of land surface subsidence due to the volume loss underground and the development of methods for coal fire risk area delineation. Furthermore, in depth thermal analysis, such as sub-pixel thermal mapping, geologic mapping based on emissivity and coal fire quantification were pursued (Ellyett and Fleming, 1974; Fisher and Kuntz, 1968, Greene et al., 1969, Guan, 1989, Knuth et al., 1968, Mansor et al., 1994; Li, 1985, Moxham and Greene, 1967; Prakash and Gupta, 1998; Prakash and Gupta, 1999; Prakash et al. 1995, Saraf et al. 1995, Zhang X. et al. 2004; Zhang 2004, Tetzlaff 2004, Kuenzer et al. 2005, Kuenzer 2005, Kuenzer et al. 2007a, Kuenzer et al. 2007b, Kuenzer et al. 2007c, Kuenzer et al. 2008, Zhang et al. 2007, Zhang and Kuenzer 2007). However, few investigators have published figures on the amounts of green house-relevant gas released through coal fires. Rosema et al. (1993) and van Genderen and Guan (1997) assumed that coal fires in China alone contribute 2% to 3% of all annual human-induced CO2 emissions, whereas Kuenzer et al. (2007) assume that this figure is more on the order of 0.1%. The main goal of this report is to demonstrate the numerous difficulties that have to be overcome on the way to a sound coal fire emission quantification. Firstly a simulation model for combustion is presented, based on recent field- laboratory and modelling work on Kimmeridge oil shales in the UK. Next, we present an inventory for coal fire-related GHG emissions in three provinces of China where this problem is the most urgent. Furthermore we describe a method that is suitable for estimating coal fire-related emissions on local and regional scale based on remote sensing data, and comment on (future) satellite options.
Figure 1 Strong gas emission through sinkhole above a subsurface coal fire (left) and coal fire induced bedrock collapse (right), both in Wuda, Inner Mongolia, China.
1.2 Relation to Kyoto protocol and CDM It is widely known that fossil fuel deposit fires release CO2 and CH4, as well as harmful and toxic gasses, such as SO2, NOX, and, in smaller amounts, CO and N2O. Especially, the release of CO2 and CH4 is worth investigating, because these gasses are known to contribute to global warming and are the only coal fire-emitted gasses considered as GHGs by the Kyoto Protocol (Goudie and Cuff, 2002; Rosenqvist et al. 2003; Wagner, 2004). The quantitative findings of

WAB 500102 021 Page 19 of 121
fossil fuel deposit fire-related emissions can be a basis for certified emissions trading under the framework of the Kyoto Protocol and similar protocols to follow. According to the Kyoto Protocol, GHGs are CO2, CH4, perfluorocarbons, hydrofluorocarbons, and sulphur hexafluoride. Only the first two are emitted from fossil fuel deposit fires (Litschke et al., 2005); thus, only those are discussed here. The aim of the Kyoto Protocol is to improve the overall flexibility and economic efficiency of making emission cuts. It introduced three mechanisms for emissions reduction, which are presented in detail in Rosenqvist et al. (2003). One of those mechanisms is the limited trading system ‘clean development mechanism’ (CDM), a mechanism whereby non-Annex I parties (non-industrialized countries) can create ‘certified emission reductions’ (CERs) through developing projects that reduce the net emissions of GHGs. Annex I parties (governments as well as private entities) can assist in financing these projects and purchase the resulting credits as a means to achieve compliance with their own reduction commitments. Thereby, a CER is a unit of GHG reduction that has been generated and certified under the provisions of the Kyoto Protocol for the CDM. Credits adhering to the guidelines of CDM have been generated and are bankable since 2000. For the CDM, it is especially important to determine the level of emissions that would have occurred without the investment. Only then can proper credit be given for the difference between the (lower) actual emissions and the baseline level that would have occurred otherwise (Rosenqvist et al. 2003, Wagner, 2004, Kuenzer, 2007b). Large energy companies are investigating the potential to extinguish the large number of coal fires burning in northeastern India, and west and north-central China. However, to date, no coal fire-related emission trading agreement is known to have been signed anywhere in the world. Requirement to obtain CDM certificates is a baseline level definition for coal fire-related GHG emission, which has yet to be established. It needs to be known how much CO2 equivalent a certain coal fire releases to the atmosphere over a certain amount of time. Based on such a baseline a company can get the proper credits for extinguishing this fire. Such baselines are a pressing need, especially in China. The country is the largest market worldwide concerning emission trade under the CDM, and more than 170 Kyoto-based CDM contracts had been signed in other fields of industry by the end of 2006 (URL1, URL2, Kuenzer 2007b).
1.3 Challenges for coal fire related emission quantification The three major parameters for coal fire quantification are the amount of coal burning [tons of coal], the amount of energy released [mega-watts], and the amount of GHGs emitted [tons of CO2] (Figure 2). From a very simplified perspective, one could come to the conclusion that, at first sight, the solution seems easy. Either one measures green house-relevant emissions directly or one retrieves the amount indirectly via the other quantities. If the amount of coal burning in a coal fire is known, it is possible to calculate how much gas is emitted. Another option is if the amount of energy released by a fire is known, one knows the amount of subsurface coal that is burning. However, for these indirect methods of gas emission estimation, two transfer functions (relationships) would have to be established: • A transfer function between the amount of burning coal and the amount of emitted GHGs. • A transfer function between coal fire energy release and the amount of burning coal (again
the first transfer function is needed; thus, this pathway contains more uncertainty).

Page 20 of 121 WAB 500102 021
Table 1 Difficulties for direct in situ measurements of the three quantitative coal fire parameters: amount of burning coal, amount of energy release, amount of emitted gasses.
Amount of burning coal Direct measurements of burning coal: - Not possible, because the coal burns
underground. >> Only approximation via a 3D model possible,
hence importance of modelling. Amount of energy release For in situ temperature- and calorimetric
measurements in a dense grid it needs it be considered that: - To define energy release of a coal fire zone on
the surface, the underground coal fire outline on the surface needs to be known (available in situ mapping result).
- Energy release undergoes strong fluctuations. - Similar burning volumes of coal might lead to
different energy release depending on overlying bedrock characteristics and crack systems.
- It is not possible to map a whole coal fire area (regional scale) of several km² in this way (too costly and time consuming)
>> Thermal remote sensing as an option
Amount of emitted gasses In situ gas measurements in a dense grid: - Gas emissions undergo strong fluctuations - Gas is emitted through cracks and vents but
also permeates through the overburden (normal rock/soil).
- It is not possible to measure emitted gas in a whole coal fire area (regional scale) of several km² in this way (too costly and time consuming)
>> Constrain for a small representative coal fire are and extrapolate.
>> CO2 detection by hyperspectral analysis of remote sensing data is beyond the present spectral and spatial resolution.
Figure 2 Relationship between the three major quantitative coal fire parameters: amount of burning coal,
amount of gasses emitted, and amount of energy released (Kuenzer et al. 2007d)

WAB 500102 021 Page 21 of 121
Under laboratory conditions, it is possible to measure gas emission quantitatively from a small volume of burning coal. However, this is not possible under realistic in situ conditions in a coal fire area. The technical difficulties of measuring the three quantities in situ are presented in Table 1 and Figure 3.
Figure 3 Complex system of a shallow subsurface coal fire. Numerous influences in a near chaotic
system hamper the quantification of burned coal and related gaseous emissions. (Kuenzer et al. 2007d)
1.3.1 Difficult to approach and measure Coal fires occur underground. Thus, it is only possible to assess the fire’s characteristics indirectly through surface temperature mapping, gas emission measurements, interpretation of mine works information and geological maps, borehole analyses, analyses of minerals or pyrometamorphic rocks, and further related activities. This approximation of GHG release via one of the three parameters is only possible with detailed geologic data, time consuming and costly field surveys, and very detailed knowledge of the coal fire zone through in situ mapping.
1.3.2 Variability in degree of combustion The coal in coal fires does not burn completely; incomplete combustion occurs. If coal combusts completely in a coal-fired power plant, 1 ton of high-rank coal (ie, 1 ton of coal with 80% carbon content) will lead to the emission of 2.5 tons of CO2. This number can be derived from the simple equation that CO2 has a weight of 44 g/mol. Carbon (C) has 12 g/mol. Thus, 1 gram of

Page 22 of 121 WAB 500102 021
pure carbon leads to the release of 3.666 grams of CO2. However, in a coal fire, the degree of combustion, which can be described quantitatively as the relationship of emitted CO to CO2, depends on numerous factors. These factors undergo daily changes. The degree of combustion depends on the type of coal, volatile matter, coal rank, layering density, and impurities influencing the calorific value of the coal. Heterogeneities in the layering of the coal can decrease the degree of combustion. Weather conditions, such as wind and moisture, also play a role. Overall, the ventilation of coal (oxygen supply) is the most crucial factor influencing the speed of the combustion process (see Figure 3). Additionally, natural coal fires often occur in complex environments. Frequently, large masses of bedrock and coal waste are moved around. Seams are exposed and covered again. Fire-induced volume loss underground leads to cracks and fractures in the overlying strata and land subsidence. The latter accelerates the underground fires through increased oxygen supply (see Figure 3). Each coal fire burns at different intensity and speed; some reach internal temperatures above 1200°C, whereas others smolder at much lower temperatures. Some fires consume all available energy supply (coal) within a short period of time, whereas other fires burn for decades or even centuries. The fire progression rate has been observed to range between less than 10 and up to 100 meters per year, which is in accordance with modelling results (Wessling et al., 2008). Thus, internal and external factors lead to strong variations in the combustion process.
1.3.3 Surface temperature patterns and coal fire-related energy release Energy release is difficult to measure in situ, especially for a larger area (see Table 1). However, thermal remote sensing data can be utilized, as for example by Tetzlaff (2004), to derive coal fire-related energy release based on a linear relationship between the spectral radiance observed at the thermal satellite sensor and in situ energy release (see Figure 4). This linear relationship was derived based on mathematical scenarios of varying fire size and temperatures for fires less than 600°K and not exceeding 1000 m² in size. The related algorithm can estimate the energy release of a predefined area within remote sensing data. This means that coal fire outlines must be known to calculate energy release. However, in many regions, detailed coal fire outlines derived from in situ mapping are not available. Furthermore, energy release can vary daily, based on different weather conditions, and, especially, changes in ventilation through new cracks and vents.
Figure 4 Coal fire related energy release. Left: thermal Landsat-7 ETM+ summer nighttime image from
2002. Right: Energy release in MW for the individual coal fires as mapped in situ (red fire outlines overlain on thermal satellite data (left). Polygons, defining an area, need to be available so that the algorithm can calculate a fire’s energy release. The subset is facing up (north) and shows 20 * 20 km. It represents the Wuda coal mining syncline, Inner Mongolia, China. From Tetzlaff (2004).
Additionally, the depth of the fire strongly influences the thermal (energy release) pattern on the surface. For deeper fires, heat transported by conduction, which is a relatively slow heat transfer mechanism, plays a bigger role. Thus, a thermal anomaly might not be visible at the

WAB 500102 021 Page 23 of 121
surface. Convection, which is a fast heat transfer mechanism, plays a bigger role for shallow, subsurface fires. Thus, a deep fire might lead to a weaker signal than a shallow fire, even though the amount of coal burning underneath might be equal. Furthermore, some of the heat released from the fires (shallow or deep) will never reach the surface; it is transferred into the surrounding rock layers (also downward). Thus, remote sensing-derived energy release is likely to underestimate the true energy release.
1.3.4 The challenge of timely predictions If a private company extinguishes a coal fire, theoretically it would get emission certificates for the amount of CO2 that the fire would have released, for the duration of the CDM contract agreement, if it had not been extinguished. However, it is a very challenging task to predict how long a coal fire will burn. So it is hard to specify, for example, if the company would get emission reduction certificates for 5 years or only for 2 years. Furthermore, natural spontaneous extinction of coal fires has been reported and is not yet understood. Currently, it is being discussed that contract periods will be as long as preceded monitoring activities to grant an understanding of the fire. For example a monitoring period of 4 years, and quantifications derived thereof, would lead to a 4-year CDM contract. The challenge here is that coal fires undergo nearly unpredictable changes over time.
1.3.5 The challenge of extrapolation to other areas Even if one can quantify the emissions of one local coal fire area, for example in China, it is difficult to extrapolate these results to a whole country without entering the blurred zone of what can still be considered scientifically reasonable. Coal fires between different countries, for example India and China, vary even more significantly due to their geological setting (coal quality, deposit type and configuration), the local climate and mining methods. The mining engineers, fire fighters, and coal mining administrators who live and work in these regions daily are the persons who probably can best determine how much coal is burning in a fire. However, one has to be cautious for overestimation of the burning volume where financial support for coal fire extinction is provided by the government.
1.3.6 Difference in estimated CO2 emission from coal fires According to Rosema et al. (1993), it is estimated that coal fires in China alone account for 2% to 3% of all human-induced CO2 emissions globally. This figure was based on a reported annual loss of coal in China of between 100 and 200 million tonnes without specification (also no differentiation was made between combusted coal and coal that could not be mined anymore in fire-affected areas). This rough figure was subsequently copied, spread, and repeated by numerous investigators in scientific papers (eg, van Genderen and Guan, 1997; Huang et al., 2001), and it was quoted over and over again in international media. By now it seems to be an accepted fact that this number exists, although the source of the estimation and the theoretical background for the calculation of this number were never laid out in a published paper. Cassels (1997) already arrived at the conclusion that the coal loss and related CO2 emission were overestimates. Based on the coal loss of 140 to 1400 tonnes/year for a typical fire in a well-studied location there would have to be 1 million to 100,000 fires to achieve an annual loss of 140 million tonnes in China, which is obviously not the case. He does not give a new estimation, but a more realistic number of 1000 to 10,000 fires would lead to between 0.14 and 14 million tonnes/year loss in China, amounting to max. 0.25% of CO2 emission. Other investigators estimated that CO2 emissions released by coal fires in China add up to around 0.1% to 0.2% of all human-induced CO2 emissions (Kuenzer et al., 2007). This number sounds small; however, taking into consideration that 0.1% is still one thousandth of all human-related CO2 emissions, it is still a significant quantity. Thus, it can be stated that coal fires contribute to global warming by emitting CO2 and other GHG’s. Which number is scientifically closer to reality is still open to debate, and this report aims to give a better underpinned estimation.

Page 24 of 121 WAB 500102 021
Overestimation of coal fire related CO2 emission could be tempting because it can lead to extra benefits (both financial and reputation-wise) for both the ‘investing’ (CDM trading) country as well as the receiving country (where emission takes place and is reduced). Together with the wide range of estimations as quoted above, and the constant attention in the media on this subject (see Annex 1: Media attention to coal fire problem), this needs to be taken into account when extrapolating emission quantities. Furthermore, a tight system of auditing including base-line assessment and reduction quantification is very difficult to realize given the erratic and dynamic nature of uncontrolled coal seam fires. These subjective interrelationships are listed in Table 2 Interrelationships of public, political and economic pressures with regard to low or high estimates
of coal fire related GHG emission. Low GHG emission: High GHG emission: Public attention Less More Research funding money Difficult to obtain Easier to obtain Probability of incorrect estimation
Low Higher
Political consequence in investing country (‘Annex I countries’)
Low economic benefit and probably limited interest to pursue CDM activities
High economic benefit for single companies, strong interest to pursue CDM related activities, technology transfer means additional economic benefit
Political consequence in country of emission origin
Probably none. However, the country could emphasize that the fire problem is limited
Competition might occur. Country with emissions might be able to choose CDM partner. Networking.
Economic consequence in investing country (‘Annex I countries’)
Receives no carbon credit certificates, therefore less extra output ‘at home’ possible
Receives more carbon credit certificates, therefore more extra output ‘at home’ becomes possible
Economic consequence in country of emission origin
Need to minimize their own emissions (if capable), less transfer of technology, know how and ideas from abroad
Large international projects lead to transfer of technology, know how, and ideas from abroad

WAB 500102 021 Page 25 of 121
2 Previous Research
2.1 Borehole methods Temperature measurement within boreholes in coal fire suspected regions are the prime in-situ method to identify coal fires. Though these measurements (temperature and depth) can be very accurate, they are quite labour intensive, and cannot be used to detect unknown and/or inaccessible occurrences. However, in order to study the behaviour in detail and construct a 3D coal fire model borehole data can provide important information. Usually, the local coal fire fighting teams in coal fire areas around the world set up a more or less dense network of boreholes, frequently measuring temperature and moisture content. For example, in the coal fire area of Wuda, China, about 10 boreholes were drilled with the purpose of regular monitoring as well as for the location of the coal fire’s ‘center’. However, for larger studies the following aspects hinder borehole drilling: Usually coal fire areas are difficult to access and it is in many cases impossible to bring drilling trucks and equipment in. Furthermore, in countries such as India or China the monetary sources for such activities are limited. Depending on the area (e.g. arid environments with frequent sandstorms, surface bedrock layers with strong movement, and cracking etc. due to the volume loss underground) boreholes can easily get clogged or even collapse. 2.2 Geophysical methods Geophysical methods are being used for local coal fire detection and monitoring. However, these methods are line- or point-based measurements and errors are to be expected during their interpolation, given the fact that coal fires have very irregular shapes. The geophysical investigations that are most often used are the electric and electromagnetic (EM) methods. An example is the resistivity method. The resistance of rock is calculated by using electrodes, measuring the resistance in ohms (Ω) per metre, and comparing these with the standard value. Under normal conditions, the resistance of sedimentary rock is 600 to 800 Ω m-1, but in burnt rock it increases to 1200 to 3000 Ω m-1, because of high porosity, cracks, and low water content. The radioactive method is based on the fact that sedimentary rocks contain radioactive elements, such as uranium (235U92, 238U92) and thorium (232Th90). These radioactive elements emit α particles during decay. During this process, they are transformed into radon 222Rn86, 220Rn86, 219Rn86), which has a half-life of 3.96 seconds to 3.825 days. The concentration of α particles depends on the temperature (i.e., if the temperature is higher, then the transportation of α particles is also higher). Pressure, porosity, and water content also influence the amount of particles. Several other methods can be used, like ground penetrating radar. For all ground-based methods the inaccessibility of active coal fire areas is a major problem. Paleo coal fire areas can be investigated with the same methods in order to detect underground cavities and/or changes in electromagnetic properties of the burnt rock. In addition, paleomagnetism can be used to detect any deviation for the normal paleomagnetic rock record due to heating above the Curie temperature. Zhang and Kuenzer (2007) and Zhang et al. (2007) presented the results of extensive temperature measurements on simulated uncovered and covered coal fires s well as from in-situ locations. Temperature measurements were performed during diurnal cycles (covering the 24 hour period) from all directions, and at different fire depths (fire center, intermediate locations, fire surface).
Page 26 of 121 WAB 500102 021
2.3 Inventory of the global scope of fossil fuel fires by remote sensing Remote sensing based coal fire study first started in the 60’s and till date several air and satellite borne thermal sensors are developed and being developed that improve the potential of coal fire detection and monitoring. In the following paragraphs remote sensing based coal fire research is reviewed by continent. The United States was the first country to apply remote sensing to coal fire detection. Using the ‘Reconofax’ thermal scanner on an airborne platform, Slavecki (1964), Fisher and Knuth (1968), and Greene et al. (1969) studied fires on waste coal and subsurface coal fires in the state of Pennsylvania, where the issue of coal fires remains a serious problem. Greene et al. also studied the depth of fire, and they classified fires into three types according to their depth: shallow fires (≤10 m deep), intermediate fires (10–30 m deep), and deep fires (>30 m deep). Currently, the focus of coal fire research in the US is on airborne studies again – especially in the states of Colorado, Wyoming and Pennsylvania. Alone in Colorado over 50 coal fires in improperly sealed mines are known, which were mapped in early 2008 with a thermal camera from a helicopter (personal communication with coal fire expert Steven Renner). In the Asia and Pacific region, China, India and Australia are most affected by coal fires. Australia: Although Burning Mountain in Australia has been known for a long time, the first recorded observation was in 1828 after its discovery by a local farmer. A notable study was produced by Fleming (1972), which suggested that the fires could have been burning since the Pleistocene. Later, Ellyett and Fleming (1974) did an extensive study using a Daedalus thermal airborne scanner that operates in the 8-μm to 14-μm region. Today, that fire is more than 152 metres underground, and is still burning the coal slowly. Fires also occur spontaneously in opencast coal mines in many locations, such as Hunter Valley (New South Wales) and the lignite mines in Victoria and South Australia (Williams, D.J., 2005: personal communication). Indonesia: Slash and burn (forest clearing by fire) is a popular and easy method by which to claim cultivation land from forests in Kalimantan (Borneo) of Indonesia; these fires sometimes burn out of control and ignite the coal and lignite seams that are exposed nearby. These fires can be very difficult to extinguish because they often start in the peat layer. In the same area, Tetuko et al. (2003) studied the burnt coal seams in order to estimate the thickness of the fire scar using synthetic aperture radar. A recent study by Whitehouse and Mulyana (2004) estimated that between 760 and 3000 coal fires are currently burning in east Kalimantan. In eastern India, the two main coalfields, Raniganj and Jharia are severely affected by coal fires. Several researchers studied these areas for different aspects of coal fires based on air and satellite sensors. In 1991, Bhattacharya et al. used airborne predawn thermal infrared and daytime multispectral images to distinguish the coal fires from the background. Another attempt to detect the coal fire was made by Mukherjee et al. (1991), using predawn airborne thermal data. They also attempted to estimate the depth of the fire using a linear heat flow equation. Cracknell and Mansor (1992) first used Landsat-5 TM and NOAA-9 AVHRR data, and found that nighttime NOAA data were quite useful to isolate the warm areas from the background. Reddy et al. (1993) used the short-wave infrared (SWIR) region of the EMS, which is covered by Landsat TM bands 4, 5, and 7. Using Landsat TM bands 6 and 7, Saraf et al. (1995) established a relation between high-temperature events and surface fires. Later, Prakash et al. (1997) used the Landsat TM TIR and SWIR bands to identify surface and subsurface fires separately. Based on a dual-band approach using TM data, Prakash and Gupta (1999) attempted to calculate the area of surface fires. Based on Landsat 5 thermal data and local knowledge, the coal fire areas were identified in the Raniganj coal belt (Gangopadhyay et al., 2006). Since 2000 emphasis was especially put on the development of automated methods to delineate coal fire risk areas, extract coal fire related thermal anomalies and quantify these thermal anomalies (Kuenzer, 2005, Zhang, 2004, Tetzlaff, 2004). These approaches were aiming at transferrable investigations methods for the country-wide and global scale and have also been applied to data from the Jharia region. Furthermore, after the failure of Landsat 7 ETM+ progress was made in the field of low resolution thermal sensors (MODIS), which’ observations are, however, available multiple times per day. Kuenzer et al. (2008) presented
WAB 500102 021 Page 27 of 121
the potential of multi-diurnal MODIS thermal bands data for coal fire detection in study areas of India and China. Coal fires in China originate at the outcrop of coal in the surface and underground, and have natural and manmade origins. Since 1986, several researchers have worked on coal fires in Xinjiang and Ningxia Hui regions. In 1991, Huang et al. studied the extent of coal fires using Daedalus data, and presented an alarming picture of Chinese coal fires. In 1995, Yang identified several coal fires in these areas using predawn airborne thermal scanner data. Later, Wan and Zhang (1996) carried out a detailed study in the same area. They used daytime Landsat TM band 6 data to estimate the relative amount of solar illumination during the overpass time, which was used to correct the effects of terrain. To detect smaller coal fires from Landsat 5 thermal band data (spatial resolution 120 m), Zhang et al. (1997) used a sub-pixel temperature estimation method. Cassels (1998) attempted to model an underground coal fire in the Kelazha area of northern China with input from a three-dimensional geological model. By analyzing the SWIR spectra of rocks, Zhang (1996) identified the burnt rocks, which are also an indication for coal fire. In 1997, Wang (2002) identified areas that were affected by coal fires with ASTER and Landsat TM data in Xinxiang province. There are several remote sensing and GIS based studies that are focused on better management of coal fires (Prakash and Vekerdy, 2004; Prakash et al., 2001, 2004). In the Wuda mining region, in Inner Mongolia, an extensive study was done on coal fire appearance, dynamics, and related emissions using multispectral thermal and hyperspectral remote sensing data (Kuenzer and Voigt 2003, Kuenzer et al. 2005, Kuenzer et al. 2007a, Kuenzer et al. 2007b, Kuenzer et al. 2007c, Gangopadhyay et al., 2005, 2008). In the same area Zhang (2004) proposed a statistical model that is capable of automated detection of coal fire with the inputs from thermal remote sensing images. His findings were based on detailed in-situ survey (Zhang, J., and Kuenzer 2007) and further investigations on simulated coal fires (Zhang, J. et al. 2007). Based on multispectral data Kuenzer (2005) developed a method to delineate coal fire risk areas in large satellite data sets, to exclude ‘false alarms’, meaning ‘hot spots’ or thermal anomalies, which are most likely not coal fire related (like industry, urban areas etc.) There are some reports (journals, newspapers and periodicals) of coal fires in Europe, Africa and South America. However, there are no peer reviewed articles available that report the use of remote sensing to identify or monitor coal fires in these places. It should be mentioned that in coal fire remote sensing many challenges exist and hamper the derivation of quantitative statements, the generation of highly accurate maps and the general acceptance of remote sensing derived results in this research field. The main challenges are the following: • Surface observation of an underground phenomenon • In-situ ‘ground truth’ mapping does not represent real ground truth • Dependency of coal fire heat emission on numerous parameters • Very dynamic changes of parameters, e.g. cracks and collapse occurring in a matter of
seconds/minutes. • Human influence, esp. coal fire mitigation measures: covering fires, excavating fires, that
should not be taken for ‘natural’ effects. • Timely variation of coal fire related heat emission • Scarceness of additional data in coal fire areas (false alarm removal) • In-situ quantification nearly impossible (no ground truth) • Number of thermal satellite sensors very limited • Limited spatial resolution of thermal sensors • Insufficient linkage between geological / geophysical and remote sensing scientists • Small thermal remote sensing community • Even smaller coal fire remote sensing community First of all the major problem of coal fires is that we are talking about a phenomenon happening mainly sub-surface underground. For e.g. forest fire assessment a helicopter can fly over the burning / burned area, take photograph and the outline of the (formerly) burning area is quite clear. With coal fires this is completely different. Even if good remote sensing data, mine plans,
Page 28 of 121 WAB 500102 021
local maps and the expert knowledge of the local people is available: the exact extent of the underground coal fire will remain unknown. Therefore, even annual ground truth mapping derived with tedious time-consuming field campaigns as undertaken by Zhang (2004), Kuenzer (2005) and Kuenzer et al. (2005) cannot yield coal fire maps that can be considered ‘real’ ground truth, such as existing for land cover mapping. Of major influence is furthermore the fact that coal fire related heat emission depends on and is influenced by many factors. Such are for example the existence of pathways for oxygen to funnel the fire. A single cracking in the bedrock surface can speed up a slowly smoldering fire to an aggressively burning one – hence, the fire’s intensity can change within a day or week due to a single event. A further important parameter is wind. Depending on the orientation of the wind and the cracks, strong wind can act like a cover on the fractures releasing the hot gasses. During strong wind the emission of hot gas is therefore ‘suppressed’ and a coal fire related crack might emit e.g. only 60°C. As soon as the wind stops emitted gasses suddenly show a temperature of 300°C. Alternatively, favorable orientation of wind and cracks can boost the throughput of oxygen and subsequent heat release. These strong timely fluctuations on a partially daily basis make it very difficult to derive statements about the intensity and size of a coal fire. Only based on the experience of numerous mapping campaigns can we derive vague statements on the fire’s intensity, its spatial extent and its trend of development (growing, stagnant, shrinking). Remote sensing based coal fire research would profit from the availability of new thermal sensors, which are currently very limited in number. In May 2003 the ‘working horse’ of most remote sensing coal fire scientists, Landsat-7 ETM+ with 60 m x 60 m spatial resolution in the TIR failed. The only thermal sensors currently available are ASTER with a 90 m spatial resolution and only limited data availability, MODIS, with a 1 km resolution in its thermal bands, and experimental satellites such as the Brazilian-Chinese satellite CBERS, whose data quality remains questionable. The development of new thermal sensors, such as the envisaged TET, to be launched by the German Aerospace Agency, DLR in 2010/2011 is a good prospect for coal fire research.
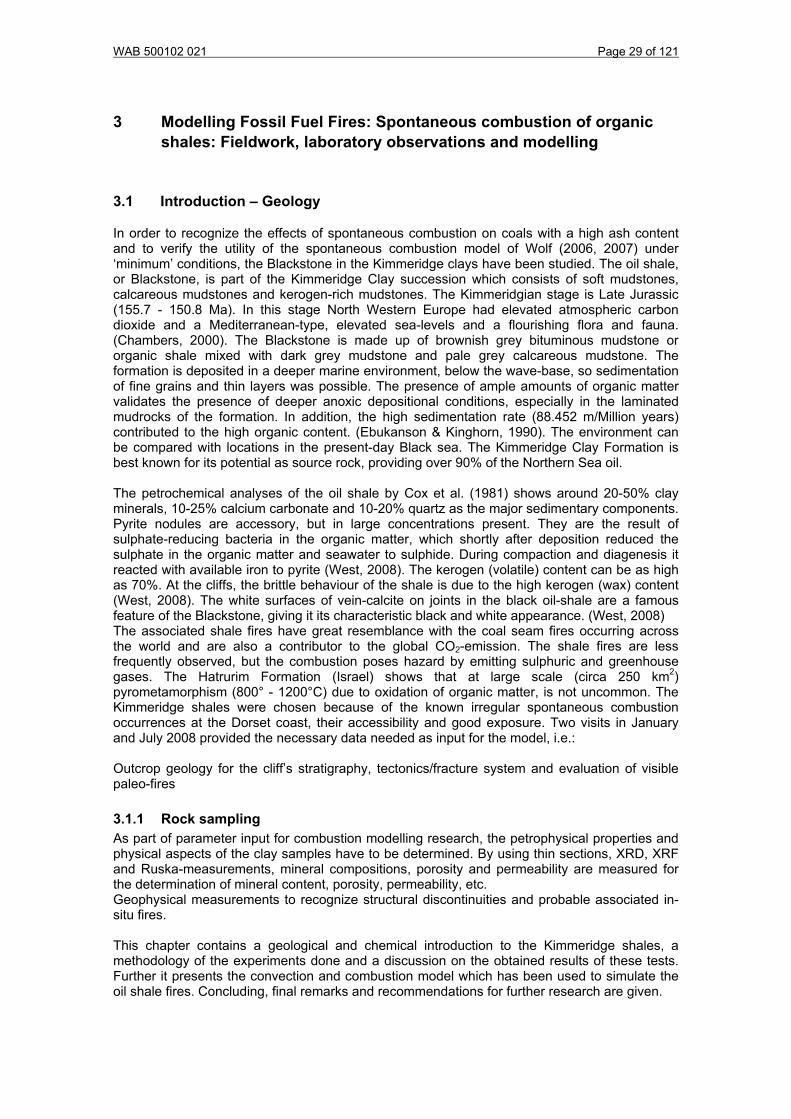
WAB 500102 021 Page 29 of 121
3 Modelling Fossil Fuel Fires: Spontaneous combustion of organic shales: Fieldwork, laboratory observations and modelling
3.1 Introduction – Geology
In order to recognize the effects of spontaneous combustion on coals with a high ash content and to verify the utility of the spontaneous combustion model of Wolf (2006, 2007) under ‘minimum’ conditions, the Blackstone in the Kimmeridge clays have been studied. The oil shale, or Blackstone, is part of the Kimmeridge Clay succession which consists of soft mudstones, calcareous mudstones and kerogen-rich mudstones. The Kimmeridgian stage is Late Jurassic (155.7 - 150.8 Ma). In this stage North Western Europe had elevated atmospheric carbon dioxide and a Mediterranean-type, elevated sea-levels and a flourishing flora and fauna. (Chambers, 2000). The Blackstone is made up of brownish grey bituminous mudstone or organic shale mixed with dark grey mudstone and pale grey calcareous mudstone. The formation is deposited in a deeper marine environment, below the wave-base, so sedimentation of fine grains and thin layers was possible. The presence of ample amounts of organic matter validates the presence of deeper anoxic depositional conditions, especially in the laminated mudrocks of the formation. In addition, the high sedimentation rate (88.452 m/Million years) contributed to the high organic content. (Ebukanson & Kinghorn, 1990). The environment can be compared with locations in the present-day Black sea. The Kimmeridge Clay Formation is best known for its potential as source rock, providing over 90% of the Northern Sea oil. The petrochemical analyses of the oil shale by Cox et al. (1981) shows around 20-50% clay minerals, 10-25% calcium carbonate and 10-20% quartz as the major sedimentary components. Pyrite nodules are accessory, but in large concentrations present. They are the result of sulphate-reducing bacteria in the organic matter, which shortly after deposition reduced the sulphate in the organic matter and seawater to sulphide. During compaction and diagenesis it reacted with available iron to pyrite (West, 2008). The kerogen (volatile) content can be as high as 70%. At the cliffs, the brittle behaviour of the shale is due to the high kerogen (wax) content (West, 2008). The white surfaces of vein-calcite on joints in the black oil-shale are a famous feature of the Blackstone, giving it its characteristic black and white appearance. (West, 2008) The associated shale fires have great resemblance with the coal seam fires occurring across the world and are also a contributor to the global CO2-emission. The shale fires are less frequently observed, but the combustion poses hazard by emitting sulphuric and greenhouse gases. The Hatrurim Formation (Israel) shows that at large scale (circa 250 km2) pyrometamorphism (800° - 1200°C) due to oxidation of organic matter, is not uncommon. The Kimmeridge shales were chosen because of the known irregular spontaneous combustion occurrences at the Dorset coast, their accessibility and good exposure. Two visits in January and July 2008 provided the necessary data needed as input for the model, i.e.: Outcrop geology for the cliff’s stratigraphy, tectonics/fracture system and evaluation of visible paleo-fires 3.1.1 Rock sampling As part of parameter input for combustion modelling research, the petrophysical properties and physical aspects of the clay samples have to be determined. By using thin sections, XRD, XRF and Ruska-measurements, mineral compositions, porosity and permeability are measured for the determination of mineral content, porosity, permeability, etc. Geophysical measurements to recognize structural discontinuities and probable associated in-situ fires. This chapter contains a geological and chemical introduction to the Kimmeridge shales, a methodology of the experiments done and a discussion on the obtained results of these tests. Further it presents the convection and combustion model which has been used to simulate the oil shale fires. Concluding, final remarks and recommendations for further research are given.

WAB 500102 021 Page 30 of 121
Figure 5 A: Location map. B: View of the cliff from Kimmeridge bay to St’ Aldhelms head.
3.2 Field data and literature The Dorset coast of England shows large outcrops of the Kimmeridge shale; a heavy bituminous clay-shale. This oil shale has attracted people’s interest for a long time, first as a fuel for local cottages and later on as an oil source and for shale fires. These fires occur naturally due to spontaneous oxidation and are reported to be burning for weeks or months as an exothermal reaction. The target site was ‘Burning Cliff’, 2 km east of Kimmeridge, where a large fire has been observed in 1973 ( Figure 5). Cole (1975) stated that oxidation of pyrite, which is available in abundance, ignited the shale. Further, the scree and certain parts of the cliff had temperatures over 500° C, with red heat radiation at about 0.5 m below the surface. XRD-results showed that the original claystone consist of illite, kaolinite, some quartz, calcite and some pyrite (6 - 9% sulphur). During the combustion the fumaroles were covered with sulphur crystals, black tarry oil, sal-ammoniac and gypsum/basanite. It produced mostly CO2, SOx and water vapour. The burnt red-baked claystone consists of illite, quartz and calcite, and some hematite.

WAB 500102 021 Page 31 of 121
Figure 6 A and B: Details of Burnt Cliff
Figure 6A and B show the cliff and details of the fire zone. The outcrop is situated about 6 to 8 meters below the top of the cliff and the estimated thermal zone is about 3 to 6 meters in height. B shows on the left side the relics of a vent or fumarole. No traces were found of the high temperature products mentioned by Cole (1975). Erosion over the past decades also removed a part of the original fire spot. Hence, depth of the original fire cannot be traced on this site. In addition, little evidence is found on the platform; burnt pieces are washed away by the tide. However, a burning trial near Kimmeridge bay at the platform shows thermal effects to depths over 1 meter. The envelope of thermally treated zone was clearly visible showing a lateral continuation of about 18 to 22 meters. For combustion, abundant oxygen supply to the rock face is essential. Fracture density and fracture width are therefore essential: • Faults, as being potential vents and chimneys for air inlet and fumaroles (Figure 5 B, Figure
7 A). They are unevenly distributed along the cliff. Usually they are filled with gauge and secondary carbonates. In most cases they look tight sealed, though, they are also the cause for major morphological instabilities (i.e. slides). Figure 5.3.A. shows rectangular and hexagonal fracture patterns, with a frac distance up to about 50 cm in the limestone richer parts. The fractures are comparable with the relaxation patterns, as found on the Whitby coastal platform (Northumbria-England) in comparable organic shales. It is suggested that they are created by up-lift and stress-relief after glacial period.
• Fracture systems, also for connection with the surface and for increase of the reaction the surface (Figure 7 B). The clay rich zones show sub-parallel fracture vertical patterns with a density < ca. 20 cm. It is not clear whether these fractures caused by surface erosion or by
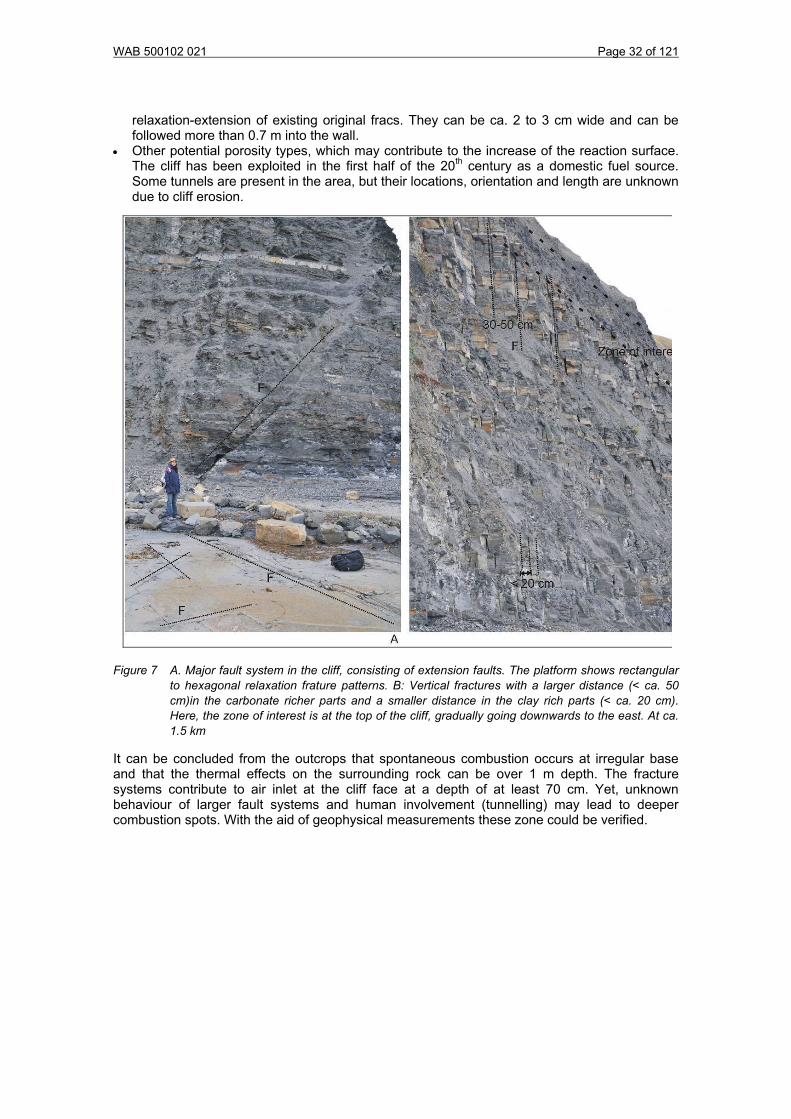
WAB 500102 021 Page 32 of 121
relaxation-extension of existing original fracs. They can be ca. 2 to 3 cm wide and can be followed more than 0.7 m into the wall.
• Other potential porosity types, which may contribute to the increase of the reaction surface. The cliff has been exploited in the first half of the 20th century as a domestic fuel source. Some tunnels are present in the area, but their locations, orientation and length are unknown due to cliff erosion.
Figure 7 A. Major fault system in the cliff, consisting of extension faults. The platform shows rectangular
to hexagonal relaxation frature patterns. B: Vertical fractures with a larger distance (< ca. 50 cm)in the carbonate richer parts and a smaller distance in the clay rich parts (< ca. 20 cm). Here, the zone of interest is at the top of the cliff, gradually going downwards to the east. At ca. 1.5 km
It can be concluded from the outcrops that spontaneous combustion occurs at irregular base and that the thermal effects on the surrounding rock can be over 1 m depth. The fracture systems contribute to air inlet at the cliff face at a depth of at least 70 cm. Yet, unknown behaviour of larger fault systems and human involvement (tunnelling) may lead to deeper combustion spots. With the aid of geophysical measurements these zone could be verified.

WAB 500102 021 Page 33 of 121
3.3 Geophysical exploration
Figure 8 Location of the geophysical lines for Induced Resistivity (red) and TDEM (blue) measurements,
starting ca. 20 m from the cliff head.
3.3.1 Methods The Kimmeridge clays and carbonate richer interstrata consist mostly of low resistivity rock (< ca 75 Ωm). The thin limestone bands are higher resistivity zones (> ca 100 Ωm). A combusted zone consists of pyrometamorpically altered rock. Wolf (2006) describes in comparable Carboniferous rocks that from 690 °C up clay minerals such as kaolinite disintegrate. At higher temperatures, up to about 970 °C, montorillonites and illite follow. The baked rock has very high resistivity characteristics (> ca 1000 Ωm) and should give a sharp contrast with surrounding clays. In addition, highly porous zones, such as caverns and large open fault systems can be detected. Since the geology shows very slowly dipping beds (< 5°) it was decided to perform electrical measurements (Figure 8). At the top of the cliff, above the burnt zone, two methods have been used: • Electrical methods: 3 lines have been shot of which 2 parallel and 1 perpendicular to the cliff
edge. To avoid effects of the cliff wall (i.e. measuring air) the lines were placed ca 20 m from the cliff head. The methods used are the Schlumberger method and the dipole-dipole method. The distance between the electrodes was 1m, the length of each array consisted of 84 electrodes. Compared to the Schlumberger method the dipole-dipole gives a moderate vertical resolution. The raw date has been inverted and is converted to 2D-sections.
Time-domain electromagnetic (TDEM) techniques are used to determine the electrical conductivity of the soil at a depth up to ca 25 m. In this study five 25x25 m square zones were investigated, of which 3 covered Line one of the Induced Resistivity measurements. Unfortunately all data of these series were corrupted, have to be recovered and couldn’t be used for interpretation.

WAB 500102 021 Page 34 of 121
3.3.2 Results Both the schlumberger and dipole-dipole measurements show, other then expected, in all lines a very low resistivity near the surface. This is due to the relatively wet top soils and the continuous contribution of salt by the sea wind. Especially the measurements of line 1 (Figure 9) and line 2, at about 50 m from the cliff, show this behaviour. In general the resistivity increases with depth. The inverted Schlumberger image of line 1 shows an increase in resistivity (Figure 9) to the surface in southward direction. The trend agrees with dipping of the bedding. Line 3, also shows the dipping of the beds in the westward direction (Figure 10). In the inverted images of both the Schlumberger and dipole-dipole measurements, some high resistivity spots have been observed. They are either due to the presence of baked rock of combusted shales or due to the presence of an old shaft. In general the resolution of the images is low and the results do not provide evidence for the presence of larger open fault or larger fault patterns. Only line 3 gives possible proof for oxidation and combustion deeper into the cliff. If the higher resistivity spots are relics of shale fires, the maximum depth of penetration could only have been about 20 meters.
Figure 9: Resistivity measurements of line 1; perpendicular to the cliff face.
WAB 500102 021 Page 35 of 121
Figure 10 Resistivity measurements of line 3; parallel to the cliff face. The low resistive red spot on the 3rd
and 6th image could be a former high temperature spot or excavation.
3.4 Laboratory experiments and results In this chapter the methods and set-ups and their relevance for the modelling work are described. The analytical results and petrography/mineralogy of original and thermally treated samples are explained. 3.4.1 Porosity and permeability The aim of these measurements is to use the porosity and permeability results in a model to predict the combustion of oil shales by their oxygen reaction. For that reason, only the dry porosity and dry permeability had to be measured. The combustion and convection model needs input from both the original samples and the thermally altered samples. Porosity and permeability are measured on standard core samples (3 cm height and 2.5 cm diameter). The brittle behaviour of the oil shale made it very difficult to get whole sample. After porosity and permeability experiments on the original samples, the 9 best were selected. Nevertheless, some of the samples had to be glued to minimize the influence of the fractures in the samples. This would have a significant influence on the porosity, but not on the permeability; the fractures run parallel to the flow direction. The dry porosity was measured with an Ultrapycnometer by using the matrix volume and the true density of the samples. By using Boyle’s law with known volumes of a reference cell, a

WAB 500102 021 Page 36 of 121
sample cell and two different pressures, it is possible to determine the sample porosity. Helium is used as the measurement gas. By using this method, thermal equilibrium is necessary. To acquire significant results multiple runs were preformed; each core was tested 5 times. The outliers, higher than 10% and below 1% of the average were discarded. The dry permeability was measured with the Ruska gas, by using Darcy’s law. The pressure drop along the length axis of the sample against the flow rate was determined. The temperature of the apparatus was used to find the gas viscosity (here N2). No corrections have been made for slippage and turbulence. Each core was tested 3 times The permeability values all samples were sorted and samples with values higher than 100 mD or lower than 2mD were discarded. Both porosity and permeability experiments have been repeated after thermal treatment of the cores.
Table 3 Heating and temperature profile of the core samples
Heating and temperature profile of the core samples
Number of samples Temperature
(°C)
Time
(hrs)
Cooling down
2 300 2 Natural cooling
2 600 2 Natural cooling
2 900 2 1 hr at 670 ° Celsius + Natural cooling
2 1000 2 1 hr at 670 ° Celsius + Natural cooling 3.4.2 Thermal treatment To get an indication of the loss of organic material and the mineral alterations, the samples were heated to four temperatures, as summarized in Table 3. All samples were treated under oxidized conditions (air). 3.4.3 Mineral and texture analysis Thin sections of (partly) kerogen-saturated samples were used for microscopical texture and mineral analysis. In addition, X-ray fluorescence (XRF) and X-ray diffraction (XRD) have been used in addition to provide a qualitative and quantitative measurement of the elements and minerals. Further, the amount of organic material can be estimated and compared to results from the porosity and permeability measurements. Both, original samples and thermally treated samples have been analyzed. 3.5 Experimental results The experimental results as summarized here below are used as input parameters for the combustion model. 3.5.1 Mineral composition and petrography The mineral composition of the Kimmeridge has in short been reviewed in the introduction (Cox et al, 1981, Ebukanson et al., 1990). These XRD results showed the significant presence of montmorillonite, quartz and calcite. The abundant background noise on the plot is created by the presence of the organic material. The thin sections mostly contain calcite, quartz, montmorillonite and/or kaolinite. The presence of the organic material is seen in the red and brown layered structure. It shows the changes in composition as a result from the heating process. Expected to be present is less organic material, due to gasification of the kerogen, and more heat-resistant minerals such as quartz, anhydrite and feldspars.
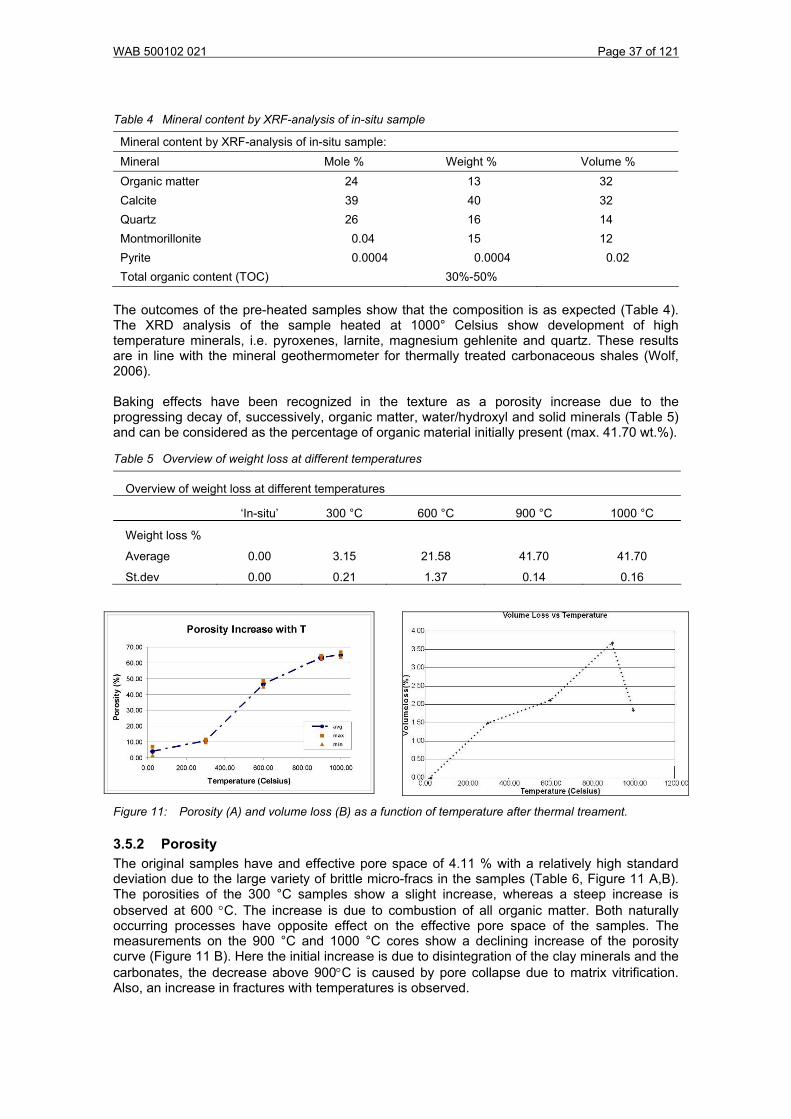
WAB 500102 021 Page 37 of 121
Table 4 Mineral content by XRF-analysis of in-situ sample
Mineral content by XRF-analysis of in-situ sample: Mineral Mole % Weight % Volume % Organic matter 24 13 32 Calcite 39 40 32 Quartz 26 16 14 Montmorillonite 0.04 15 12 Pyrite 0.0004 0.0004 0.02 Total organic content (TOC) 30%-50%
The outcomes of the pre-heated samples show that the composition is as expected (Table 4). The XRD analysis of the sample heated at 1000° Celsius show development of high temperature minerals, i.e. pyroxenes, larnite, magnesium gehlenite and quartz. These results are in line with the mineral geothermometer for thermally treated carbonaceous shales (Wolf, 2006). Baking effects have been recognized in the texture as a porosity increase due to the progressing decay of, successively, organic matter, water/hydroxyl and solid minerals (Table 5) and can be considered as the percentage of organic material initially present (max. 41.70 wt.%).
Table 5 Overview of weight loss at different temperatures
Overview of weight loss at different temperatures
‘In-situ’ 300 °C 600 °C 900 °C 1000 °C
Weight loss %
Average 0.00 3.15 21.58 41.70 41.70
St.dev 0.00 0.21 1.37 0.14 0.16
Figure 11: Porosity (A) and volume loss (B) as a function of temperature after thermal treament.
3.5.2 Porosity The original samples have and effective pore space of 4.11 % with a relatively high standard deviation due to the large variety of brittle micro-fracs in the samples (Table 6, Figure 11 A,B). The porosities of the 300 °C samples show a slight increase, whereas a steep increase is observed at 600 °C. The increase is due to combustion of all organic matter. Both naturally occurring processes have opposite effect on the effective pore space of the samples. The measurements on the 900 °C and 1000 °C cores show a declining increase of the porosity curve (Figure 11 B). Here the initial increase is due to disintegration of the clay minerals and the carbonates, the decrease above 900°C is caused by pore collapse due to matrix vitrification. Also, an increase in fractures with temperatures is observed.

WAB 500102 021 Page 38 of 121
Table 6 Porosity measurements
Porosity measurements
20 °C 300 °C 600 °C 900 °C 1000 °C
Porosity (%)
Average 4.11 10.67 46.40 63.23 64.95
St.dev 1.74 0.82 1.37 0.67 0.95
N 40 10 10 10 10 Besides the increase of matrix porosity due to heating, thermal fracturing has been observed. The nature of the crack formation, i.e. shrinkage, buckling or steam explosion (Wolf 2006), has not been found.
3.5.3 Matrix permeability The results are used to determine the temperature dependent matrix permeability and are used as input parameters in the convection and combustion model. This dry permeability gives an indication of the ability for oxygen to reach the burning zone through either the burnt or the original sediments. Note, that cleat permeability is not included in these results. Table 7 and Figure 12 A demonstrate that the Ruska gas permeameter gives a big variation in results for all samples per temperature. The original samples already were very brittle and both, in the field as in the laboratory it was observed that a fracture densities of < 20 cm are present on a regular base. Hence, the core quality before and after thermal treatment may contribute to the variation in results, i.e. position of the core between the different measurements, thermal fractures and matrix heterogeneity. Usually, the core is tightly fixed in a rubber sleeve, but some damage and fracs on/in the cores could result in an elevated permeability. Further, the 900 °C experiments diverge from the other temperatures. This only can be explained by clogging effects of carbon rich remnants of the former kerogen matter. In general, the average permeability increases with temperature from ca. 200 mD to ca. 600 mD.
Table 7 Permeability vs. temperatures
Permeability vs. temperatures
Permeability (mD) ‘In-situ’ 300 °C 600 °C 900 °C 1000 °C
Average 298.82 244.45 436.93 268.46 581.77
St.dev 225.49 209.52 137.20 31.58 95.53
N 20 12 4 8 3
Average all samples 411.60 381.71 1051.43 320.20 712.22
N (all) 20 12 9 10 6 When all averaged porosity and permeability results are compared, a positive correlation is found for the temperature dependent matrix permittivity (Figure 12 B). Now, for use first determine the temperature dependent porosity and after that the porosity dependent matrix permeability. Having these laboratory results, it is possible to derive a matrix permeability for all thermal zones in the combustion and convection model. Note that all measurements have been performed under atmospheric and oxidizing conditions. These can be used under shallow conditions. Wolf (2006) showed that the effect of rubble compaction by vertical load will reduce the permeability in eventually present rubble zones. In our situation, only ca. 0.5 MPa vertical stress can be produced by the overburden, which is insufficient for serious volume reduction.

WAB 500102 021 Page 39 of 121
Figure 12 A: Permeability versus temperature, including minimum and maximum values and the
standard deviation. B Log permeability as a function of the porosity.
3.6 The combustion and convection model 3.6.1 Model explanation To understand a oil shale or coal fire, a model between the subsurface processes and surface temperature needs to include the heat source, heat transfer through the rubble bed and overburden and the thermo-mechanical behaviour of the associated sediments. Models, developed for underground coal gasification by Batenburg (1992) and Biezen (1996), include forced injection, gas-coal reactions and thermal convection. Overburden subsidence and compaction of the permeable rubble zone, under high temperature in-situ conditions, were not included. This work was used for deep coal seams (> 700 m), where water influx was avoided by using higher gas pressures. Rosema et al. (2001) developed a spontaneous combustion model where the porous overburden is subject to forced convection by wind in a dynamic combustion process. Zhang et al. (1998), van Genderen et al. (1996), Cassels (1997) and Wessling et al. (2008) measured surface temperatures above Chinese underground coal fires, which were correlated to remote sensing satellite images in the infra-red spectrum. The outcomes were used to estimate the depth and position of the heat source. They used a linear heat flow model, a spherical heat flow model and a finite element model on a homogeneous isotropic overburden, in order to estimate the temperature distribution at the surface. Huang et al. (2001) developed a steady state model, using natural convection theory in porous media. This theory is applicable in a subsiding environment, where high permeable chimney-like faults, created by collapse and a rubble zone allow a natural convective flow. The air flow migrates from the surface through faults, strata, rubble bed and across the coal face back to the surface. In this steady state model, the temperature at the burning coal face was not taken as the product of supplied air reacting with coal, but as a constant value. Besides, thermo-mechanical behaviour and permeability of the rubble and overburden were also not included. The models discussed in the previous paragraph only use a subset of the geotechnical parameters. Either (forced) convection or bulk thermal characteristics of solid overburden are implemented. The presence of the thermal zones and differentiation in permeability in and between rubble zone and overburden are ignored. In the model of Wolf (2006), the effects of thermally and mechanically altered overburden and rubble zone are included as a contribution to coal combustion. A vertical 2D-section is chosen with an idealized coal fire, which consists of a burning coal front that will be replaced by spalled and collapsed overburden. During subsidence faults are created, which act as oxygen suppliers for the fire. In the permeable rubble zone and above five different zones develop due to increased temperature and overburden load (Wolf 2006). The method used in this study includes the temperature and stress effects. The theoretical background is described in Wolf et al. (2007) and includes the following components: • Temperature driven natural convection. The temperature at the coal face depends on the
oxygen supply for combustion and the length of the cracked drying zone in the seam behind. • Temperature depending compressibility of the rubble in the cavity.

WAB 500102 021 Page 40 of 121
• Permeability distribution in the rubble and overburden, which depends on the volumetric changes due to heating and subsidence, and the permeability of the faults.
• The rock is a dry zone above the water table. No effects of water and/or steam are involved. The burning process of the coal is a continuous process where the maximum temperatures, reached by the rubble and overburden, give isotherms through time. Hence, a semi-steady state process can be considered, which determines the mechanical behaviour of the rubble zone and overburden. A combined use of the convection model and of the mechanical models is applied to model the sub-surface processes. For the cliffs at the Kimmeridge Bay, the combustion and convection model is adapted to the local situation. The model considers the following essential criteria and boundary conditions (Figure 13): • the flow of air through the sediments provide oxygen to the burning zone • the convection of heat through the sediments is used to heat adjacent zones • the built-up of the burning cliffs including fractures and different zones of interest • the petrophysical properties of the oil shale are inserted and used as fractions of organic
matter compared to coal and relevant porosity/permeability values • the thermal properties of the oil shale and surrounding rock are included • realistic boundary conditions determining the inflow of air The combustion zone is covered by a limestone rich oil shale with a relatively low permeability. Below the oil shale a mix of alternating lower permeable black stones and limestones is present. The fractures observed in the field and not in the geophysical measurements are considered to be tight and do not contribute in the convection system. The burning zone is located 6 to 10 meters away from the cliff and covered by a rubble scree (Figure 6). The observed fumarole and the interface between the scree and the rock are considered to be the fractures in the model.
Figure 13 Model domains for the Kimmeridge cliffs, as an adaption to the original model of Wolf (2006).
3.6.2 Parameter definition In Table 8 the input parameters for the model are listed. Since the original coal model was modified to a oil shale configuration, some alterations are made in model parameters. The initial thermal expansion coefficient is changed, because the model used coal as burning material instead of oil shale. The oil shale consists of 32% of carbonic material, so the thermal value
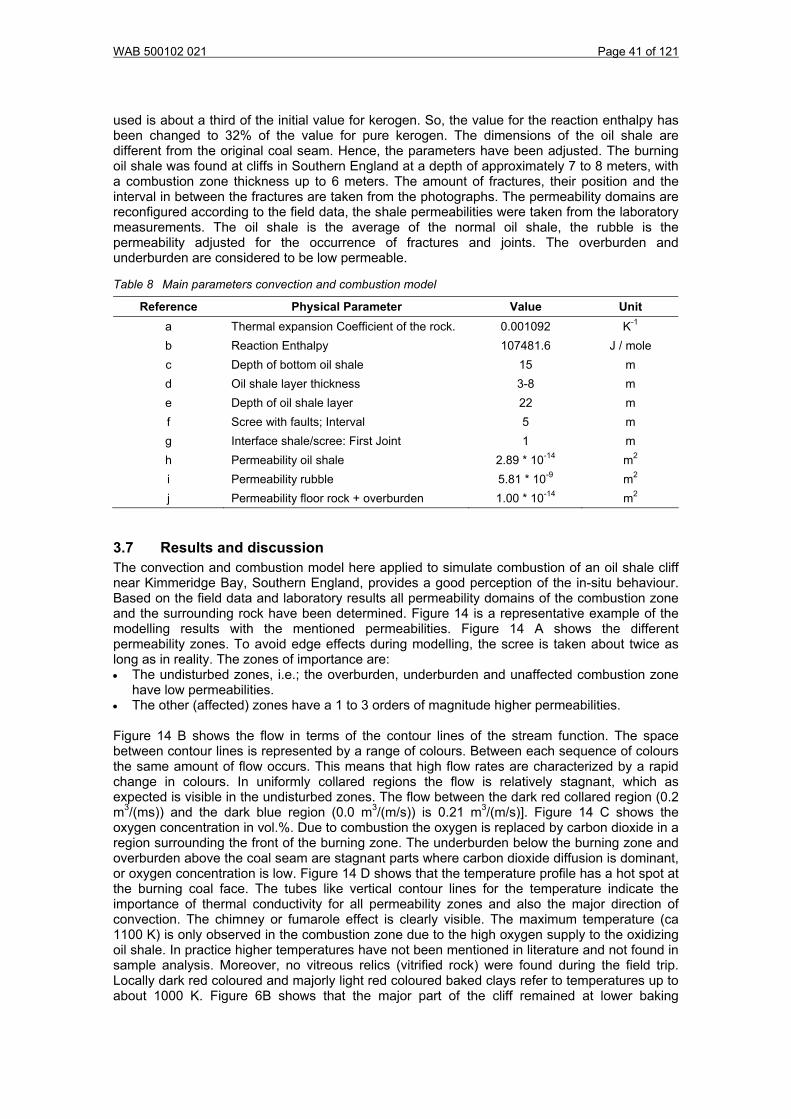
WAB 500102 021 Page 41 of 121
used is about a third of the initial value for kerogen. So, the value for the reaction enthalpy has been changed to 32% of the value for pure kerogen. The dimensions of the oil shale are different from the original coal seam. Hence, the parameters have been adjusted. The burning oil shale was found at cliffs in Southern England at a depth of approximately 7 to 8 meters, with a combustion zone thickness up to 6 meters. The amount of fractures, their position and the interval in between the fractures are taken from the photographs. The permeability domains are reconfigured according to the field data, the shale permeabilities were taken from the laboratory measurements. The oil shale is the average of the normal oil shale, the rubble is the permeability adjusted for the occurrence of fractures and joints. The overburden and underburden are considered to be low permeable.
Table 8 Main parameters convection and combustion model
Reference Physical Parameter Value Unit a Thermal expansion Coefficient of the rock. 0.001092 K-1 b Reaction Enthalpy 107481.6 J / mole c Depth of bottom oil shale 15 m d Oil shale layer thickness 3-8 m e Depth of oil shale layer 22 m f Scree with faults; Interval 5 m g Interface shale/scree: First Joint 1 m h Permeability oil shale 2.89 * 10-14 m2
i Permeability rubble 5.81 * 10-9 m2 j Permeability floor rock + overburden 1.00 * 10-14 m2
3.7 Results and discussion The convection and combustion model here applied to simulate combustion of an oil shale cliff near Kimmeridge Bay, Southern England, provides a good perception of the in-situ behaviour. Based on the field data and laboratory results all permeability domains of the combustion zone and the surrounding rock have been determined. Figure 14 is a representative example of the modelling results with the mentioned permeabilities. Figure 14 A shows the different permeability zones. To avoid edge effects during modelling, the scree is taken about twice as long as in reality. The zones of importance are: • The undisturbed zones, i.e.; the overburden, underburden and unaffected combustion zone
have low permeabilities. • The other (affected) zones have a 1 to 3 orders of magnitude higher permeabilities. Figure 14 B shows the flow in terms of the contour lines of the stream function. The space between contour lines is represented by a range of colours. Between each sequence of colours the same amount of flow occurs. This means that high flow rates are characterized by a rapid change in colours. In uniformly collared regions the flow is relatively stagnant, which as expected is visible in the undisturbed zones. The flow between the dark red collared region (0.2 m3/(ms)) and the dark blue region (0.0 m3/(m/s)) is 0.21 m3/(m/s)]. Figure 14 C shows the oxygen concentration in vol.%. Due to combustion the oxygen is replaced by carbon dioxide in a region surrounding the front of the burning zone. The underburden below the burning zone and overburden above the coal seam are stagnant parts where carbon dioxide diffusion is dominant, or oxygen concentration is low. Figure 14 D shows that the temperature profile has a hot spot at the burning coal face. The tubes like vertical contour lines for the temperature indicate the importance of thermal conductivity for all permeability zones and also the major direction of convection. The chimney or fumarole effect is clearly visible. The maximum temperature (ca 1100 K) is only observed in the combustion zone due to the high oxygen supply to the oxidizing oil shale. In practice higher temperatures have not been mentioned in literature and not found in sample analysis. Moreover, no vitreous relics (vitrified rock) were found during the field trip. Locally dark red coloured and majorly light red coloured baked clays refer to temperatures up to about 1000 K. Figure 6B shows that the major part of the cliff remained at lower baking

WAB 500102 021 Page 42 of 121
temperatures. The reference experiments suggest that in general the temperature was not higher then 800 K.
Figure 14 Convection model result: Oxygen concentration [%], flow [m3/(m/s)]
Various scenarios with changing oil shale thickness were run to predict the temperature distribution (Table 9). The maximum combustion temperature did hardly change with the thickness of the combustion zone. In all cases (Figure 14) the maximum temperature is at the combustion front and it slowly reduces vertically along the fault above this front. Heating effects can be recognized in samples where the clay minerals are dehydroxylized and light organic components are oxidized. In our case this is at temperatures above 600 K.
Table 9 Parameter variation versus maximum temperature. Parameter variation versus maximum temperature Thickness combustion zone Maximum T Thermal impact 8 m 1100 K 5 m 1150 K 3 m 1150 K
Maximum T in combustion zone and slow vertical T decrease along the frac. Restricted T-effect around the combustion zone.
Permeability rubble zone 10-7 m2 Ca. 1000 K 10-10 m2 300 K
In our model the depth of heat penetration for minimum thermal alteration is found to be 4 to 5 meters from the combustion front. This may be in line with the high resistivity spot in line 3 of the geophysical measurements.
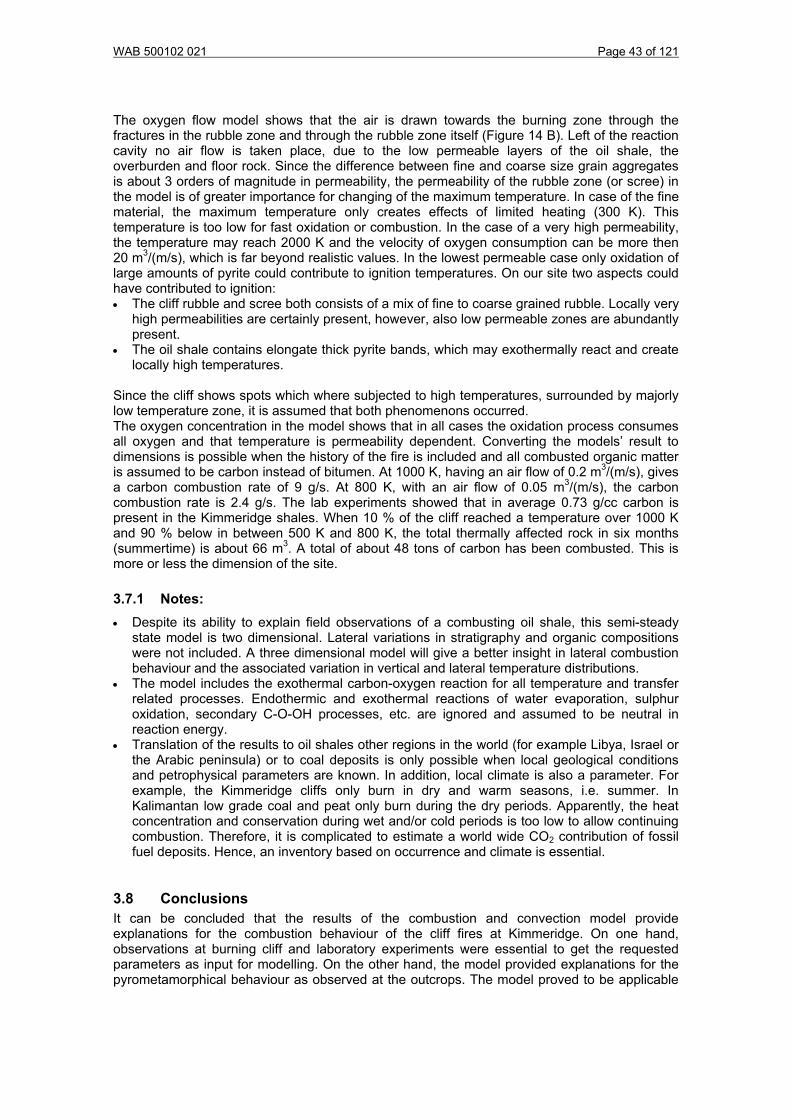
WAB 500102 021 Page 43 of 121
The oxygen flow model shows that the air is drawn towards the burning zone through the fractures in the rubble zone and through the rubble zone itself (Figure 14 B). Left of the reaction cavity no air flow is taken place, due to the low permeable layers of the oil shale, the overburden and floor rock. Since the difference between fine and coarse size grain aggregates is about 3 orders of magnitude in permeability, the permeability of the rubble zone (or scree) in the model is of greater importance for changing of the maximum temperature. In case of the fine material, the maximum temperature only creates effects of limited heating (300 K). This temperature is too low for fast oxidation or combustion. In the case of a very high permeability, the temperature may reach 2000 K and the velocity of oxygen consumption can be more then 20 m3/(m/s), which is far beyond realistic values. In the lowest permeable case only oxidation of large amounts of pyrite could contribute to ignition temperatures. On our site two aspects could have contributed to ignition: • The cliff rubble and scree both consists of a mix of fine to coarse grained rubble. Locally very
high permeabilities are certainly present, however, also low permeable zones are abundantly present.
• The oil shale contains elongate thick pyrite bands, which may exothermally react and create locally high temperatures.
Since the cliff shows spots which where subjected to high temperatures, surrounded by majorly low temperature zone, it is assumed that both phenomenons occurred. The oxygen concentration in the model shows that in all cases the oxidation process consumes all oxygen and that temperature is permeability dependent. Converting the models’ result to dimensions is possible when the history of the fire is included and all combusted organic matter is assumed to be carbon instead of bitumen. At 1000 K, having an air flow of 0.2 m3/(m/s), gives a carbon combustion rate of 9 g/s. At 800 K, with an air flow of 0.05 m3/(m/s), the carbon combustion rate is 2.4 g/s. The lab experiments showed that in average 0.73 g/cc carbon is present in the Kimmeridge shales. When 10 % of the cliff reached a temperature over 1000 K and 90 % below in between 500 K and 800 K, the total thermally affected rock in six months (summertime) is about 66 m3. A total of about 48 tons of carbon has been combusted. This is more or less the dimension of the site. 3.7.1 Notes: • Despite its ability to explain field observations of a combusting oil shale, this semi-steady
state model is two dimensional. Lateral variations in stratigraphy and organic compositions were not included. A three dimensional model will give a better insight in lateral combustion behaviour and the associated variation in vertical and lateral temperature distributions.
• The model includes the exothermal carbon-oxygen reaction for all temperature and transfer related processes. Endothermic and exothermal reactions of water evaporation, sulphur oxidation, secondary C-O-OH processes, etc. are ignored and assumed to be neutral in reaction energy.
• Translation of the results to oil shales other regions in the world (for example Libya, Israel or the Arabic peninsula) or to coal deposits is only possible when local geological conditions and petrophysical parameters are known. In addition, local climate is also a parameter. For example, the Kimmeridge cliffs only burn in dry and warm seasons, i.e. summer. In Kalimantan low grade coal and peat only burn during the dry periods. Apparently, the heat concentration and conservation during wet and/or cold periods is too low to allow continuing combustion. Therefore, it is complicated to estimate a world wide CO2 contribution of fossil fuel deposits. Hence, an inventory based on occurrence and climate is essential.
3.8 Conclusions It can be concluded that the results of the combustion and convection model provide explanations for the combustion behaviour of the cliff fires at Kimmeridge. On one hand, observations at burning cliff and laboratory experiments were essential to get the requested parameters as input for modelling. On the other hand, the model provided explanations for the pyrometamorphical behaviour as observed at the outcrops. The model proved to be applicable

WAB 500102 021 Page 44 of 121
at lower temperatures. Therefore, it also can be used in areas where low caloric coals are being subject to coal fires. Estimation of the world wide CO2 contribution of combustion of low grade coals and oil shales is only possible when the thermal models as described in this chapter can be related to thermal remote sensing data (see further chapters). At this moment both the lack of direct correlation as well as the climate conditions and variable intensity of combustion (incl. seasonal variation and site-specific dynamics) prevent an overall model to be established with any kind of certainty.

WAB 500102 021 Page 45 of 121
4 Case study: Rujigou syncline, Ningxia, China
4.1 Location and history of coal fires in Ningxia In 1821, the first recorded coal fire in Ningxia started. Most of the coal fire areas in Ningxia are located at the outcrops of the coal seams at the slope of the mountains. The surface forms steep slopes. In some areas the height difference reaches 200 meters. The small informal mines take coal from the bottom of the slope. Cracks resulting from the burning of coal and volume loss in the strata supply the oxygen as a kind of ventilation system. Most of the fires are located in the surroundings of the big state mines. The climate in Ningxia is arid and the terrain is located at high elevations. Thus, there is little material (like loess) available for fire fighting through covering (oxygen depletion). Apart from that there is also a scarcity of surface and underground water. Also it was observed that the burning area is very dynamic. The burning area and the burning depth of a coal fire are constantly changing. From 1996-1999 ITC was involved in coal fire research together with NITG/TNO and EARS in the Netherlands and BRSC (Beijing Remote Sensing Corporation) in China in the province of Ningxia. Later, the Sino-German Coal Fire Research initiative carried on with investigations, see: http://www.coal fire.caf.dlr.de/intro_en.html
N
Figure 15 Coal fire distribution map for Rujigou coal mining area. Top: Ikonos image with four different mining areas. Below: coal fires as mapped based on aerial survey and ground mapping
In recent times, coal fires in Ningxia were thoroughly surveyed two times. In 1998 this task has been accomplished by ARSC. 22 coal fire areas were located. Based on night infrared airborne images a temperature isoline map of 15 coal fire areas has been produced. The second survey was undertaken in 2001 by the Ningxia Surveying Institute of Coal Geology. ARSC used IKONOS images to locate the coal fire areas in Rujigou mining area (Figure 15). Furthermore, they were using extensive field campaigns performing temperature measurements. The temperature was measured using thermometers. They have measured 18 coal fire areas, acquired >250 GPS control points, which are located at the boundaries of the fire areas. They have undertaken 16 profiles in the coal fire area with 119 temperature measurements.

WAB 500102 021 Page 46 of 121
Table 10 Coal fire statistics in Ningxia province, China. burning
area burning depth
Lost coal Coalfield
name No. Coal fire name (m)
Thickness of
coalseam Quality of coal Carbon
content Coal fire status (10,000 m2) (MT)
1 1 Beikalagou 6,425 150 10 Anthracite 95% burning
2 2 Nanshan 4,975 100 20 Anthracite 95% burning
3 3 Honglianbei 1,15 60 21,5 Anthracite 95% burning
4 4 Hongwanxing 3,175 29 Anthracite 95% burning
5 5 shanger 6,85 90 14,4 Anthracite 95% burning
6 6 Gudao 1,444 4,3 Anthracite 95% burning
7 7 Beiyi 5,275 95 12 Anthracite 95% burning
8 8 Naner 2,53 67 23 Anthracite 95% burning
9 9 zhongcao 6,623 95 15,3 Anthracite 95% burning
10 10 Longlinchu 25 Anthracite 95% firespot
11 11 Nansixing 25 Anthracite 95% firespot
12 12 Hongwan 210 25 Anthracite 95% burning
13 13 Kengmuchang 25 Anthracite 95% burning
14 14 Hongliang 370 29,4 Anthracite 95% burning
15 15 Nansi 120 20 Anthracite 95% burning
Rujigou
Total 38,447 60~370
16 1 Huifeng 3,7 68 6 burning
17 2 Xishan 5,227 79 6 burning
18 3 Dayushugou 6,025 69 6 burning Redaolin
Total 14,952 68~79
Maliantan 19 1 Maliantan 8 Coking Coal/Gas & Fat Coal 75% firespot
20 1 Yikuan 3,1 54 6,4 Coking Coal/Gas & Fat Coal 75% burning
21 2 Shankuan 7,3 110 6,4 Coking Coal/Gas & Fat Coal 75% burning
22 3 Lijiagou 3,2 113 7 Coking Coal/Gas & Fat Coal 75% burning
Shitanjing
23 4 Erkuan 163 6,4 Coking Coal/Gas & Fat Coal 75% extinguished
Total 13,6 54~163
Hulusitai 24 1 Wulan 0,5 10,2 Coking Coal 75% burning
Xianshan 25 2 Shanxiahejian 87 5,24 Coking Coal 75% extinguished
Total 67,499 54~370 15
26 1 Dalingwan 8,837 120 15,8 Anthracite 95% extinguished
27 2 Yingbo 6,889 395 25 Anthracite 95% extinguished
28 3 Shuixian 0,406 180 25 Anthracite 95% extinguished
29 4 Xigou 15,325 350 20,4 Anthracite 95% extinguished
30 5 Shangyi 1,15 78 4,5 Anthracite 95% extinguished
31 6 Dashidou 25,304 250 17,5 Anthracite 95% extinguished
32 7 Heitouzhai 7,734 150 20 Anthracite 95% extinguished
33 8 Xingshen 0 160 25 Anthracite 95% extinguished
34 9 Honglianxi 0 60 25 Anthracite 95% extinguished
35 10 Hongliandong 0 75 25 Anthracite 95% extinguished
36 11 Nanyi 0,832 53 8 Anthracite 95% extinguished
Rujigou (extinguished)
37 12 beishan 2,125 140 21 Anthracite 95% extinguished
Total 68,602 53~395 35
Total all of coafires 136,1 50

WAB 500102 021 Page 47 of 121
In 1988, the total coal fire area was 1,470,000 m², according to existing reports. In the time period of 1997 to 2004, the coal fire areas were extended by 605,000 m². Until this year, 1,390,000 m² were extinguished, so that a total area of 685,000 m² is still burning. There were in total 37 active coal fire areas at the end of 2004, with a total burning area of 1,361,000 square meters. Among those fires, 12 coal fires have been fought between 1997 and 2007 within a coal fire fighting operation funded by the national government. These are: Dalingwan, Yinpo, Shuihang, Xigou, Shangyi, Dashitou, Heitouzhai, Xinsheng, Hongliangdong, Hongliangxi, Beisan, Nanyi. At the end of 2007, the fighting ended (targeted coal fires have been extinguished). There are still 25 coal fire areas left, which are not under control, with a total area of 675,000 m². The total amount of burnt coal over the last two decades is estimated to sum up to 50 Million tons (up to end of 2007, see Table 10). It is estimated that about 2 million tons of coal is burned out per year. About 7 million tons of CO2 are generated annually accordingly. Because the coal seams in Ningxia province are relatively horizontal (they have low dip angles), coal fires don’t influence a big area, which means that coal located away from the fire still can be exploited. Therefore, the coal lost is mainly the burnt coal, which amounts also to about 2 million tons per year. Presently five key uncontrolled coal fire areas are Hongliangbeiye, Beikalagou, Nansan, Hongwanxin, Shanger. The total burning area is 226,000 m² and the depths of these coal fires are varying between 60 to 150 m. These coal fires together burn 100,000 tons of coal per year. There are 20 further coal fire areas with a total area of 449,000 m². They are mainly distributed in the Rujigou, Erdaoling, Shitanjing, Hulusitai, Maliantan and Xiangshan coalfields. Among them, ten coal fires are in Rujigou with a total area of 159,000 m². About 100,000 tons of coal is being burnt per year in these areas. Additionally, there are three more fires in Erdaoling coal field, summing up to a burning area of 150,000 m². Their names are Huifeng, Xishan, and Dayushu. There are an additional 4 fires in Shitanjing coal field with a total area of 136,000 m², named Yikuang, Erkuang, Sankuang, and Lijiagou. Wula coal fire is located in Hulusitai coal field with a burning area of 5,000 m². There is a newly reported coal fire in Maliantan coal field. The Shangxiaheyan coal fire in the Xiangshan coalfield has already extinguished naturally. 4.2 Impacts of the coal fires There are several adverse effects of coal fires, including threatening the safety of coal mining, consuming a non-renewable energy resources, increasing the production cost and destroying the natural environment by air pollution (gasses, aerosols), subsidence etc. The following paragraphs discuss these effects in detail. In Rujigou 68 per cent of the coal fires have started after the mining activities started in 1950. As the underground coal fires are very difficult to detect, the coal fires in Rujigou have been burning for years. Till 2007 the total loss of coal in Ningxia is estimated to be about 50 Million tons. Only in Rujigou coalfield 35 Million tons of coal was lost equalling 10% of the total coal reserve of Rujigou. Due to the burning of the coal, the safety of the mining is usually compromised. The mine has to keep more coal pillars, conducting continuous coal fire fighting, or giving up production and seal the mine. Coal fires develop along the strike on both sides form the burning area. The area near coal fires usually shows dried soil and dying vegetation. As coal fires develop along the dip of the coal seam, thick pyro-metamorphosed rocks will be formed and surface cracks will be developed. When the coal fires connect inside the mining area, the propagation of coal fires will accelerate. Air pollution of the immediate environment is one of the serious adverse effects of coal fire. In the process of burning of the coal seams, many hazardous gases are released to the atmosphere. Among them CO2 and CH4 are most accountable because of their green house effect. Moreover, SOX, H2S, NOX, are also released in the atmosphere. Through trace element analysis in the local vegetation and poplar trees, it has been found that the people living close to coal fire areas have the risk of elevated amounts of Cu intoxication (64.6 times). Furthermore, respiratory tract diseases, stomach diseases etc. are common in local population. The Cu content of the poplar trees in the coal fire area is 5.17 times higher

WAB 500102 021 Page 48 of 121
than the unaffected areas. In the coal fire areas, the smell of sulphur is very strong and sulphur crystals can be observed on the surface (on the vents). According to atmospheric measurements, the air quality of the coal fire areas is dangerously degraded (see Table 11, Table 12 and Table 13). The increase of SO2 in the troposphere will contribute to acid rain. An increase of the CO content in the upper atmosphere is liable to deteriorate the ozone layer.
Table 11 Atmospheric quality standard (mg/m3), above they ‘standard value’ conditions for the inhabitants are considered harmful
Atmospheric quality standard (mg/m3
Pollutant Standard value Annotation
CO 20 The highest permitted value for residence areas SO2 0.7 H2S 0.01 NOx 0.3
Grade 3 standard
Table 12 Atmospheric monitoring measurements (autumn) Atmospheric monitoring measurements (autumn)
Sample area Monitoring item
Average density (mg/m3)
Density range (mg/m3)
Measure-ment times
Number of measurements which exceed the standard
Maximum measure-
ment
Times to the
standard
H2S 0.038 0.032-0.053 9 9 5.5 100
NOx 0.087 0.003-0.251 9 0 0.857 0 CO 123.67 35.94 278 9 9 13.9
No.1 Yinpo coal fire area
SO2 0.354 0.011-0.817 9 2 1.17 22.2
H2S 0.037 0.031-0.052 9 9 5.2 100
NOx 0.018 0.002-0.054 9 0 0.18 0
CO 28.25 0.00-99.280 9 4 4.96 44.4
No.2 Rujigou mining area
SO2 0.032 0.019-0.053 9 0 0.06 0 H2S 0.037 0.030-0.052 9 9 5.2 100
NOx 0.006 0.001-0.0390 9 0 0.1 0
CO 12.54 0.00-87.78 9 1 4.39 11.1
No.3 the tenth monitoring hole in the Beisan coal fire area
SO2 0.045 0.012-0.095 9 0 0.14 0
H2S 0.035 0.030-0.042 9 9 4.2 100 NOx 0.02 0.001-0.088 9 0 0.29 0 CO 45.59 0.00-132.89 9 6 6.64 66
No4 the seventh monitoring hole in Beisan coal fire area
SO2 0.079 0.017-0.371 9 0 0.53 0
H2S 0.038 0.031-0.052 9 9 5.2 100
NOx 0.011 0.001-0.034 9 0 0.11 0
CO 11.49 0.00-41.24 9 2 2.16 22.2
No5. the pump house in the Beisan coal fire area
SO2 0.058 0.019-0.121 9 0 1.73 0
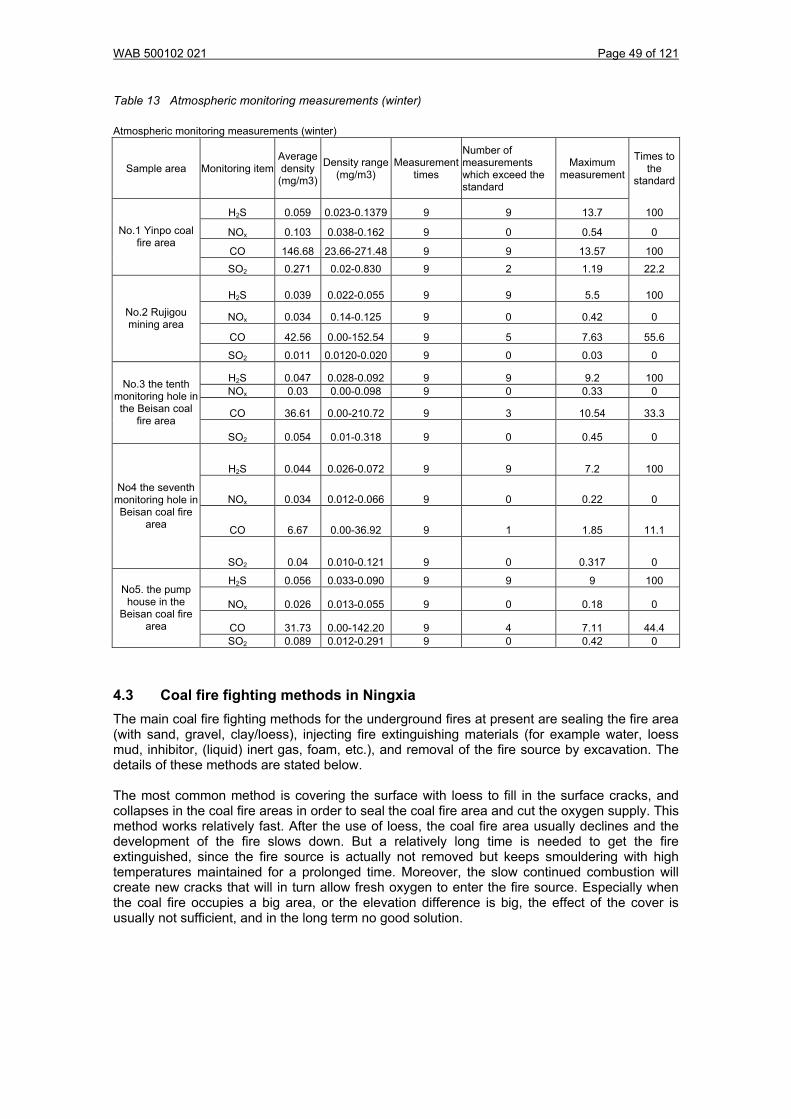
WAB 500102 021 Page 49 of 121
Table 13 Atmospheric monitoring measurements (winter) Atmospheric monitoring measurements (winter)
Sample area Monitoring item Average density
(mg/m3)
Density range(mg/m3)
Measurement times
Number of measurements which exceed the standard
Maximum measurement
Times to the
standard
H2S 0.059 0.023-0.1379 9 9 13.7 100
NOx 0.103 0.038-0.162 9 0 0.54 0
CO 146.68 23.66-271.48 9 9 13.57 100
No.1 Yinpo coal fire area
SO2 0.271 0.02-0.830 9 2 1.19 22.2
H2S 0.039 0.022-0.055 9 9 5.5 100
NOx 0.034 0.14-0.125 9 0 0.42 0
CO 42.56 0.00-152.54 9 5 7.63 55.6
No.2 Rujigou mining area
SO2 0.011 0.0120-0.020 9 0 0.03 0
H2S 0.047 0.028-0.092 9 9 9.2 100 NOx 0.03 0.00-0.098 9 0 0.33 0
CO 36.61 0.00-210.72 9 3 10.54 33.3
No.3 the tenth monitoring hole in the Beisan coal
fire area SO2 0.054 0.01-0.318 9 0 0.45 0
H2S 0.044 0.026-0.072 9 9 7.2 100
NOx 0.034 0.012-0.066 9 0 0.22 0
CO 6.67 0.00-36.92 9 1 1.85 11.1
No4 the seventh monitoring hole in Beisan coal fire
area
SO2 0.04 0.010-0.121 9 0 0.317 0
H2S 0.056 0.033-0.090 9 9 9 100
NOx 0.026 0.013-0.055 9 0 0.18 0
CO 31.73 0.00-142.20 9 4 7.11 44.4
No5. the pump house in the
Beisan coal fire area
SO2 0.089 0.012-0.291 9 0 0.42 0
4.3 Coal fire fighting methods in Ningxia The main coal fire fighting methods for the underground fires at present are sealing the fire area (with sand, gravel, clay/loess), injecting fire extinguishing materials (for example water, loess mud, inhibitor, (liquid) inert gas, foam, etc.), and removal of the fire source by excavation. The details of these methods are stated below. The most common method is covering the surface with loess to fill in the surface cracks, and collapses in the coal fire areas in order to seal the coal fire area and cut the oxygen supply. This method works relatively fast. After the use of loess, the coal fire area usually declines and the development of the fire slows down. But a relatively long time is needed to get the fire extinguished, since the fire source is actually not removed but keeps smouldering with high temperatures maintained for a prolonged time. Moreover, the slow continued combustion will create new cracks that will in turn allow fresh oxygen to enter the fire source. Especially when the coal fire occupies a big area, or the elevation difference is big, the effect of the cover is usually not sufficient, and in the long term no good solution.

WAB 500102 021 Page 50 of 121
Figure 16 a and b Fire fighting by water supply (a) and drilling to inject synthetic foam (b)
Secondly, injection of water and mud (loess) is used through boreholes on the surface. Loess mud will decrease the temperature of the coal, close cracks, and then stop the development of the fire. This method is not restrained by the area of the fire, or the depth of the fire. It can be applied anywhere and usually returns fast results. But constrains of the methods are estimation of mud required to extinguish a certain active coal fire and proper supply of mud on the fire. However, in a relatively simple geological setting this method offers good results. Other agents are also used for injection, like liquid nitrogen and synthetic foam (that can be mixed with mud or ash). These operations are relatively expensive and are only feasible in small areas with a high priority (for example to prevent loss of mining equipment or other infrastructure). The excavation (dig out and remove) method follows the following steps. First water is injected, and then the fire is removed gradually from the top downwards. Thought it is a definite method to extinguish fires, the engineering is complex and a big investment is required. For shallow fires and those that develop slowly or controlled, this method offers best result.

WAB 500102 021 Page 51 of 121
B A
C D
F
E
Figure 17 a and b: large excavation operation at Beishan coal fire area to remove entire burning coal layer. Ref. Table Ningxia coal fires statistics, Rujigou extinghuished, no. 37 (12). Picture taken in 2002.
c and d: Coal fire at Nanyi (a) taken in 1997, (b) taken in 2002 after excavation and rehabilitation. Ref. Table Ningxia coal fire statistics Rujigou extinghed no. 36 (11).
e and f: Coverage of coal fire outcrop at a cliff above the village of Rujigou, with a pond for extra protection (e), and coverage of coal fire with overburden, note new cracks developing near the cliff face (f). Yingbo coal fire area, 2002, ref. Table Ningxia coal fire statistics Rujiogou extinghuised no 27 (2).

WAB 500102 021 Page 52 of 121
4.4 Monitoring coal fire in Ningxia According to the standard for fighting coal fires, the monitoring should be done during the coal fire fighting engineering period and at least one year after the engineering is finished. The monitoring result can guide the fire fighting engineering and check, and evaluate the result of the engineering. Monitoring methods include measuring temperature at different depths in a monitoring bore holes, measuring the gas content of monitoring bore holes, and investigating the area with magnetic and electric methods. In the Rujigou mine area, drilling is difficult because of rugged topography. The following monitoring methods are being used: 4.4.1 Temperature measurements Temperature in the fire area is the most direct index for the state of fire, and hence for evaluating the fire fighting result. The surface temperature in the coal fire area is measured using a thermometer. The temperature in the bore hole is measured using the ‘TES-1320’ digital thermometer. C 4.4.2 Gas content analysis CO, O2, H2, and CH4 are analyzed using gas spectrometry from borehole samples, as part of the monitoring of coal fire areas where extinguishing activities are (or have been) undertaken. At certain threshold values (similar with the temperature monitoring), renewed extinguishing activities will be started. Figure 18 shows a 19 months monitoring result of a typical borehole for monitoring the effect of coal fire fighting. During a period of 19 months, the temperature, oxygen, and the carbon oxide were measured in the monitoring borehole. It can be seen that the temperature in the fire area decreased from above 200°C to 50°C, and has the trend of decrease further. The content of CO is kept within 64ppm. At the meantime the O2 content decreased from 20% to 7%. All these indexes indicated that the fire is distinguished. The coal fire fighting was successful.
0
50
100
150
200
250 O2 T
0
200
400
600
800
1000
1200
1400
CO
T O2 CO
Figure 18 A 19 month Gas content analysis from a monitoring borehole. Pink: temperature in °C; blue: Oxygen content in %; yellow: CO in ppm.

WAB 500102 021 Page 53 of 121
4.4.3 Remote sensing approach With the improvement of the spectral and spatial resolutions, remote sensing has become vital tool in coal fire research. • High spectral resolution sensor: OMIS, a Chinese scanner that operates in the 0.4 to 12.5
μm region with different spectral resolution in different part of EMS. Its parameters are shown in Table 14. Data from day time and night time were collected. The daytime data can be used to demarcate the surface thermal anomalies, as well as areas of metamorphic rocks. Night time data are used to calculate the coal loss, locating the burning centre, and creating distribution map of the surface anomalies.
• ETM+ images: the bands and the spatial resolution are described in Table 14. Images can be used to demarcate the burning area, and the night images can be used to monitoring coal fires and evaluating the coal loss.
• IKONOS images: its parameters are presented in Table 14. Ikonos images have a good geometry and spatial resolution. They can be used for the accurate demarcation of coal fire areas and for the monitoring of coal fires.
In Rujigou mining area, the remote sensing method has a good potential, and is not restrained by the complex topography.
Table 14 Sensor characteristics Sensor characteristics
index OMIS ETM IKONOS
0.4-1.14um 10nm 64 bands 0.45-0.515nm 0.45-0.9umpan
1.06-1.70 40 16 0.525-0.605 0.45-0.52
2.0-2.5 15 32 0.775-0.90 0.52-0.60
3.0-5.0 250 8 1.55-1.75 0.63-0.69
Band range, spectral
resolution, and band number
8.0-12.5 500 8 10.4-12.5 0.6-0.90
IFOV 3mrad 2.09-2.35 Image width11km Pixel number
per line 512 0.52-0.90
Spatial resolution Best 2m 1,2,3,4,5,7(30m)
6(60m),pan15m
pan1m,multi 4m
In 2006, ARSC developed a monitoring information system in Rujigou mining area. The system contains several modules: for visualisation, query, edit, 3-D fly, managing of images, managing of the vectors, managing of the properties, managing of transport network data, and managing of the water table information. Secondly, a digital elevation model was derived from Quickbird data at a scale of 1:5000.
4.4.4 Monitoring coal fires using geophysics and geochemistry methods (a) Electrical restitivity: The electrical method is based on the theory that the underground rock layers have different conductivities. Through the study and observation of the electric field, we will know the property, scale and the position of the rock layers. The high resolution electrical method works in the same way as the traditional electrical method. However, it has dense measuring points (the max. distance between the points is 20m), which gives it a high sensitivity for anomalies. It can locate the depth of an anomaly. It can have a high signal – noise ratio.

WAB 500102 021 Page 54 of 121
(b) Electro-magnetic (EM) methods: This method uses the principle of induced electro-magnetic currents to detect the underground geology. It is using one cable to generate subsurface currents, and another cable to receive the signal in certain time intervals. The received signal depends on the conductivity of the bedrock underground. Rocks in the area with high temperature and the surface fire area have significantly lower electrical conductivity than the surrounding. The electro- magnetic method can be used to demarcate the fire area. It works well in bare rock areas and arid areas.
Figure 19 Electro-magnetic field measurements in Rujigou area
The equipment used is the ‘LC electro-magnetic system’, which can generate an electric current of 400A; the instant power is 40-500 KW. It submerges erratic signals from other sources and it is suitable for complex topographic areas (Figure 19). (c) Surface isotope measuring method: Sedimentary rocks contain some radioactive elements. In general, the darker the sediment, and the finer the grain size is, the more radioactive elements they have. Coal related layers usually show a high amount of radioactive elements. The isotopes 238U92, 232Th90, 235U92 produce Rn, Th and Ac during the process of decaying. The Th and Ac have a half life time of 54.5 seconds, and 3.96 seconds respectively. Rn has a relatively longer halftime, which is 3.83 days. Spontaneous combustion leads to changes in the Rn content. The higher the temperature is, the more Rn exists. From measurements of Rn near the surface one can locate underground coal fires. (d) Monitoring coal fire fighting results using thermal photos. Thermal cameras allow to assess the temperature patterns of individual cracks and vents and assessments at diurnal resolution or daily, weekly or monthly mapping is easily possible if a camera is available. Furthermore, panorama images taken from a distant point can reveal the temperature behavior of a larger fire zone during the day as well as during night. Currently, many research teams assess the option to map coal fires with thermal cameras mounted on ultra-light unmanned vehicles, which would strongly reduce costs of manned flight campaigns and which could be easily repeated. Comparing thermal photos made before and after the coal fire fighting engineering, the change of the temperature can be seen (Figure 20).
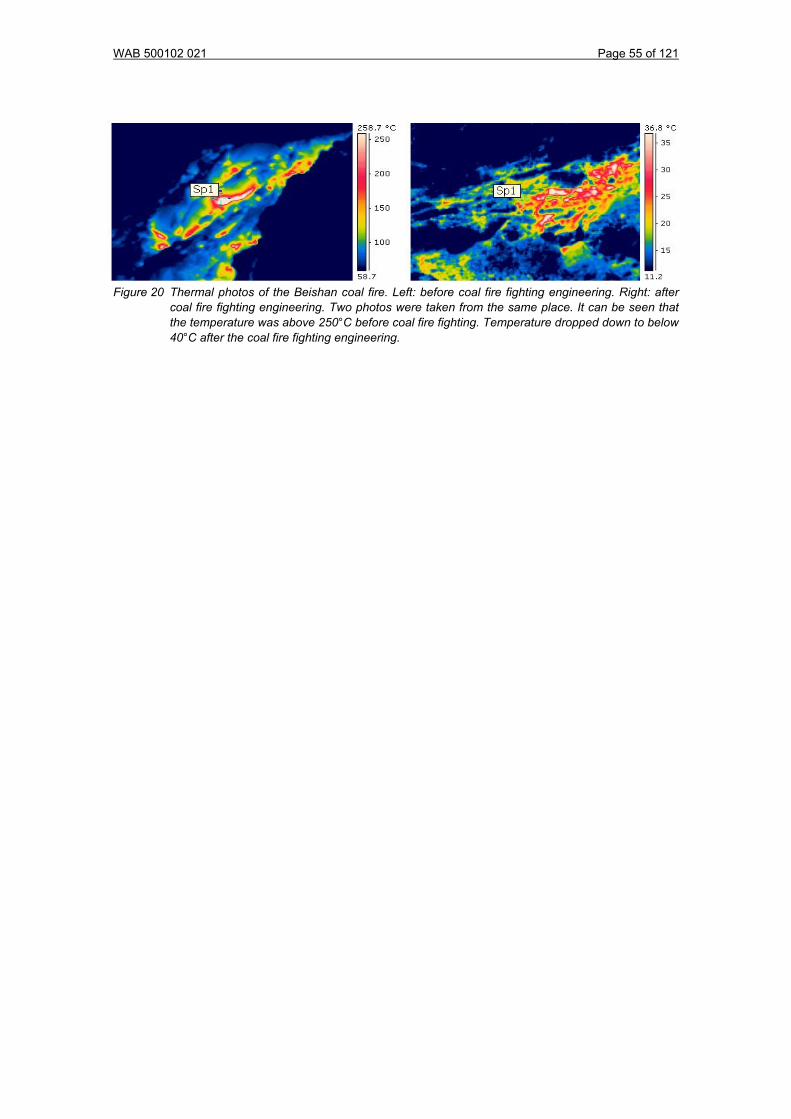
WAB 500102 021 Page 55 of 121
Figure 20 Thermal photos of the Beishan coal fire. Left: before coal fire fighting engineering. Right: after coal fire fighting engineering. Two photos were taken from the same place. It can be seen that the temperature was above 250°C before coal fire fighting. Temperature dropped down to below 40°C after the coal fire fighting engineering.


WAB 500102 021 Page 57 of 121
5 Case study: Wuda syncline, Inner Mongolia, China
5.1 Location and history of coal fires in Wuda Wuda is located in Inner Mongolia Autonomous Region, which covers an area of 1,180,000 km² or about one-eighth of the country (People’s Republic of China Ministry of Geology and Mineral Resources, 1991). The city borders the structural syncline hosting a large coal fire area investigated. It is located on the western side of the Yellow River, north of the Helan Shan mountain range, not far from the border to Ningxia Hui Autonomous Region. Ten kilometers west of Wuda the first dunes of the Badain Jaran desert can be found. The geographic location of Wuda city is approximately 39.51° North and 106.60° East (see Figure 21 and Figure 22). The nearest bigger cities are Wuhai, located 20 km to the Northeast, Shizuishan-Dawukou, 75km southwest of Wuda and Yinchuan, the capital of Ningxia Hui Autonomous Region, which is located 150 km to the South. The broader study area of Wuda includes a region of approximately 1600 km², with Wuda at the center. Land elevations in this region vary from 1010 to 1980 meters above sea level. From 2001-2004 joint research was carried out by ITC and DLR as part of the start-up phase of the Sino-German Coal Fire Research projects, see: http://www.coal fire.caf.dlr.de/intro_en.html
N
Wuda town
Figure 21 Wuda syncline. Background image: Landsat 7 ETM+, optical colour composite (nir, red, green; bands 4,3,2). In the right image it is overlain by the coloured thermal band (red = hot, blue = cold). Note black spots are coal mines, merged spots in black lines are outlining coal seams, and large black areas are coal waste and stockpiles on the optical image. Vegetation appears red in the optical false colour composite.
In the thermal image the coal seams on fire (and some industry) give thermal anomalies. The Yellow River and (irrigated) vegetation areas as well as shadows near hills are relatively cold.
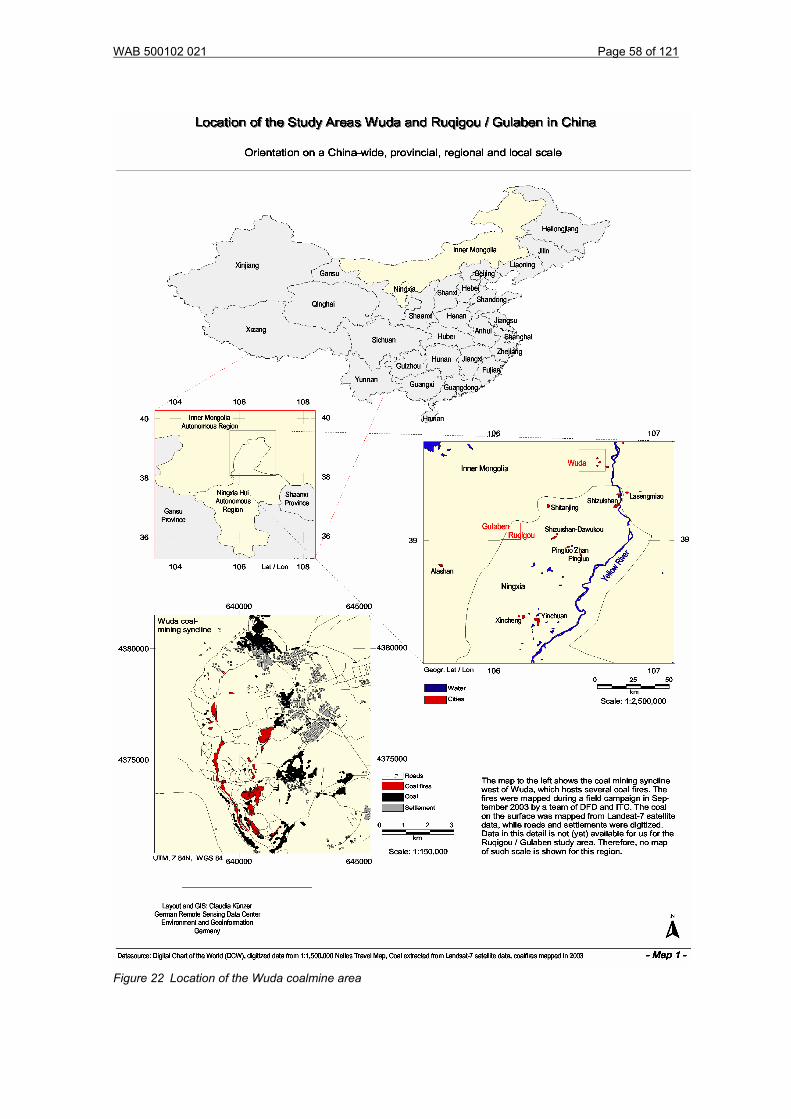
WAB 500102 021 Page 58 of 121
Figure 22 Location of the Wuda coalmine area
WAB 500102 021 Page 59 of 121
The north-south striking structural syncline located 5 km west of Wuda city has a spatial extent of 35km² and holds a total reserve of 630 Mio. tons of coal. The coal layers originate from Upper Carboniferous and Lower Permian times (DAI et al. 2002). Mineable reserves are stated to be 27 Mio. tons with seam thickness varying between 1.5 and 12 meters. The coal layers are interbedded in different layers of coarse to fine-grained white to dark grey or yellowish sandstone and grayish-, brown- or green-yellowish shale with varying organic content also originating from the Carboniferous and Permian. Occurring formations are the Taiyuan-, Shanxi-, Xiashihezi- and Shangshihezi formation. The Taiyuan formation is the major coal bearing formation (DAI et al. 2002). The strata dip to the East with an average dip angle of 6 to 10°, but steeper dips occur as well. Quaternary alluvial layers of silt, shale and gravel unconformably cover small parts of the Permian and Carboniferous outcrops. Outside the syncline also Lower- and Middle Ordovician marine facies sediments including thick bedded dolomite and limestone occur. The Silurian and Devonian sequence is missing in the Helan Mountain area and its surroundings. In the syncline area the coal layers have been mined under the authority of the ‘Wuda coal mine bureau’ within the three coal mines of Wuhushan operating in the South, Huangbaici in the East and Suhai-Tu in the Northwest since 1958. In these three mines three different qualities of coal – fatcoal, cooking coal and steam coal – are being extracted from the 17 mineable of the overall 24 coal seams. The upper seven coal seams from Permian times, belonging to the Shanxi group, have an overall thickness of 88 meters and are characterized by a low sulfur and a high ash content. All lower seems from the Carboniferous belong to the Thairen group and have a high sulfur and low ash content. The heating value of the Wuda coal varies between 5000-7000 kcal/kg (JIA 2002, SUN 2003). 5.2 Impacts of the coal fires in Wuda Since commercial mining in the Wuda syncline started in 1958, 120 megatons have been mined by 2000. Mainly mechanized longwall methods are applied and the average mining depth of state run- or commercial mines is around 100m but can reach up to 200-300 m. The first coal fires in the area were discovered in 1961. The recent annual amount of coal being burned is estimated to be 200,000 tons. An acceleration of the process from year to year is observed. It is assumed that so far, over one Mio. tons of coal have been destroyed or became inaccessible due to coal fires. However, no attempt has been made to date to really quantify the total coal loss within the last 35 years. Knowledge about the influence of the numerous small profit mines is difficult to access. Today 8.8% of the three coal mining areas in the syncline are affected by coal fires and the coal fire area has an extent of 3.07 km² (JIA, 2002). Eight coal seams are burning: seams 1, 2, 4, 6, 7, 9, 10 and 12. Small scale private mines with a low level of mechanization and poor safety standards pose the greatest threat concerning the development of new coal fires or the ventilation of existing fires. Private mining has been permitted since 1980 as long as mine shafts are not drilled deeper than 300 m from the mine entrance into the strata. However, many of the formerly over 100 small scale private mines scattered along the seam outcrops are now abandoned, after coal fires made mining too dangerous. Governmental laws led to the closure of many private mines. Since mine entries and ventilation systems were in most cases not properly sealed off, these abandoned private mines are still risk areas for spontaneous combustion of coal seams. The same is true for coal waste- and leftover coal storage piles. The coal in the Wuda area is particularly prone to this catalytic effect of self ignition. The fires in Wuda are monitored by mine engineers and mine administrators and have been numbered to provide a common reference. In 2000, an assessment of the boundaries of the coal fires by satellite data, GPS-field measurements and geologic analysis was undertaken (JIA, 2002). Thermal measurements and borehole drillings supported these activities. The result is a map of Wuda syncline with 16 demarcated coal fire areas. Furthermore it was found that coal fires are burning not only close beneath the surface, but up to depths of 50-100 meters (JIA, 2002). Before 1989 most coal fires in Wuda were isolated and scattered in different locations. The isolated fires started to connect gradually between 1989 and 1995 (GANGOPADHYAY, 2003).

WAB 500102 021 Page 60 of 121
The changes in coal fire dynamics observed between the field visits in 2002, 2003 and 2004 were dramatic. Fires 13-1 and 13-2 had merged, fire 6 and fire 8 had spread to the North and South and fire 3 had shifted southeast. A new very hot coal fire had developed between fires 6 and 8. 5.3 Coal fire fighting methods in Wuda In Wuda, coal fire fighting at large scale to date has not started yet. Several smaller burning zones were used for extinguishing experiments. The local fire fighting team used a mix of coal dust, water, and ashes for injection into the underground, to fill cracks and ventilations pathways and thus deplete the fire of oxygen. Furthermore, smaller fire areas were covered with a blanket of overburden loose material, such as loess, sand, and gravel. Jointly with international research projects the opportunities of salt-water drilling and injection, the option of colloidal mixture injection and synthetic foams have been discussed. However, most extinction techniques proposed by experts from outside of China proved to expensive and this cannot be performed in Wuda. Currently the focus is on coal fire excavation to separate the burning part of the seams from areas still unaffected. Also the coverage of fires is ongoing. However, as by November 2008 one of the authors (CK) visited the area, still 20 fires were uncontrolled in Wuda syncline and it is not determined yet when the ‘test’ phase will be over and real systematic extinction will begin. 5.4 Figures for coal loss in Inner Mongolia For Inner Mongolia no detailed figures per coal fire area are available (like we present for Ningxia in Chapter 4 and Xinjiang in Chapter 6). The known coal fire regions are: Wuda, Gulaben, Zhozi Shan and Erduosi. Note Gulaben is located west of Rujigou (province Ningxia), and in fact the continuation of the same synclinal deposit. The total amounts for the entire province are estimated at 64 individual coal fires, totaling 2280 * 10,000 m2 and 45 Mt coal lost per year. See further discussion of coal lost versus coal burnt in Chapter 8. 5.5 Satellite monitoring of coal fires in Wuda To monitor the coal fires in Wuda different methods are being used. The methods are similar to those described in 4.4.3. The satellite remote sensing monitoring activities on Wuda’s individual fires were performed from 2000 to 2005 (Figure 23). After the year 2005 strong changes in the Wuda syncline, due to the preparation of fire fighting activities, lead to a complete change of the syncline’s appearance. Large masses of rock have been shifted, whole sandstone plateaus were blown up and large areas collapsed further. Thus, it is nowadays impossible to continue the time series analyses of the individual coal fires as presented in Kuenzer et al. 2005.
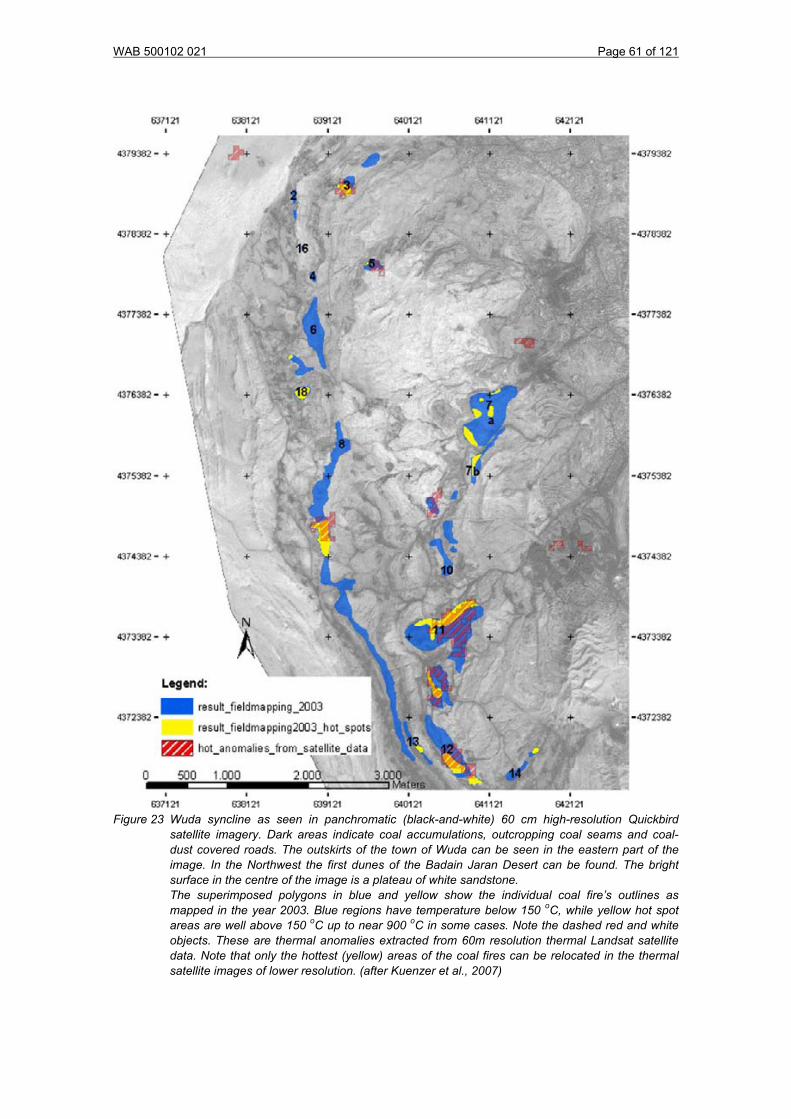
WAB 500102 021 Page 61 of 121
Figure 23 Wuda syncline as seen in panchromatic (black-and-white) 60 cm high-resolution Quickbird satellite imagery. Dark areas indicate coal accumulations, outcropping coal seams and coal-dust covered roads. The outskirts of the town of Wuda can be seen in the eastern part of the image. In the Northwest the first dunes of the Badain Jaran Desert can be found. The bright surface in the centre of the image is a plateau of white sandstone.
The superimposed polygons in blue and yellow show the individual coal fire’s outlines as mapped in the year 2003. Blue regions have temperature below 150 oC, while yellow hot spot areas are well above 150 oC up to near 900 oC in some cases. Note the dashed red and white objects. These are thermal anomalies extracted from 60m resolution thermal Landsat satellite data. Note that only the hottest (yellow) areas of the coal fires can be relocated in the thermal satellite images of lower resolution. (after Kuenzer et al., 2007)

WAB 500102 021 Page 62 of 121
5.6 Monitoring coal fire extent and intensity using thermal photos in Wuda .6 Monitoring coal fire extent and intensity using thermal photos in Wuda Thermal cameras allow to assess the temperature patterns of individual cracks and vents and assessments at diurnal resolution or daily, weekly or monthly mapping is easily possible if a camera is available. Furthermore, panorama images taken from a distant point can reveal the temperature behavior of a larger fire zone during the day as well as during night. Currently, many research teams assess the option to map coal fires with thermal cameras mounted on ultra-light unmanned vehicles, which would strongly reduce costs of manned flight campaigns and which could be easily repeated.
Thermal cameras allow to assess the temperature patterns of individual cracks and vents and assessments at diurnal resolution or daily, weekly or monthly mapping is easily possible if a camera is available. Furthermore, panorama images taken from a distant point can reveal the temperature behavior of a larger fire zone during the day as well as during night. Currently, many research teams assess the option to map coal fires with thermal cameras mounted on ultra-light unmanned vehicles, which would strongly reduce costs of manned flight campaigns and which could be easily repeated.
A
B
C Figure 24 A: Coal fire #7 in Wuda coal mining syncline. Handheld thermal image overlay on ordinary
daytime photograph, shot from a distance with a FLIR camera to visualize what optically cannot be seen during day. The heavily cracked and partially collapsed bedrock results from coal fire induced volume loss underground. Here the fire is raging underneath.
Figure 24 A: Coal fire #7 in Wuda coal mining syncline. Handheld thermal image overlay on ordinary daytime photograph, shot from a distance with a FLIR camera to visualize what optically cannot be seen during day. The heavily cracked and partially collapsed bedrock results from coal fire induced volume loss underground. Here the fire is raging underneath.
B: Daytime, and C: Nighttime thermal camera field photo. The images underline the usefulness of night-time investigations, since the fire’s hottest spots stand out with more contrast at night because the solar heating effect is minimized.
B: Daytime, and C: Nighttime thermal camera field photo. The images underline the usefulness of night-time investigations, since the fire’s hottest spots stand out with more contrast at night because the solar heating effect is minimized.
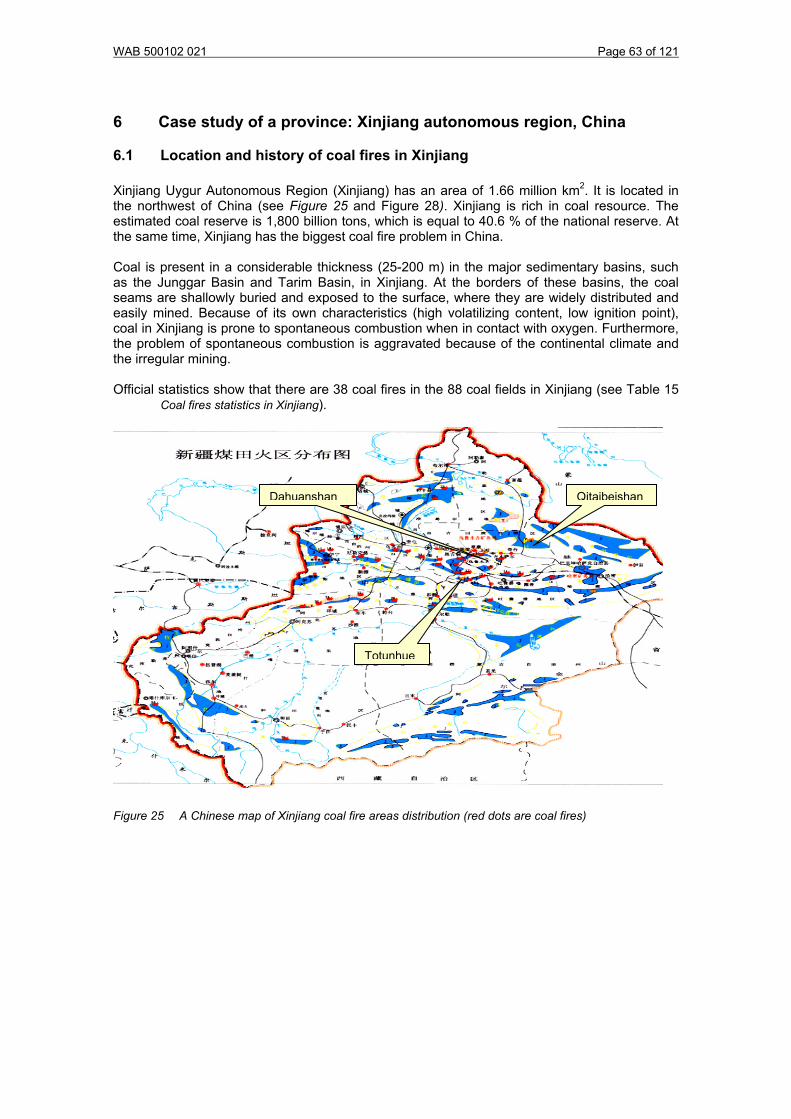
WAB 500102 021 Page 63 of 121
6 Case study of a province: Xinjiang autonomous region, China
6.1 Location and history of coal fires in Xinjiang Xinjiang Uygur Autonomous Region (Xinjiang) has an area of 1.66 million km2. It is located in the northwest of China (see Figure 25 and Figure 28). Xinjiang is rich in coal resource. The estimated coal reserve is 1,800 billion tons, which is equal to 40.6 % of the national reserve. At the same time, Xinjiang has the biggest coal fire problem in China. Coal is present in a considerable thickness (25-200 m) in the major sedimentary basins, such as the Junggar Basin and Tarim Basin, in Xinjiang. At the borders of these basins, the coal seams are shallowly buried and exposed to the surface, where they are widely distributed and easily mined. Because of its own characteristics (high volatilizing content, low ignition point), coal in Xinjiang is prone to spontaneous combustion when in contact with oxygen. Furthermore, the problem of spontaneous combustion is aggravated because of the continental climate and the irregular mining. Official statistics show that there are 38 coal fires in the 88 coal fields in Xinjiang (see Table 15 Coal fires statistics in Xinjiang).
Dahuanshan Qitaibeishan
Totunhue
Figure 25 A Chinese map of Xinjiang coal fire areas distribution (red dots are coal fires)

WAB 500102 021 Page 64 of 121
Table 15 Coal fires statistics in Xinjiang (shaded names appear in the text and/or illustrations) Burning
area Burning depth Lost coal
No. Coal fire name 10,000 m2 (m)
Thickness of
coalseam Quality of coal Carbon
content Coal fire status (MT)
Lost coal per year (MT/Y)
1 Tiechangou 1,2 120 10 Long Flame Coal 65% burning 216 10
2 Lamamiao 1 100 6 Long Flame Coal 65% burning 784 10
3 Beiyanghe Long Flame Coal 65% burning 10
4 Hefen 3 100 4 Long Flame Coal 65% burning 216 10
5 Kulongtiebuke Long Flame Coal 65% burning 10
6 Hongshan 0,9 50 28 Un-Sticky Coal 71% burning 20800 10
7 Qitaibeishan 3,53 28 28 Un-Sticky Coal 71% extinguished 6000
8 Laojiumiao 0,05 50 14 Un-Sticky Coal 71% burning 130 10
9 Balikongguan tanyao Un-Sticky Coal 71% burning 10
10 Sikeshu 2,72 175 23 Gas Coal 80% burning 5474 10
11 Bayinggou 11,76 200 27 Gas Coal 80% burning 3998 10
12 Shihezinanshan Weak-Sticky Coal 74% burning 15
13 Qingshuihequoergou Long Flame Coal 65% burning 15
14 Toutunhue 14,35 100 8 Un-Sticky Coal 71% burning 33736 50
15 Xishan 1,03 100 20 Long Flame Coal 65% burning 3350 10
16 Tiechanggou 0,47 125 Gas Coal 80% extinguished 4825
17 Dahuanshan 27,46 175 30 Gas & Fat Coal 82% extinguished 49022
18 Shuixigou 0,5 125 25 Gas Coal 80% burning 556 10
19 Dabancheng 0,5 100 13 Gas Coal 80% burning 169 10
20 Nanshan 18 250 27 Gas Coal 80% burning 31302 10
21 Shandaoling 0,7 25 14 Un-Sticky Coal 71% extinguished 100
22 Nandahu 0,12 50 53 Long Flame Coal 65% extinguished 130
23 Qiquanhu 0,6 100 8,5 Long Flame Coal 65% burning 10
24 Ke-er Jian 1,02 100 15 Long Flame Coal 65% burning 1139 50
25 Erweiergou 1,2 50 18 Gas & Fat Coal 82% extinguished 4680
26 Huorongdong 0,4 75 23 Gas/long flame 70% burning 10
27 Nileke 0,38 60 8 Gas Coal 80% burning 232 10
28 Aremale 0,5 60 23 Gas/long flame 70% extinguished 1196 10
29 Zhaosu 0,28 75 23 Long Flame Coal 65% extinguished
30 Hamangou 0,39 55 17 Long Flame Coal 65% burning 38 10
31 Yangxia 1 200 30 Gas/weak sticky coal 67% burning 624 15
32 Aer 82%
33 Ezeibulayan 9,4 225 28 Gas/fat coal
burning 18880 10
34 Tielieke 0,2 55 8 Lean coal 86% burning 150 30
35 Kalasu 10 150 16 Gas/weak sticky coal 67% burning 9987
36 Qiaokuang 0,7 100 8 Lean coal 86% burning 2000 20
37 Kuangchenzi 2 125 8 Fat coal 86% burning 1976 10
38 Bayiling 0,3 100 6 Lean coal 86% burning 568 30
Total Xinjiang 115,66 202278 435
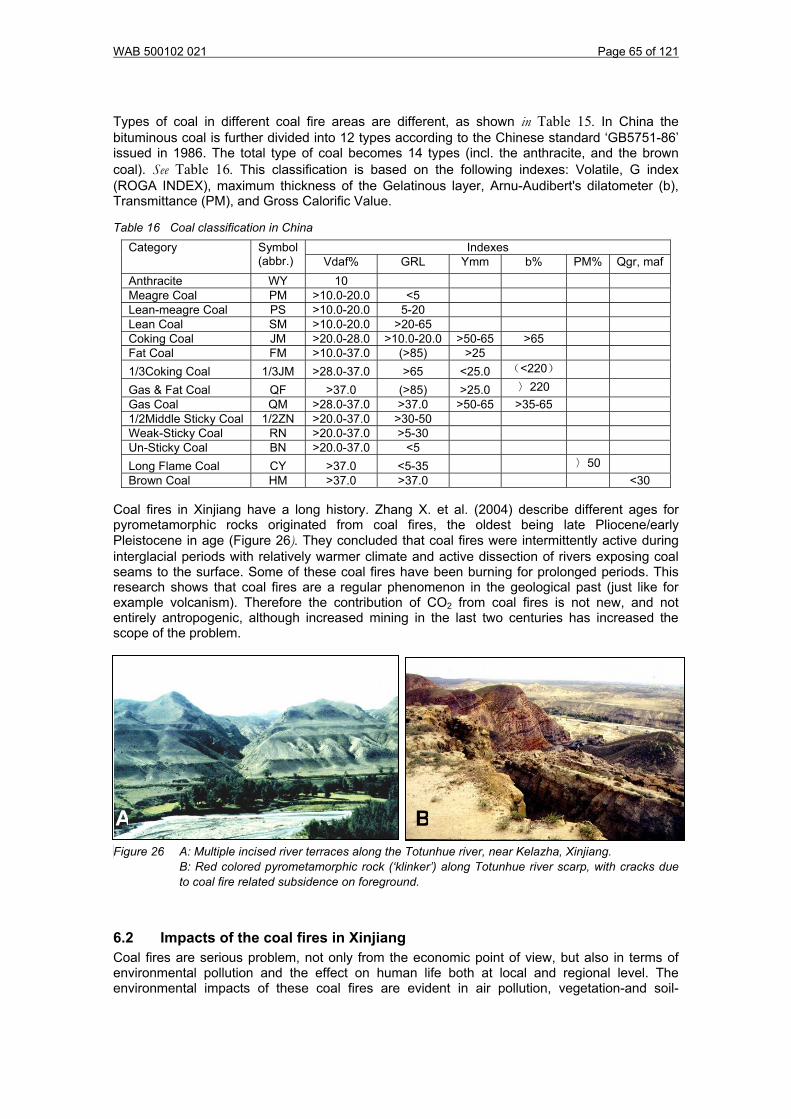
WAB 500102 021 Page 65 of 121
Types of coal in different coal fire areas are different, as shown in Table 15. In China the bituminous coal is further divided into 12 types according to the Chinese standard ‘GB5751-86’ issued in 1986. The total type of coal becomes 14 types (incl. the anthracite, and the brown coal). See Table 16. This classification is based on the following indexes: Volatile, G index (ROGA INDEX), maximum thickness of the Gelatinous layer, Arnu-Audibert's dilatometer (b), Transmittance (PM), and Gross Calorific Value.
Table 16 Coal classification in China Indexes Category Symbol
(abbr.) Vdaf% GRL Ymm b% PM% Qgr, maf Anthracite WY 10 Meagre Coal PM >10.0-20.0 <5 Lean-meagre Coal PS >10.0-20.0 5-20 Lean Coal SM >10.0-20.0 >20-65 Coking Coal JM >20.0-28.0 >10.0-20.0 >50-65 >65 Fat Coal FM >10.0-37.0 (>85) >25 1/3Coking Coal 1/3JM >28.0-37.0 >65 <25.0 (<220)
Gas & Fat Coal QF >37.0 (>85) >25.0 〉220 Gas Coal QM >28.0-37.0 >37.0 >50-65 >35-65 1/2Middle Sticky Coal 1/2ZN >20.0-37.0 >30-50 Weak-Sticky Coal RN >20.0-37.0 >5-30 Un-Sticky Coal BN >20.0-37.0 <5 Long Flame Coal CY >37.0 <5-35 〉50 Brown Coal HM >37.0 >37.0 <30
Coal fires in Xinjiang have a long history. Zhang X. et al. (2004) describe different ages for pyrometamorphic rocks originated from coal fires, the oldest being late Pliocene/early Pleistocene in age (Figure 26). They concluded that coal fires were intermittently active during interglacial periods with relatively warmer climate and active dissection of rivers exposing coal seams to the surface. Some of these coal fires have been burning for prolonged periods. This research shows that coal fires are a regular phenomenon in the geological past (just like for example volcanism). Therefore the contribution of CO2 from coal fires is not new, and not entirely antropogenic, although increased mining in the last two centuries has increased the scope of the problem.
A B Figure 26 A: Multiple incised river terraces along the Totunhue river, near Kelazha, Xinjiang. B: Red colored pyrometamorphic rock (‘klinker’) along Totunhue river scarp, with cracks due
to coal fire related subsidence on foreground.
6.2 Impacts of the coal fires in Xinjiang Coal fires are serious problem, not only from the economic point of view, but also in terms of environmental pollution and the effect on human life both at local and regional level. The environmental impacts of these coal fires are evident in air pollution, vegetation-and soil-

WAB 500102 021 Page 66 of 121
degradation. The amount of poisonous gas emissions, such as CO, CO2, H2S, SO2, SO3 in the coal fire areas is about 100 times above the national criteria. In vegetated areas, the forests and meadows burnt by the coal fires lead to soil erosion and desertification. From Table 15 it can be seen that the coal fires in Xinjiang make up for 435 Mt of coal loss per year. It is estimated that there are about 13.5 Mt of coal directly burnt out per year. Most coal seams in Xinjiang have a high dip angle (close to vertical), which makes a coal fire influence more area. When there is a coal fire on the surface, it blocks the coal below from mining. The coal below a fire is hard to be mined, and it is counted as coal loss. A coal fire makes less coal loss when the coal seam is horizontal (as for example in Qitaibeishan). 6.3 Coal fire fighting methods in Xinjiang Coal fire fighting in Xinjiang started in 1958, when the Xinjiang coal fire fighting team, the first in China, was established. By filling water through drills to the active fires and filling loess (fine wind-blown sediment) to the cracks and covering loess on the surface to isolate the coal fires from oxygen, the Xinjiang coal fire fighting team has been working in 14 coal fire fields, covering a total area of over 6 km2 by 1995. By the end of 2007, the Xinjiang coal fire fighting team has extinguished Qitaibeishan (Figure 27), Liuhuanggou, Terak, Tiechanggou, Dahuangshan (Figure 29), Shandaoling, Nandahu, Erweiergou, Aremala, Zhaosu, etc. In 1995, the Xinjiang coal fire fighting team made a plan to distinguish all the coal fires in Xinjiang by the year of 2015, instead of the 2020 in the previous plan. Some of the fire-fighting successes are mentioned in the press (see Appendix I), for example: BBC News (http://news.bbc.co.uk/1/hi/world/asia-pacific/3978329.stm) Nature News (http://www.nature.com/news/2007/071122/full/news.2007.281.html)
A BFigure 27 A: Qitaibeishan open pit mining with coal fire. B: Inspection of borehole in sand/gravel covered coal fire at Qitaibeishan (1995).
Coal fire fighting methods are mainly the same as the methods used in Ningxia (balnketing with overburden (loess, sand, gravel), injection of water and mud.
6.4 Monitoring coal fires in Xinjiang During 1994 to 1997, the ITC had a joint project ‘Environmental monitoring of spontaneous combustion in the North China Coalfields ‘, with Aerophotogrammetry and Remote Sensing Centre of China Coal Industry (ARSC). The project was mainly conducted in Xinjiang and aimed to develop fast and effective detection methods of coal fires based on latest remote sensing techniques and geological information of the coal basins in which coal fires occur, and to develop a system to monitor the coal fires and the effectiveness of coal fire fighting measures, based on remote sensing data and other information. With the help of the products of the project, coal fires in Xinjiang could be well monitored. At that time, the main source of satellite imagery was the Landsat TM, particularly the night-time images of thermal band 6 turned out to

WAB 500102 021 Page 67 of 121
be the most useful. Since 2003, the Sino-German Coal Fire Research projects are also active in Xinjiang, see: http://www.coal fire.caf.dlr.de/intro_en.html (Figure 28). It is reported that during the last 50 years, the Xinjiang coal fire fighting team has already extinguished 8 coal fire fields, and is working on 31 coal fires (Note: the number of coal fire locations varies in different reports, depending on the definition of areas/subareas). The total area is about 9.27 Mm2. 30.8 billion tons of coal have been protected from the fires, and 0.37 billion tons of CO2 reportedly was reduced to release to the air. 13.5Mt of coal per year burnt from coal fire in Xinjiang generate about 35 million tons of CO2.
DahuanshanQitaibeishan
Totunhue
Figure 28 Overview Xinjiang. Location: latitude 42°31' to 42°50, longitude 81°19 to 81°S34', Source: DMT field report, 2002, unpublished. Two locations of the German project are
indicated (Tielieke and Ke-er Jian). The other three locations illustrated in this section are also labelled (Qitaibeishan, Dahuanshan and Totunhue).
See: http://www.coal fire.caf.dlr.de/projectareas/project_area_en.html

WAB 500102 021 Page 68 of 121
Figure 29 Fire fighting techniques at Xiaolongkao/xiaohuangshan coal fire in Dahuanshan coal mining
area (Number 17 in Table 15), Xinjiang, illustrating a combined effort of covering coal fires with overburden, and injection if water/mud in the hot zone.
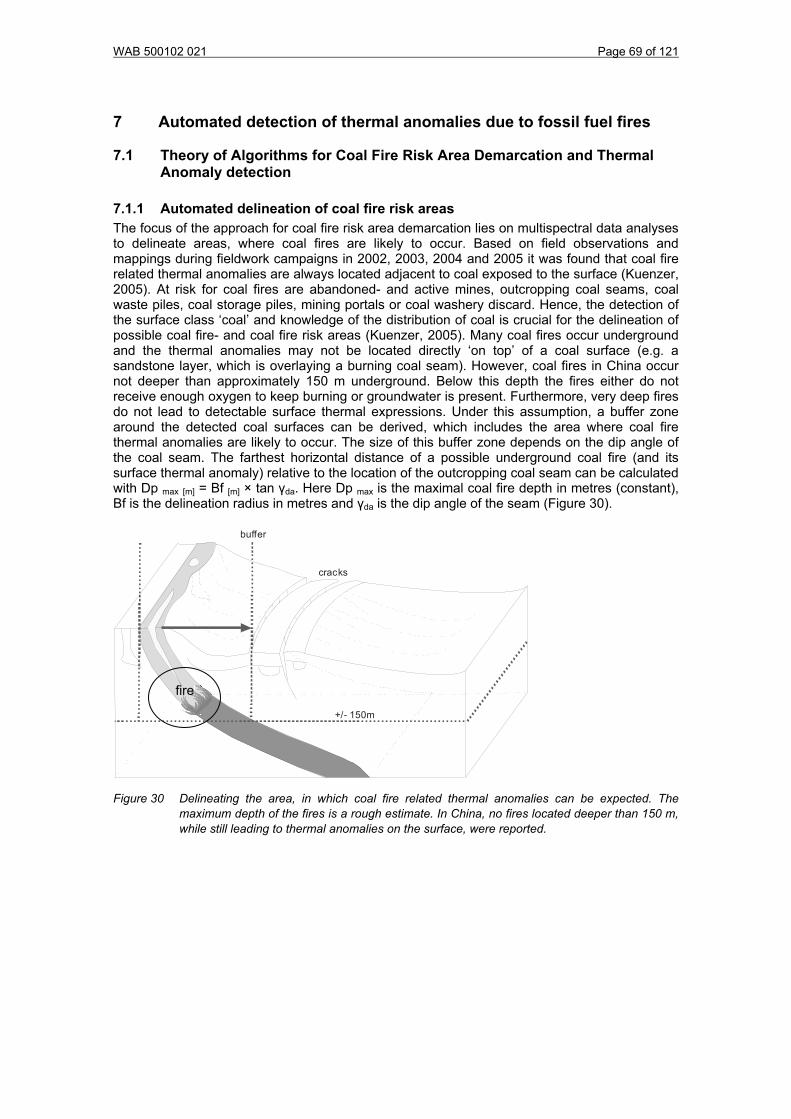
WAB 500102 021 Page 69 of 121
7 Automated detection of thermal anomalies due to fossil fuel fires
7.1 Theory of Algorithms for Coal Fire Risk Area Demarcation and Thermal Anomaly detection
7.1.1 Automated delineation of coal fire risk areas The focus of the approach for coal fire risk area demarcation lies on multispectral data analyses to delineate areas, where coal fires are likely to occur. Based on field observations and mappings during fieldwork campaigns in 2002, 2003, 2004 and 2005 it was found that coal fire related thermal anomalies are always located adjacent to coal exposed to the surface (Kuenzer, 2005). At risk for coal fires are abandoned- and active mines, outcropping coal seams, coal waste piles, coal storage piles, mining portals or coal washery discard. Hence, the detection of the surface class ‘coal’ and knowledge of the distribution of coal is crucial for the delineation of possible coal fire- and coal fire risk areas (Kuenzer, 2005). Many coal fires occur underground and the thermal anomalies may not be located directly ‘on top’ of a coal surface (e.g. a sandstone layer, which is overlaying a burning coal seam). However, coal fires in China occur not deeper than approximately 150 m underground. Below this depth the fires either do not receive enough oxygen to keep burning or groundwater is present. Furthermore, very deep fires do not lead to detectable surface thermal expressions. Under this assumption, a buffer zone around the detected coal surfaces can be derived, which includes the area where coal fire thermal anomalies are likely to occur. The size of this buffer zone depends on the dip angle of the coal seam. The farthest horizontal distance of a possible underground coal fire (and its surface thermal anomaly) relative to the location of the outcropping coal seam can be calculated with Dp max [m] = Bf [m] × tan γda. Here Dp max is the maximal coal fire depth in metres (constant), Bf is the delineation radius in metres and γda is the dip angle of the seam (Figure 30).
buffer
+/- 150m
cracks
fire
Figure 30 Delineating the area, in which coal fire related thermal anomalies can be expected. The maximum depth of the fires is a rough estimate. In China, no fires located deeper than 150 m, while still leading to thermal anomalies on the surface, were reported.

WAB 500102 021 Page 70 of 121
Coal fires lead to the degradation and decay of vegetation. Subsurface fires are not found underneath densely vegetated soil or bedrock (Kuenzer and Voigt, 2003, Gupta and Prakash 1998). Very hot coal fires lead to the pyrometamorphosis of the surrounding bedrock. If the thermal intensity of a fire is high enough colour and texture changes of the adjacent strata can occur (Zhang, J., 1996). These two phenomena can be detected in remote sensing data. They are also considered in the knowledge based test sequence, which was employed for coal surface extraction and is presented following. However, since they are not the key element for the delineation of risk areas and since pyrometamoprhic areas (and influenced pixels) are rare, this is not presented in detail here (Figure 31). The sequence automatically extracts coal surfaces from multispectral data. Following, the area in a certain radius is delineated, to yield possible coal fire risk areas. Within these risk areas densely vegetated areas can be excluded and pixels of pyrometamorphic rock can be highlighted. The spectral test sequence is based on the principle of decision trees, which are a simple and transferable method to classify image data without user interaction once the tree has been designed. The spectral tests and the individual thresholds were defined based on extensive statistical analysis of spectral reflectance signatures from a larger number of Landsat scenes. This grants temporal and spatial transfer of the sequence. Figure 31 demonstrates the working steps of the algorithm. A complete ETM+ or Aster layer stack is used to generate several intermediate data products. These are spectral mean value channels (SPM) and vegetation indices (here SAVI, the soil adjusted vegetation index for arid regions) followed by testing for the three surfaces of interest as mentioned. Following, the test sequence for Landsat 7 ETM+ data is presented.
Figure 31 Radiometrically corrected Landsat-7 ETM+ spectra for different surfaces. (here: 6=mid infrared, 7=thernak infrared to present channels in the correct wavelengths range). The image spectra of coal (black diamonds) and shadow (black squares) run nearly parallel and can only be differentiated by temperature differences. Water (grey diamonds) shows a similar spectral behavior in the first four bands but differs in the far near infrared and mid infrared. The separability of coal, vegetation, or geologic surfaces, like sandstone, limestone and desert sand (upper three signatures) is good. The right part shows average reflectance and standard deviation of coal (left), shadow margin areas (second left), shadowed areas (second right) and water of the Yellow River (right). Especially coal and shadow margin regions can be easily confused. Here, the thermal band can support separation of classes.

WAB 500102 021 Page 71 of 121
(a) Coal extraction: Test 1: Synthetic spectral mean test SPM123457 From all input bands except the thermal channel a synthetic band is calculated, containing the spectral mean (SPM) of each pixel over all bands. This mean channel gives an indication of the albedo of a surface over the whole covered wavelength region. Surface classes like coal, clear water or shadow have low spectral mean values due to their overall low reflectance (ρ [%]) in the visible (VIS), near infrared (NIR) and mid infrared (MIR) domain. These three are therefore also the surface classes easily to be confused. Especially coal and shadow have near identical spectra and even illumination correction can not eliminate all shadowed areas within satellite data. ρ [%] SPM123457 ≥ 1 and ρ [%] SPM123457 ≤ 10 (7.1) (b) Coal extraction: Test 2: Synthetic spectral mean test SPM123 Additionally, a SPM was calculated over the visible bands 1, 2 and 3. For the synthetic mean channel of bands 1, 2, and 3 a lower threshold was defined at an average reflectance of 1 % and an upper threshold was defined at 7 % reflectance. ρ [%] SPM123 ≥ 1 and ρ [%] SPM123 ≤ 7 (7.2) These first two thresholds help to delineate coal surfaces from other geologic surfaces. Shadow, shadow margin areas and deep water cannot be separated yet. (c) Coal extraction: Test 3: Shadowed area tests To eliminate conflict situations, where shadow pixels are still mistakenly extracted as coal after the two SPM the following tests are applied: Shadow file from ATCOR-3 = 0 (7.3) ρ [%] band 1 = 0 (7.4) ρ [%] band 2 = 0 (7.5) ρ [%] band 3 = 0 (7.6) The first test includes the shadow-file, which is created during illumination correction in ATCOR-3 (Richter, 1998). This test is similar to the retrieval and exclusion of shadowed areas out of a DEM-derived illumination file directly. Fully shadowed regions (shadow file = 0) are defined as areas, where the pixel consists purely of shade and the geometry between the pixel (relief), Sun and satellite sensor does not allow for a return signal in these wavelengths. In contrast, other shadowed pixels may only contain part of a shadow (shadow margin) and, therefore, allow for a weakened spectral signal. Such shadowed areas, which are not excluded in the shadow file, can fulfill all or some of the equations 7.4 to 7.6. They can therefore be excluded and will not be interpreted as coal surfaces. Only pixels not fulfilling any of the equations will continue in the test sequence. (d) Coal extraction: Test 4: NIR test This test excludes pixels, whose reflectance is too high in the NIR band 4 to belong to the class coal. Pixels, which pass this test continue in the testing sequence, pixels, which do not pass the test are excluded from further analysis. ρ [%] band 4 ≤ 10 (7.7) (e) Coal extraction: Test 5: Test for water surface exclusion This test supports the exclusion of water surfaces, which might still be left within the remaining pixels, which passed tests 1 and 2 and 4 and were not excluded by test 3. Water surfaces often have low overall albedo and, therefore, may pass tests 1 and 2. Their differentiation criterion to

WAB 500102 021 Page 72 of 121
coal is that they usually exhibit lower reflectances in band 5 and band 7. Here, the spectrum of water has decreasing reflectances from blue to the MIR. ρ [%] band 5 ≥ 5 (7.8) ρ [%] band 7 ≥ 5 (7.9) ρ [%]bands 4, 5, 7 > 0 (7.10) Pixels, which do pass this test continue in the test sequence, pixels which do not fulfil the criteria of 8 and 9 are assumed to be water surfaces. If 7.10 is fulfilled these are either shadow surfaces (which were already excluded by test 3), or water surfaces of extremely low reflectance. (f) Coal extraction: Test 6: Temperature test The inclusion of the thermal band can increase the separability of classes. The thermal band (calibrated and radiometrically corrected to land surface temperature, LST) is included in the test sequence. This test excludes pixels, which passed test 1 and test 2, did not pass test 3 and passed tests 4 and 5, but whose temperatures are not suitable for coal surfaces. A problem with this test is that the temperature behaviour of a surface changes over the year. Daily and annual amplitudes of a surface are not only a function of the surface’s thermal inertia but also of longitude and latitude, elevation, microclimatic location and strongly depend on the season’s climate, shading, wind, snow cover etc. It is not possible to define a fixed absolute temperature threshold applicable for several regions and multi-date imagery. Therefore, a relative temperature test was defined. This relative approach is transferable from scene to scene. It might not yield as exact results as an absolute threshold but allows for multi-scene processing. ρ [°C] > Global mean band 6 [°C] (7.11) Here ρ is emission of thermal radiation, which should not be confused with emissivity. Condition 11 tests, if the pixel under investigation has a temperature exceeding the global mean of the thermal band. This is based on the finding that shaded pixels (cooler) are always located left (at lower temperatures) of the global mean of band 6, whereas coal pixels are located right (at warmer temperatures) of the global temperature mean. Pixels, which pass tests 1, 2, 4, 5 and 6 and which do not pass test 3 are defined as coal pixels. The final result of the above knowledge based coal extraction methodology is majority filtered with a 3 × 3 matrix. This statistical filter excludes single scattered pixels. Following this filter application, a buffer region is generated around the extracted coal surfaces. The radius of the buffer depends on the prevalent dip angle in the area. If no information on the general dip of the strata is available, the algorithm runs with a default buffer size of 500 or 1000 m, depending on analyst choice. With such a radius prevalent dip angles of 16° and more and 8.5° and more are covered. However, this buffer size can be adjusted depending on test area.
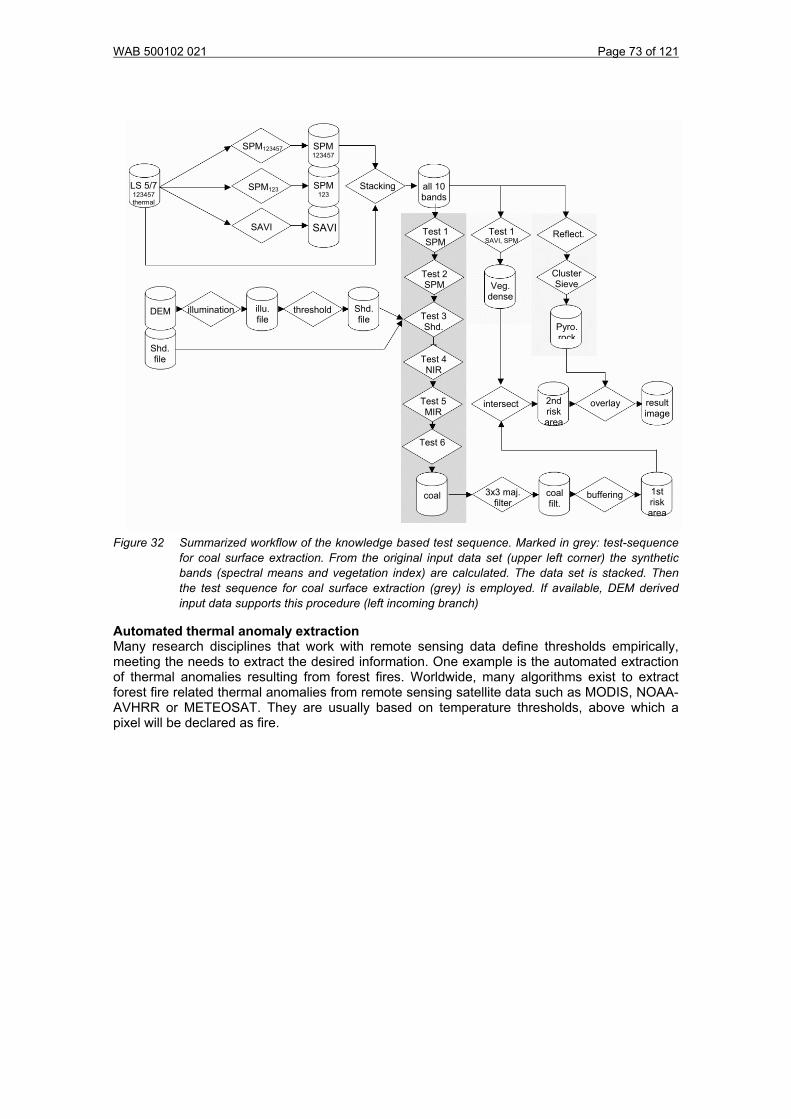
WAB 500102 021 Page 73 of 121
Reflect.
Cluster Sieve
Pyro. rock
Test 1 SAVI, SPM
Veg. dense
SPM 123457
SPM123
SAVI
Stacking all 10 bands
Shd. file
Test 1
Test 4 NIR
Test 5 MIR
Test 6
coal 3x3 maj. filter
coal filt.
buffering 1st risk area
intersect overlay result image
2nd risk area
SPM
LS 5/7
SAVI
DEM Shd. file
illumination threshold
Test 2
Test 3 Shd.
SPM
illu. file
SPM 123 123457
thermal
SPM123457
Figure 32 Summarized workflow of the knowledge based test sequence. Marked in grey: test-sequence
for coal surface extraction. From the original input data set (upper left corner) the synthetic bands (spectral means and vegetation index) are calculated. The data set is stacked. Then the test sequence for coal surface extraction (grey) is employed. If available, DEM derived input data supports this procedure (left incoming branch)
Automated thermal anomaly extraction Many research disciplines that work with remote sensing data define thresholds empirically, meeting the needs to extract the desired information. One example is the automated extraction of thermal anomalies resulting from forest fires. Worldwide, many algorithms exist to extract forest fire related thermal anomalies from remote sensing satellite data such as MODIS, NOAA-AVHRR or METEOSAT. They are usually based on temperature thresholds, above which a pixel will be declared as fire.

WAB 500102 021 Page 74 of 121
LM
LM
LM
LM
LM
LM
LM
LM
LM
Figure 33 A moving window filter of varying size (11*11 to 35 * 35) investigated the thermal data set. The histogram of each sub-window can contain no thermal anomaly at all – gradually up to being 100 % filled with a thermal anomaly as presented above in synthesized image subsets. We assume that every sub-window histogram contains a part representing the background temperatures (B) and the thermally anomalous part (F). The first local minimum after the main histogram maximum (LM) is defined as the relative threshold to separate those two. This automated method will lead to a loss of thermal anomalies if e.g. the sub-window is 100 % filled by a thermal anomaly. It will furthermore indicate coal fire or thermal anomalies respectively if no thermal anomalous area is contained in the image. However, since every centre pixel is investigated for over 1000 times and has to be declared as ‘thermally anomalous’ in at least 70 % of the tests, this error is kept as low as possible. The principle of the algorithm is shown in the lower left area of the figure, the lower right area shows clustered thermal anomalies (pixel size 60 m) above subsurface coal fires in Wuda (left) and above coal industrial plants (right)
It needs to be underlined that the task to detect a coal fire related thermal anomaly against a normal temperature background is much more complex than for example detecting a forest fire signal. Coal fire surface expressions are very subtle. Even if a 30 cm long crack in an area of underground coal fires emits 400 °C hot gasses, the overall temperature of the 60 x 60 m (or coarser) thermal pixel might only be raised a few degrees Celsius against the background. Thus, coal fire anomalies are extremely weak anomalies, which can by no means be compared with thermal applications like forest fire detection, lava flow detection or the spotting of large industrial heat islands. Coal fire thermal anomaly detection, and here especially subsurface coal fire detection, is considered a very difficult task. In recent decades, coal fires were thus mainly

WAB 500102 021 Page 75 of 121
delineated by manual thresholding techniques, where the fire outline was already known (e.g. through in situ field mapping or from coal fire maps provided by mines). The threshold was then adjusted, so that the portion of the thermally anomalous area derived in this process fit the known fire outline as good as possible. Such interactive analyses can lead to very detailed coal fire maps, but only if other such detailed coal fire maps already exist. Therefore, it is often questionable, which additional or new information is gained from the Earth observation data. Furthermore, one single threshold cannot be applicable to all the coal fires within one satellite image and hence the image needs to be split into several subsets to extract each fire with its own optimum threshold. The disadvantage of these interactive analyses is a very time consuming processing. Results can hardly be repeated by a second analyst (interpreter’s bias) and the additional information gain is relatively low. The algorithm presented here circumvents the above disadvantages. It facilitates raw satellite data as input for a sub-image statistical analysis and is based on a moving window concept. For an image of M columns and N rows a small window with M1 columns and N1 rows is defined. (M1<=M, N1<=N). The window moves over the image with the step X, where (X<=M-M1) in the column direction and step Y (where Y<=N-N1) in the row direction. When the moving window passes the whole image, a pixel in the image will be sampled in (M1*N1)/(X*Y) subsets. This moving window of varying size (depending on sensor of input data, usually between 11*11 and 35*35) investigates the histogram of the image subsets concerning the occurrence of thermally anomalous pixels. Based on the assumption that each histogram of such a sub-image is the combination of a background part and a coal fire part, the thermally anomalous part is separated from the background part. To not employ empirical thresholds a clearly defined mathematical point has to be chosen for separation. In this case the first local minimum after the main maximum (LM in Figure 33) could be defined as the criterion allowing the separation of thermally anomalous pixels from background pixels (see Figure 31). In a moving window approach each centre pixel within this window matrix is sampled multiple times (depending on window size, which varies). In the present case the window sizes 11*11, 19*19, 27*27 and 35*35 were applied. One pixel is thus investigated 121+361+729+1225=2436 times. Only if a pixel is regarded as thermally anomalous in 70 % of the cases (>1706 times), it is declared as a thermal anomaly. In this way, strongly contrary to an overall threshold, the thermal anomalies extracted represent local anomalies. This means that pixels of very different temperature and within a different temperature background can be declared thermally anomalous. This method thus considers the large variation in coal fire anomaly temperatures and locations. Figure 34 shows histograms for three coal fire areas – fire #8 in Wuda syncline, fire # 41 in Rujigou and fire # 21 in Gulaben. All three fires have different minimum and maximum pixel values as well as a differing temperature range in thermal night-time data.
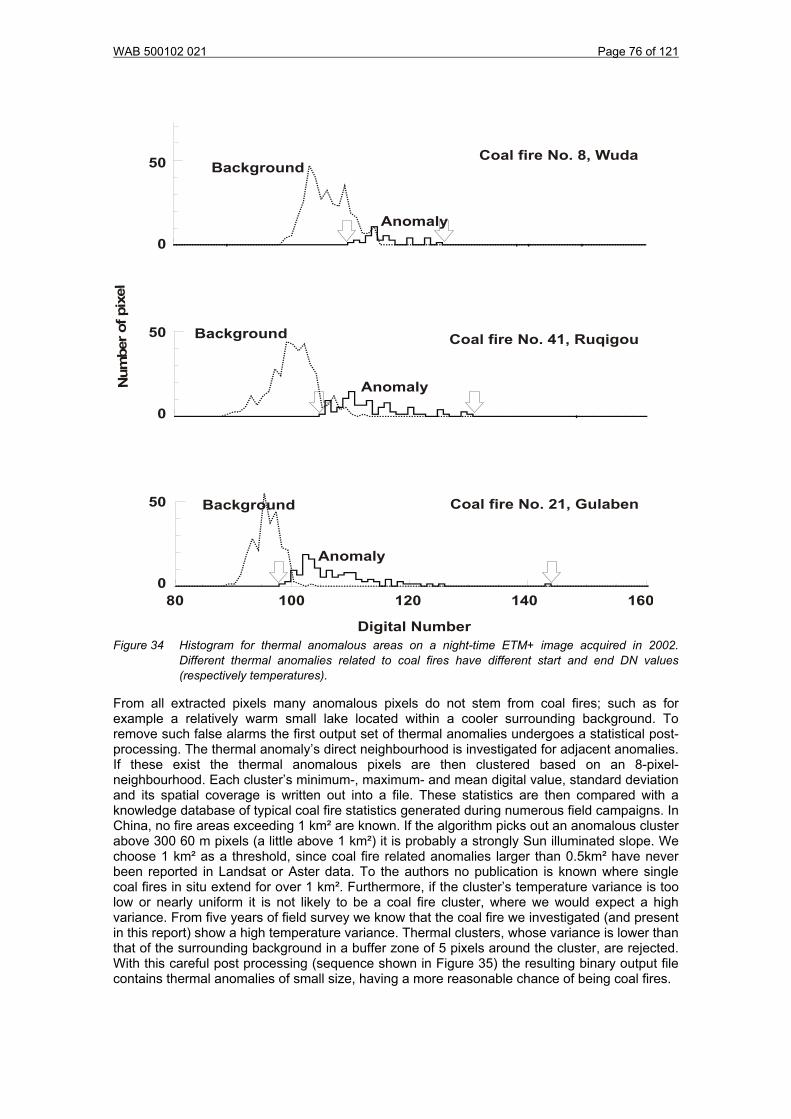
WAB 500102 021 Page 76 of 121
Num
ber o
f pix
el
0
50
0
50
0
50
80 100 120 140 160
Digital Number
Coal fire No. 41, Ruqigou
Coal fire No. 8, Wuda
Coal fire No. 21, Gulaben
Anomaly
Anomaly
Anomaly
Background
Background
Background
Figure 34 Histogram for thermal anomalous areas on a night-time ETM+ image acquired in 2002. Different thermal anomalies related to coal fires have different start and end DN values (respectively temperatures).
From all extracted pixels many anomalous pixels do not stem from coal fires; such as for example a relatively warm small lake located within a cooler surrounding background. To remove such false alarms the first output set of thermal anomalies undergoes a statistical post-processing. The thermal anomaly’s direct neighbourhood is investigated for adjacent anomalies. If these exist the thermal anomalous pixels are then clustered based on an 8-pixel-neighbourhood. Each cluster’s minimum-, maximum- and mean digital value, standard deviation and its spatial coverage is written out into a file. These statistics are then compared with a knowledge database of typical coal fire statistics generated during numerous field campaigns. In China, no fire areas exceeding 1 km² are known. If the algorithm picks out an anomalous cluster above 300 60 m pixels (a little above 1 km²) it is probably a strongly Sun illuminated slope. We choose 1 km² as a threshold, since coal fire related anomalies larger than 0.5km² have never been reported in Landsat or Aster data. To the authors no publication is known where single coal fires in situ extend for over 1 km². Furthermore, if the cluster’s temperature variance is too low or nearly uniform it is not likely to be a coal fire cluster, where we would expect a high variance. From five years of field survey we know that the coal fire we investigated (and present in this report) show a high temperature variance. Thermal clusters, whose variance is lower than that of the surrounding background in a buffer zone of 5 pixels around the cluster, are rejected. With this careful post processing (sequence shown in Figure 35) the resulting binary output file contains thermal anomalies of small size, having a more reasonable chance of being coal fires.

WAB 500102 021 Page 77 of 121
Still, anomalies remain, which are not related to coal fires and which also cannot be distinguished from a coal fire anomaly. Such anomalies are smaller Sun illuminated surfaces, which pass the aerial threshold mentioned above, (even occurring in 10 pm night time data), anomalies resulting form industry, the heating of houses, burning of fields or garbage, or even forest or grassland fires. Here, the previously described algorithm for coal fire risk area delineation (Kuenzer, 2005) comes into play. The synergy of both algorithms is presented in the results section. The thermal algorithm works fully automatic for Landsat 5 TM, Landsat 7 ETM+, ASTER and MODIS data.
First Anomalies
Thermal algorithm:
Moving window extraction
Input thermal image
Clustering of adjacent anomalies
Clustered anomalies
Statistical analyses of clusters
Remaining anomalies
Figure 35 Sequence of the algorithm for automated thermal anomaly extraction. Moving window approach, anomaly clustering and statistical post processing.
7.2 Application of Algorithms for Coal Fire Risk Area Demarcation and Thermal Anomaly detection based on Landsat, MODIS and ASTER data
7.2.1 Combination of algorithm synergetic effects: Experiments with Landsat data To quantify the synergetic effect of the coal fire (risk) area delineation algorithm and the thermal anomaly detection algorithm, it was furthermore investigated, how many false alarm anomalies can be rejected through coal fire (risk) area delineation (based on 6 Landsat daytime and nighttime scenes). This is shown in Table 17.

WAB 500102 021 Page 78 of 121
Table 17 Coal fire risk area delineation supporting the exclusion of false alarms
Anomalies in # pixels extracted by thermal algorithm
Anomalies in # pixels rejected by coal fire risk area algorithm
Anomalous area before coal fire area delineation [km²]
Anomalous area after coal fire area delineation [km²]
226 / 211 ETM+ night 28.09.2002
451
243 (500m) 211 (1000m)
14.49
6.77 (500m) 7.54 (1000m)
129 / 033 ETM+ day 21.09.2002
10,911
9449 (500m)
8884 (1000m)
61.46
10.77 (500m)
13.22 (1000m)
129 / 033 ETM+ day 20.09.1987
9,817 9,078 (500m)
8593 (1000m)
100.41 8.48 (500m)
11.22 (1000m)
140 / 044 ETM+ day 02.11.2001
6,067
4533 (500m)
42.84
14.92 (500m)
128 / 032 ETM+ day 21.08.2002
15,653
15036 (500m)
83.90
3.90 (500m)
098 / 081 ETM+ day 15.11.2002
1334
1300 (500 m)
7.25
0.14 (500 m)
From the six scenes processed (5 daytime, 1 night-time) we calculated, how many thermally anomalous clusters were extracted, how many anomalies were rejected as false alarms through a clipping process with the delineated risk area (one time with a 500 m buffer, one time with a 1000 m buffer), and how large the resulting thermally anomalous area is. The thermal night-time data set yielded 243 or 211 remaining thermal anomalous clusters in the scene covering the two main study areas. The area of these clusters covers 7.54 km² and 6.77 km² respectively. From field mappings and local mining information it is known that coal fires in Wuda cover an area of roughly 4 km² and in Rujigou of around 2 km². Based on this result and through visual checks and ground validation we know that approximately 90% of the night-time thermally anomalous clusters within the delineated risk areas stem from coal fires. Only a small number of these clusters stems from coal mining related industry and other industries or settlements. From the daytime scenes an unevenly higher number of thermal anomalous clusters was extracted. This demonstrates the much higher need for the application of the delineation algorithm for daytime data. The scene from the study areas in 1987 yielded 9817 anomalous clusters. In 2002 it was already 10900 clusters. Illumination conditions were similar, since both scenes were acquired during the same day of the same month. From weather station data we know that both days were sunny and clear. Atmospheric differences will anyhow not influence single pixels reflectance values so strongly that they would pass as a coal pixel (which has nearly 0 reflectance, except in the thermal band). The increase in anomalies thus stems from the extension of the two presented coal fire areas, the ignition of new coal fires in new areas and an increase in industry and settlement in the region. Through risk area delineation over 80% of the anomalous clusters were rejected as false alarms However, even after the clipping with risk areas, the number of remaining thermally anomalous clusters was still higher in daytime data. This results from remaining solar effects and higher industrial and heat related activities during the daytime. However, it should also be mentioned that for Wuda not all coal fires were detected by the thermal algorithm. Even in night-time data only 14 of the, at that time (2002) existing 17, coal fires were detected. Three coal fires did simply show to week thermal signals to be extracted. These fires are usually fires, which are very small in extent or located very deep underground
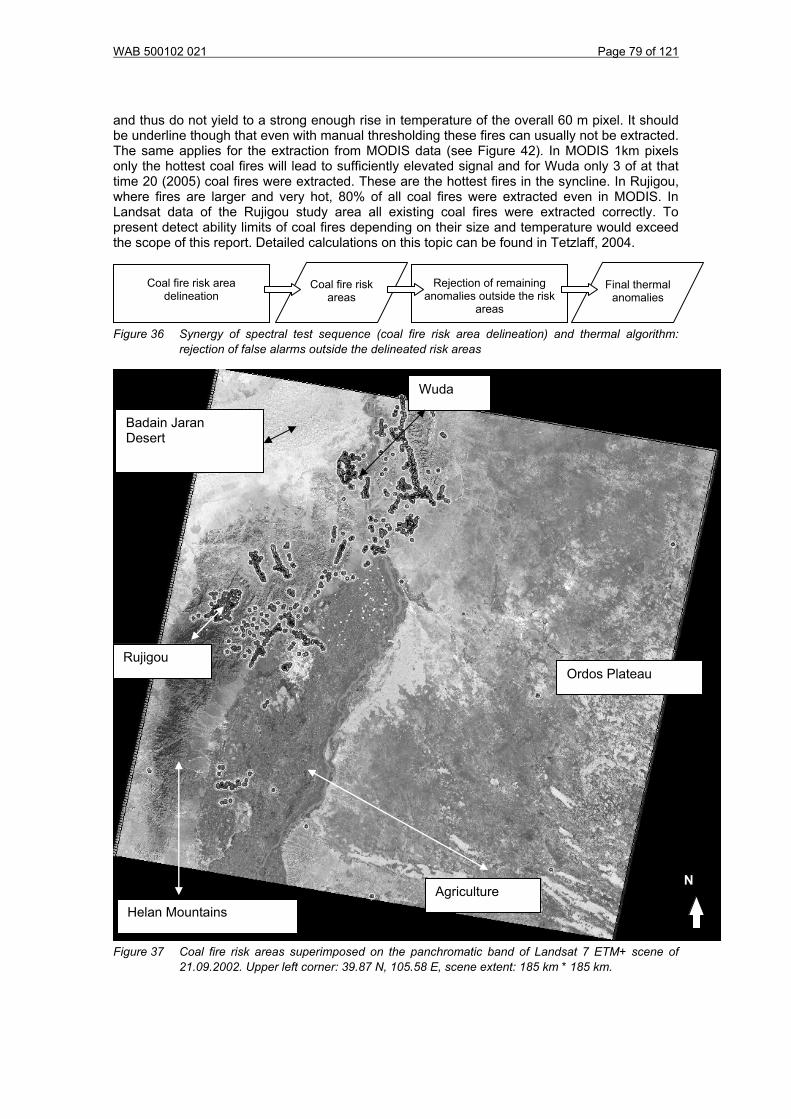
WAB 500102 021 Page 79 of 121
and thus do not yield to a strong enough rise in temperature of the overall 60 m pixel. It should be underline though that even with manual thresholding these fires can usually not be extracted. The same applies for the extraction from MODIS data (see Figure 42). In MODIS 1km pixels only the hottest coal fires will lead to sufficiently elevated signal and for Wuda only 3 of at that time 20 (2005) coal fires were extracted. These are the hottest fires in the syncline. In Rujigou, where fires are larger and very hot, 80% of all coal fires were extracted even in MODIS. In Landsat data of the Rujigou study area all existing coal fires were extracted correctly. To present detect ability limits of coal fires depending on their size and temperature would exceed the scope of this report. Detailed calculations on this topic can be found in Tetzlaff, 2004.
Coal fire risk areas
Rejection of remaining anomalies outside the risk
areas
Final thermal anomalies
Coal fire risk area delineation
Figure 36 Synergy of spectral test sequence (coal fire risk area delineation) and thermal algorithm: rejection of false alarms outside the delineated risk areas
Ordos Plateau
Badain Jaran Desert
Rujigou
Agriculture N
Helan Mountains
Wuda
Figure 37 Coal fire risk areas superimposed on the panchromatic band of Landsat 7 ETM+ scene of 21.09.2002. Upper left corner: 39.87 N, 105.58 E, scene extent: 185 km * 185 km.

WAB 500102 021 Page 80 of 121
Figure 38 Thermal clusters extracted with the automated detection algorithm based on Landsat 7 ETM+ night-time data from 28.09.2002 superimposed on the panchromatic band of Landsat ETM+ daytime data from 21.09.2002. Detected anomalies: w) Wuda coal fires, r) Rujigou coal fires, c) other confirmed coal fires, i) industrial installations. Extent of image: 80km by 90km.
i
i
i
i
i
106°30’E 107°E
39°N
39°30’N
w
cc
c
r
The powerful combination of the multispectral surface extraction algorithm for coal fire risk area delineation with the thermal anomaly extraction algorithm could furthermore be demonstrated, when new coal fires could be detected from remote sensing data exclusively.
7.2.2 Detection of unknown fires: Field survey in September 2003 In September of 2003, a field trip was undertaken to the remote area shown in Figure 38. The coal-fire fighting team of Wuda, which joined the survey, did not know about the area visited beforehand, nor did they have any information on possible coal fires in that region. The area is settled very sparsely and is only accessible via dirt roads. Information from the local inhabitants revealed that the region once was a prospering coal mining area. However, production had decreased drastically because of financial problems. With the help of GPS, the satellite data thermal anomalies were located in an area of very rugged terrain of former coal waste piles, abandoned mines, and heavily disturbed coal outcrops. Five of the six suspicious thermal anomalies (as extracted from thermal satellite sensor data and located within risk areas) were fires in a coal seam, whereas the other anomalies resulted from fires in a coal waste pile. Therefore, all six anomalies could be verified as coal fire anomalies. In this area, the fire temperatures ranged from 170ºC to 340ºC.

WAB 500102 021 Page 81 of 121
i s
c
c
Figure 39 Newly detected coal fire in the valleys of Hulusitai and Shitanjing about 30km northeast of
Rujigou. The two parallel running valleys are shown on the right side in a panchromatic subset of the Landsat ETM+ image of 21.09.2002. The subset is about 17 km * 10 km. Light blue: automatically extracted coal surfaces, yellow: coal fire risk areas, red: automatically detected thermal anomalous clusters. s: solar induced thermal anomalies, i: industry induced anomalies, c: confirmed newly detected coal fires. On the left side you see a collapsed bedrock surface and a vent. Up to 340° C hot gasses are emitted through the subsurface fire burning underneath.
7.2.3 Detection of unknown fires: Field survey in June 2004 In June 2004, another field trip was undertaken to the eastern side of the Yellow River, approximately 25 km southeast of Wuda (see Figure 38 and Figure 40). Based on remote sensing data exclusively, this area was expected to host at least one coal fire. The thermal anomalies that were extracted and located within the delineated areas were fires in underground coal seams. The local inhabitants knew about the fires; however, they were unknown to the mining authorities of Wuda city. According to a local worker, the fire had developed in private coal mines that were abandoned and sealed improperly. The local people started to seal these mines with sand and loess just recently. Coal-fire fighting is currently undertaken. A trench is dug in an attempt to separate the burning portion of the coal seam from the unaffected part (see Figure 40). To date the fire is not under control and spreads along the dip and strike directions.

WAB 500102 021 Page 82 of 121
former wild mines, improperly sealed
trenchh
Covering of fire
coal fire exhaust
trench
burning seam
a b
s
s i
i c c
i
i
Figure 40 Newly detected coal fire in the valley east of the Yellow River about 27 km southeast of Wuda city. The upper part shows a panchromatic subset of the Landsat ETM+ image of 21.09.2002. The subset is about 15 km * 10 km large. Light blue: automatically extracted coal surfaces, yellow: coal fire risk areas, red: automatically detected thermal anomalous clusters. s: solar induced thermal anomalies, i: industry induced anomalies, c: confirmed newly detected coal fires. The orange arrow indicates the location of the 2 the photographs.
7.2.4 Thermal anomaly extraction based on MODIS and ASTER data Generally, satellite data with a coarser spatial resolution in the thermal domain than that of LANDSAT-TM (120 m) was rarely used for coal fire research and did not yield promising results. Though Mansor et al. (1994) could spot very hot surface coal fires in Jharia with NOAA-AVHRR, Zhang, X. (1998) showed that the spatial resolution of NOAA-AVHRR data (1km) in general is too low to detect underground coal fires in Northwest China. Coal fire research based on MODIS has – to our knowledge – only been published by the authors of this report. With the partial failure of LANDSAT ETM+ in May 2003, ASTER nowadays is the only available sensor in orbit, which offers a thermal band with a comparable resolution to that of LANDSAT ETM+. For large area monitoring ASTER’s swath width is however insufficient. Furthermore,

WAB 500102 021 Page 83 of 121
especially in recent times the availability of ASTER data has been limited, since priority acquisition requests by national governments in the case of natural hazard and crisis (e.g. hurricanes Katrina and Wilma in the US, Tsunamis in Indonesia etc.) are more pressing. Therefore, we here present a multi-diurnal approach to exploit low resolution MODIS thermal bands data for coal fire detection. MODIS data is easily and freely accessible and the acquisition times of two MODIS sensors on two platforms (TERRA and AQUA) as well as several thermal bands offer advantages for analysis currently no other sensor can provide. The MODIS sensor consists of 36 spectral bands ranging from 0.62 µm to 14.385 µm. Spatial resolution at nadir is 250 m for bands 1 and 2 (VIS), 500 m for bands 3 to 7 (VIS and NIR) and 1000 m for bands 8 to 36 (VIS, NIR, MIR, TIR). At the sensors maximum scan angle of 55 degree near the far end of a swath the pixel sizes can reach almost 2 km * 5 km. However, large swath widths grant a higher revisiting frequency so that MODIS data is available daily for most spots on the earth’s surface. Due to the installation of the sensor on the platform TERRA (launched 1999) and an identical instrument on the platform AQUA (launched 2002) most areas can be covered four to five times daily: in the morning, afternoon, evening and pre-dawn. This grants frequent cloud free observations and a continuous monitoring of a desired area. For coal fire research especially bands 20 to 23 (ranging from 3.66 to 4.08 µm) as well as bands 31 and 32 (ranging from 10.78 to 12.27 µm) are of interest. These bands were designed for land surface temperature analysis. As datasets we chose datasets from the Jharia coal field in India, namely a morning and an evening scene on November 2nd 2001 and November 3rd 2001 respectively (a year when MODIS was only available on TERRA), as well as morning, afternoon, evening and pre-dawn scenes of February 12th, 2nd, 24th and 17th 2005, respectively. We chose early spring or late fall scenes since seasonal temperature patterns strongly influence thermal anomaly detection. Thermal anomaly detection is most successful when the contrast between the anomaly and its surrounding background are high. Such conditions are given during colder seasons, as well as during times of the day when solar effects are the least accentuated. Close before sunrise the earth’s surface has cooled off as much as possible. Effects of uneven solar heating due to different exposition (e.g. south sloped versus north slopes) or due to different thermal surface inertia (fast heating/cooling materials versus slow heating/cooling materials) are minimized. Thus, evening-, night-time- and especially pre-dawn data hold a big advantage for thermal anomaly detection (Kuenzer 2005).
Table 18 Specifications of MODIS images used in this study
Next to the MODIS data sets we employed one daytime LANDSAT data set from November 1st 2002 and one ASTER night-time thermal-band data set from March 5th 2005. Especially the ASTER thermal night-time dataset coincides temporally with the 4 MODIS datasets from 2005 and thus could act for thermal comparison and validation purposes. Furthermore, high resolution Quickbird data was available for the area from 2003, which allows the heat source identification of thermal anomalies.
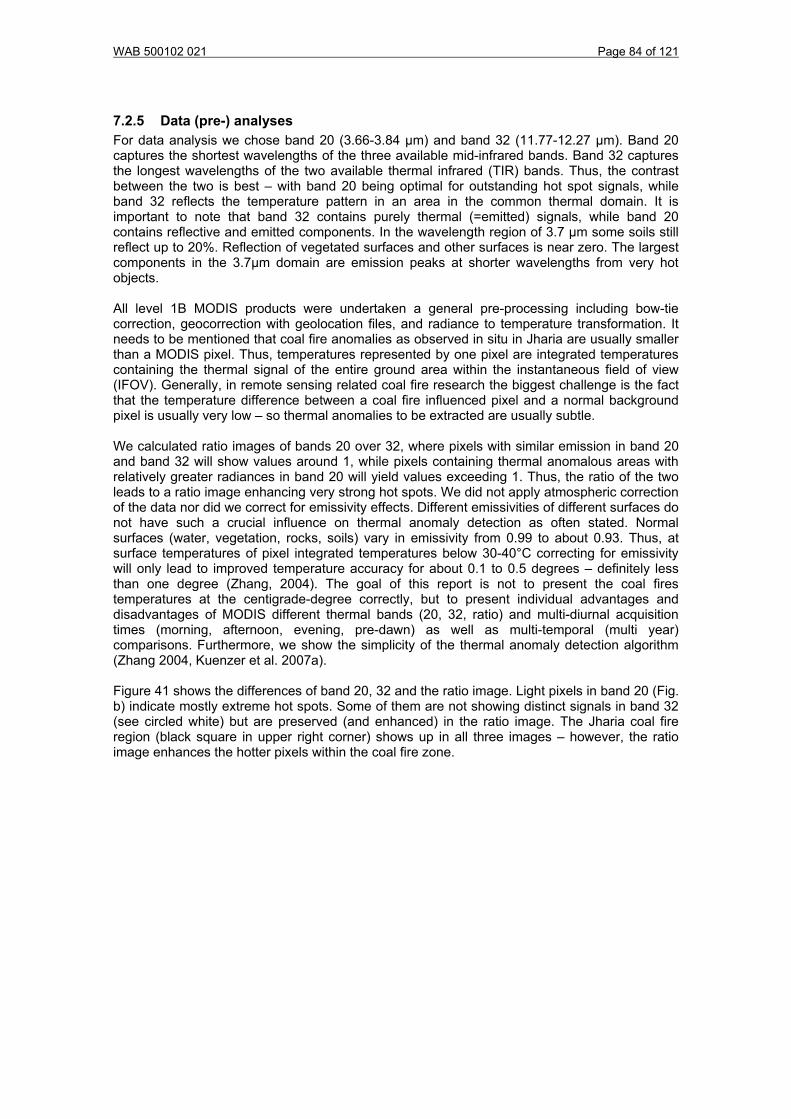
WAB 500102 021 Page 84 of 121
7.2.5 Data (pre-) analyses For data analysis we chose band 20 (3.66-3.84 µm) and band 32 (11.77-12.27 µm). Band 20 captures the shortest wavelengths of the three available mid-infrared bands. Band 32 captures the longest wavelengths of the two available thermal infrared (TIR) bands. Thus, the contrast between the two is best – with band 20 being optimal for outstanding hot spot signals, while band 32 reflects the temperature pattern in an area in the common thermal domain. It is important to note that band 32 contains purely thermal (=emitted) signals, while band 20 contains reflective and emitted components. In the wavelength region of 3.7 µm some soils still reflect up to 20%. Reflection of vegetated surfaces and other surfaces is near zero. The largest components in the 3.7µm domain are emission peaks at shorter wavelengths from very hot objects. All level 1B MODIS products were undertaken a general pre-processing including bow-tie correction, geocorrection with geolocation files, and radiance to temperature transformation. It needs to be mentioned that coal fire anomalies as observed in situ in Jharia are usually smaller than a MODIS pixel. Thus, temperatures represented by one pixel are integrated temperatures containing the thermal signal of the entire ground area within the instantaneous field of view (IFOV). Generally, in remote sensing related coal fire research the biggest challenge is the fact that the temperature difference between a coal fire influenced pixel and a normal background pixel is usually very low – so thermal anomalies to be extracted are usually subtle. We calculated ratio images of bands 20 over 32, where pixels with similar emission in band 20 and band 32 will show values around 1, while pixels containing thermal anomalous areas with relatively greater radiances in band 20 will yield values exceeding 1. Thus, the ratio of the two leads to a ratio image enhancing very strong hot spots. We did not apply atmospheric correction of the data nor did we correct for emissivity effects. Different emissivities of different surfaces do not have such a crucial influence on thermal anomaly detection as often stated. Normal surfaces (water, vegetation, rocks, soils) vary in emissivity from 0.99 to about 0.93. Thus, at surface temperatures of pixel integrated temperatures below 30-40°C correcting for emissivity will only lead to improved temperature accuracy for about 0.1 to 0.5 degrees – definitely less than one degree (Zhang, 2004). The goal of this report is not to present the coal fires temperatures at the centigrade-degree correctly, but to present individual advantages and disadvantages of MODIS different thermal bands (20, 32, ratio) and multi-diurnal acquisition times (morning, afternoon, evening, pre-dawn) as well as multi-temporal (multi year) comparisons. Furthermore, we show the simplicity of the thermal anomaly detection algorithm (Zhang 2004, Kuenzer et al. 2007a). Figure 41 shows the differences of band 20, 32 and the ratio image. Light pixels in band 20 (Fig. b) indicate mostly extreme hot spots. Some of them are not showing distinct signals in band 32 (see circled white) but are preserved (and enhanced) in the ratio image. The Jharia coal fire region (black square in upper right corner) shows up in all three images – however, the ratio image enhances the hotter pixels within the coal fire zone.

WAB 500102 021 Page 85 of 121
Figure 41 Comparison of MODIS radiant temperatures in band 20 (b) and band 32 (c), and ratio image (d) for pre-dawn data of February 17, 2005. The LANDSAT subset (a) is for orientation. Both radiant temperature images (b, c) show strong variations in background temperature. Lighter pixel values indicate higher temperatures. The ratio image enhances hot thermal anomalies as high pixel values and suppresses background variation. Extent of image: 172 km x 85 km. Projection: UTM, zone 45 North, WGS 84. Box surrounded in black in upper right corner: Jharia coal mining region.
Based on these data sets we now applied a fully automatic approach for thermal anomaly extraction of regional thermal anomalies to the data. Figure 42shows the result of an automatic extraction – here not for the Jharia area in India, but for the Wuda and Rujigou coal fire sites in China

WAB 500102 021 Page 86 of 121
Figure 42 Thermal clusters extracted with the automated detection algorithm based on MODIS ratioed pre-dawn data from 02.02.2005. Detected anomalies: w) Wuda coal fires, r) Rujigou coal fires, c) other confirmed coal fires, i) industrial installations, y) Yellow River. Ground extent (field mapping) of Wuda and Rujigou coal fires are indicated as polygons in white and dark gray, respectively. Background image: Landsat 7 ETM+ from 21.09.2002, band 1. Extent of image: 80km by 90km.
7.2.6 Multi band extraction results The algorithm for thermal anomaly extraction was applied to all MODIS datasets as well as to an ASTER and LANDSAT dataset for later comparison. For all MODIS images band 20, 32 and the calculated ratio was processed. As a result we receive output images with black background areas (0) and extracted regional thermal anomalies (grey) counted as anomalous 70%-85% of investigated times (1) and extracted regional anomalies (white) counted as anomalous > 85% of times (2). Extraction results for band 20, band 32 and the ratio band from one MODIS dataset (pre-dawn from Feb. 17th 2005) are shown in Figure 43. Statistics are presented in Figure 44. The MODIS subset contained 14705 pixels of 1 km² each. In Figure 43 the first prominent observation is that the Jharia coal fire region plots as the most outstanding (largest) thermally anomalous pixel cluster in all three extraction results. It is separated into a larger eastern part and a thermally anomalous cluster in the western part. In between lies the cities of Katras and Malkera (compare with Figure 41). However, it is obvious that automated anomaly extraction from the three different bands varies substantially. From band 20 and 32 a nearly even number of anomalies is extracted. Major clusters of these two are identical. However, more anomalies were extracted in the southern part of the band 32 subset. These are pixels, which are warm against their background in the 12 µm domain, but not warm enough to yield contrasting behaviour in the 3.7µm domain. Subset d (the ratio) shows thermal anomalies, which are very strong hot spots. This means their response in the 3.7µm domain is

WAB 500102 021 Page 87 of 121
unevenly stronger against the background than in the 12 µm domain. Thus this image is suitable to indicate the major hot spot areas within coal fire zones. Note that the lake in the northern centre of the subset leads to an anomaly extracted from band 20 and band 32. This is uncommon. The statistical post processing within thermal anomaly extraction usually discards clusters, whose variance is below the variance in a 5 pixel buffer surrounding. However, this lake not only is a warm cluster relative to its background (which can be expected in pre-dawn data), but obviously its temperature variance is quite strong. However, the lake related clusters does not occur in the extraction result of the ratio image anymore. This means that its temperature is not high enough to be considered a real outstanding hot spot. Concerning the coal fire area we can see that the combination of band 32 and the ratio band is suitable to present overall likely coal fire related temperature anomalies as well as the hotter zones within the coal fire area.
Figure 43 Thermal anomaly extraction for the MODIS predawn subset of February 17th 2005. The result is overlain on a LANDSAT scene to show the regional context. a: LANDSAT overview of the area, b: anomalies extracted from band 20, c: anomalies extracted from band 32, d: anomaly extraction from the ratio image. Black: non-anomalous area, grey: anomalies counted between 70%-85% of times, white: anomalies counted above 85% of times. Small white box: Jharia coal fire area.
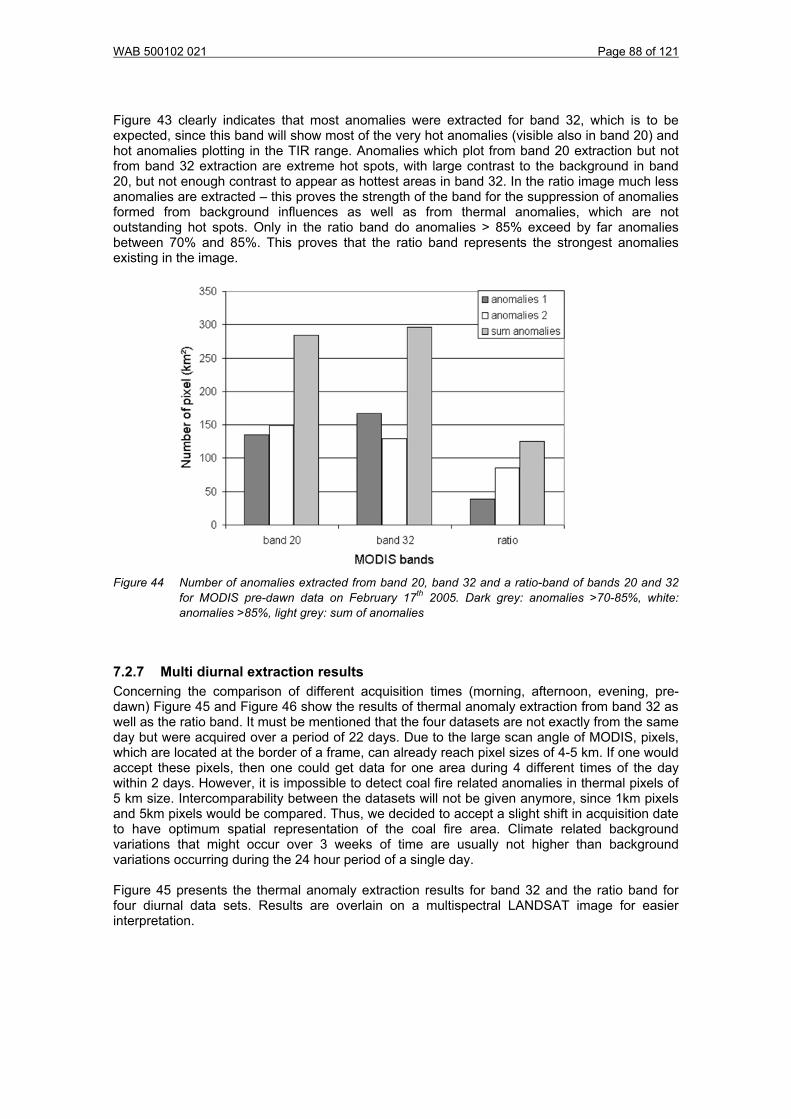
WAB 500102 021 Page 88 of 121
Figure 43 clearly indicates that most anomalies were extracted for band 32, which is to be expected, since this band will show most of the very hot anomalies (visible also in band 20) and hot anomalies plotting in the TIR range. Anomalies which plot from band 20 extraction but not from band 32 extraction are extreme hot spots, with large contrast to the background in band 20, but not enough contrast to appear as hottest areas in band 32. In the ratio image much less anomalies are extracted – this proves the strength of the band for the suppression of anomalies formed from background influences as well as from thermal anomalies, which are not outstanding hot spots. Only in the ratio band do anomalies > 85% exceed by far anomalies between 70% and 85%. This proves that the ratio band represents the strongest anomalies existing in the image.
Figure 44 Number of anomalies extracted from band 20, band 32 and a ratio-band of bands 20 and 32 for MODIS pre-dawn data on February 17th 2005. Dark grey: anomalies >70-85%, white: anomalies >85%, light grey: sum of anomalies
7.2.7 Multi diurnal extraction results Concerning the comparison of different acquisition times (morning, afternoon, evening, pre-dawn) Figure 45 and Figure 46 show the results of thermal anomaly extraction from band 32 as well as the ratio band. It must be mentioned that the four datasets are not exactly from the same day but were acquired over a period of 22 days. Due to the large scan angle of MODIS, pixels, which are located at the border of a frame, can already reach pixel sizes of 4-5 km. If one would accept these pixels, then one could get data for one area during 4 different times of the day within 2 days. However, it is impossible to detect coal fire related anomalies in thermal pixels of 5 km size. Intercomparability between the datasets will not be given anymore, since 1km pixels and 5km pixels would be compared. Thus, we decided to accept a slight shift in acquisition date to have optimum spatial representation of the coal fire area. Climate related background variations that might occur over 3 weeks of time are usually not higher than background variations occurring during the 24 hour period of a single day. Figure 45 presents the thermal anomaly extraction results for band 32 and the ratio band for four diurnal data sets. Results are overlain on a multispectral LANDSAT image for easier interpretation.

WAB 500102 021 Page 89 of 121
Figure 45 Thermal anomalies extracted from band 32 (TIR) of a morning (a), afternoon (b), evening (c) and a pre-dawn scene (d). The result is presented half-transparent, overlain on a LANDSAT scene. Coordinate boxes mark the upper left and lower right corner of the MODIS subset, which has an extent of 172 km x 85 km. Only the upper right corner (small white box) shows the Jharia area. Projection: UTM, zone 45 North, WGS 84.

WAB 500102 021 Page 90 of 121
Figure 46 Thermal anomalies extracted the ratio band (20/32) of a morning (a), afternoon (b), evening (c) and a pre-dawn scene (d). The result is presented half-transparent, overlain on a LANDSAT scene. Coordinate boxes mark the upper left and lower right corner of the MODIS subset, which has an extent of 172 km x 85 km. Only the upper right corner (small white box) shows the Jharia area. Projection: UTM, zone 45 North, WGS 84.

WAB 500102 021 Page 91 of 121
From this figure we can draw the following visual observations. In band 32 the Jharia coal fire area is represented best in pre-dawn data acquired at 1:30 am. This was to be expected since contrast to the background is highest. The lake in the northern centre only occurs as an anomaly in the pre-dawn data, which also had to be expected, since only at that time of the day the contrast of a warmer water surface to the surrounding background is high enough for the anomaly to plot. Furthermore, it is obvious that the least anomalies were extracted from the afternoon image, when solar masking is strongest, while the highest number of anomalies is extracted in the pre-dawn data, where anomaly-background contrast is highest. The fact that the coal fire area plots in the morning and afternoon data but not in the evening data is not understood. This phenomenon might occur due to local weather phenomena like rain (shortly decreasing fires intensity) or strong wind (suppressing the hot gasses from pouring out of the ground). This already indicates that coal fire related anomalies underlie strong dynamics. This has important influences on multi-year comparisons, which will be demonstrated in the next subsection. Thermal anomaly statistics for multi-diurnal extraction results from both bands are presented in Figure 47. In Figure 46 the multi-diurnal extraction for the ratio images are presented. Also here the first observation is that the Jharia coal fire area is represented as one of the largest thermally anomalous clusters. Since the ratio image favours hottest anomalies – opposite to Figure 45 – here only the hot zones of the coal fire zone are extracted. Further extracted hot spots stem from coal related industry, other industry, as well as anthropogeneous activities. Comparing Figure 45 and Figure 46 holds the potential to draw conclusions on the strength of a thermal anomaly. The anomalies extracted in the south-eastern corner of the image in Figure 45 b, c and d mostly do not plot in Figure 46. Table 19 and Table 20 present the exact number of extraction for the thermal band 32 and the ratio band. These numbers are visualized again in Figure 44 for better statistical interpretation. olds the potential to draw conclusions on the strength of a thermal anomaly. The anomalies extracted in the south-eastern corner of the image in Figure 45 b, c and d mostly do not plot in
Table 19 Thermal anomaly extraction in data from 4 different times of the day as extracted from the thermal band 32.
Table 20 Thermal anomaly extraction in data from 4 different times of the day as extracted from the ratio
band (20/32).

WAB 500102 021 Page 92 of 121
Figure 47 statistically presents the results of multi diurnal anomaly extraction for different bands. For band 32 we observe the trend of decreasing numbers of thermally anomalous pixels towards the afternoon (solar masking) and increasing number of extracted pixels towards pre-dawn time. We also calculated the average thermal cluster size per time step by dividing the number of extracted pixels by the number of grouped individual clusters. Anomalous clusters size is largest in the pre-dawn imagery. The development of thermal cluster size over the day goes in accordance with the number of extracted anomalies – decreasing towards the afternoon and increasing towards pre-dawn. This also applies for the ratio image.
Figure 47 Statistics of multi-diurnal thermal anomaly extraction for morning, afternoon, evening and pre-dawn data from the MODIS thermal band 32. Statistics are shown for the overall number of thermally anomalous pixels, the number of clusters and the two probability groups for all four time steps. On the right side the ratio of pixels per cluster is shown for the four time steps (1=morning, 2=afternoon, 3=evening, 4=pre-dawn).
7.2.8 Multi temporal extraction results (different years) We additionally compared data sets of two different years (2001 and 2005) but similar acquisition times (evening, 22:00 and 22:10), to investigate, if the comparison of only two time steps allows for conclusions of multi-temporal dynamics in an area. Many anomalies show even intra-daily variations in size and general occurrence. Coal fire related anomalies were not visible in the evening data set of February 2005 – except for a smaller anomaly in the West of the coal field (small white circle in Figure 48). However, in figure 9 the ratio band clearly shows the coal fire related anomalies in the West and especially in the East of the coal field. This again stresses how powerful the ratio image is in visualizing effects that are not occurring in extraction results from band 20 or 32 data alone. However, according to our observation it is not possible to derive any statement on the multi-temporal development of a coal fire area with only two data sets. We know from several years of coal fire field work experience in China as well as from reports about Jharia that coal fires underlie very high dynamics. Temperature patterns can change monthly to weekly and local weather conditions. Especially wind strongly influences, if an anomaly occurs or not. We thus consider it impossible to draw statements on coal fire size changes or intensity changes from only two compared data sets. The only observation that is obvious in Figure 48 is the strongly increased number of anomalies in the south-eastern corner of the subset (big city), which might result from increasing industrial activity around the city of Puruliya over the past years.

WAB 500102 021 Page 93 of 121
Figure 48 Multi-temporal comparison of anomaly extraction for an evening dataset of November 2001
(left side) and an evening dataset of 2005 (right side) for band 20, 32 and the ratio band. The MODIS subset has an extent of 172 km x 85 km.
7.2.9 Comparison results with high resolution TIR data To compare the results with higher resolution thermal data we applied the thermal extraction algorithm to thermal band 15 of a geometrically corrected ASTER night-time scene from March 5th 2005. This band is located between 10.95 µm and 11.65 µm and thus best comparable with MODIS band 32. Furthermore, we extracted thermal anomalies from the LANDSAT scene from November 1st 2002. Figure 49, Figure 50 and Figure 51 show the extraction results for the MODIS, and the ASTER and LANDSAT data, respectively. Quickbird data is then especially useful for the final heat source definition of anomalies, meaning their categorization in classes such as coal fire related and industry. Thus, it is possible to define each hot spot very precisely. In Figure 49 a we present the automatically extracted thermal anomalies from ASTER night-time band 14 (orange clusters) on top of the MODIS extraction result of thermally anomalous warm areas for pre-dawn band 32 (grey clusters) and the hot spot areas extracted from the pre-dawn ratio image (white clusters). It is obvious that most thermal anomalous clusters extracted from ASTER are all located on top of – or adjacent to – the white MODIS hot spot anomalies. Slight shifts between orange and white clusters might occur due to the relatively rough geolocation of the MODIS and Aster data, since no ground based GPS data was available. Please also note that outside the Jharia coal fire and mining region or the settled region neither in the MODIS nor in the ASTER data hot spots are being extracted. The only major ASTER hot spot not located on top of – or directly adjacent to – a ‘white’ MODIS hot spot is the cluster in the centre of Figure 49 a. Since the cluster is prominent in ASTER original data and was extracted, we would expect it also to be extracted also in the MODIS data. This is however not the case. Fact is, that already in the MODIS original data the region does not belong to the hottest pixels. When we checked the numerous temporary output files of the thermal extraction algorithm we observe the

WAB 500102 021 Page 94 of 121
following. The region is declared as anomalous in an intermediate (temporary output) results – however, it is not counted as being anomalous for over 70% of all moving window investigation steps. Thus, it is discarded. So the missing of this anomaly can purely result from the fact that the anomaly with regard to the background investigation area (which is bigger for MODIS than for ASTER) is not anomalous. Strictly speaking we present results of different scales – which we cannot compare in a quantitative way – anomalous areas in ASTER must not be anomalous areas in MODIS. We simply presented them jointly to show that MODIS can detect coal fire zones and differentiate warm and hot anomalies. Figure 49 b and c present an indirect validation of this. Figure 49 b is the surface and subsurface fire extraction based on Landsat data presented by Chatterjee (2006), while Figure 49 c shows an in-situ field mapping as presented by Michalski (2004). These additional figures confirm that the majority of MODIS hottest areas extracted (Figure 49 a, white clusters) stem from coal fires. Figure 49 b and c also confirm our assumption that coal fires in the bow-shaped Jharia coal belt are most prominent in the Southeast and East with additional fires existing in the far West of the belt. Furthermore, Quickbird data helps to identify the heat sources of the anomalous clusters extracted. Most areas, where hottest (white) pixels were extracted (including the orange hot spots) are areas where firstly, coal is exposed to the surface, secondly no houses or industrial buildings are present, and thirdly, where pyrometamorphic rocks or even steam can be observed. Thus, there can be no other logical heat source (especially in pre-dawn data) than burning coal. Figure 50 presents the hot spots extracted from the MODIS February pre-dawn ratio band (white square pixels) on top of the multispectral LANDSAT image. For the LANDSAT daytime image thermal anomalies were extracted from the thermal band 6. They are overlain as orange clusters. Note that the MODIS result is from 2005, while the LANDSAT thermal clusters represent anomalies in 2002. We can thus not quantitatively compare the results. However, two things are very obvious. Firstly, from the LANDSAT daytime thermal band only hottest anomalies are extracted during the daytime. This has been observed in many coal fire areas (Kuenzer 2005, Zhang 2004).

WAB 500102 021 Page 95 of 121
b
c
a
Figure 49 a: Thermal anomalous clusters extracted from ASTER band 14 (orange), MODIS warm areas from band 32 (grey) and MODIS hottest zones from the ratio image (white) in February/March 2005. Note that the ASTER night-time scene covers only part of the LANDSAT scene. In this figure only the Jharia area (black square in left corner) is presented. All extracted ASTER hot spots or located directly on top of or in the direct vicinity of the white MODIS derived hot spots. Only the ASTER cluster in the center does not coincide with MODIS. b: Landsat 5 TM based coal fire extraction result from Chaterjee (2006) from 1992 data, which were still mostly confirmed during field checks in 2003. c: in-situ coal fire mapping result from Michalski (2004).

WAB 500102 021 Page 96 of 121
Background temperatures during the day can easily mask weaker coal fire anomalies or they lead to such a low contrast that anomalous clusters will not be extracted. Even the images are three years apart, the hot spots extracted from LANDSAT and the hot spots extracted from MODIS coincide spatially well. Only some very small anomalies (orange) scattered over the coal field were not picked up in the MODIS hot spot ratio band extraction. However, they are represented in the MODIS extraction results of the thermal band 32 at pre-dawn. The hottest zones within the Jharia coal field are the West and especially the Southeast. In Figure 50 we have defined the anomalies with the help of high resolution data interpretation (Quickbird) and ground knowledge available from scientists who know the area very well. The yellow circles areas are shown as small Quickbird subsets to confirm the naming of the anomalies. In the left subset only coal surface including some pyrometamorphic phenomena can be seen. The centre subset is clearly a large coal industrial complex. The right subset again shows only coal surfaces and large areas of reddish pyrometamorphic rock.
Figure 50 MODIS hot spot anomalies from pre-dawn ratio data (white) and extracted daytime thermal
anomalies from LANDSAT band 6 data (orange) overlain on a multispectral LANDSAT subset of Jharia coal field. Nearly all anomalies stem from coal fires, coal storage- or waste pile fires, as well as industry. Prominent hot spot zones in the Jharia coal belt are the West and especially the Southeast. Three (yellow circled) areas are presented in Quickbird data, which we used for heat source definition of the anomalies
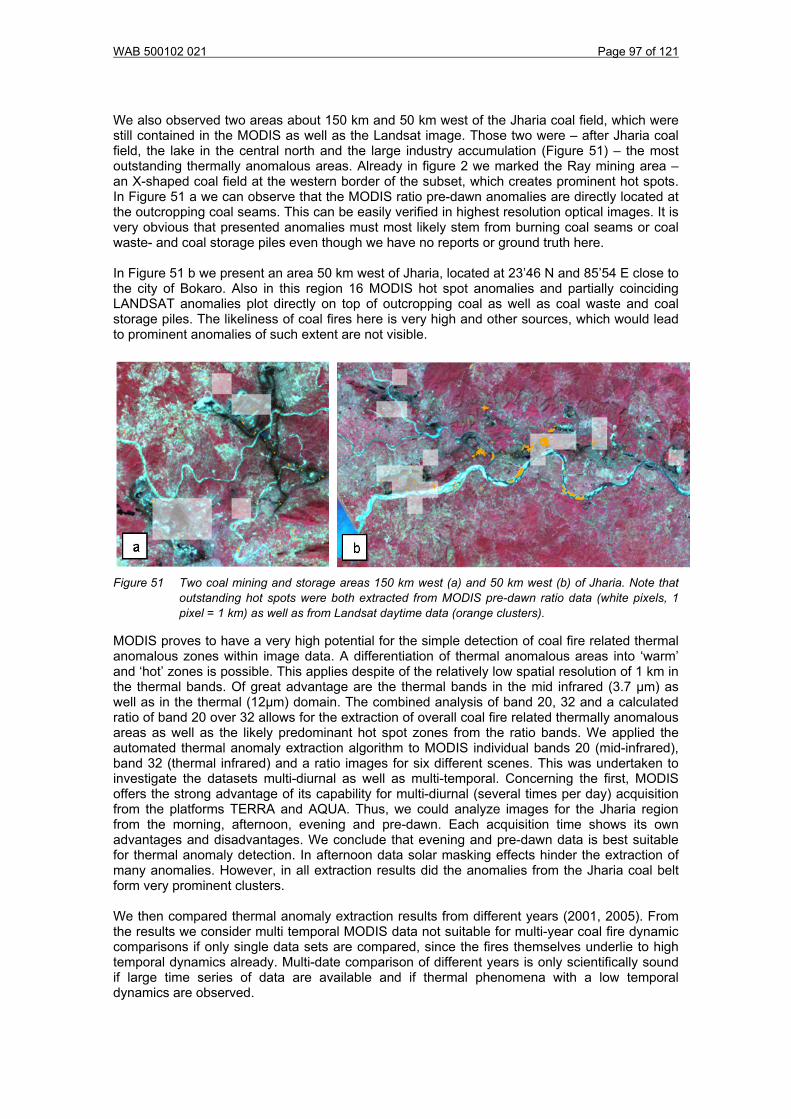
WAB 500102 021 Page 97 of 121
We also observed two areas about 150 km and 50 km west of the Jharia coal field, which were still contained in the MODIS as well as the Landsat image. Those two were – after Jharia coal field, the lake in the central north and the large industry accumulation (Figure 51) – the most outstanding thermally anomalous areas. Already in figure 2 we marked the Ray mining area – an X-shaped coal field at the western border of the subset, which creates prominent hot spots. In Figure 51 a we can observe that the MODIS ratio pre-dawn anomalies are directly located at the outcropping coal seams. This can be easily verified in highest resolution optical images. It is very obvious that presented anomalies must most likely stem from burning coal seams or coal waste- and coal storage piles even though we have no reports or ground truth here. In Figure 51 b we present an area 50 km west of Jharia, located at 23’46 N and 85’54 E close to the city of Bokaro. Also in this region 16 MODIS hot spot anomalies and partially coinciding LANDSAT anomalies plot directly on top of outcropping coal as well as coal waste and coal storage piles. The likeliness of coal fires here is very high and other sources, which would lead to prominent anomalies of such extent are not visible.
Figure 51 Two coal mining and storage areas 150 km west (a) and 50 km west (b) of Jharia. Note that
outstanding hot spots were both extracted from MODIS pre-dawn ratio data (white pixels, 1 pixel = 1 km) as well as from Landsat daytime data (orange clusters).
MODIS proves to have a very high potential for the simple detection of coal fire related thermal anomalous zones within image data. A differentiation of thermal anomalous areas into ‘warm’ and ‘hot’ zones is possible. This applies despite of the relatively low spatial resolution of 1 km in the thermal bands. Of great advantage are the thermal bands in the mid infrared (3.7 µm) as well as in the thermal (12µm) domain. The combined analysis of band 20, 32 and a calculated ratio of band 20 over 32 allows for the extraction of overall coal fire related thermally anomalous areas as well as the likely predominant hot spot zones from the ratio bands. We applied the automated thermal anomaly extraction algorithm to MODIS individual bands 20 (mid-infrared), band 32 (thermal infrared) and a ratio images for six different scenes. This was undertaken to investigate the datasets multi-diurnal as well as multi-temporal. Concerning the first, MODIS offers the strong advantage of its capability for multi-diurnal (several times per day) acquisition from the platforms TERRA and AQUA. Thus, we could analyze images for the Jharia region from the morning, afternoon, evening and pre-dawn. Each acquisition time shows its own advantages and disadvantages. We conclude that evening and pre-dawn data is best suitable for thermal anomaly detection. In afternoon data solar masking effects hinder the extraction of many anomalies. However, in all extraction results did the anomalies from the Jharia coal belt form very prominent clusters. We then compared thermal anomaly extraction results from different years (2001, 2005). From the results we consider multi temporal MODIS data not suitable for multi-year coal fire dynamic comparisons if only single data sets are compared, since the fires themselves underlie to high temporal dynamics already. Multi-date comparison of different years is only scientifically sound if large time series of data are available and if thermal phenomena with a low temporal dynamics are observed.
WAB 500102 021 Page 98 of 121
7.3 Discussion and conclusions The algorithm for automated detection of thermal anomalies due to fossil fuel fires using remote sensing data includes two steps. One step is automated delineation of coal fire risk areas using multi-optical bands. The other step is to automatic detection of the thermal anomalies using thermal band data. This algorithm was developed based on the known coal fires in Wuda area. Later it is used to detect unknown fires in China, and in India. It is established that the method is feasible by using the data from Landsat-7, ASTER, and MODIS. Night-time thermal data have the best contrast for detection thermal anomalies due to fossil fuel fires from the background. In principle it is possible to use this algorithm to generate a world fossil fuel fires distribution map, which can tell where the fossil fuel fires are (however that is a very large assignment). The area of a thermal anomaly extracted by the algorithm varies when data from different times or different source satellites are used. This is because the thermal anomaly on the earth surface varies with its surrounding conditions. When the surrounding temperature is high, such as in summer, the anomaly has a smaller area. When the surrounding temperature is low, such as in winter, the same coal fire forms an anomaly with a bigger area. More research is needed for comparing anomalies from different times. At present, there is still not a feasible way to quantify the development of fossil fuel fires by using the remote sensing data, but it is feasible for the remote sensing data to tell the existence of a fossil fuel fire. The conclusion is that the link between in-situ fossil fuel fire models (such as presented in Chapter 3) and remote sensing monitoring cannot be made yet.
WAB 500102 021 Page 99 of 121
8 Estimation of GHG emission due to fossil fuel fires
8.1 Proposed method to approximate coal fire-related emissions The proposed methods to quantify the coal fire emissions are based on official figures of coal lost in Ningxia, Inner Mongolia and Xinjiang (see Table 10 and Table 15). The risk of over estimation (for reasons of political gain and/or extra budget) are expected to be limited, because the quantities are shared between the various coal mining companies and (provincial) authorities, introducing a mutual review that would prevent excessive estimations. Furthermore the authors of the present report have been engaged in field observation in all three provinces spanning the time between 1994 and 2008. Three scales are differentiated: single coal fire, coal fire area, whole province.
8.1.1 Method for local GHG emission estimation of a single coal fire To assess a single coal fire, one approach would be direct gas measurements as undertaken by Litschke et al. (2005). The problem with these measurements is that GHG emission through cracks and overburden in the bedrock is very irregularly distributed, and undergoes strong fluctuations. Emission rates vary daily and even hourly, depending on ventilation, wind and other parameters. Furthermore, some fires are not located under strongly cracked bedrock layers. Thus, in these areas there is a diffuse escape of gasses in small quantities through the undisturbed soil. For some coal fires, although gas measurements might be the best way to estimate GHG emission of a single fire, it is not economically feasible to perform them on a large number of fires or even on all fires of a province or country. Thus, in our opinion, the approach of emission quantification should be obtained via the determination of the amount of coal lost due to burning in the specified coal fire. If coal composition, combustion characteristics, and the amount of coal burnt (for a certain period of time) is known, then the amount of GHG can be estimated. According to Table 10 and Table 15, the amount of burnt coal cannot be estimated directly; however, it can be approximated through a three-dimensional (3-D) model, using geologic maps, mining information, borehole information, and spatial details on the fire from repeated in situ coal fire mappings. Then, for this estimated burning volume, CO2 equivalent emissions for complete combustion can be calculated. This value has to be corrected with factors for the coal type (from laboratory measurements), the real burning volume (the entire thickness of the seam may not be burning), a depth component (if the seam is dipping, it will not burn below a certain depth), the degree of combustion, a value characterizing the permeability of the overlying bedrock, and any additional information available. The result (GHG release) has to be formulated as a quantity per day, month, or year. The results presented here are derived from the data on burning (individual) coal mines provided to us by local and provincial authorities in China (Table 10 and Table 15). For a more thorough investigation, the following working steps could be adopted: 1. Intensive interviews of as many local experts as possible (especially local miners) and the
collection of statements of estimated monthly/annual coal loss in this single fire. 2. Detection of factors that influence this figure (coal loss): are locals more likely to over- or
underestimate the number? 3. Development of a geologic 3-D underground model of the specific coal fire zone with
support of available geologic maps, mine work information, local knowledge, in situ coal fire maps, crack models, etc.
4. Borehole drillings within this zone to see if the whole thickness of the seam is burning 5. Intersection of surface-mapped coal fire extent with the coal volume underground. The
surface-mapped coal fire extent coincides with the thermally anomalous pattern on the surface.
6. Fix an estimated burning coal volume (in m³ or tons) 7. Considering the coal petrography, how much GHG would be released if the coal burns
under homogeneous conditions with complete combustion in a coal-fired power plant? 8. Modification and correction of this amount based on correction coefficients for the degree of
combustion (decreasing degree leads to less CO2, but more CO and more CH4). The
WAB 500102 021 Page 100 of 121
degree of combustion should be linked with the availability of oxygen (ventilation pathways), and, thus, cracks in the overlying bedrock.
9. Analysis of thermal remote sensing data with respect to energy release of the available coal fire outline and comparison with retrieved results.
10. To predict the coal consumption (and thus, GHG) for the time span of a year or longer, numerical modelling has to be used. Only numerical modelling is able to represent the complexity of processes that influence each other and can change in scale and magnitude within seconds (eg, a large overburden bedrock areas can collapse and ventilation increase significantly within only a few minutes).
11. Critical analysis of the quantification results for one single fire by other independent coal fire scientists who are familiar with the area.
8.1.2 Method for regional GHG emission estimation of one coal fire area To transfer the results to a regional scale it is certainly not feasible to work with the same detailed (field) observation as for a local coal fire zone as described above. Therefore, the fires are grouped according to their similarities, such as coal type, stage of fire (according to Table 10 and Table 15), and, if possible, degree of combustion (ventilation conditions: mine ventilation, surface fracturing, subsidence). The coal loss (and related GHG emissions) of a fire, representing a certain group, should then be multiplied according to the estimated burning coal volume of the other fires. In this way, a scientifically sound approximation could be achieved. Another way to achieve a (minimum) estimation is with (thermal) remote sensing data. This uses the (conservative) relationships of temperature anomaly patterns (mapping) on the surface and a link with burning coal underground. Because not every ton of coal burning underground leads to a temperature anomaly on the surface (especially if there is no convective heat transport = no cracks and exhaust pathways), this leads to an underestimation of burning coal. This will provide and acceptable conservative approach; however, the direct estimation derived from burning coal (directly provided by the mine authorities) is preferred for the extrapolation.
8.1.3 Estimation of GHG emissions for Ningxia We now present a calculation example that can define the upper limit of GHG emissions for the Ningxia province. We know that there are total 37 coal fires in Ningxia province as listed in the Table 10. At present, 14 coal fires have been extinguished, leaving 23 active. We know from the local experts that 2 million tons of coal from these 23 coal fires is burnt out per year. The Ningxia coal has a carbon content of 95% (see Table 10), thus, 1 ton of burning coal releases 3.5 tons of CO2. If 2,000,000 tons are burning, with each ton releasing 3.5 tons of CO2 (to calculate with an upper limit number, complete combustion assumed) and 0.1 ton of CH4 (also calculating with an upper limit number): (2,000,000 * 3.5) + ((2,000,000 * 0.1) * 23) = 11,600,000 tons of CO2 equivalents This number is an upper range number, because, for this calculation, we assumed that every ton of burning coal leads to the release of methane, which is actually not the case. A conservative (lower limit) estimate for Ningxia would calculate only the pure CO2 emissions, which would add up to 7,000,000 tons of CO2. This number would have to be corrected for incomplete combustion.
8.1.4 Estimation of GHG emissions for the Wuda coal mining region, and other occurrences in Inner Mongolia
We now present a calculation example that can define the upper limit of GHG emissions for the Wuda coal fire region (all 20 fires). Local mining engineers report that 200,000 tons of coal are burning each year in Wuda. This number probably is exaggerated slightly, because of the hope for increased governmental extinction money, but no better number exists. This number also is in accordance with the fact that China reports the burning of 20 million tons of coal per year. Although more than 50 coal fire areas might exist in China (this number has never been confirmed in a scientific way), Wuda is definitely one of the biggest coal fire areas in China. This information has been confirmed by many mining engineers, administrators, and fire fighters
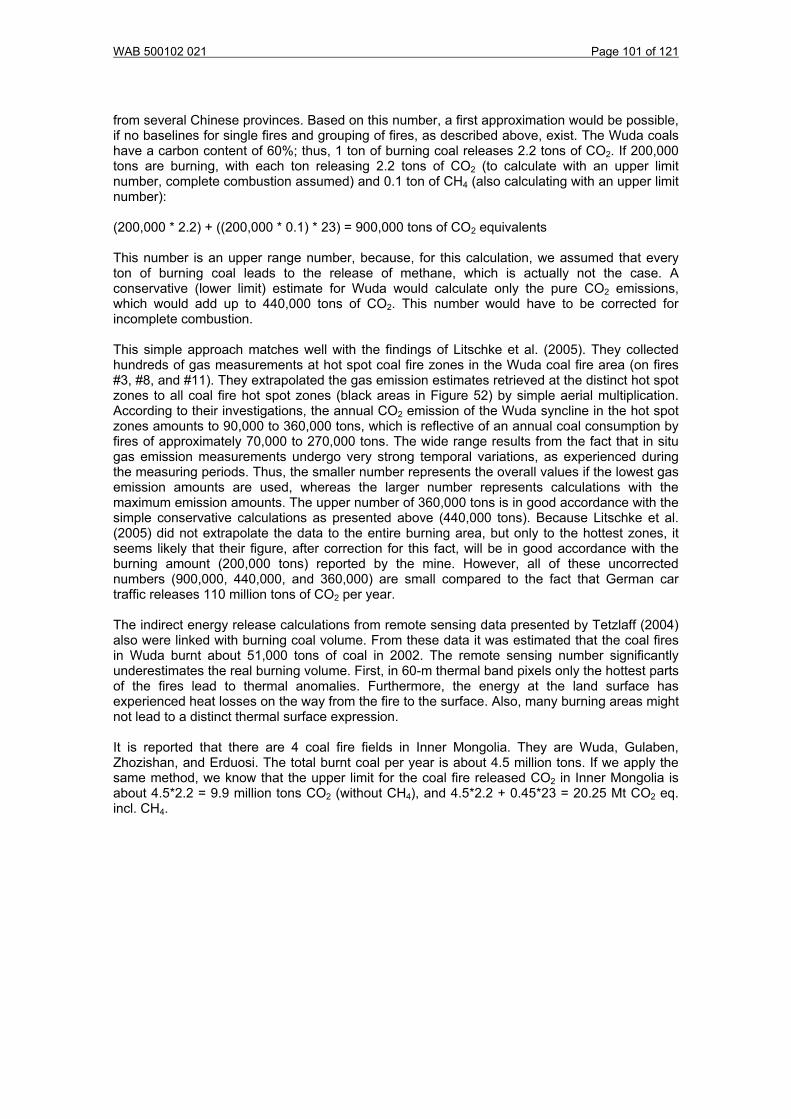
WAB 500102 021 Page 101 of 121
from several Chinese provinces. Based on this number, a first approximation would be possible, if no baselines for single fires and grouping of fires, as described above, exist. The Wuda coals have a carbon content of 60%; thus, 1 ton of burning coal releases 2.2 tons of CO2. If 200,000 tons are burning, with each ton releasing 2.2 tons of CO2 (to calculate with an upper limit number, complete combustion assumed) and 0.1 ton of CH4 (also calculating with an upper limit number): (200,000 * 2.2) + ((200,000 * 0.1) * 23) = 900,000 tons of CO2 equivalents This number is an upper range number, because, for this calculation, we assumed that every ton of burning coal leads to the release of methane, which is actually not the case. A conservative (lower limit) estimate for Wuda would calculate only the pure CO2 emissions, which would add up to 440,000 tons of CO2. This number would have to be corrected for incomplete combustion. This simple approach matches well with the findings of Litschke et al. (2005). They collected hundreds of gas measurements at hot spot coal fire zones in the Wuda coal fire area (on fires #3, #8, and #11). They extrapolated the gas emission estimates retrieved at the distinct hot spot zones to all coal fire hot spot zones (black areas in Figure 52) by simple aerial multiplication. According to their investigations, the annual CO2 emission of the Wuda syncline in the hot spot zones amounts to 90,000 to 360,000 tons, which is reflective of an annual coal consumption by fires of approximately 70,000 to 270,000 tons. The wide range results from the fact that in situ gas emission measurements undergo very strong temporal variations, as experienced during the measuring periods. Thus, the smaller number represents the overall values if the lowest gas emission amounts are used, whereas the larger number represents calculations with the maximum emission amounts. The upper number of 360,000 tons is in good accordance with the simple conservative calculations as presented above (440,000 tons). Because Litschke et al. (2005) did not extrapolate the data to the entire burning area, but only to the hottest zones, it seems likely that their figure, after correction for this fact, will be in good accordance with the burning amount (200,000 tons) reported by the mine. However, all of these uncorrected numbers (900,000, 440,000, and 360,000) are small compared to the fact that German car traffic releases 110 million tons of CO2 per year. The indirect energy release calculations from remote sensing data presented by Tetzlaff (2004) also were linked with burning coal volume. From these data it was estimated that the coal fires in Wuda burnt about 51,000 tons of coal in 2002. The remote sensing number significantly underestimates the real burning volume. First, in 60-m thermal band pixels only the hottest parts of the fires lead to thermal anomalies. Furthermore, the energy at the land surface has experienced heat losses on the way from the fire to the surface. Also, many burning areas might not lead to a distinct thermal surface expression. It is reported that there are 4 coal fire fields in Inner Mongolia. They are Wuda, Gulaben, Zhozishan, and Erduosi. The total burnt coal per year is about 4.5 million tons. If we apply the same method, we know that the upper limit for the coal fire released CO2 in Inner Mongolia is about 4.5*2.2 = 9.9 million tons CO2 (without CH4), and 4.5*2.2 + 0.45*23 = 20.25 Mt CO2 eq. incl. CH4.
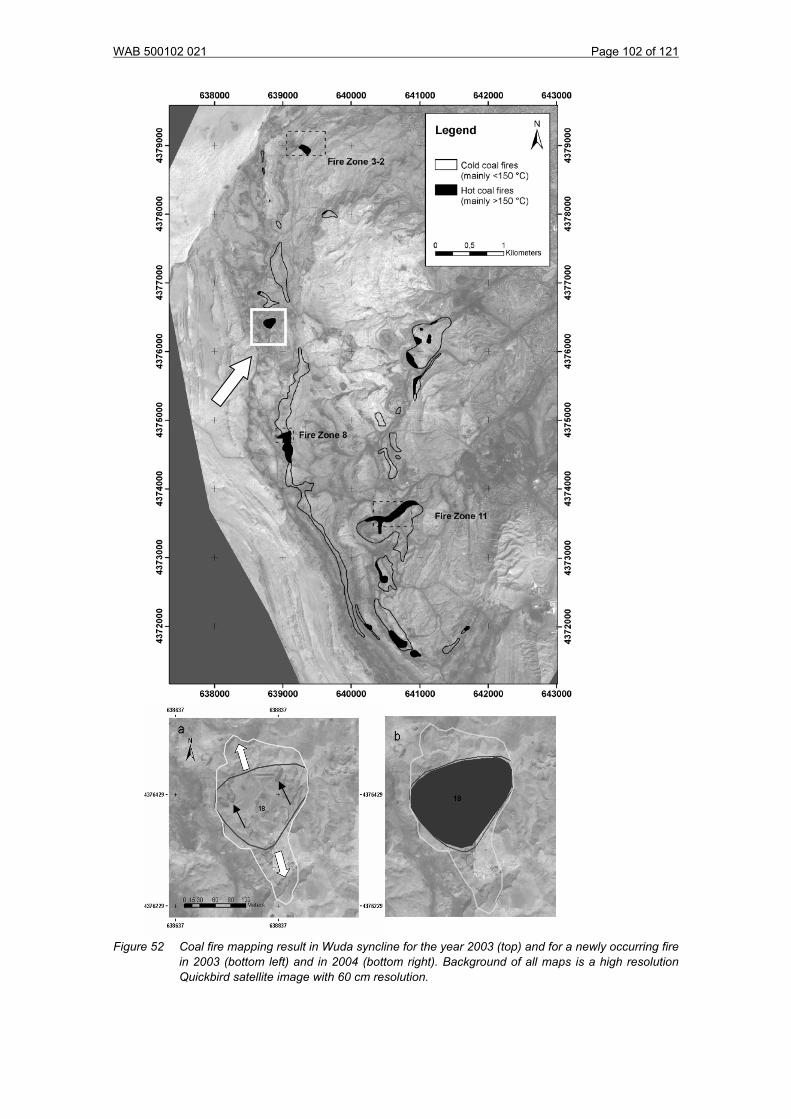
WAB 500102 021 Page 102 of 121
Figure 52 Coal fire mapping result in Wuda syncline for the year 2003 (top) and for a newly occurring fire in 2003 (bottom left) and in 2004 (bottom right). Background of all maps is a high resolution Quickbird satellite image with 60 cm resolution.

WAB 500102 021 Page 103 of 121
8.1.5 Estimation of GHG emissions for the Xinjiang province From Table 15 we know that there are total 38 coal fires in Xinjiang. At present 8 coal fires have been extinguished; there are still 30 left. Although we have a huge coal loss number (435,000,000 tons) per year, we know from the local experts that actually there are only about 13.5 million tons of coals from these 30 coal fires burnt out per year. This is due to the fact that coal fires in steeply dipping strata preclude the mining of large amounts of coal that would otherwise be minable. The Xinjiang coal has a carbon content varies from 65 to 86% (see Table 15). If we take an average of it, 75%, 1 ton of burning coal releases 2.7 tons of CO2 (to calculate with an upper limit number, complete combustion assumed) and 0.1 ton of CH4 (also calculating with an upper limit number): (13,500,000 * 2.7) + ((13,500,000 * 0.1) * 23) = 67,500,000 tons of CO2 equivalents A conservative (lower limit) estimate for Xinjiang would calculate only the pure CO2 emissions without methane, which would add up to 36,000,000 tons of CO2. This number would have to be corrected for incomplete combustion. 8.2 Method for national GHG emission estimation (province or country) In our opinion, the exact quantification of coal fires on a country wide scale is not possible. It is only possible to derive an upper value by extrapolating the results achieved for a regional fire area. Thus, these calculations can not be used for a country-wide baseline estimation. However, the calculation of an upper limit is possible. For example, if values for the Chinese coal fire area of Wuda (with 20 individual fires) are known, this number can be multiplied by the number of other existing coal fire areas. Now we have quantified and reasonably reliable information of 3 provinces, which comprise the major coalfire areas in China, it is also possible to give a national estimate. The following approach is proposed to extrapolate data to a country-wide scale. According to varying sources, approximately 50 coal fire areas are known in China, of which the Wuda coal fire region is considered to be the most severe. Thus, coal fire-related GHG emissions in China should be less than 50 times the amount of GHGs released by the Wuda coal fires. We doubt that 50 similar coal fire areas exist in China; despite numerous interviews with mining administrators, international conferences, and related research, we heard about only 10, to a maximum of 20, severely burning coal fire areas. Actually, the problem mainly occurs in Xinjiang, Ningxia, and Inner Mongolia. There are very rare coal fires in the others province. Even when there are some, their total coal loss per year is very small, which can be neglected comparing with the coal loss from Xinjiang, Ningxia, and Inner Mongolia. The total burnt coal in Xinjiang, Ningxia, and Inner Mongolia is 13.5+2+4.5 = 20 million tons, which is reported by the government and can represent the upper limit of the total burnt coal by coal fires in China. If we take a conservative approach regarding the burning coal, and assume that 20 million tons are burning with each ton releasing 2.7 tons of CO2 (to consider coals of different rank) and 0.1 tons of CH4 (also calculating with an upper limit number): (20,000,000 * 2.7) + ((20.000.000 * 0.1) * 23) = 100,000,000 tons of CO2 equivalent If 20 million tons of coal are really burning, these fires should not release much more than 100 million tons of CO2 equivalents of GHGs. Without the methane component (more likely scenario), it is 54 million tons. These numbers still have to be corrected with regard to combustion. However, we doubt that this amount of coal is really burning in China; therefore, the figure (20 million ton) announced by the Chinese authorities has to be handled with care. The International Energy Agency (IEA) reported (URL 3) that the global human-induced CO2 emissions added up to 26 Giga tons (26,000,000,000 tons) in 2006. If we assume 100 million

WAB 500102 021 Page 104 of 121
tons of CO2 equivalent released from coal fires (derived from 20 million tons, including methane), these GHGs contribute 0.38 % of all global human-induced CO2 emissions. These percentages were derived using a non-conservative approach; we assumed that 20 million tons of coal are burning (which is probably not the case) and we included methane release. From the studies of Litschke et al. (2005), we know that methane is not released from every ton of burning coal. If coal burns at very hot temperatures (eg, in the hot spots of coal fires), no methane is released. The numbers presented above (2.7 tons of CO2 and 0.1 tons of CH4 per ton of burning coal, which would be 5 tons of CO2 equivalent per ton of burning coal) are worst-case scenario figures. If we compare global annual IEA CO2 release with CO2 equivalents and compare the CO2 numbers (without methane), they are only 0.2%. To the best of our knowledge and contrary to some publications, a maximum of 20 other coal fire areas, with the same extent of those in Wuda, exist in China. Then 200,000 tons (maximum burning in Wuda) multiplied by 20 equals 4 million tons of burning coal; considering that some smaller coal fire areas exist, we assume that 5 to 10 million tons of coal actually may be burning in China. This results in 24 to 48 million tons of CO2 equivalents, contributing 0.09% or 0.18% to the global CO2 budget, or, comparing only CO2, contributing with 0.048 to 0.096 to the global annual human-induced CO2 budget. See Table 21 and Table 22 for an overview of these figures.
Table 21 Coal fire emissions in Wuda as estimated from reported burning coal volume and remote sensing. Calculations with and without methane release.
Wuda Coal loss (tons) CO2 at 60% C (tons) CO2 equivalents including CH4
Reported by mine 200,000
440,000 900,000
Remote sensing derived 51,000 112,200 229,500
Gas measurement derived (upper limit)
270,000 360,000
Gas measurement derived (lower limit)
70,000 90,000
We assume that the 3% figure published by Rosema et al. (1993), and repeated frequently without questioning, especially by the media, resulted from a very simple mistake. The Chinese report that 20 million tons of coal are burning and that a 10-fold amount of coal is lost. ‘Lost’ does not mean ‘burnt.’ ‘Lost’ means inaccessible to mining operations because it is too dangerous to mine in the vicinity of coal fires; even after the fires are extinguished, the overlying layers are too fragile. We want to emphasize again that the official amount of burning coal announced by the Chinese has to be questioned and reinvestigated. Based on the above, we are certain that all GHG emissions from coal fires in China account for much less than 0.4% of all global CO2 emissions annually; we are confident that the number is even less than 0.1%.
Table 22 Coal fire emissions in China as estimated from reported and assumed burning coal volume. Calculations with and without methane release. Percentage numbers (*) indicate the contribution to the global annual human-induced CO2 budget.
China Coal burnt [t] CO2 C [t] CO2 equivalents incl. CH4 Three provinces from government 20,000,000 54,000,000
(0.2%)* 100,000,000 (0.38%)*
Assumed by authors (upper limit) 10,000,000 25,000,000 (0.096%)*
48,000,000 (0.18%)*
Assumed by authors (lower limit) 5,000,000 12,500,000 (0.048%)*
24,000,000 (0.09%)*

WAB 500102 021 Page 105 of 121
8.2.1 Conclusions The quantification of coal fire-related GHG emissions on a local, regional, or even country-wide scale is a sensitive topic. Quantification of coal fire-related GHG emissions is influenced by political and economic factors, which might not always be in accordance with purely science-based estimates. Especially with regard to the CDM under the framework of the Kyoto Protocol, the extinction of coal fires in developing countries by private companies from so-called ‘Annex I countries’ (industrialized countries) is receiving more and more attention. Thus, a thorough baseline estimation is needed for coal fires. A baseline defines how much coal is burning in a coal fire in a certain amount of time; this can be used later to calculate emission certificate policies in the case of CDM contracting for the extinction of a specific fire area. We have shown the challenges and difficulties in assessing coal fire-related GHG release on a remote sensing basis. Uncertainties related to the underground occurrence of coal fires make them especially difficult to assess in a quantitative way. Variations in the physical and chemical characteristics of coal, heterogeneities in coal layering, differences in overburden bedrock characteristics, varying crack and vent pathway densities above the burning seam, related variations in the degree of combustion, uncertainties in measuring techniques, as well as the problem of spatial, and especially, temporal, transfer of results are key parameters that complicate GHG emission quantification. Coal fire emission quantification has to be pursued by different methods for local, regional, and country-wide scales. Local estimates are based on very detailed in situ measurements and the development of complex 3-D models from direct gas measurements or the exact estimation of the amount of underground burnt coal. The regional approach relies on the groupings of individual fires and extrapolating the results derived for fires that represent a certain group. The country-wide approach of GHG estimation can only serve as an upper limit for that country’s coal fire-related emissions; the correct amount probably cannot be determined. We consider coal fire extinction to be an urgent priority in China, because the emissions contribute to global warming. Furthermore, a valuable resource is lost. However, GHG quantification should be based on scientific and reasonable methods and calculations. For future activities in the field of coal fire-related GHG emission estimation we calculated upper limits for coal fire related GHG emission in China. We are certain that coal fire-related emissions in China account for well less than 0.4% of all human-induced global annual CO2 emissions, probably even less than 0.1%. 8.3 Global estimation of GHG emission from fossil fuel deposit fires. At the end of 2006, the proved recoverable coal reserves of the USA have a total amount of 246,643 million tons, which is the 27.1% of the world reserves. Russia has a total amount of 157,010 million tons, which is 17.3% of the world reserves. China has 114,500 million tons, 12.6% of the world reserve. India has 92,445 million tons, 10.2%. Australia has 78,500 million tonnes, 8.6%. In the year 2006, the world produced 6,793 million tons of coal. China produced 2,620 million tons, which is 38.6% of the world production. USA produced 1,163 million tons of coal, 17% of the world production. Russia produced 341 million tons, India produced 497 million tons, and Australia produced 420 million tons, which are 5%, 7%, 6% of the world production respectively (http://www.eia.doe.gov/emeu/aer/txt/ptb1114.html). We know that the occurrence of fossil fuel fires is related to a lot of factors, such as the outcrop of the coal seam (the more outcrop of coal seams, the more likely the fossil fuel fires exist), the climate (an arid climate favours for fossil fuel fires), the mining activities (the more mining activities exist, the more fossil fuel fires occur), etc. It is estimated by the coal fire fighting teams in China that the burnt amounts of coal due to fossil fuel fires in Xinjiang, Ningxia, and Inner Mongolia in China are 13.5 million tons, 2 million

WAB 500102 021 Page 106 of 121
tons, and 4.5 million tons respectively. For the whole China, the direct burnt coal from other provinces due to the fossil fuel fires can be neglected comparing these 3 provinces. It is estimated that the upper limit for the CO2 release of China is not larger than 100,000,000 tons (CH4 included), 0.38% of the global annual human-induced CO2 budget. We, the authors, assume that this number is still too big. We estimate that the direct burnt coal due to fossil fuel fires in China is not more than 10,000,000 tons, which gives the upper limit of the CO2 release of 25,000,000 tons (48,000,000 tons with methane included), which is 0.096% (resp. 0.18%) of the global annual human-induced CO2 budget. It is very hard to estimate the GHG emission due to the fossil fuel fires. However, according to the coal reserve, coal production of the world, and the climate, we assume that the global CO2 emission due to the fossil fuel fires is hardly more than 4 times of the emission from China. The upper limit is 100,000,000 tons (192,000,000 tons with CH4 included), which amounts to 0.4% (0.7% with methane included) of the global annual human-induced CO2 budget.
WAB 500102 021 Page 107 of 121
9 Technical options of (future) satellite derived CO2 quantifications
9.1 Introduction To identify the GHG sources due to fossil fuel fires and estimate the emission, remote sensing is the most suitable tool for global scale, however technical limitations still play a role. Several instruments such as a Fourier transform spectrometers, lasers, hyperspectral sensors can be employed, boarded on air/satellite based platforms for estimation of different atmospheric gases with a proper analysis of atmospheric spectra and reliable retrievals. Some of these models that are based on band ratioing exploit the absorption features of different atmospheric gases in certain wavelengths. However, water vapour retrieval from hyperspectral remote sensing data such as AVIRIS has been standardized (Gao and Goetz, 1990; Schläpfer et al., 1998) because of presence of several wide and distinct water vapour absorption bands in the visible to shortwave infrared range of the electromagnetic spectrum. Nevertheless, retrieval of CO2, CH4 and other GHG gases from these types of sensors is still difficult as most of the absorption bands (of these GHG gasses) that are situated in the operating range of typical hyperspectral instruments (0.4 to 2.4 μm) are relatively narrow and influenced by other atmospheric gases such as water vapour. Furthermore, the problem of narrow absorption bands (>5 nm) can hardly be solved as most of these sensors typically have a bandwidth of ~10nm covering the whole visible and some part of the short-wave infrared region. With a relatively small FWHM (full width at half maximum), SCIAMACHY (Scanning Imaging Absorption Spectrometer for Atmospheric Cartography) is an imaging spectrometer whose primary mission objective is to perform global measurements of trace gases in the troposphere and in the stratosphere. The instrument provides spectra measured from light transmitted, back scattered or reflected by trace gases in the atmosphere. The instrument is designed for the global measurement of trace gases in the troposphere and stratosphere by means of a spectrometer scanning the atmosphere either at nadir or in limb. It records radiation in the range 0.24 μm to 2.4 μm with 8 detector modules. The goal is to allow small optical absorptions to be detected. SCIAMACHY is designed to measure the global distribution of trace gases, aerosols and clouds in both the troposphere and the stratosphere. The abundances of a number of atmospheric constituents which are targeted species include: • in the troposphere - O3, O4, N2O, NO2, CH4, CO, CO2, H2O, H-CH-O and aerosols and, in
polluted conditions, SO2 • in the stratosphere - O3, O2, O2*, O4, NO, NO2, BrO, N2O, CO, CO2, H2O, CH4 plus under
volcanic eruption SO2, plus under ozone hole conditions O-Cl-O and Cl-O. SCIAMACHY makes spectral measurements in passive limb and nadir looking spectrometer observations to permit ground based computation of the trace constituent concentrations. The observational foundation of global carbon studies of the National Oceanic and Atmospheric Administration is the Climate Monitoring and Diagnostic Laboratory Cooperative Global Air Sampling Network of worldwide measurements for GHGs (Conway et al., 1990). Approximately fifty six fixed base observatories complemented with ships and aircraft are distributed all over the globe. Their in situ measurements are quite accurate but for assessing the global process their distribution is very limited over space and time. Based on this network the observed uncertainty of the global carbon budget is 2-3 GtC yr-1 (Tans et al., 1990; Rayner and O’Brien, 2001; Gurney et al., 2002). Undoubtedly, a space borne, high spatial resolution, highly accurate and dedicated sensor could provide much information on global CO2 distribution in the atmosphere. More precisely, a polar orbiting satellite with low solar zenith angle (to reduce atmospheric scattering) can be quite useful to atmospheric CO2 retrievals. However, the weaker transitions will have different temperature dependences, pressure broadening, and pressure shift characteristics than the stronger transitions, requiring the best possible knowledge of the line-by-line parameters for all CO2 transitions in the near infrared spectral window above the 0.3% threshold in order to ensure precise remote sensing retrievals of CO2. So far an ambitious project has been taken up by JPL, NASA and OCO (the Orbiting Carbon Observatory), which will supposedly be launched in 2008, Miller et al., 2005).
WAB 500102 021 Page 108 of 121
9.2 Theoretical options and limitations for CO2 anomaly detection Theoretically, a remote sensing and radiative transfer based model that estimates CO2 concentration can be made for a given plume height of a geo-natural event such as coal fire. Radiative transfer codes with the spectral database can simulate atmospheric transmission and path radiance with customized gas composition and concentration in order to understand the phenomena in a specific wavelength region. In order to quantify a certain atmospheric species by exploiting its absorption features, it is important to understand the interaction of energy in that particular wavelength. The most CO2 susceptible bands in the operating region of most present-day hyperspectral instruments with different atmospheric conditions and variable CO2 concentrations are centered around 2.0 µm. In the measured spectrum of a space borne hyperspectral sensor from top of the atmosphere (TOA) each atmospheric species leaves a specific absorption feature by which it can be identified and quantified (in a certain resolution). A simplified atmospheric model can be developed based on simulations in a radiative transfer code, to retrieve a CO2 plume related radiance from radiance at satellite (Gangopadhyay et al., 2008b). Later this information could be inverted (using a regression model) to retrieve coal fire related CO2 concentration up to a desired altitude. If concentration of the CO2 can be achieved in this way and subsequently after validation with ground data a relation between CO2 concentration and CO2 flux could be established to estimate the total CO2 emission from coal fires (Gangopdhyay et al., 2008a). However, the proposed model would deal with uncertainties that can not be resolved as yet. The total retrieval error is a resultant of sensor noise, surface properties, terrain effect, model error and interference from other atmospheric constituents. We can conclude that in-situ estimation of coal burnt is still an essential step in any estimation for CO2 emission from coal fires, and that thermal remote sensing can help to extrapolate the result over larger areas. Detection of CO2 anomalies in the atmosphere due to point sources (such as coal fires, but also industry and urban areas) is still out of reach with the present instrumentation and resolution.

WAB 500102 021 Page 109 of 121
References
Adam J. Berkovich, John H. Levy, S. James Schmidt and Brent R. Young, 2000, Heat capacities and enthalpies for some Australian oil shales from non-isothermal modulated DSC, Thermochimica Acta, Vol. 357-358, p. 41-45.
Arisoy, A. and Akgun, F., 1994, Modelling of spontaneous combustion of coal with moisture content included, Fuel, 73(2), p. 281-286.
Ballice, L., 2003, Solvent swelling studies of Göynük (Kerogen Type-I) and Beypazarı oil shales (Kerogen Type-II), Fuel, Vol. 82, Issue 11, p. 1317-1321.
Batenburg D., 1992, Heat and mass transfer during underground gasification of thin deep coal seems. PhD thesis, Delft University of Technology, 123 p.
Bhattacharya, A., Reddy, C.S. and Mukherjee, T., 1991, Multi-tier remote sensing data analysis for coal fire mapping in Jharia coalfield of Bihar, India, in: Proceedings, Asian Conference on Remote Sensing, Singapore, 12th, National University of Singapore, p. 22-1-22-6.
Biezen E., 1996, Modelling Underground Coal Gasification, PhD thesis, Delft University of Technology, 140 p.
Bruegge, C. J., Conel, J. E., Margolis, J. S., et al., 1990, In-situ atmospheric water-vapor retrieval in support of AVIRIS validation. Imaging Spectroscopy of the Terrestrial Environment: SPIE 1298, 150 – 163.
Cassells C.J.S., 1997, Thermal modelling of underground coal fires in northern China. PhD thesis, International Institute for Aerospace Survey and Earth Sciences (ITC), The Netherlands, ISBN 90-6164-234-5, ITC Dissertation No. 51, 183 pages.
Chambers, M., 2008, The Upper Jurassic Kimmeridge Clay, http://www.fortunecity.com/greenfield/ecolodge/25/kimclay.htm
Chen, G., et al., 2003, A study of wellbore stability in shales including poroelastic, chemical, and thermal effects, Journal of Petroleum Science and Engineering, V. 38 (3-4), p. 167-176.
Cole, D.I., 1975, Observations on a burning cliff. Proceedings of the Dorset Natural History and Archaeological Society, 96, 16-19.
Conway, T.J., Tans P.P., Waterman, L.S. and Thoning, K.W., 1990, Evidence for interannual variability of the carbon cycle from the National Oceanic and Atmospheric Administration Climate Monitoring and Diagnostics Laboratory Global Air Sampling Network, Journal of Geophysical Research, 99: 22831–22855.
Cox and Gallois, 1981, Stratigraphy of the Kimmeridge Clay of the Dorset type area and its correlation with some other Kimmeridgian sequences, Institute of Geological Sciences, Vol. 80/4, p. 1-44
Cracknell, A.P. and Mansor, S.B., 1992, Detection off sub-surface coal fires using Landsat Thematic Mapper data. International Archive of Photogrammetry and Remote Sensing, 29(b7), p.750-753.
Dai, S., Ren, D., Tang, Y., Shao, L. and Li, S., 2002, Distribution, isotopic variation and origin of sulfur in coals in the Wuda coalfield, Inner Mongolia, China. International Journal of Coal Geology, 51, p. 237–250.
DMT, 2001, Visit of Wuda, Gulaben and Rujigou coalfield – Field Report. Internal unpublished project report, German Montan Technology, Germany.
Ebukansen, E.J., Kinghorn, R.R.F., 1990, Jurassic mudrock formations of Southern England: Lithology, Sedimentation Rates And Organic Carbon Content, Journal of Petroleum Geology, Vol. 13/2, p. 221-2287, url = http://dx.doi.org/10.1111/j.1747-5457.1990.tb00841.x
Ellyett, C.D. and Fleming, A.W., 1974, Thermal infrared imagery of the Burning Mountain coal fire. Remote Sensing of Environment, 3, p.79-86.
Etheridge, D.M., Steele, L.P., Langenfelds, R.L., Francey, R.J., Barnola, J.M., and Morgan, V.I., 1996, Natural and anthropogenic changes in atmospheric CO2 over the last 1000 years from air in Antarctic ice and firn, Journal of Geophysical Research, 101, p. 4115-4128.
Finkelman R.B., Skinner H.C.W., Plumlee G.S., Bunnell, J.E., 2001: Medical geology, GEOTIMES Volume: 46 Issue: 11 Pages: 20-23
Fisher, W.J. and Knuth, W.M., 1968, Detection and delineation of subsurface coal fires by aerial infrared scanning. Geological Society of America Bulletin, 115, p. 67–68.

WAB 500102 021 Page 110 of 121
Fleming, A.W., 1972, Investigations into Permian Geology and the Burning Mountain Coal fire, B.Sc. Thesis, Newcastle, University of Newcastle.
Gaffey, S.J., McFadden, L,A,, Nash, D. and Pieters, C.M., 1993, Ultraviolet, visible, and near-infrared reflectance spectroscopy: laboratory spectra of geologic materials. In: Pieter C.M. and Engler P.A., editors: Remote Geochemical Analysis: Elemental and Mineralogical Composition, Cambridge, Cambridge University Press, p. 43-71.
Gangopadhyay, P.K., 2008: Coal fire related CO2 emissions and remote sensing. PhD thesis, Utrecht University, ISBN 978-90-6164-267-1, ITC dissertation no. 153, 156 p.
Gangopadhyay, P. K., van der Meer, F. and van Dijk, P., 2008a, Detecting anomalous CO2 flux using space borne spectroscopy. International Journal of Applied Earth Observation and Geoinformation (in press).
Gangopadhyay, P. K., van der Meer, F. and van Dijk, P., 2008b, Atmospheric modelling using FASCOD to identify CO2 absorption bands and their suitability analysis in variable concentrations for remote sensing applications. Journal of Quantitative Spectroscopy and Radiative Transfer, 109, p. 670-683.
Gangopadhyay, P.K., Lahiri-Dutt, K., Saha, K., 2006, Application of Remote Sensing to Identify Coal fires in the Raniganj Coalbelt, India. International Journal of Applied Earth Observation and Geoinformation, 8, p. 188–195.
Gangopadhyay, P.K., Maathuis, B. and van Dijk P., 2005, ASTER derived emissivity and coal fire related surface temperature anomaly: A case study in Wuda, North China, International Journal of Remote Sensing, v. 24, p. 5555-5751.
Gao, B.C. and Goetz, A.F.H., 1990, Column Atmospheric Water Vapor and Vegetation Liquid Water Retrievals From Airborne Imaging Spectrometer Data. Journal of Geophysical Research, v. 95, p.3549-3564.
Genderen, J.L. van, Cassells, C.J.S. and Zhang X.M., 1996, The synergistic use of remotely sensed data for the detection of underground coal fires, International Archives of Photogrammetry and Remote Sensing, XXXI(7): 722-727.
Genderen J.L. van, Guan H., 1997, Environmental monitoring of spontaneous combustion in the north China coalfields. Final Report to European Commission DG XII-G: I.S.C. under Contract No. CI1*-CT93-0008 (DG-HSMV), 244 p.
Green, R.O., Carre`re, V., and Conel, J.E., 1989, Measurement of atmospheric water vapor using the Airborne Visible/Infrared Imaging Spectrometer. Workshop Imaging Processing: Sparks 1989, Nevada, USA, p. 6.
Greene, G.W., Moxham, R.M. and Harvey, A.H., 1969, Aerial infrared surveys and borehole temperature measurements of coal mine fires in Pennsylvania, Proceedings of the Sixth International ERIM Symposium on Remote Sensing of Environment, 13-16 October, 1969 (University of Michigan), p. 517-525.
Gross, S., 1977, The Mineralogy of the Hatrurim Formation, Israel. Geological Survey of Israel, Bulletin no. 70, 80 p.
Gurney, K.R., et al., 2002, Towards robust regional estimates of CO2 sources and sinks using atmospheric transport models, Nature, v. 415, p. 626–630.
Hecker, C., Kuenzer, C., and Zhang, J., 2007: Remote sensing based coal fire detection with low resolution MODIS data. In: Stracher, G.B. (Ed.) Geology of Coal Fires: Case Studies from Around the World, Geological Society of America, Reviews in Engineering Geology, v. XVIII, p. 229-239, doi: 10.1130/2007.4118(15)
Huang, Y., Huang, H. and Chen, W., 1991, Remote sensing approaches for underground coal fire detection. In: Proceedings, Beijing International Conference on Reducing Geological Hazards, Beijing, p. 634-641.
Huang, J., Bruining, J. and Wolf, K.-H.A.A., 2001, Modelling of gas flow and temperature fields in underground coal fires, Fire Safety Journal, 36, p. 477-489.
Huang, J., Bruining, J., Wolf, K-H.A.A., 1997, Modelling the sub-surface temperature distribution of natural coal fires. Proceedings of the 14th annual international Pittsburgh Coal conference, September 23-27, Taiyuan, China, ISBN:1-890977-14-4 Cdrom. (A)
Kaufman, Y. J., and Gao, B.C., 1992. Remote sensing of water vapor in the near IR from EOS/MODIS. IEEE Transactions of Geosciences and Remote Sensing, v. 30(5), p. 871–884.
Krishnaswamy, S., Agarwal, P.K. and Gunn, R.D., 1996, Low temperature oxidation of coal 3. Modelling spontaneous combustion in coal stockpiles, Fuel, v. 75(3), p. 353-362.

WAB 500102 021 Page 111 of 121
Kroonenberg S.B., X.M. Zhang, 1995, Pleistocene coal fires in northwestern China, energy for early man. In: J.E. van Hinte (eds.), Proc. of the ARA Symp. at the Royal Neth. Acad. of Art & Sciences (KNAW), November 1995, (Amsterdam, The Netherlands), ISBN: 90-6984-199-1, p. 39-44, (A)
Kuenzer, C. and Stracher, G.B., 2008, Geomorphology of Coal Seam Fires. Accepted by: Geomorphology
Kuenzer, C., Hecker, C., Zhang, J., Wessling, S. and Wagner, W., 2008, The potential of multi-diurnal MODIS thermal bands data for coal fire detection. In: International Journal of Remote Sensing, Vol. 29, 923-944, DOI: 10.1080/01431160701352147
Kuenzer, C. 2007a: Providing Future Energy: Electricity Generation from Coal Mine Methane. In: Business Forum China, 06/07, pp. 59-61
Kuenzer, C., 2007b, Clean Development Mechanism. In: Business Forum China, 03/07, pp. 54-56 Kuenzer, C., 2007c, Coal Mining in China. In: Schumacher-Voelker, E., and Mueller, B., (Eds.),
2007: Business Focus China, Energy: A Comprehensive Overview of the Chinese Energy Sector. pp. 62-68, gic Deutschland Verlag, 281 pp., ISBN: 978-3-940114-00-6
Kuenzer, C., Zhang, J., Li, J., Voigt, S., Mehl, H. and Wagner, W., 2007a, Detection of unknown coal fires: synergy of coal fire risk area delineation and improved thermal anomaly extraction. In: International Journal of Remote Sensing, , DOI: 10.1080/01431160701250432, Vol. 28, pp. 4561-4585
Kuenzer, C., Zhang, J., Tetzlaff, A., Voigt, S., Van Dijk, P., Wagner, W. and Mehl, H., 2007b, Uncontrolled coal fires and their environmental impacts: Investigating two arid mining environments in north-central China. In: Applied Geography, Vol. 27, pp. 42-62
Kuenzer, C., Zhang, J., Voigt, S. and Wagner, W., 2007c, Remotely sensed land-cover changes in the Wuda and Rujigou-Gulaben coal ming areas China. In: Stracher, G.B. (Ed.) Geology of Coal Fires: Case Studies from Around the World, Geological Society of America Reviews in Engineering Geology, v. XVIII, p. 219-228, doi: 8 10.1130/2007.4118(14)
Kuenzer, C., Wessling, S., Zhang, J., Litschke, T., Schmidt, M., Schulz, J., Gielisch, H., and Wagner, W., 2007d, Concepts for Green House Gas Emission Estimating of underground Coal Seam Fires, Geophysical Research Abstracts, Vol. 9, 11716, EGU 2007, 16-20th April 2007, Vienna
Kuenzer, C., 2005, Demarcating coal fire risk areas based on spectral test sequences and partial unmixing using multi sensor remote sensing data. Ph.D. thesis, Technical University Vienna, Austria, 199 pp.
Kuenzer, C., Zhang, J., Hirner, A., Bo, Y., Jia, Y. and Sun, Y., 2005, Multitemporal in-situ mapping of the Wuda coal fires from 2000 to 2005 – assessing coal fire dynamics. In: Proceedings of the International Conference on Coal Fire Research, 29.11.-01.12.2005 Beijing, pp. 104-106.
Kuenzer, C., and Voigt, S. 2003, Vegetationsdichte als moeglicher Indikator fuer Kohlefloezbraende? Untersuchung mittels Fernerkundung und GIS. In: Strobl, J., Blaschke, T. and Griesebner, G., (ed.): Angewandte Geographische Informations-verarbeitung XV. Beitraege zum 15. AGIT-Symposium Salzburg 2.-4. July 2003. –Heidelberg, Wichmann, pp.256-261.
Lillesand, T.M. and Kiefer, R.W, 2000, Remote Sensing and Image Interpretation, John Wiley and Sons Inc., New York, 724 p.
Litschke, T., 2005, Innovative Technologies for Exploration, Extinction and Monitoring of Coal Fires in North China, MSc thesis no. 1239595, University Duisburg-Essen, Institut für Geographie, Abteilung Geologie, 90 p.
Liu, G., 1990, Permo-carboniferous paleography and coal accumulation and their tectonic control in North China and South China continental plates, International Journal of Coal Geology, v. 16, p. 73-117.
Lohrer C., Krause U., Steinbach J., 2005, Self-ignition of combustible bulk materials under various ambient conditions, PROCESS SAFETY AND ENVIRONMENTAL PROTECTION Volume: 83 Issue: B2 Special Issue: Sp. Iss. SI Pages: 145-150
Markham, B.L. and Barker, J.L., 1986, Landsat MSS and TM post calibration dynamic ranges, Exoatmospheric reflectance and at-satellite temperatures. EOSAT Landsat Technical Notes 1. Earth Observation Satellite Co. (Lanham, Maryland, EOSAT), USA, p. 3-8.

WAB 500102 021 Page 112 of 121
Miller, C.E., Brown, L.R., Toth, R.A., Benner, D.C. and, Devi, V.M., 2005, Spectroscopic challenges for high accuracy retrievals of atmospheric CO2 and the Orbiting Carbon Observatory (OCO) experiment, Comptes Rendus Physique, v. 6, p. 876–887.
Mukherjee, T.K., Bandopadhyay, T.K. and Pande, S.K., 1991, Detection and delineation of depth of subsurface coalmine fires based on an airborne multispectral scanner survey in a part of the Jharia Coalfield, India. Photogrammetric Engineering and Remote Sensing, v. 57, p. 1203-1207.
Prakash A., Fielding E.J., Gen, R., van Genderen J.L. and Evans D.L. (2001) Data fu-sion for investigating land subsidence and coal fire hazards in a coal mining area. Inter-national Journal of Remote Sensing, 22, 921-932.
Prakash, A. and Gupta, R.P., 1999, Surface fires in Jharia coalfield, India – their distribution and estimation of area and temperature from TM data, International Journal of Remote Sensing, v. 20(10), p. 1935-1946.
Prakash, A., Gupta, R.P. and Saraf A.K., 1997, A Landsat TM based comparative study of surface and subsurface fires in the Jharia coalfield, India, International Journal of Remote Sensing v. 18(11), p. 2463-2469.
Rayner, P.J. and O’Brien, D.M., 2001, The utility of remotely sensed CO2 concentration data in surface source inversions, Geophysical Research Letters, v. 28, p. 175–178.
Reddy, C.S.S., Srivastav, S.K., and Bhattacharya, A., 1993, Application of Thematic Mapper short wavelength infrared data for the detection and monitoring of high temperature related geoenvironmental features, International Journal of Remote Sensing, v. 14(17), p. 3125-3132.
Rozema, A., van Genderen, J.L. and Schalke, H.J.W.G., 1995, Environmental monitoring of coal fires in North China. Project Identification Mission Report October 1993. BCRS project 4.2/TO-04, BCRS report 93-29, ISBN 90-5411-105-4, 25 p.
Rosema, A., Guan, H. and Veld, A., 2001, Simulation of spontaneous combustion, to study the causes of coal fires in the Rujigou Basin, Fuel, v. 80, p. 7-16.
Rosema, A., Guan, H., van Genderen, J.L., Veld, H., Vekerdy, Z., ten Katen, A.M., Prakash, A. and Sharif. M, 1999, Manual of Coal Fire Detection and Monitoring. Report of the project: Development and implementation of a coal fire monitoring and fighting system in China. ISBN 90-6743-640-2, 245 p.
Saraf, A.K., Prakash, A., Sengupta, S. and Gupta, R.P., 1995, Landsat TM data for estimating ground temperature and depth of subsurface coal fire in the Jharia coalfield, India, Journal of Remote Sensing 16(12): 2114-2124.
Schläpfer, D., Borel, C.C., Keller, J. and Itten, K.I., 1998, Atmospheric Pre-Corrected Differential Absorption Techniques to Retrieve Columnar Water Vapor, Remote Sensing of Environment, 65(3): 353-366.
Selley, Richard. How to find oil without really trying, NewScientist, 12 January 1991. Slavecki, R.J., 1964, Detection and location of subsurface coal fires, in Proceedings,
Symposium on Remote Sensing of Environment, 3rd, Ann Arbor: Michigan, University of Michigan, p. 537-547.
Tans, P.P., Fung, I.Y. and Takahashi, T., 1990, Observational constraints on the global atmospheric CO2 budget, Science, 247: 1431–1438.
Tetuko, S.S. J., Tateishi, R. and Takeuchi, N., 2003, A physical method to analyse scattered waves from burnt coal seam and its application to estimate thickness of fire scars in central Borneo using L-Band SAR data, International Journal of Remote Sensing, 24(15): 3119-3136.
Tetzlaff, A. 2004 . Coal fire quantification using Aster, ETM and Bird instrument data, [PhD Thesis], of Geosciences, Maximilians-University, Munich, 155 p.
Tyson, R. V., R.C.L. Wilson & C. Downie, ‘A stratified water column environmental model for the type Kimmeridge Clay’, Nature, 1979,
Vapnik, Y., Sokol, E., Murashko, M., Sharygin, V. (2006): The enigma of Hatrurim. Mineralogical Almanac, 10, 69-77.
Vekerdy, Z., ten Katen, A.M. and Veld, H., 2000, Handbook of the Coal Fire Monitoring and management System (Coalman). ITC Enschede, 174 p.
Voigt, S., A. Tetzlaff, J. Zhang, C. Kuenzer, B. Zhukov, G. Strunz, D. Oertel, A. Roth, P. van Dijk and H. Mehl, 2004, Integrating satellite remote sensing techniques for detection and

WAB 500102 021 Page 113 of 121
analysis of uncontrolled coal seam fires in North China, International Journal of Coal Geology, v. 59, p. 121-136.
Wan, Y.Q. and Zhang X.M., 1996, Using a DEM to reduce the effect of solar heating on Landsat TM thermal IR images and detection of coal fires, Asia-Pacific Remote Sensing and GIS Journal, v. 8, p. 65-72.
Wang, C., 2002, Detection of coal fires in Xinjiang (China) using remote sensing techniques, MSc Thesis, ITC, Enschede, 93 p.
Wessling, S., Kuenzer, C., Kessels, W., and Wuttke, M., 2008, Numerical modeling to analyze underground coal fire induced thermal surface anomalies. Accepted for publication at: International Journal of Coal Geology, DOI 10.1016/j.coal.2007.12.005
West, I., 2007, Burning cliffs of Dorset - Oil shale fires, http://www.soton.ac.uk/~imw/kimfire.htm West, I., 2008a, Geology of the Wessex Coast of Southampton, http://www.soton.ac.uk/~imw/ West, I., 2008b, Kimmeridge - The Blackstone - Oil Shale, http://www.soton.ac.uk/~imw/kimblack.htm Whitehouse, A.E. and Mulyana, A.A.S., 2004, Coal fires in Indonesia, International Journal of
Coal Geology, v. 59, p. 91–97. Wolf, K-H.A.A., 2006, The interaction between underground coal fires and their roof rocks. PhD-
thesis, Delft University of Technology, ISBN-10: 90-9020939-5, ISBN-13: 978-90-9020939-5, 237 p.
Wolf, K-H.A.A., Bruining, J., 2007, Modelling the interaction between underground coal fires and their roof rocks. Fuel, vol. 86, p.2761-2777.
Wolf, K-H.A.A., Hettema, M.H.H.., 1995. Petrophysical and Mineralogical Properties of Overburden Rock and Coal. NOVEM- Delft University, technical report, 22.1.40/13.11, Part 1 ( R )
Wolf, K-H.A.A., Hettema, M.H.H., 1995. Petrophysical and mineralogical properties of overburden rock and coal. NOVEM- Delft University, technical report nr 22.1.40/13.11. 121 pages, Part 2 ( R )
Wolf, K-H.A.A., Hettema, M.H.H., 1996, Thermo-mechanical behaviour and stability of wall rock during underground coal gasification; El Tremedal Field Test, Phase 1. Final Report, TU-Delft-Novem, Contract nr: 94/E0767/230110/04/03, 90 pages. ( R )
Wolf, K-H.A.A., Hettema, M.H.H., 1997, Thermo-mechanical behaviour and stability of wall rock during underground coal gasification; El Tremedal Field Test, Phase 2. Final Report. TU-Delft-Novem, Contract nr: 94/E0767/230110/04/03, 74 pages.
Wolf, K-H., Hettema, M., Tongeren, P.C.H. van, Schreurs, H.C.E., 1997, Enhancement of CBM production with the aid of UCG. Proc. Int. Coalbed Methane Symp., Tuscaloosa, U.S. Paper no. 9725, p. 409-419. (A)
Wolf, K-H.A.A., Kühnel, R.A., Pater, C.J. de, 1987, Laboratory experiments on the thermal behaviour of roof and floor rocks of carboniferous coal seams., International Conference on Coal Science, Maastricht, Netherlands, 1987, Elsevier Publishers, ISBN 0-444-42893-3, p. 911-914.
Wolf, K-H.A.A., Kühnel, R.A., Pater, C.J. de, 1987, Thermal behaviour of country rock in laboratory experiments; mineralogical and textural aspects. Proc. of the 13th Annual Underground Coal Gasification Symposium, Laram, Wyoming, DOE/METC-88/6029, 163-173. (A)
Wolf, K-H.A.A., Kühnel, R.A. & Pater, C.J. de, 1987, Laboratory experiments on thermal behaviour of roof and floor rocks of carboniferous coal seams. In: J.A. Moulijn et al. (eds.) 1987 International conference on coal science, Elsevier science publishers B.V., Amsterdam, 911-914.
Wolf K-H.A.A., Pater, C.J. de, 1989, Laboratory tests on Carboniferous overburden rock, textural and mineralogical properties at elevated pressure and temperature., proc, 15th Annual UCG-symposium, Delft, the Netherlands. pp. 322-334. ISBN 90-6275-566-6. (A)
Wolf, K-H.A.A., Pater, C.J. de, 1990, Chemical and Petrophysical Characterization of Coal and Overburden Rock. Final Report, TU-Delft-Novem, Contract: 20.11-015, 105 pages. ( R )
Yang, H., 1995, Detection of Areas of Spontaneous Combustion of Coal Using Airborne and TM Data in Xinxiang, China. MSc Thesis, ITC Enschede, 73 p.
Zelm, L.F. van, 2008, Modelling of Kimmeridge Oil Shale Fires associated to Spontaneous Oxidation. Delft University, BSc-thesis, 29 pages.
WAB 500102 021 Page 114 of 121
Zhang, J. and Kuenzer, C., 2007, Thermal surface characteristics of coal fires 1: Results of in-situ measurements. Journal of Applied Geophysics, DOI:10.1016/j.jappgeo.2007.08.002, Vol. 63, pp. 117-134
Zhang, J., Kuenzer, C., Tetzlaff, A., Oettl, D., Zhukov, B. and Wagner, W., 2007: Thermal characteristics of coal fires 2: Results of measurements on simulated coal fires. Journal of Applied Geophysics, DOI:10.1016/j.jappgeo.2007.08.003, Vol. 63, pp. 135-147
Zhang, J.Z., 1996, SWIR spectra of rocks in areas affected by coal fires, Xinjiang autonomous region P.R. of China. MSc Thesis, ITC, Enschede, 74 p.
Zhang, J.Z., 2004, Spatial and Statistical Analysis of Thermal Satellite Imagery for Extraction of Coal Fire Related Anomalies. PhD thesis, TU-Vienna, 161 p.
Zhang, X., 1998, Coal fires in Northwest China; Detection, Monitoring and Prediction Using Remote Sensing Data. PhD-thesis TU Delft, ISBN 90-6164-144-6, ITC Publ. No. 58, 135 pages.
Zhang X., van Genderen, J.L. and Kroonenberg, S.B., 1997, A method to evaluate the capability of Landsat-5 TM band 6 data for sub-pixel coal fire detection, International Journal for Remote Sensing, 18(15): 3279-3288.
Zhang, X., Kroonenberg, S.B. and de Boer, C.M., 2004, Dating of coal fires in Xinjiang, north-west China, Terra Nova, v. 16(2), p. 68-74.
Zhang, X., Zhang, J., Kuenzer, C., Voigt, S. and Wagner, W., 2004: Capability evaluation of 3-5µm and 8-12,5µm airborne thermal data for underground coal fire detection. In: International Journal of Remote Sensing, Vol. 25, No. 12, pp. 2245-2258
Simulation model, value for shale thermal expansion coefficient: http://www.sciencedirect.com/science?_ob=ArticleURL&_udi=B6VDW-48BTYD2-1&_user=499885&_rdoc=1&_fmt=&_orig=search&_sort=d&view=c&_acct=C000024500&_version=1&_urlVersion=0&_userid=499885&md5=81e4ef8bb704fb9233457e1c8ae732bf#toc10
WAB 500102 021 Page 115 of 121
Appendix 1 Press articles on coal fire issues, in chronological order
12 June 2008: Een model voor steenkoolbranden IN: U-blad No. 31, p.12 22 November 2007: 50-year-old fire put out BY: Katharine Sanderson IN: Nature News http://www.nature.com/news/2007/071122/full/news.2007.281.html 21 November 2007: China Coal Fire Put Out After More Than 50 Years BY: Planet Ark world Environmental News (Reuters) IN: http://www.planetark.org/avantgo/dialynewsstory.cfm?mewsid=45461 21 November 2007: Underground coal seam fire put out after 50 years in NW China BY: Xinhua, Chinese press agency IN: http://news.xinhuanet.com/english/2007-11/21/content_7120136.htm 13 July 2007: The Wrong Fire BY: Diana Furchtgott-Roth IN: The New York Sun (http://www.nysun.com/article/58374) September 2005: Bodem in brand BY: Marc Koenen IN: Quest 09/2005, p. 88-92. May 2005: Fire in the Hole BY: Kevin Krajick IN: Smithonian, Vol. 36, No. 2, p. 53-61. 5 November 2004: ITC helpt China bij mijnbranden IN: Tubantia 4 November 2004: Brand in mijn na 130 jaar geblust. IN: Tubantia 3 November 2004: 130-year-old Chinese fire put out IN: BBC News (http://news.bbc.co.uk/1/hi/world/asia-pacific/3978329.stm) 3 November 2004: Xinjiang vows to quell underground coal fires. IN: China Daily (http://chinadaily.com.cn/english/doc/2004-11/03/content_388130.htm) May 2004: Fire Down Below BY: John Dyson IN: Readers Digest (Asia), pp. 70-76

WAB 500102 021 Page 116 of 121
November 2003: Monitoring of spontaneous coal fires in China: local, national and global adverse effects. BY: Sacha Charls IN: International Study Group Newsletter
(an American Women’s Club of Brussels affiliate). 9 October 2003: Coal Fire research (CFR) Project: Kick-Off Meeting and Field Visit BY: Stefan Voigt IN: Press release DLR 10 September 2003: Project launched to staunch coal fires. BY: Cui Ning IN: China Daily 31 July 2003: Coal-mine blaze in Xinjiang to be put out. IN: China Daily (http://www.chinadaily.com.cn/en/doc/2003-07/31/content_250580.htm) 22 April 2003: Feuer unter der Erde. China verliert große Menge Kohle durch unterirdische Brände. Nun sollen die Flöz-Verläufe kartiert werden BY: Nora Knappe IN: Berliner Zeitung April 2003: Groot probleem in Noord-China – Nederland helpt ondergrondse steenkolenbranden beheersen. BY: Peter Juijn IN: ‘Milieu in de Markt’, Export Platform Milieu, EVD. 10 March 2003: Underground fires stoke global warming. BY: Anne Blair Gould, Science Unit IN: Radio Nederland Wereldomroep (RNW) http://www.rnw.nl/science/html/030310coal fire.html 22 February 2003: Onblusbare branden. BY: Kris de Decker IN: De Financieel-Economische Tijd, Uw Leven, Wetenschap en Technologie. 19 February 2003: BY: Danny Kingsley IN: Environment News, News in Science, ABC http://www.abc.net.au/science/news/enviro/EnviroRepublish_786127.htm 17 February 2003: Stop the coal fires burning IN: Mining Environmental Management, The Mining Journal Ltd. http://www.mining-journal.com/artman/publish/article_503.asp 15 February 2003: Underground fires wreak havoc - Blazing coal seams threaten wildlife and stoke global warming BY: Tim Radford IN: The Guardian http://www.guardian.co.uk/uk_news/story/0,3604,895904,00.html

WAB 500102 021 Page 117 of 121
15 February 2003: Underground coal fires called a ‘catastrophe’ BY: Michael Woods IN: Post-Gazette, Pittsburgh, PA http://www.post-gazette.com/healthscience/20030215coalenviro4p4.asp 14 February 2003: Coal Fires Burning out of Control around the World: A Global Catastrophe. BY: Glenn B. Stracher, Tammy P. Taylor, Robert Finkelman IN: AAAS Symposium 1034, February 14, 2003, Denver, CO. http://www.ega.edu/facweb/stracher/AAAS%20COGEL.htm 14 February 2003: Wild coal fires are a ‘global catastrophe’ BY: Shaoni Bhattacharya IN: New Scientist http://www.newscientist.com/news/news.jsp?id=ns99993390 14 February 2003: Coal Fires are ‘Global Catastrophe’ BY: Jonathan Amos IN: BBC news – In Depth – Denver 2003 http://news.bbc.co.uk/1/hi/in_depth/sci_tech/2003/denver_2003/2759983.stm 14 February 2003: Scientists warn of ‘global catastrophe’. BY: Clive Cookson IN: Financial Times http://www.corporate-training.ch/Text,%20week%208,%202003,%20global%20catastrophe.pdf 14 February 2003: Hidden Coal Fires Create Visible Problems IN: Environment News Service http://ens-news.com/ens/feb2003/2003-02-14-06.asp 14 February 2003: A Burning Issue IN: Mines & Communities Website http://www.minesandcommunities.org/Action/press109.htm 14 February 2003: Coal fires are ‘global catastrophe’ IN: Orangutans Online.Com http://www.orangutansonline.com/articles/article176.htm 14 February 2003: Coal Fires Pose Growing Threat to Environment IN: Popular Mechanics.Com http://popularmechanics.com/science/research/2003/2/coal_fires/print.phtml 14 February 2003: Global Warming: Coal fires are ‘global catastrophe’ IN: Friends of the Irish Environment http://www.friendsoftheirishenvironment.net/article.php?sid=757

WAB 500102 021 Page 118 of 121
13 February 2003: A Global ‘Catastrophe’ – Coal Fires Threaten Environment, Human Health. BY: News & Reporter Help IN: AAAS news releases 2003 symposium ‘Science as a Way of Life’, Denver, Co. http://www.aaas.org/news/releases/2003/0213fire.shtml 13 February 2003: A global ‘catastrophe’ – coal fires threaten environment, human health. BY: Monica Amarelo and Ginger Pinholster IN: Eureka Alert! http://www.eurekalert.org/pub_releases/2003-02/aaft-ag020503.php December 2002: Feux de charbon la Chine brûle-t-elle? BY: Stéphanie Olivier IN: Science & Vie, pp. 104-108. December 2002: Hidden Fire – Fighting fire in coal mines BY: Joris Tielens IN: Holland Know-How, education section in Holland Horizon, issued by the Dutch Ministry of Foreign Affairs (BuZa), with NUFFIC, FION, EVD, EZ, LNV, OCW. October 2002: Coal Fires: A Burning Global Recipe for Catastrophe BY: Glenn Stracher IN: Geotimes, October 2002 http://www.agiweb.org/geotimes/oct02/geophen.html August 2002: Fighting China’s fires. BY: Simon Walker IN: World Coal, Vol. 11, No. 8, p. 8-15. 15 May 2002: Verbrennung am falschen Ort – Bekämpfung van unterirdischen Kohlebränden in China. BY: Hans Dieter Sauer IN: Neue Zürcher Zeitung, Forschung und Technik. May 2002: Underground Fires Surface BY: Scott Fields IN: Environmental Health Perspectives (A journal of the National Institute of Environmental Health Sciences, USA), Vol. 110, No. 5, page A234 11 February 2002: How China’s scramble for ‘black gold’ is causing a green disaster. BY: David Rennie IN: Daily Telegraph http://news.telegraph.co.uk/news/main.jhtml?xml=/news/2002/02/01/wcoal01.xml&sSheet=/news/2002/02/01/ixworld.html 7 February 2002 Minenfeuer: Wenn die Erde Feuer fängt. BY: Günther Wessel and Sacha Hartgers IN: Greenpeace Magazine 2/2002 http://www.greenpeace-magazin.de/archiv/hefte00/2_00/wenn_die_erde.html

WAB 500102 021 Page 119 of 121
27 January 2002: Gröste Brandstiftung aller Zeiten BY: Hans Bewersdorff IN: Die Welt – Wissenschaft http://www.welt.de/daten/2002/01/27/0127ws310320.htx 15 January 2002: Underground Fires Menace Land and Climate. BY: Andrew C. Revkin IN: New York Times, Science Times http://query.nytimes.com/gst/abstract.html?res=F60813FE3E5C0C768DDDA80894DA404482 17 May 2001: Nederlandse hulp bij bestrijding van enorme steenkoolbranden in China. IN: Examen HAVO Scheikunde (nieuwe stijl), vraag 36. 2001: Spontane Kohlebrände in Nord China – Eine Umweltkatastrophe und eine Forschungsaufgabe von Internationaler Bedeutung (brochure). BY: Stefan Voigt, DLR 14 November 2000: Eeuwig branden de kolen. BY: Anne Meijdam IN: Trouw 3 August 2000: China battles coal fires. BY: Ruppert Wingfield-Hayes IN: BBC News – World – Asia-Pacific http://news.bbc.co.uk/1/hi/world/asia-pacific/864588.stm 26 February 2000: Nederlandse hulp bij blussen steenkoolbranden China. BY: Patrick Marx IN: Chemisch 2 Weekblad, Vol. 96, No. 4, p. 16-17. 16 December 1999: Coal fires, a big problem – New software system to help put them out. BY: Tang Min IN: China Daily, Vol. 19, No. 6101 And several other newspapers in Chinese (China Coal News of 28-12-1999, Science and technology Daily of 18-12-1999, China Economic herald of 17-12-1999, China land and Resources News of 18-12-1999, Unknown papers of 17-12-1999, 6-12-1999 and Science Times Overseas Edition of 28-12-1999) reporting the successful end of the Oret/Miliev project, with the launch of Coalman. 13 December 1999: Ondergrondse branden bedreigen noorden van China. IN: Algemeen Dagblad, p. 6 30 October 1999: Feuer unter China BY: Philip Bethge & Andreas Lorenz IN: Der Spiegel, 44/1999 http://www.spiegel.de/spiegel/0,1518,52205,00.html
WAB 500102 021 Page 120 of 121
October 1999: China’s on fire IN: Discover Magazine, Vol. 20, No. 10, p. 20 http://www.discover.com/oct_99/break.html 1-7 November 1997: Noorderlicht en het Verborgen Vuur. BY: Manfred van Eyk IN: VPRO Gids, 1997/44. 1 November 1997: Ondergrondse branden rampzalig. BY: Hans Piët IN: Haagsche Courant November 1997: Het Vuur van de Draak BY: Manfred van Eyk IN: EOS magazine –Wetenschap en Technologie voor de Mens, Vol.14, Nr.11, p. 38-41. November 1997: Verborgen vuur in China BY: Manfred van Eyk IN: International Samenwerking, No. 11, p. 8-9. October 1997: Mine Fires – Quenching the fires of Jharia, India: - Investigating the fires BY: S.R. Michalski and R.E. Gray - Planning for today and the future BY: A. Schori and A.H. Scrymgeour IN: World Coal, October 1997, p. 1-12 3 Juli 1997: Brandweer in Dante’s hel – Delfts ingenieursbureau bestrijdt steenkoolbranden in China. BY: Bert Verhoeven IN: De Ingenieur, Nr. 12, p. 28-31 1997?, date unknown: ITC helpt China Vuur van de Draak te bestrijden. BY: Alphonse Huiskes IN: Tubantia 1996: Coal-Fire Monitoring and Control System in China IN: ITC Annual Report 1996, p. 64-67 5 November 1996: Steenkool vliegt spontaan in brand – Nederland helpt China met opsporingssysteem voor ondergrondse vuren. BY: A.C. Bregman IN: Reformatorisch Dagblad, Wetenschap en Techniek. 28 September 1996: ITC helpt China bij bestrijding steenkoolbranden. IN: Tubantia

WAB 500102 021 Page 121 of 121
21 September 1996: Nederlandse hulp bij bestrijding van enorme steenkoolbranden in China. BY: Henk Donkers IN: NRC Handelsblad 25 November 1995: Kolenkachels van Moeder Natuur stoken aarde op. BY: Lanny Slobbe IN: de Volkskrant November 1995: Een miljoen jaar menselijke milieuvervuiling. BY: Lanny Slobbe IN: KNGMG Nieuwsbrief, November 1995, No. 8, p. 1-3. August 1995: China brandt BY: Marc Koenen IN: Kijk, Augustus 1995, No. 8, p. 26-31. 1995: China National Administration of Coal Geology (brochure). Overseas Engineering and International Relations, p. 33 and 35 December 1994: ITC gaat Chinese kolenbranden monitoren, BY: Lanny Slobbe IN: KNGMG Nieuwsbrief, December 1994, No. 10, p. 1.

CLIMATE CHANGE
Scientific Assessment and Policy Analysis
WAB 500102 021
Fossil Fuel Deposit Fires
Occurrence Inventory, design and assessment of Instrumental Options